Loading ...
Loading ...
Loading ...
SNA5000A Vector Network Analyzer User Manual 44
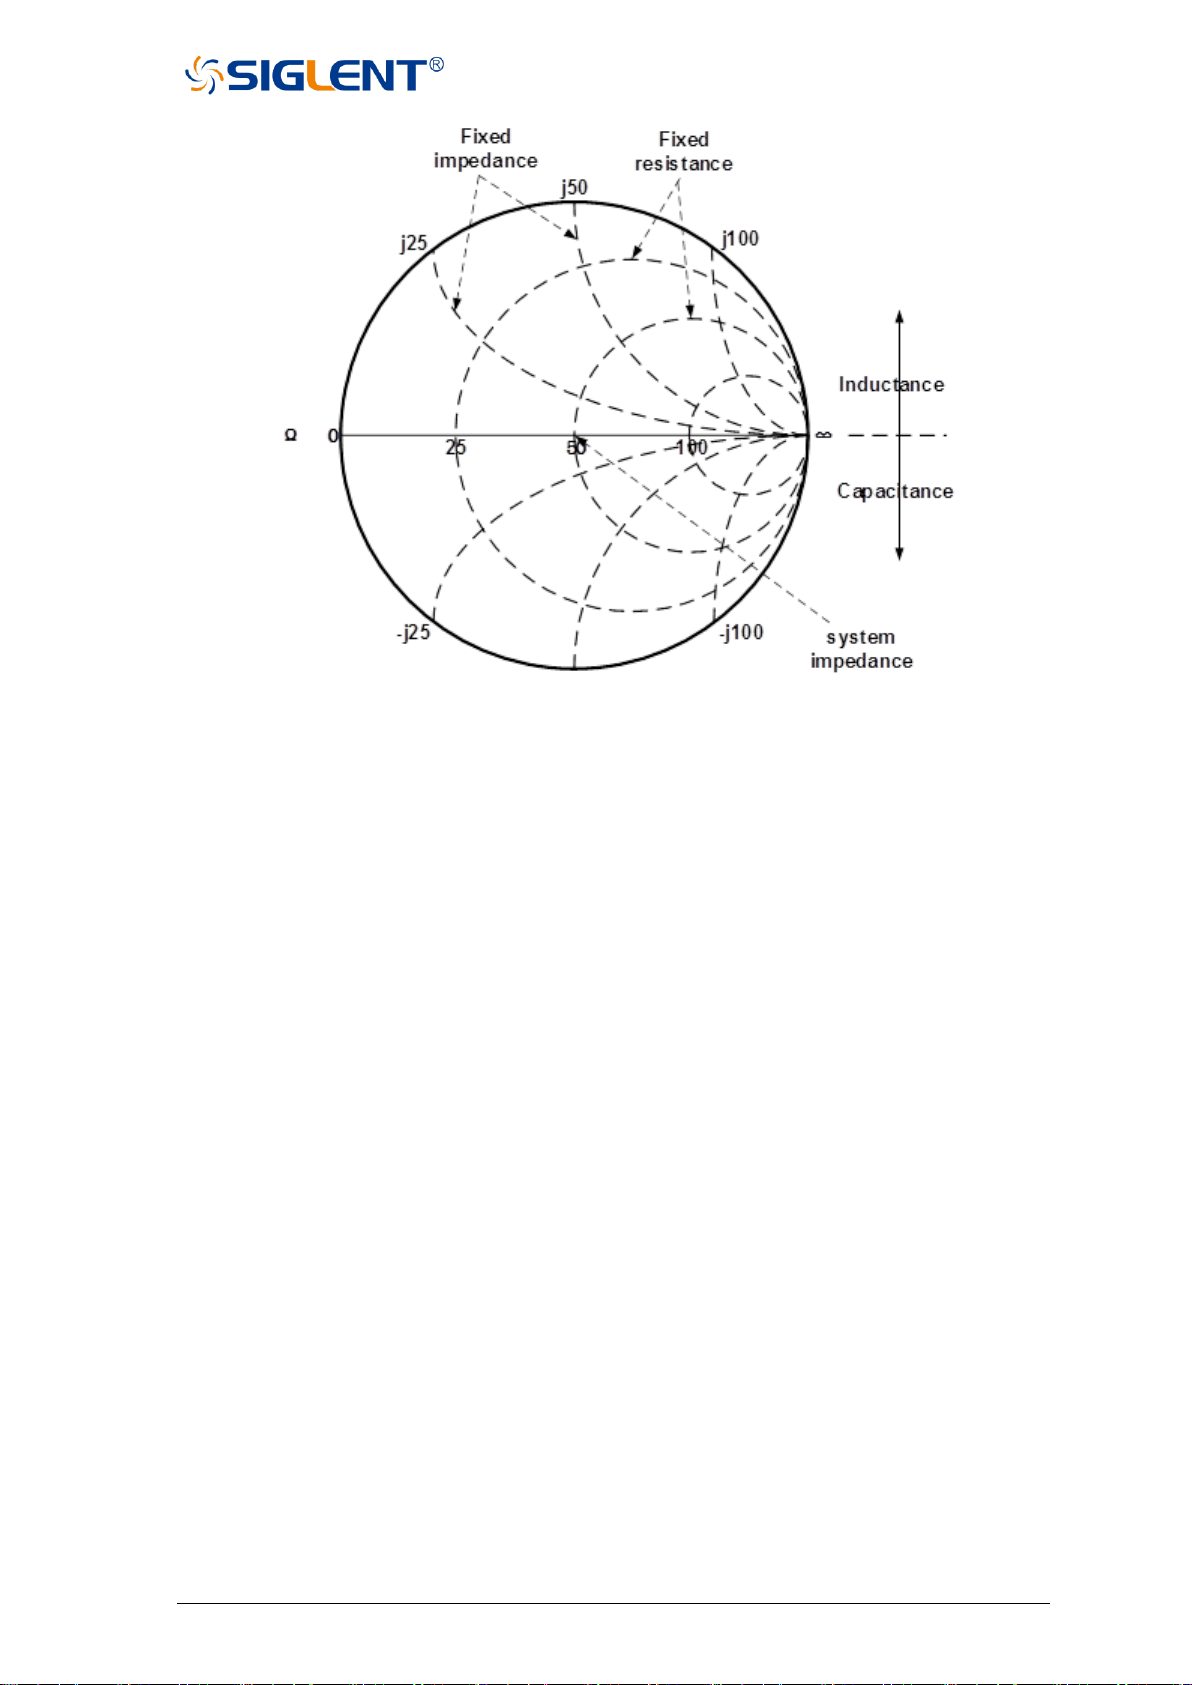
Figure 2-7 Schematic diagram of the Admittance Smith chart
• Each point on the Smith chart represents a complex impedance (r±jx) consisting of a real
resistance (r) and an imaginary reactance (x).
• The horizontal axis (solid line) shows the real part of the difference between impedance
and resistance. The horizontal axis always represents the system impedance. The
rightmost value is infinite ohms (open path). The leftmost value is zero ohms (short circuit).
• The dotted circle intersecting the horizontal axis represents a constant reactance.
• A dashed arc tangent to the horizontal axis represents a constant impedance.
• The top half of Smith's circle is the region where the reactance component is positive and
hence inductance is generated.
• The lower half is the region where the reactance component is negative and therefore
generates capacitance.
2.7 Scale
2.7.1 Scale/reference level and position
The "Scale", "Reference Level", and "Reference Position" Settings (as well as the format)
determine how the data trace will appear on the vector network analyzer screen.
Operating steps:
Loading ...
Loading ...
Loading ...