Loading ...
Loading ...
Loading ...
18
Repeat the measurement if the flashing icon
is
displayed after the measurement. Please note that you
should rest for 5 minutes between measurements and
not talk or move during the measurement. If the icon
appears often, please contact your doctor. Any
self-diagnosis and treatment based on the test results
may be dangerous. It is vital to follow your doctor’s
instructions.
WHO classification:
According to WHO Guidelines/Definitions and the latest
findings, the test results can be classified and evaluated
according to the following chart:
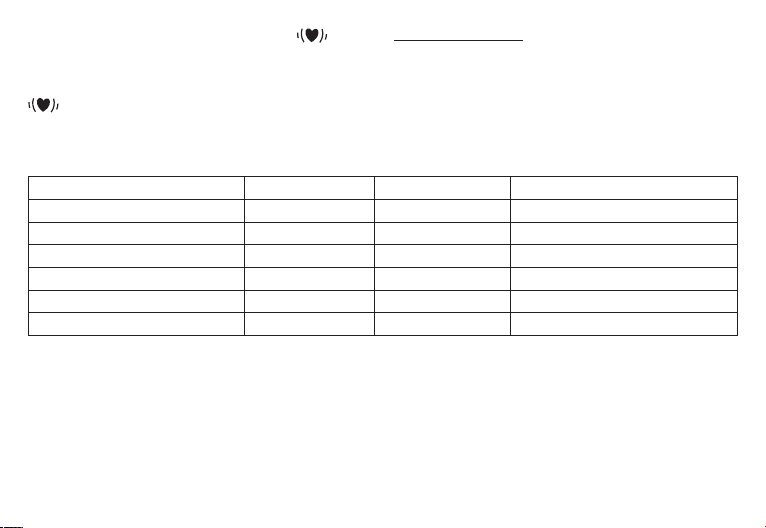
According to WHO Guidelines/Definitions and the latest
findings, the test results can be classified and evaluated
according to the following chart.
Range of blood pressure values Systolic (in mmHg) Diastolic (in mmHg) Measure
Grade 3: Severe hypertension ≥180 ≥110 Seek medical advice
Grade 2: Moderate hypertension 160 -179 100 -109 Seek medical advice
Grade 1: Mild hypertension 140 -159 90 - 99 Have it checked regularly by doctor
High-normal 130 -139 85 - 89 Have it checked regularly by doctor
Normal 120 -129 80 - 84 Check it yourself
Optimal <120 <80 Check it yourself
Source: WHO, 1999
The bar graph in the display and the scale on the unit
indicate the range of the blood pressure which has been
recorded. An accoustic evaluation of your measurement
also follows.
If the values for systolic and diastolic pressure are in
two different WHO ranges (e.g. systolic in the high-nor-
mal range and diastolic pressure in the normal range)
the graphic WHO classification on the unit indicates the
higher range (high-normal in the example described).
6. Saving, retrieving and deleting results
•
The results of each successful measurement are
stored together with date and time. With more than
60 items of measured data, the earliest items of data
measured are lost.
Loading ...
Loading ...
Loading ...