Loading ...
Loading ...
Loading ...
Chapter 16: Statistics and Data Plots 253
16STATS.DOC TI-89/TI-92 Plus: Statistics and Data Plots (English) Susan Gullord Revised: 02/23/01 1:12 PM Printed: 02/23/01 2:17 PM Page 253 of 22
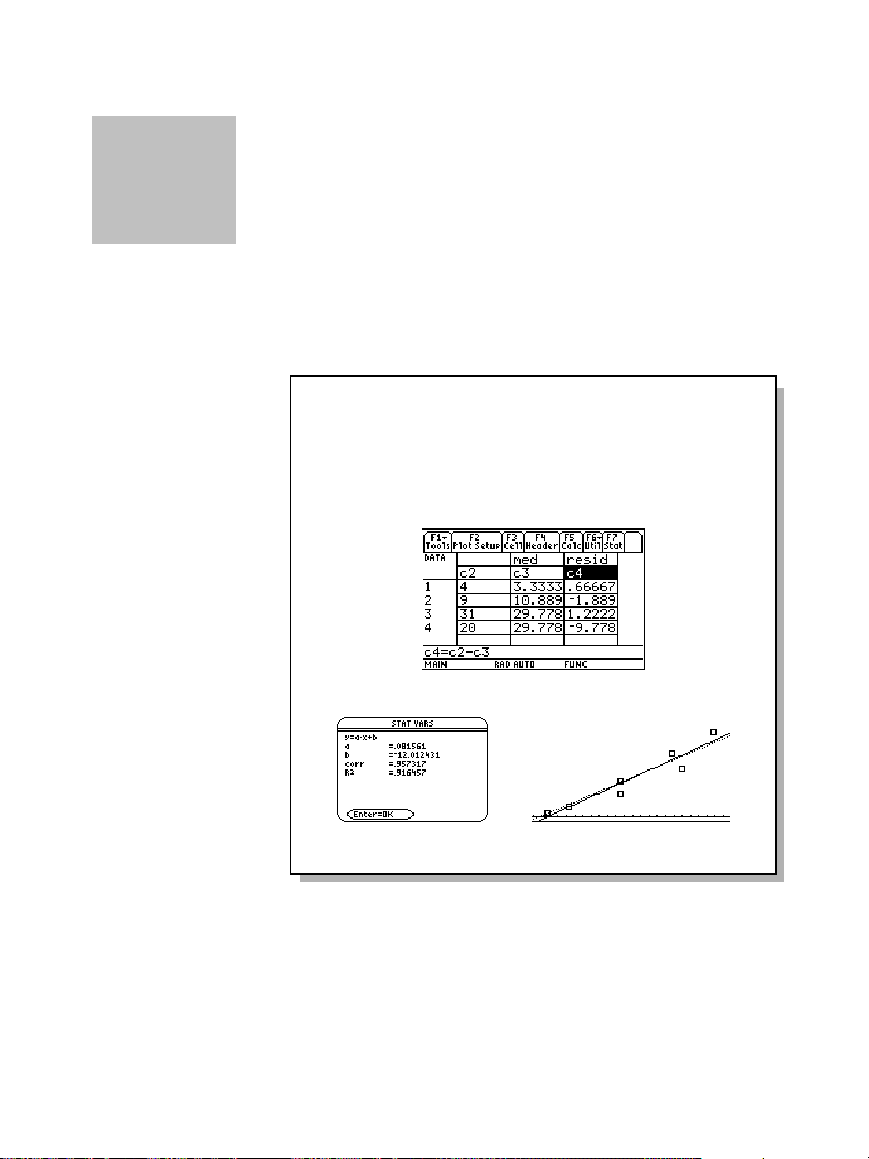
Chapter 16:
Statistics and Data Plots
Preview of Statistics and Data Plots.................................................... 254
Overview of Steps in Statistical Analysis............................................ 258
Performing a Statistical Calculation.................................................... 259
Statistical Calculation Types ................................................................ 261
Statistical Variables................................................................................ 263
Defining a Statistical Plot...................................................................... 264
Statistical Plot Types ............................................................................. 266
Using the Y= Editor with Stat Plots..................................................... 268
Graphing and Tracing a Defined Stat Plot .......................................... 269
Using Frequencies and Categories ...................................................... 270
If You Have a CBL 2/CBL or CBR......................................................... 272
The Data/Matrix Editor serves two main purposes.
¦ As described previously in Chapter 15, the Data/Matrix Editor
lets you create and maintain a list, matrix, or data variable.
¦ This chapter describes how to use the Data/Matrix Editor to
perform statistical calculations and graph statistical plots.
16
Loading ...
Loading ...
Loading ...