Loading ...
Loading ...
Loading ...
Chapter 8: Polar Graphing 135
08POLAR.DOC TI-89/TI-92 Plus: Polar Graphing (English) Susan Gullord Revised: 02/23/01 10:57 AM Printed: 02/23/01 2:14 PM Page 135 of 6
From the Graph screen, you can:
¦ Display the coordinates of any pixel by using the free-moving
cursor, or of a plotted point by tracing a polar equation.
¦ Use the
„
Zoom
toolbar menu to zoom in or out on a portion of
the graph.
¦ Use the
‡
Math
toolbar menu to find derivatives, tangents, etc.
Some menu items are not available for polar graphs.
Overview of Steps in Graphing Polar Equations
To graph polar equations, use the same general steps used
for y(x) functions as described in Chapter 6: Basic Function
Graphing. Any differences that apply to polar equations are
described on the following pages.
Graphing Polar
Equations
Exploring the Graph
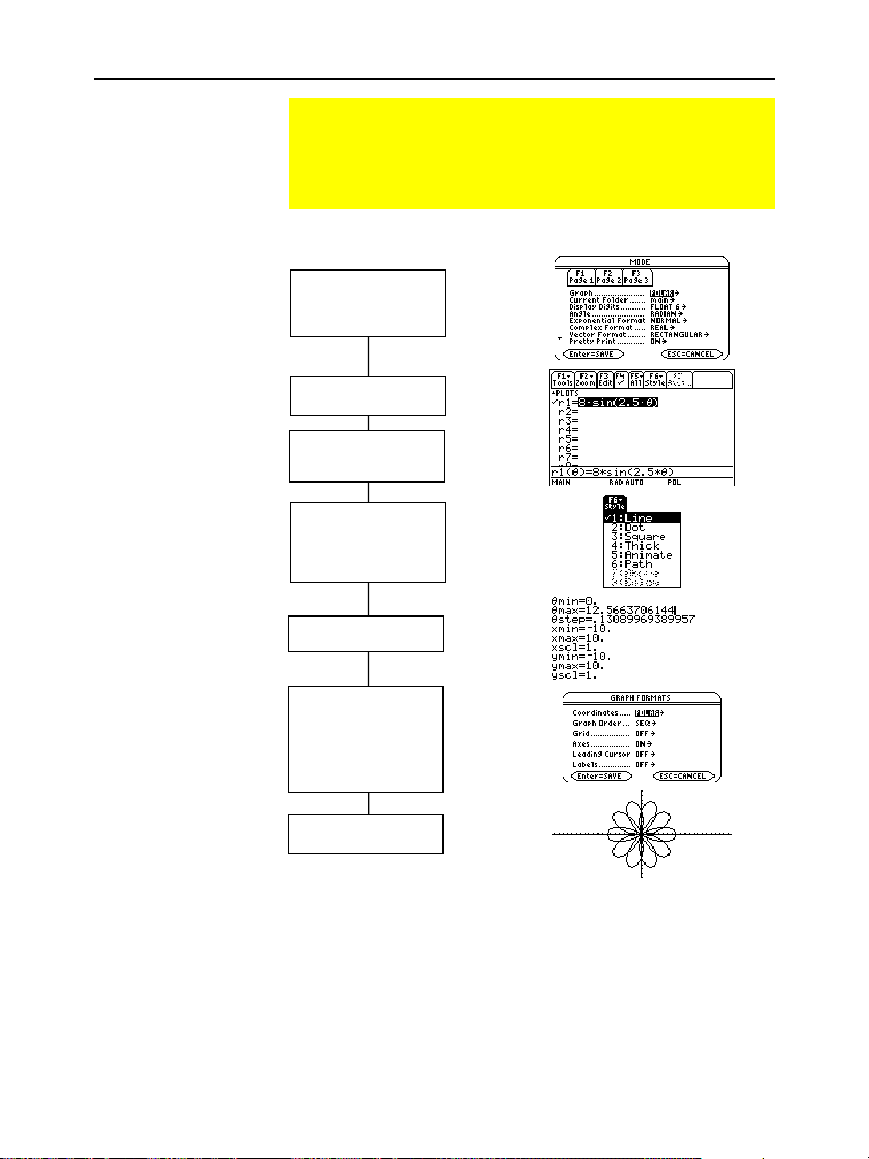
Set Graph mode (
3
)
to
POLAR
.
Also set Angle mode,
if necessary.
Define polar equations
on Y= Editor (
¥
#
).
Select (
†
) which
defined equations to
graph.
Set the display style
for an equation.
TI
-
89:
2
ˆ
TI
-
92 Plus:
ˆ
Define the viewing
window (
¥
$
).
Change the graph
format,if necessary.
ƒ
9
— or —
TI
-
89:
¥
Í
TI
-
92 Plus:
¥
F
Tip:
This is optional. For
multiple equations, this helps
visually distinguish one from
another.
Graph the selected
equations (
¥
%
).
Tip:
To turn off any stat
data plots (Chapter 16),
press
‡
5
or use
†
to
deselect them.
Tip:
To display r and
q
, set
Coordinates =
POLAR
.
Tip:
„
Zoom
also changes
the viewing window.
Loading ...
Loading ...
Loading ...