
AutoCAD 2013
User's Guide
January 2012

©
2012 Autodesk, Inc. All Rights Reserved. Except as otherwise permitted by Autodesk, Inc., this publication, or parts thereof, may not
be reproduced in any form, by any method, for any purpose.
Certain materials included in this publication are reprinted with the permission of the copyright holder.
Trademarks
The following are registered trademarks or trademarks of Autodesk, Inc., and/or its subsidiaries and/or affiliates in the USA and other countries:
123D, 3ds Max, Algor, Alias, Alias (swirl design/logo), AliasStudio, ATC, AUGI, AutoCAD, AutoCAD Learning Assistance, AutoCAD LT, AutoCAD
Simulator, AutoCAD SQL Extension, AutoCAD SQL Interface, Autodesk, Autodesk Homestyler, Autodesk Intent, Autodesk Inventor, Autodesk
MapGuide, Autodesk Streamline, AutoLISP, AutoSketch, AutoSnap, AutoTrack, Backburner, Backdraft, Beast, Beast (design/logo) Built with
ObjectARX (design/logo), Burn, Buzzsaw, CAiCE, CFdesign, Civil 3D, Cleaner, Cleaner Central, ClearScale, Colour Warper, Combustion,
Communication Specification, Constructware, Content Explorer, Creative Bridge, Dancing Baby (image), DesignCenter, Design Doctor, Designer's
Toolkit, DesignKids, DesignProf, DesignServer, DesignStudio, Design Web Format, Discreet, DWF, DWG, DWG (design/logo), DWG Extreme,
DWG TrueConvert, DWG TrueView, DWFX, DXF, Ecotect, Evolver, Exposure, Extending the Design Team, Face Robot, FBX, Fempro, Fire, Flame,
Flare, Flint, FMDesktop, Freewheel, GDX Driver, Green Building Studio, Heads-up Design, Heidi, Homestyler, HumanIK, IDEA Server, i-drop,
Illuminate Labs AB (design/logo), ImageModeler, iMOUT, Incinerator, Inferno, Instructables, Instructables (stylized robot design/logo),Inventor,
Inventor LT, Kynapse, Kynogon, LandXplorer, LiquidLight, LiquidLight (design/logo), Lustre, MatchMover, Maya, Mechanical Desktop, Moldflow,
Moldflow Plastics Advisers, Moldflow Plastics Insight, Moldflow Plastics Xpert, Moondust, MotionBuilder, Movimento, MPA, MPA (design/logo),
MPI, MPI (design/logo), MPX, MPX (design/logo), Mudbox, Multi-Master Editing, Navisworks, ObjectARX, ObjectDBX, Opticore, Pipeplus, Pixlr,
Pixlr-o-matic, PolarSnap, PortfolioWall, Powered with Autodesk Technology, Productstream, ProMaterials, RasterDWG, RealDWG, Real-time
Roto, Recognize, Render Queue, Retimer, Reveal, Revit, RiverCAD, Robot, Scaleform, Scaleform GFx, Showcase, Show Me, ShowMotion,
SketchBook, Smoke, Softimage, Softimage|XSI (design/logo), Sparks, SteeringWheels, Stitcher, Stone, StormNET, Tinkerbox, ToolClip, Topobase,
Toxik, TrustedDWG, U-Vis, ViewCube, Visual, Visual LISP, Voice Reality, Volo, Vtour, WaterNetworks, Wire, Wiretap, WiretapCentral, XSI.
All other brand names, product names or trademarks belong to their respective holders.
Disclaimer
THIS PUBLICATION AND THE INFORMATION CONTAINED HEREIN IS MADE AVAILABLE BY AUTODESK, INC. "AS IS." AUTODESK, INC. DISCLAIMS
ALL WARRANTIES, EITHER EXPRESS OR IMPLIED, INCLUDING BUT NOT LIMITED TO ANY IMPLIED WARRANTIES OF MERCHANTABILITY OR
FITNESS FOR A PARTICULAR PURPOSE REGARDING THESE MATERIALS.

Contents
Chapter 1 Get Information . . . . . . . . . . . . . . . . . . . . . . . . . . 1
Find the Information You Need . . . . . . . . . . . . . . . . . . . . . . 1
Access and Search the Product Help . . . . . . . . . . . . . . . . . 1
Learn the Product . . . . . . . . . . . . . . . . . . . . . . . . . . . 2
View the Product Readme . . . . . . . . . . . . . . . . . . . . . . 3
Join the Customer Involvement Program . . . . . . . . . . . . . . 3
Join the Customer Involvement Program . . . . . . . . . . . 4
Get Information from Drawings . . . . . . . . . . . . . . . . . . . . . . 4
Obtain General Drawing Information . . . . . . . . . . . . . . . . 4
Chapter 2 The User Interface . . . . . . . . . . . . . . . . . . . . . . . . . 7
Start a Command . . . . . . . . . . . . . . . . . . . . . . . . . . . . . . 7
Parts of the User Interface . . . . . . . . . . . . . . . . . . . . . . 7
The Menu Bar . . . . . . . . . . . . . . . . . . . . . . . . . . . . . 8
The Tool Sets Palette . . . . . . . . . . . . . . . . . . . . . . . . . 8
The Command Line . . . . . . . . . . . . . . . . . . . . . . . . . 10
Overview of Using the Command Line . . . . . . . . . . . . 10
Enter Commands on the Command Line . . . . . . . . . . 11
Enter System Variables on the Command Line . . . . . . . . 13
Switch Between Dialog Boxes and the Command
Line . . . . . . . . . . . . . . . . . . . . . . . . . . . . . 14
View and Edit Within the Command History . . . . . . . . 14
Work with Shortcut Menus . . . . . . . . . . . . . . . . . . . . . 15
iii

About Keyboard Shortcuts . . . . . . . . . . . . . . . . . . . . . 16
Control the Drawing Area Interface . . . . . . . . . . . . . . . . . . . 22
Interface Themes and Background Color . . . . . . . . . . . . . . 22
Interface Themes and Background Color . . . . . . . . . . . 23
Cursors in the Drawing Area . . . . . . . . . . . . . . . . . . . . 24
Selection Style . . . . . . . . . . . . . . . . . . . . . . . . . . . . 24
The UCS Icon . . . . . . . . . . . . . . . . . . . . . . . . . . . . 25
Viewport Label Menus . . . . . . . . . . . . . . . . . . . . . . . 25
The ViewCube Tool . . . . . . . . . . . . . . . . . . . . . . . . . 26
The Coordinates Display . . . . . . . . . . . . . . . . . . . . . . 27
Model Space and Layouts . . . . . . . . . . . . . . . . . . . . . . 27
Control Status, Layers, Properties, and Content . . . . . . . . . . . . . 28
The Status Bar . . . . . . . . . . . . . . . . . . . . . . . . . . . . 28
The Status Bar . . . . . . . . . . . . . . . . . . . . . . . . . 29
The Layers Palette . . . . . . . . . . . . . . . . . . . . . . . . . . 29
The Layers Palette . . . . . . . . . . . . . . . . . . . . . . . 31
The Properties Inspector . . . . . . . . . . . . . . . . . . . . . . 32
The Content Palette . . . . . . . . . . . . . . . . . . . . . . . . . 34
Customize the Drawing Environment . . . . . . . . . . . . . . . . . . 34
Set Interface Options . . . . . . . . . . . . . . . . . . . . . . . . 35
Set Up the Drawing Area . . . . . . . . . . . . . . . . . . . 35
Specify the Behavior of Palettes . . . . . . . . . . . . . . . . 36
Customize Startup . . . . . . . . . . . . . . . . . . . . . . . . . . 36
Chapter 3 Start and Save Drawings . . . . . . . . . . . . . . . . . . . . . 39
Start a Drawing . . . . . . . . . . . . . . . . . . . . . . . . . . . . . . 39
Overview of Starting a New Drawing . . . . . . . . . . . . . . . . 39
Specify Units and Unit Formats . . . . . . . . . . . . . . . . . . . 40
Determine the Units of Measurement . . . . . . . . . . . . 40
Set the Unit Format Conventions . . . . . . . . . . . . . . 41
Use a Drawing Template File . . . . . . . . . . . . . . . . . . . . 42
Add Identifying Information to Drawings . . . . . . . . . . . . . 43
Open or Save a Drawing . . . . . . . . . . . . . . . . . . . . . . . . . . 43
Open a Drawing . . . . . . . . . . . . . . . . . . . . . . . . . . . 43
Work with Multiple Open Drawings . . . . . . . . . . . . . . . . 46
Preview Open Drawings and Layouts . . . . . . . . . . . . . 46
Switch Between Open Drawings . . . . . . . . . . . . . . . 47
Switch Between Layouts in the Current Drawing . . . . . . 47
Transfer Information between Open Drawings . . . . . . . . 47
Save a Drawing . . . . . . . . . . . . . . . . . . . . . . . . . . . 48
Find a Drawing File . . . . . . . . . . . . . . . . . . . . . . . . . 51
Specify Search Paths and File Locations . . . . . . . . . . . . . . 51
Repair, Restore, or Recover Drawing Files . . . . . . . . . . . . . . . . . 52
Repair a Damaged Drawing File . . . . . . . . . . . . . . . . . . . 52
Create and Restore Backup Files . . . . . . . . . . . . . . . . . . 54
Recover from a System Failure . . . . . . . . . . . . . . . . . . . 55
iv | Contents

Chapter 4 Control the Drawing Views . . . . . . . . . . . . . . . . . . . . 57
Change Views . . . . . . . . . . . . . . . . . . . . . . . . . . . . . . . 57
Pan or Zoom a View . . . . . . . . . . . . . . . . . . . . . . . . . 57
Save and Restore Views . . . . . . . . . . . . . . . . . . . . . . . 59
Control the 3D Projection Style . . . . . . . . . . . . . . . . . . . 60
Overview of Parallel and Perspective Views . . . . . . . . . 60
Define a Perspective Projection (DVIEW) . . . . . . . . . . . 61
Define a Parallel Projection . . . . . . . . . . . . . . . . . . 61
Choose Preset 3D Views . . . . . . . . . . . . . . . . . . . . 62
Define a 3D View with Coordinate Values or Angles . . . . . 62
Change to a View of the XY Plane . . . . . . . . . . . . . . 63
Shade a Model and Use Edge Effects . . . . . . . . . . . . . . . . 63
Use a Visual Style to Display Your Model . . . . . . . . . . . 63
Customize a Visual Style . . . . . . . . . . . . . . . . . . . 65
Control Performance . . . . . . . . . . . . . . . . . . . . . 71
Use Viewing Tools . . . . . . . . . . . . . . . . . . . . . . . . . . . . . 72
Specify 3D Views . . . . . . . . . . . . . . . . . . . . . . . . . . 72
Overview of 3D Views . . . . . . . . . . . . . . . . . . . . . 73
Use 3D Navigation Tools . . . . . . . . . . . . . . . . . . . 73
Create a 3D Dynamic View (DVIEW) . . . . . . . . . . . . . 73
Use ViewCube Tool . . . . . . . . . . . . . . . . . . . . . . . . . 74
Overview of ViewCube Tool . . . . . . . . . . . . . . . . . 75
ViewCube Menu . . . . . . . . . . . . . . . . . . . . . . . . 76
Reorient the View of a Model with ViewCube . . . . . . . . 77
Change the UCS with the ViewCube Tool . . . . . . . . . . 80
Display Multiple Views in Model Space . . . . . . . . . . . . . . . . . . 81
Set Model Space Viewports . . . . . . . . . . . . . . . . . . . . . 81
Select and Use the Current Viewport . . . . . . . . . . . . . . . . 83
Save and Restore Model Layout Viewport Arrangements . . . . . 84
Chapter 5 Organize Drawings and Layouts . . . . . . . . . . . . . . . . . 85
Create Single-View Drawings (Model Space) . . . . . . . . . . . . . . . 85
Quick Start for Model Space Drafting . . . . . . . . . . . . . . . . 85
Draw, Scale, and Annotate in Model Space . . . . . . . . . . . . . 86
Create Multiple-View Drawing Layouts (Paper Space) . . . . . . . . . . 89
Quick Start for Layouts . . . . . . . . . . . . . . . . . . . . . . . 89
Understand the Layout Process . . . . . . . . . . . . . . . . . . . 89
Work with Model Space and Paper Space . . . . . . . . . . . . . . 90
Work in Model Space . . . . . . . . . . . . . . . . . . . . . 91
Work on a Named Layout . . . . . . . . . . . . . . . . . . . 91
Access Model Space from a Layout Viewport . . . . . . . . . 92
Create and Modify Layout Viewports . . . . . . . . . . . . . . . . 93
Control Views in Layout Viewports . . . . . . . . . . . . . . . . . 94
Scale Views in Layout Viewports . . . . . . . . . . . . . . . 95
Control Visibility in Layout Viewports . . . . . . . . . . . . 96
Contents | v

Scale Linetypes in Layout Viewports . . . . . . . . . . . . . 99
Align Views in Layout Viewports . . . . . . . . . . . . . . . 99
Rotate Views in Layout Viewports . . . . . . . . . . . . . . 100
Reuse Layouts and Layout Settings . . . . . . . . . . . . . . . . 101
Work with Layouts in a Project . . . . . . . . . . . . . . . . . . . . . 102
Quick Start for Projects . . . . . . . . . . . . . . . . . . . . . . 102
Understand the Project Manager Interface . . . . . . . . . . . . 103
Create and Manage a Project . . . . . . . . . . . . . . . . . . . 104
Create a Project . . . . . . . . . . . . . . . . . . . . . . . 105
Create and Modify Layouts in a Project . . . . . . . . . . . 107
Work with Views on Layouts . . . . . . . . . . . . . . . . 109
Organize a Project with Groups . . . . . . . . . . . . . . . 109
Include Information with Projects, Groups, Layouts, and
Views . . . . . . . . . . . . . . . . . . . . . . . . . . . . 110
Publish Layouts and Projects . . . . . . . . . . . . . . . . . . . 111
Use Projects in a Team . . . . . . . . . . . . . . . . . . . . . . . 112
Use Projects in a Multiple Operating System Environment . . . . 114
Chapter 6 Create and Modify Objects . . . . . . . . . . . . . . . . . . . 117
Control the Properties of Objects . . . . . . . . . . . . . . . . . . . . 117
Work with Object Properties . . . . . . . . . . . . . . . . . . . . 117
Overview of Object Properties . . . . . . . . . . . . . . . . 117
Display and Change the Properties of Objects . . . . . . . 118
Copy Properties Between Objects . . . . . . . . . . . . . . 119
Work with Layers . . . . . . . . . . . . . . . . . . . . . . . . . 119
Overview of Layers . . . . . . . . . . . . . . . . . . . . . . 119
Use Layers to Manage Complexity . . . . . . . . . . . . . 120
Create and Name Layers . . . . . . . . . . . . . . . . . . . 123
Change Layer Settings and Layer Properties . . . . . . . . 124
Override Layer Properties in Viewports . . . . . . . . . . . 125
Group and Sort the List of Layers . . . . . . . . . . . . . . 128
Reconcile New Layers . . . . . . . . . . . . . . . . . . . . 131
Work with Layer States . . . . . . . . . . . . . . . . . . . 132
Work with Colors . . . . . . . . . . . . . . . . . . . . . . . . . 134
Set the Current Color . . . . . . . . . . . . . . . . . . . . 134
Change the Color of an Object . . . . . . . . . . . . . . . 136
Use Color Books . . . . . . . . . . . . . . . . . . . . . . . 136
Work with Linetypes . . . . . . . . . . . . . . . . . . . . . . . . 137
Overview of Linetypes . . . . . . . . . . . . . . . . . . . . 137
Load Linetypes . . . . . . . . . . . . . . . . . . . . . . . . 138
Set the Current Linetype . . . . . . . . . . . . . . . . . . . 139
Change the Linetype of an Object . . . . . . . . . . . . . 139
Control Linetype Scale . . . . . . . . . . . . . . . . . . . . 140
Display Linetypes on Short Segments and Polylines . . . . 141
Control Lineweights . . . . . . . . . . . . . . . . . . . . . . . . 141
Overview of Lineweights . . . . . . . . . . . . . . . . . . 142
vi | Contents

Display Lineweights . . . . . . . . . . . . . . . . . . . . . 143
Set the Current Lineweight . . . . . . . . . . . . . . . . . 144
Change the Lineweight of an Object . . . . . . . . . . . . 144
Control the Display Properties of Certain Objects . . . . . . . . 145
Control the Display of Polylines, Hatches, Gradient Fills,
Lineweights, and Text . . . . . . . . . . . . . . . . . . . 145
Control the Transparency of Objects . . . . . . . . . . . . 147
Control How Overlapping Objects Are Displayed . . . . . . 147
Control the Display of Objects . . . . . . . . . . . . . . . 148
Use Precision Tools . . . . . . . . . . . . . . . . . . . . . . . . . . . . 148
Work with the User Coordinate System (UCS) . . . . . . . . . . 148
Overview of the User Coordinate System (UCS) . . . . . . 148
Control the User Coordinate System (UCS) . . . . . . . . . 150
Work with Named UCS Definitions and Preset
Orientations . . . . . . . . . . . . . . . . . . . . . . . . 150
Assign UCS Definitions to Viewports . . . . . . . . . . . . 151
Use the Dynamic UCS with Solid Models . . . . . . . . . . 152
Control the Display of the User Coordinate System
Icon . . . . . . . . . . . . . . . . . . . . . . . . . . . . 154
Enter Coordinates to Specify Points . . . . . . . . . . . . . . . . 156
Overview of Coordinate Entry . . . . . . . . . . . . . . . . 156
Enter 2D Coordinates . . . . . . . . . . . . . . . . . . . . 157
Enter 3D Coordinates . . . . . . . . . . . . . . . . . . . . 161
Use Dynamic Input . . . . . . . . . . . . . . . . . . . . . . . . 166
Snap to Locations on Objects (Object Snaps) . . . . . . . . . . . 168
Use Object Snaps . . . . . . . . . . . . . . . . . . . . . . . 169
The Object Snap Menu . . . . . . . . . . . . . . . . . . . 170
Set Visual Aids for Object Snaps (AutoSnap) . . . . . . . . 171
Override Object Snap Settings . . . . . . . . . . . . . . . . 171
Restrict Cursor Movement . . . . . . . . . . . . . . . . . . . . . 173
Adjust Grid and Grid Snap . . . . . . . . . . . . . . . . . 173
Use Orthogonal Locking (Ortho Mode) . . . . . . . . . . . 176
Use Polar Tracking and PolarSnap . . . . . . . . . . . . . . 177
Lock an Angle for One Point (Angle) . . . . . . . . . . . . 179
Combine or Offset Points and Coordinates . . . . . . . . . . . . 180
Combine Coordinate Values (Coordinate Filters) . . . . . . 180
Track to Points on Objects (Object Snap Tracking) . . . . . 183
Track to Offset Point Locations (Tracking) . . . . . . . . . 185
Specify Distances . . . . . . . . . . . . . . . . . . . . . . . . . . 185
Enter Direct Distances . . . . . . . . . . . . . . . . . . . . 185
Offset from Temporary Reference Points . . . . . . . . . . 186
Specify Intervals on Objects . . . . . . . . . . . . . . . . . 186
Extract Geometric Information from Objects . . . . . . . . . . . 188
Obtain Distances, Angles, and Point Locations . . . . . . . 188
Obtain Area and Mass Properties Information . . . . . . . 189
Use a Calculator . . . . . . . . . . . . . . . . . . . . . . . . . . 193
Contents | vii

Use the Command Prompt Calculator . . . . . . . . . . . 193
Create Objects . . . . . . . . . . . . . . . . . . . . . . . . . . . . . . 195
Draw Linear Objects . . . . . . . . . . . . . . . . . . . . . . . . 195
Draw Lines . . . . . . . . . . . . . . . . . . . . . . . . . . 196
Draw Polylines . . . . . . . . . . . . . . . . . . . . . . . . 196
Draw Rectangles and Polygons . . . . . . . . . . . . . . . 198
Draw Multiline Objects . . . . . . . . . . . . . . . . . . . 199
Draw Freehand Sketches . . . . . . . . . . . . . . . . . . . 200
Draw Curved Objects . . . . . . . . . . . . . . . . . . . . . . . 201
Draw Arcs . . . . . . . . . . . . . . . . . . . . . . . . . . 201
Draw Circles . . . . . . . . . . . . . . . . . . . . . . . . . 205
Draw Polyline Arcs . . . . . . . . . . . . . . . . . . . . . . 207
Draw Donuts . . . . . . . . . . . . . . . . . . . . . . . . . 209
Draw Ellipses . . . . . . . . . . . . . . . . . . . . . . . . . 209
Draw Splines . . . . . . . . . . . . . . . . . . . . . . . . . 210
Draw Helixes . . . . . . . . . . . . . . . . . . . . . . . . . 214
Draw Construction and Reference Geometry . . . . . . . . . . . 215
Draw Reference Points . . . . . . . . . . . . . . . . . . . . 215
Draw Construction Lines (and Rays) . . . . . . . . . . . . 216
Create and Combine Areas (Regions) . . . . . . . . . . . . . . . 217
Create Revision Clouds . . . . . . . . . . . . . . . . . . . . . . 219
Select and Modify Objects . . . . . . . . . . . . . . . . . . . . . . . . 220
Select Objects . . . . . . . . . . . . . . . . . . . . . . . . . . . 220
Select Objects Individually . . . . . . . . . . . . . . . . . 221
Select Multiple Objects . . . . . . . . . . . . . . . . . . . 222
Prevent Objects from Being Selected . . . . . . . . . . . . 224
Select Objects by Properties . . . . . . . . . . . . . . . . . 224
Customize Object Selection . . . . . . . . . . . . . . . . . 225
Group Objects . . . . . . . . . . . . . . . . . . . . . . . . 227
Correct Mistakes . . . . . . . . . . . . . . . . . . . . . . . . . . 229
Erase Objects . . . . . . . . . . . . . . . . . . . . . . . . . . . . 231
Cut, Copy, and Paste with the Clipboard . . . . . . . . . . . . . 231
Modify Objects . . . . . . . . . . . . . . . . . . . . . . . . . . . 232
Choose a Method to Modify Objects . . . . . . . . . . . . 232
Modify Objects Using Grips . . . . . . . . . . . . . . . . . 233
Move or Rotate Objects . . . . . . . . . . . . . . . . . . . 238
Copy, Array, Offset, or Mirror Objects . . . . . . . . . . . . 242
Change the Size and Shape of Objects . . . . . . . . . . . 256
Fillet, Chamfer, Break, or Join Objects . . . . . . . . . . . 262
Disassociate Compound Objects (Explode) . . . . . . . . . 271
Modify Polylines . . . . . . . . . . . . . . . . . . . . . . . 272
Modify Splines . . . . . . . . . . . . . . . . . . . . . . . . 274
Modify Helixes . . . . . . . . . . . . . . . . . . . . . . . . 278
Modify Multilines . . . . . . . . . . . . . . . . . . . . . . 280
Add Constraints to Geometry . . . . . . . . . . . . . . . . . . . . . . 282
Overview of Constraints . . . . . . . . . . . . . . . . . . . . . . 282
viii | Contents

Constrain Objects Geometrically . . . . . . . . . . . . . . . . . 284
Overview of Geometric Constraints . . . . . . . . . . . . . 284
Apply or Remove Geometric Constraints . . . . . . . . . . 285
Display and Verify Geometric Constraints . . . . . . . . . 289
Modify Objects with Geometric Constraints Applied . . . . 291
Infer Geometric Constraints . . . . . . . . . . . . . . . . . 293
Constrain Distances and Angles between Objects . . . . . . . . . 294
Overview of Dimensional Constraints . . . . . . . . . . . 295
Apply Dimensional Constraints . . . . . . . . . . . . . . . 296
Control the Display of Dimensional Constraints . . . . . . 298
Modify Objects with Dimensional Constraints
Applied . . . . . . . . . . . . . . . . . . . . . . . . . . . 299
Constrain a Design with Formulas and Equations . . . . . . . . 301
Overview of Formulas and Equations . . . . . . . . . . . . 301
Control Geometry with Parameters . . . . . . . . . . . . . 302
Chapter 7 Define and Reference Blocks . . . . . . . . . . . . . . . . . . 307
Work with Blocks . . . . . . . . . . . . . . . . . . . . . . . . . . . . 307
Overview of Blocks . . . . . . . . . . . . . . . . . . . . . . . . . 307
Insert Blocks . . . . . . . . . . . . . . . . . . . . . . . . . . . . 309
Work with Dynamic Blocks in Drawings . . . . . . . . . . . . . 311
Overview of Dynamic Blocks . . . . . . . . . . . . . . . . 311
Work With Action Parameters in Blocks . . . . . . . . . . 313
Work With Constraint Parameters in Blocks . . . . . . . . 315
Remove Block Definitions . . . . . . . . . . . . . . . . . . . . . 316
Create and Modify Blocks . . . . . . . . . . . . . . . . . . . . . . . . 316
Define Blocks . . . . . . . . . . . . . . . . . . . . . . . . . . . . 316
Create Blocks Within a Drawing . . . . . . . . . . . . . . . 317
Create Drawing Files for Use as Blocks . . . . . . . . . . . 318
Control the Color and Linetype Properties in Blocks . . . . 319
Nest Blocks . . . . . . . . . . . . . . . . . . . . . . . . . . 321
Create Block Libraries . . . . . . . . . . . . . . . . . . . . 323
Attach Data to Blocks (Block Attributes) . . . . . . . . . . . . . 323
Overview of Block Attributes . . . . . . . . . . . . . . . . 324
Define Block Attributes . . . . . . . . . . . . . . . . . . . 325
Extract Data from Block Attributes . . . . . . . . . . . . . 327
Extract Block Attribute Data (Advanced) . . . . . . . . . . 328
Modify Blocks . . . . . . . . . . . . . . . . . . . . . . . . . . . 333
Modify a Block Definition . . . . . . . . . . . . . . . . . . 333
Modify the Data in Block Attributes . . . . . . . . . . . . . 334
Modify a Block Attribute Definition . . . . . . . . . . . . . 335
Disassemble a Block Reference (Explode) . . . . . . . . . . 336
Chapter 8 Work with 3D Models . . . . . . . . . . . . . . . . . . . . . . 339
Create 3D Models . . . . . . . . . . . . . . . . . . . . . . . . . . . . 339
Contents | ix

Overview of 3D Modeling . . . . . . . . . . . . . . . . . . . . . 339
Create Solids and Surfaces from Lines and Curves . . . . . . . . 342
Overview of Creating Solids and Surfaces . . . . . . . . . . 342
Create a Solid or Surface by Extruding . . . . . . . . . . . 346
Create a Solid or Surface by Sweeping . . . . . . . . . . . . 348
Create a Solid or Surface by Lofting . . . . . . . . . . . . . 350
Create a Solid or Surface by Revolving . . . . . . . . . . . 352
Create Solids . . . . . . . . . . . . . . . . . . . . . . . . . . . . 352
Overview of Creating 3D Solids . . . . . . . . . . . . . . . 352
Create 3D Solid Primitives . . . . . . . . . . . . . . . . . . 354
Create a Polysolid . . . . . . . . . . . . . . . . . . . . . . 361
Create 3D Solids from Objects . . . . . . . . . . . . . . . . 362
Combine or Slice 3D Objects . . . . . . . . . . . . . . . . 366
Check 3D Models for Interferences . . . . . . . . . . . . . 368
Create Surfaces . . . . . . . . . . . . . . . . . . . . . . . . . . . 369
Overview of Creating Surfaces . . . . . . . . . . . . . . . . 369
Create Procedural Surfaces . . . . . . . . . . . . . . . . . . 374
Create NURBS Surfaces . . . . . . . . . . . . . . . . . . . 378
Create Associative Surfaces . . . . . . . . . . . . . . . . . 380
Create Meshes . . . . . . . . . . . . . . . . . . . . . . . . . . . 382
Overview of Creating Meshes . . . . . . . . . . . . . . . . 382
Create 3D Mesh Primitives . . . . . . . . . . . . . . . . . 385
Construct Meshes from Other Objects . . . . . . . . . . . 393
Create Meshes by Conversion . . . . . . . . . . . . . . . . 397
Create Custom Mesh (Legacy) . . . . . . . . . . . . . . . . 399
Create Wireframe Models . . . . . . . . . . . . . . . . . . . . . 404
Add 3D Thickness to Objects . . . . . . . . . . . . . . . . . . . 406
Modify 3D Models . . . . . . . . . . . . . . . . . . . . . . . . . . . . 407
Overview of Modifying 3D Objects . . . . . . . . . . . . . . . . 408
Use Gizmos to Modify Objects . . . . . . . . . . . . . . . . . . 410
Overview of Using Gizmos . . . . . . . . . . . . . . . . . 410
Use the Gizmos . . . . . . . . . . . . . . . . . . . . . . . 410
Move 3D Objects . . . . . . . . . . . . . . . . . . . . . . . 412
Rotate 3D Objects . . . . . . . . . . . . . . . . . . . . . . 414
Scale 3D Objects . . . . . . . . . . . . . . . . . . . . . . . 416
Use Grips to Modify Solids and Surfaces . . . . . . . . . . . . . 418
Use 3D Subobject Grips . . . . . . . . . . . . . . . . . . . 418
Cycle Through and Filter Subobjects . . . . . . . . . . . . 419
Use Grips to Edit 3D Solids and Surfaces . . . . . . . . . . 420
Modify 3D Subobjects . . . . . . . . . . . . . . . . . . . . . . . 423
Move, Rotate, and Scale 3D Subobjects . . . . . . . . . . . 423
Modify Faces on 3D Objects . . . . . . . . . . . . . . . . . 425
Modify Edges on 3D Objects . . . . . . . . . . . . . . . . 429
Modify Vertices on 3D Objects . . . . . . . . . . . . . . . 432
Work with Complex 3D Solids and Surfaces . . . . . . . . . . . 433
Display Original Forms of Composite Solids . . . . . . . . 434
x | Contents

Modify Composite Solids and Surfaces . . . . . . . . . . . 435
Shell and Remove Redundancies in 3D Objects . . . . . . . 437
Pressing or Pulling Areas and Faces . . . . . . . . . . . . . 438
Add Facets to Faces on Solids and Surfaces . . . . . . . . . 439
Modify the Properties of 3D Solids, Surfaces, and Meshes . . . . 441
Modify Surfaces . . . . . . . . . . . . . . . . . . . . . . . . . . 444
Overview of Modifying Surfaces . . . . . . . . . . . . . . . 445
Trim and Untrim Surfaces . . . . . . . . . . . . . . . . . . 446
Extend a Surface . . . . . . . . . . . . . . . . . . . . . . . 447
Fillet a Surface . . . . . . . . . . . . . . . . . . . . . . . . 448
Edit NURBS Surfaces . . . . . . . . . . . . . . . . . . . . . 448
Analyze Surfaces . . . . . . . . . . . . . . . . . . . . . . . 450
Modify Mesh Objects . . . . . . . . . . . . . . . . . . . . . . . 454
Overview of Modifying Meshes . . . . . . . . . . . . . . . 454
Change Mesh Smoothness Levels . . . . . . . . . . . . . . 457
Refine Mesh Objects or Subobjects . . . . . . . . . . . . . 460
Add Creases to Mesh . . . . . . . . . . . . . . . . . . . . . 462
Modify Mesh Faces . . . . . . . . . . . . . . . . . . . . . . 463
Create and Close Mesh Gaps . . . . . . . . . . . . . . . . 466
Tips for Working with Mesh . . . . . . . . . . . . . . . . . 468
Create Sections and Drawings from 3D Models . . . . . . . . . . . . . 474
Work with Sections . . . . . . . . . . . . . . . . . . . . . . . . 474
Overview of Section Objects . . . . . . . . . . . . . . . . . 474
Create Section Objects . . . . . . . . . . . . . . . . . . . . 476
Modify a Section View . . . . . . . . . . . . . . . . . . . . 479
Save and Publish Section Objects . . . . . . . . . . . . . . 483
Create a Flattened View . . . . . . . . . . . . . . . . . . . . . . 486
Chapter 9 Annotate Drawings . . . . . . . . . . . . . . . . . . . . . . . 489
Work with Annotations . . . . . . . . . . . . . . . . . . . . . . . . . 489
Overview of Annotations . . . . . . . . . . . . . . . . . . . . . 489
Scale Annotations . . . . . . . . . . . . . . . . . . . . . . . . . 490
Overview of Scaling Annotations . . . . . . . . . . . . . . 490
Set Annotation Scale . . . . . . . . . . . . . . . . . . . . . 491
Create Annotative Objects . . . . . . . . . . . . . . . . . . 492
Display Annotative Objects . . . . . . . . . . . . . . . . . 500
Add and Modify Scale Representations . . . . . . . . . . . 501
Set Orientation for Annotations . . . . . . . . . . . . . . . . . . 502
Set Orientation for Annotations . . . . . . . . . . . . . . . 503
Hatches, Fills, and Wipeouts . . . . . . . . . . . . . . . . . . . . . . . 504
Overview of Hatch Patterns and Fills . . . . . . . . . . . . . . . 504
Specify Hatch and Fill Areas . . . . . . . . . . . . . . . . . . . . 505
Control the Appearance of Hatches . . . . . . . . . . . . . . . . 509
Choose a Hatch Pattern or Fill . . . . . . . . . . . . . . . . 509
Control the Hatch Origin Point . . . . . . . . . . . . . . . 510
Control the Scale of Hatch Patterns . . . . . . . . . . . . . 510
Contents | xi

Set Property Overrides for Hatches and Fills . . . . . . . . 511
Control the Display of Hatch Boundaries . . . . . . . . . . 511
Control the Draw Order of Hatches and Fills . . . . . . . . 512
Modify Hatches and Fills . . . . . . . . . . . . . . . . . . . . . 512
Modify Hatch Properties . . . . . . . . . . . . . . . . . . . 513
Modify Hatch Alignment, Scale, and Rotation . . . . . . . 513
Reshape a Hatch or Fill . . . . . . . . . . . . . . . . . . . 514
Re-create the Boundary of a Hatch or Fill . . . . . . . . . . 515
Create a Blank Area to Cover Objects . . . . . . . . . . . . . . . 516
Notes and Labels . . . . . . . . . . . . . . . . . . . . . . . . . . . . . 517
Overview of Notes and Labels . . . . . . . . . . . . . . . . . . . 517
Create Text . . . . . . . . . . . . . . . . . . . . . . . . . . . . . 517
Overview of Creating Text . . . . . . . . . . . . . . . . . . 517
Create Single-Line Text . . . . . . . . . . . . . . . . . . . 518
Create Multiline Text . . . . . . . . . . . . . . . . . . . . 520
Create and Edit Columns in Multiline Text . . . . . . . . . 528
Import Text from External Files . . . . . . . . . . . . . . . 529
Create Leaders . . . . . . . . . . . . . . . . . . . . . . . . . . . 529
Overview of Leader Objects . . . . . . . . . . . . . . . . . 529
Create and Modify Leaders . . . . . . . . . . . . . . . . . 530
Modify Leaders Using Grips . . . . . . . . . . . . . . . . . 532
Work with Leader Styles . . . . . . . . . . . . . . . . . . . 533
Add Content to a Leader . . . . . . . . . . . . . . . . . . . 533
Use Fields in Text . . . . . . . . . . . . . . . . . . . . . . . . . 536
Insert Fields . . . . . . . . . . . . . . . . . . . . . . . . . 536
Update Fields . . . . . . . . . . . . . . . . . . . . . . . . . 537
Work with Text Styles . . . . . . . . . . . . . . . . . . . . . . . 540
Overview of Text Styles . . . . . . . . . . . . . . . . . . . 540
Assign Text Fonts . . . . . . . . . . . . . . . . . . . . . . 542
Set Text Height . . . . . . . . . . . . . . . . . . . . . . . . 547
Set Text Obliquing Angle . . . . . . . . . . . . . . . . . . 548
Set Horizontal or Vertical Text Orientation . . . . . . . . . 549
Change Text . . . . . . . . . . . . . . . . . . . . . . . . . . . . 549
Overview of Changing Text . . . . . . . . . . . . . . . . . 550
Change Single-Line Text . . . . . . . . . . . . . . . . . . . 550
Change Multiline Text . . . . . . . . . . . . . . . . . . . . 550
Find and Replace Text . . . . . . . . . . . . . . . . . . . . 551
Check Spelling . . . . . . . . . . . . . . . . . . . . . . . . . . . 552
Format Multiline Text at the Command Prompt . . . . . . . . . 553
Tables . . . . . . . . . . . . . . . . . . . . . . . . . . . . . . . . . . . 556
Create and Modify Tables . . . . . . . . . . . . . . . . . . . . . 556
Work with Table Styles . . . . . . . . . . . . . . . . . . . . . . . 558
Add Text and Blocks to Tables . . . . . . . . . . . . . . . . . . . 559
Use Formulas in Table Cells . . . . . . . . . . . . . . . . . . . . 560
Dimensions and Tolerances . . . . . . . . . . . . . . . . . . . . . . . 561
Understand Basic Concepts of Dimensioning . . . . . . . . . . . 561
xii | Contents

Overview of Dimensioning . . . . . . . . . . . . . . . . . 561
Parts of a Dimension . . . . . . . . . . . . . . . . . . . . . 562
Associative Dimensions . . . . . . . . . . . . . . . . . . . 563
Use Dimension Styles . . . . . . . . . . . . . . . . . . . . . . . 565
Overview of Dimension Styles . . . . . . . . . . . . . . . . 565
Compare Dimension Styles and Variables . . . . . . . . . . 565
Control Dimension Geometry . . . . . . . . . . . . . . . . 566
Control Dimension Text . . . . . . . . . . . . . . . . . . . 571
Control Dimension Values . . . . . . . . . . . . . . . . . 577
Set the Scale for Dimensions . . . . . . . . . . . . . . . . . . . . 583
Create Dimensions . . . . . . . . . . . . . . . . . . . . . . . . . 584
Create Linear Dimensions . . . . . . . . . . . . . . . . . . 584
Create Radial Dimensions . . . . . . . . . . . . . . . . . . 588
Create Angular Dimensions . . . . . . . . . . . . . . . . . 592
Create Ordinate Dimensions . . . . . . . . . . . . . . . . 594
Create Arc Length Dimensions . . . . . . . . . . . . . . . 596
Modify Existing Dimensions . . . . . . . . . . . . . . . . . . . . 596
Modify A Dimension . . . . . . . . . . . . . . . . . . . . 597
Apply a New Dimension Style to Existing
Dimensions . . . . . . . . . . . . . . . . . . . . . . . . 609
Override a Dimension Style . . . . . . . . . . . . . . . . . 609
Add Geometric Tolerances . . . . . . . . . . . . . . . . . . . . . 610
Overview of Geometric Tolerances . . . . . . . . . . . . . 610
Material Conditions . . . . . . . . . . . . . . . . . . . . . 612
Datum Reference Frames . . . . . . . . . . . . . . . . . . 612
Projected Tolerance Zones . . . . . . . . . . . . . . . . . . 613
Composite Tolerances . . . . . . . . . . . . . . . . . . . . 613
Chapter 10 Plot and Publish Drawings . . . . . . . . . . . . . . . . . . . . 615
Specify Settings for Plotting . . . . . . . . . . . . . . . . . . . . . . . 615
Save Plot Settings as Named Page Setups . . . . . . . . . . . . . 615
Reuse Named Page Setups . . . . . . . . . . . . . . . . . . . . . 616
Specify Page Setup Settings . . . . . . . . . . . . . . . . . . . . 617
Select a Printer or Plotter for a Layout . . . . . . . . . . . . 617
Select a Paper Size for a Layout . . . . . . . . . . . . . . . 617
Determine the Drawing Orientation of a Layout . . . . . . 618
Set the Plot Area of a Layout . . . . . . . . . . . . . . . . . 618
Adjust the Plot Offset of a Layout . . . . . . . . . . . . . . 619
Set the Plot Scale for a Layout . . . . . . . . . . . . . . . . 619
Set the Lineweight Scale for a Layout . . . . . . . . . . . . 620
Select a Plot Style Table for a Layout . . . . . . . . . . . . 620
Set Shaded Viewport and Plot Options for a Layout . . . . 620
Named Page Setups with Projects . . . . . . . . . . . . . . . . . 621
Print or Plot Drawings . . . . . . . . . . . . . . . . . . . . . . . . . . 621
Overview of Plotting . . . . . . . . . . . . . . . . . . . . . . . . 622
Use a Page Setup to Specify Plot Settings . . . . . . . . . . . . . 624
Contents | xiii

Select a Printer or Plotter . . . . . . . . . . . . . . . . . . . . . 624
Specify the Area to Plot . . . . . . . . . . . . . . . . . . . . . . 624
Set Paper Size . . . . . . . . . . . . . . . . . . . . . . . . . . . . 625
Position the Drawing on the Paper . . . . . . . . . . . . . . . . 625
Specify the Printable Area . . . . . . . . . . . . . . . . . . 625
Set the Position of the Plot . . . . . . . . . . . . . . . . . 626
Set Drawing Orientation . . . . . . . . . . . . . . . . . . 626
Control How Objects Are Plotted . . . . . . . . . . . . . . . . . 627
Set Plot Scale . . . . . . . . . . . . . . . . . . . . . . . . . 627
Set Shaded Viewport Options . . . . . . . . . . . . . . . . 628
Set Options for Plotted Objects . . . . . . . . . . . . . . . 630
Use Plot Styles to Control Plotted Objects . . . . . . . . . 631
Use Color-Dependent Plot Style Tables . . . . . . . . . . . 633
Use Named Plot Style Tables . . . . . . . . . . . . . . . . . 634
Change Plot Style Settings . . . . . . . . . . . . . . . . . . 636
Preview a Plot . . . . . . . . . . . . . . . . . . . . . . . . . . . 640
Plot Files to Other Formats . . . . . . . . . . . . . . . . . . . . 640
Plot Adobe PDF Files . . . . . . . . . . . . . . . . . . . . . 640
Publish Drawings . . . . . . . . . . . . . . . . . . . . . . . . . . . . . 640
Overview of Publishing . . . . . . . . . . . . . . . . . . . . . . 641
Create a Drawing Set for Publishing . . . . . . . . . . . . . . . . 641
Publish a Project . . . . . . . . . . . . . . . . . . . . . . . . . . 642
Chapter 11 Share Data Between Files . . . . . . . . . . . . . . . . . . . . 643
Reference Other Drawing Files . . . . . . . . . . . . . . . . . . . . . . 643
Overview of Referenced Drawings (Xrefs) . . . . . . . . . . . . . 643
Attach and Detach Referenced Drawings . . . . . . . . . . . . . 644
Attach Drawing References (Xrefs) . . . . . . . . . . . . . 644
Nest and Overlay Referenced Drawings . . . . . . . . . . . 646
Set Paths to Referenced Drawings . . . . . . . . . . . . . . 647
Detach Referenced Drawings . . . . . . . . . . . . . . . . 649
Update and Archive Referenced Drawings . . . . . . . . . . . . 650
Update Referenced Drawing Attachments . . . . . . . . . 650
Archive Drawings That Contain Referenced Drawings
(Bind) . . . . . . . . . . . . . . . . . . . . . . . . . . . . 652
Clip External References and Blocks . . . . . . . . . . . . . . . . 653
Edit Referenced Drawings . . . . . . . . . . . . . . . . . . . . . 655
Edit a Referenced Drawing in a Separate Window . . . . . 656
Edit Selected Objects in Referenced Drawings and
Blocks . . . . . . . . . . . . . . . . . . . . . . . . . . . 656
Use the Working Set to Edit Referenced Drawings and
Blocks . . . . . . . . . . . . . . . . . . . . . . . . . . . 658
Save Back Edited Referenced Drawings and Blocks . . . . . 659
Edit Referenced Drawings and Blocks with Nesting or
Attributes . . . . . . . . . . . . . . . . . . . . . . . . . 660
Resolve Referenced Drawing Errors . . . . . . . . . . . . . . . . 660
xiv | Contents

Resolve Missing External References . . . . . . . . . . . . 661
Resolve Circular External References . . . . . . . . . . . . 662
Resolve Name Conflicts in External References . . . . . . . 662
Track External Reference Operations (Log File) . . . . . . . 663
Increase Performance with Large Referenced Drawings . . . . . . 666
Overview of Demand Loading . . . . . . . . . . . . . . . . 666
Unload Xrefs in Large Drawings . . . . . . . . . . . . . . . 666
Work with Demand Loading in Large Drawings . . . . . . 666
Work with Layer and Spatial Indexes . . . . . . . . . . . . 667
Set Paths for Temporary Xref File Copies . . . . . . . . . . 668
Work with Data in Other Formats . . . . . . . . . . . . . . . . . . . . 669
Import Other File Formats . . . . . . . . . . . . . . . . . . . . . 669
Import ACIS SAT Files . . . . . . . . . . . . . . . . . . . . 669
Convert DXF and DXB Files to DWG Format . . . . . . . . 669
Attach PDF Files as Underlays . . . . . . . . . . . . . . . . . . . 670
Overview of PDF Underlays . . . . . . . . . . . . . . . . . 670
Attach, Scale, and Detach PDF Underlays . . . . . . . . . 670
Work with PDF Underlays . . . . . . . . . . . . . . . . . 672
Manage and Publish Drawings Containing PDF Underlays
. . . . . . . . . . . . . . . . . . . . . . . . . . . . . . . 678
Attach Raster Image Files . . . . . . . . . . . . . . . . . . . . . 680
Overview of Raster Images . . . . . . . . . . . . . . . . . . 681
Attach, Scale, and Detach Raster Images . . . . . . . . . . 683
Modify Raster Images and Image Boundaries . . . . . . . . 685
Manage Raster Images . . . . . . . . . . . . . . . . . . . . 688
Tune Raster Image Performance . . . . . . . . . . . . . . . 690
Export Drawings to Other File Formats . . . . . . . . . . . . . . 692
Export PDF Files . . . . . . . . . . . . . . . . . . . . . . . 692
Export DXF Files . . . . . . . . . . . . . . . . . . . . . . . 693
Export Raster Files . . . . . . . . . . . . . . . . . . . . . . 693
Export PostScript Files . . . . . . . . . . . . . . . . . . . . 693
Export ACIS SAT Files . . . . . . . . . . . . . . . . . . . . 694
Export Stereolithography STL Files . . . . . . . . . . . . . 694
Use Drawings from Different Versions and Applications . . . . . 695
Work with Drawings in Earlier Releases . . . . . . . . . . . 695
Save Drawings to Previous Drawing File Formats . . . . . . 699
Work with AutoCAD Drawings in AutoCAD LT . . . . . . . 700
Work with Custom and Proxy Objects . . . . . . . . . . . 702
Chapter 12 Collaborate with Others . . . . . . . . . . . . . . . . . . . . . 705
Use the Internet for Collaboration . . . . . . . . . . . . . . . . . . . 705
Get Started with Internet Access . . . . . . . . . . . . . . . . . . 705
Work with Drawing Files over the Internet . . . . . . . . . . . . 706
Open and Save Drawing Files from the Internet . . . . . . 706
Share Drawing Files Internationally . . . . . . . . . . . . . 706
Use AutoCAD WS for Drawing File Collaboration . . . . . 707
Contents | xv

Work with Xrefs over the Internet . . . . . . . . . . . . . 708
Chapter 13 Render Drawings . . . . . . . . . . . . . . . . . . . . . . . . . 711
Draw 2D Isometric Views . . . . . . . . . . . . . . . . . . . . . . . . 711
Set Isometric Grid and Snap . . . . . . . . . . . . . . . . . . . . 711
Draw Isometric Circles . . . . . . . . . . . . . . . . . . . . . . . 712
Add Lighting to Your Model . . . . . . . . . . . . . . . . . . . . . . . 713
Overview of Lighting . . . . . . . . . . . . . . . . . . . . . . . 713
Standard and Photometric Lighting Workflow . . . . . . . . . . 715
Illuminate a Scene . . . . . . . . . . . . . . . . . . . . . . . . . 716
Guidelines for Lighting . . . . . . . . . . . . . . . . . . . 716
Use Point Lights . . . . . . . . . . . . . . . . . . . . . . . 717
Use Spotlights . . . . . . . . . . . . . . . . . . . . . . . . 719
Use Weblights . . . . . . . . . . . . . . . . . . . . . . . . 721
Use Distant Lights . . . . . . . . . . . . . . . . . . . . . . 727
Assigning a Shape to a Light . . . . . . . . . . . . . . . . . 727
Adjust and Manipulate Lights . . . . . . . . . . . . . . . . . . . 728
Control the Display of Lights . . . . . . . . . . . . . . . . 728
Adjust Light Placement . . . . . . . . . . . . . . . . . . . 729
Control Light Properties . . . . . . . . . . . . . . . . . . . 730
Sun and Sky Simulation . . . . . . . . . . . . . . . . . . . . . . 735
Incorporate Luminaire Objects . . . . . . . . . . . . . . . . . . 735
Materials and Textures . . . . . . . . . . . . . . . . . . . . . . . . . . 736
Overview of Materials . . . . . . . . . . . . . . . . . . . . . . . 736
Browse Material Library . . . . . . . . . . . . . . . . . . . . . . 736
Render 3D Objects for Realism . . . . . . . . . . . . . . . . . . . . . 738
Overview of Rendering . . . . . . . . . . . . . . . . . . . . . . 738
Prepare a Model for Rendering . . . . . . . . . . . . . . . . . . 739
Understand Face Normals and Hidden Surfaces . . . . . . 739
Minimize Intersecting and Coplanar Faces . . . . . . . . . 741
Balance Mesh Density for Smooth Geometry . . . . . . . . 744
Set Up the Renderer . . . . . . . . . . . . . . . . . . . . . . . . 747
Control the Rendering Environment . . . . . . . . . . . . 747
Basics of Rendering . . . . . . . . . . . . . . . . . . . . . . . . 748
Render Views . . . . . . . . . . . . . . . . . . . . . . . . . 748
Save and Redisplay Rendered Images . . . . . . . . . . . . . . . 749
Save a Rendered Image . . . . . . . . . . . . . . . . . . . 749
Redisplay a Rendered Image . . . . . . . . . . . . . . . . . 749
Use Models with Other Applications . . . . . . . . . . . . 750
Glossary . . . . . . . . . . . . . . . . . . . . . . . . . . . . . . . . . . . . . . . . . . 751
3D mesh primitive . . . . . . . . . . . . . . . . . . . . . . . . . . . . . . . . . 751
3D view . . . . . . . . . . . . . . . . . . . . . . . . . . . . . . . . . . . . . . . 751
absolute coordinates . . . . . . . . . . . . . . . . . . . . . . . . . . . . . . . . 751
acquired point . . . . . . . . . . . . . . . . . . . . . . . . . . . . . . . . . . . 751
acquisition marker . . . . . . . . . . . . . . . . . . . . . . . . . . . . . . . . . 751
activate . . . . . . . . . . . . . . . . . . . . . . . . . . . . . . . . . . . . . . . 751
xvi | Contents

adaptive degradation . . . . . . . . . . . . . . . . . . . . . . . . . . . . . . . . 751
adaptive sampling . . . . . . . . . . . . . . . . . . . . . . . . . . . . . . . . . 752
adjacent cell selection . . . . . . . . . . . . . . . . . . . . . . . . . . . . . . . 752
alias . . . . . . . . . . . . . . . . . . . . . . . . . . . . . . . . . . . . . . . . . 752
aliasing . . . . . . . . . . . . . . . . . . . . . . . . . . . . . . . . . . . . . . . 752
aligned dimension . . . . . . . . . . . . . . . . . . . . . . . . . . . . . . . . . 752
alpha channel . . . . . . . . . . . . . . . . . . . . . . . . . . . . . . . . . . . . 752
ambient color . . . . . . . . . . . . . . . . . . . . . . . . . . . . . . . . . . . . 753
ambient light . . . . . . . . . . . . . . . . . . . . . . . . . . . . . . . . . . . . 753
angular dimension . . . . . . . . . . . . . . . . . . . . . . . . . . . . . . . . . 753
angular unit . . . . . . . . . . . . . . . . . . . . . . . . . . . . . . . . . . . . . 753
annotational constraint . . . . . . . . . . . . . . . . . . . . . . . . . . . . . . 753
annotations . . . . . . . . . . . . . . . . . . . . . . . . . . . . . . . . . . . . . 753
annotation scale . . . . . . . . . . . . . . . . . . . . . . . . . . . . . . . . . . 753
annotative . . . . . . . . . . . . . . . . . . . . . . . . . . . . . . . . . . . . . . 753
anonymous block . . . . . . . . . . . . . . . . . . . . . . . . . . . . . . . . . . 754
anti-aliasing . . . . . . . . . . . . . . . . . . . . . . . . . . . . . . . . . . . . . 754
approximation points . . . . . . . . . . . . . . . . . . . . . . . . . . . . . . . 754
array . . . . . . . . . . . . . . . . . . . . . . . . . . . . . . . . . . . . . . . . . 754
arrowhead . . . . . . . . . . . . . . . . . . . . . . . . . . . . . . . . . . . . . . 754
aspect ratio . . . . . . . . . . . . . . . . . . . . . . . . . . . . . . . . . . . . . 754
associative dimension . . . . . . . . . . . . . . . . . . . . . . . . . . . . . . . 754
associative hatch . . . . . . . . . . . . . . . . . . . . . . . . . . . . . . . . . . 755
associative surfaces . . . . . . . . . . . . . . . . . . . . . . . . . . . . . . . . . 755
attenuation . . . . . . . . . . . . . . . . . . . . . . . . . . . . . . . . . . . . . 755
attribute definition . . . . . . . . . . . . . . . . . . . . . . . . . . . . . . . . . 755
attribute extraction file . . . . . . . . . . . . . . . . . . . . . . . . . . . . . . . 755
attribute extraction template file . . . . . . . . . . . . . . . . . . . . . . . . . . 755
attribute prompt . . . . . . . . . . . . . . . . . . . . . . . . . . . . . . . . . . 755
attribute tag . . . . . . . . . . . . . . . . . . . . . . . . . . . . . . . . . . . . . 755
attribute value . . . . . . . . . . . . . . . . . . . . . . . . . . . . . . . . . . . 755
axis tripod . . . . . . . . . . . . . . . . . . . . . . . . . . . . . . . . . . . . . . 756
back face . . . . . . . . . . . . . . . . . . . . . . . . . . . . . . . . . . . . . . 756
baseline . . . . . . . . . . . . . . . . . . . . . . . . . . . . . . . . . . . . . . . 756
baseline dimension . . . . . . . . . . . . . . . . . . . . . . . . . . . . . . . . . 756
base point . . . . . . . . . . . . . . . . . . . . . . . . . . . . . . . . . . . . . . 756
basic tooltip . . . . . . . . . . . . . . . . . . . . . . . . . . . . . . . . . . . . . 756
Bezier curve . . . . . . . . . . . . . . . . . . . . . . . . . . . . . . . . . . . . . 756
bitmap . . . . . . . . . . . . . . . . . . . . . . . . . . . . . . . . . . . . . . . 756
blips . . . . . . . . . . . . . . . . . . . . . . . . . . . . . . . . . . . . . . . . . 756
block . . . . . . . . . . . . . . . . . . . . . . . . . . . . . . . . . . . . . . . . 757
block definition . . . . . . . . . . . . . . . . . . . . . . . . . . . . . . . . . . . 757
block definition table . . . . . . . . . . . . . . . . . . . . . . . . . . . . . . . . 757
block instance . . . . . . . . . . . . . . . . . . . . . . . . . . . . . . . . . . . . 757
block reference . . . . . . . . . . . . . . . . . . . . . . . . . . . . . . . . . . . 757
bounded area . . . . . . . . . . . . . . . . . . . . . . . . . . . . . . . . . . . . 757
Contents | xvii

B-spline curve . . . . . . . . . . . . . . . . . . . . . . . . . . . . . . . . . . . . 757
bulge magnitude . . . . . . . . . . . . . . . . . . . . . . . . . . . . . . . . . . 757
bump map . . . . . . . . . . . . . . . . . . . . . . . . . . . . . . . . . . . . . 757
BYBLOCK . . . . . . . . . . . . . . . . . . . . . . . . . . . . . . . . . . . . . . 758
BYLAYER . . . . . . . . . . . . . . . . . . . . . . . . . . . . . . . . . . . . . . 758
camera target . . . . . . . . . . . . . . . . . . . . . . . . . . . . . . . . . . . . 758
candela . . . . . . . . . . . . . . . . . . . . . . . . . . . . . . . . . . . . . . . 758
canvas . . . . . . . . . . . . . . . . . . . . . . . . . . . . . . . . . . . . . . . . 758
category . . . . . . . . . . . . . . . . . . . . . . . . . . . . . . . . . . . . . . . 758
cell . . . . . . . . . . . . . . . . . . . . . . . . . . . . . . . . . . . . . . . . . 758
cell boundary . . . . . . . . . . . . . . . . . . . . . . . . . . . . . . . . . . . . 758
cell style . . . . . . . . . . . . . . . . . . . . . . . . . . . . . . . . . . . . . . . 758
circular external reference . . . . . . . . . . . . . . . . . . . . . . . . . . . . . 758
clamp curve . . . . . . . . . . . . . . . . . . . . . . . . . . . . . . . . . . . . . 758
clamp surface . . . . . . . . . . . . . . . . . . . . . . . . . . . . . . . . . . . . 759
clipping planes . . . . . . . . . . . . . . . . . . . . . . . . . . . . . . . . . . . 759
CMYK . . . . . . . . . . . . . . . . . . . . . . . . . . . . . . . . . . . . . . . . 759
coincident grip . . . . . . . . . . . . . . . . . . . . . . . . . . . . . . . . . . . 759
Color bleed scale . . . . . . . . . . . . . . . . . . . . . . . . . . . . . . . . . . 759
color map . . . . . . . . . . . . . . . . . . . . . . . . . . . . . . . . . . . . . . 759
column . . . . . . . . . . . . . . . . . . . . . . . . . . . . . . . . . . . . . . . 759
command line . . . . . . . . . . . . . . . . . . . . . . . . . . . . . . . . . . . 759
compass . . . . . . . . . . . . . . . . . . . . . . . . . . . . . . . . . . . . . . . 759
composite solid . . . . . . . . . . . . . . . . . . . . . . . . . . . . . . . . . . . 759
constraint bar . . . . . . . . . . . . . . . . . . . . . . . . . . . . . . . . . . . . 759
constraint point . . . . . . . . . . . . . . . . . . . . . . . . . . . . . . . . . . . 760
constraints . . . . . . . . . . . . . . . . . . . . . . . . . . . . . . . . . . . . . 760
construction plane . . . . . . . . . . . . . . . . . . . . . . . . . . . . . . . . . 760
continued dimension . . . . . . . . . . . . . . . . . . . . . . . . . . . . . . . . 760
continuity . . . . . . . . . . . . . . . . . . . . . . . . . . . . . . . . . . . . . . 760
control frame . . . . . . . . . . . . . . . . . . . . . . . . . . . . . . . . . . . . 760
control point . . . . . . . . . . . . . . . . . . . . . . . . . . . . . . . . . . . . 760
control vertices (CVs) . . . . . . . . . . . . . . . . . . . . . . . . . . . . . . . . 761
Coons patch . . . . . . . . . . . . . . . . . . . . . . . . . . . . . . . . . . . . 761
coordinate filters . . . . . . . . . . . . . . . . . . . . . . . . . . . . . . . . . . 761
crease . . . . . . . . . . . . . . . . . . . . . . . . . . . . . . . . . . . . . . . . 761
crosshairs . . . . . . . . . . . . . . . . . . . . . . . . . . . . . . . . . . . . . . 761
crossing selection . . . . . . . . . . . . . . . . . . . . . . . . . . . . . . . . . . 761
cross sections . . . . . . . . . . . . . . . . . . . . . . . . . . . . . . . . . . . . 761
CTB file . . . . . . . . . . . . . . . . . . . . . . . . . . . . . . . . . . . . . . . 761
ctrl-cycle . . . . . . . . . . . . . . . . . . . . . . . . . . . . . . . . . . . . . . 761
current drawing . . . . . . . . . . . . . . . . . . . . . . . . . . . . . . . . . . . 761
cursor . . . . . . . . . . . . . . . . . . . . . . . . . . . . . . . . . . . . . . . . 762
cursor menu . . . . . . . . . . . . . . . . . . . . . . . . . . . . . . . . . . . . . 762
curve-fit . . . . . . . . . . . . . . . . . . . . . . . . . . . . . . . . . . . . . . . 762
custom grips . . . . . . . . . . . . . . . . . . . . . . . . . . . . . . . . . . . . 762
xviii | Contents

customization (CUIx) file . . . . . . . . . . . . . . . . . . . . . . . . . . . . . . 762
custom object . . . . . . . . . . . . . . . . . . . . . . . . . . . . . . . . . . . . 762
CV hull . . . . . . . . . . . . . . . . . . . . . . . . . . . . . . . . . . . . . . . 762
decimal degrees . . . . . . . . . . . . . . . . . . . . . . . . . . . . . . . . . . . 762
default . . . . . . . . . . . . . . . . . . . . . . . . . . . . . . . . . . . . . . . . 763
default drawing . . . . . . . . . . . . . . . . . . . . . . . . . . . . . . . . . . . 763
default lighting . . . . . . . . . . . . . . . . . . . . . . . . . . . . . . . . . . . 763
default value . . . . . . . . . . . . . . . . . . . . . . . . . . . . . . . . . . . . 763
definition points . . . . . . . . . . . . . . . . . . . . . . . . . . . . . . . . . . 763
definition table . . . . . . . . . . . . . . . . . . . . . . . . . . . . . . . . . . . 763
degree . . . . . . . . . . . . . . . . . . . . . . . . . . . . . . . . . . . . . . . . 763
dependency highlighting . . . . . . . . . . . . . . . . . . . . . . . . . . . . . . 763
dependent named objects (in xrefs) . . . . . . . . . . . . . . . . . . . . . . . . 763
dependent symbols . . . . . . . . . . . . . . . . . . . . . . . . . . . . . . . . . 764
DIESEL . . . . . . . . . . . . . . . . . . . . . . . . . . . . . . . . . . . . . . . 764
diffuse color . . . . . . . . . . . . . . . . . . . . . . . . . . . . . . . . . . . . . 764
dimensional constraint . . . . . . . . . . . . . . . . . . . . . . . . . . . . . . . 764
dimension line arc . . . . . . . . . . . . . . . . . . . . . . . . . . . . . . . . . 764
dimension style . . . . . . . . . . . . . . . . . . . . . . . . . . . . . . . . . . . 764
dimension text . . . . . . . . . . . . . . . . . . . . . . . . . . . . . . . . . . . 764
dimension variables . . . . . . . . . . . . . . . . . . . . . . . . . . . . . . . . . 764
direct distance entry . . . . . . . . . . . . . . . . . . . . . . . . . . . . . . . . 764
dithering . . . . . . . . . . . . . . . . . . . . . . . . . . . . . . . . . . . . . . 764
drawing area . . . . . . . . . . . . . . . . . . . . . . . . . . . . . . . . . . . . 764
drawing extents . . . . . . . . . . . . . . . . . . . . . . . . . . . . . . . . . . . 765
drawing limits . . . . . . . . . . . . . . . . . . . . . . . . . . . . . . . . . . . . 765
drawing template . . . . . . . . . . . . . . . . . . . . . . . . . . . . . . . . . . 765
driven constraint . . . . . . . . . . . . . . . . . . . . . . . . . . . . . . . . . . 765
driving dimension . . . . . . . . . . . . . . . . . . . . . . . . . . . . . . . . . 765
driving property . . . . . . . . . . . . . . . . . . . . . . . . . . . . . . . . . . 765
DWG . . . . . . . . . . . . . . . . . . . . . . . . . . . . . . . . . . . . . . . . 765
DXF . . . . . . . . . . . . . . . . . . . . . . . . . . . . . . . . . . . . . . . . . 766
dynamic constraint . . . . . . . . . . . . . . . . . . . . . . . . . . . . . . . . . 766
dynamic dimension . . . . . . . . . . . . . . . . . . . . . . . . . . . . . . . . . 766
edge . . . . . . . . . . . . . . . . . . . . . . . . . . . . . . . . . . . . . . . . . 766
edge modifiers . . . . . . . . . . . . . . . . . . . . . . . . . . . . . . . . . . . 766
elevation . . . . . . . . . . . . . . . . . . . . . . . . . . . . . . . . . . . . . . 766
empty selection set . . . . . . . . . . . . . . . . . . . . . . . . . . . . . . . . . 766
environment map . . . . . . . . . . . . . . . . . . . . . . . . . . . . . . . . . . 766
environment variable . . . . . . . . . . . . . . . . . . . . . . . . . . . . . . . . 767
explode . . . . . . . . . . . . . . . . . . . . . . . . . . . . . . . . . . . . . . . 767
exploded dimension . . . . . . . . . . . . . . . . . . . . . . . . . . . . . . . . 767
extents . . . . . . . . . . . . . . . . . . . . . . . . . . . . . . . . . . . . . . . 767
external reference (xref) . . . . . . . . . . . . . . . . . . . . . . . . . . . . . . 767
extrusion . . . . . . . . . . . . . . . . . . . . . . . . . . . . . . . . . . . . . . 767
face . . . . . . . . . . . . . . . . . . . . . . . . . . . . . . . . . . . . . . . . . 767
Contents | xix

face color mode . . . . . . . . . . . . . . . . . . . . . . . . . . . . . . . . . . . 767
face style . . . . . . . . . . . . . . . . . . . . . . . . . . . . . . . . . . . . . . 767
facet . . . . . . . . . . . . . . . . . . . . . . . . . . . . . . . . . . . . . . . . . 767
feature control frame . . . . . . . . . . . . . . . . . . . . . . . . . . . . . . . . 768
fence . . . . . . . . . . . . . . . . . . . . . . . . . . . . . . . . . . . . . . . . 768
field . . . . . . . . . . . . . . . . . . . . . . . . . . . . . . . . . . . . . . . . . 768
fill . . . . . . . . . . . . . . . . . . . . . . . . . . . . . . . . . . . . . . . . . . 768
filters . . . . . . . . . . . . . . . . . . . . . . . . . . . . . . . . . . . . . . . . 768
final gathering . . . . . . . . . . . . . . . . . . . . . . . . . . . . . . . . . . . 768
fit points . . . . . . . . . . . . . . . . . . . . . . . . . . . . . . . . . . . . . . 768
fit tolerance . . . . . . . . . . . . . . . . . . . . . . . . . . . . . . . . . . . . . 768
floating viewports . . . . . . . . . . . . . . . . . . . . . . . . . . . . . . . . . . 769
font . . . . . . . . . . . . . . . . . . . . . . . . . . . . . . . . . . . . . . . . . 769
footcandle . . . . . . . . . . . . . . . . . . . . . . . . . . . . . . . . . . . . . . 769
footcandle . . . . . . . . . . . . . . . . . . . . . . . . . . . . . . . . . . . . . . 769
frame . . . . . . . . . . . . . . . . . . . . . . . . . . . . . . . . . . . . . . . . 769
freeze . . . . . . . . . . . . . . . . . . . . . . . . . . . . . . . . . . . . . . . . 769
front faces . . . . . . . . . . . . . . . . . . . . . . . . . . . . . . . . . . . . . . 769
G0 continuity . . . . . . . . . . . . . . . . . . . . . . . . . . . . . . . . . . . . 769
G1 continuity . . . . . . . . . . . . . . . . . . . . . . . . . . . . . . . . . . . . 769
G2 continuity . . . . . . . . . . . . . . . . . . . . . . . . . . . . . . . . . . . . 769
general property . . . . . . . . . . . . . . . . . . . . . . . . . . . . . . . . . . 769
generic surface . . . . . . . . . . . . . . . . . . . . . . . . . . . . . . . . . . . 769
geometric constraint . . . . . . . . . . . . . . . . . . . . . . . . . . . . . . . . 770
geometry . . . . . . . . . . . . . . . . . . . . . . . . . . . . . . . . . . . . . . 770
gizmo . . . . . . . . . . . . . . . . . . . . . . . . . . . . . . . . . . . . . . . . 770
global illumination . . . . . . . . . . . . . . . . . . . . . . . . . . . . . . . . . 770
Gooch shading . . . . . . . . . . . . . . . . . . . . . . . . . . . . . . . . . . . 770
graphics area . . . . . . . . . . . . . . . . . . . . . . . . . . . . . . . . . . . . 770
graphics window . . . . . . . . . . . . . . . . . . . . . . . . . . . . . . . . . . 770
grid . . . . . . . . . . . . . . . . . . . . . . . . . . . . . . . . . . . . . . . . . 770
grid limits . . . . . . . . . . . . . . . . . . . . . . . . . . . . . . . . . . . . . . 770
grip menu options . . . . . . . . . . . . . . . . . . . . . . . . . . . . . . . . . 771
grip modes . . . . . . . . . . . . . . . . . . . . . . . . . . . . . . . . . . . . . 771
grips . . . . . . . . . . . . . . . . . . . . . . . . . . . . . . . . . . . . . . . . . 771
grip tool . . . . . . . . . . . . . . . . . . . . . . . . . . . . . . . . . . . . . . . 771
ground plane . . . . . . . . . . . . . . . . . . . . . . . . . . . . . . . . . . . . 771
guide curves . . . . . . . . . . . . . . . . . . . . . . . . . . . . . . . . . . . . . 771
handle . . . . . . . . . . . . . . . . . . . . . . . . . . . . . . . . . . . . . . . . 771
heads-up display (HUD) . . . . . . . . . . . . . . . . . . . . . . . . . . . . . . 772
helix . . . . . . . . . . . . . . . . . . . . . . . . . . . . . . . . . . . . . . . . . 772
Help menu . . . . . . . . . . . . . . . . . . . . . . . . . . . . . . . . . . . . . 772
HLS . . . . . . . . . . . . . . . . . . . . . . . . . . . . . . . . . . . . . . . . . 772
Home view . . . . . . . . . . . . . . . . . . . . . . . . . . . . . . . . . . . . . 772
horizontal landing . . . . . . . . . . . . . . . . . . . . . . . . . . . . . . . . . 772
hot grip . . . . . . . . . . . . . . . . . . . . . . . . . . . . . . . . . . . . . . . 772
xx | Contents

Illuminance . . . . . . . . . . . . . . . . . . . . . . . . . . . . . . . . . . . . . 772
indirect bump scale . . . . . . . . . . . . . . . . . . . . . . . . . . . . . . . . . 772
indirect illumination . . . . . . . . . . . . . . . . . . . . . . . . . . . . . . . . 772
initial environment . . . . . . . . . . . . . . . . . . . . . . . . . . . . . . . . . 773
interface element . . . . . . . . . . . . . . . . . . . . . . . . . . . . . . . . . . 773
interpolation points . . . . . . . . . . . . . . . . . . . . . . . . . . . . . . . . 773
island . . . . . . . . . . . . . . . . . . . . . . . . . . . . . . . . . . . . . . . . 773
ISO . . . . . . . . . . . . . . . . . . . . . . . . . . . . . . . . . . . . . . . . . 773
isoline . . . . . . . . . . . . . . . . . . . . . . . . . . . . . . . . . . . . . . . . 773
isometric snap style . . . . . . . . . . . . . . . . . . . . . . . . . . . . . . . . . 773
isoparm . . . . . . . . . . . . . . . . . . . . . . . . . . . . . . . . . . . . . . . 773
key point . . . . . . . . . . . . . . . . . . . . . . . . . . . . . . . . . . . . . . 773
knot . . . . . . . . . . . . . . . . . . . . . . . . . . . . . . . . . . . . . . . . . 773
label block . . . . . . . . . . . . . . . . . . . . . . . . . . . . . . . . . . . . . . 774
landing . . . . . . . . . . . . . . . . . . . . . . . . . . . . . . . . . . . . . . . 774
landing gap . . . . . . . . . . . . . . . . . . . . . . . . . . . . . . . . . . . . . 774
layer . . . . . . . . . . . . . . . . . . . . . . . . . . . . . . . . . . . . . . . . . 774
layer index . . . . . . . . . . . . . . . . . . . . . . . . . . . . . . . . . . . . . 774
layout . . . . . . . . . . . . . . . . . . . . . . . . . . . . . . . . . . . . . . . . 774
layout viewports . . . . . . . . . . . . . . . . . . . . . . . . . . . . . . . . . . 774
leader tail . . . . . . . . . . . . . . . . . . . . . . . . . . . . . . . . . . . . . . 774
lens length . . . . . . . . . . . . . . . . . . . . . . . . . . . . . . . . . . . . . 774
level of smoothness . . . . . . . . . . . . . . . . . . . . . . . . . . . . . . . . . 774
light glyph . . . . . . . . . . . . . . . . . . . . . . . . . . . . . . . . . . . . . 774
limits . . . . . . . . . . . . . . . . . . . . . . . . . . . . . . . . . . . . . . . . 775
line font . . . . . . . . . . . . . . . . . . . . . . . . . . . . . . . . . . . . . . . 775
linetype . . . . . . . . . . . . . . . . . . . . . . . . . . . . . . . . . . . . . . . 775
lineweight . . . . . . . . . . . . . . . . . . . . . . . . . . . . . . . . . . . . . . 775
LL84 coordinate system . . . . . . . . . . . . . . . . . . . . . . . . . . . . . . . 775
lofted solid/surface . . . . . . . . . . . . . . . . . . . . . . . . . . . . . . . . . 775
lumen . . . . . . . . . . . . . . . . . . . . . . . . . . . . . . . . . . . . . . . . 775
luminaire . . . . . . . . . . . . . . . . . . . . . . . . . . . . . . . . . . . . . . 775
luminance . . . . . . . . . . . . . . . . . . . . . . . . . . . . . . . . . . . . . . 775
luminous flux . . . . . . . . . . . . . . . . . . . . . . . . . . . . . . . . . . . . 775
lux . . . . . . . . . . . . . . . . . . . . . . . . . . . . . . . . . . . . . . . . . . 776
magnitude . . . . . . . . . . . . . . . . . . . . . . . . . . . . . . . . . . . . . 776
main customization file . . . . . . . . . . . . . . . . . . . . . . . . . . . . . . 776
merge . . . . . . . . . . . . . . . . . . . . . . . . . . . . . . . . . . . . . . . . 776
mesh . . . . . . . . . . . . . . . . . . . . . . . . . . . . . . . . . . . . . . . . 776
mirror . . . . . . . . . . . . . . . . . . . . . . . . . . . . . . . . . . . . . . . . 776
mode . . . . . . . . . . . . . . . . . . . . . . . . . . . . . . . . . . . . . . . . 776
model . . . . . . . . . . . . . . . . . . . . . . . . . . . . . . . . . . . . . . . . 776
model space . . . . . . . . . . . . . . . . . . . . . . . . . . . . . . . . . . . . . 776
model viewports . . . . . . . . . . . . . . . . . . . . . . . . . . . . . . . . . . 776
multi-functional grip menu options . . . . . . . . . . . . . . . . . . . . . . . . 777
multileader . . . . . . . . . . . . . . . . . . . . . . . . . . . . . . . . . . . . . 777
Contents | xxi

named object . . . . . . . . . . . . . . . . . . . . . . . . . . . . . . . . . . . . 777
named objects, dependent . . . . . . . . . . . . . . . . . . . . . . . . . . . . . 777
named view . . . . . . . . . . . . . . . . . . . . . . . . . . . . . . . . . . . . . 777
node . . . . . . . . . . . . . . . . . . . . . . . . . . . . . . . . . . . . . . . . . 777
non-associative dimension . . . . . . . . . . . . . . . . . . . . . . . . . . . . . 777
normal . . . . . . . . . . . . . . . . . . . . . . . . . . . . . . . . . . . . . . . 777
noun-verb selection . . . . . . . . . . . . . . . . . . . . . . . . . . . . . . . . . 777
NURBS . . . . . . . . . . . . . . . . . . . . . . . . . . . . . . . . . . . . . . . 777
NURBS surface . . . . . . . . . . . . . . . . . . . . . . . . . . . . . . . . . . . 778
object . . . . . . . . . . . . . . . . . . . . . . . . . . . . . . . . . . . . . . . . 778
ObjectARX (AutoCAD Runtime Extension) . . . . . . . . . . . . . . . . . . . . 778
object enabler . . . . . . . . . . . . . . . . . . . . . . . . . . . . . . . . . . . . 778
Object Snap mode . . . . . . . . . . . . . . . . . . . . . . . . . . . . . . . . . 778
object snap override . . . . . . . . . . . . . . . . . . . . . . . . . . . . . . . . 778
opacity map . . . . . . . . . . . . . . . . . . . . . . . . . . . . . . . . . . . . . 778
origin . . . . . . . . . . . . . . . . . . . . . . . . . . . . . . . . . . . . . . . . 778
orthogonal . . . . . . . . . . . . . . . . . . . . . . . . . . . . . . . . . . . . . 778
Ortho mode . . . . . . . . . . . . . . . . . . . . . . . . . . . . . . . . . . . . . 778
page setup . . . . . . . . . . . . . . . . . . . . . . . . . . . . . . . . . . . . . . 779
palette . . . . . . . . . . . . . . . . . . . . . . . . . . . . . . . . . . . . . . . . 779
pan . . . . . . . . . . . . . . . . . . . . . . . . . . . . . . . . . . . . . . . . . 779
paper space . . . . . . . . . . . . . . . . . . . . . . . . . . . . . . . . . . . . . 779
parametric design . . . . . . . . . . . . . . . . . . . . . . . . . . . . . . . . . . 779
parametric drawing . . . . . . . . . . . . . . . . . . . . . . . . . . . . . . . . . 779
path curve . . . . . . . . . . . . . . . . . . . . . . . . . . . . . . . . . . . . . . 779
PC3 file . . . . . . . . . . . . . . . . . . . . . . . . . . . . . . . . . . . . . . . 779
periodic curve . . . . . . . . . . . . . . . . . . . . . . . . . . . . . . . . . . . . 780
periodic surface . . . . . . . . . . . . . . . . . . . . . . . . . . . . . . . . . . . 780
perspective view . . . . . . . . . . . . . . . . . . . . . . . . . . . . . . . . . . 780
photometric lights . . . . . . . . . . . . . . . . . . . . . . . . . . . . . . . . . 780
photon map . . . . . . . . . . . . . . . . . . . . . . . . . . . . . . . . . . . . . 780
photorealistic rendering . . . . . . . . . . . . . . . . . . . . . . . . . . . . . . 780
pick button . . . . . . . . . . . . . . . . . . . . . . . . . . . . . . . . . . . . . 780
pick-first . . . . . . . . . . . . . . . . . . . . . . . . . . . . . . . . . . . . . . . 781
pick-first set . . . . . . . . . . . . . . . . . . . . . . . . . . . . . . . . . . . . . 781
pick points . . . . . . . . . . . . . . . . . . . . . . . . . . . . . . . . . . . . . 781
planar face . . . . . . . . . . . . . . . . . . . . . . . . . . . . . . . . . . . . . 781
planar projection . . . . . . . . . . . . . . . . . . . . . . . . . . . . . . . . . . 781
planar surface . . . . . . . . . . . . . . . . . . . . . . . . . . . . . . . . . . . . 781
plan view . . . . . . . . . . . . . . . . . . . . . . . . . . . . . . . . . . . . . . 781
pline . . . . . . . . . . . . . . . . . . . . . . . . . . . . . . . . . . . . . . . . . 781
plot style . . . . . . . . . . . . . . . . . . . . . . . . . . . . . . . . . . . . . . 781
plot style table . . . . . . . . . . . . . . . . . . . . . . . . . . . . . . . . . . . 781
PMP file . . . . . . . . . . . . . . . . . . . . . . . . . . . . . . . . . . . . . . . 782
point . . . . . . . . . . . . . . . . . . . . . . . . . . . . . . . . . . . . . . . . 782
pointer . . . . . . . . . . . . . . . . . . . . . . . . . . . . . . . . . . . . . . . 782
xxii | Contents

point filters . . . . . . . . . . . . . . . . . . . . . . . . . . . . . . . . . . . . . 782
polar array . . . . . . . . . . . . . . . . . . . . . . . . . . . . . . . . . . . . . 782
Polar Snap . . . . . . . . . . . . . . . . . . . . . . . . . . . . . . . . . . . . . . 782
polar tracking . . . . . . . . . . . . . . . . . . . . . . . . . . . . . . . . . . . . 782
polyface and polygon mesh . . . . . . . . . . . . . . . . . . . . . . . . . . . . 782
polygon window selection . . . . . . . . . . . . . . . . . . . . . . . . . . . . . 782
polyline . . . . . . . . . . . . . . . . . . . . . . . . . . . . . . . . . . . . . . . 782
polysolid . . . . . . . . . . . . . . . . . . . . . . . . . . . . . . . . . . . . . . 783
primary table fragment . . . . . . . . . . . . . . . . . . . . . . . . . . . . . . . 783
primitive . . . . . . . . . . . . . . . . . . . . . . . . . . . . . . . . . . . . . . 783
procedural materials . . . . . . . . . . . . . . . . . . . . . . . . . . . . . . . . 783
procedural surface . . . . . . . . . . . . . . . . . . . . . . . . . . . . . . . . . 783
profile curve . . . . . . . . . . . . . . . . . . . . . . . . . . . . . . . . . . . . . 783
project . . . . . . . . . . . . . . . . . . . . . . . . . . . . . . . . . . . . . . . . 783
prompt . . . . . . . . . . . . . . . . . . . . . . . . . . . . . . . . . . . . . . . 783
proxy object . . . . . . . . . . . . . . . . . . . . . . . . . . . . . . . . . . . . . 783
QuickView . . . . . . . . . . . . . . . . . . . . . . . . . . . . . . . . . . . . . 783
ray-traced shadows . . . . . . . . . . . . . . . . . . . . . . . . . . . . . . . . . 784
ray tracing . . . . . . . . . . . . . . . . . . . . . . . . . . . . . . . . . . . . . . 784
rectangular break . . . . . . . . . . . . . . . . . . . . . . . . . . . . . . . . . . 784
redraw . . . . . . . . . . . . . . . . . . . . . . . . . . . . . . . . . . . . . . . . 784
reference . . . . . . . . . . . . . . . . . . . . . . . . . . . . . . . . . . . . . . 784
refine . . . . . . . . . . . . . . . . . . . . . . . . . . . . . . . . . . . . . . . . 784
reflectance scale . . . . . . . . . . . . . . . . . . . . . . . . . . . . . . . . . . . 784
reflection color . . . . . . . . . . . . . . . . . . . . . . . . . . . . . . . . . . . 784
reflection line . . . . . . . . . . . . . . . . . . . . . . . . . . . . . . . . . . . . 784
reflection mapping . . . . . . . . . . . . . . . . . . . . . . . . . . . . . . . . . 784
refraction . . . . . . . . . . . . . . . . . . . . . . . . . . . . . . . . . . . . . . 785
regenerate . . . . . . . . . . . . . . . . . . . . . . . . . . . . . . . . . . . . . . 785
region . . . . . . . . . . . . . . . . . . . . . . . . . . . . . . . . . . . . . . . . 785
relative coordinates . . . . . . . . . . . . . . . . . . . . . . . . . . . . . . . . . 785
relax constraints . . . . . . . . . . . . . . . . . . . . . . . . . . . . . . . . . . 785
RGB . . . . . . . . . . . . . . . . . . . . . . . . . . . . . . . . . . . . . . . . . 785
roll arrows . . . . . . . . . . . . . . . . . . . . . . . . . . . . . . . . . . . . . . 785
roughness . . . . . . . . . . . . . . . . . . . . . . . . . . . . . . . . . . . . . . 785
row . . . . . . . . . . . . . . . . . . . . . . . . . . . . . . . . . . . . . . . . . 785
rubber-band line . . . . . . . . . . . . . . . . . . . . . . . . . . . . . . . . . . 785
running object snap . . . . . . . . . . . . . . . . . . . . . . . . . . . . . . . . 786
sampling . . . . . . . . . . . . . . . . . . . . . . . . . . . . . . . . . . . . . . 786
save back . . . . . . . . . . . . . . . . . . . . . . . . . . . . . . . . . . . . . . 786
scale representation . . . . . . . . . . . . . . . . . . . . . . . . . . . . . . . . . 786
script file . . . . . . . . . . . . . . . . . . . . . . . . . . . . . . . . . . . . . . 786
secondary table fragment . . . . . . . . . . . . . . . . . . . . . . . . . . . . . . 786
selection node . . . . . . . . . . . . . . . . . . . . . . . . . . . . . . . . . . . 786
selection sensitivity . . . . . . . . . . . . . . . . . . . . . . . . . . . . . . . . . 786
selection set . . . . . . . . . . . . . . . . . . . . . . . . . . . . . . . . . . . . . 786
Contents | xxiii

shadow maps . . . . . . . . . . . . . . . . . . . . . . . . . . . . . . . . . . . . 786
ShapeManager . . . . . . . . . . . . . . . . . . . . . . . . . . . . . . . . . . . 787
shortcut keys . . . . . . . . . . . . . . . . . . . . . . . . . . . . . . . . . . . . 787
shortcut menu . . . . . . . . . . . . . . . . . . . . . . . . . . . . . . . . . . . 787
sky . . . . . . . . . . . . . . . . . . . . . . . . . . . . . . . . . . . . . . . . . . 787
smoothness . . . . . . . . . . . . . . . . . . . . . . . . . . . . . . . . . . . . . 787
smooth shading . . . . . . . . . . . . . . . . . . . . . . . . . . . . . . . . . . . 787
snap angle . . . . . . . . . . . . . . . . . . . . . . . . . . . . . . . . . . . . . . 787
snap grid . . . . . . . . . . . . . . . . . . . . . . . . . . . . . . . . . . . . . . 787
Snap mode . . . . . . . . . . . . . . . . . . . . . . . . . . . . . . . . . . . . . 787
snap resolution . . . . . . . . . . . . . . . . . . . . . . . . . . . . . . . . . . . 787
solid history . . . . . . . . . . . . . . . . . . . . . . . . . . . . . . . . . . . . . 788
solid object . . . . . . . . . . . . . . . . . . . . . . . . . . . . . . . . . . . . . 788
solid primitive . . . . . . . . . . . . . . . . . . . . . . . . . . . . . . . . . . . 788
spatial index . . . . . . . . . . . . . . . . . . . . . . . . . . . . . . . . . . . . 788
specular reflection . . . . . . . . . . . . . . . . . . . . . . . . . . . . . . . . . 788
spline-fit . . . . . . . . . . . . . . . . . . . . . . . . . . . . . . . . . . . . . . . 788
split face . . . . . . . . . . . . . . . . . . . . . . . . . . . . . . . . . . . . . . . 788
STB file . . . . . . . . . . . . . . . . . . . . . . . . . . . . . . . . . . . . . . . 788
stretch frame . . . . . . . . . . . . . . . . . . . . . . . . . . . . . . . . . . . . 788
subdivision . . . . . . . . . . . . . . . . . . . . . . . . . . . . . . . . . . . . . 788
subobject . . . . . . . . . . . . . . . . . . . . . . . . . . . . . . . . . . . . . . 789
sub-prompt . . . . . . . . . . . . . . . . . . . . . . . . . . . . . . . . . . . . . 789
surface . . . . . . . . . . . . . . . . . . . . . . . . . . . . . . . . . . . . . . . . 789
surface associativity . . . . . . . . . . . . . . . . . . . . . . . . . . . . . . . . . 789
surface normal . . . . . . . . . . . . . . . . . . . . . . . . . . . . . . . . . . . 789
swept solid/surface . . . . . . . . . . . . . . . . . . . . . . . . . . . . . . . . . 789
symbol . . . . . . . . . . . . . . . . . . . . . . . . . . . . . . . . . . . . . . . 789
symbol library . . . . . . . . . . . . . . . . . . . . . . . . . . . . . . . . . . . . 789
symbol table . . . . . . . . . . . . . . . . . . . . . . . . . . . . . . . . . . . . 789
system variable . . . . . . . . . . . . . . . . . . . . . . . . . . . . . . . . . . . 789
table . . . . . . . . . . . . . . . . . . . . . . . . . . . . . . . . . . . . . . . . . 789
table break . . . . . . . . . . . . . . . . . . . . . . . . . . . . . . . . . . . . . 790
table style . . . . . . . . . . . . . . . . . . . . . . . . . . . . . . . . . . . . . . 790
temporary files . . . . . . . . . . . . . . . . . . . . . . . . . . . . . . . . . . . 790
tessellation lines . . . . . . . . . . . . . . . . . . . . . . . . . . . . . . . . . . 790
text style . . . . . . . . . . . . . . . . . . . . . . . . . . . . . . . . . . . . . . 790
texture map . . . . . . . . . . . . . . . . . . . . . . . . . . . . . . . . . . . . . 790
thaw . . . . . . . . . . . . . . . . . . . . . . . . . . . . . . . . . . . . . . . . . 790
thickness . . . . . . . . . . . . . . . . . . . . . . . . . . . . . . . . . . . . . . 790
tiled viewports . . . . . . . . . . . . . . . . . . . . . . . . . . . . . . . . . . . 791
TILEMODE . . . . . . . . . . . . . . . . . . . . . . . . . . . . . . . . . . . . . 791
tooltip . . . . . . . . . . . . . . . . . . . . . . . . . . . . . . . . . . . . . . . . 791
tracking . . . . . . . . . . . . . . . . . . . . . . . . . . . . . . . . . . . . . . . 791
translucency . . . . . . . . . . . . . . . . . . . . . . . . . . . . . . . . . . . . 791
transmittance scale . . . . . . . . . . . . . . . . . . . . . . . . . . . . . . . . . 791
xxiv | Contents

transparency . . . . . . . . . . . . . . . . . . . . . . . . . . . . . . . . . . . . 791
transparent command . . . . . . . . . . . . . . . . . . . . . . . . . . . . . . . 791
two sided material . . . . . . . . . . . . . . . . . . . . . . . . . . . . . . . . . 791
UCS . . . . . . . . . . . . . . . . . . . . . . . . . . . . . . . . . . . . . . . . . 791
UCS definition . . . . . . . . . . . . . . . . . . . . . . . . . . . . . . . . . . . 791
UCS icon . . . . . . . . . . . . . . . . . . . . . . . . . . . . . . . . . . . . . . 792
underconstrained geometry . . . . . . . . . . . . . . . . . . . . . . . . . . . . 792
underground . . . . . . . . . . . . . . . . . . . . . . . . . . . . . . . . . . . . 792
up direction . . . . . . . . . . . . . . . . . . . . . . . . . . . . . . . . . . . . . 792
user coordinate system (UCS) . . . . . . . . . . . . . . . . . . . . . . . . . . . 792
user parameter . . . . . . . . . . . . . . . . . . . . . . . . . . . . . . . . . . . 792
UVW . . . . . . . . . . . . . . . . . . . . . . . . . . . . . . . . . . . . . . . . 792
vector . . . . . . . . . . . . . . . . . . . . . . . . . . . . . . . . . . . . . . . . 793
vertex . . . . . . . . . . . . . . . . . . . . . . . . . . . . . . . . . . . . . . . . 793
view . . . . . . . . . . . . . . . . . . . . . . . . . . . . . . . . . . . . . . . . . 793
view category . . . . . . . . . . . . . . . . . . . . . . . . . . . . . . . . . . . . 793
ViewCube . . . . . . . . . . . . . . . . . . . . . . . . . . . . . . . . . . . . . . 793
viewpoint . . . . . . . . . . . . . . . . . . . . . . . . . . . . . . . . . . . . . . 793
viewport . . . . . . . . . . . . . . . . . . . . . . . . . . . . . . . . . . . . . . . 793
viewport configuration . . . . . . . . . . . . . . . . . . . . . . . . . . . . . . . 793
virtual screen display . . . . . . . . . . . . . . . . . . . . . . . . . . . . . . . . 793
visual style . . . . . . . . . . . . . . . . . . . . . . . . . . . . . . . . . . . . . 794
volumetric shadows . . . . . . . . . . . . . . . . . . . . . . . . . . . . . . . . . 794
watertight . . . . . . . . . . . . . . . . . . . . . . . . . . . . . . . . . . . . . . 794
WCS . . . . . . . . . . . . . . . . . . . . . . . . . . . . . . . . . . . . . . . . . 794
window selection . . . . . . . . . . . . . . . . . . . . . . . . . . . . . . . . . . 794
wipeout object . . . . . . . . . . . . . . . . . . . . . . . . . . . . . . . . . . . 794
wireframe model . . . . . . . . . . . . . . . . . . . . . . . . . . . . . . . . . . 794
working drawing . . . . . . . . . . . . . . . . . . . . . . . . . . . . . . . . . . 794
working set . . . . . . . . . . . . . . . . . . . . . . . . . . . . . . . . . . . . . 794
work plane . . . . . . . . . . . . . . . . . . . . . . . . . . . . . . . . . . . . . 794
world coordinates . . . . . . . . . . . . . . . . . . . . . . . . . . . . . . . . . . 794
world coordinate system (WCS) . . . . . . . . . . . . . . . . . . . . . . . . . . 795
X,Y,Z point filters . . . . . . . . . . . . . . . . . . . . . . . . . . . . . . . . . . 795
xref . . . . . . . . . . . . . . . . . . . . . . . . . . . . . . . . . . . . . . . . . 795
zoom . . . . . . . . . . . . . . . . . . . . . . . . . . . . . . . . . . . . . . . . 795
Index . . . . . . . . . . . . . . . . . . . . . . . . . . . . . . . 797
Contents | xxv

xxvi

Get Information
Find the Information You Need
There are various ways to find information about how to use this program, and
multiple resources are available.
Access and Search the Product Help
The Help system uses a Web browser and is available online and offline.
You can access the Help system by doing one of the following:
■ Press Fn-F1 or Cmd-/.
If you press Fn-F1 or Cmd-/ when a command is active, the appropriate help
topic is opened in the Web browser. Otherwise, the landing page of the Help
system is displayed.
■ On the Mac OS menu bar, click Help ➤ AutoCAD Help.
The landing page of the Help system is displayed.
■ In a dialog box, click the Help or ‘?’ button.
The help topic related to the dialog box is opened in the Web browser.
Navigate Help
Each page of the help system is divided into four main areas:
■ Header - Contains the navigation links to the Home page along with links
that represent the path to the current topic. Along with navigation links,
the Search text box is also located in the header.
1
1

■ Left Side - Along the left side of a page is the table of contents that allow
you to navigate in the current guide. You can also find links sections on
the current page as well as related topics in the documentation set. When
on the Home page, the left side contains a listing of the guides in the
current documentation set.
■ Middle - The middle of the page contains the content for the current
topic. When on the Home page, the middle of the page contains links to
the main topics in the selected guide in the documentation set from the
left side.
■ Right Side - The right side of the page contains links that are related to
the current topic. These links come from Autodesk.com and are available
only when using the online version of the Help system.
Search Help
In the upper-right corner of each page is a Search text box. Enter a text string
to search on, and click the Search button or press Enter to begin the search.
The results of the search are displayed on a new page. The left side of the
results page lists the books that a search result was found in, while the right
side displays the results for the selected book. Click a book from the left side
to see additional serach results, or click a link from the search results to open
the associated topic.
Learn the Product
For the latest information about Autodesk training, visit ht-
tp://www.autodesk.com/training or contact your local Autodesk office.
More than 1,200 ATC sites are avail-
able worldwide to meet your needs
Authorized Training Centers
for discipline-specific, locally based
training.
Autodesk Official Training Courseware
(AOTC) is technical training material
Autodesk Official Training Courseware
developed by Autodesk. You can pur-
chase AOTC from your local reseller
or distributor, or you can order it on-
line from the Autodesk Store.
2 | Chapter 1 Get Information

Autodesk e-Learning for Autodesk
Subscription customers features inter-
e-Learning
active lessons organized into product
catalogs.
The Autodesk Developer (ADN) pro-
gram provides support for full-time,
Autodesk Developer Network
professional developers who want to
build software based on Autodesk
products.
Autodesk Consulting provides services
that help set up processes and provide
Consulting
critical training that will help increase
productivity so you can capitalize on
the power of your products.
Visit the Partner Products & Services
page for a list of resources available
Partner Products and Services
for your Autodesk product and your
industry.
View the Product Readme
You can find late-breaking information about this software in the online
Readme.
It is suggested that you read through the online Readme for the latest
information about recommended hardware, updated installation instructions,
and known software problems.
View the product Readme
Join the Customer Involvement Program
If you participate in the Customer Involvement Program (CIP), specific
information about how you use AutoCAD is forwarded to Autodesk. This
information includes what features you use the most, problems that you
Find the Information You Need | 3

encounter, and other information helpful to the future direction of the
product.
See the following links for more information.
■ Learn more about the Autodesk Customer Involvement Program: ht-
tp://www.autodesk.com/cip
■ Read the Autodesk Privacy Statement: http://www.autodesk.com/cipprivacy
When you join, you will be able to view reports that can help you optimize
your use of AutoCAD.
Join the Customer Involvement Program
To turn the CIP on or off
1 On the menu bar, click Help ➤ Customer Involvement Program.
2 In the Customer Involvement Program dialog box, choose whether you
want to start or stop participating.
3 Click OK.
Get Information from Drawings
You can retrieve general information from a drawing including identifying
information and the number of objects that it contains.
There are types of information stored in a drawing that are not specific to
objects within the drawing, but provide useful information to help you
understand the behavior of the drawing, the settings of system variables, the
number of objects, descriptive information, and so on.
Obtain General Drawing Information
You can retrieve general information about the drawing file and its settings.
This information includes the following:
■ General drafting and object settings (STATUS)
■ Amount of time spent in the drawing (TIME)
■ Current drawing and objects settings (PROPERTIES)
4 | Chapter 1 Get Information

This information can help you document a drawing, displays a variety of
drawing settings such as the total number of objects in the drawing, and total
amount of time spent in the drawing file.
See also:
Enter System Variables on the Command Line (page 13)
Add Identifying Information to Drawings (page 43)
Extract Geometric Information from Objects (page 188)
Compare Dimension Styles and Variables (page 565)
Get Information from Drawings | 5

6
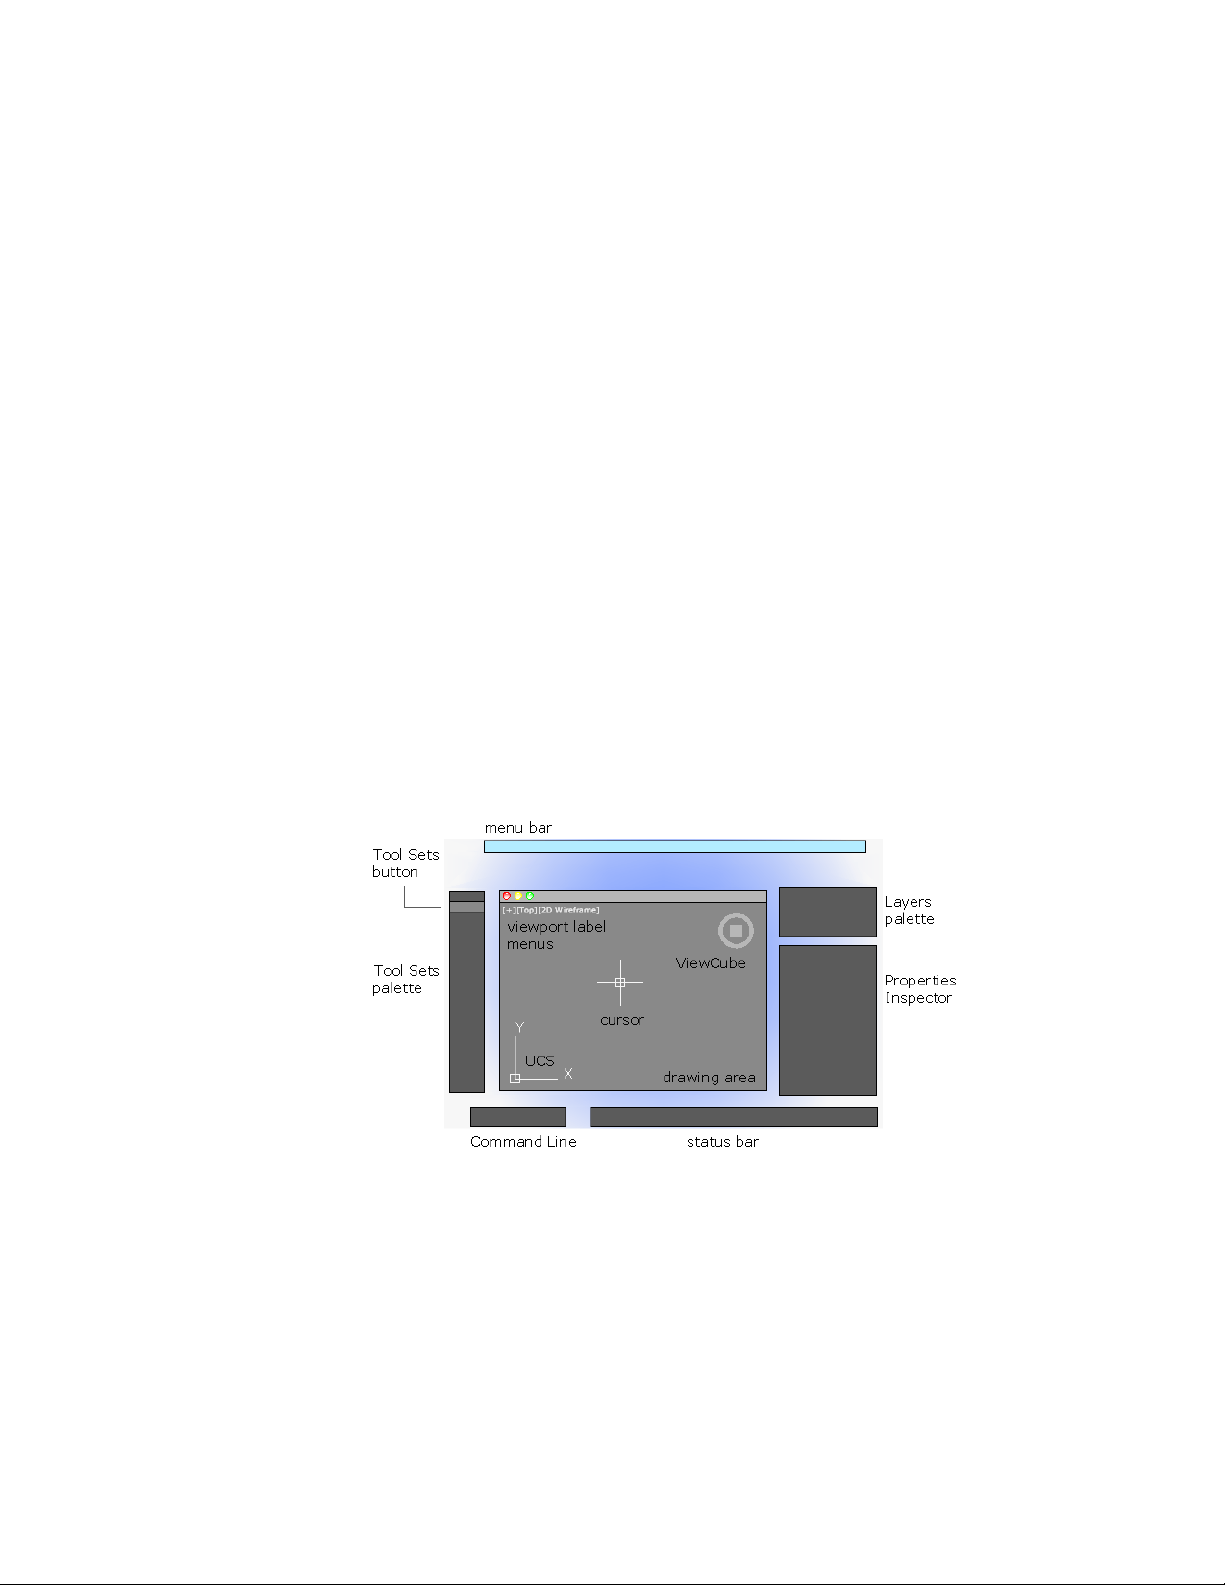
The User Interface
Start a Command
Use the menu bar, Tool Sets palette, and Command Line to access many
frequently used commands.
Parts of the User Interface
The user interface consists of palettes and bars around the drawing area. Also,
several controls are displayed within the drawing area.
■ Cmd-1 turns the Tool Sets palette on and off
■ Cmd-2 turns the Content Libraries palette on and off
■ Cmd-3 turns the Command Line on and off
2
7
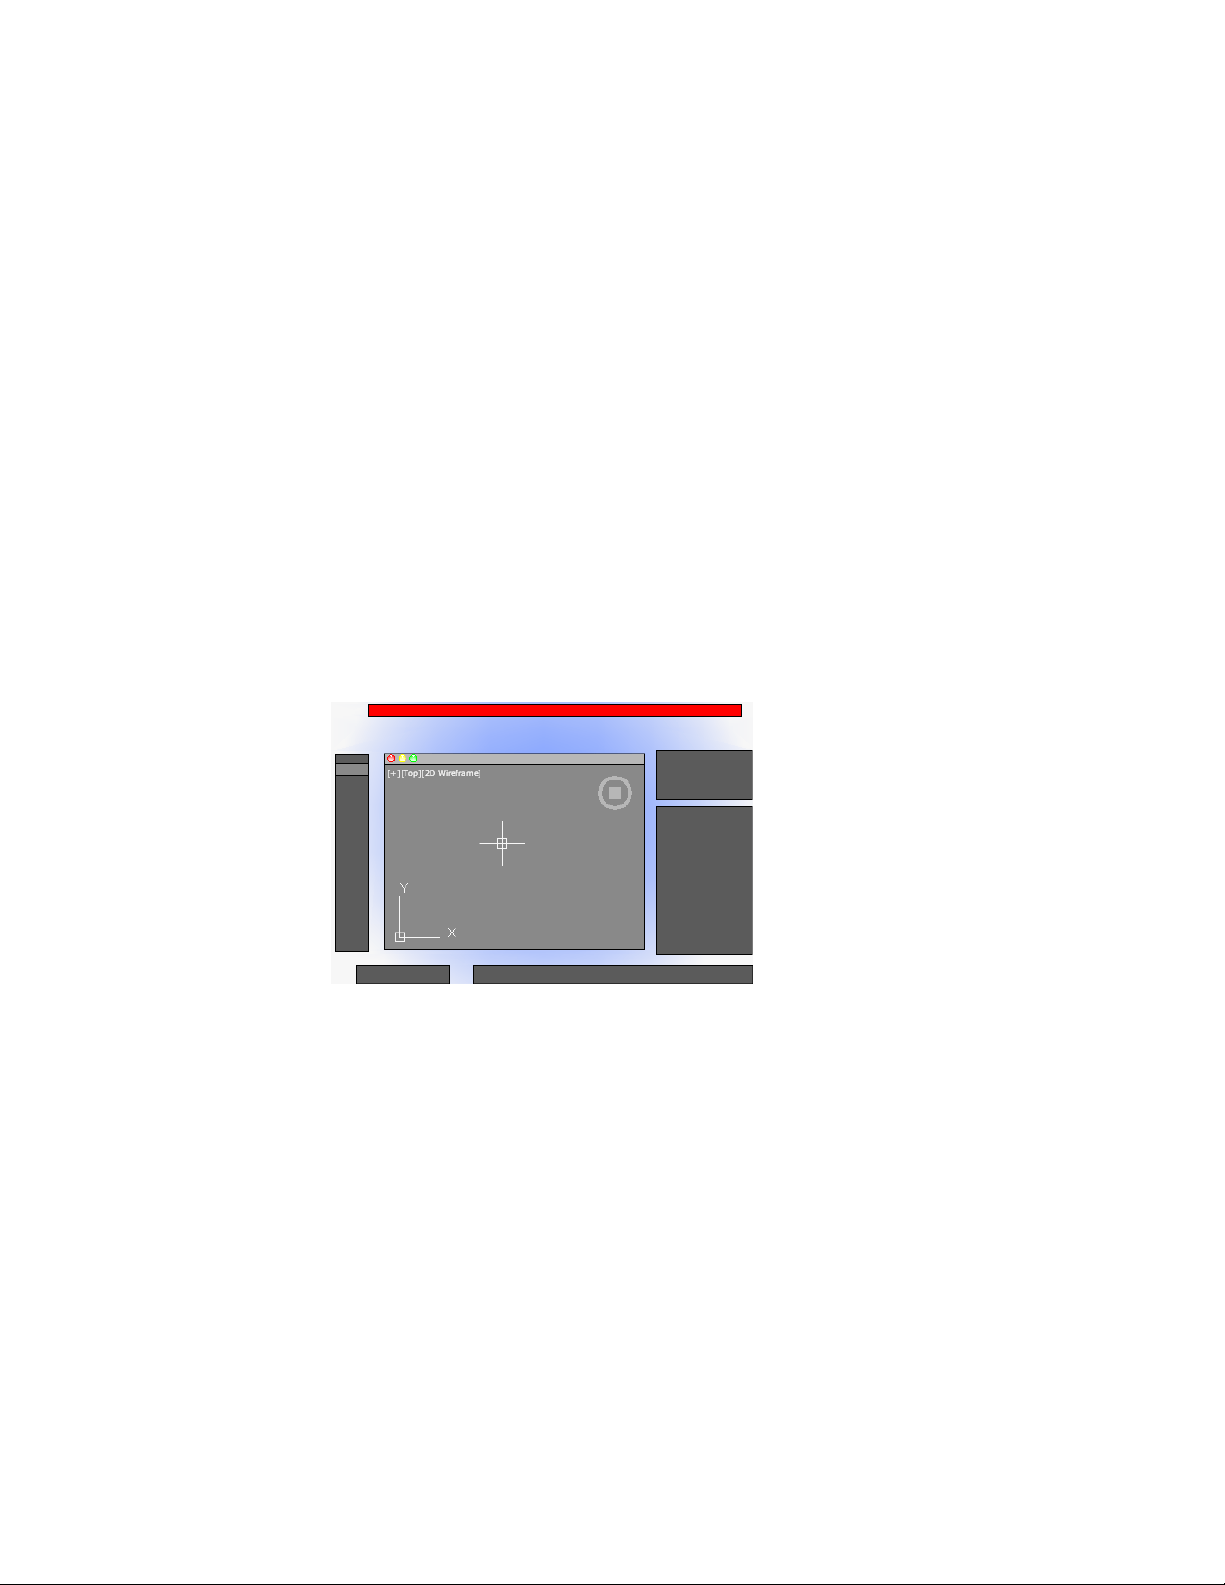
■ Cmd-4 turns the Layers palette on and off
■ Cmd-5 turns the Properties Inspector on and off
■ Cmd-6 turns the Status bar on and off
■ Cmd-7 turns the Reference Manager palette on and off
■ Cmd-8 turns the Materials Browser palette on and off
■ Cmd-0 turns all palettes and bars on and off
You can dock palettes by dragging them to the edge of your screen until a
blue line appears, and then dropping them into place. You can also undock
them by dragging and dropping.
The Menu Bar
The menu bar contains common commands organized into logical categories.
Use the menu bar when learning the product, or browsing for a command.
Many, but not all commands are accessible from the menu bar. Less commonly
used commands can be entered at the Command prompt. All available
commands are listed in the Help system under Command Reference.
The Tool Sets Palette
The Tool Sets palette provides efficient access to AutoCAD commands.
■ Tool flyouts
8 | Chapter 2 The User Interface
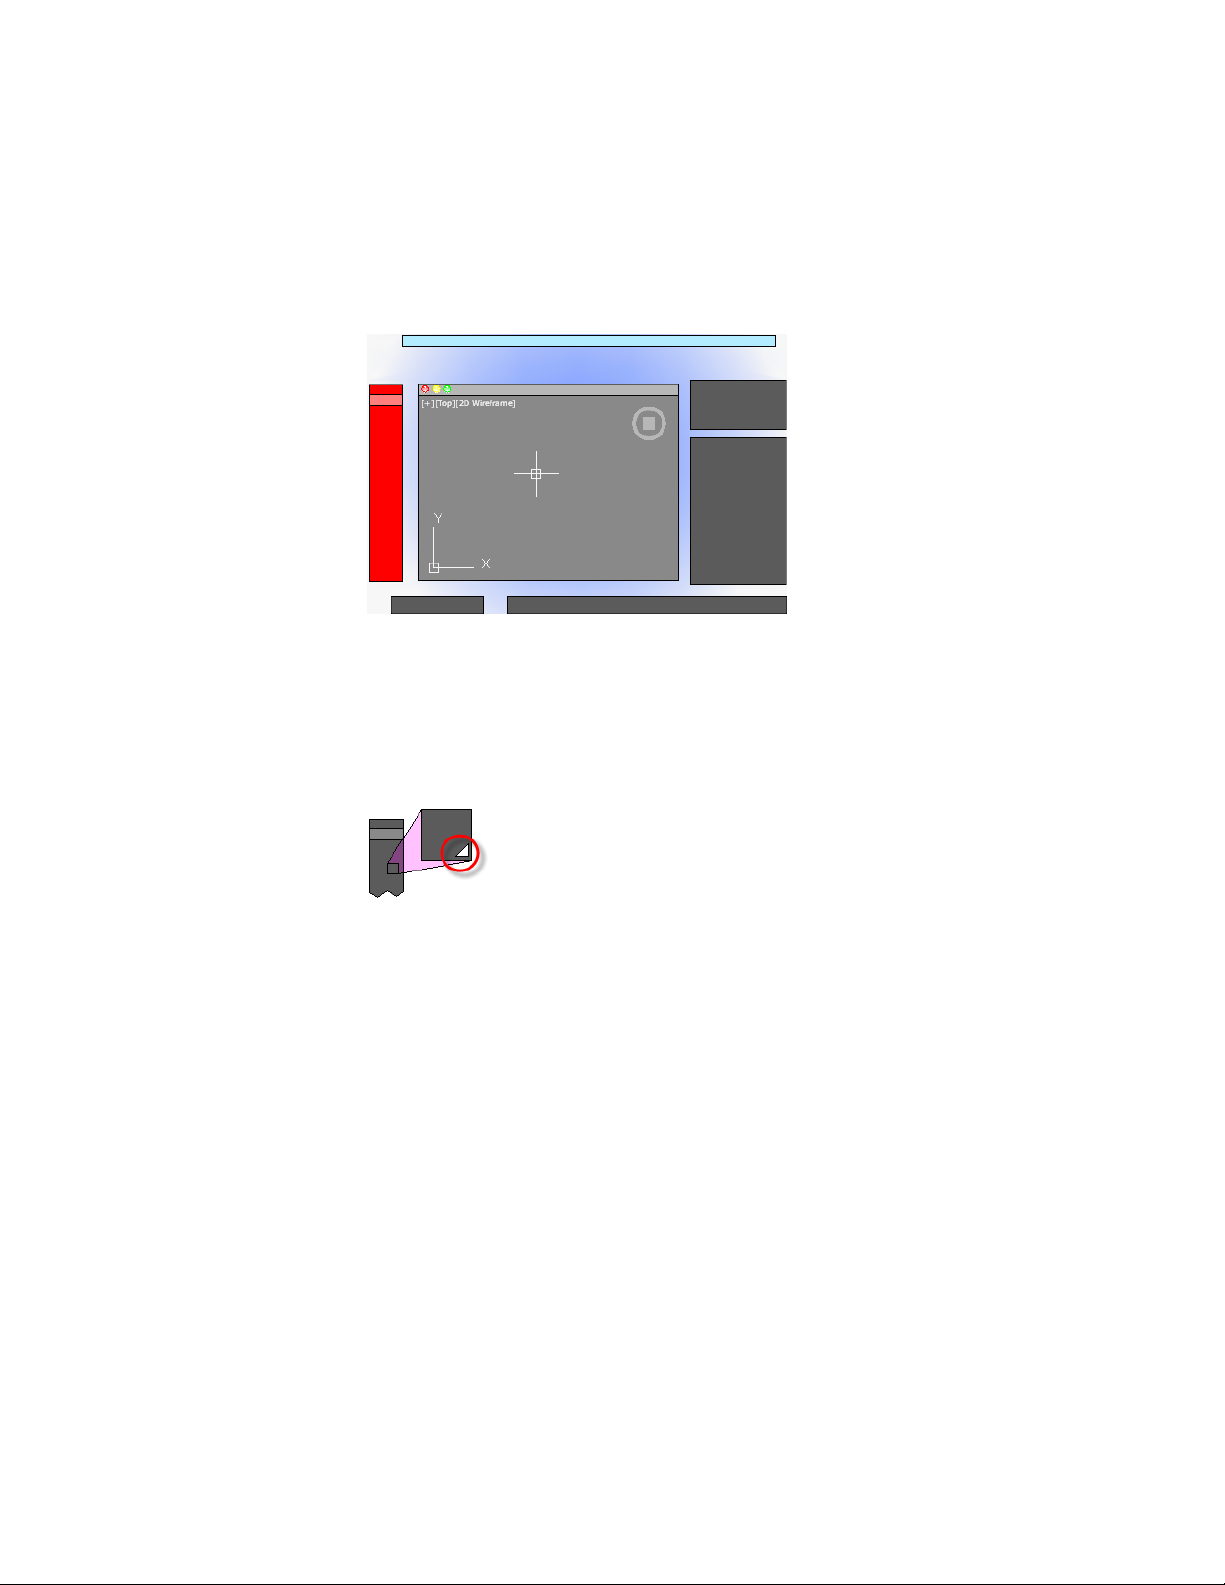
■ Tool groups
■ Tool sets
The size of the icons on the Tool Sets palette can be adjusted by using the
Tool Set & Status Bar Icons slider on the Look & Feel tab of the Application
Preferences dialog box (OPTIONS command).
Tool Flyouts
Some of the tools on the Tool Sets palette have a flyout indicator.
Click and hold the flyout to display several options for that command.
Tool Groups
The tools on the Tool Sets palette are organized into tool groups. Click the
arrow to display the entire tool group, which includes additional commands.
To make the tool group stay visible, click the lock icon at the bottom of the
tool group.
Start a Command | 9
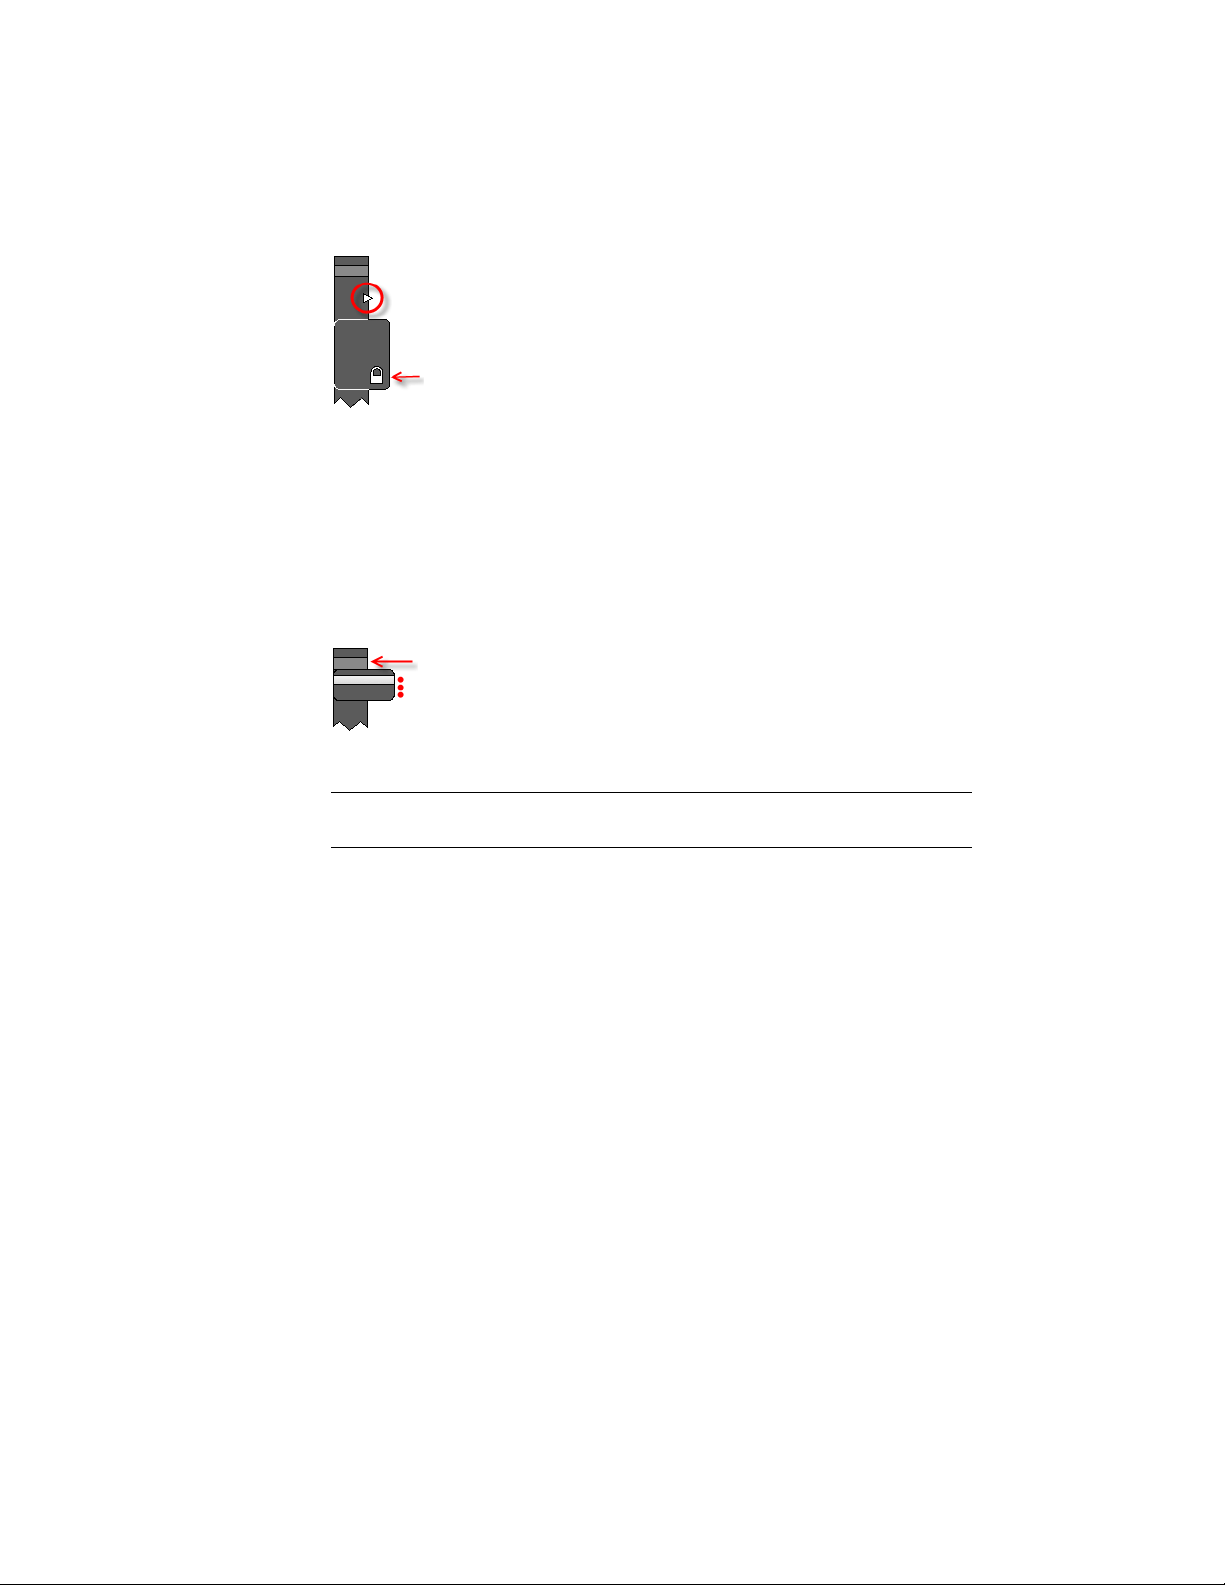
If you right-click the Tool Sets palette, a menu displays that you can use to
turn off any tool groups that you don’t need.
Tool Sets
Click the Tool Sets button to display a list of alternate sets of commands based
on your current tasks. For example, clicking the Annotation tool set replaces
the commands in the Tool Sets palette with commands associated with
dimensioning.
Cmd-1 turns the Tool Sets palette on and off.
TIP Use the Customize dialog box to customize any tool set, or create your own
tool sets.
The Command Line
The Command Line provides a fast way to enter commands and system
variables directly using the keyboard.
Overview of Using the Command Line
By default, the Command Line is displayed in the lower-left corner of screen.
10 | Chapter 2 The User Interface
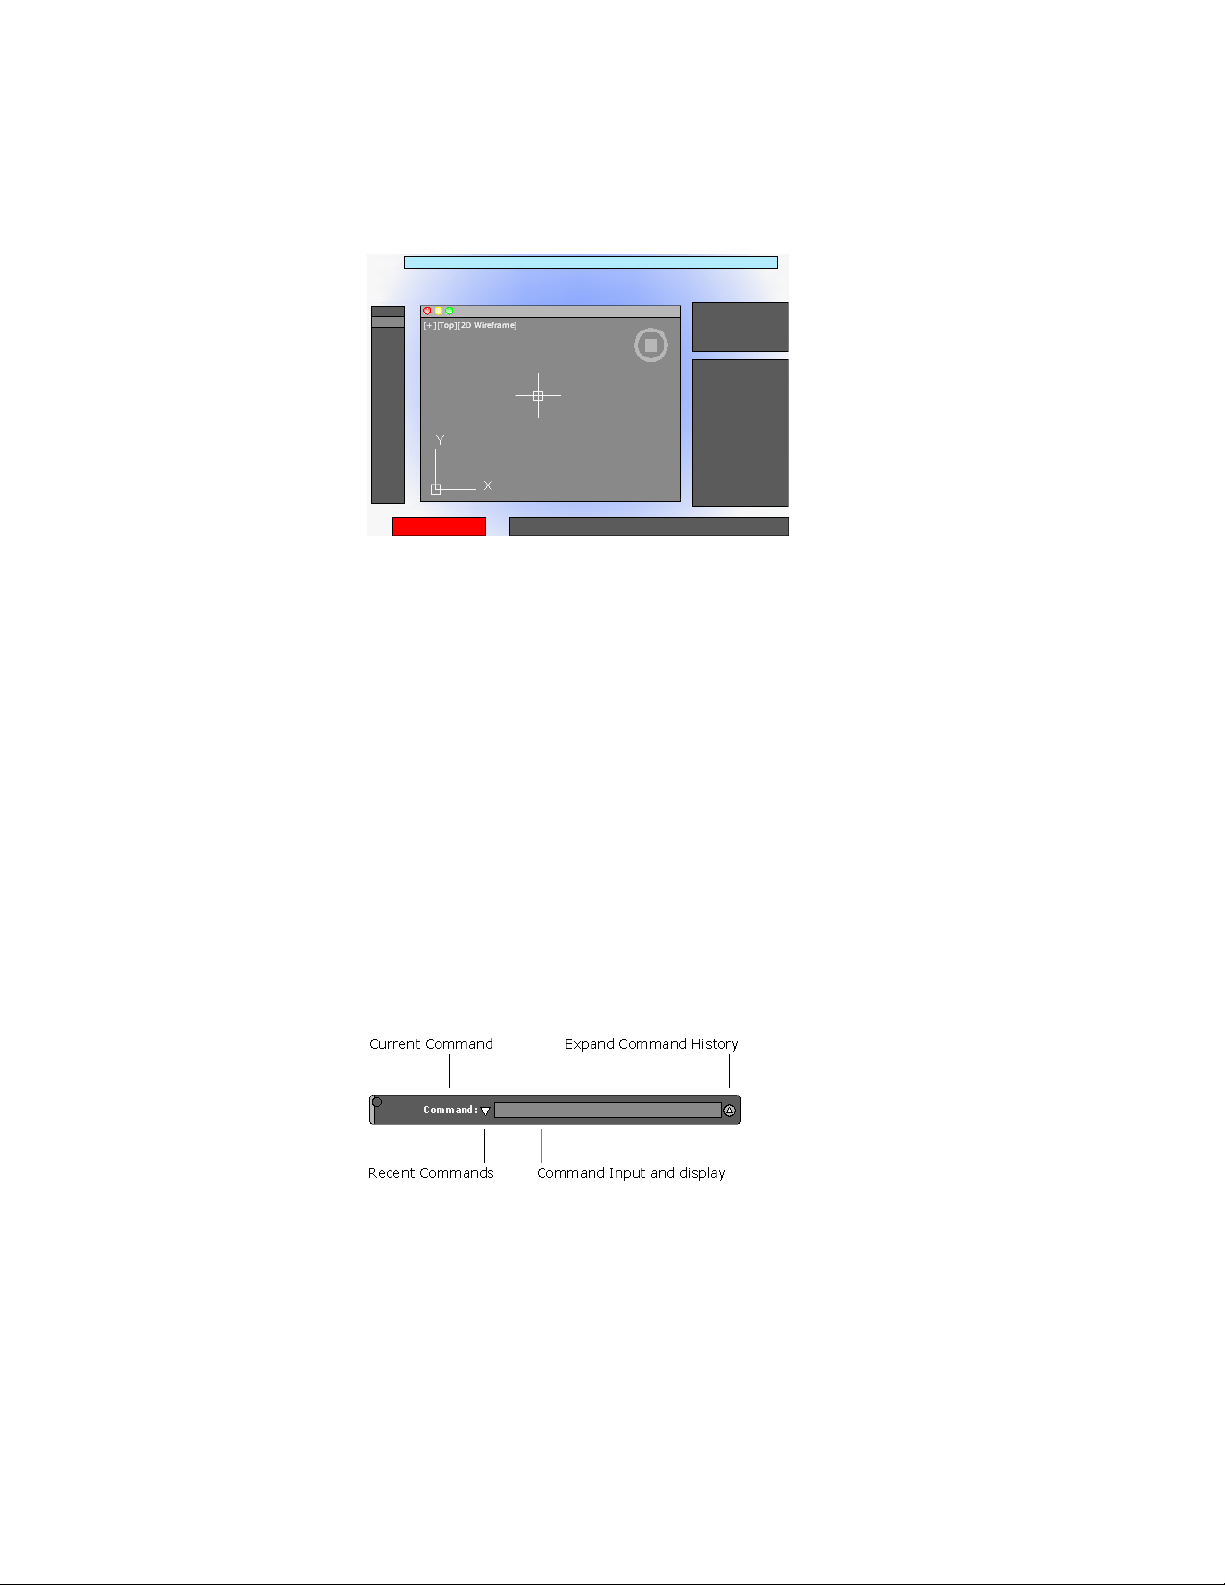
Using the keyboard, you can enter the following in the Command Line:
■ A command or command abbreviation called a command alias
■ The capitalized letters of an option for a command
■ A setting called a system variable that controls how the program operates
by default
Many advanced users prefer this method for speed. Also, the Command Line
displays prompts and error messages.
Cmd-3 turns the Command Line on and off.
Enter Commands on the Command Line
You can enter a command by using the keyboard. Some commands also have
abbreviated names called command aliases.
To enter a command by using the keyboard, type the full command name or
its command alias in the input area of the Command Line, and then press
Enter or Spacebar. The Command Line includes several controls.
Start a Command | 11

NOTE When Dynamic Input is turned on and is set to display dynamic prompts,
you can enter commands and options in tooltips near the cursor. Dynamic Input
can be turned on an off from the status bar.
Display Valid Commands and System Variables
By default, AutoCAD automatically completes the name of a command or
system variable as you type it. Additionally, a list of valid choices is displayed
from which you can choose. Use the AUTOCOMPLETE command to control
which automatic features that you want to use.
If the automatic completion feature turned off, you can type a letter on the
command line and press TAB to cycle through all the commands and system
variables that begin with that letter. Press Enter or Spacebar to start the
command or system variable.
Enter Alternate Names of Commands
Some commands also have alternate names. For example, instead of entering
circle to start the CIRCLE command, you can enter c. Command aliases are
defined in the acad.pgp file.
To define your own command aliases, see Create Command Aliases in the
Customization Guide.
Specify Command Options
When you enter a command in the Command Line, you see either a set of
options, a dialog box, or a palette. To specify an option displayed in the
Command line, enter the capitalized letters for the option. For example, when
you enter circle, the following prompt is displayed:
Specify center point for circle or [3P/2P/Ttr (tan tan radius)]:
You can specify the center point for the circle either by entering X,Y coordinate
values, or by using the pointing device to click a point in the drawing area.
To choose a different option, enter the letters capitalized in one of the options
in the brackets. You can enter uppercase or lowercase letters. For example, to
choose the three-point option (3P), enter 3p.
Repeat and Cancel Commands
You can repeat the previous command by pressing Enter or Spacebar.
12 | Chapter 2 The User Interface

To repeat a recently used command, right-click in the Command Line or click
the drop-down arrow to the left of the command input area. This action
displays a shortcut menu with a list of recently used commands.
You can also repeat a recently used command by cycling through the
commands with Up Arrow and Down Arrow keys, and then pressing Enter.
To cancel any command in progress, press Esc.
See also:
Use Dynamic Input (page 166)
Create Command Aliases
Enter System Variables on the Command Line
System variables are settings that control how certain commands work.
Sometimes you use a system variable in order to change a setting. At other
times you use a system variable to display the current status.
With system variables, you can
■ Turn on or turn off features. For example, the GRIDMODE system variable
turns the grid display on and off when you change the value.
■ Control the operation of a command. For example, the HPASSOC syatem
variable controls whether hatch patterns are associative by default.
■ Retrieve stored information about the current drawing and about the
program configuration. For example, CDATE is a read-only system variable
that stores the current date in decimal format. You can display the values
of read-only system variables, but you cannot change them.
Usually system variables are accessible from dialog boxes. You can change
their values either in a dialog box, directly in the Command Line, or
automatically in a script or custom program.
Enter System Variables on the Command Line
To change the setting of a system variable
1 In the Command Line, enter the system variable name. For example,
enter pickadd to change the style for selecting objects, whether selecting
Start a Command | 13

objects automatically replaces the current selection set, or whether they
are added to the current selection set.
2 If necessary, press Fn-F1 to view the documentation for that system
variable.
3 Enter the setting that you want to use. In the example of PICKADD,
enter 0, 1, or 2 to determine how you select multiple objects.
Switch Between Dialog Boxes and the Command Line
You can display prompts on the command line instead of using a dialog box,
or switch back again. This option is useful primarily when using scripts.
Some functions are available both in the Command Line and in a dialog box.
In many cases, you can enter a hyphen before a command to suppress the
dialog box and display prompts in the Command Line instead.
For example, entering layer on the command line displays the Layers palette.
Entering -layer on the command line displays the equivalent Command Line
options.
Suppressing a dialog box is useful for familiar operation with earlier versions
of the program, and for using script files. There may be slight differences
between the options in the dialog box and those available in the Command
Line.
These system variables also affect the display of dialog boxes:
■ ATTDIA controls whether the INSERT command uses a dialog box for
entering block attribute values.
■ EXPERT controls whether certain warning dialog boxes are displayed.
■ FILEDIA controls the display of dialog boxes used with commands that
read and write files. For example, if FILEDIA is set to 1, SAVEAS displays
the Save Drawing As dialog box. If FILEDIA is set to 0, SAVEAS displays
prompts on the command line. The procedures in this documentation
assume that FILEDIA is set to 1. Even when FILEDIA is set to 0, you can
display a file dialog box by entering a tilde (~) at the first prompt.
FILEDIA and EXPERT are useful when you use scripts to run commands.
View and Edit Within the Command History
You can copy text from the Command History to repeat commands.
14 | Chapter 2 The User Interface
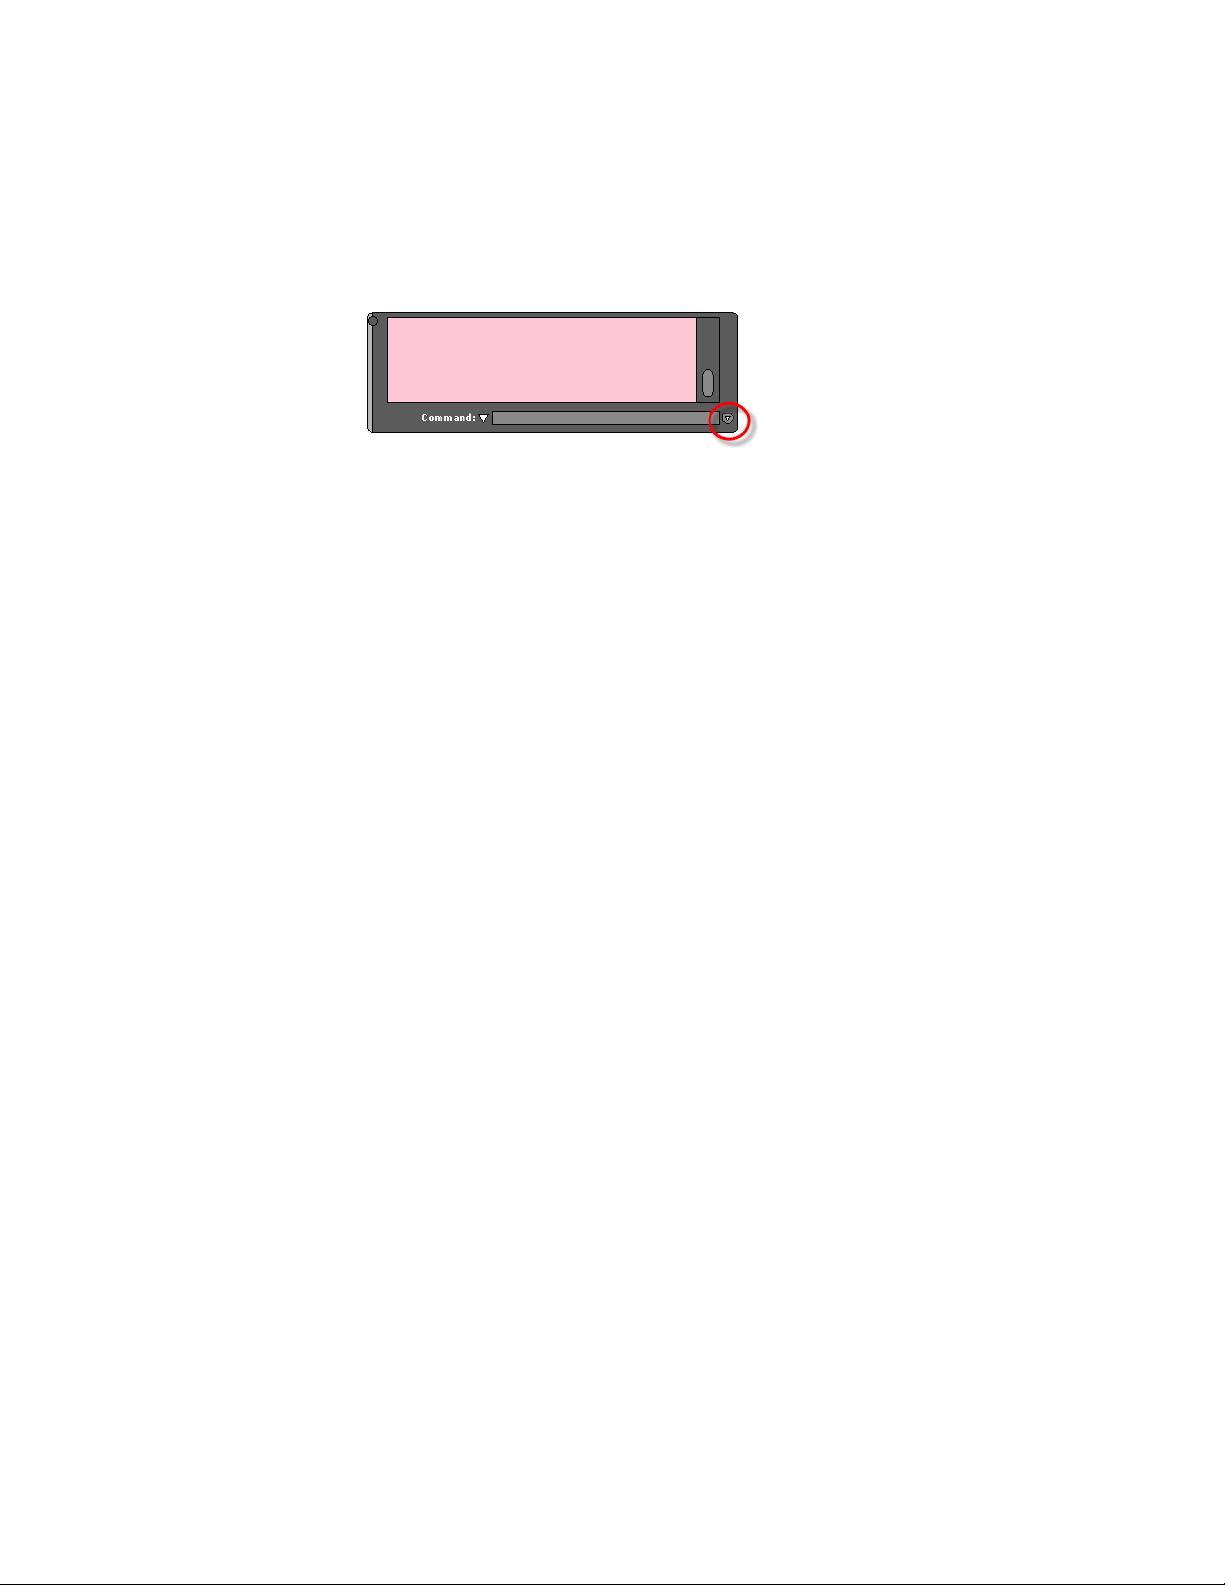
You can expand and collapse the Command History in the Command Line
using the indicated control.
Within the Command History, use the Up Arrow and Down Arrow keys, the
scroll bar, or other scrolling method to locate and then highlight previously
entered commands, system variables, and text.
By default, pressing Cmd-C copies highlighted text to the Clipboard. Pressing
Cmd-V pastes text from the Clipboard to the Command Line.
To copy all the text in the Command History to the Clipboard, right-click and
select Copy History from the shortcut menu, or enter the COPYHIST command.
To save commands automatically to a log file starting with the next command,
enter the LOGFILEON command.
Work with Shortcut Menus
Display a shortcut menu for quick access to commands that are relevant to
your current activity.
Shortcut menus can be used to:
■ Display the controls for a user-interface element such as a palette, the
status bar, or the ViewCube
■ Control the command in progress, including command options, object
snaps, and canceling
■ Display a list of recent input or repeat the last command entered
■ Cut, copy, and paste from the Clipboard
■ Display a dialog box, such as Drafting Settings or Preferences
■ Undo the last command entered
In the Application Preferences dialog box (the OPTIONS command), you can
customize right-click behavior to be time sensitive, so that a quick right-click
acts the same as pressing Enter, and a longer right-click displays a shortcut
menu.
Start a Command | 15

About Keyboard Shortcuts
Keyboard shortcuts allow for quick access to drafting aids, file management
commands, and the Clipboard.
The shortcut keys that AutoCAD supports are:
DescriptionKeyboard Shortcut
Launches the default Web browser and dis-
plays the Landing page or a specific Help
Fn-F1 or Cmd-/
topic based on the current context of the
program.
Expands or collapses the display of the
Command Window.
Fn-F2
Toggles object snap mode on and off.Fn-F3
Toggles 3D object snap mode on and off.Fn-F4
Toggles isoplane mode between top, right,
and left isometric planes.
Fn-F5
Toggles Dynamic UCS mode on and off.Fn-F6 or Cmd-D
Toggles grid display on and off.Fn-F7 or Control-E
Toggles ortho mode on and off.Fn-F8 or Cmd-L or Shift-Cmd-O
Opens or closes the Tool Sets palette.Cmd-1
Opens or closes the Content palette on and
off.
Cmd-2
Shows or hides the Command Window.Cmd-3
Opens or closes the Layers palette.Cmd-4
16 | Chapter 2 The User Interface

DescriptionKeyboard Shortcut
Opens or closes the Properties Inspector
palette.
Cmd-5 or Cmd-I
Toggles the display of the status bar on and
off.
Cmd-6
Opens or closes the Reference Manager
palette.
Cmd-7
Opens or closes the Material Browser
palette.
Cmd-8
Toggles CleanScreen on and off.Cmd-0 or Shift-Cmd-F
Selects all objects in the current layout.Cmd-A or Control-A
Toggles grid snap mode on and off.Cmd-B or Control-B
Copies the selected objects to the Clip-
board.
Cmd-C or Control-C
Toggles Dynamic UCS mode on and off.Cmd-D or Control-D
Displays the Export Data dialog box.Cmd-E
Displays the Find and Replace dialog box.Cmd-F
Groups the selected objects.Cmd-G
Opens or closes the Properties Inspector
palette.
Cmd-I
Toggles ortho mode on and off.Cmd-L or Control-L
Minimizes the current drawing window.Cmd-M
Start a Command | 17

DescriptionKeyboard Shortcut
Displays the Select Template dialog box.
Select a template to create a new drawing.
Cmd-N or Control-N
Displays the Select File dialog box. Select a
drawing file to open.
Cmd-O or Control-O
Displays the Print dialog box, and creates
a hard copy or PDF file of the current layout.
Cmd-P or Control-P
Closes the program.Cmd-Q or Control-Q
Regenerates the current viewport.Cmd-R
Saves the current drawing. If the drawing
has not been saved yet, the Save Drawing
As dialog box is displayed.
Cmd-S or Control-S
Toggles polar tracking on and off.Cmd-U or Control-U
Pastes the contents of the Clipboard to the
current layout.
Cmd-V or Control-V
Closes the current drawing.Cmd-W
Removes the selected from the drawing and
adds them to the Clipboard.
Cmd-X or Control-X
Reverses the most recent undo.Cmd-Y or Control-Y
Undoes the most recent action.Cmd-Z or Control-Z
Zooms the drawing out by .5 times.Cmd- -
Zooms the drawing in by 2 times.Cmd- +
18 | Chapter 2 The User Interface

DescriptionKeyboard Shortcut
Displays the Application Preferences dialog
box.
Cmd-,
Displays the Quick View dialog box.Cmd-.
Launches the default Web browser and dis-
plays the Landing page or a specific Help
Cmd-/
topic based on the current context of the
program.
Toggles group selection mode on and off.Shift-Cmd-A
Displays the Color Palette. Select a new
color to make it the current color for new
objects.
Shift-Cmd-C
Toggles Dynamic Input mode on and off.Shift-Cmd-D
Toggles CleanScreen mode on and off.Shift-Cmd-F
Ungroups the selected group.Shift-Cmd-G
Toggles the display of all palettes on or off.Shift-Cmd-H
Toggles Infer Constraints mode on and off.Shift-Cmd-I
Toggles ortho mode on and off.Shift-Cmd-O or Control-L
Displays the Page Setup Manager.Shift-Cmd-P
Regenerates all viewports in the current
layout.
Shift-Cmd-R
Displays the Save Drawing As dialog box.Shift-Cmd-S
Toggles object snap tracking on and off.Shift-Cmd-T
Start a Command | 19

DescriptionKeyboard Shortcut
Reverses the most recent undo.Shift-Cmd-Z
Displays the Check Spelling dialog box.Shift-Cmd-;
Selects all objects in the current layout.Control-A
Toggles grid snap mode on and off.Control-B
Copies the selected objects to the Clip-
board.
Control-C
Toggles Dynamic UCS mode on and off.Control-D
Toggles grid display on and off.Control-E
Toggles object snap mode on and off.Control-F
Toggles grid display on and off.Control-G
Toggles PICKSTYLE on and off.Control-H
Toggles the coordinates display mode.Control-I
Repeats the previous command.Control-J
Toggles ortho mode on and off.Control-L
Repeats the previous command.Control-M
Displays the Select Template dialog box.
Select a template to create a new drawing.
Control-N
Displays the Select File dialog box. Select a
drawing file to open.
Control-O
20 | Chapter 2 The User Interface

DescriptionKeyboard Shortcut
Displays the Print dialog box, and creates
a hard copy or PDF file of the current layout.
Control-P
Closes the program.Control-Q
Saves the current drawing. If the drawing
has not been saved yet, the Save Drawing
As dialog box is displayed.
Control-S
Toggles polar tracking on and off.Control-U
Pastes the contents of the Clipboard to the
current layout.
Control-V
Removes the selected from the drawing and
adds them to the Clipboard.
Control-X
Reverses the most recent undo.Control-Y
Undoes the most recent action.Control-Z
Nudges the selected objects to the left in
the drawing area.
Control-Arrow Left
Nudges the selected objects to the right in
the drawing area.
Control-Arrow Right
Nudges the selected objects up in the
drawing area.
Control-Arrow Up
Nudges the selected objects down in the
drawing area.
Control-Arrow Down
Toggles group selection mode on and off.Shift-Control-A
Toggles grid snap mode on and off.Shift-Control-B
Start a Command | 21

DescriptionKeyboard Shortcut
Copies the selected objects to the Clipboard
with a specified base point.
Shift-Control-C
Toggles Dynamic UCS mode on and off.Shift-Control-D
Toggles object snap mode on and off.Shift-Control-F
Toggles grid display on and off.Shift-Control-G
Toggles Infer Constraints mode on and off.Shift-Control-I
Repeats the previous command.Shift-Control-J
Repeats the previous command.Shift-Control-M
Toggles ortho mode on and off.Shift-Control-O
Displays the Save Drawing As dialog box.Shift-Control-S
Toggles polar tracking on and off.Shift-Control-U
Removes the selected objects from the
drawing.
Delete
Control the Drawing Area Interface
The drawing area includes several tools and controls for viewing and drawing
operations. You can adjust the display of these interface elements.
Interface Themes and Background Color
Many options are provided for customizing the look and feel of the product,
including the color of the icons and the background color of the drawing area.
22 | Chapter 2 The User Interface

The default color of the icons and palettes are dark gray. If you prefer, you
can change this theme to a light color.
The default background color of the drawing area is a medium gray, which is
optimum for displaying objects with different colors. Nevertheless, some
people prefer a white or a black background color depending on their tasks
and preferences.
See also:
Set Up the Drawing Area (page 35)
Interface Themes and Background Color
To change the color of the user interface between dark and light
1 On the menu bar, click AutoCAD 2013, and then Preferences.
2 In the Application Preferences dialog box, left column, click Look & Feel.
3 Under Interface Theme, click in the Themes box, and click either Dark
or Light.
4 Click OK.
To change the background color of the drawing area in Model space
1 On the menu bar, click AutoCAD 2013, and then Preferences.
2 In the Application Preferences dialog box, left column, click Look & Feel.
3 Under Interface Theme, click in the Model box, and then click a color,
or click Select Color.
The default dark gray background color has an RGB value of 33,40,48.
4 If you clicked Select Color, the Color Palette dialog box is displayed. At
the top of the dialog box, click either Index Color, True Color, or Color
Books, and then make your color selection. Click OK to exit the Color
Palette dialog box.
5 Click OK.
Control the Drawing Area Interface | 23
Cursors in the Drawing Area
In the drawing area, the appearance of the cursor changes depending on what
you are doing.
■ If you are prompted to specify a point location, the cursor appears as
crosshairs
■ If you are prompted to select an object, the cursor changes to a small square
called a pickbox
■ When you are not in a command, the cursor appears as a combination of
the crosshairs and pickbox cursors
■ If you are prompted to enter text, the cursor appears as a vertical bar
In the following illustrations, these cursors are displayed in order.
You can change the size of the crosshairs and pickbox cursors in the
Application Preferences dialog box by clicking Cursor & Selection (the
OPTIONS command).
Selection Style
Selecting objects conforms to a selection style that is common to most Mac
applications.
Use click and drag to specify a rectangular selection area. Drag to the left for
a crossing selection, or drag to the right for a window selection.
Each time you select one or more objects, it automatically clears the previous
selection. To add objects to the previous selection, hold Shift as you select
them.
You can change the behavior of object selection in the Application Preferences
dialog box by clicking Cursor & Selection (the OPTIONS command).
See also:
Select Multiple Objects (page 222)
24 | Chapter 2 The User Interface
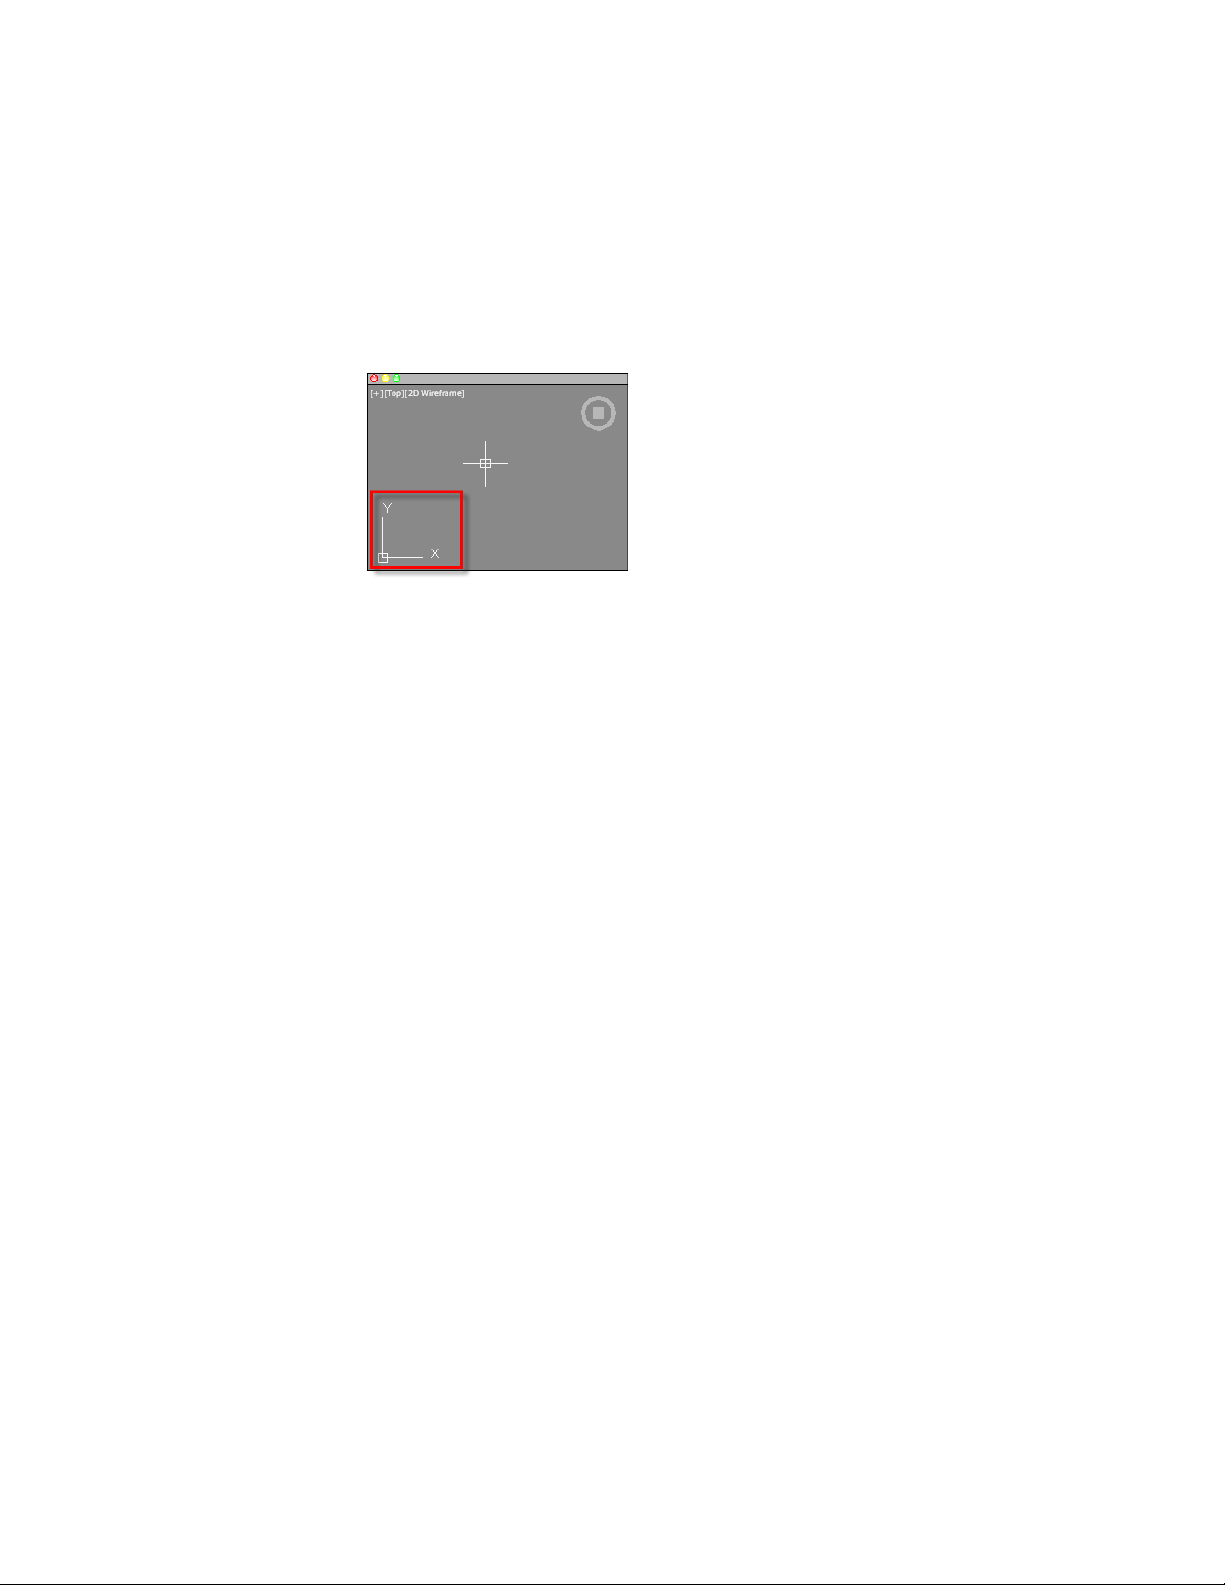
The UCS Icon
The drawing area displays an icon representing the XY axis of a rectangular
coordinate system called the User Coordinate System, or UCS.
You can move or rotate the UCS icon with the UCS command, or by clicking
and dragging the icon using the grips that are displayed. The UCS is useful
because it controls features that include
■ The angular orientation that defines horizontal and vertical
■ The alignment and angle of the grid, and hatch patterns
■ The origin and orientation for 2D and 3D coordinate entry
■ The orientation of construction places, projection planes, and the Z-axis
direction for many 3D operations
You can change the appearance of the UCS icon with the UCSICON command,
Properties option. With this command, you can also control whether the UCS
icon is visible.
See also:
Overview of the User Coordinate System (UCS) (page 148)
Use the Dynamic UCS with Solid Models (page 152)
Control the Display of the User Coordinate System Icon (page 154)
Viewport Label Menus
Viewport label menus are located at the top-left corner of each viewport, and
provide a convenient way of changing views and visual styles.
Control the Drawing Area Interface | 25
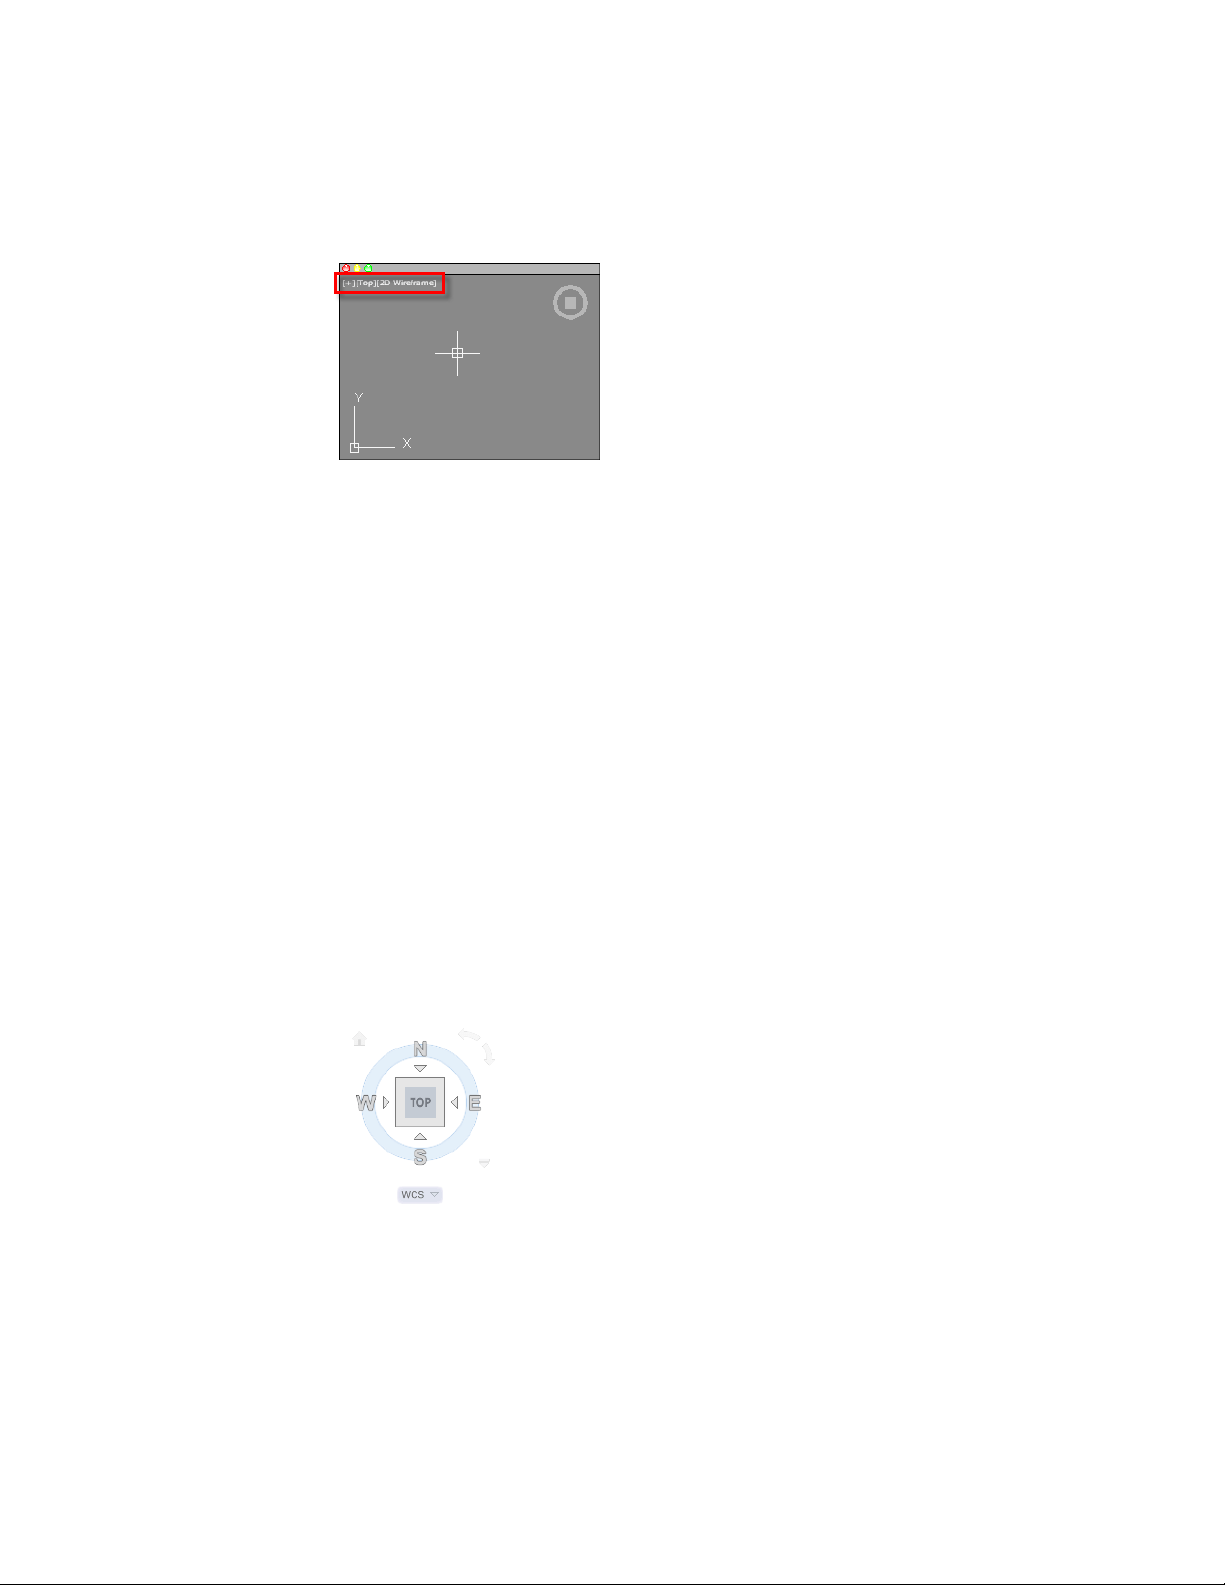
By default, text is displayed that shows the current viewport settings. For
example, the text might be
[+][Top][2D Wireframe]
You can click within each of the three bracketed areas.
■ Click + to display more options
■ Click Top to choose between several standard and custom views
■ Click 2D Wireframe to choose one of several visual styles. Most of the
other visual styles are used for 3D visualization
See also:
Save and Restore Views (page 59)
Use a Visual Style to Display Your Model (page 63)
The ViewCube Tool
The ViewCube tool is a handy tool to control the orientation of 3D views.
This tool is available in most Autodesk products, and provides a common
experience when you switch between products.
26 | Chapter 2 The User Interface
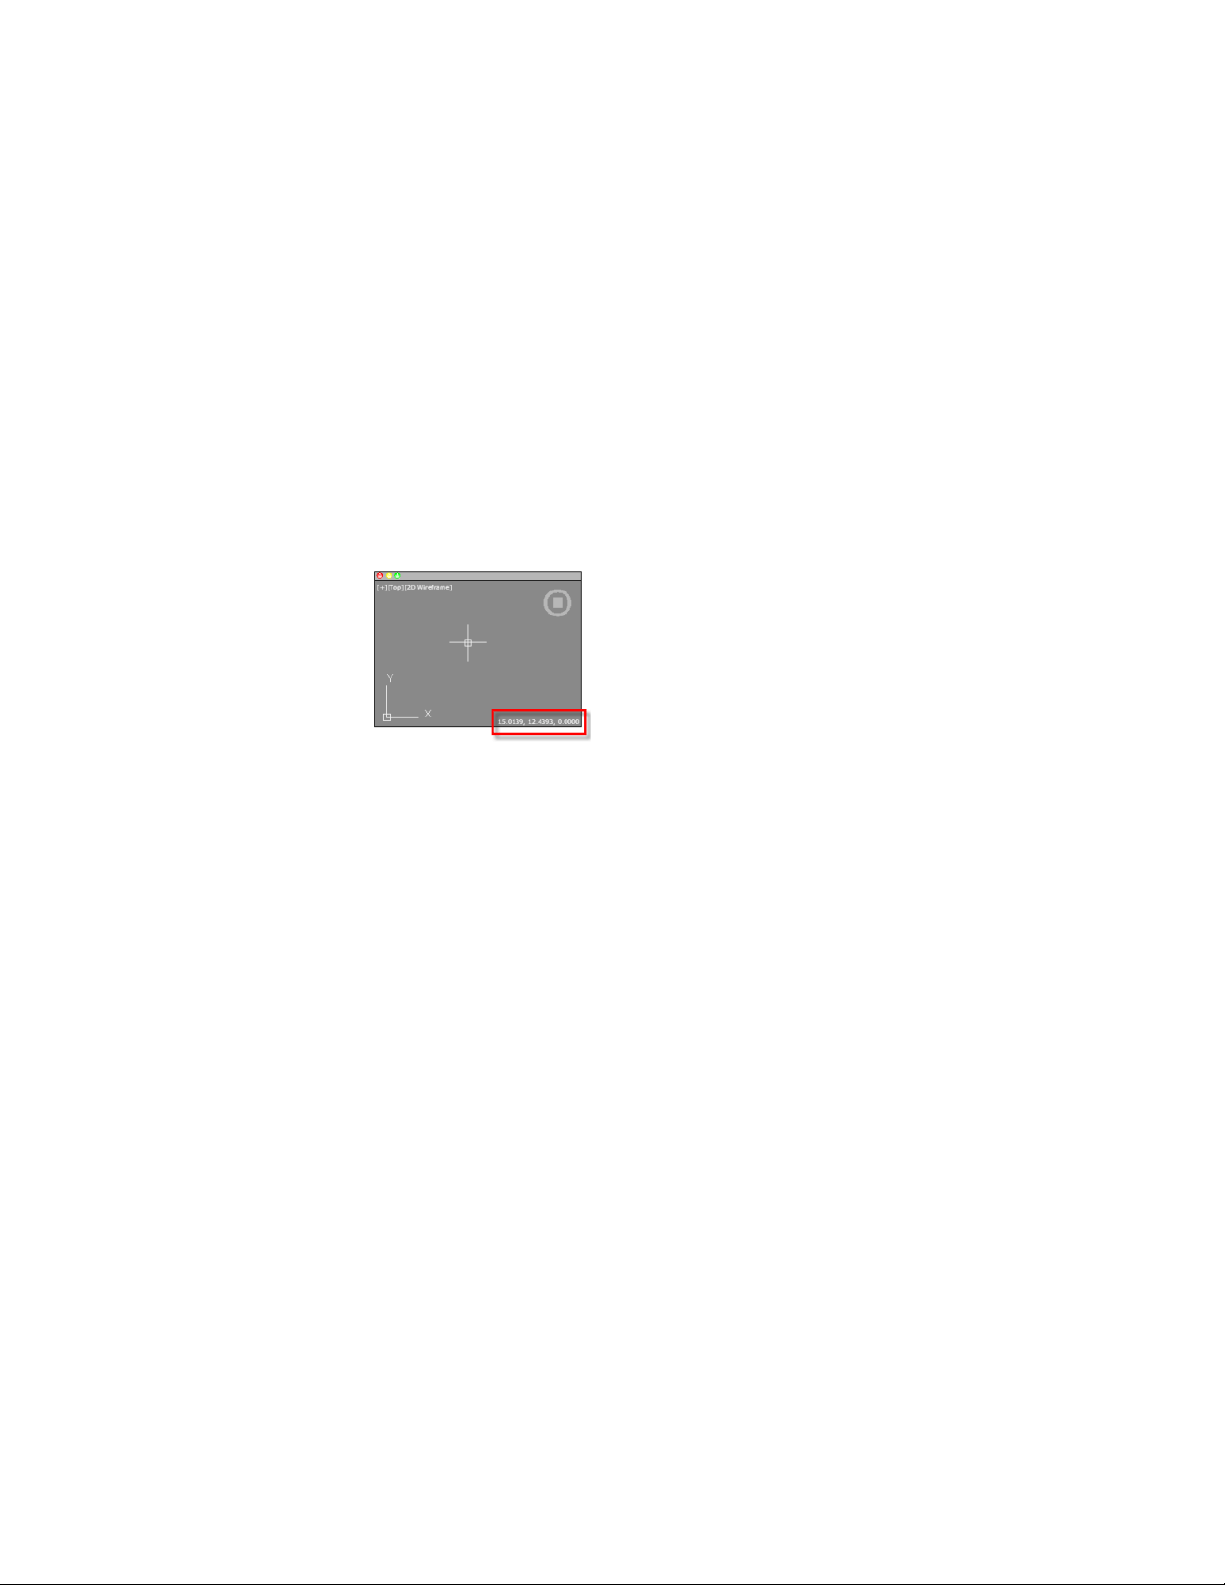
Alternatively, you can use the 3DORBIT command to drag 3D views, and
right-click for additional 3D viewing options.
See also:
Use 3D Navigation Tools (page 73)
The Coordinates Display
The coordinates display is located in the lower-right corner of the active
viewport and displays the current location of the crosshair cursor in the
drawing area.
The display of the coordinates in the active viewport can be toggled in the
Units & Guides tab (Application Preferences dialog box).
Along with the coordinates displayed in the active viewport, you can also get
the current location of the crosshair cursor in a tooltip near the cursor when
dynamic input is turned on. For more information about dynamic input, see
Use Dynamic Input (page 166).
See also:
Use Dynamic Input (page 166)
Overview of Coordinate Entry
Model Space and Layouts
There are two working environments, or spaces, in which you can work, model
space and paper space layouts.
■ Model space is used to create 2D drawings and 3D models
■ Paper space is used create layouts for plotting
Control the Drawing Area Interface | 27
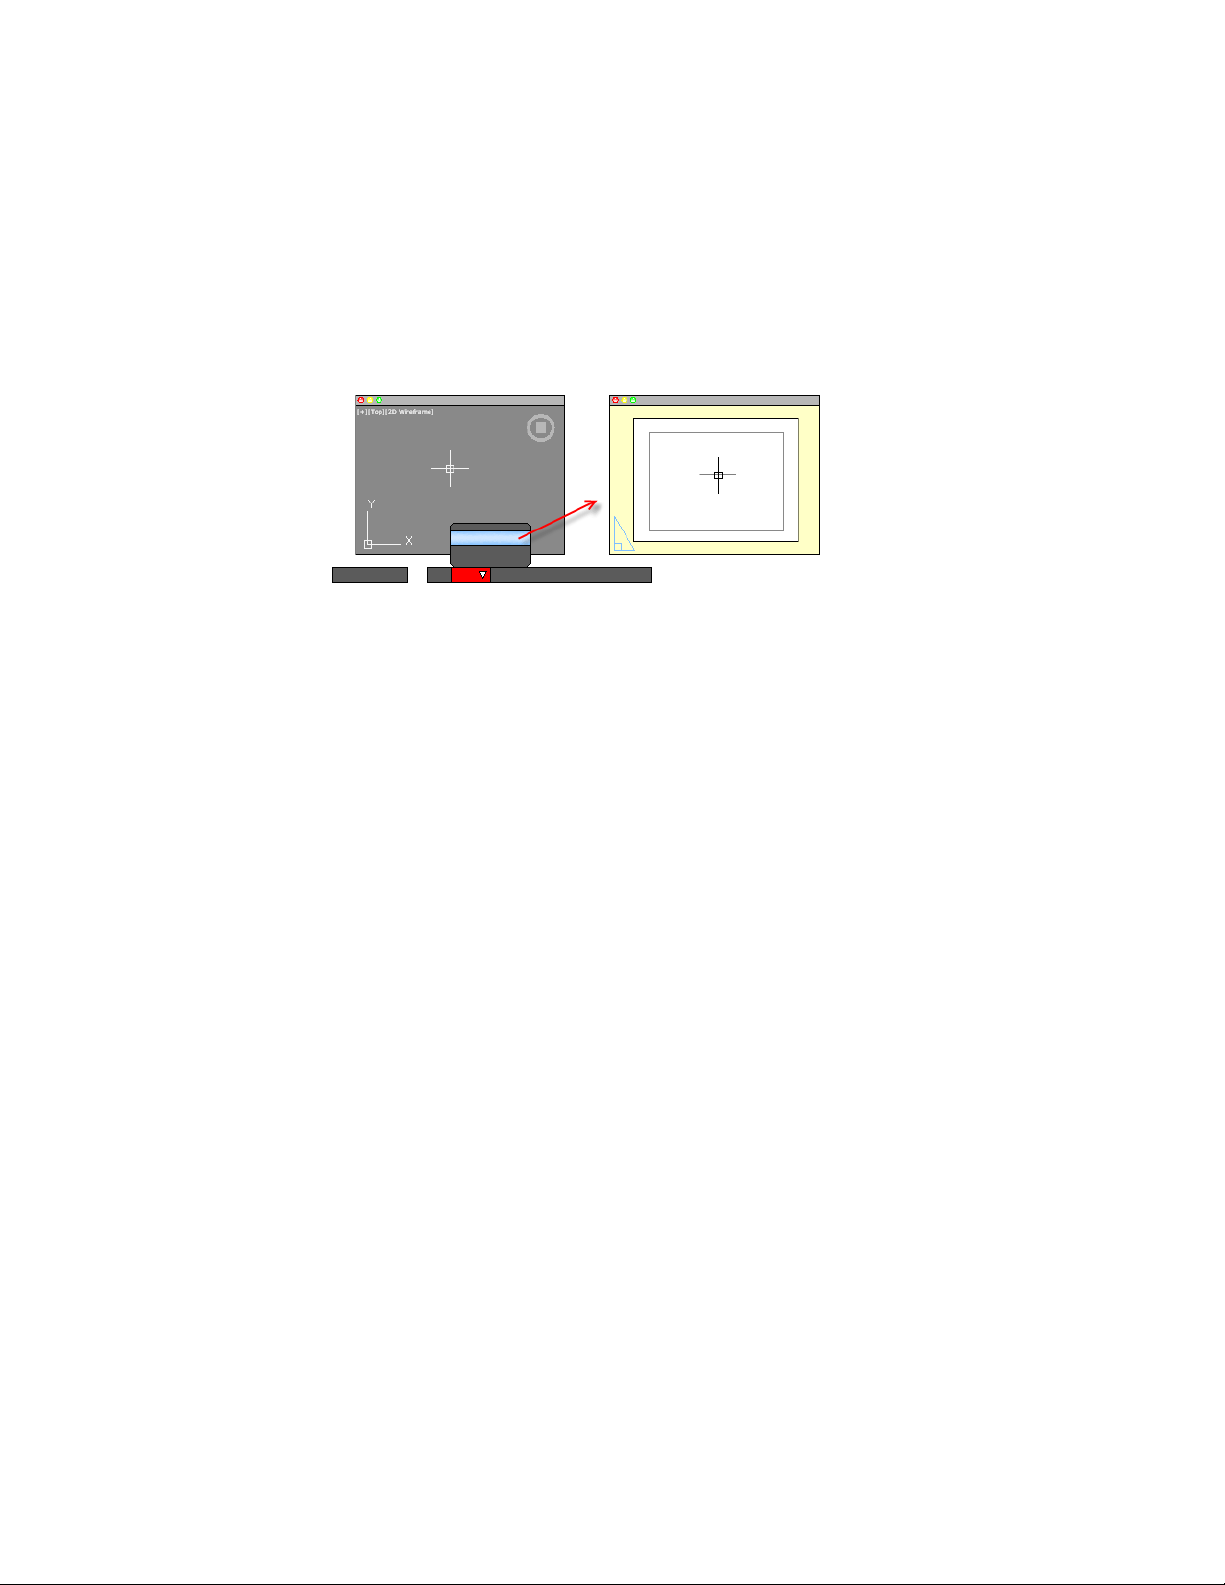
While you can plot from model space, layouts are more convenient for scaling
views, changing the location of views, and controlling the area and settings
used in plotting.
To switch between model space and a layout, click the drop-down near the
left side of the status bar.
See also:
Quick Start for Layouts (page 89)
Control Status, Layers, Properties, and Content
Use the Status bar, Layers palette, Properties Inspector, and Content palette
to change which drafting aids are enabled, modify the layers in the current
drawing, the properties of the current drawing or selected objects, and insert
blocks or hatch patterns from custom content libraries.
The Status Bar
The Status bar includes buttons that turn on and off various features.
For example, this is where you can conveniently turn on and off the grid
display, grid snap, object snap, dynamic input, and so on. The status bar also
includes controls to display lineweights and object transparency. Several
controls relate to the annotation scaling feature.
28 | Chapter 2 The User Interface
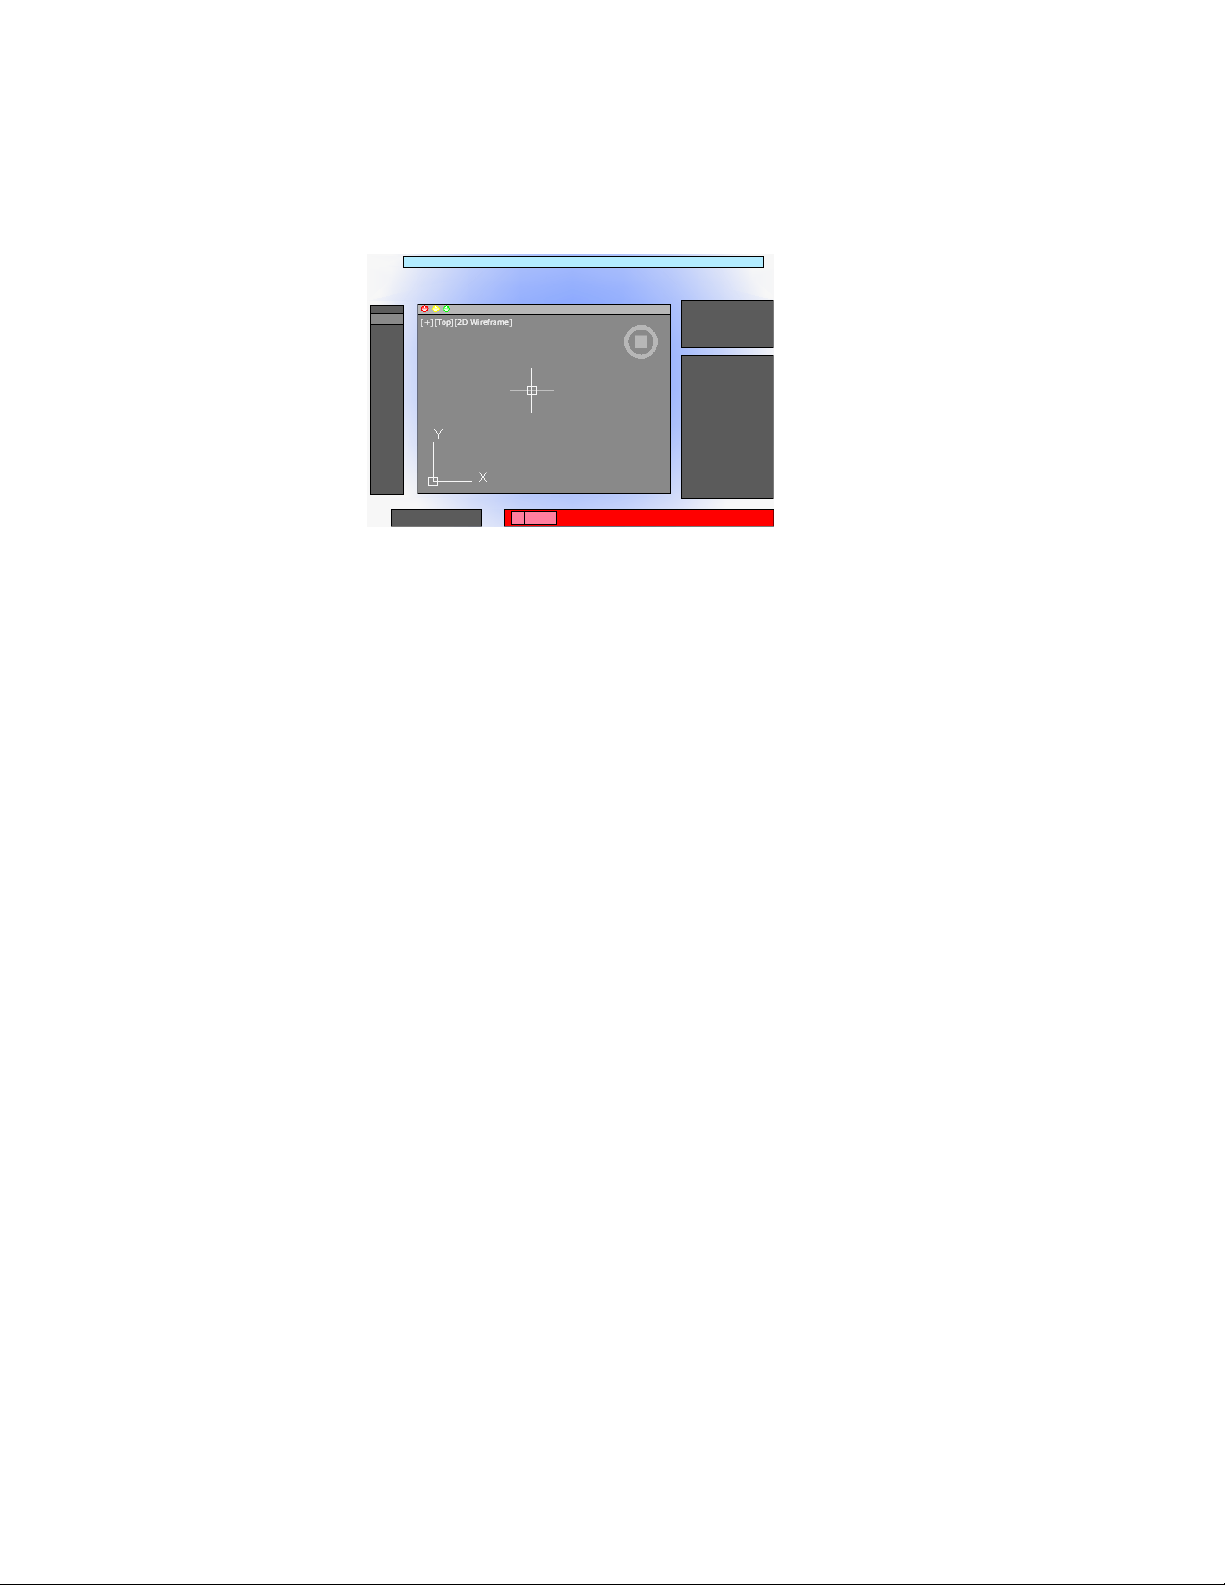
One of the most important controls on the status bar, highlighted in the
illustration, changes the drawing area between model space and paper space
layouts.
Click the disclosure triangle at the far right end of the status bar to display the
second row of controls, which include settings and operations for 3D.
The size of the icons and controls on the status bar can be adjusted by using
the Tool Set & Status Bar Icons slider on the Look & Feel tab of the Application
Preferences dialog box (OPTIONS command).
Cmd-6 turns the status bar on and off.
The Status Bar
To control the display of buttons on the status bar
1 Right-click any empty area of the status bar.
2 In the status bar menu, click Display, and then any flyout.
3 Click any button name in the flyout to change whether it is displayed
or hidden.
The Layers Palette
The Layers palette is used to display and manage layers and layer groups.
The disclosure triangle in the Layers palette expands and compresses the Layers
palette to display either
■ All layers and layer groups in a matrix of information, or
Control Status, Layers, Properties, and Content | 29
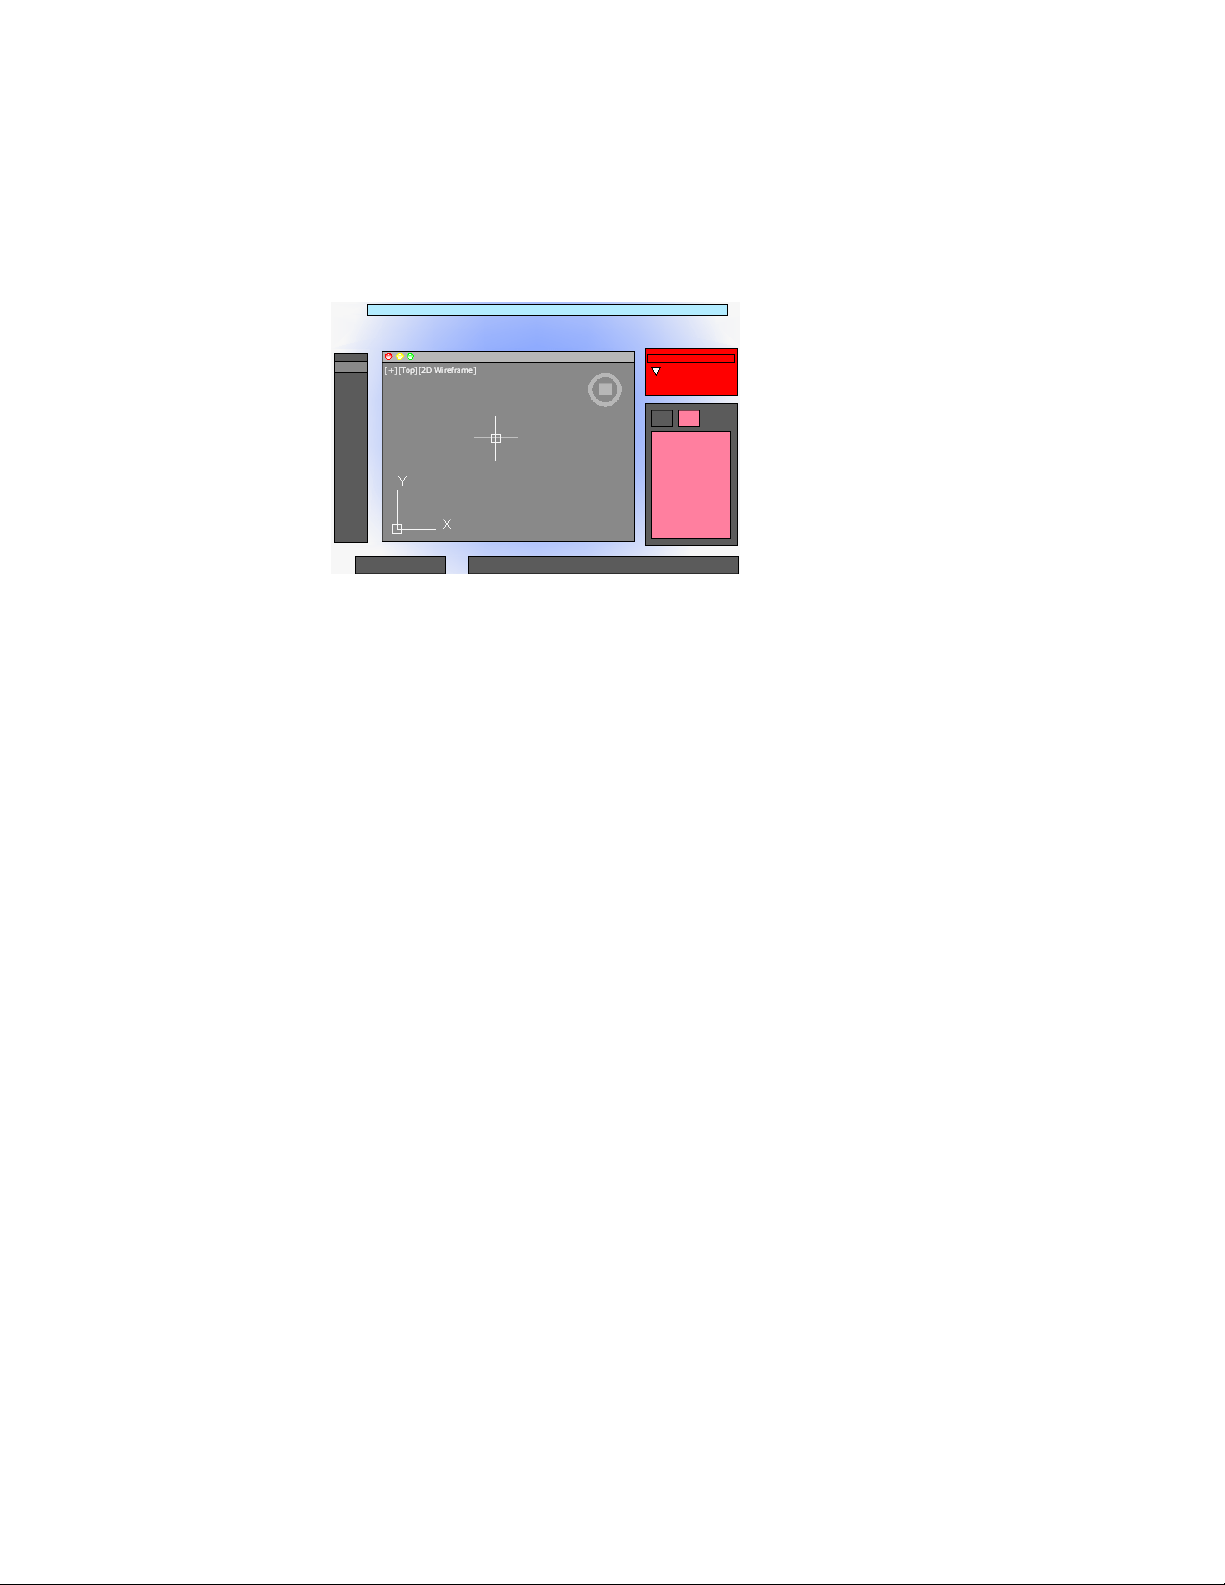
■ The current layer only
Cmd-4 turns the Layers palette on and off.
Display All Layers and Layer Properties
The layers and layer properties in a drawing can be displayed as a matrix,
similar to a spreadsheet. Each row contains a layer and each column represents
a layer property. Right-click the column header in the Layers list to control
which layer properties are displayed.
When undocked in this format, the Layers palette can display all layer
information simultaneously at the cost of taking up space on the screen.
Docking the Layers palette reduces the space it takes up, but you might have
to scroll left and right to see all the properties.
Display the Current Layer Only
Under normal working conditions, the compressed format that displays only
the name of the current layer is adequate and recommended.
Review Layer Properties
The Properties Inspector palette can be used to display all the properties of
either the current layer, or a selected layer as a vertical list. To switch from
displaying object properties, click the Layer Properties tab at the top of the
Properties Inspector palette.
30 | Chapter 2 The User Interface

Display Layer Groups
Layer groups are displayed in the Layer list and allow you to group layers
together by what they represent in the drawing or similar layer properties.
Grouping layers together allows you to change the layer status of all the layers
in the group, and to access the current state or function of layers in the drawing
through the use of dynamic layer groups. Dynamic layer groups automatically
maintain a listing of all the layers that meet a specific set of rules or criteria.
There are four automatic dynamic layer groups that the Layer list supports
and they are:
■ All Used Layers. Lists all the layers that are currently being used in the
drawing.
■ Xref. Lists all the attached external references (xrefs) as nested layer groups,
and each layer group contains the layers of the corresponding xref.
■ Viewport Overrides. Lists all the layers that have viewport overrides
assigned to them in the current viewport.
■ Unreconciled Layers. Lists all the layers that have been recently added
to the drawing and need to be reconciled.
Use Display Settings in the lower-right corner of the Layers palette to control
the display of layer groups in the Layer list. You can also determine which
automatic dynamic layer groups should be displayed and where in the Layer
list that layer groups should be listed.
See also:
Work with Layers (page 119)
The Layers Palette
To create a new layer
1 If necessary, click the Show Layer List disclosure triangle to expand the
Layers palette.
2 At the bottom-left corner of the palette, click the Create Layer button
which looks like a stack of papers.
3 Enter the name of the new layer in the highlighted text area, and then
press Enter.
Control Status, Layers, Properties, and Content | 31

To change the current layer
1 On the Layers palette, click the Layer drop-down.
2 Click the layer that you want to make the current layer.
There are several alternative methods. In the expanded Layers palette, you
can right-click a layer to display a menu, or you can double-click on the layer
name.
To filter the list of layers
1 If necessary, click the disclosure triangle to expand the Layers palette.
2 Enter one of more characters in the Search area at the bottom of the
palette.
Only the layers with the characters that you entered are displayed in the
Layers palette. Wildcards are not available.
3 It is recommended that you delete the text in the Search area when you
are done.
You can click the magnifying glass icon to display and choose from a
list of previous searches.
The Properties Inspector
With the Properties Inspector, you can display and change the settings and
properties for objects and for layers.
You can perform the following actions:
■ Specify the current default properties assigned to all new objects
■ View and change the properties of one or more selected objects
■ Specify the default properties of the current layer
The key to controlling the information that appears in the Properties Inspector
is choosing either the Object/Current tab, or the Layer Properties tab in the
top-left corner of the palette.
32 | Chapter 2 The User Interface
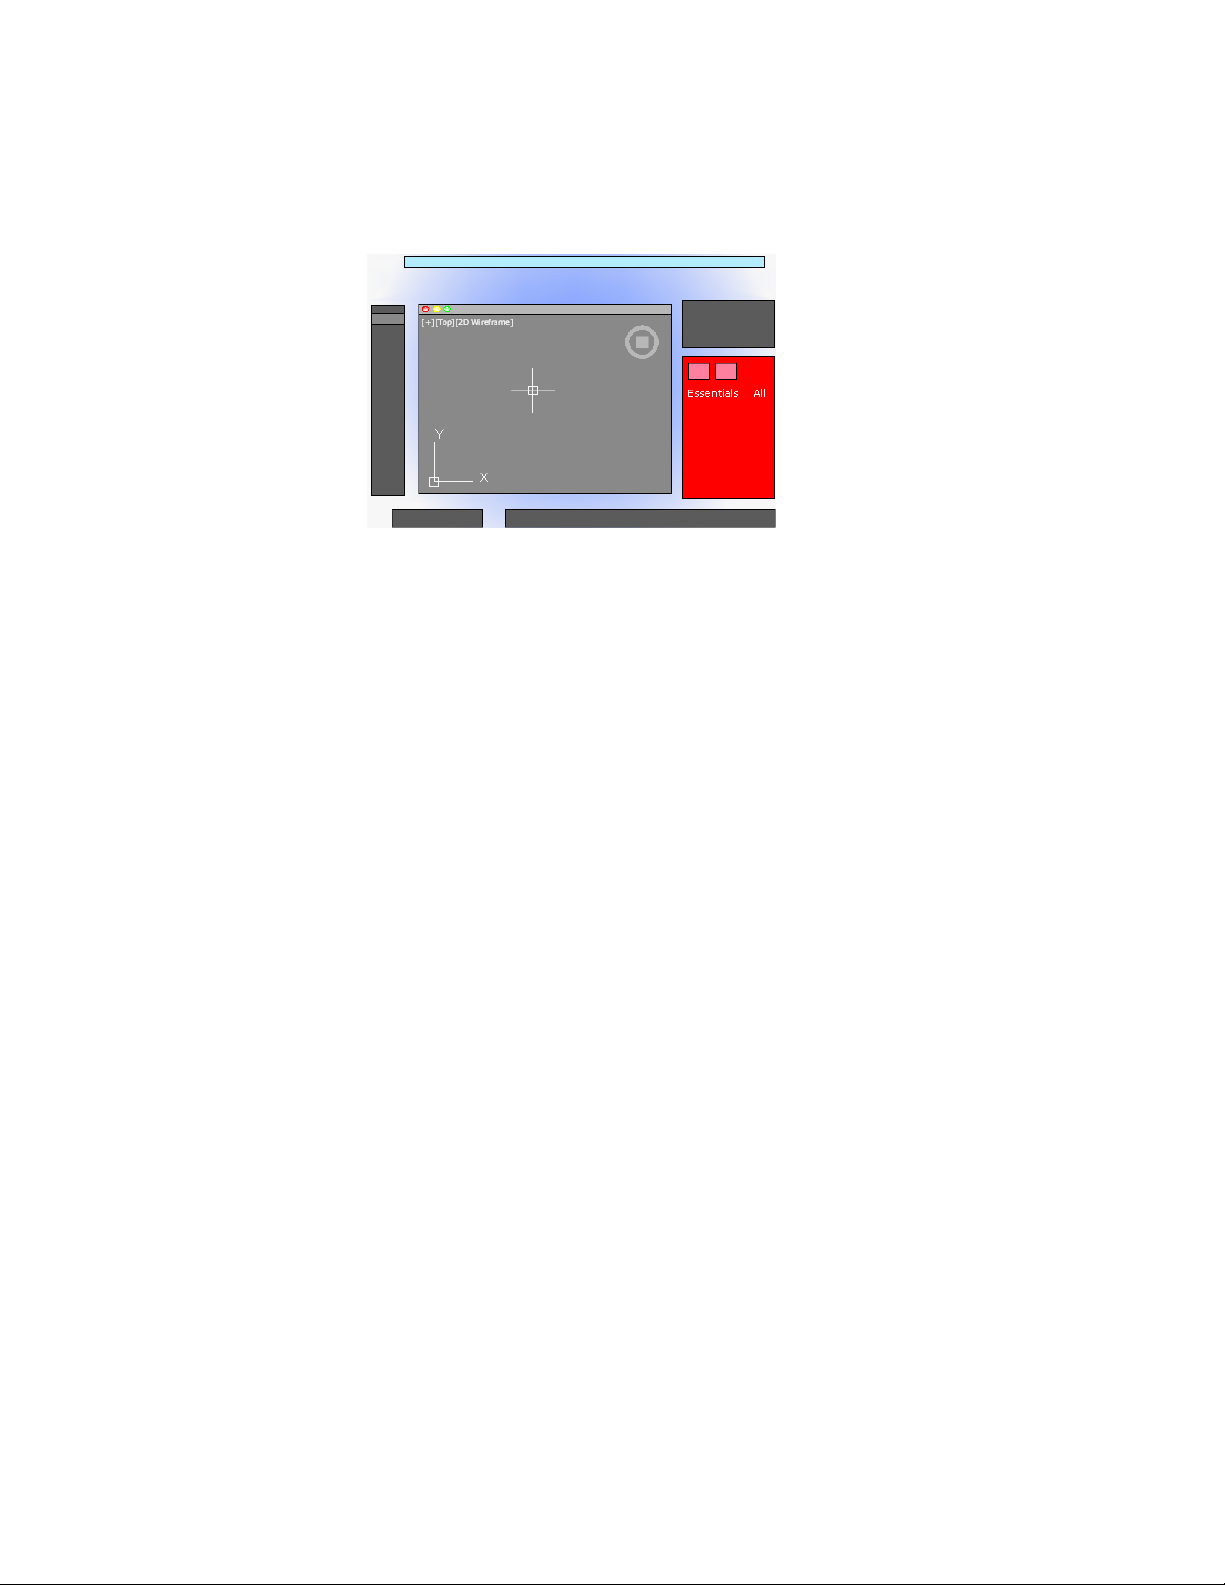
For object properties, clicking either the Essentials button or the All button
controls the number of properties displayed.
Object/Current Properties Tab
The Properties Inspector with the Object/Current button clicked can complete
one of three actions depending on what is selected.
■ With no objects selected, it displays the default properties to be used for
all new objects. You can change these defaults by clicking a property in
the palette, and specifying a different value.
■ With one object selected, it displays the properties for that object only,
and you can change any of its properties.
■ With more than one object selected, it can either display only the common
properties shared by the objects, or all the properties. Any property that
you change is applied to all the selected objects.
Layer Properties Tab
The Properties Inspector provides an efficient way of displaying the properties
and settings associated with the current layer, or a layer that you select in the
Layers palette.
Cmd-5 turns the Properties Inspector on and off.
See also:
Overview of Object Properties (page 117)
Control Status, Layers, Properties, and Content | 33

The Content Palette
The Content palette allows you to access and manage content libraries.
From the Content palette you can
■ Create custom content libraries to organize frequently used blocks
■ Add and remove blocks from the Favorites library or a custom library
■ Insert blocks from the current drawing, Favorites library, or a custom library
Content Libraries
Libraries are used to help organize and access the blocks that you frequently
use. By default, there is no content available in the Content palette. Custom
libraries are created and managed using the Manage Content Libraries dialog
box. You add content to a library by referencing a saved DWG or DXF file, or
block contained in a saved DWG file.
After content has been added to a library, you can
■ Insert a block into a drawing (see -INSERT)
■ Add a block to or remove it from the Favorites library
■ Search for a block in a library
WARNING If a drawing being referenced by Favorites or a custom library is moved,
the reference is maintained but the associated block cannot be inserted into a
drawing.
See also:
Insert Blocks (page 309)
Customize the Drawing Environment
Many elements of the working environment can be customized to fit your
needs.
You can change many window and drawing environment settings in the
Application Preferences dialog box. For example, you can change how often
a drawing is automatically saved to a temporary file, and you can link the
program to folders containing files you use frequently.
34 | Chapter 2 The User Interface

Set Interface Options
You can adjust the application interface and drawing area to match the way
you work.
Set Up the Drawing Area
You can adjust the color and display schemes used in the application and
drawing windows, and control the behavior of general features such as grip
editing behavior.
Many of the settings are available from shortcut menus and the Application
Preferences dialog box.
Some user interface elements, such as the presence and location of menu items
and palettes, can be specified and saved using the Customize dialog box.
Some settings affect how you work in the drawing area:
■ Color Scheme (Application Preferences dialog box, Look & Feel
tab). You specify a dark or light color theme for the overall user interface.
The settings affect the window frame background, status bar, title bar, and
palettes.
■ Background Colors (Application Preferences dialog box, Look
& Feel tab). You specify the background colors used in the Model and
named layouts.
■ UCS Icon and ViewCube (Application Preferences dialog box,
Look & Feel tab). You can specify the display options for the UCS icon
and ViewCube in model space.
■ UCS Icon Style, Size, and Color (UCS Icon dialog box). You can
control the appearance of the UCS icon in model space and paper space.
■ Clean Screen. You can expand the drawing area to display only the menu
bar with the Clean Screen button on the status bar. Press Ctrl-0 to restore
the previous setup.
Tooltips
Several types of tooltips provide pop-up information for interaction with
toolbars, object snaps, and drafting operations.
Tooltips are displayed for tools on the Tool Sets and other palettes in the user
interface. Hover the cursor over the control to display the tooltip.
Customize the Drawing Environment | 35

See also:
User Interface Customization in the Customization Guide
Specify the Behavior of Palettes
Palettes, such as Tool Set, status bar, and Reference Manager can be docked,
displayed as icons, or floated.
Settings for these and other options are often changed on a shortcut menu,
available by right-clicking the title bar of the palette.
■ Resize. Drag an edge of the palette to change its size. If one or more
palettes are docked, dragging one of the palettes adjusts the size of the
other docked palettes.
■ Collapse to Icons. You can collapse the display of all palettes, except
command line and status bar, to a set of icons that are displayed along the
left or right side of the screen. Click an icon to temporarily display the
associated palette. (PALETTEICONON command)
■ Show as Palettes. Expands all palettes that are currently collapsed as
icons. The palettes are returned to their previous size and location.
(PALETTEICONOFF command)
You can hide all the palettes at once with HIDEPALETTES and turn on all
hidden palettes with SHOWPALETTES.
NOTE
If a palette has been turned back on manually and moved, it is not affected
by SHOWPALETTES.
The placement of palettes can be changed by dragging them on screen. You
can control the location a palette is docked by dragging it to the edge of the
screen and dropping it when you see a blue bar. You can also drag and drop
palettes on a palette that is already docked.
Use RESETPALETTES to return all palettes to their default placement.
Customize Startup
Command line switches can be used to control how the program is started
from the Terminal window or a shell script.
36 | Chapter 2 The User Interface
You can use command line switches to specify several options when you start
the program. For example, you can run a script or start with a specified drawing
template.
Command line switches are parameters you can use to create custom shell
scripts to start AutoCAD in a specific way. Valid switches are listed in the
following table.
Designates a script to run after you start the
program (b stands for batch process). Scripts
Script name-b
can be used to set up drawing parameters
in a new drawing file.
Creates a new drawing based on a template
or prototype drawing.
Template file name-t
Starts the program without first displaying
the logo screen.
No AutoCAD logo screen-nologo
The syntax for using command line switches is
pathname/AutoCAD [drawingname] [-switchname]
When using a switch option, you must follow the switch with a space and
then the name of a file. For example, the following entry starts the program
from a folder named AutoCAD 2013with the drawing template arch1.dwt and
executes a script file startup.scr.
/Applications/Autodesk/AutoCAD 2013/AutoCAD
2013.app/Contents/MacOS/AutoCAD -t /templates/arch1.dwt -b
startup.scr
Customize the Drawing Environment | 37

38

Start and Save Drawings
Start a Drawing
All drawings start from either a default drawing template file or a custom drawing
template file that you create. Drawing template files store default settings, styles,
and additional data.
Overview of Starting a New Drawing
Before you start to draw, you need to decide what system of drawing units that
you will use in the drawing, and then choose a drawing template file appropriate
for those drawing units.
Choose Drawing Units
A drawing unit can equal one inch, one millimeter, or any other system of
measurement. For more information about drawing units, see Determine the
Units of Measurement (page 40).
Choose a Drawing Template File
When you start a new drawing, AutoCAD accesses a drawing template file to
determine many default settings such as unit precision, dimension styles, layer
names, a title block, and other settings. Many of the settings are based on
whether the drawing template file is intended for use with a drawing created
in inches, feet, millimeters, centimeters, or other unit of measurement.
3
39
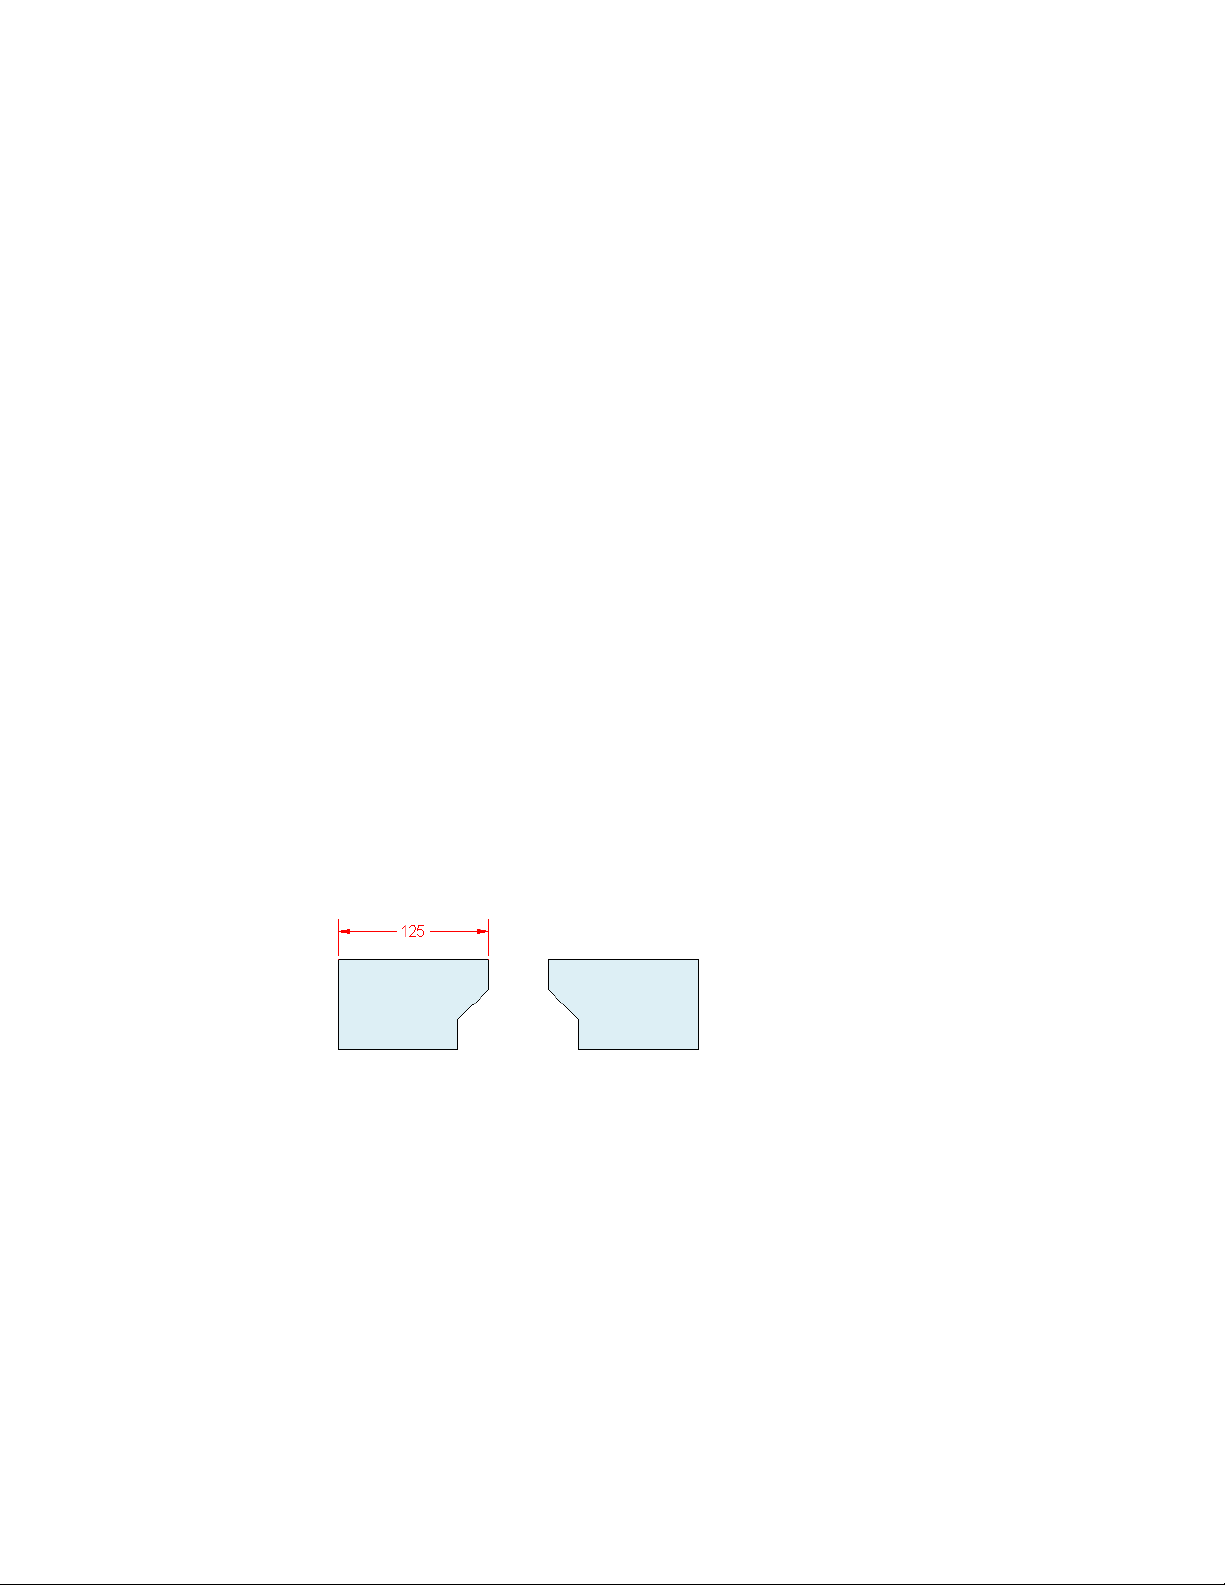
Customize a Drawing Template File
By customizing your own drawing template file, you save yourself a lot of
work changing settings, and you also ensure that the settings are standardized.
You can create several drawing template files for different projects, and you
can choose one when you click New.
Specify Units and Unit Formats
Before you start to draw, you decide on the units of measurement to be used
in the drawing, and set the format, precision, and other conventions to be
used in coordinates and distances.
Determine the Units of Measurement
Before you start to draw, you must decide what one drawing unit represents
based on what you plan to draw. You can convert a drawing between systems
of measurement by scaling it.
Every object you create is measured in drawing units. Before you start to draw,
you must decide what one drawing unit will represent based on what you
plan to draw. Then you create your drawing at actual size with that convention.
For example, the objects in the illustration might represent two buildings that
are each 125 feet long, or a section of a mechanical part that is measured in
millimeters.
Convert Drawing Units
If you start a drawing in one system of measurement (imperial or metric) and
then want to switch to the other system, use SCALE to scale the model
geometry by the appropriate conversion factor to obtain correct distances and
dimensions.
40 | Chapter 3 Start and Save Drawings
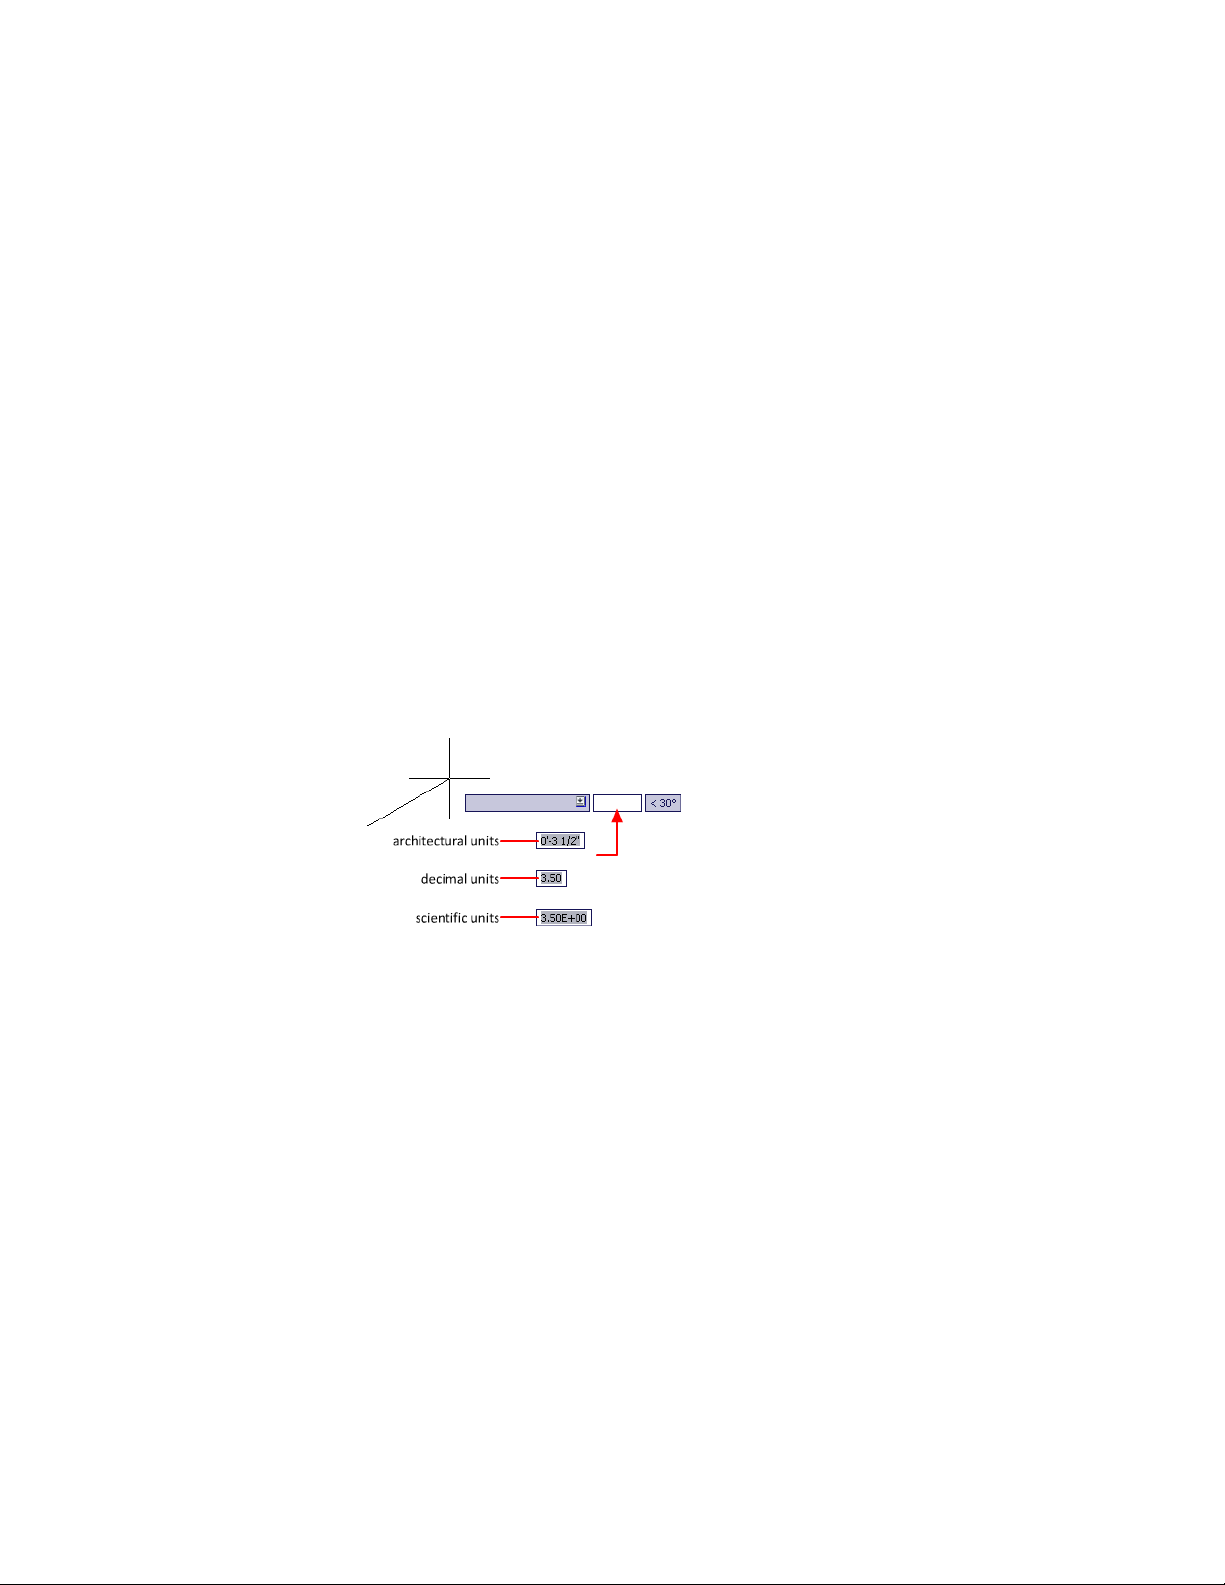
For example, to convert a drawing created in inches to centimeters, you scale
the model geometry by a factor of 2.54. To convert from centimeters to inches,
the scale factor is 1/2.54 or about 0.3937.
See also:
Set the Scale for Dimensions (page 583)
Set the Unit Format Conventions
You can set the format and the number of decimal places to be used when
you enter and display linear and angular units.
Set Linear Units
You can choose from several common conventions to represent the format
and the precision of linear distances and coordinates displayed in the Properties
Inspector palette, dynamic input, the status bar, and other locations.
For example, here are three variations of dynamic input.
Set Angular Units
You can specify that positive values of angles are measured either clockwise
or counterclockwise, and the direction of angle 0 (usually East or North). You
can enter angles using grads, radians, or surveyor's units or using degrees,
minutes, and seconds.
If you use surveyor's angles when specifying polar coordinates, indicate whether
the surveyor's angles are in the north, south, east, or west direction. For
example, to enter the relative coordinates for a property line that is 72 feet,
8 inches long with a bearing of 45 degrees north, 20 minutes, 6 seconds east,
enter @72'8"<n45d20'6"e.
Start a Drawing | 41

Understand Rounding and Precision
When you specify the display precision of units, the values for coordinates
and distances are rounded off. However, the internal precision of coordinates
and distances is always maintained regardless of the display precision.
For example, if you set the display precision of decimal-format units to 1 (or
0.0), the display of coordinates is rounded to one place after the decimal point.
Thus, the coordinates 0.000,1.375 are displayed as 0.0,1.4, but the internal
precision is still maintained.
Use a Drawing Template File
A drawing template file provides consistency in the drawings that you create
by maintaining your standard styles and settings.
Select a Drawing Template File
A set of drawing template files is installed with AutoCAD. Many of them are
provided either for imperial or for metric units, and some are optimized for
3D modeling. All drawing template files have a .dwt file extension.
While these drawing templates provide a quick way to start a new drawing,
it is best to create drawing templates specific to your company and the type
of drawings you create.
Create a Drawing Template File
When you need to create several drawings that use the same conventions and
default settings, you can save time by creating or customizing a drawing
template file instead of specifying the conventions and default settings each
time you start. Conventions and settings commonly stored in template files
include
■ Unit format and precision (page 40)
■ Title blocks and borders (page 309)
■ Layer names (page 120)
■ Snap and Grid spacing (page 173)
■ Text styles (page 540)
■ Dimension styles (page 565)
■ Multileader styles (page 533)
42 | Chapter 3 Start and Save Drawings

■ Linetypes (page 137)
■ Lineweights (page 141)
■ Layouts (page 89)
■ Page setups (page 617)
By default, drawing template files are stored in the template folder, where they
are easily accessible. You can use the Application Preferences dialog box to
set a default for both the template folder and the drawing template file.
Add Identifying Information to Drawings
You can keep track of your drawings more easily if you add keywords or other
information to them.
Use Finder
Finder can be used to location drawing files. For example, you can search for
all files created on a certain date, or for files you modified yesterday.
Display Properties in Fields
You can assign any of the drawing properties to a field in a text object. For
more information about fields, see Use Fields in Text (page 536).
Open or Save a Drawing
You can use several methods to find and open drawings, even damaged
drawings. You can save and backup drawings automatically.
Open a Drawing
You open drawings to work on them just as you do with other applications.
In addition, you can choose from several alternative methods.
To open a drawing, you can
■ Use Open on the File menu to display the Select File dialog box. If the
FILEDIA system variable is set to 0, the Command prompt version displays
instead of a file navigation dialog box.
Open or Save a Drawing | 43

■ Double-click a drawing in Finder to launch AutoCAD
®
and open the
drawing. If the program is already running, the drawing opens in the
current session.
■ Drag a drawing from Finder onto the AutoCAD icon in the Dock.
If you drop a drawing anywhere outside the drawing area—for example,
the command line or the blank space next to the toolbars— the drawing
is opened. However, if you drag a single drawing into the drawing area of
an open drawing, the new drawing is not opened but inserted as a block
reference.
■ Use the Project Manager to locate and open the drawings in a project data
(DST) file.
Work on Drawings During Loading
You can work on drawings before they are fully open. This is useful when you
work on large drawings and you want to begin working immediately. To take
advantage of this capability, three conditions are required.
■ The drawing must have been saved in paper space.
■ The INDEXCTL system variable must be set to a non-zero value.
When these conditions are met, you can create or modify visible objects, pan
or zoom, turn off or freeze layers, and any other operation that does not require
displaying objects not visible when the drawing was last saved.
NOTE
The Quick View feature will not be fully functional during loading under these
conditions.
Resolve Missing References
As you open a drawing, you are notified (messages and task dialog boxes)
when a reference cannot be located. From the References - Unresolved
Reference Files task dialog box, click Update the Location of the Referenced
Files to open the Reference Manager palette to make changes to missing
external references.
44 | Chapter 3 Start and Save Drawings
The following table outlines some of the references that might be missing and
describes how to handle them.
DescriptionMissing Reference Types
Missing external references are the result of AutoCAD
not being able to resolve the last known location of an
External references
xref, raster image, or underlay. To resolve a missing ex-
ternal reference, locate the file and update its location
using the Reference Manager palette.
For information about resolving missing referenced files,
see
■ Resolve Missing External References (page 661)
■ Attach Raster Image Files (page 680)
■ Attach Files as Underlays (page 670)
Missing shape files are often the result of custom shapes
being used in a linetype. Browse to the missing linetype
Shapes
file, or place the shape file in the folder with the drawing
or one of the support paths defined in the Application
Preferences dialog box.
Work with Large Objects
AutoCAD 2010 supports object size limits greater than those available in
previous releases. With increased object size limits you can create larger and
more complex models. Using increased object size limits can result in
compatibility issues with legacy drawing file formats (AutoCAD 2007 and
earlier).
When working with drawings that you might need to exchange with others
using AutoCAD 2009 and earlier, set the LARGEOBJECTSUPPORT system
variable to 0. Setting LARGEOBJECTSUPPORT to 0 warns you when a drawing
contains large objects that cannot be opened by a release of the program prior
to AutoCAD 2010.
Recover Defective Drawing Files
In some circumstances, it is possible that a drawing file becomes defective.
This can result from hardware problems or transmission errors. If a drawing
Open or Save a Drawing | 45

file is corrupt, you might be able to recover it. See Repair, Restore, or Recover
Drawing Files (page 52).
Change the Default Drawing Folder
Each time you start AutoCAD, the Documents folder is the default path in each
standard file selection dialog box.
Alternatively, you can start AutoCAD in the current folder from the Terminal
window. Set REMEMBERFOLDERS to 0 and then start AutoCAD from the
current folder.
See also:
Work with Layouts in a Project (page 102)
Open and Save Drawing Files from the Internet (page 706)
Work with Multiple Open Drawings
You can preview and switch between open drawings and layouts in a drawing
and transfer information between open drawings.
Preview Open Drawings and Layouts
With QuickView, you can easily preview and switch between open drawings
and layouts in an open drawing.
The Show Drawings & Layouts button on the status bar allows you to do the
following:
■ Open drawings. All open drawings are displayed along the left side of
the QuickView dialog box. Double-click a drawing thumbnail to switch to
the corresponding drawing file, or right-click a drawing thumbnail to
display a list of available options. For more information, see Switch Between
Open Drawings (page 47)
■ Layouts in an open drawing. Displays the Model layout and named
layouts in the current drawing or the selected drawing when there is more
than one drawing open. Double-click a layout thumbnail to switch to the
corresponding layout and drawing file, or right-click a layout thumbnail
to display a list of available options. For more information, see Switch
Between Layouts in the Current Drawing (page 47)
46 | Chapter 3 Start and Save Drawings

Switch Between Open Drawings
Switch between open drawings.
You can use one of the following methods to switch between open drawings:
■ On the menu bar, click the Window menu and choose a drawing from the
bottom of the menu.
■ In the Mac OS Dock, right-click the AutoCAD icon and choose a drawing
from the top of the menu.
■ In the Mac OS Dock, right side, click the thumbnail that represents the
open drawing.
■ On the status bar, click the Show Drawings & Layouts button. In the
QuickView dialog box, click the drawing thumbnail along the left side.
■ On the status bar, click the Drawings & Layouts pop-up menu and choose
a drawing from the top of the menu.
Switch Between Layouts in the Current Drawing
Switch between the model space and layouts in the current drawing.
You can use one of the following methods to switch between layouts in the
current drawing:
■ On the status bar, click the Show Drawings & Layouts button. In the
QuickView dialog box, click the layout thumbnail on the right side.
■ On the status bar, click the Drawings & Layouts pop-up menu and choose
a layout from the middle section of the menu.
■ At the Command prompt, enter ctab and press Enter. When prompted
for a new value, enter model or the name of a layout in the drawing and
press Enter.
Transfer Information between Open Drawings
You can easily transfer information between drawings that are open in a single
session.
When you open multiple drawings in a single session, you can
■ Reference other drawings.
■ Insert blocks between open drawings (CONTENT) command.
Open or Save a Drawing | 47

■ Copy and paste between drawings.
■ Use object snaps and the Copy with Basepoint (COPYBASE) command to
ensure accurate placement.
Save a Drawing
You save drawing files for later use just as you do with other applications. You
can also set up automatic saving and backup files and save only selected
objects.
When you work on a drawing, you should save it frequently. Saving protects
you from losing work in the event of a power failure or other unexpected
event. If you want to create a new version of a drawing without affecting the
original drawing, you can save it under another name.
The file extension for drawing files is .dwg, and unless you change the default
file format in which drawings are saved, drawings are saved in the latest
drawing file format. This format is optimized for file compression and for use
on a network.
The character limit for a DWG file name (including its path) is 256 characters.
NOTE If the FILEDIA system variable is set to 0, the Command prompt version
displays instead of a file navigation dialog box.
Save Part of a Drawing File
If you want to create a new drawing file from part of an existing drawing, you
use the WBLOCK command. With the command, you can select objects or
specify a block definition in your current drawing and save them to a new
drawing file. You can also save a description with the new drawing.
Save to a Different Type of Drawing File
You can save a drawing to an earlier version of the drawing format (DWG) or
drawing interchange format (DXF), or save a drawing as a template file. Choose
the format in the Save Drawing As dialog box.
Save with Visual Fidelity for Annotative Objects
When working with annotative objects, this option allows you to maintain
visual fidelity for these objects when they are viewed in AutoCAD 2007 and
48 | Chapter 3 Start and Save Drawings

earlier releases. Visual fidelity is controlled by the SAVEFIDELITY system
variable.
If you work primarily in model space, it is recommended that you turn off
visual fidelity (set SAVEFIDELITY to 0). However, if you need to exchange
drawings with other users, and layout fidelity is most important, then visual
fidelity should be turned on (set SAVEFIDELITY to 1).
NOTE
The SAVEFIDELITY system variable does not effect saving a drawing to the
AutoCAD 2010 drawing or DXF file formats.
Annotative objects may have multiple scale representation. When visual
fidelity is on, annotative objects are decomposed and scale representations
are saved (in an anonymous block) to separate layers, which are named based
on their original layer and appended with a number. If you explode the block
in AutoCAD 2007 or earlier releases, and then open the drawing in AutoCAD
2008 or later releases, each scale representation becomes a separate annotative
object, each with one annotation scale. It is not recommended that you edit
or create objects on these layers when working with a drawing created in
AutoCAD 2008 and later releases in AutoCAD 2007 and earlier releases.
When this option is not selected, a single model space representation is
displayed on the Model layout. More annotation objects may be displayed on
the Model layout depending on the ANNOALLVISIBLE setting. Also, more
objects may be displayed in paper space viewports at different sizes than in
AutoCAD 2008 and later releases.
Reduce the Time Required to Save a Drawing File
You can reduce the time required to save a drawing file if you specify
incremental saves rather than full saves. An incremental save updates only
those portions of the saved drawing file that you changed.
When you use incremental saves, drawing files will contain a percentage of
potentially wasted space. This percentage increases after each incremental
save until it reaches a specified maximum, at which time a full save is
performed instead. You can set the incremental save percentage in the Open
and Save tab of the Options dialog box or by setting the value of the system
variable ISAVEPERCENT. If you set the value of ISAVEPERCENT to 0, all saves
are full saves.
To reduce the size of drawing files, it is recommended that you perform a full
save (with ISAVEPERCENT set to 0) before transmitting or archiving a drawing.
Open or Save a Drawing | 49

Work Internationally
If you share drawing files with companies in other countries and regions, the
drawing file names might contain characters that are not used in other
languages.
If a drawing file is created in a different language version of the operating
system, the following will occur:
■ If support for the language is installed, the file name characters are visible
in Finder.
■ If support for the language is not installed, the file name characters appear
as a series of boxes in Finder.
In either case, you will be able to open the drawing file beginning with
AutoCAD 2007 because the product is Unicode-compliant.
NOTE
If you share drawing files with companies using earlier releases of the product,
you can avoid file name issues for Asian languages and languages that use
accented characters. In those circumstances, do not use high ASCII values, or
values of 80 hexadecimal and above, when creating a file name.
Maintain Compatibility with Large Object Limits
Drawings saved to a legacy drawing file format (AutoCAD 2007 or earlier) do
not support objects greater than 256MB. With the AutoCAD 2010 drawing
file format, these limitations have been removed allowing you to save objects
that are greater in size.
When saving to a legacy drawing file format (AutoCAD 2007 or earlier), the
drawing cannot contain large objects; there might be compatibility issues with
trying to open the drawing. The LARGEOBJECTSUPPORT system variable
controls the large object size limits used and the warning messages displayed
when a drawing is saved.
The following explains how object size limits for drawings is determined:
■ Drawing files cannot exceed an internal size limit of 4GB. This size is based
on the total size of all objects in a drawing when uncompressed. Since a
drawing file is normally compressed, the final size of a saved drawing file
on disk will vary based on the size and number of objects in a drawing.
■ Each individual object in a drawing cannot exceed an uncompressed size
limit of 256MB. For example, a mesh object, when saved to a file and
50 | Chapter 3 Start and Save Drawings

compressed, might be 75MB in size while the same object when
uncompressed might be 257MB.
In these situations, the drawing cannot be saved to an AutoCAD 2007 or earlier
file format until the issues are resolved. You can resolve the size limits by
breaking the drawing or objects up into several drawings or objects.
See also:
Save Drawings to Previous Drawing File Formats (page 699)
Work with Drawings in Earlier Releases (page 695)
Export Drawings to Other File Formats (page 692)
Create Drawing Files for Use as Blocks (page 318)
Add Identifying Information to Drawings (page 43)
Create and Restore Backup Files (page 54)
Share Drawing Files Internationally (page 706)
Open and Save Drawing Files from the Internet (page 706)
Find a Drawing File
You can search for a drawing using name, location, and date filters.
■ Use Searchlight in Finder to search for drawings using name, location, and
date filters.
■ Use the Select File dialog box for the OPEN command to display drawing
file previews. When the RASTERPREVIEW system variable is on, a raster
preview image is automatically generated and stored with the drawing
when you save it.
See also:
Add Identifying Information to Drawings (page 43)
Specify Search Paths and File Locations
You can set the search path to drawing support files such as text fonts,
drawings, linetypes, and hatch patterns. You also can specify the location of
temporary files, which is important when working in a network environment.
Open or Save a Drawing | 51

The Application tab (Application Preferences dialog box) is where you set the
search path that is used by the program to find drawing support files such as
text fonts, drawings, linetypes, and hatch patterns. The
MYDOCUMENTSPREFIX system variable stores the location of the Documents
folder for the current user.
The working search path for drawing support files lists paths that are valid
and exist in the current system folder structure (including system network
mapping). Using these options helps improve performance when these files
are loaded.
Using the Application tab (Application Preferences dialog box), you can also
specify the location of temporary files. Temporary files are created on disk,
and then deleted when you exit the program. The temporary folder is set to
the location that the operating system uses. If you plan to run this program
from a write-protected folder (for example, if you work on a network or open
files on a CD), specify a different location for your temporary files.
The temporary folder that you specify must not be write-protected, and the
drive containing the folder should have sufficient disk space for the temporary
files. It is recommended that you manually delete the files from this folder
on a regular basis to ensure sufficient space is provided for temporary files. If
not enough space is available for temporary files, you may experience errors
or instability in the program.
If you want to use a file that contains custom interface elements, specify it in
the Customization Files item on the Application tab (Application Preferences
dialog box). The default customization file is acad.cuix.
Repair, Restore, or Recover Drawing Files
If a drawing file is damaged or if your program terminates unexpectedly, you
can recover some or all of the data by using commands to find and correct
errors, or by reverting to a backup file.
Repair a Damaged Drawing File
If a drawing file is damaged, you can recover some or all of the data by using
commands to find and correct errors.
52 | Chapter 3 Start and Save Drawings

Repair and Recovery
When an error occurs, diagnostic information is recorded in the acad.err file,
which you can use to report a problem.
A drawing file is marked as damaged if corrupted data is detected, or if you
request that the drawing be saved after a program failure. If the damage is
minor, sometimes you can repair the drawing simply by opening it. A recovery
notification is displayed while opening drawing files that are damaged and
need recovery. You can
■ RECOVER. Performs an audit on, and attempts to open, any drawing file.
■ AUDIT. Finds and corrects errors in the current drawing.
■ RECOVERAUTO. Controls the display of recovery notifications before or
after opening a damaged drawing file.
Example: Auditing Files
Auditing a file generates a description of problems with a drawing file and
recommendations for correcting them. As you start the audit, you specify
whether you want the program to try to fix the problems it encounters. The
report is similar to the following example:
Auditing Header
DXF NAME Current Value Validation Default
PDMODE 990 - 2040
UCSFOLLOW 811 or 0
Error found in auditing header variables
4 Blocks audited
Pass 1 4 objects audited
Pass 2 4 objects audited
Total errors found 2 fixed 2
If you chose not to correct the errors, the last statement changes to
Total errors found 2 fixed 0.
The output from a recovery audit is written to an audit log (ADT) file if the
AUDITCTL system variable is set to 1 (On).
Recovery does not necessarily preserve the high-level consistency of the
drawing file. The program extracts as much material as it can from the damaged
file.
See also:
Create and Restore Backup Files (page 54)
Repair, Restore, or Recover Drawing Files | 53

Create and Restore Backup Files
Backup files help ensure the safety of your drawing data. If a problem occurs,
you can restore a drawing backup file.
Computer hardware problems, power failures or surges, user mistakes, or
software problems can cause errors in a drawing. By saving your work
frequently, you can ensure a minimum of lost data if your system fails for any
reason. If a problem occurs, you can restore a drawing backup file.
Use Backup Files
In the Application tab (Application Preferences dialog box), you can specify
that backup files are created when you save drawings. If you do, each time
you save a drawing, the previous version of your drawing is saved to a file
with the same name and a .bak file extension. The backup file is located in
the same folder as the drawing file.
You can revert to your backup version by renaming the .bak file in Finder to
a file with a .dwg extension. You may want to copy it to a different folder to
avoid overwriting your original file.
Save Your Drawing Automatically at Specified Intervals
If you turn the automatic save option on, your drawing is saved at specified
time intervals. By default, files saved automatically are temporarily assigned
the name filename_a_b_nnnn.sv$.
■ Filename is the current drawing name.
■ a is the number of open instances of the same drawing file in the same
work session.
■ b is the number of open instances of the same drawing in different work
sessions.
■ nnnn is a random number.
These temporary files are automatically deleted when a drawing closes
normally. In the event of a program failure or a power failure, these files are
not deleted.
To recover a previous version of your drawing from the automatically saved
file, rename the file using a .dwg extension in place of the .sv$ extension before
you close the program.
54 | Chapter 3 Start and Save Drawings

See also:
Recover from a System Failure (page 55)
Recover from a System Failure
A hardware problem, power failure, or software problem can cause this program
to terminate unexpectedly. If this happens, you can restore the drawing files
that were open.
Resolve Drawing Files
After a program or system failure, the Files Recovered dialog box opens the
next time you start AutoCAD. The Files Recovered dialog box displays a list
of all drawing files that were open, including the following drawing file types:
■ Drawing files (DWG)
■ Drawing template files (DWT)
NOTE Unsaved drawings that are open at the time of an unexpected failure are
not tracked by the Files Recovered dialog box. Be sure to save your work after you
begin, and regularly thereafter.
For each drawing, you can open and choose from the following files if they
exist:
■ DrawingFileName.dwg
■ DrawingFileName.bak
■ DrawingFileName_a_b_nnnn.sv$
NOTE The drawing, backup, and recover files are listed in the order of their time
stamps—the time when they were last saved.
If you close the Files Recovered dialog box before resolving all affected
drawings, you can re-open the dialog box at a later time with the
DRAWINGRECOVERY command.
Send an Error Report Automatically to Autodesk
If the program encounters a problem and closes unexpectedly, you can send
an error report to help Autodesk diagnose problems with the software. The
error report includes information about the state of your system at the time
the error occurred. You can also add other information, such as what you were
Repair, Restore, or Recover Drawing Files | 55

doing at the time of the error. The REPORTERROR system variable controls
whether the error-reporting feature is available.
56 | Chapter 3 Start and Save Drawings

Control the Drawing
Views
Change Views
You can magnify the details in your drawing for a closer view or shift the view
to a different part of the drawing. If you save views by name, you can restore
them later.
See also:
Rotate Views in Layout Viewports (page 100)
Pan or Zoom a View
You can pan to reposition the view in the drawing area or zoom to change
magnification.
With the Realtime option of PAN, you pan dynamically by moving your pointing
device. Like panning with a camera, PAN does not change the location or
magnification of objects on your drawing; it changes only the view.
You can change the magnification of a view by zooming in and out, which is
similar to zooming in and out with a camera. ZOOM does not change the
absolute size of objects in the drawing; it changes only the magnification of the
view.
When you work with minute parts in your drawing, you may need to zoom out
frequently to see an overview of your work. Use ZOOM Previous to return quickly
to the prior view.
The options described here are the options most commonly used.
4
57
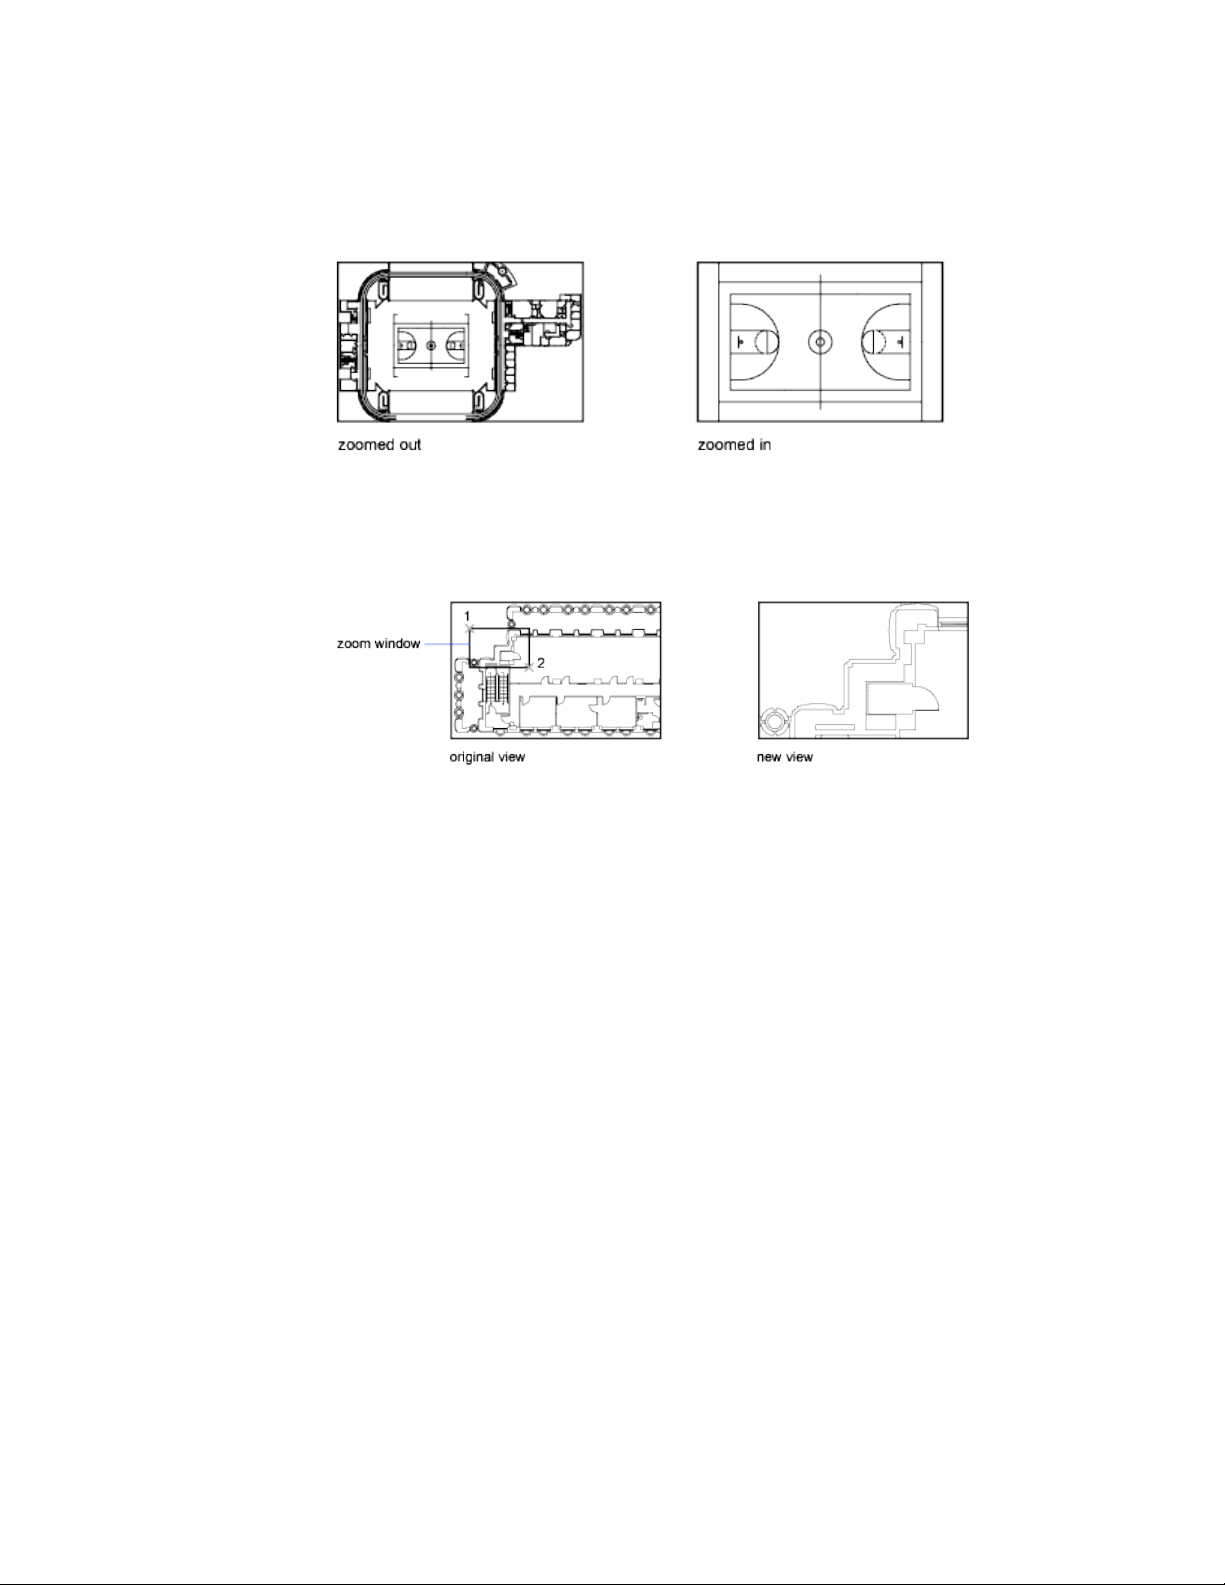
Zoom to Magnify a Specified Rectangular Area
You can quickly zoom on a rectangular area of your drawing by specifying
two diagonal corners of the area you are interested in.
The lower-left corner of the area you specify becomes the lower-left corner of
the new display. The shape of the zoom area you specify does not correspond
exactly to the new view, which must fit the shape of the viewport.
Zoom in Real Time
With the Realtime option, you zoom dynamically by moving your pointing
device up or down. By right-clicking, you can display a shortcut menu with
additional viewing options.
Zoom to Magnify One or More Objects
ZOOM Objects displays a view with the largest possible magnification that
includes all of the objects you selected.
Zoom to View All Objects in the Drawing
ZOOM Extents displays a view with the largest possible magnification that
includes all of the objects in the drawing. This view includes objects on layers
that are turned off but does not include objects on frozen layers.
58 | Chapter 4 Control the Drawing Views
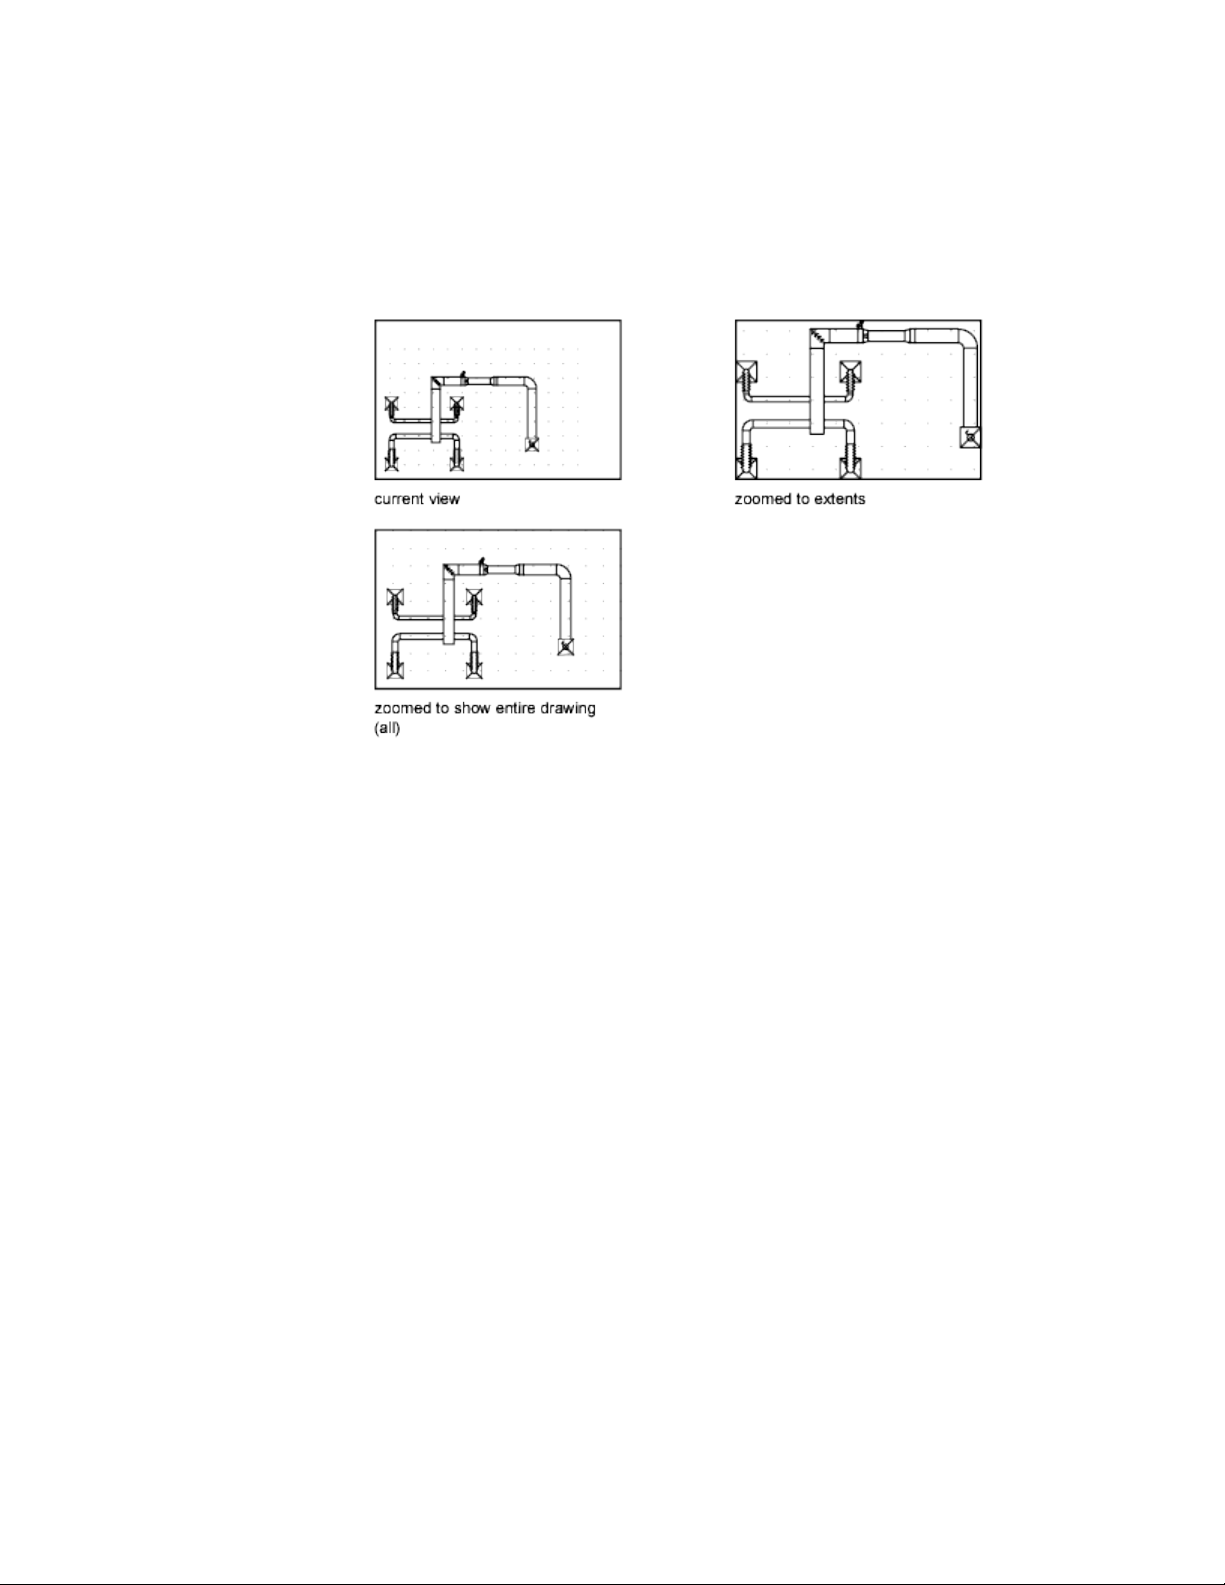
ZOOM All displays either the user-defined grid limits or the drawing extents,
whichever view is larger.
See also:
Scale Views in Layout Viewports (page 95)
Save and Restore Views
When you save specific views by name, you can restore them for layout and
plotting or when you need to refer to specific details.
A named view created with the VIEW command consists of a specific
magnification, position, and orientation. In each drawing session, you can
restore up to 10 previous views displayed in each viewport using ZOOM
Previous.
Named views are saved with a drawing and can be used any time. When you
are composing a layout, you can restore a named view to a viewport on the
layout.
Change Views | 59

Save a View
When you name and save a view, the following settings are saved:
■ Magnification, center point, and view direction
■ View category that you assign to the view (optional)
■ The location of the view (the Model or a specific named layout)
■ Layer visibility in the drawing at the time the view is saved
■ User coordinate system
■ 3D perspective
■ Live section
■ Visual style
■ Background
Restore a Named View
You can use named views to do the following:
■ Restore a view that you use frequently while working in model space.
■ Restore a view on a layout that is zoomed into an area of interest on the
layout.
■ With multiple model or layout viewports, restore a different view in each
one.
Control the 3D Projection Style
You can view both parallel and perspective projection of a 3D model.
Overview of Parallel and Perspective Views
You can create realistic visual effects in a drawing by defining either parallel
or perspective projections of a model.
The difference between perspective views and parallel projections is that
perspective views require a distance between a theoretical camera and target
point. Small distances produce severe perspective effects; large distances
produce mild effects.
60 | Chapter 4 Control the Drawing Views
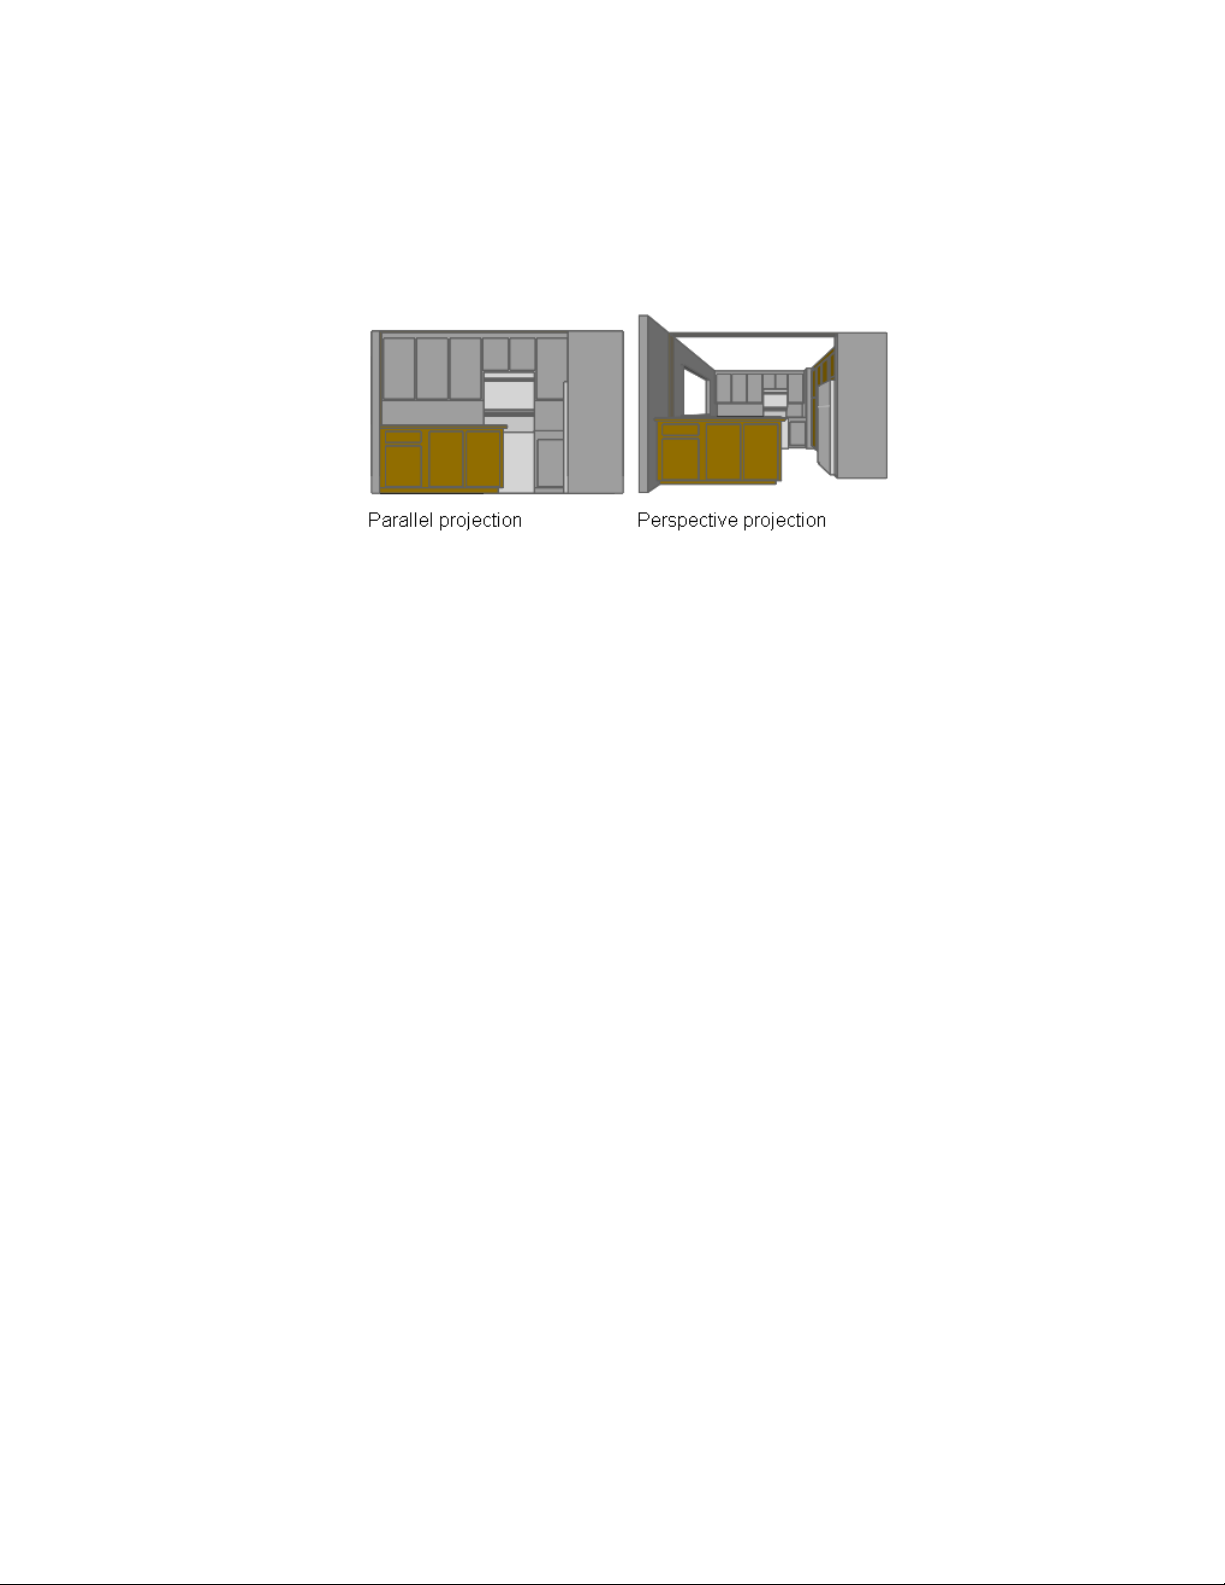
The following illustration shows the same model in both a parallel projection
and perspective projection. Both are based on the same viewing direction.
Define a Perspective Projection (DVIEW)
Perspective projections require a distance between a theoretical camera and
a target point. Small distances produce severe perspective effects; large distances
produce milder effects.
A perspective view remains in effect until the perspective effect is turned off
or until a new view is defined in its place.
Define a Parallel Projection
You can define a parallel projection.
To determine the point or angle in model space, you can
■ Enter a coordinate or angles that represent your viewing location in 3D.
■ Change to a view of the XY plane of the current UCS, a saved UCS, or the
WCS.
■ Change the 3D view dynamically with your pointing device.
■ Set front and back clipping planes to limit the objects being displayed.
Viewing in 3D is available only in model space. If you are working in paper
space, you cannot use 3D viewing commands such as VPOINT, DVIEW, or
PLAN to define paper space views. The view in paper space is always a plan
view.
Change Views | 61
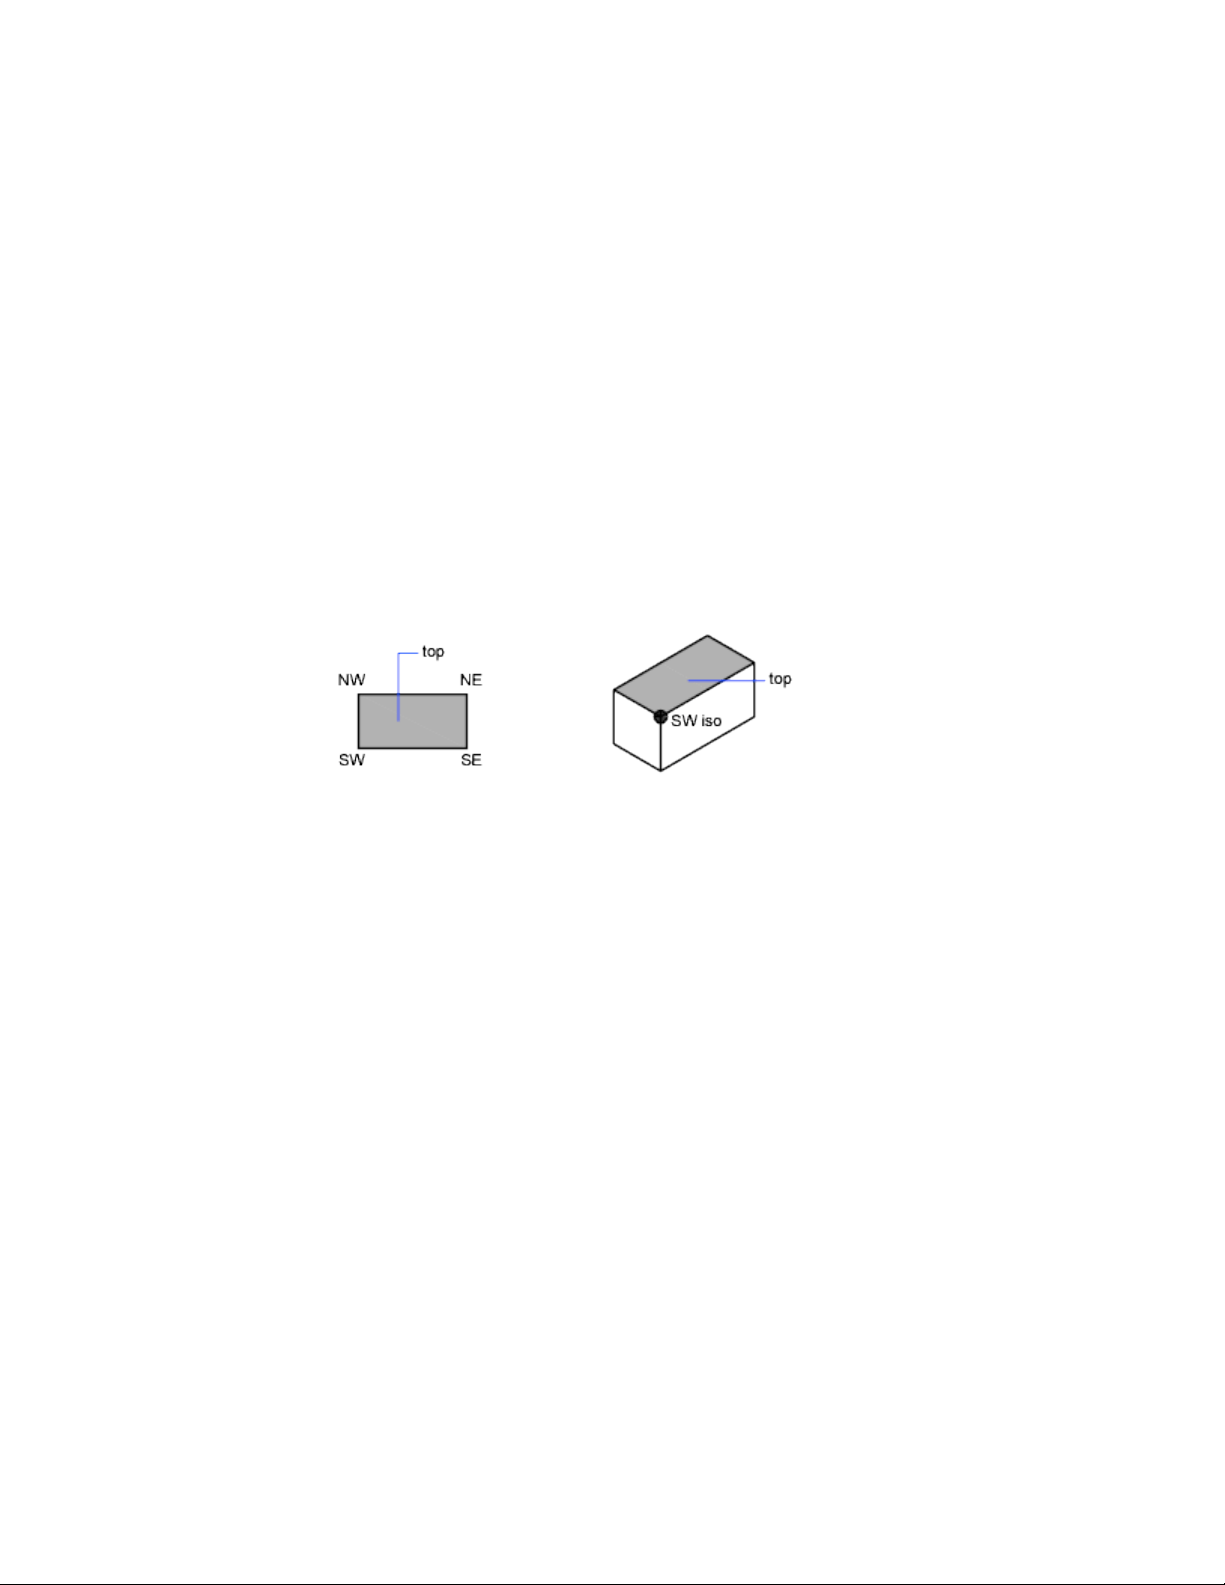
Choose Preset 3D Views
You can select predefined standard orthographic and isometric views by name
or description.
A quick way to set a view is to choose one of the predefined 3D views. You
can select predefined standard orthographic and isometric views by name or
description. These views represent commonly used options: Top, Bottom,
Front, Left, Right, and Back. In addition, you can set views from isometric
options: SW (southwest) Isometric, SE (southeast) Isometric, NE (northeast)
Isometric, and NW (northwest) Isometric.
To understand how the isometric views work, imagine you are looking down
at the top of a box. If you move toward the lower-left corner of the box, you
are viewing the box from the SW Isometric View. If you move toward the
upper-right corner of the box, you are viewing it from NE Isometric View.
Define a 3D View with Coordinate Values or Angles
You can define a viewing direction by entering the coordinate values of a
point or the measures of two angles of rotation.
This point represents your position in 3D space as you view the model while
looking toward the origin (0,0,0). Viewpoint coordinate values are relative to
the world coordinate system unless you change the WORLDVIEW system
variable. The conventions for defining standard views differ between
architectural (AEC) and mechanical design. In AEC design, the perpendicular
view of the XY plane is the top or plan view; in mechanical design, the
perpendicular view of the XY plane is the front view.
The following illustration shows a view defined by two angles relative to the
X axis and the XY plane of the WCS.
62 | Chapter 4 Control the Drawing Views
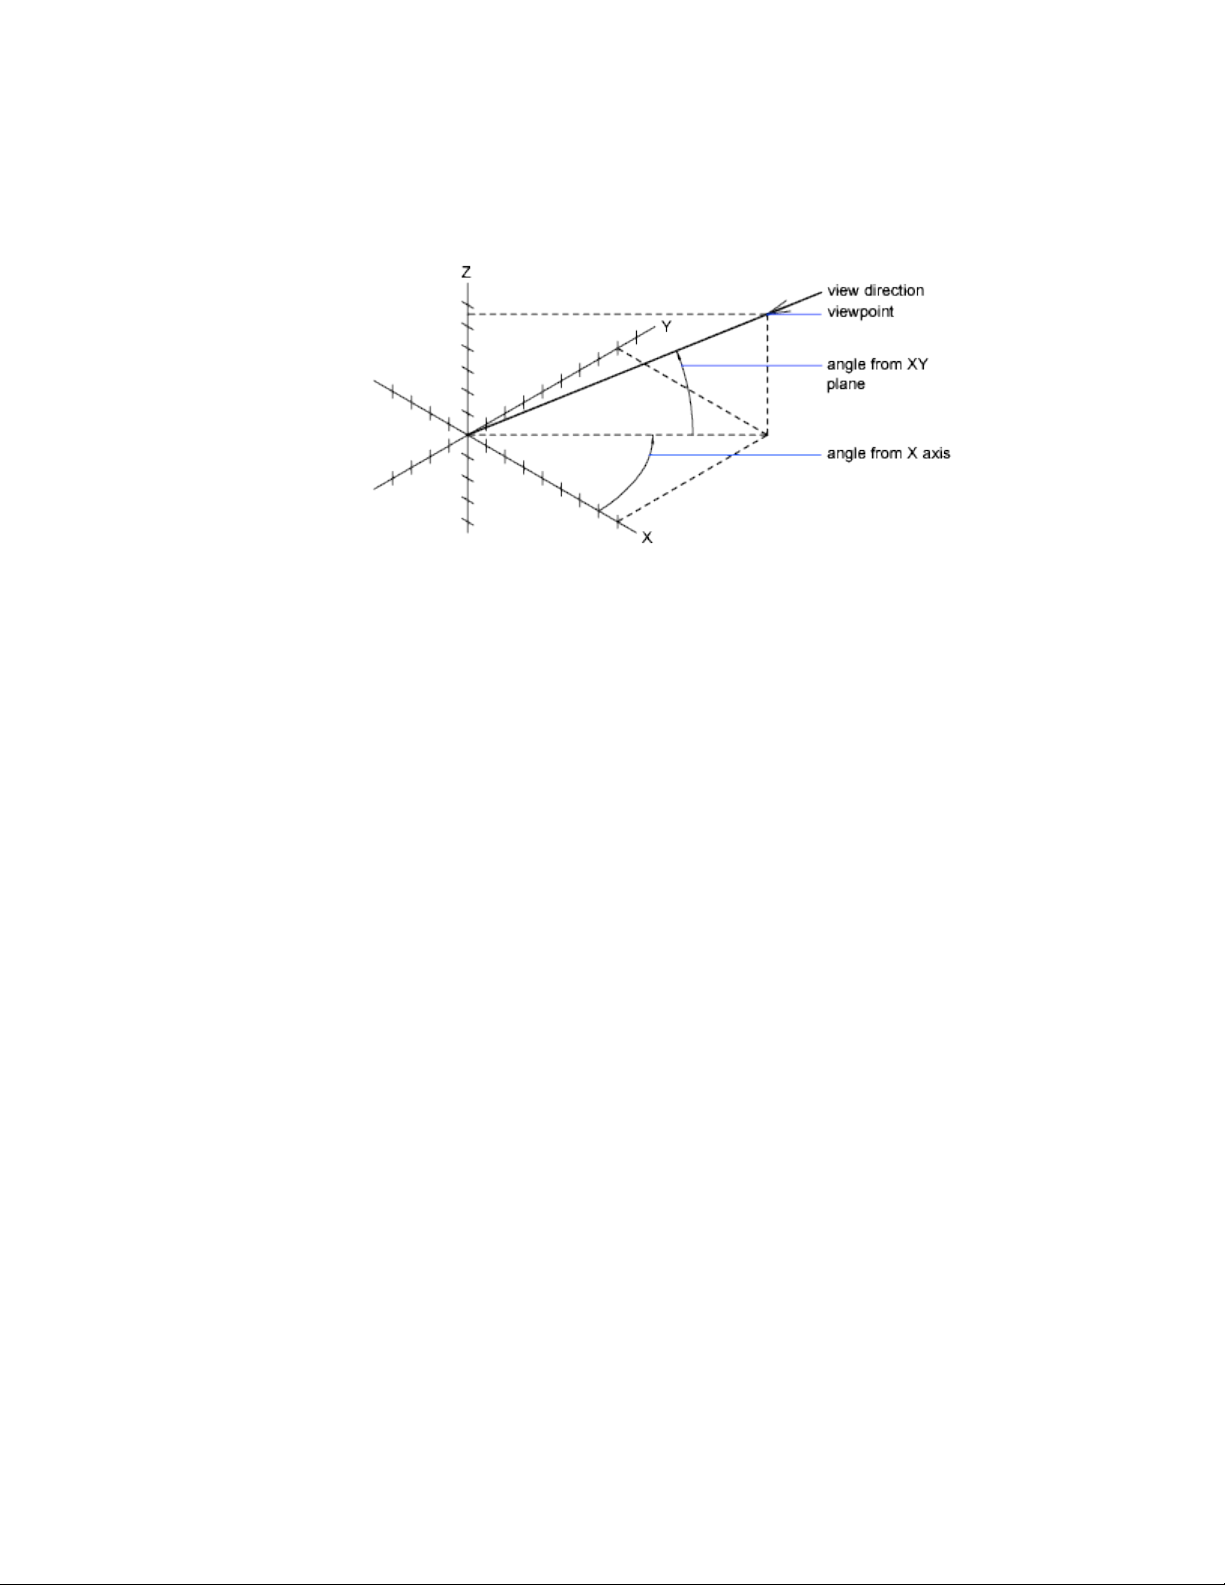
Change to a View of the XY Plane
You can change the current viewpoint to a plan view of the current UCS, a
previously saved UCS, or the WCS.
A plan view is a view aimed toward the origin (0,0,0) from a point on the
positive Z axis. This results in a view of the XY plane.
You can restore the view and coordinate system that is the default for most
drawings by setting the UCS orientation to World and then setting the 3D
view to Plan View.
Shade a Model and Use Edge Effects
Hiding lines enhances the drawing and clarifies the design. The addition of
shading produces a more realistic image of your model.
Use a Visual Style to Display Your Model
Visual styles control the display of edges and shading a viewport.
Control the effect of a visual style by changing its properties. When you apply
a visual style or change its settings, the associated viewport is automatically
updated to reflect those changes.
The Properties Inspector displays all visual styles available in the drawing
under the Visual Styles section.
Change Views | 63
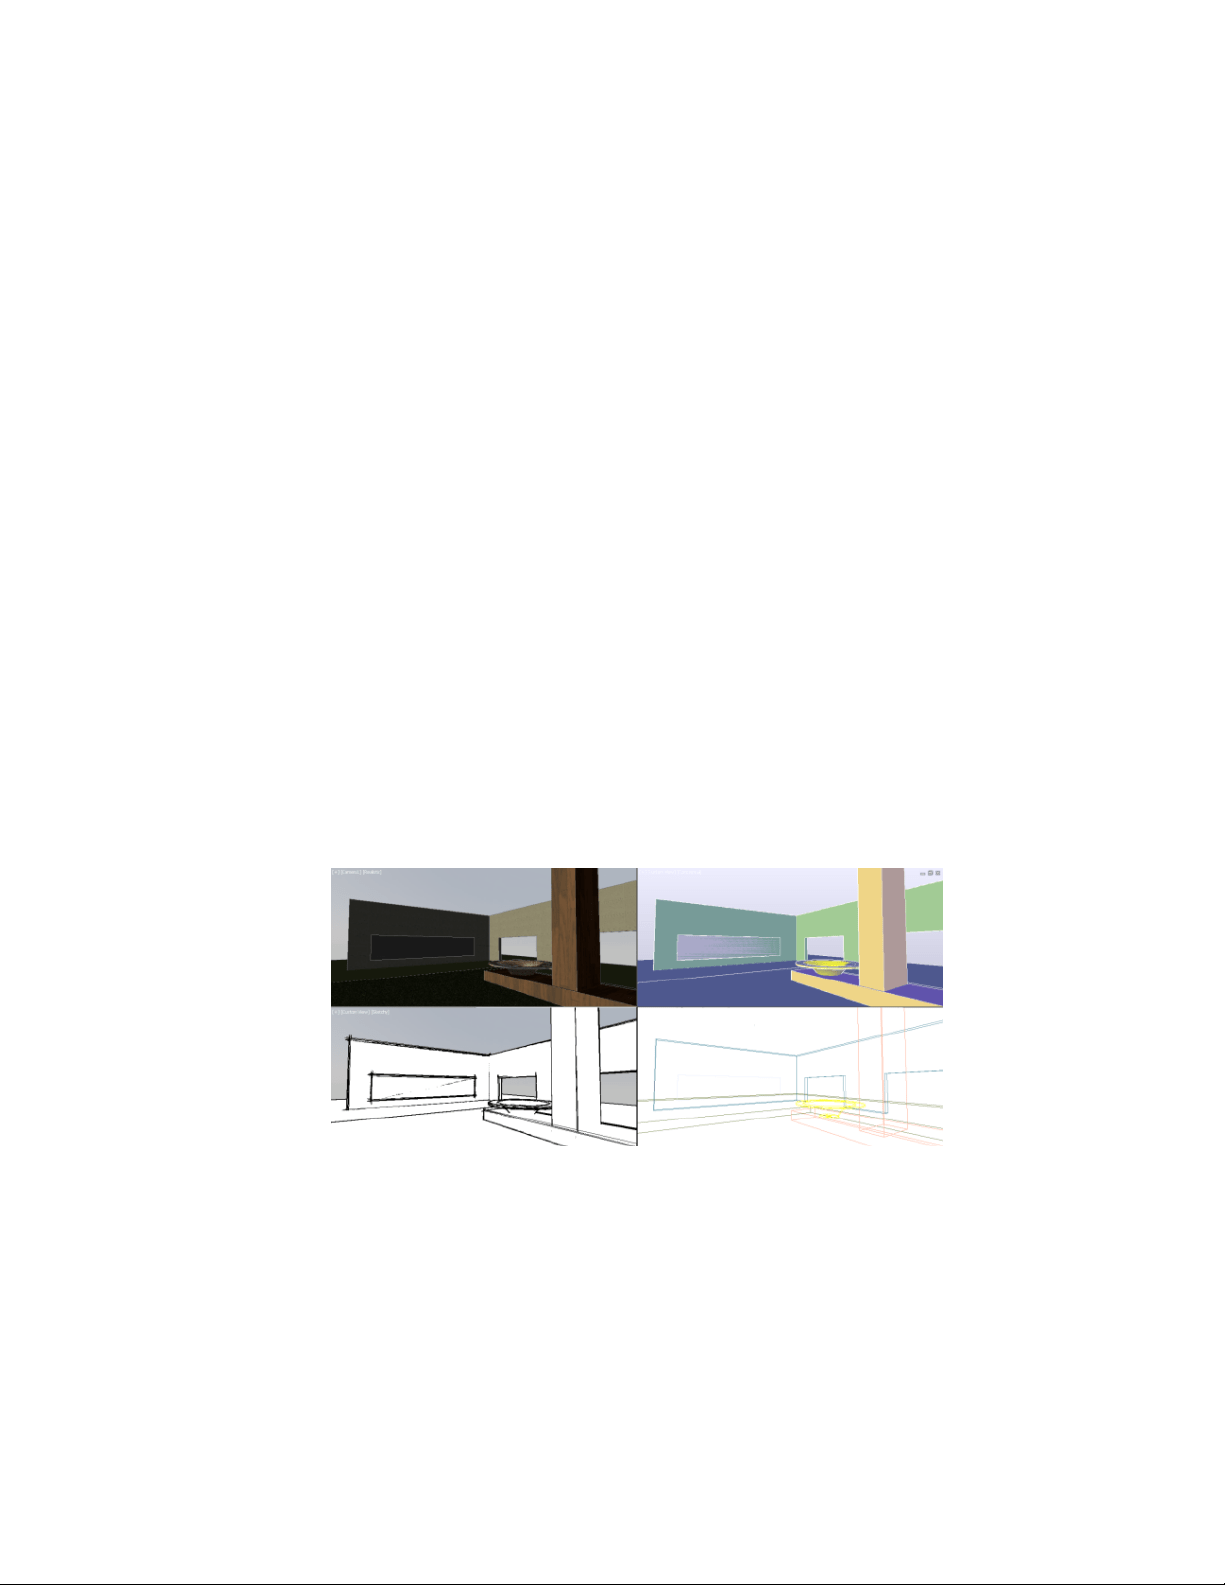
The following predefined visual styles are supplied with the product:
■ 2D Wireframe. Displays objects using lines and curves to represent the
boundaries.
NOTE Raster images, linetypes, and lineweights are visible.
■ Conceptual. Displays objects using smooth shading and the Gooch face
style. The Gooch face style transitions between cool and warm colors,
rather than dark and light. The effect is less realistic, but it can make the
details of the model easier to see.
■ Hidden. Displays objects using wireframe representation and hides lines
representing back faces.
■ Realistic. Displays objects using smooth shading and materials.
■ Shaded. Displays objects using smooth shading.
■ Shaded with Edges. Displays objects using smooth shading and visible
edges.
■ Shades of Gray. Displays objects using smooth shading and
monochromatic shades of gray.
■ Sketchy. Displays objects with a hand-sketched effect by using the Line
Extensions and Jitter edge modifiers.
■ Wireframe. Displays objects using lines and curves to represent the
boundaries.
■ X-ray. Displays objects with partial transparency.
In shaded visual styles, faces are lit by two distant light sources that follow
the viewpoint as you move around the model. This default lighting is designed
to illuminate all faces in the model so that they are visually discernable. Default
lighting is available only when other lights, including the sun, are off.
64 | Chapter 4 Control the Drawing Views
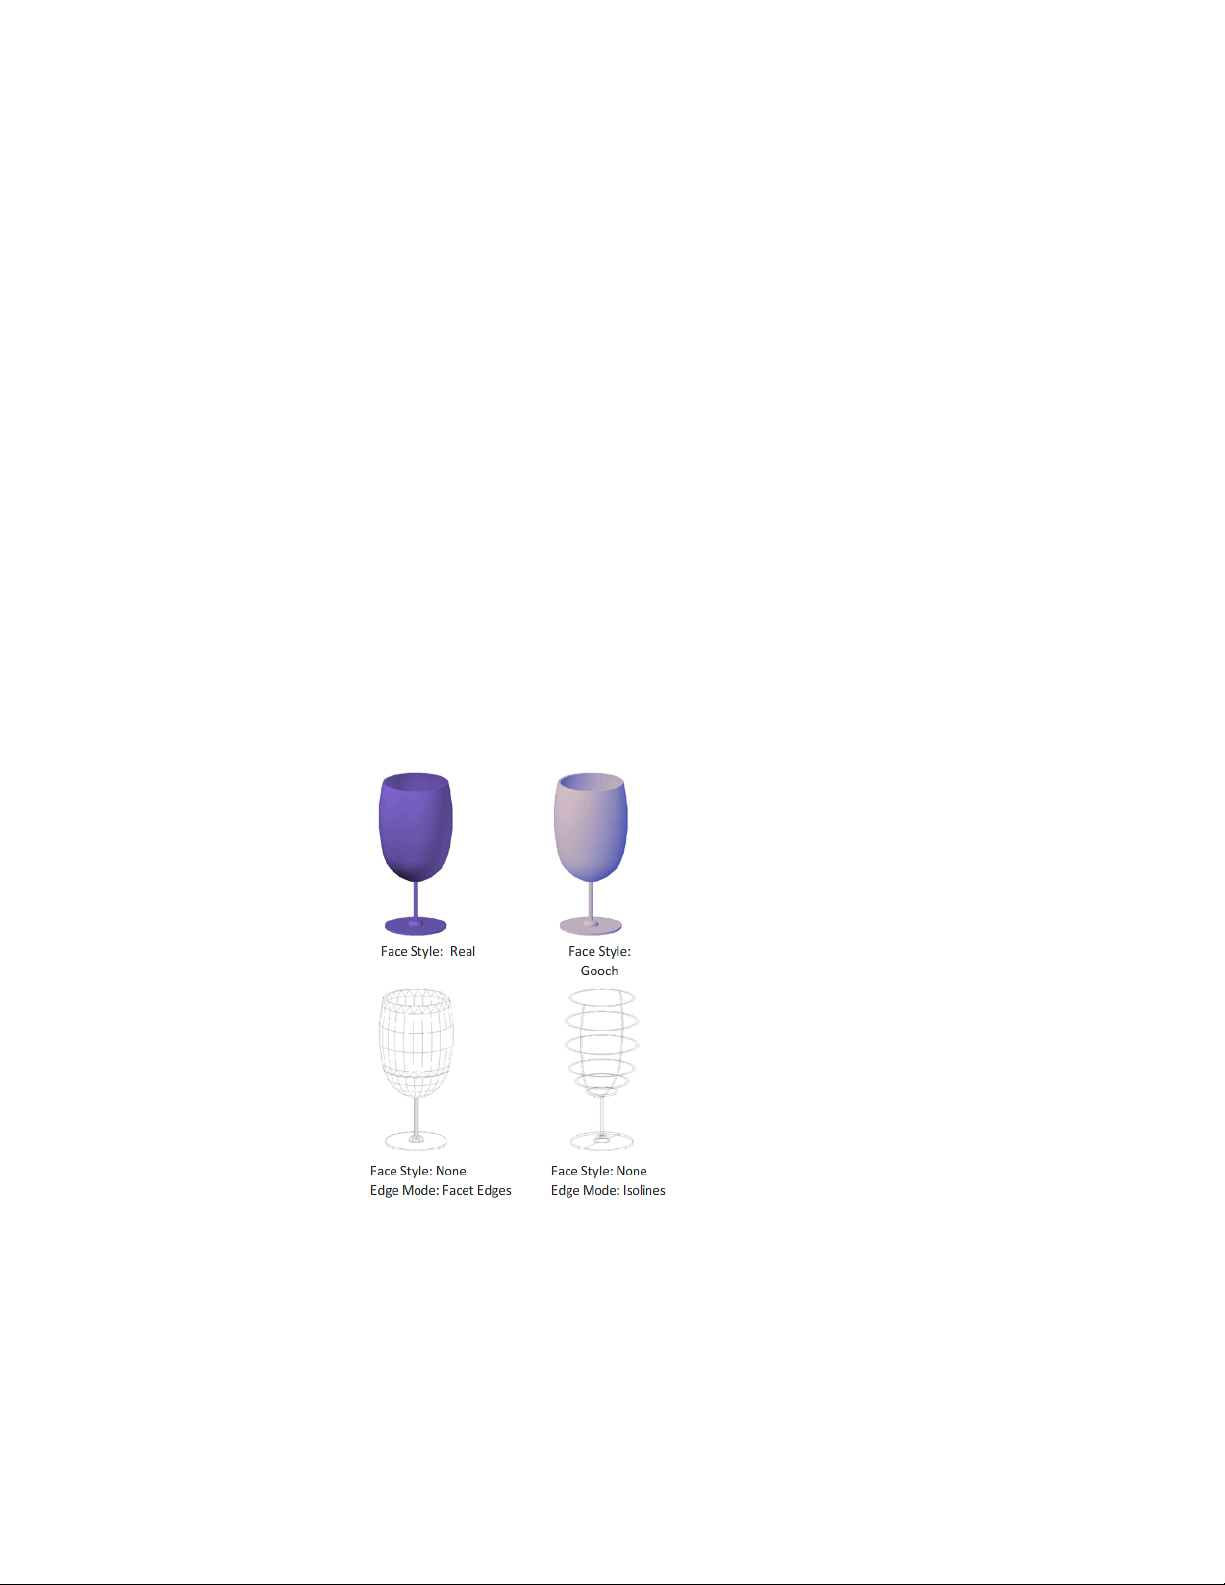
Select a visual style and change its settings at any time. The changes are
reflected in the viewports to which the visual style is applied. Any changes
you make to the current visual style are saved in the drawing.
Customize a Visual Style
You can create your own visual styles by changing the face and edge settings
and using shadows and backgrounds.
Shade and Color Faces
Shading and color effects control the display of faces in a model.
Face Styles
The face style defines the shading on a face. Realistic (below left) is meant to
produce the effect of realism. Gooch (below right) can show details better by
softening the contrast between lit areas and shadowed areas. Lit areas use
warm tones and shadowed areas use cool tones.
Change Views | 65
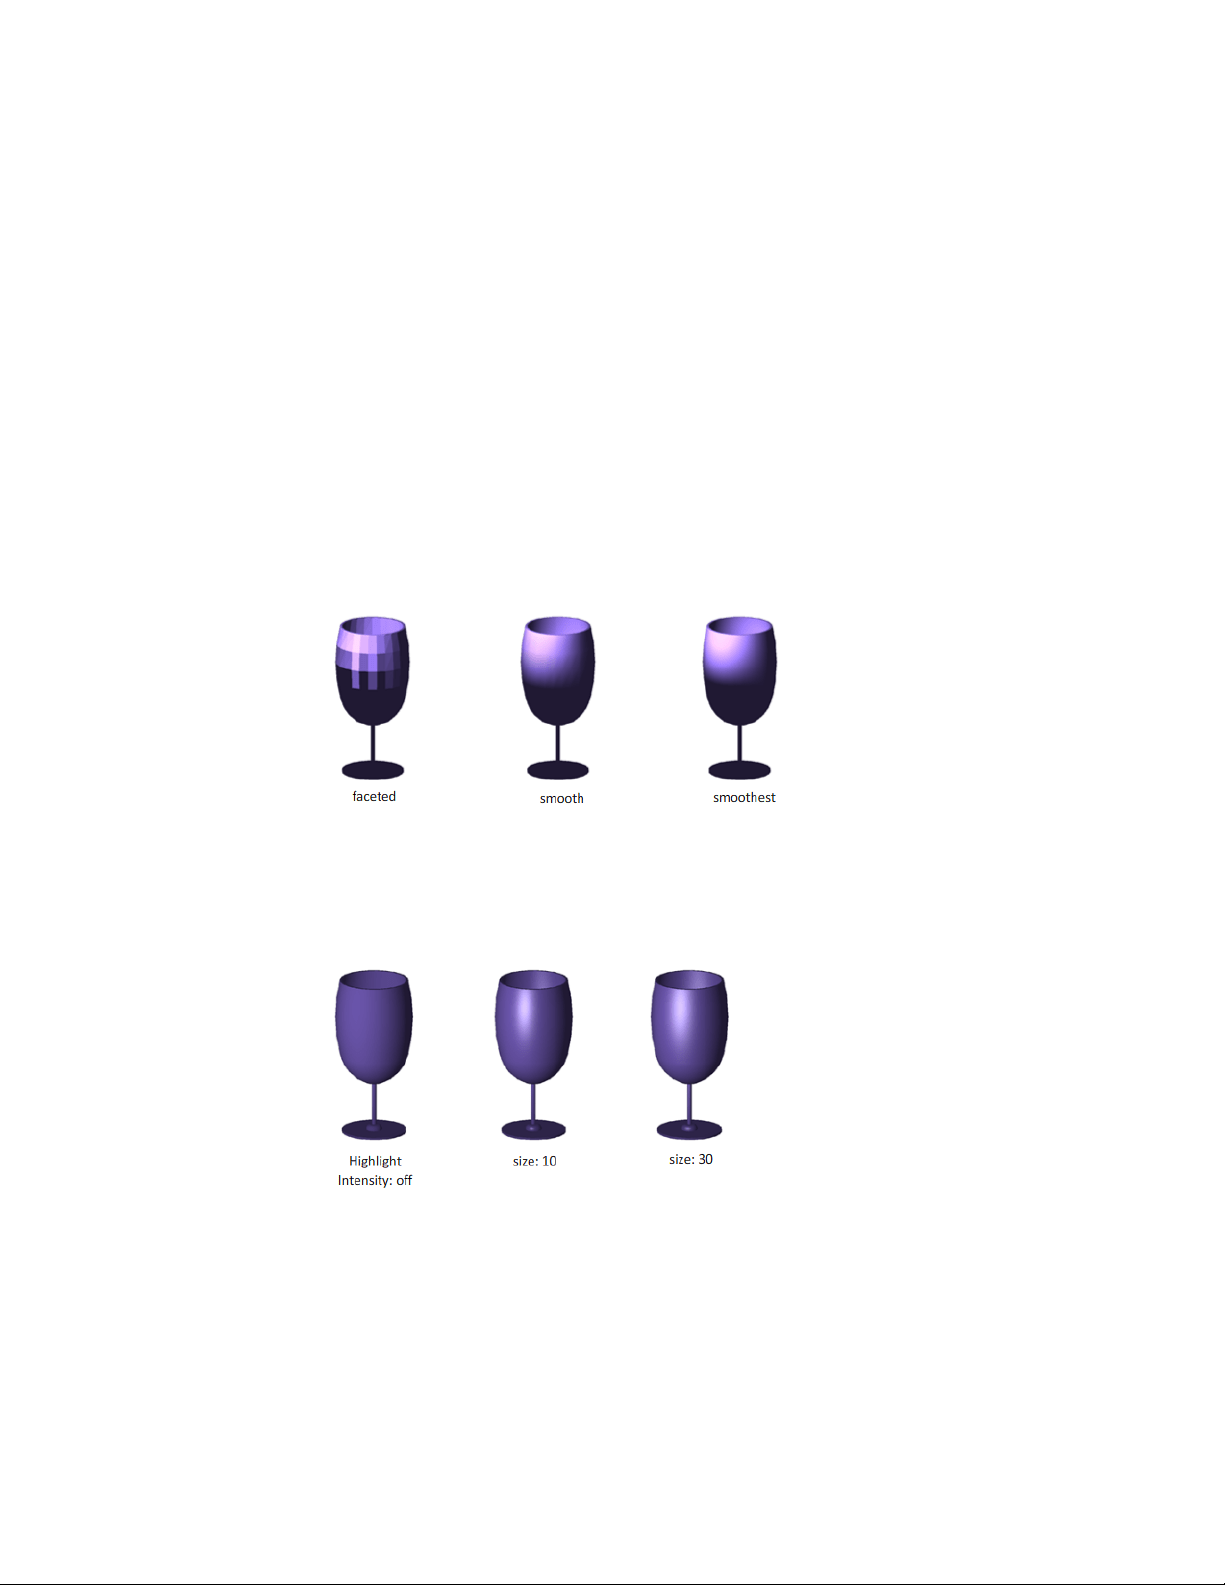
The None face style produces no shading, and displays only edges. Customize
edge settings to control whether facet edges or isolines are displayed.
Lighting Quality
Lighting quality determines the smoothness of shaded objects.
Faceted lighting computes a single color for each face. Individual faces appear
flat. Smooth lighting smoothes the edges between polygon faces by computing
the colors as a gradient between the faces’ vertices. This gives objects a smooth
appearance.
For the Smoothest option, the Per-Pixel Lighting setting must be enabled
under the Hardware acceleration option of -3DCONFIG. The colors are
computed for individual pixels, giving a smoother appearance. If not, the
Smooth setting is used instead.
Highlights
The size of an object’ s highlights affect the perception of shininess. A smaller,
more intense highlight makes objects appear shinier. The highlight intensity
that is set in a visual style does not apply to objects with attached materials.
66 | Chapter 4 Control the Drawing Views
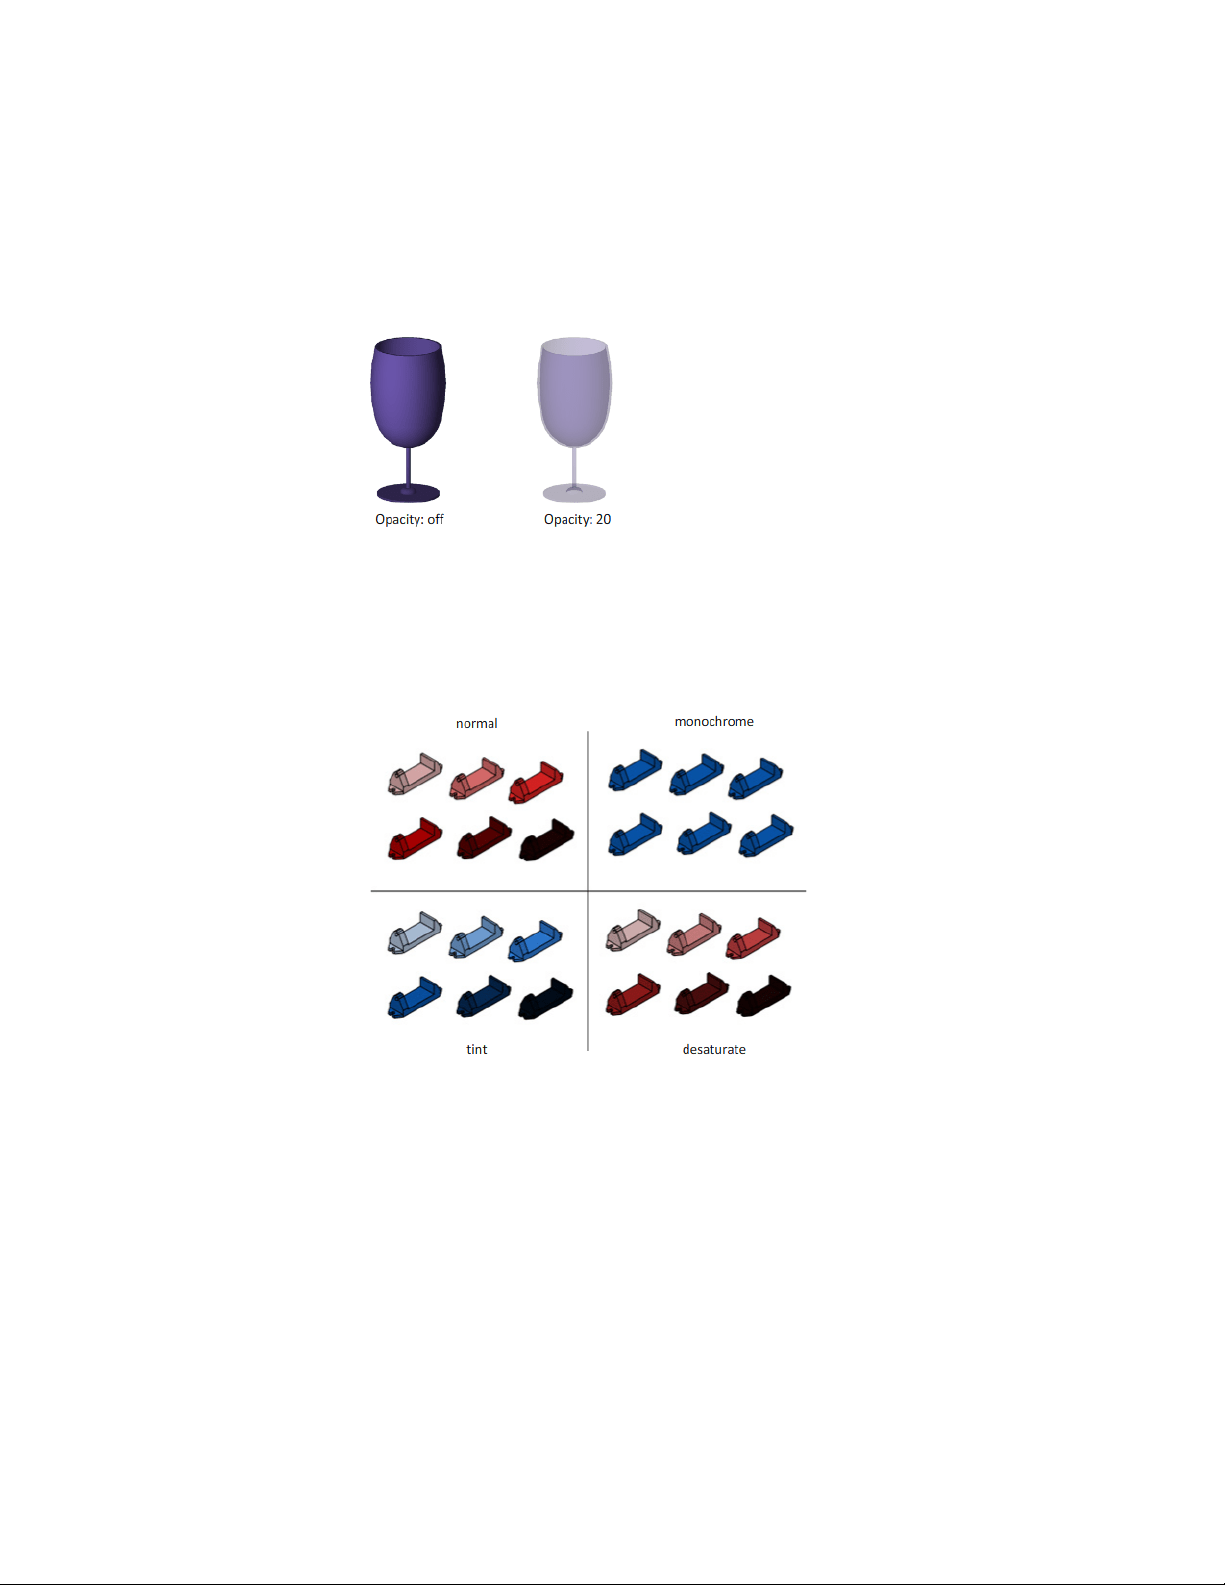
Opacity
The opacity property controls the transparency of objects.
Face Color Modes
Display face colors in the normal way, or specify a face color mode.
Monochrome displays faces in the varying shades of a specified color. Tint
shades faces by changing the hue and saturation values based on a specified
color. Desaturate softens colors.
Display Backgrounds and Shadows
The visual style also controls the display of backgrounds and shadows in the
viewport.
Change Views | 67

Backgrounds
You can use a color, a gradient fill, an image, or the sun & sky as a background
in the viewport in any 3D visual style, even one that does not shade objects.
When Background is set to On in the current visual style, the background is
displayed.
NOTE
AutoCAD 2013 does not support the ability to create a named view with a
background or assign a background to the current view. If a background is
assigned to the current view or a named view, it does display in the current
viewport.
Shadows
Shaded objects in a viewport can display shadows. Ground shadows are
shadows that objects cast on the ground. Mapped object shadows are shadows
cast by objects onto other objects. The lighting in the viewport must be from
user-created lights or the sun for mapped object shadows to be displayed.
Where shadows overlap, they appear darker.
NOTE To display mapped object shadows, hardware acceleration is required.
When Enhanced 3D Performance is off, mapped object shadows cannot be
displayed. (To access these settings, enter -3dconfig at the Command prompt.
Use options acceLeration and then Hardware to get to the Enhanced 3D
performance option.)
Displaying shadows can slow performance. You can turn off shadows in the
current visual style while you work and turn them back on when you need
them.
In the Properties Inspector, you can set the Shadow Display property for an
object: casts shadows, receives shadows, casts and receives shadows, or ignores
shadows.
More options are available for shadows used in rendering.
68 | Chapter 4 Control the Drawing Views
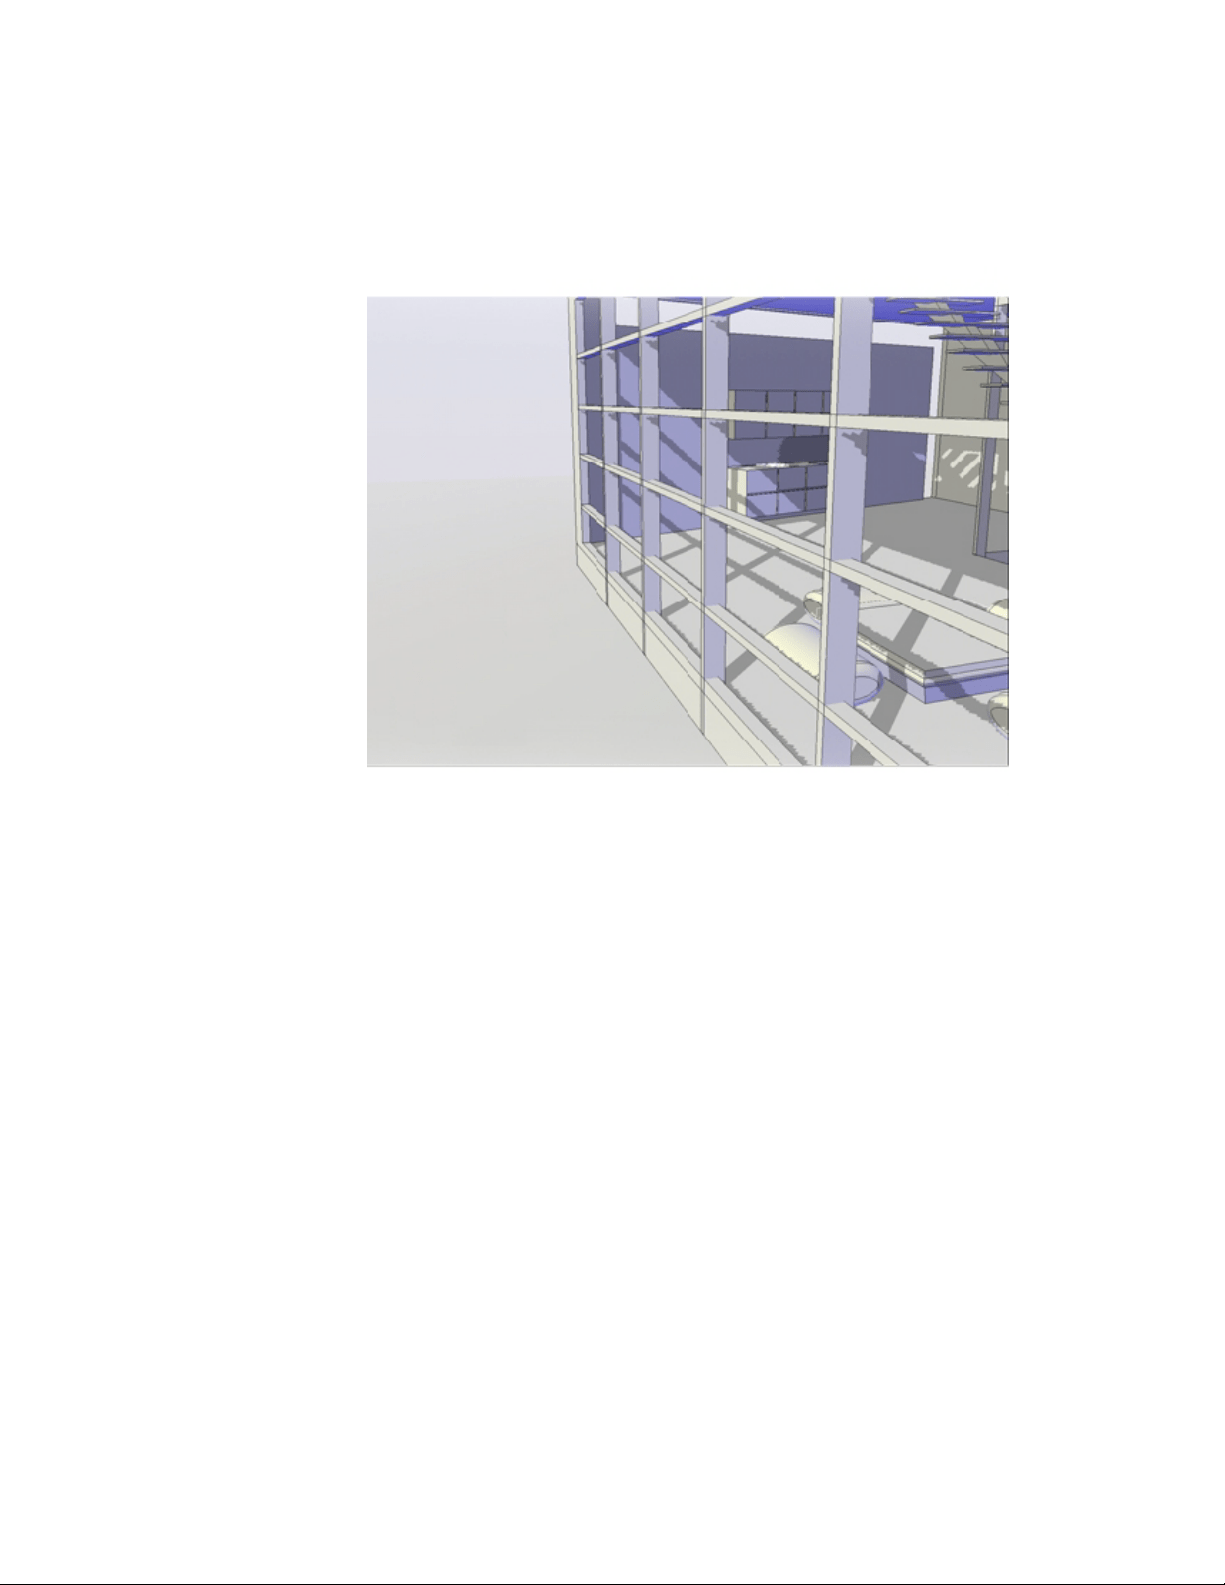
See also:
Overview of Lighting (page 713)
Control the Display of Edges
Different edge types can be displayed using different colors and linetypes. You
can also add special effects, such as jitter and line extensions.
In a shaded or wireframe model, the visual style sets the visibility and
appearance of isolines, facet edges, silhouette edges, occluded edges, and
intersection edges. Facet edges (the edges between planar faces representing
a surface) are displayed only when the angle between the facets is smaller than
the crease angle value you specify.
Edge modifiers such as line extension and jitter, produce the appearance of a
model that is still in the conceptual phase. Jitter makes lines appear as though
Change Views | 69
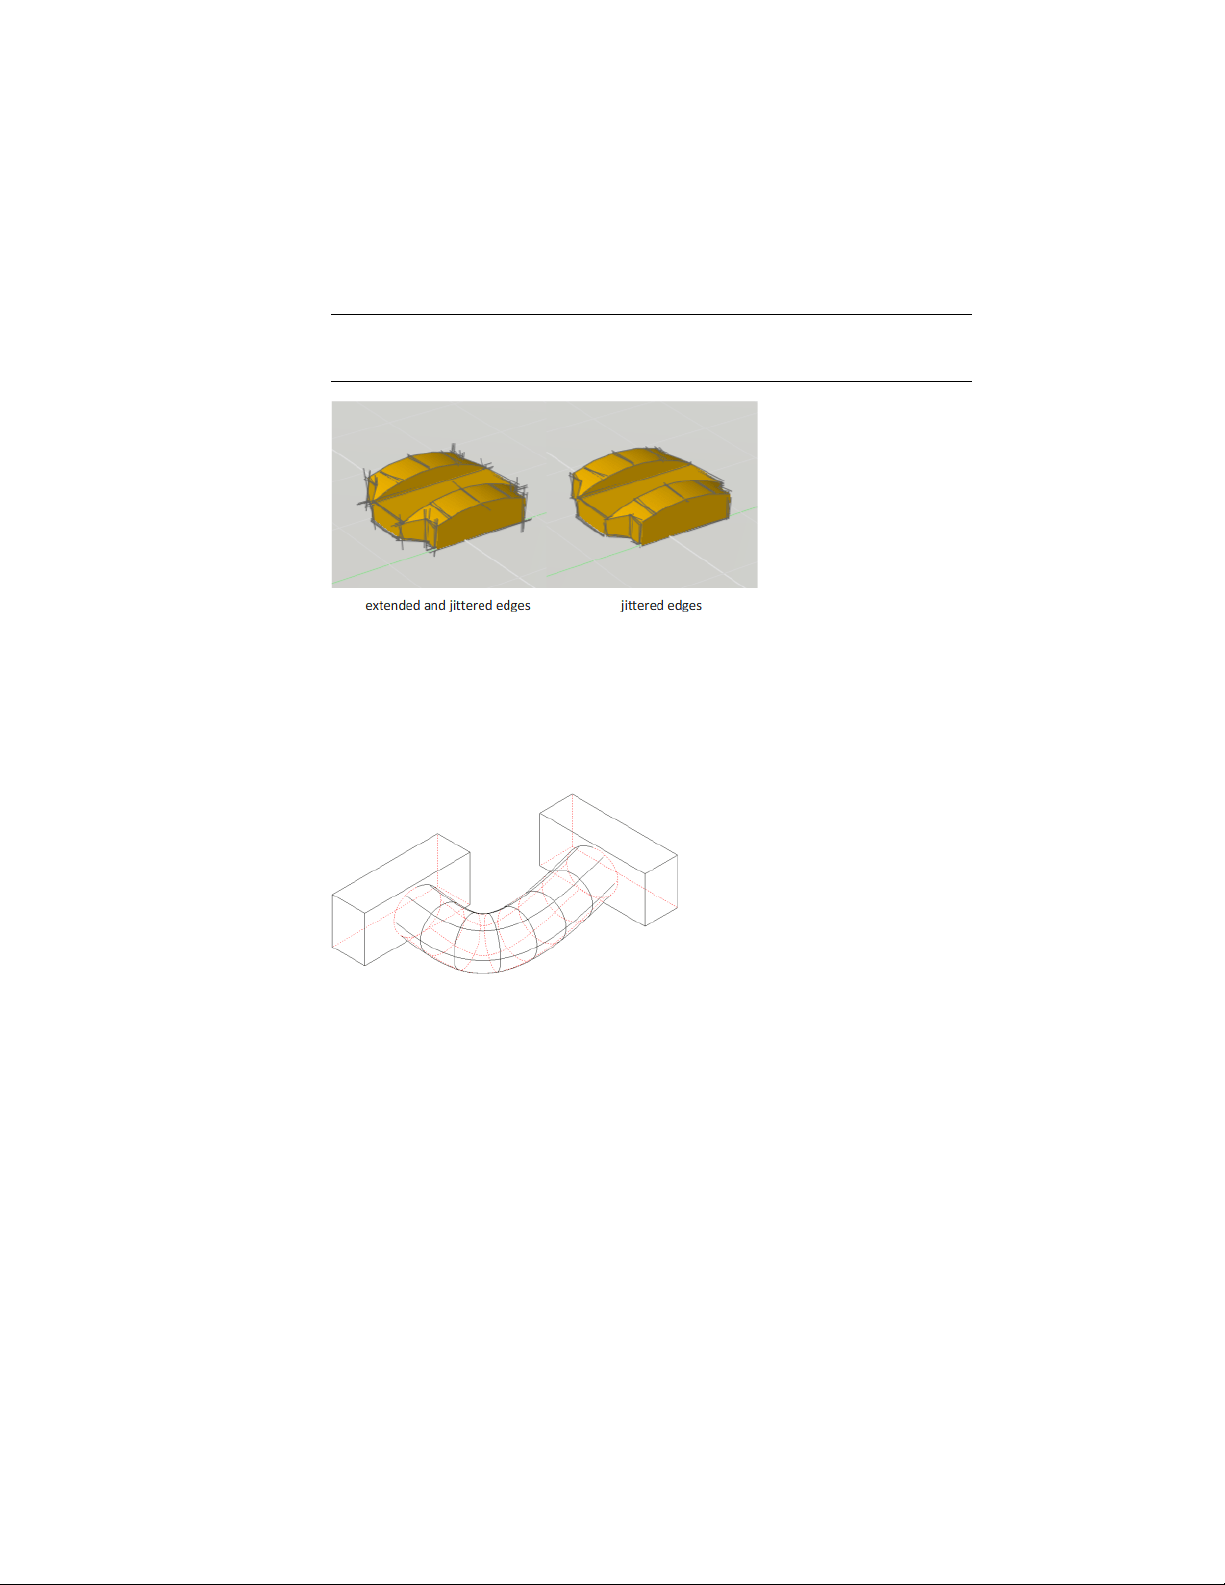
they were sketched with a pencil. Line extension produces another kind of
hand-drawn effect.
NOTE
Plot styles are not available for objects with the Jitter edge modifier applied.
Control the display of occluded lines in 2D View
Occluded lines are hidden lines made visible by changing its linetype and
color. In 2D View, you can change the display of occluded linetype with
OBSCUREDLTYPE system variable and occluded color with OBSCUREDCOLOR
system variable.
To control the display of occluded lines in 2D View, you can:
■ Hide them or make them partially visible with dashes and dots.
■ Make them completely visible.
■ Make them distinctive or indistinctive by changing its color.
NOTE
You can only change occluded color when the occluded lines are partially
or completely visible.
70 | Chapter 4 Control the Drawing Views

IMPORTANT After you have changed the settings for occluded lines, use the HIDE
command to regenerate the drawing and display the changes.
Control Performance
3D graphics display and memory allocation can slow performance on your
system. Performance and memory tuning are different approaches to delivering
the best performance possible.
Performance Tuning
Performance tuning examines your graphics card and display driver and
determines whether to use software or hardware implementation for features
that support both.
Features that cannot work properly on your system are turned off. Some
features may work but not be recommended for use with your graphics card
or 3D graphics display driver. Enable these features at your own risk. For
information on the options available, see -3DCONFIG.
Graphics Caching
Graphics cache files are created and maintained to optimize performance and
increase the regeneration speed of objects with complex geometry such as 3D
solids, non-mesh surfaces, and regions. These cache files persist between
drawing sessions and are saved in /Users/<user name>/Library/Application
Support/Autodesk/local/<product name>/<release>/<language>/GraphicsCache. The
maximum number of these cache files are limited in number and total size
by the CACHEMAXFILES and CACHEMAXTOTALSIZE system variables. If the
limits are exceeded, the oldest cache files are automatically deleted.
NOTE If you ever need to delete the graphics cache files, you can temporarily set
CACHEMAXFILES or CACHEMAXTOTALSIZE to 0.
Memory Tuning
Performance can also be improved by adding memory to your system. This is
especially true when working on larger models.
Change Views | 71

AutoCAD requires at least 2 GB of physical memory (RAM) for working in 2D.
For 3D modeling, at least 4 GB of RAM is required.
The size and complexity of a model often defines how efficiently an application
runs. If you notice increased hard drive activity, it means that physical memory
has been exceeded and data is being passed to a swap file (virtual memory).
A swap file is an area on the hard drive that the operating system uses as if it
were physical memory (RAM). The swap file size is basically a limit which
restricts the total virtual size of the AutoCAD process. A good rule of thumb
for configuring your swap file is three times the amount of physical memory
on your system. This usually sets the limit high enough that AutoCAD does
not run out of swap space.
Graphics cache files are created and maintained to optimize performance and
increase the regeneration speed of objects with complex geometry such as 3D
solids, non-mesh surfaces, and regions. These cache files persist between
drawing sessions and are saved in /Users/<user name>/Library/Application
Support/Autodesk/local/<product name>/<release>/<language>/GraphicsCache. The
maximum number of these cache files are limited in number and total size
by the CACHEMAXFILES and CACHEMAXTOTALSIZE system variables. If the
limits are exceeded, the oldest cache files are automatically deleted.
NOTE If you ever need to delete the graphics cache files, you can temporarily set
CACHEMAXFILES or CACHEMAXTOTALSIZE to 0.
See also:
Performance Tuning (page 71)
Use a Visual Style to Display Your Model (page 63)
Use Viewing Tools
When working in 3D, you'll often want to display different views so that you
can see and verify the 3D effects in your drawing.
Specify 3D Views
You can control the 3D navigation display, projection, and visualization tools.
72 | Chapter 4 Control the Drawing Views

Overview of 3D Views
You can create an interactive view of your drawing in the current viewport.
Using the 3D viewing and navigation tools, you can navigate through a
drawing. You can orbit, zoom, and swivel around a 3D model.
Use 3D Navigation Tools
3D navigation tools allow you to view objects in a drawing from different
angles, heights, and distances.
Use the following 3D tools to orbit, swivel, adjust distance, zoom, and pan in
a 3D view.
■ 3D Orbit. Moves around a target. The target of the view stays stationary
while the camera location, or point of view, moves. The center of the
viewport, not the center of the objects you’re viewing, is the target point.
■ Constrained Orbit. Constrains 3D Orbit along the XY plane or the Z
axis. (3DORBIT)
■ Free Orbit. Orbits in any direction without reference to the planes. The
point of view is not constrained along the XY plane of the Z axis.
(3DFORBIT)
■ Adjust Distance. Changes the distance of objects as you move the cursor
vertically. You can make objects appear larger or smaller, and you can
adjust the distance. (3DDISTANCE)
■ Swivel. Simulates panning with a camera in the direction that you drag.
The target of the view changes. You can swivel the view along the XY plane
or along the Z axis. (3DSWIVEL)
■ Zoom. Simulates moving the camera closer to an object or farther away.
Zooming in magnifies the image. (3DZOOM)
■ Pan. Starts the interactive 3D view and enables you to drag the view
horizontally and vertically. (3DPAN)
Create a 3D Dynamic View (DVIEW)
You can change a view without interrupting your current operation using a
feature that combines panning and zooming.
Use Viewing Tools | 73
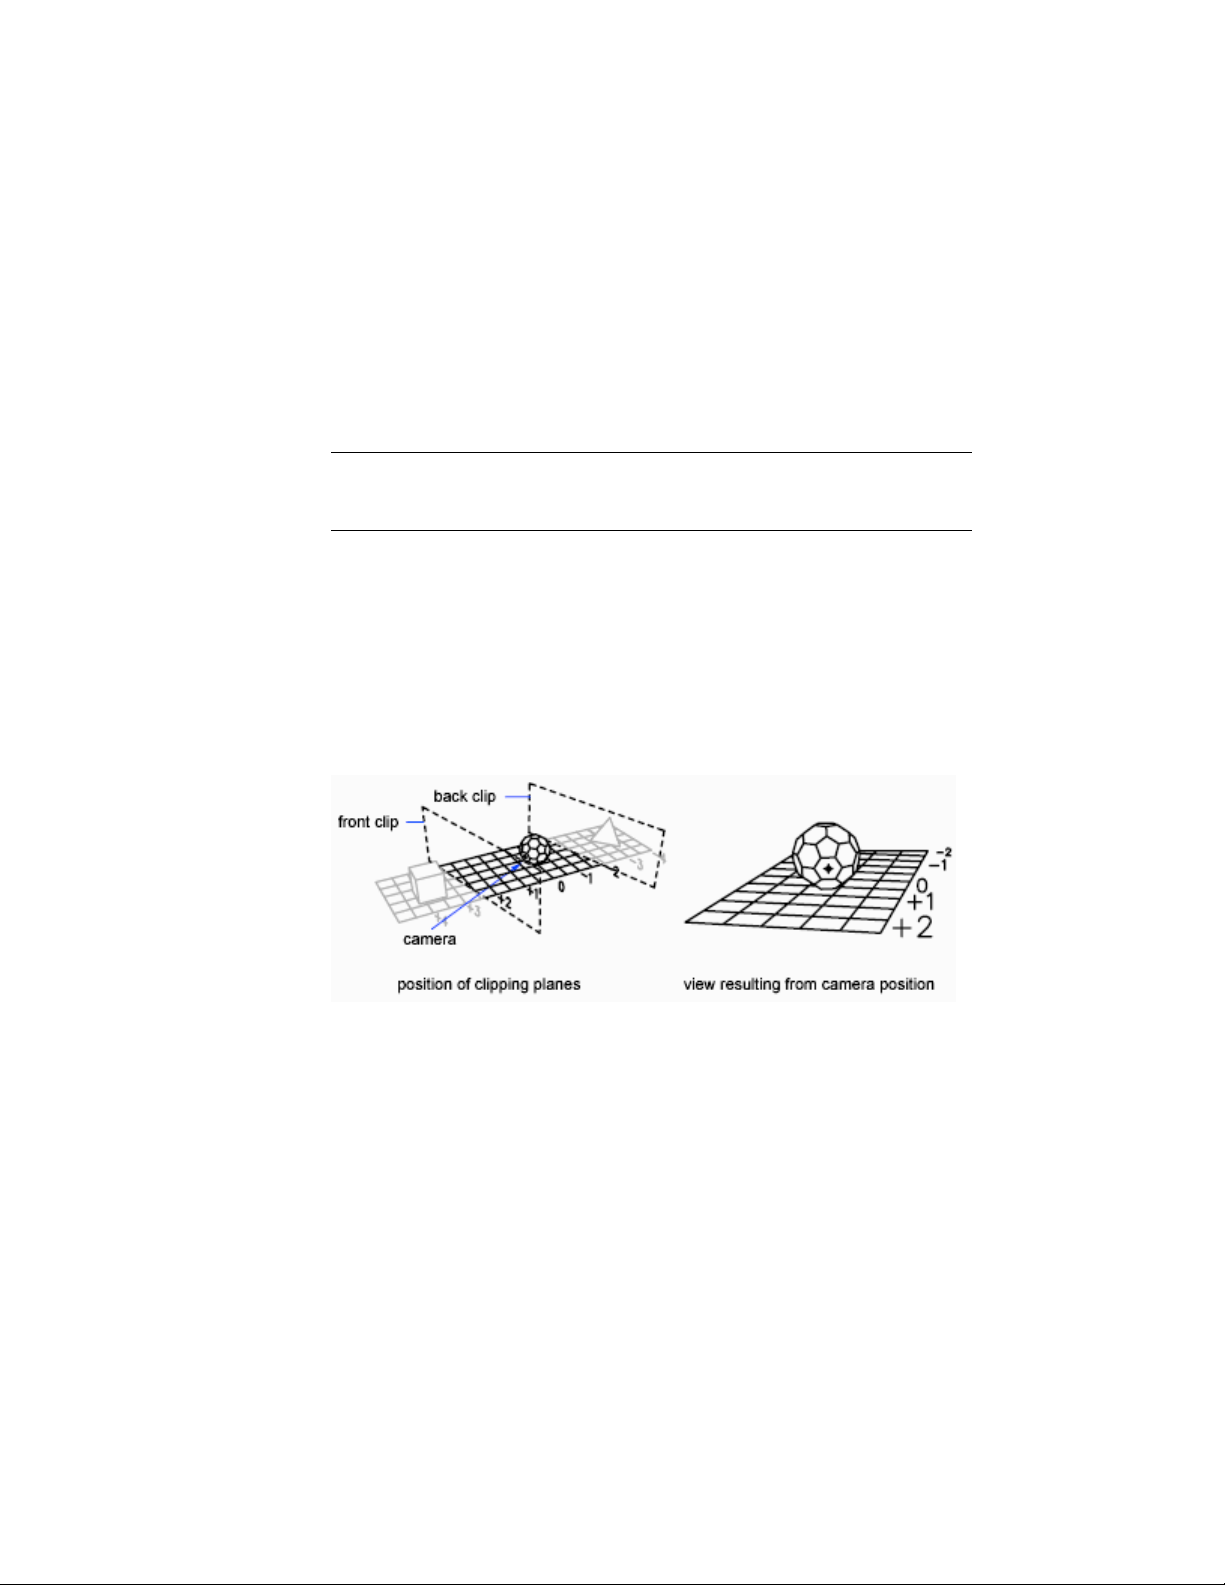
With dynamic viewing, you can display the effects of changing your viewpoint
as you make the changes. Using this method, you can also simplify your view
temporarily by choosing only the objects that you need to determine the view.
Alternatively, if you press Enter without selecting any objects, 3D Dynamic
View displays a model of a small house instead of your actual drawing. You
can use this house to define the viewing angle and distance. When your
adjustments are complete and you exit the command, the changes are applied
to the entire 3D model in the current view.
NOTE More powerful options for dynamic viewing in 3D are available in the
3DORBIT command. For more information, see Use 3D Navigation Tools (page
73).
Set Clipping Planes
You can create cutaway, or section, views of your drawing by positioning front
and back clipping planes that control the visibility of objects based on their
distance from a theoretical camera. You can move the clipping planes
perpendicular to the line of sight between the camera and target (where the
camera is pointing). Clipping removes the display of objects from the front
and back of clipping planes. The following illustration shows how clipping
planes work:
Use ViewCube Tool
ViewCube tool provides visual feedback of the current orientation of a model.
You can use the ViewCube tool to adjust the viewpoint of the model.
74 | Chapter 4 Control the Drawing Views

Overview of ViewCube Tool
ViewCube tool is a navigation tool that is displayed when you are working in
2D model space or 3D visual style. With ViewCube tool, you can switch
between standard and isometric views.
The ViewCube tool is a persistent, clickable and draggable interface that you
use to switch between standard and isometric views of your model. When you
display the ViewCube tool, it is shown in one of the corners of the window
over the model in an inactive state. The ViewCube tool provides visual feedback
about the current viewpoint of the model as view changes occur. When the
cursor is positioned over the ViewCube tool, it becomes active. You can drag
or click the ViewCube tool, switch to one of the available preset views, roll
the current view, or change to the Home view of the model.
FaceCornerEdge
Control the Appearance of ViewCube Tool
The ViewCube tool is displayed in one of two states: inactive and active. When
the ViewCube tool is inactive, it appears partially transparent by default so
that it does not obscure the view of the model. When active, it is opaque and
may obscure the view of the objects in the current view of the model.
In addition to controlling the inactive opacity level of the ViewCube tool,
you can also control the following properties for the ViewCube tool:
■ Size
■ Position
■ Display of the UCS menu
■ Default orientation
■ Compass display
Using the Compass
The compass is displayed below the ViewCube tool and indicates which
direction North is defined for the model. You can click a cardinal direction
letter on the compass to rotate the model, or you can click and drag one of
Use Viewing Tools | 75

the cardinal direction letters or the compass ring to interactively rotate the
model around the pivot point.
ViewCube Menu
Use the ViewCube menu to restore and define the Home view of a model,
switch between view projection modes, and change the interactive behavior
and appearance of the ViewCube tool.
The ViewCube menu has the following options:
■ Home. Restores the Home view saved with the model.
■ Parallel. Switches the current view to parallel projection.
■ Perspective. Switches the current view to perspective projection.
■ Perspective with Ortho Faces. Switches the current view to perspective
projection unless the current view aligns with a face view defined on the
ViewCube tool.
■ Set Current View as Home. Defines the Home view of the model based
on the current view.
■ ViewCube Settings. Displays the dialog box where you can adjust the
appearance and behavior of the ViewCube tool.
■ Help. Launches the online Help system and displays the topic for the
ViewCube tool.
ViewCube Menu
To display the ViewCube menu
To display the ViewCube menu, do one of the following:
■ Right-click on the compass, Home icon, or the main area of the ViewCube
tool.
■ Click the context menu button located below the ViewCube tool.
76 | Chapter 4 Control the Drawing Views

Reorient the View of a Model with ViewCube
The ViewCube tool offers many intuitive ways to reorient the view of a model.
Reorient the Current View
You can reorient the current view of a model by clicking predefined areas on
the ViewCube tool or dragging the ViewCube tool.
The ViewCube tool provides twenty-six defined parts to click and change the
current view of a model. The twenty-six defined parts are categorized into
three groups: corner, edge, and face. Of the twenty-six defined parts, six of
the parts represent standard orthogonal views of a model: top, bottom, front,
back, left, and right. Orthogonal views are set by clicking one of the faces on
the ViewCube tool.
You use the other twenty defined parts to access angled views of a model.
Clicking one of the corners on the ViewCube tool reorients the current view
of the model to a three-quarter view, based on a viewpoint defined by three
sides of the model. Clicking one of the edges reorients the view of the model
to a half view based on two sides of the model.
The outline of the ViewCube tool helps you identify the form of orientation
it is in: standard or fixed. When the ViewCube tool is in standard orientation,
not orientated to one of the twenty-six predefined parts, its outline is displayed
as dashed. The ViewCube tool is outlined in a solid continuous line when it
is constrained to one of the predefined views.
FaceCornerEdge
Drag or Click the ViewCube Tool
You can also click and drag the ViewCube tool to reorient the view of a model
to a custom view other than one of the twenty-six predefined parts. If you
drag the ViewCube tool close to one of the preset orientations and it is set to
snap to the closest view, the ViewCube tool rotates to the closest preset
orientation.
The ViewCube tool reorients the object’s view around a pivot point.
■ When the object is unselected, drag the ViewCube tool to reorient the
object’s view around the pivot point displayed at the center of the view.
Use Viewing Tools | 77
■ When the object is selected, drag the ViewCube tool to reorient the object’ s
view around the pivot point displayed at the center of the selected object.
■ When the object is unselected and a pivot point is defined and used by
another navigation tool before using the ViewCube tool, drag the ViewCube
tool to reorient the object’s view around the defined pivot point.
Roll a Face View
When you view a model from one of the face views, two roll arrow buttons
are displayed near the ViewCube tool. Use the roll arrows to rotate the current
view 90 degrees clockwise or counterclockwise around the center of the view.
Switch to an Adjacent Face
When the ViewCube tool is active while viewing a model from one of the face
views, four orthogonal triangles are displayed near the ViewCube tool. You
use these triangles to switch to one of the adjacent face views.
78 | Chapter 4 Control the Drawing Views
Set the View Projection Mode
View projection produces realistic visual effects of a model.
The ViewCube tool supports two view projection modes (Perspective and
Orthographic) and a combination of both these modes (Perspective with Ortho
faces). Orthographic projection is also referred to as parallel projection.
Perspective projected views are calculated based on the distance from a
theoretical camera and target point. The shorter the distance between the
camera and the target point, the more distorted the perspective effect appears;
greater distances produce less distorted affects on the model. Orthographic
projected views display all the points of a model being projected parallel to
the screen.
Orthographic projection mode makes it easier to work with a model due to
all the edges of the model appearing as the same size, regardless of the distance
from the camera. Orthographic projection mode though, is not how you
commonly see objects in the real world. Objects in the real world are seen in
perspective projection. So when you want to generate a rendering or hidden
line view of a model, using perspective projection will give the model a more
realistic look.
The following illustration shows the same model viewed from the same viewing
direction, but with different view projections.
PerspectiveParallel
When you change the view for a model, the view is updated using the previous
projection mode unless the current projection mode for the ViewCube tool
is Perspective with Ortho Faces. The Perspective with Ortho Faces mode forces
all views to be displayed in perspective projection unless the model is being
viewed from one of the face views: top, bottom, front, back, left, or right.
Use Viewing Tools | 79

Home View
You can define a Home view for a model so you can restore a familiar view
when you use the navigation tools.
The Home view is a special view stored with a model that makes it easy to
return to a known or familiar view. You can define any view of the model as
the Home view. The saved Home view can be applied to the current view by
clicking the Home button above the ViewCube tool or from the ViewCube
menu.
When you open a drawing that was created in a release earlier than AutoCAD
2008, the extents of a model are used as the default Home view. Drawings
created with AutoCAD 2013 have a Home view defined with a Top/Left/Front
orientation. While you can use the Home view to navigate back to a familiar
view, you can also use it to generate the thumbnail preview when you save a
model instead of using the last saved view.
Examine Individual Objects with the ViewCube Tool
You can examine individual objects of a model using the ViewCube tool.
With the ViewCube tool, you can define the center of a view based on one or
more selected objects. Select an object or objects and use the ViewCube tool
to reorient the model. The model rotates around the center of the view.
Calculate the center of the view by the extents of the selected objects.
Change the UCS with the ViewCube Tool
With the ViewCube tool you can change the current UCS for the model to
one of the named UCSs saved with the model or you can define a new UCS.
The UCS menu, located below the ViewCube tool, displays the name of the
current UCS in the model. From the menu, you can restore one of the named
UCSs saved with the model, switch to WCS, or define a new UCS. With the
WCS item on the menu, you can switch the coordinate system from the current
UCS to WCS. With the new UCS, you can rotate the current UCS based on
one, two, or three points to define a new UCS. When you click New UCS, a
new UCS is defined with the default name of Unnamed. To save the new
defined UCS with a name, use the Named option in the UCS command.
80 | Chapter 4 Control the Drawing Views
You can orient the ViewCube tool with the current UCS or WCS. By orienting
the ViewCube tool with the current UCS, you know in which direction you
are modeling. Orienting the ViewCube tool with the WCS, you can navigate
the model based on the North and Up directions of the model. The settings
for controlling the orientation of the ViewCube tool are in the .
Display Multiple Views in Model Space
To see several views at the same time, you can split the drawing area of the
Model layout into separate viewing areas called model space viewports. You can
save arrangements of model space viewports for reuse at any time.
See also:
Work with Model Space and Paper Space (page 90)
Create and Modify Layout Viewports (page 93)
Set Model Space Viewports
On the Model layout, you can split the drawing area into one or more adjacent
rectangular views known as model space viewports.
Display Multiple Views in Model Space | 81
Viewports are areas that display different views of your model. As you work
on the Model layout, you can split the drawing area into one or more adjacent
rectangular views known as model space viewports. In large or complex drawings,
displaying different views reduces the time needed to zoom or pan in a single
view. Also, errors you might miss in one view may be apparent in the others.
Viewports created on the Model layout completely fill the drawing area and
do not overlap. As you make changes in one viewport, the others are updated
simultaneously. Three model space viewports are shown in the illustration.
You can also create viewports on a named (paper space) layout. You use those
viewports, called layout viewports, to arrange the views of your drawing on a
sheet. You can move and resize layout viewports. By using layout viewports,
you have more control over the display; for example, you can freeze certain
layers in one layout viewport without affecting the others. For more
information about layouts and layout viewports, see Create Multiple-View
Drawing Layouts (Paper Space) (page 89).
Use Model Space Viewports
With model space viewports, you can do the following:
■ Pan; zoom; set Snap, Grid, and UCS icon modes; and restore named views.
■ Save user coordinate system orientations with individual viewports.
■ Draw from one viewport to another when executing a command.
82 | Chapter 4 Control the Drawing Views
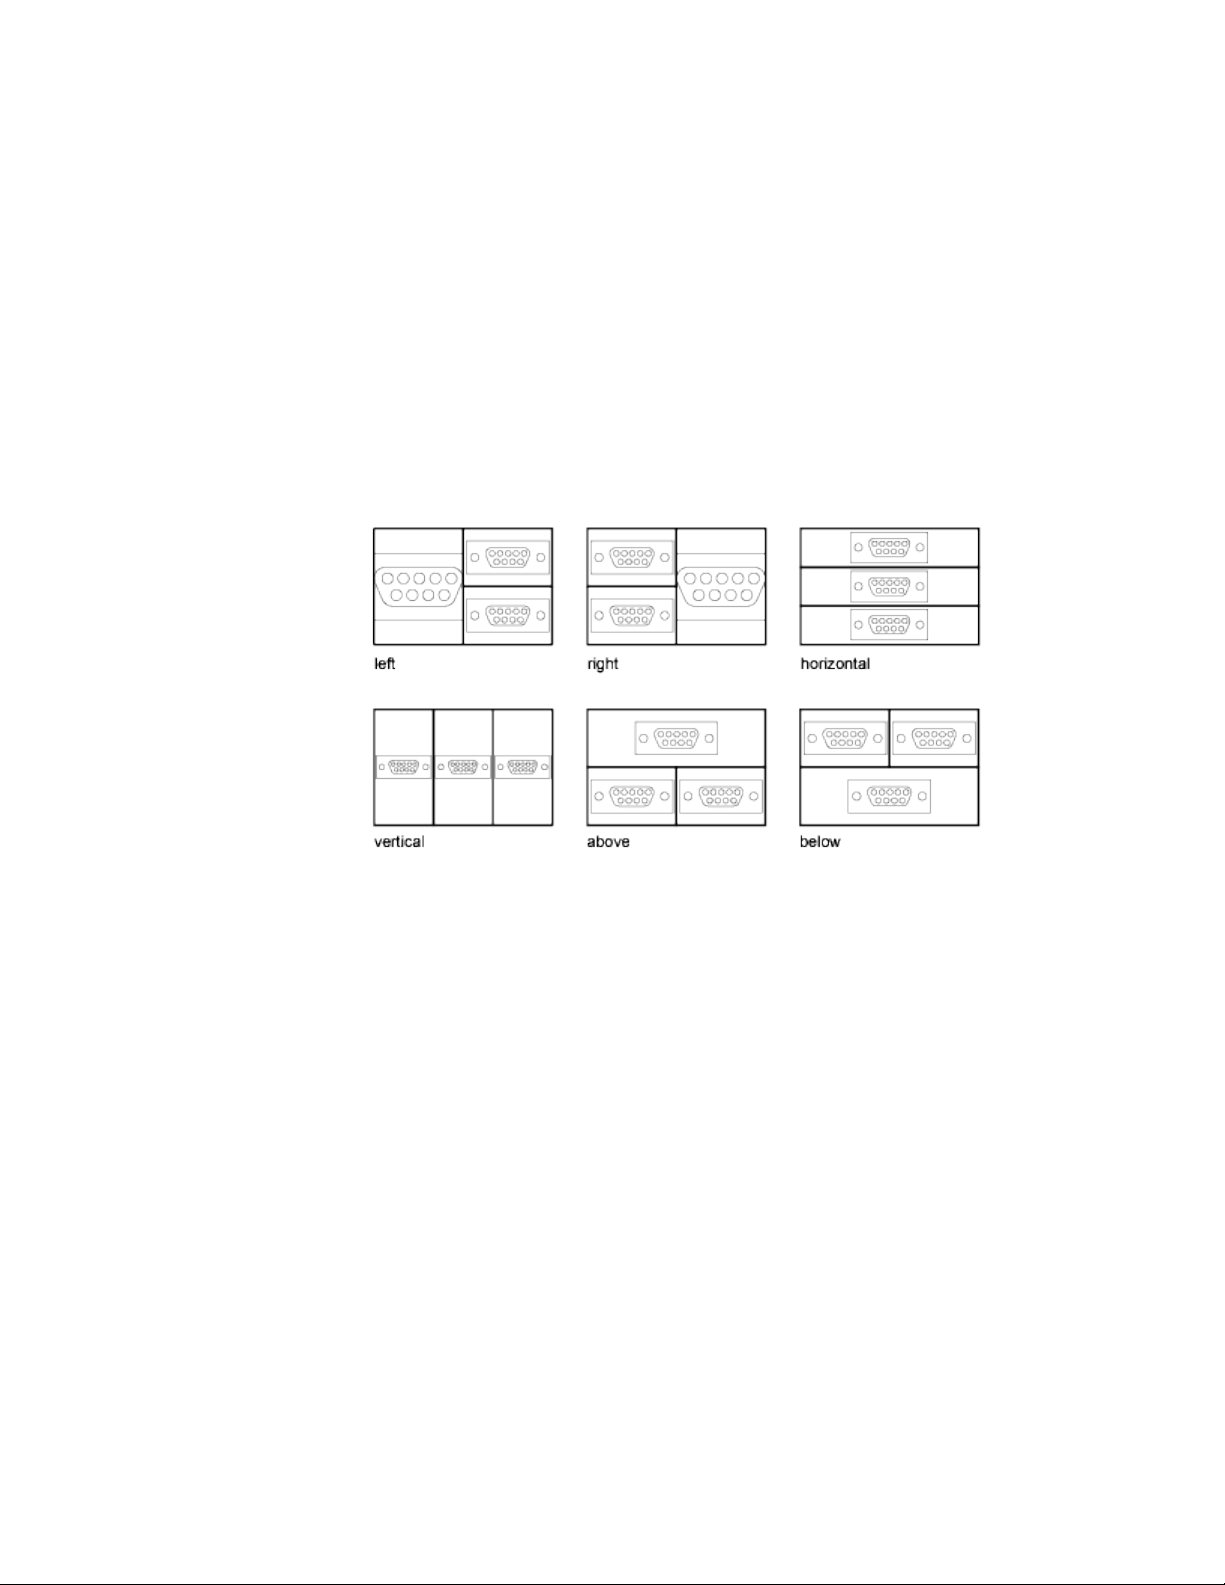
■ Name a viewport arrangement so that you can reuse it on the Model layout
or insert it on a named layout.
Setting up different coordinate systems in individual viewports is useful if you
typically work on 3D models. See Assign UCS Definitions to Viewports (page
151).
Split and Join Model Space Viewports
The illustrations below show several default model space viewport
configurations.
You can easily modify model space viewports by splitting and joining them.
If you want to join two viewports, they must share a common edge of the
same length.
Select and Use the Current Viewport
When you use multiple viewports, one of them is the current viewport, which
accepts cursor input and view commands.
When a viewport is current, the cursor is displayed as crosshairs rather than
an arrow, and the viewport boundary is highlighted. You can change the
current viewport at any time except when a View command is in progress.
To make a viewport the current viewport, you click inside it or press Ctrl-R to
cycle through the existing viewports.
Display Multiple Views in Model Space | 83
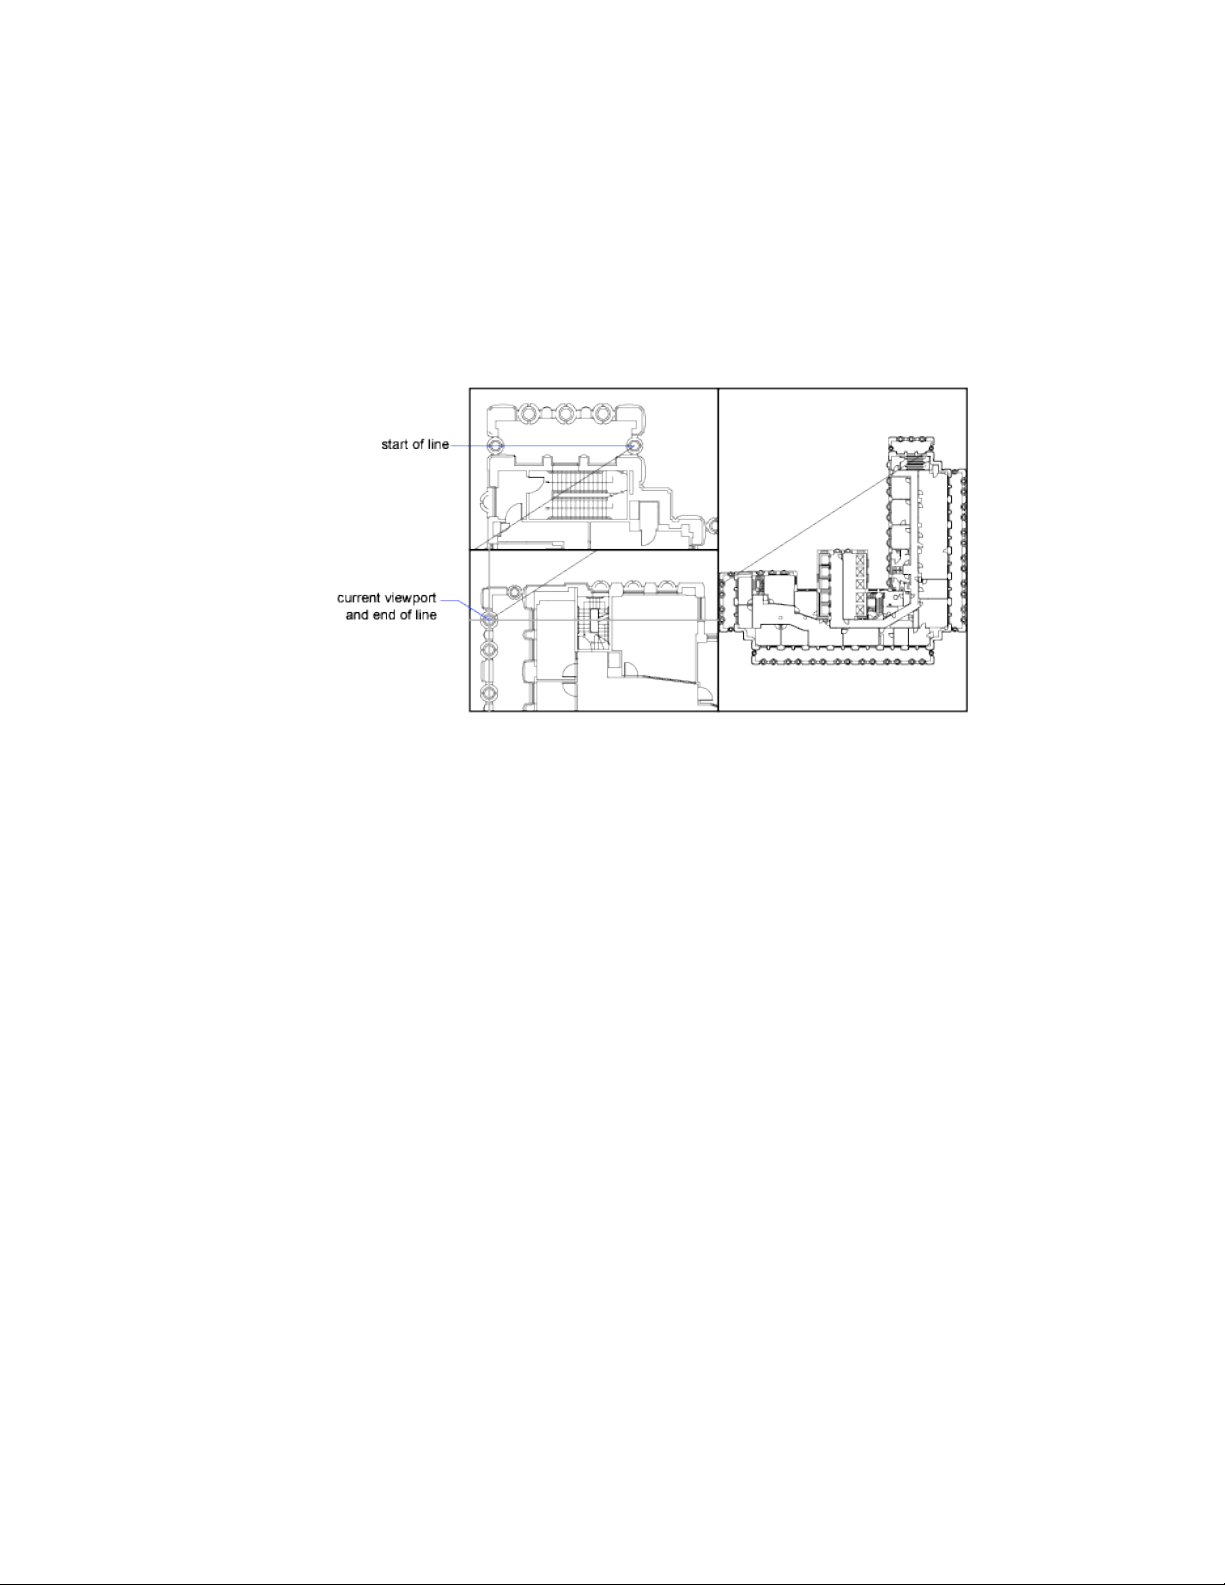
To draw a line using two model space viewports, you start the line in the
current viewport, make another viewport current by clicking within it, and
then specify the endpoint of the line in the second viewport. In a large
drawing, you can use this method to draw a line from a detail in one corner
to a detail in a distant corner.
Save and Restore Model Layout Viewport Ar-
rangements
Arrangements of model viewports can be saved and restored by name.
You do not have to set up viewports and views every time you need them.
With VPORTS, viewport arrangements can be saved and later restored by
name. Settings that are saved with viewport arrangements include
■ The number and position of viewports
■ The views that the viewports contain
■ The grid and snap settings for each viewport
■ The UCS icon display setting for each viewport
You can list, restore, and delete the available viewport arrangements. A
viewport arrangement saved on the Model layout can be inserted on a named
layout.
84 | Chapter 4 Control the Drawing Views

Organize Drawings and
Layouts
Create Single-View Drawings (Model Space)
To create a two dimensional drawing that has one view, you can create the
drawing and its annotation entirely in model space. This is the traditional
method for creating drawings with AutoCAD.
With this method, you create the building, mechanical part, or geographic area
that you want to represent at full scale (1:1), but you create the text, dimensions,
and the title block of the drawing at a scale to match the intended plot scale.
Quick Start for Model Space Drafting
The process of creating and plotting a drawing file in model space is very
different from the process used in manual drafting.
In AutoCAD, there are two distinct working environments that are represented
by Model and named layouts.
If you are going to create a two-dimensional drawing that has one view, you
can create both the model and its annotation entirely in model space, not using
a layout. This is the traditional method for creating drawings with AutoCAD.
This method is simple but has several limitations, including
■ It is suitable for 2D drawings only
■ It does not support multiple views and view-dependent layer settings
■ Scaling the annotation and title block requires computation unless you use
objects.
5
85

With this method, you always draw geometric objects at full scale (1:1) and
text, dimensions, and other annotation at a scale that will appear at the correct
size when you output the drawing.
For information about using annotative objects and scaling annotations
automatically, see Scale Annotations (page 490).
See also:
Create Multiple-View Drawing Layouts (Paper Space) (page 89)
Draw, Scale, and Annotate in Model Space
If you draw and plot from model space, you must determine and apply a scale
factor to annotate objects before you plot.
You can draw and plot entirely from model space. This method is useful
primarily for two-dimensional drawings that have a single view. With this
method, you use the following process:
■ Determine the unit of measurement (drawing units) for the drawing.
■ Specify the display style for the drawing unit.
■ Calculate and set the scale for dimensions, annotations, and blocks.
■ Draw at full scale (1:1) in model space.
■ Create the annotation and insert the blocks in model space.
■ Print the drawing at the predetermined scale.
You can also use objects if you want to scale annotations automatically. For
information about using annotative objects and scaling annotations
automatically, see Scale Annotations (page 490).
Determine the Unit of Measurement
Before you begin drawing in model space, you determine the unit of
measurement (drawing units) that you plan to use. You decide what each unit
on the screen represents, such as an inch, a millimeter, a kilometer, or some
other unit of measurement. For example, if you are drawing a motor part, you
might decide that one drawing unit equals a millimeter. If you are drawing a
map, you might decide that one unit equals a kilometer.
86 | Chapter 5 Organize Drawings and Layouts

Specify the Display Style of Drawing Units
Once you have determined a drawing unit for the drawing, you need to specify
the style for displaying the drawing unit, which includes the unit type and
precision. For example, a value of 14.5 can be displayed as 14.500, 14-1/2, or
1'2-1/2".
Specify the display style of drawing units with the UNITS command. The
default drawing unit type is decimal.
Set the Scale for Annotations and Blocks
Before you draw, you should set the scale for dimensions, annotations, and
blocks in your drawings. Scaling these elements beforehand ensures that they
are at the correct size when you plot the final drawing.
You should enter the scale for the following objects:
■ Text. Set the text height as you create text or by setting a fixed text height
in the text style (STYLE).
■ Dimensions. Set the dimension scale in a dimension style (DIMSTYLE)
or with the DIMSCALE system variable.
■ Linetypes. Set the scale for noncontinuous linetypes with the CELTSCALE
and LTSCALE system variables.
■ Hatch patterns. Set the scale for hatch patterns while creating the hatch
(HATCH), before creating the hatch object with the HPSCALE system
variable, or edit the hatch after it has been created.
■ Blocks.Specify the insertion scale for blocks either as you insert them, or
set an insertion scale in the Insert Block dialog box (INSERT).
The system variables used for inserting blocks are INSUNITS,
INSUNITSDEFSOURCE, and INSUNITSDEFTARGET. This also applies to
the border and title block of the drawing.
You can also use objects if you want to scale annotations automatically. For
information about using annotative objects and scaling annotations
automatically, see Scale Annotations (page 490).
Determine the Scale Factor for Plotting
To plot your drawing from the Model layout, you calculate the exact scale
factor by converting the drawing scale to a ratio of 1:n. This ratio compares
plotted units to drawing units that represent the actual size of the objects you
are drawing.
Create Single-View Drawings (Model Space) | 87
For example, if you plan to plot at a scale of 1/4 inch = 1 foot, you would
calculate the scale factor 48 as follows:
1/4" = 12"
1 = 12 x 4
1 (plotted unit) = 48 (drawing units)
Using the same calculation, the scale factor for 1 centimeter = 1 meter is 100,
and the scale factor for 1 inch = 20 feet is 240.
Sample Scale Ratios
The sample architectural scale ratios in the table can be used to calculate text
sizes in model space.
Set drawing text
size to
To plot text size
at
Scale factorScale
30 cm3 mm1001 cm = 1 m
12"1/8"961/8" = 1'-0"
8"1/8"643/16" = 1'-0"
6"1/8"481/4" = 1'-0"
4"1/8"323/8" = 1'-0"
3"1/8"241/2" = 1'-0"
2"1/8"163/4" = 1'-0"
1.5"1/8"121" = 1'-0"
1.0"1/8"81 1/2" = 1'-0"
If you are working in metric units, you might have a sheet size of 210 x 297
mm (A4 size) and a scale factor of 20. You calculate grid limits as follows:
210 x 20 = 4200 mm
88 | Chapter 5 Organize Drawings and Layouts

297 x 20 = 5900 mm
See also:
Specify Units and Unit Formats (page 40)
Create Multiple-View Drawing Layouts (Paper
Space)
Paper space is a sheet layout environment where you can specify the size of
your sheet, add a title block, display multiple views of your model, and create
dimensions and notes for your drawing.
Quick Start for Layouts
There are two distinct working environments, or “spaces,” in which you can
create objects in a drawing.
Typically, a model composed of geometric objects is created in a
three-dimensional space called model space. A final layout of specific views
and annotations of this model is created in a two-dimensional space called
paper space.
Working in model space, you draw a model of your subject at 1:1 scale.
Working on a named layout, you create one or more layout viewports,
dimensions, notes, and a title block to represent a drawing sheet.
Each layout viewport is like a picture frame containing a “photograph” of the
model in model space. Each layout viewport contains a view that displays the
model at the scale and orientation that you specify. You can also specify which
layers are visible in each layout viewport.
After you finish arranging the layout, you turn off the layer that contains the
layout viewport objects. The views are still visible, and you can plot the layout
without displaying the viewport boundaries.
Understand the Layout Process
When you use a named layout to prepare your drawing for output, you follow
a series of steps in a process.
Create Multiple-View Drawing Layouts (Paper Space) | 89

You design the subject of your drawing in model space and prepare it for
output on a named layout in paper space. A drawing always has at least one
named layout.
Before you can use a layout, it must be initialized. A layout does not contain
any page setup information before it is initialized. Once initialized, layouts
can be drawn upon and output.
Process Summary
When you prepare a layout, you typically step through the following process:
■ Create a model of your subject in model space.
■ Initialize a named layout.
■ Specify layout page settings such as output device, paper size, drawing
area, output scale, and drawing orientation.
■ Insert a title block into the layout (unless you have started with a drawing
template that already has a title block).
■ Create a new layer to be used for layout viewports.
■ Create layout viewports and position them on the layout.
■ Set the orientation, scale, and layer visibility of the view in each layout
viewport.
■ Add dimensions and annotate in the layout as needed.
■ Turn off the layer containing the layout viewports.
■ Output your layout.
You can also use annotative objects if you want to annotate your drawing in
model space and scale the annotations automatically. For information about
using annotative objects and scaling annotations automatically, see Scale
Annotations (page 490).
Work with Model Space and Paper Space
There are several benefits to switching between model space and paper space
to perform certain tasks. Use model space for creating and editing your model.
Use paper space for composing your drawing sheet and defining views.
90 | Chapter 5 Organize Drawings and Layouts

Work in Model Space
By default, you start working in a limitless drawing area called model space. In
model space, you draw, view, and edit your model.
You first decide whether one unit represents one millimeter, one centimeter,
one inch, one foot, or whatever unit is most convenient or customary in your
business. You then create your model at 1:1 scale.
In model space, you can view and edit model space objects. The crosshairs
cursor is active over the entire drawing area.
In model space, you can also define named views that you display in layout
viewports on a layout.
Work on a Named Layout
Named layouts access an area called paper space. In paper space, you place your
title block, create layout viewports to display views, dimension your drawing,
and add notes.
In paper space, one unit represents the actual distance on a sheet of paper.
The units will be in either millimeters or inches, depending on how you
configure your page setup.
On a named layout, you can view and edit paper space objects, such as layout
viewports and title blocks. You can also move an object (such as a leader or a
title block) from model space to paper space (or vice versa). The crosshairs
cursor is active over the entire layout area.
Create Additional Named Layouts
By default, a new drawing starts with two named layouts, named Layout1 and
Layout2. If you use a drawing template or open an existing drawing, the
layouts in your drawing may be named differently.
You can create a new layout using one of the following methods:
■ Add a new layout with no settings and then specify the settings in the
Page Setup Manager.
■ Copy a layout and its settings from the current drawing file.
■ Import a layout from an existing drawing template (DWT) file or drawing
(DWG) file.
Create Multiple-View Drawing Layouts (Paper Space) | 91

Access Model Space from a Layout Viewport
You can access model space from a layout viewport to edit objects, to freeze
and thaw layers, and to adjust the view.
After creating viewport objects, you can access model space from a layout
viewport to perform the following tasks:
■ Create and modify objects in model space inside the layout viewport.
■ Pan the view inside the layout viewport and change layer visibility.
The method you use to access model space depends on what you plan to do.
Create and Modify Objects in a Layout Viewport
If you plan to create or modify objects, use the Maximize Viewport button on
the status bar to make the layout viewport fill the application window. The
center point and the layer visibility settings of the layout viewport are retained,
and the surrounding objects are displayed.
You can pan and zoom while you are working in model space, but when you
restore the viewport to return to paper space, the position and scale of the
objects in the layout viewport are restored.
NOTE If you use PLOT while a viewport is maximized, the layout is restored before
the Print dialog box is displayed. If you save and close the drawing while a viewport
is maximized, the drawing opens with the named layout restored.
If you choose to switch to the default model space to make changes, the layer
visibility settings are the settings for the drawing as a whole, not the settings
for that particular layout viewport. Also, the view is not centered or magnified
the same way it is in the layout viewport.
Adjust the View in a Layout Viewport
If you plan to pan the view and change the visibility of layers, double-click
within a layout viewport to access model space. The viewport border becomes
thicker, and the crosshairs cursor is visible in the current viewport only. All
active viewports in the layout remain visible while you work. You can freeze
and thaw layers in the current viewport in the Layers palette, and you can
pan the view. To return to paper space, double-click an empty area on the
layout outside a viewport. The changes you made are displayed in the viewport.
92 | Chapter 5 Organize Drawings and Layouts
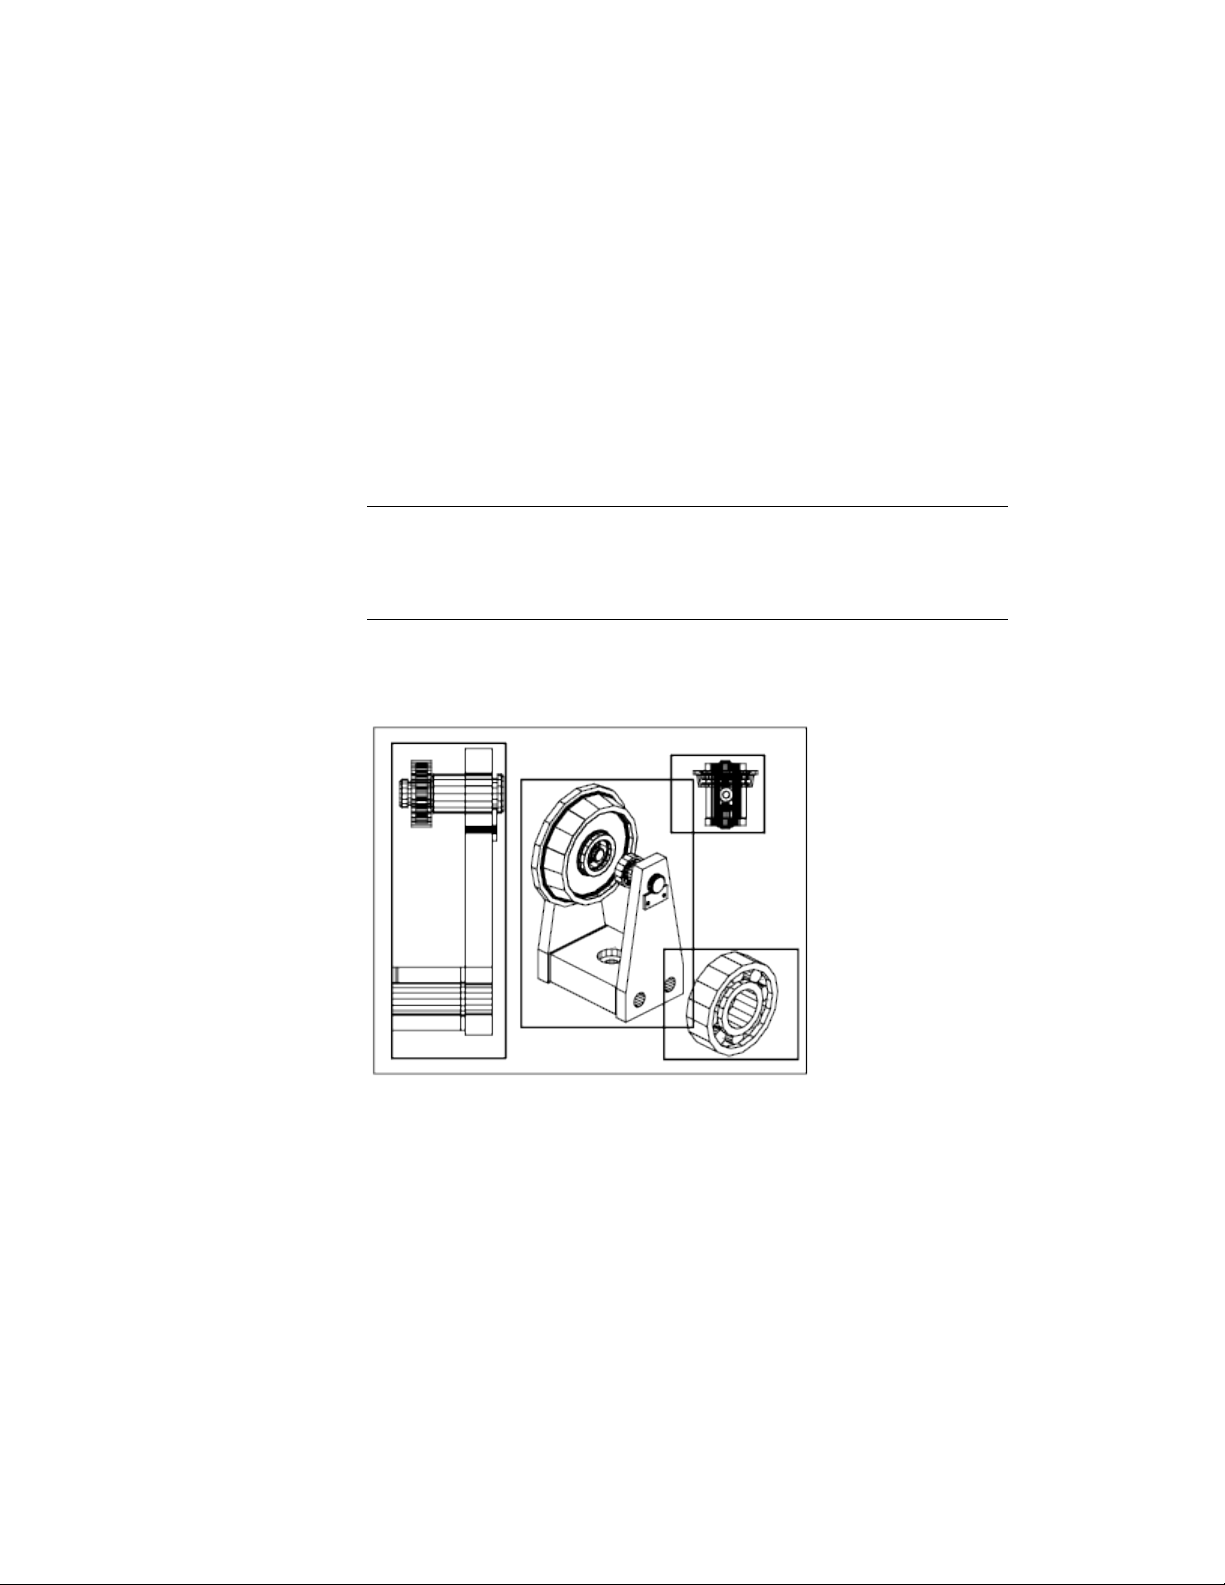
If you set the scale in the layout viewport before you access model space, you
can lock the scale to prevent changes. When the scale is locked, you cannot
use ZOOM while you work in model space.
Create and Modify Layout Viewports
You can create a single layout viewport that fits the entire layout or create
multiple layout viewports in the layout. Once you create the viewports, you
can change their size, their properties, and also scale and move them as needed.
NOTE
It is important to create layout viewports on their own layer. When you are
ready to output your drawing, you can turn off the layer and output the layout
without the boundaries of the layout viewports.
With MVIEW, you have several options for creating one or more layout
viewports. You can also use COPY and ARRAY to create multiple layout
viewports.
Create Nonrectangular Layout Viewports
You can create a new viewport with nonrectangular boundaries by converting
an object drawn in paper space into a layout viewport.
Create Multiple-View Drawing Layouts (Paper Space) | 93

You can use the MVIEW command to create nonrectangular viewports.
■ With the Object option, you can select a closed object, such as a circle or
closed polyline created in paper space, to convert into a layout viewport.
The object that defines the viewport boundary is associated with the
viewport after the viewport is created
■ With the Polygonal option, you can create a nonrectangular layout
viewport by specifying points. The prompts are the same as the prompts
for creating a polyline
NOTE When you want to suppress the display of the boundary of a layout viewport,
you should turn off the layer of the nonrectangular viewport instead of freezing
it. If the layer of a nonrectangular layout viewport is frozen, the viewport is not
clipped correctly.
Redefine Layout Viewport Boundaries
You can redefine the boundary of a layout viewport by using the VPCLIP
command. You can either select an existing object to designate as the new
boundary, or specify the points of a new boundary. The new boundary does
not clip the old boundary, it redefines it.
A nonrectangular viewport consists of two objects: the viewport itself and the
clipping boundary. You can make changes to the viewport, the clipping
boundary, or both.
NOTE In the Properties Inspector, the default selection for a nonrectangular
viewport is Viewport. This is because you are more likely to change the properties
of the viewport than of the clipping boundary.
Resize Layout Viewports
If you want to change the shape or size of a layout viewport, you can use grips
to edit the vertices just as you edit any object with grips.
Control Views in Layout Viewports
When you create a layout, you can add layout viewports that act as windows
into model space. In each layout viewport, you can control the view that is
displayed.
94 | Chapter 5 Organize Drawings and Layouts

Scale Views in Layout Viewports
To scale each displayed view in output accurately, set the scale of each view
relative to paper space.
You can change the view scale of the viewport using
■ The Properties Inspector
■ The XP option of the ZOOM command
■ The Viewports Scale on the status bar
NOTE You can modify the list of scales that are displayed in all view and print
scale lists with SCALELISTEDIT. After you add a new scale to the default scale list,
you can use the Reset button in the Edit Drawing Scales dialog box to add the
new scale to your drawing.
When you work in a layout, the scale factor of a view in a layout viewport
represents a ratio between the actual size of the model displayed in the
viewport and the size of the layout. The ratio is determined by dividing the
paper space units by the model space units. For example, for a quarter-scale
drawing, the ratio would be a scale factor of one paper space unit to four model
space units, or 1:4.
Scaling or stretching the layout viewport border does not change the scale of
the view within the viewport.
When creating a new drawing based on a template, the scales in the template
are used in the new drawing. The scales in the user profile are not imported.
Lock the Scale of Layout Viewports
Once you set the viewport scale, you cannot zoom within a viewport without
changing the viewport scale. By locking the viewport scale first, you can zoom
in to view different levels of detail in your viewport without altering the
viewport scale.
Scale locking locks the scale that you set for the selected viewport. Once the
scale is locked, you can continue to modify the geometry in the viewport
without affecting the viewport scale. If you turn a viewport's scale locking on,
most of the viewing commands, such as VPOINT, DVIEW, 3DORBIT, PLAN,
and VIEW, no longer function in that viewport.
Create Multiple-View Drawing Layouts (Paper Space) | 95

NOTE Viewport scale locking is also available for nonrectangular viewports. To
lock a nonrectangular viewport, you must perform an extra step in the Properties
Inspector to select the viewport object rather than the viewport clipping boundary.
Annotative Objects and Scaling
Annotative objects are defined at a paper height instead of a model size and
assigned one or more scales. These objects are scaled based on the current
annotation scale setting and automatically displayed at the correct size in the
layout or when plotted. The annotation scale controls the size of the annotative
objects relative to the model geometry in the drawing.
You can specify the default list of scales available for layout viewports, page
layouts, and printing in Default Scale List dialog box.
For more information about annotation scaling, see Scale Annotations (page
490).
Control Visibility in Layout Viewports
You can control the visibility of objects in layout viewports using several
methods. These methods are useful for emphasizing or hiding different
elements of a drawing, and for reducing screen regeneration time.
See also:
Display Annotative Objects (page 500)
Freeze Specified Layers in a Layout Viewport
A major benefit to using layout viewports is that you can selectively freeze
layers in each layout viewport. You can also specify default visibility settings
for new viewports and for new layers. As a result, you can view different objects
in each layout viewport.
You can freeze or thaw layers in current and future layout viewports without
affecting other viewports. Frozen layers are invisible. They are not regenerated
or plotted. In the illustration, the layer showing terrain has been frozen in
one viewport.
96 | Chapter 5 Organize Drawings and Layouts
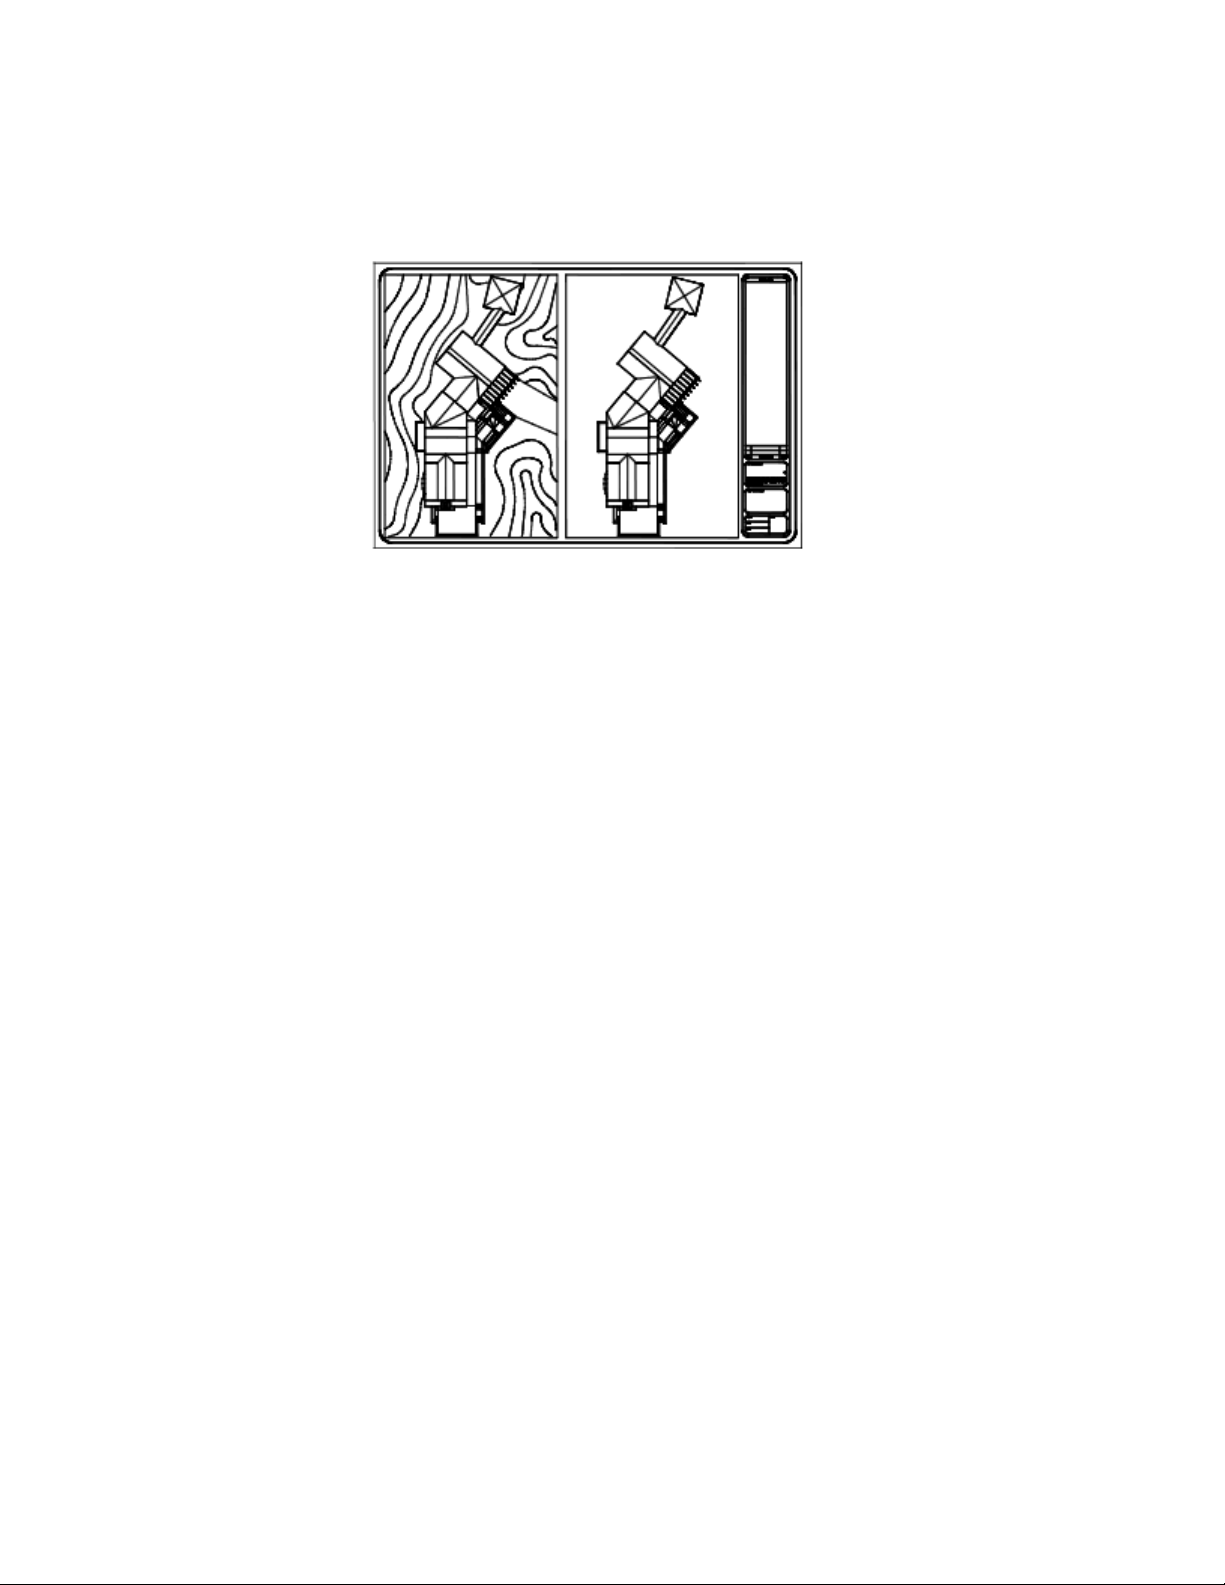
Thawing the layer restores visibility. The easiest way to freeze or thaw layers
in the current viewport is to use the Layers palette.
In the Layers palette, on the right side, use the column labeled VP Freeze to
freeze one or more layers in the current layout viewport. To display the VP
Freeze column, you must be on a layout. Specify the current layout viewport
by double-clicking anywhere within its borders.
Freeze or Thaw Layers Automatically in New Layout Viewports
You can set visibility defaults for specific layers in all new layout viewports.
For example, you can restrict the display of dimensions by freezing the
DIMENSIONS layer in all new viewports. If you create a viewport that requires
dimensions, you can override the default setting by changing the setting in
the current viewport. Changing the default for new viewports does not affect
existing viewports.
Create New Layers That Are Frozen in All Layout Viewports
You can create new layers that are frozen in all existing and new layout
viewports. Then you can thaw the layers in the viewports you specify. This is
a shortcut for creating a new layer that is visible only in a single viewport.
Screen Objects in Layout Viewports
Screening refers to applying less ink to an object when it is plotted. The object
appears dimmer on the screen and output to paper. Screening can be used to
help differentiate objects in a drawing without changing the objects' color
properties.
Create Multiple-View Drawing Layouts (Paper Space) | 97
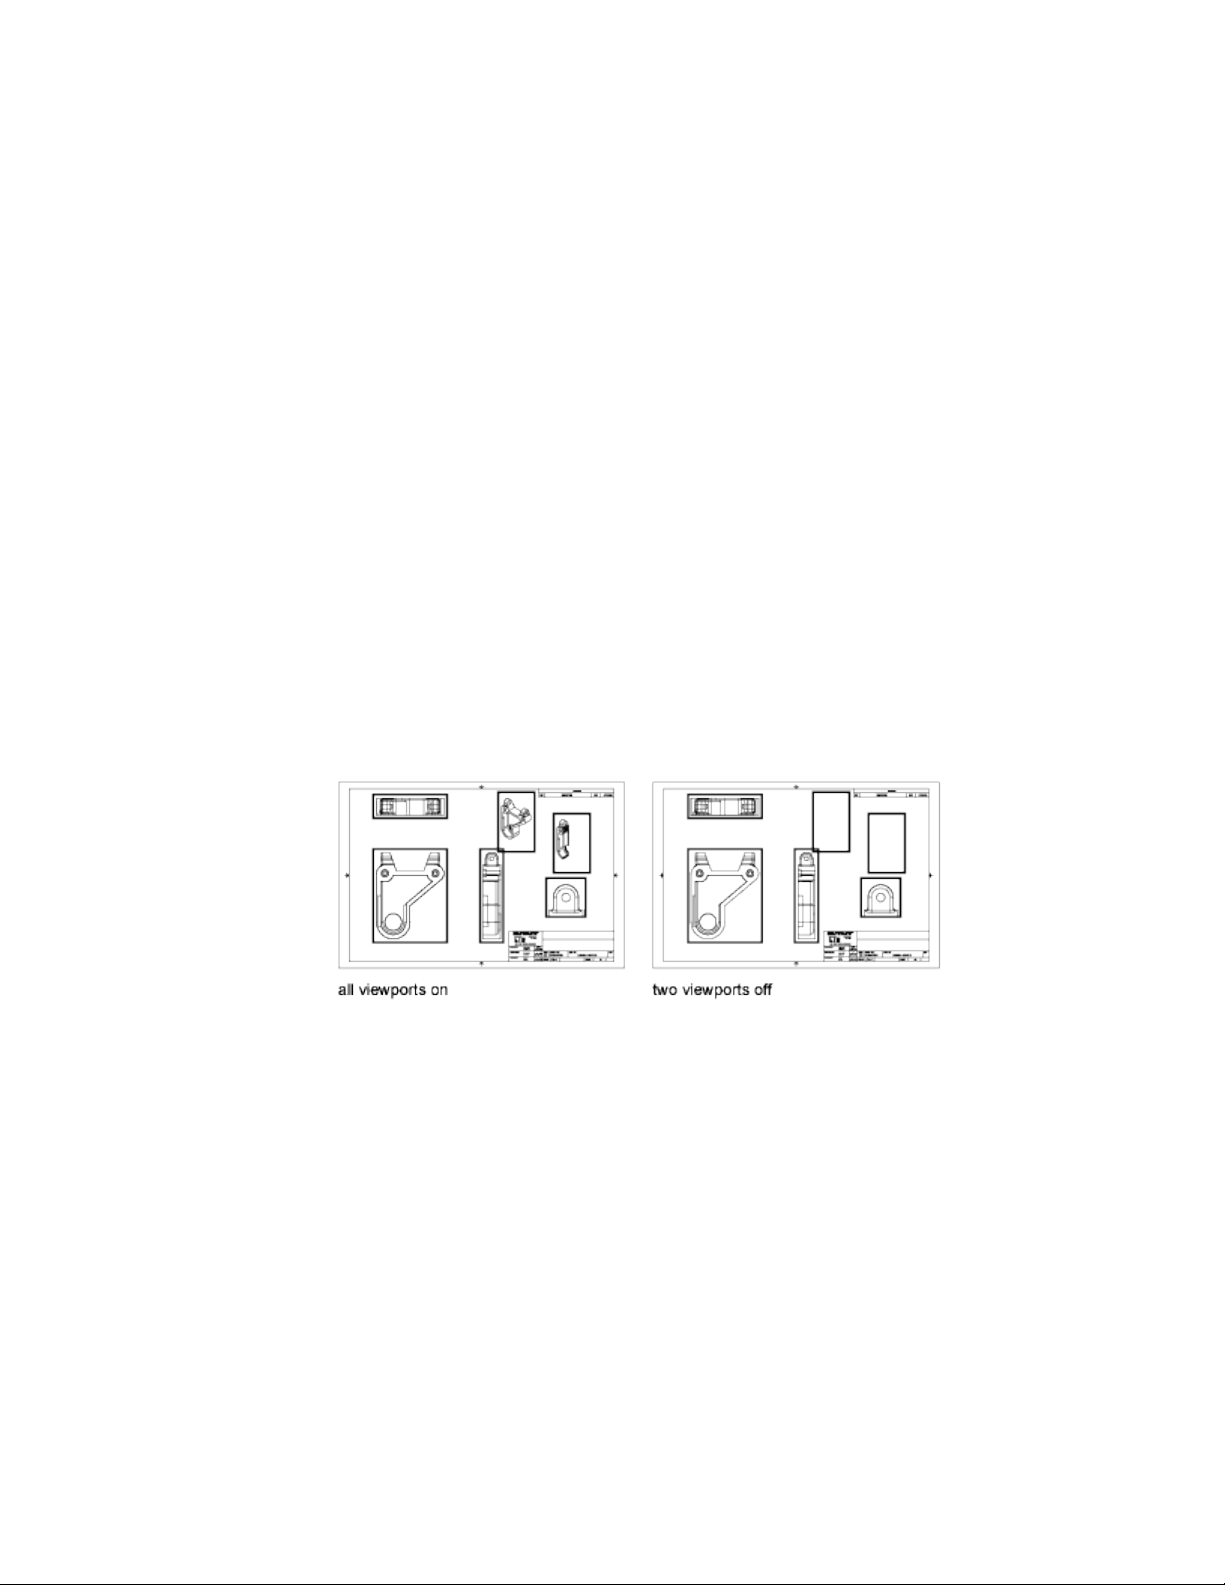
To assign a screening value to an object, you must assign a plot style to the
object, and then define the screening value in that plot style.
You can assign a screening value from 0 to 100. The default setting, 100, means
no screening is applied, and the object is displayed with normal ink intensity.
A screening value of 0 means the object contains no ink and is thus invisible
in that viewport.
See also:
Set Options for Plotted Objects (page 630)
Turn Layout Viewports On or Off
You can save time by turning some layout viewports off or by limiting the
number of active viewports.
Displaying a large number of active layout viewports can affect your system's
performance as the content of each layout viewport regenerates. You can save
time by turning some layout viewports off or by limiting the number of active
viewports. The following illustration shows the effects of turning off two
layout viewports.
New layout viewports are turned on by default. If you turn off the layout
viewports you aren't using, you can copy layout viewports without waiting
for each one to regenerate.
If you don't want to plot a layout viewport, you can turn the layout viewport
off.
98 | Chapter 5 Organize Drawings and Layouts
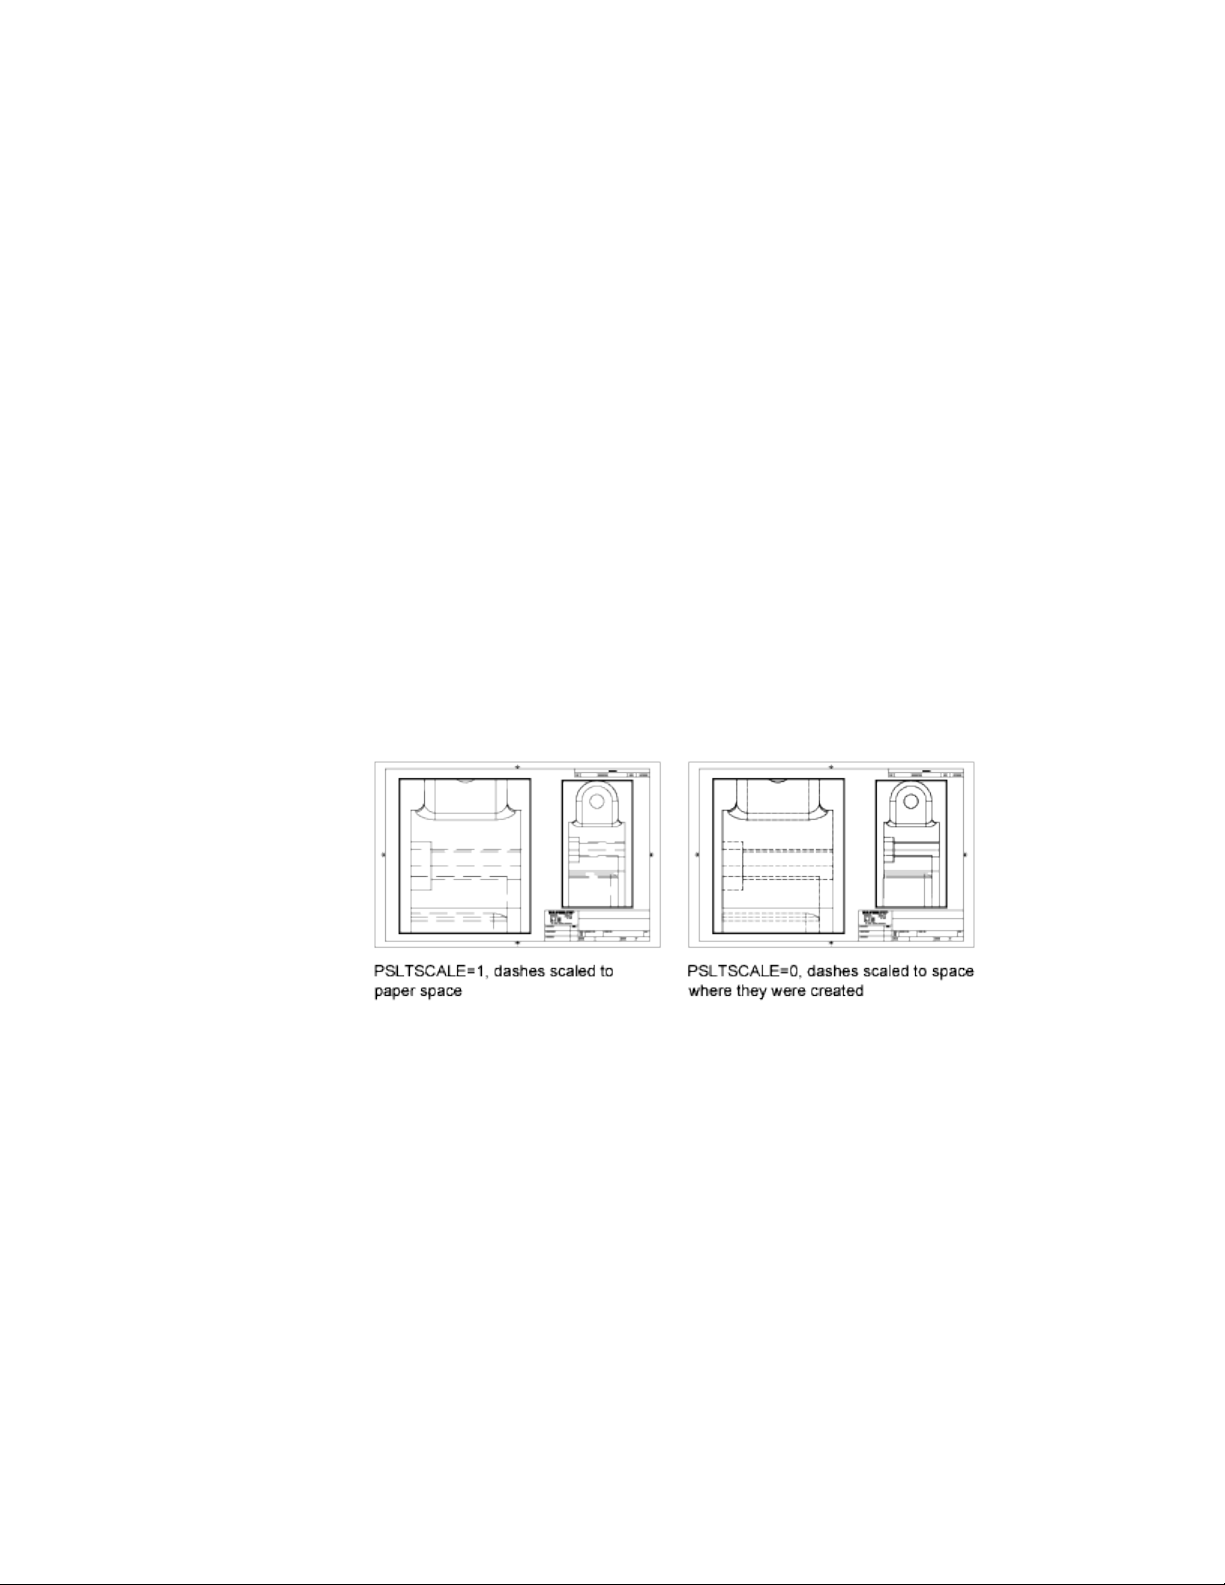
Scale Linetypes in Layout Viewports
You can scale linetypes in paper space either based on the drawing units of
the space in which the object was created or based on the paper space units.
You can set the PSLTSCALE system variable to maintain the same linetype
scaling for objects displayed at different zoom factors in a layout and in a
layout viewport. For example, with PSLTSCALE set to 1 (default), set the current
linetype to dashed, and then draw a line in a paper space layout.
In the layout, create a viewport with a zoom factor of 1x, make that layout
viewport current, and then draw a line using the same dashed linetype. The
dashed lines should appear to be the same. If you change the viewport zoom
factor to 2x, the linetype scaling for the dashed line in the layout and the
dashed line in the layout viewport will be the same, regardless of the difference
in the zoom factor.
With PSLTSCALE turned on, you can still control the dash lengths with
LTSCALE and CELTSCALE. In the following illustration, the pattern of the
linetypes in the drawing on the left has been scaled to be the same regardless
of the scale of the view. In the drawing on the right, the scale of the linetypes
matches the scale of each view.
See also:
Set the Lineweight Scale for a Layout (page 620)
Align Views in Layout Viewports
You can arrange the elements of your drawing by aligning the view in one
layout viewport with the view in another viewport.
Create Multiple-View Drawing Layouts (Paper Space) | 99
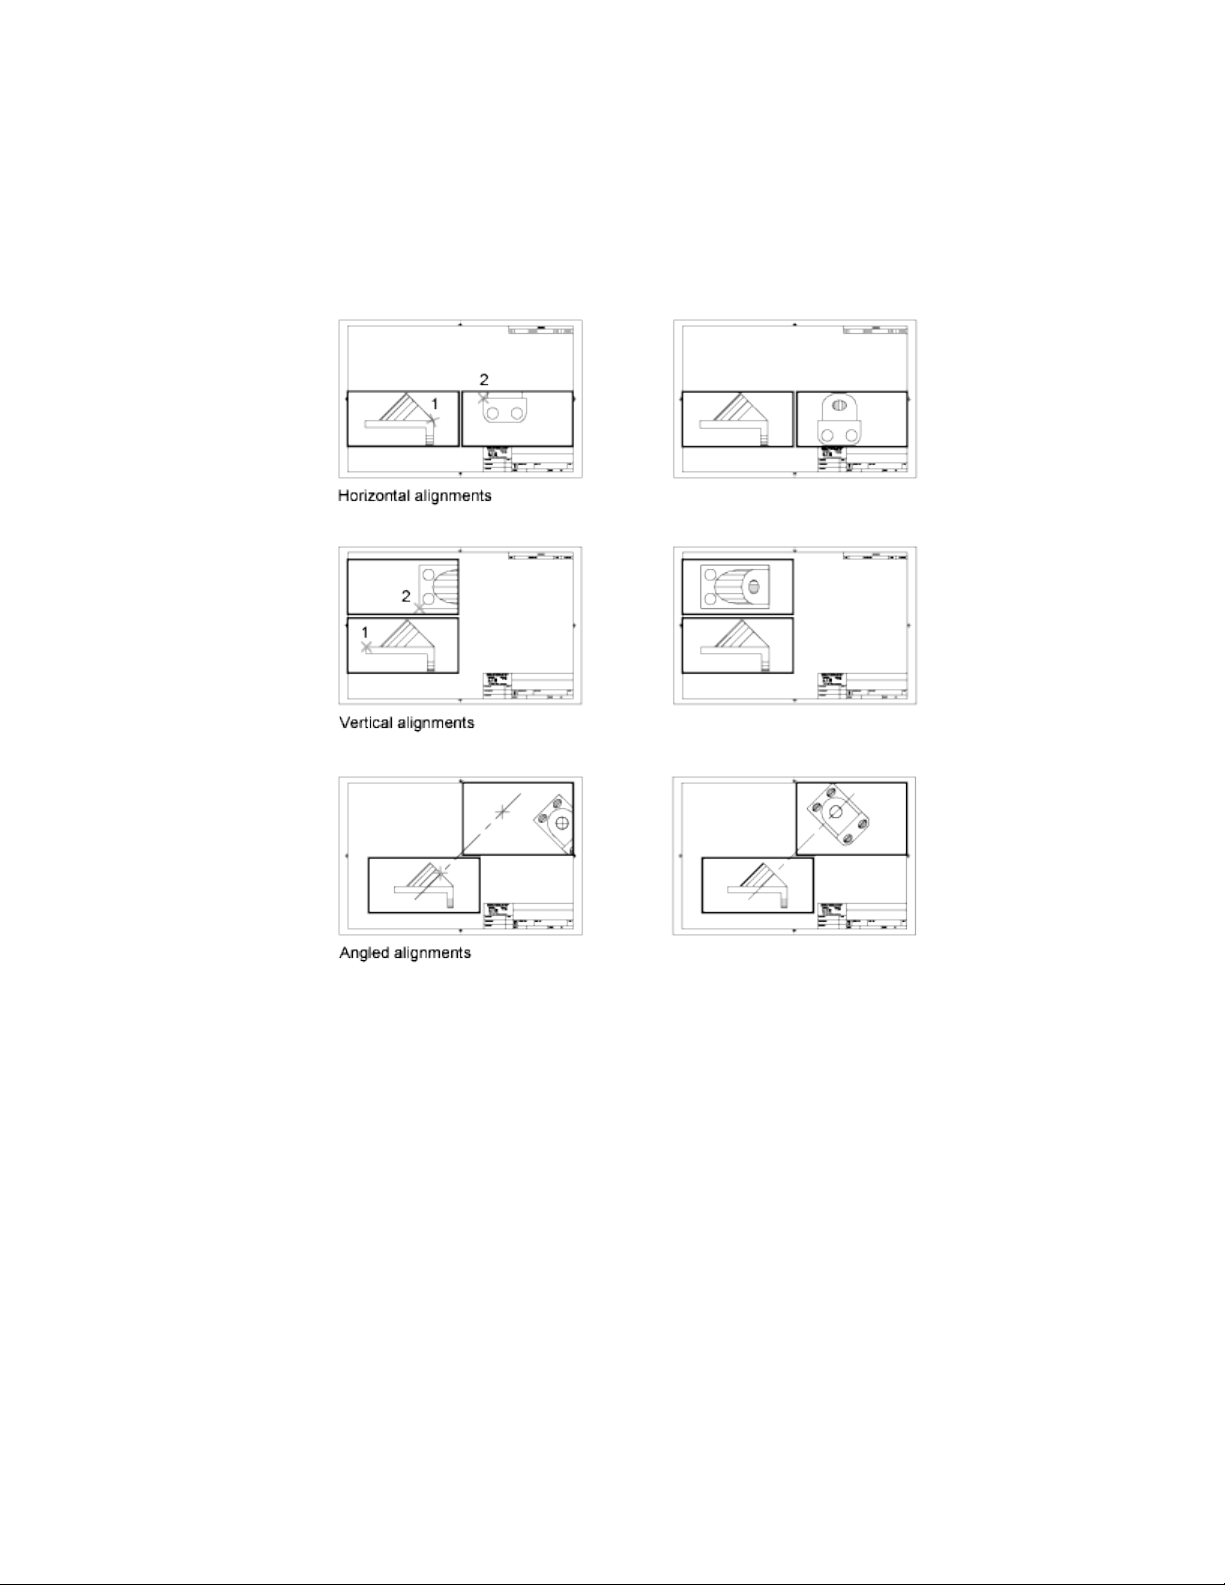
For angled, horizontal, and vertical alignments, you can move each layout
viewport relative to distances defined by the model-space geometry displayed.
To adjust the views on a layout with precision, you can create construction
geometry, use object snaps on the model space objects displayed in layout
viewports, or use one of the drafting aids on the status bar.
Rotate Views in Layout Viewports
You can rotate an entire view within a layout viewport with the
VPROTATEASSOC system variable.
100 | Chapter 5 Organize Drawings and Layouts
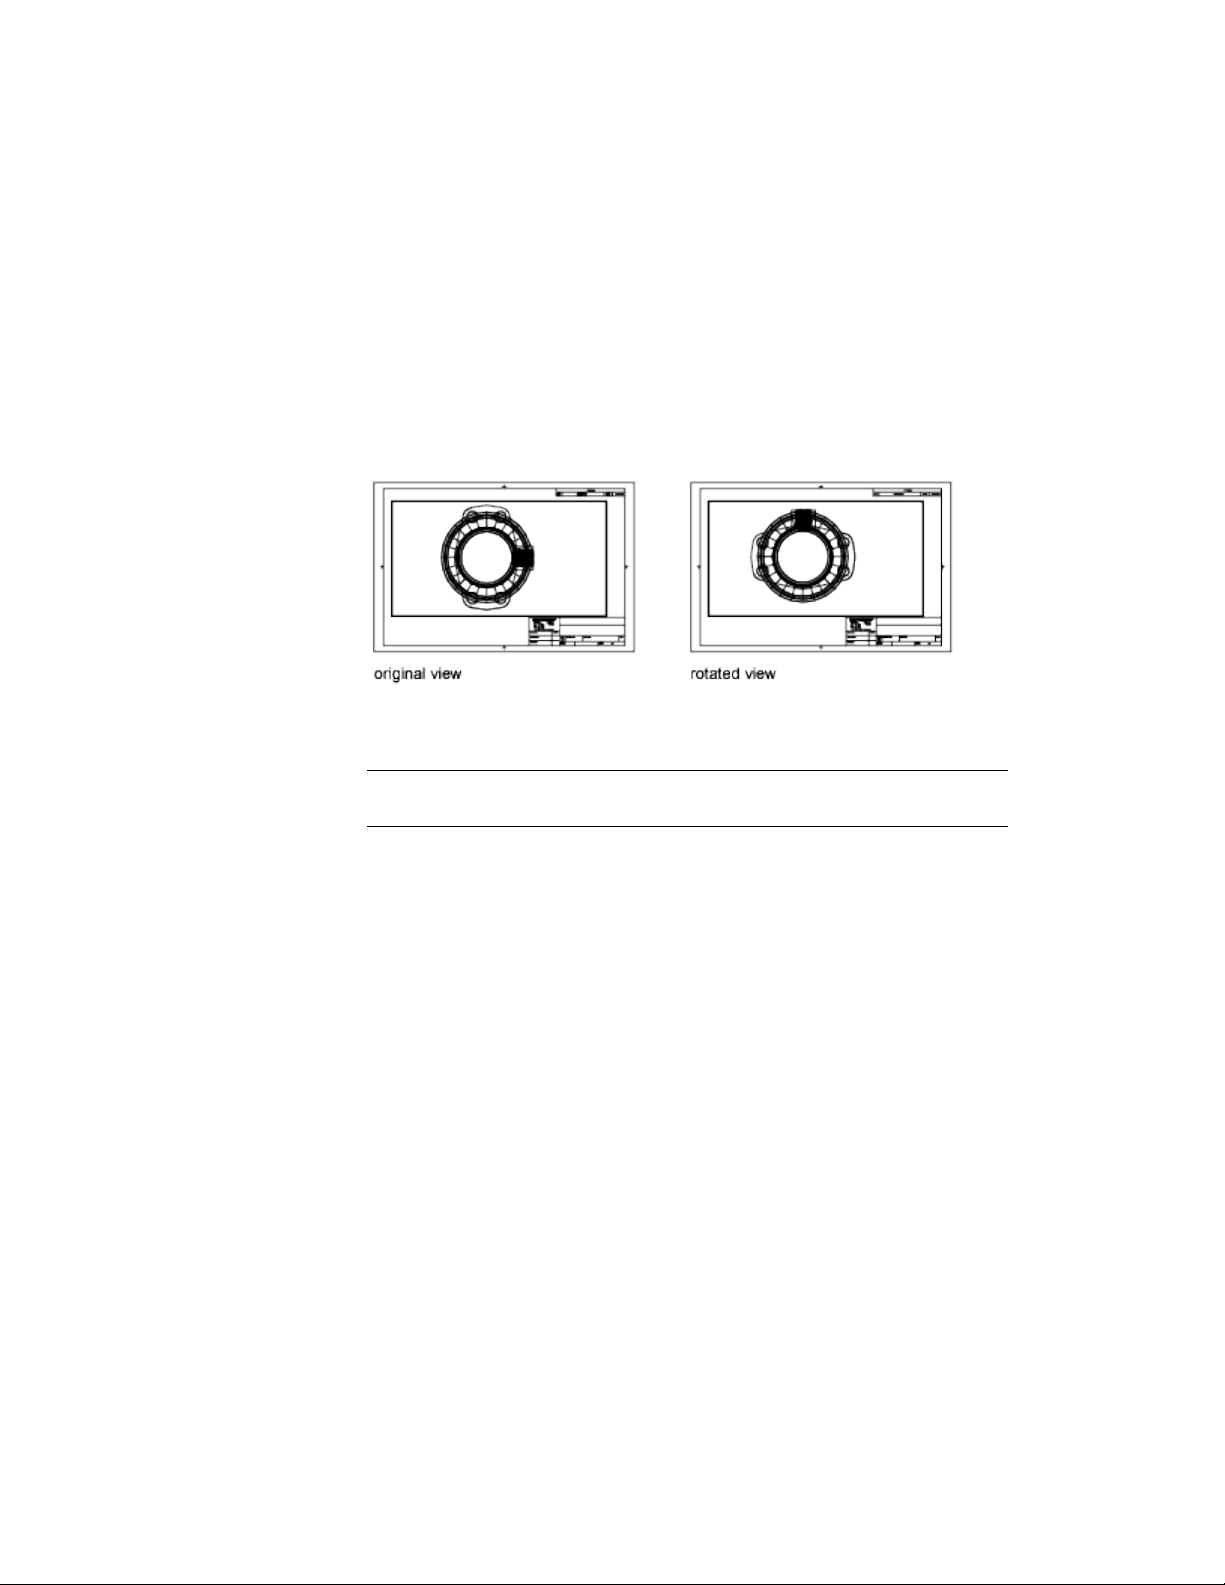
When VPROTATEASSOC is set to 1, the view within a viewport is rotated with
the viewport. When VPROTATEASSOC is set to 0, the view remains when the
viewport is rotated.
You can also rotate an entire view within a layout viewport by changing the
UCS and using the PLAN command.
With the UCS command, you can rotate the XY plane at any angle around
the Z axis. When you enter the PLAN command, the view rotates to match
the orientation of the XY plane.
Another way is to use the Align and then Rotate View options in the MVSETUP
command.
NOTE The ROTATE command rotates individual objects only and should not be
used to try to rotate a view.
Reuse Layouts and Layout Settings
When you create a layout, you can choose to apply the information from an
existing template.
A layout template is a layout imported from a DWG or DWT file. When you
create a layout, you can choose to apply the information from an existing
template. The program has sample layout templates to use when you design
a new layout environment. The paper space objects and page setup in the
existing template are used in the new layout. Thus, the layout objects,
including any viewport objects, are displayed in paper space. You can keep
any of the existing objects from the template you import, or you can delete
the objects. No model space objects are imported.
The layout templates are identified with a .dwt file extension. However, a
layout template or layout from any drawing or drawing template can be
imported into the current drawing.
Create Multiple-View Drawing Layouts (Paper Space) | 101

Save a Layout Template
Any drawing can be saved as a drawing template (DWT file), including all of
the objects and layout settings. You can save a layout to a new DWT file by
choosing the Save As option of the LAYOUT command. The template file is
saved in the drawing template file folder as defined in the Application tab
(Application Preferences dialog box). The layout template has a .dwt or .dwg
extension like a drawing template or drawing file, but it contains little
information not essential to the layout.
When you create a new layout template, any named items, such as blocks,
layers, and dimension styles, that are used in the layout are saved with the
template. These definition table items are imported as part of the layout
settings if you import this template into a new layout. It is recommended that
you use the Save As option of the LAYOUT command to create a new layout
template. When you use the Save As option, unused definition table items are
not saved with the file; they are not added to the new layout into which you
import the template.
If you insert a layout from a drawing or template that was not created using
the Save As option of the LAYOUT command, definition table items that are
used in the drawing but not in the layout are inserted with the layout. To
eliminate unnecessary definition table items, use the PURGE command.
Work with Layouts in a Project
With the Project Manager, you can organize drawing layouts into named
projects. The layouts in a project can be batch published as a unit.
Projects facilitate the organization and management of drawings and improve
the communication in a work group.
Quick Start for Projects
A project, also referred to as a sheet set, is an organized collection of layouts
from several drawing files.
Sets of drawings are the primary deliverable for most design groups. Sets of
drawings communicate the overall design intent of a project and provide the
documentation and specifications for the project. However, managing sets of
drawings manually can be complicated and time consuming.
102 | Chapter 5 Organize Drawings and Layouts
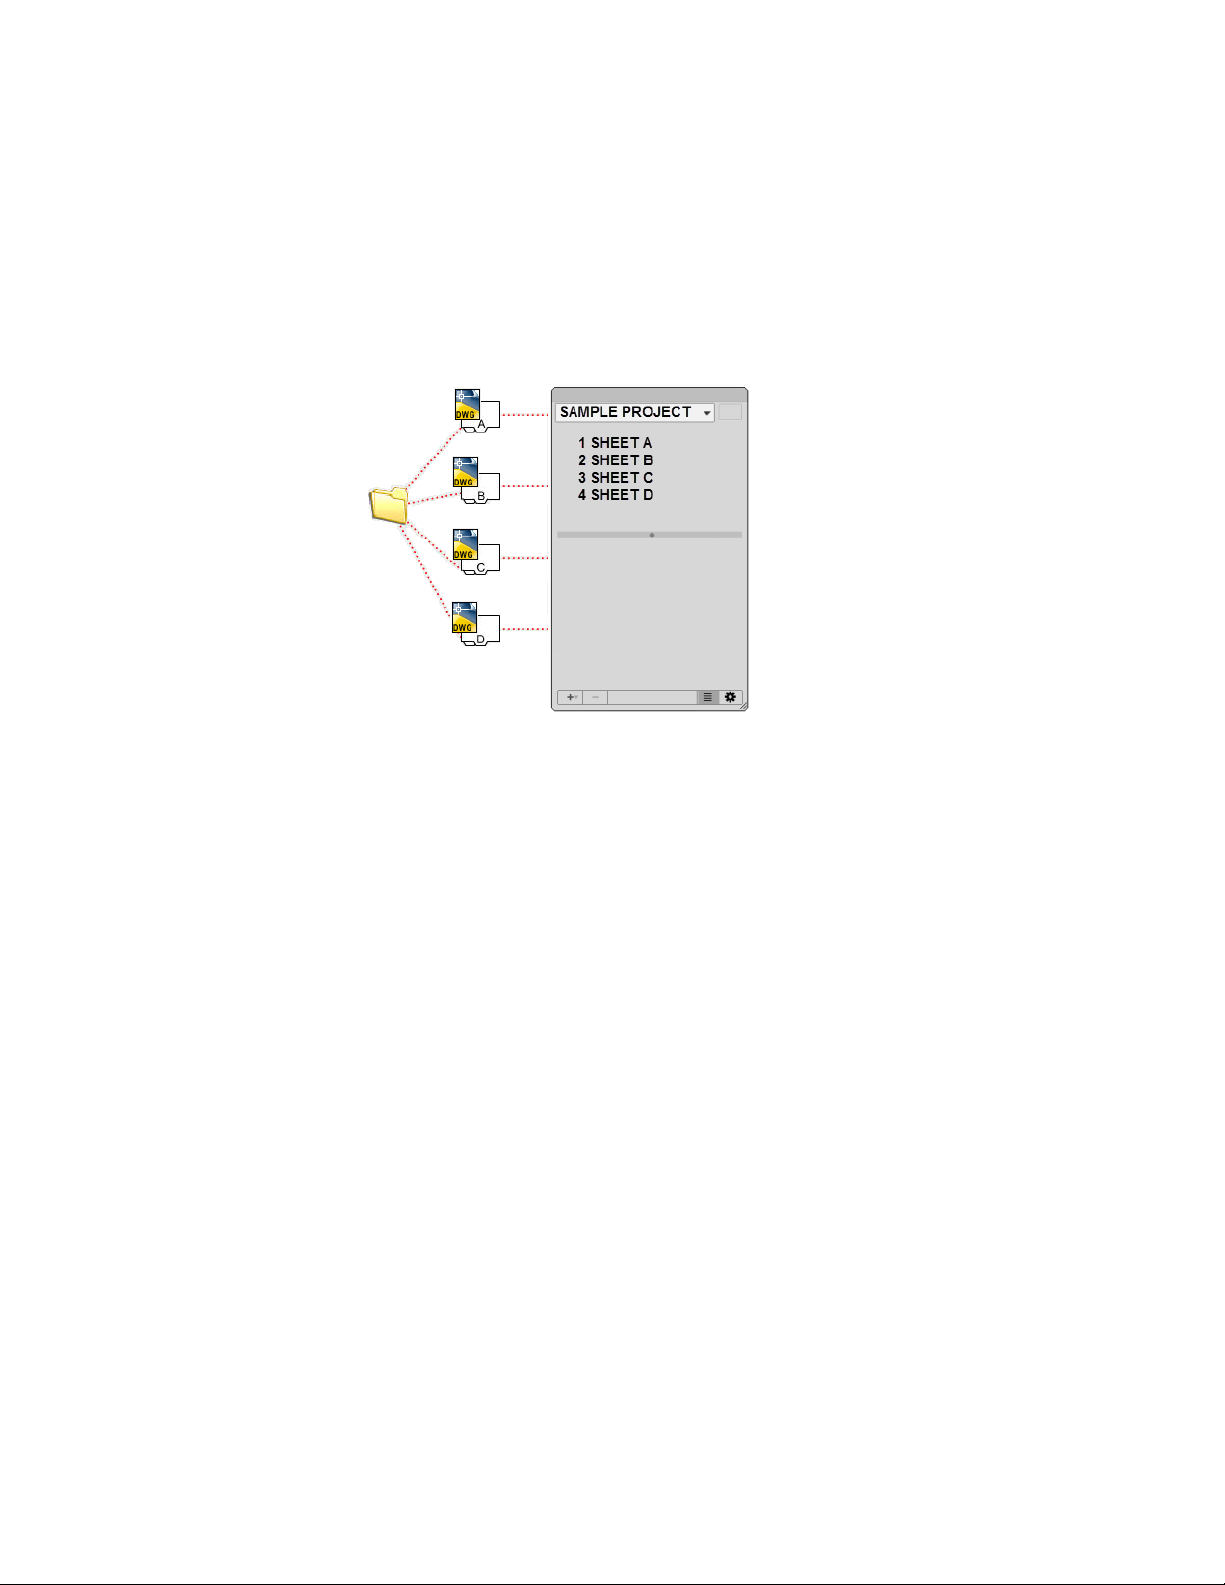
With the Project Manager, you can manage drawings as projects. A project is
an organized and named collection of layouts, or sheets, from several drawing
files. You can import a layout from any drawing into a project or create new
sheets from a the Project Manager which creates a new drawing with a named
layout.
You can manage and publish projects as a unit.
Understand the Project Manager Interface
Using the controls in the Project Manager, you can create, organize, and
manage layouts in a project.
You use the following features in the Project Manager:
Project Popup Menu. Lists all the open and recently opened projects. Use
the list to switch between open projects.
Publish Project Button. Displays and populates the Batch Publish dialog
box with all the layouts in the current project.
Project Tree View. Displays an organized list of all layouts in the current
project.
Details Panel. Displays the properties for the item selected in the Project
tree view. Click the Show/Hide Details button at the bottom of the Project
Manager to toggle the display of the Details panel.
Work with Layouts in a Project | 103

Create Action Button. Displays a popup menu that allows you to perform
one of the following actions:
■ Add a new layout to the project or selected group
■ Imports all named layouts from an existing drawing
■ Create a new group
■ Create a new project file
Remove Button. Removes the selected group or layout from the project.
Removing a layout does not delete the associated drawing file.
Show/Hide Details Button. Toggles the display of the Details panel.
Project Action Button. Displays a popup menu that allows you to perform
one of the following actions:
■ Open a project previously saved to disk
■ Close the current project
■ Publish the selected layouts in the current project
■ Switch to the Model tab when opening a drawing associated with a layout
■ Show who currently has a project or layout locked
■ Controls the renaming of drawing files and layouts when changing name
and numbers in the Project Manager
Actions Available in the Project Tree View
You can use the following actions in the tree view:
■ Double-click layouts to open the associated drawing.
■ Right-click to access shortcut menus of the operations that are relevant to
the currently selected item.
■ Drag items within the tree view to reorder them.
NOTE To use the Project Manager effectively, right-click items in the tree view to
access relevant shortcut menus.
Create and Manage a Project
There are several methods for setting up and organizing a project. You can
also include relevant information with a project and its layouts.
104 | Chapter 5 Organize Drawings and Layouts

Create a Project
You can create a project from scratch or use an existing project to define the
properties, items, and structure for a new project.
Layouts from specified drawing files can be imported into the project. The
associations and information that define a project are stored in a project data
(DST) file.
When creating a new project, a new folder is created as the default project
storage location. This new folder, named AutoCAD Projects, is located in the
Documents folder. The default location for the sheet set file can be changed,
and it is recommended that the DST file is stored with the files referenced by
the project.
NOTE The DST file should be stored in a network location that is accessible to all
users and mapped using the same logical drive. It is strongly recommended that
you store the DST and the drawings in the same folder. If an entire project needs
to be moved, or a server or folder name changes, the DST file will still be able to
locate the drawings using relative path information.
Preparation Tasks
Before you begin creating a project, you should complete the following tasks:
■ Consolidate drawing files. Move the drawing files to be used in the
project into a small number of folders. This will simplify administration
of managing the project and its files.
■ Eliminate multiple layout tabs. Each drawing you plan to use in the
project should have only one layout. This is important for access to layouts
when multiple users are working on the same project. A drawing can only
be opened for edit by one user at a time.
■ Create a layout from a template. Create or identify a drawing template
(DWT) file to be used by the project for creating new sheets. This drawing
template file is called the sheet creation template. You specify this template
file in the Details panel when a project is selected. You can also assign a
drawing template to a sub-group. Each sub-group can be assigned a different
drawing template than that assigned to the project.
■ Create a page setup overrides file. Create or identify a DWT file to
store page setups for publishing. This file, called the page setup overrides
file, can be used to apply a single page setup to all layouts in a project,
overriding the individual page setups stored in each drawing.
Work with Layouts in a Project | 105

NOTE Although it is possible to use several layouts from the same drawing file in
a project, it is not recommended. This makes concurrent access to each layout by
multiple users impossible. This practice can also reduce your management options
and can complicate the organization of layouts in the project.
Create a Blank Project
In the New Project dialog box, when you choose to create a blank project, you
provide the minimal information needed to create a new project. You must
provide a name and location for the project. Once the project is created, you
can then modify its properties, add layouts from existing drawings, and create
new layouts or sub-groups.
Create a Project from a Template
In the New Project dialog box, when you choose to create a project from a
template, the template project provides the organizational structure, groups,
and default properties for the new project.
Create a Project from an Existing Project
In the New Project dialog box, when you choose to create a project from an
existing DST file, the project provides the organizational structure only for
the new project. The properties are set to their default values and no layouts
are added from the existing project.
Backup and Recover Project Data Files
The data stored in the sheet set data file represents a significant amount of
work, so you should take the same care to create backups of DST files as you
do for drawing files.
In the unlikely event of DST file corruption or a major user error, the previously
saved project data file can be recovered. Every time the project data file is
opened, the current project data file is copied to a backup file (DS$). This
backup file has the same file name and is located in the same folder as the
current project data file.
To recover the previous version of the project data file, first make sure that
no one else on your network is working on the project. Then, it is
recommended that you copy the existing DST file to another file name. Finally,
rename the backup file from the DS$ file extension to the DST file extension.
106 | Chapter 5 Organize Drawings and Layouts

Create and Modify Layouts in a Project
There are several options in the Project Manager for creating and modifying
layouts directly in the interface or through a shortcut menu.
Following are descriptions of common operations when working with layouts
in the Project Manager. You can access commands by right-clicking an item
in the tree view to display the relevant shortcut menu.
■ Add layout from drawing. After you create a project, you can add one
or more layouts from existing drawings. You can initialize a layout by
switching to it using the QuickView dialog box or the layouts popup menu
on the status bar. A layout does not contain any print settings before
initialization. Once initialized, layouts can be drawn upon, published, and
added to projects (after the drawing has been saved).
■ Create a new layout. As an alternative to importing existing layouts
from a drawing, you can create a new drawing with a layout based on a
specified template. When you place views in this layout, the drawing files
associated with the views are attached as xrefs.
■ Modify a layout. Double-click a layout on the Project tree view to open
the associated drawing. To review a layout, right-click on the layout and
click Open Layout Read-only to open the drawing in read-only mode.
NOTE Modifying a layout should always be done using an open project in the
Project Manager. This ensures that all data associated with the layout is updated.
■ Rename and renumber a layout. After you create or add a layout, you
can change its title and number.
■ Remove a layout from a project. Removing a layout from a project
disassociates the layout from the project, but does not delete the associated
drawing file or the layout saved in the drawing.
■ Reassociate a layout. If you move a drawing to a different folder, you
should reassociate the layout to the project with the properties listed in
the Details panel to correct the path. To reassociate the layout, click the
Ellipsis button in Drawing Location property and specify the new location
of the drawing. Update the Layout property as needed.
Work with Layouts in a Project | 107
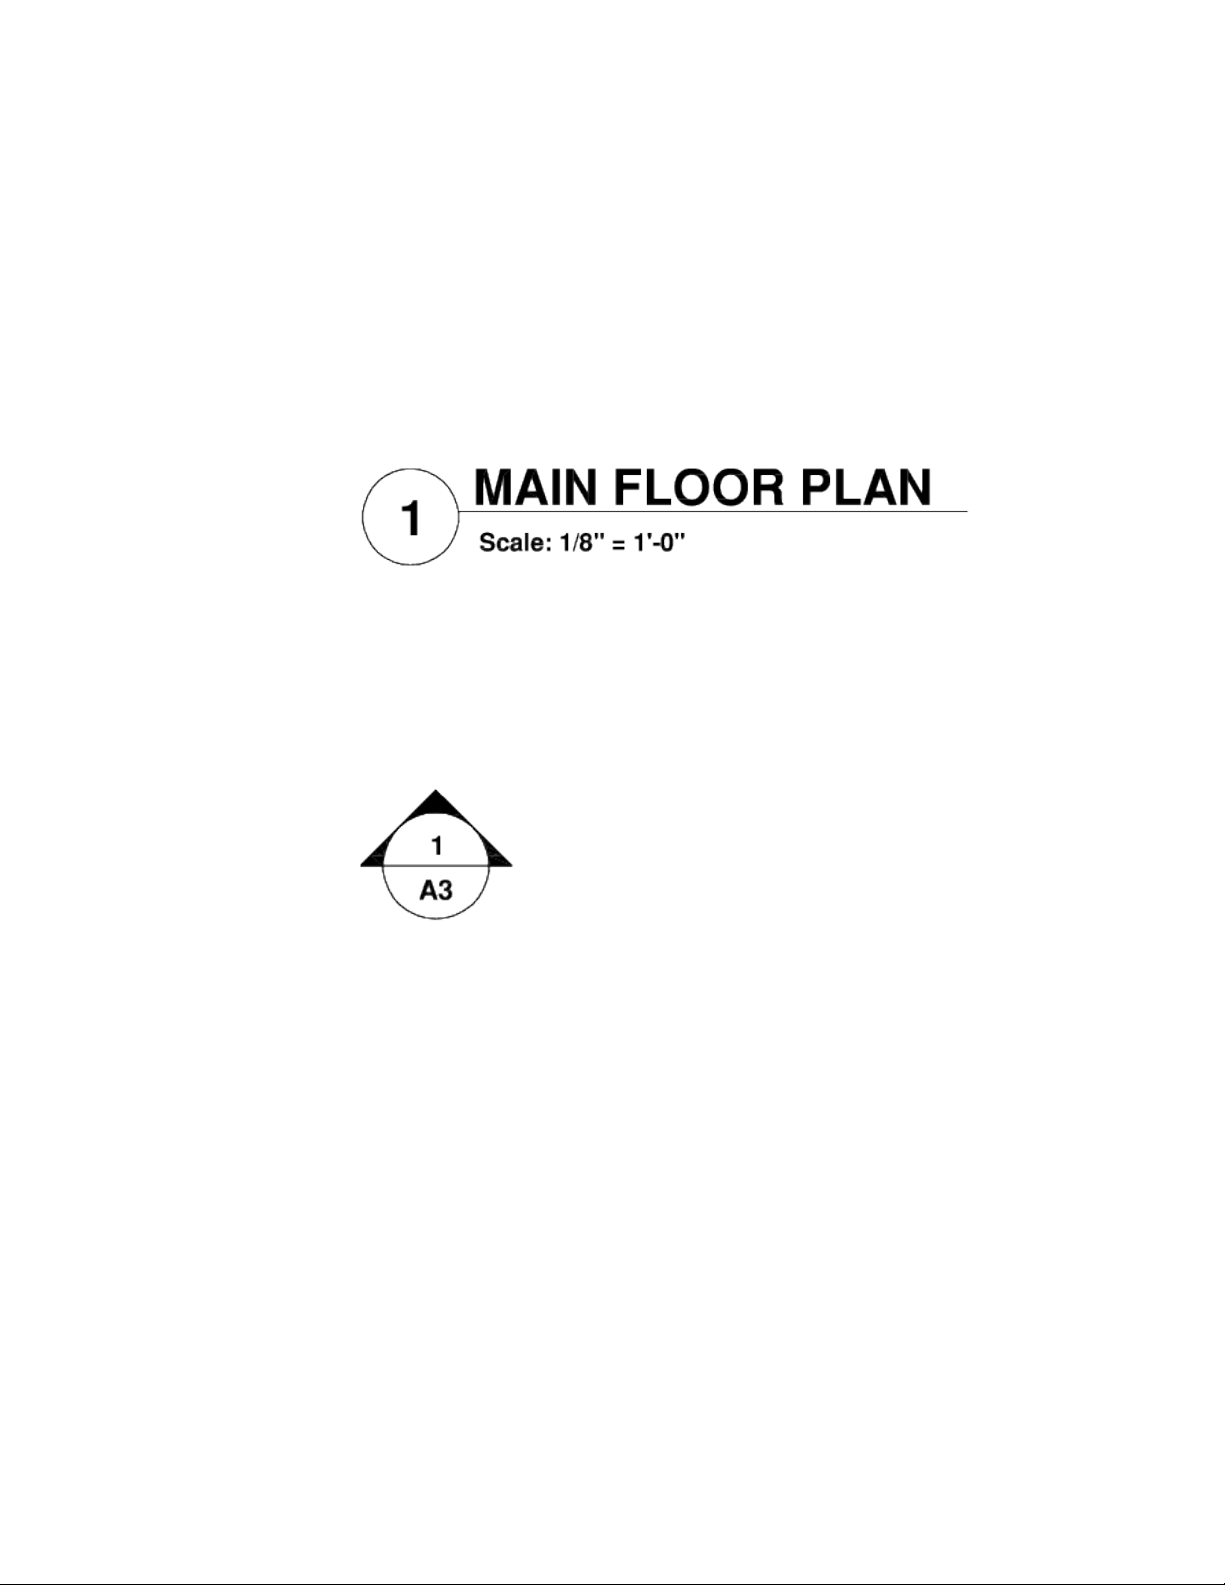
NOTE You can quickly confirm whether a layout is in the expected folder by
looking at the path information of the Drawing Location property and
comparing it with the path displayed in the Found Location property of the
Details panel.
■ Add label blocks to views. With the Project Manager, you can label
views and details automatically as you place them. Label blocks contain
data associated with the referenced view.
■ Add callout blocks to layouts. Callout blocks is the term for the symbols
that reference other layouts. Callout blocks have many industry-specific
names such as reference tags, detail keys, detail makers, building section
keys, and so on. Callout blocks contain data associated with the layout
and view that are referenced.
NOTE When you place a callout block with fields on a layout, make sure that
the current layer is unlocked.
Create Callout Blocks and Label Blocks (Advanced)
If you create a block to be used as a callout block or label block in a project,
you can use a placeholder field to display information such as view title or
layout number. The callout or label block must be defined in a DWG or DWT
file that is specified in the Details panel for the project. Later, you can insert
the callout block from the Layout shortcut menu or the label block from the
View shortcut menu in the tree view.
For the field to display the correct information about a view or layout on
which you later insert it, the field must be included within a block attribute,
not text, when you define the block. To create the block attribute definition,
108 | Chapter 5 Organize Drawings and Layouts

insert a placeholder field as the value, select the Preset option, and specify a
tag.
NOTE If you create your own label blocks and callout blocks, set any attribute
definitions to Preset to avoid prompts when placing these blocks in a drawing.
For more information about fields, see Insert Fields (page 536).
See also:
Create Multiple-View Drawing Layouts (Paper Space) (page 89)
Use Fields in Text (page 536)
Work with Views on Layouts
Layouts can contain viewports that show named model space views.
Project (DST) files created with the Sheet Set Manager in AutoCAD for Windows
can contain sheet views that are named model space views. Views that are
placed on a layout are displayed represented by a node in the Project Manager
below the layout they are placed on.
Named model space views cannot be placed on a layout with the Project
Manager. However, you can edit the properties of a view and place view label
blocks for a view on a layout that has already been placed. If you modify the
geometry in a drawing that contains the referenced named view, the changes
are displayed on the layout as long as the changed geometry is within the
boundary of the named view.
See also:
Create and Modify Layouts in a Project (page 107)
Save and Restore Views (page 59)
Organize a Project with Groups
Groups can be used to organize related layouts in a project.
Layouts can be arranged into collections called groups. Groups can also contain
sub-groups which is a nested group. The use of groups can make it easier to
locate a layout in a project and publish a small set of layouts that are in a
project.
Work with Layouts in a Project | 109

Use Groups in Projects
Project groups are often associated with a discipline such as architecture or
mechanical design. For example, in architecture, you might use a group named
Structural; and in mechanical design, you might use a group called Standard
Fasteners or Brackets. In some cases, you might also find it useful to create
groups associated with a review or completion status.
After you create or add layouts or groups, you can reorder them by dragging
them in the Project tree view.
Include Information with Projects, Groups, Layouts,
and Views
Projects, groups, layouts, and views include several types of information. This
information, called properties, includes titles, descriptions, file paths, and
custom properties that you define and place on a layout with fields.
Different Properties for Different Levels (Owners)
Projects, groups, layouts, and views represent different levels of organization,
and each of the items includes different types of properties. You specify the
values for these properties after you create the project, group, layout, or view.
In addition, you can define custom properties for a project and layout. The
values for custom properties for a project are typically specific to just that
project. For example, a custom property for a project might include the contract
number. The values for custom properties for layouts are typically specific to
each layout. For example, a custom property for a layout might include the
name of the designer.
You cannot create custom properties for groups.
View and Edit Properties
You can view and edit the properties of a project, group, layout, or view from
the Details panel. The properties and values that are displayed in the Details
panel depend on which you select. You can edit the value of a property by
clicking its value.
110 | Chapter 5 Organize Drawings and Layouts

Place Project Information on a Layout
Information about a project, or the layouts and views in a project can be
inserted as a field onto a layout that a project references. When the information
in a project is changed, the fields that reference the project are updated to
reflect the latest value when the layout is saved, printed, or published.
Placeholder fields are used to reference project information in a drawing
template or block. When a drawing template or block containing a placeholder
field is added to a project or layout in a project, the field value is resolved. If
the field value of a placeholder field is not resolved, the field displays ####
as its current value. For a list of available placeholder fields and information
about fields, see Insert Fields (page 536).
Publish Layouts and Projects
After you have organized drawings, you can publish the project as a package.
Use the Publish feature to output the layouts in a project to a printer or PDF
in either normal or reverse order. If you select a layout to publish, only that
layout is added to the Batch Publish dialog box. Selecting a group adds all the
layouts in that group to the Batch Publish dialog box, while selecting the
project name adds all layouts in the project to the dialog box.
You can exclude a layout or group from being published by changing the
values of the Include for Publish or Publish Sheets in Subsets properties in the
Details panel.
Use Page Setups
Page setups provide the settings that are used for publishing and printing.
When you create a project, you can specify a drawing template (DWT) file
that contains one or more page setups for all new layouts. This DWT file is
called the sheet creation template.
Another DWT file, called the page setup overrides file, contains page setups that
can be specified to override the page setups in each layout. You specify the
page setup overrides file in the Details panel.
When you publish a project, you can use the page setups defined in each
drawing file, you can use the page setup overrides for all drawing files, or you
can publish to a PDF file.
Work with Layouts in a Project | 111

NOTE With page setup overrides, you can use the PUBLISHCOLLATE system variable
to control whether printing a layout set can be interrupted by other plot jobs or
not.
Use Projects in a Team
You can use projects in a team that can involve network access and online
collaboration. The team can also include people who use software that does
not include the Project Manager.
Work in a Team That Uses Project Manager
When you use projects in a team, each member should have network access
to the project data (DST) file and the drawing template (DWT) files associated
with the project. Each team member can open the project to load the
information from the DST file into the Project Manager.
Any change made by a team member results in the DST file being opened
briefly while changes are being saved back. When the DST file is opened and
being edited, a lock icon appears below the Project popup menu. Adjacent to
the lock icon is the name of the user currently editing the file, in the format
of "In use by <user name>".
The lock icon appears under the following situations:
■ Properties of the project, a group, a layout, or a view in the project are
being edited.
■ A layout is being created or added to the project.
■ Project, group, or layout are being renamed.
■ Placement of a view label or callout block.
■ Project (DST) file is read-only or is in a read-only location.
As items are added or modified in the Project tree view, the changes are
automatically seen on other workstations that have the project (DST) file open
in the Project Manager.
If each member of the team has access to the drawing template (DWT) files,
new drawing files and their layouts are created using the same standards; page
setups for these drawings are also standardized.
112 | Chapter 5 Organize Drawings and Layouts
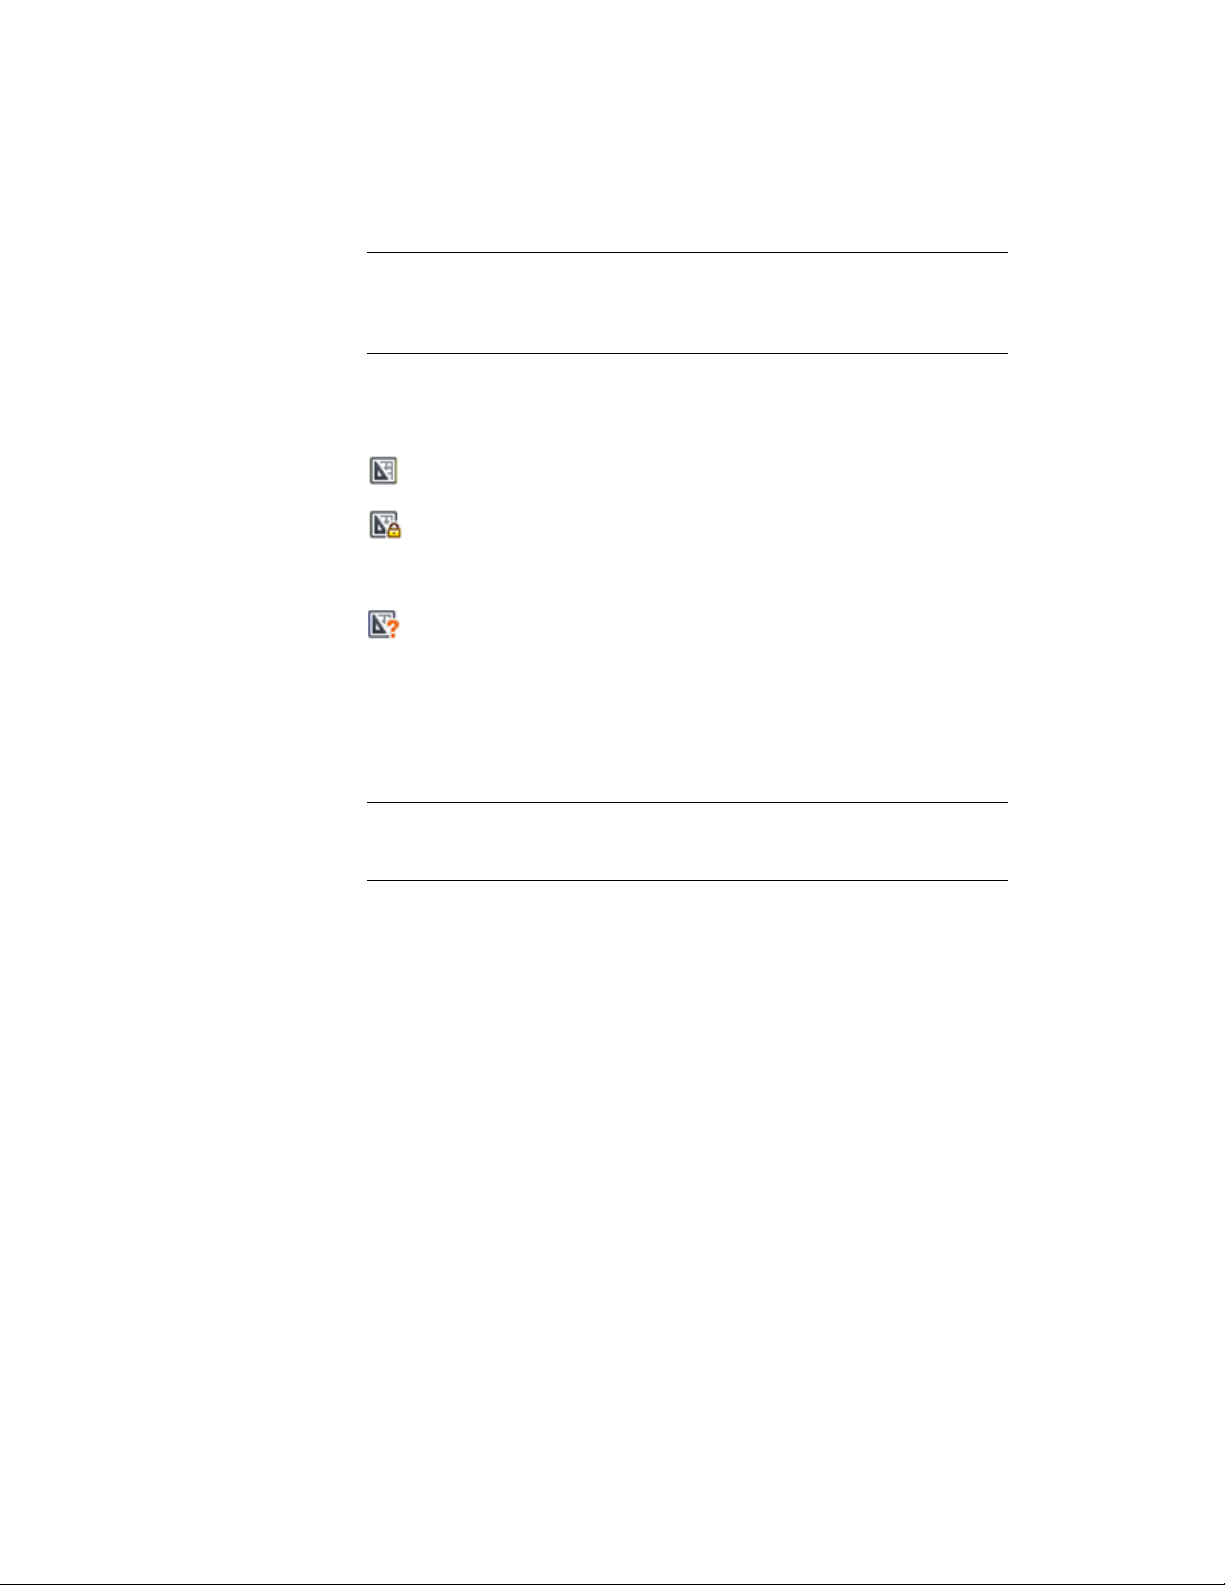
NOTE If two or more users access the same project through different logical drives
on a network, each will in turn be prompted to resave the project using their own
logical drive. To avoid unnecessary saving, users should map the same logical
drives, if possible.
Status data for layouts in the current project are also available to other team
members. This status data is displayed in the tree view and indicates one of
the following conditions:
The layout is available for editing.
The layout is locked. In addition to the lock icon, the name of the user
currently editing the file, in the format of "In use by <user name>", is displayed
below the layout.
The layout is missing or found in an unexpected folder location.
The active layouts of other team members are automatically polled for status
changes; the tree view is updated in your session of the Project Manager. The
polling cycle skips the poll interval in your session when a command is active.
You can click any layout to display more information in the Details panel of
the Project Manager.
NOTE A false lock icon may be displayed if there is a network problem or if the
program terminates unexpectedly. If you suspect a problem, click the layout to
display more information.
Work in a Team That Does Not Use Project Manager
With some limitations, you can use projects in a team with members who do
not have network access, or do not have access to the Project Manager. These
team members may be using an older version of AutoCAD. In those
circumstances, not all members of the team will have access to the DST file.
However, relevant information from the DST file is stored (cached) in each
drawing file, and project information, such as custom properties, is preserved
when the drawing file is shared by other team members.
After a member of the team changes information in the DST file, the
information in several drawing files might need to be updated. With the
project open, update a layout by opening and saving the layout.
Work with Layouts in a Project | 113

Use Projects in a Multiple Operating System
Environment
Project (DST) files can be used across both the Mac OS X and Windows
operating systems.
Project files can be used in releases of AutoCAD or AutoCAD LT that support
the Sheet Set Manager on Windows or the Project Manager on Mac OS X. The
project (DST) file is an XML based file which allows the files to be used between
both platforms. You will want to make sure that the drawing (DWG) files
referenced by the layouts in the project (DST) file are in a network location
that can be accessed by both Windows and Mac OS X.
In addition to the drawing and drawing template files referenced by the project
file, you need to make sure the following are also accessible to all users:
■ Drawing template (DWT) files
■ Callout blocks
■ View label blocks
■ Page setups
Project Terminology Differences
The terminology used on AutoCAD for Windows is different from that on the
Mac OS X.
DescriptionWindows TermMac OS X Term
User interface used to access
the information about lay-
Sheet Set ManagerProject Manager
outs and views stored in a
project (DST) file
The XML file used to store
the associations and inform-
sheet set fileproject file
ation that define a project.
File extension is DST.
An organized and named
collection of layouts from
several drawing files.
sheet setproject
114 | Chapter 5 Organize Drawings and Layouts

DescriptionWindows TermMac OS X Term
A layout selected from a
drawing file and assigned to
a project.
sheetlayout
A group of layouts in a pro-
ject that is often organized
subsetgroup
by discipline or workflow
stage.
A named model space view
placed on a layout.
sheet viewnamed view
Work with Layouts in a Project | 115

116

Create and Modify Ob-
jects
Control the Properties of Objects
You can organize objects in your drawing and control how they are displayed
and plotted by changing their properties, which include layer, linetype, color,
lineweight, transparency, and plot style.
Work with Object Properties
You can change the object properties in your drawing by using the Properties
Inspector palette.
Overview of Object Properties
Every object you draw has properties. Some properties are general and apply to
most objects; for example, layer, color, linetype, transparency, and plot style.
Other properties are object-specific; for example, the properties of a circle include
radius and area, and the properties of a line include length and angle.
Most general properties can be assigned to an object by layer or can be assigned
to an object directly.
■ When a property is set to the value BYLAYER, the object is assigned the same
value as the layer on which it is drawn.
For example, if a line drawn on layer 0 is assigned the color BYLAYER, and
layer 0 is assigned the color Red, the line is red.
6
117

■ When a property is set to a specific value, that value overrides the value
set for the layer.
For example, if a line drawn on layer 0 is assigned the color Blue, and layer
0 is assigned the color Red, the line is blue.
See also:
Control the Color and Linetype Properties in Blocks (page 319)
Display and Change the Properties of Objects
You can display and change the current properties for any object in your
drawing.
Use the Properties Inspector Palette
The Properties Inspector palette lists the current settings for properties of the
selected object or set of objects. You can modify any property that can be
changed by specifying a new value.
■ When more than one object is selected, the Properties Inspector palette
displays only those properties common to all objects in the selection set.
■ When no objects are selected, the Properties Inspector palette displays only
the general properties of the current layer, the name of the plot style table
attached to the layer, the view properties, and information about the UCS.
Control Double-Click Behavior
You can double-click most objects to open the Properties Inspector palette
when the DBLCLKEDIT and PICKFIRST system variables are turned on (the
default).
Several types of objects open an editor or start an object-specific command
when you double-click them instead of the Properties Inspector palette. These
types of objects include blocks, polylines, splines, text, and more.
See also:
Control the Color and Linetype Properties in Blocks (page 319)
Set Interface Options (page 35)
118 | Chapter 6 Create and Modify Objects
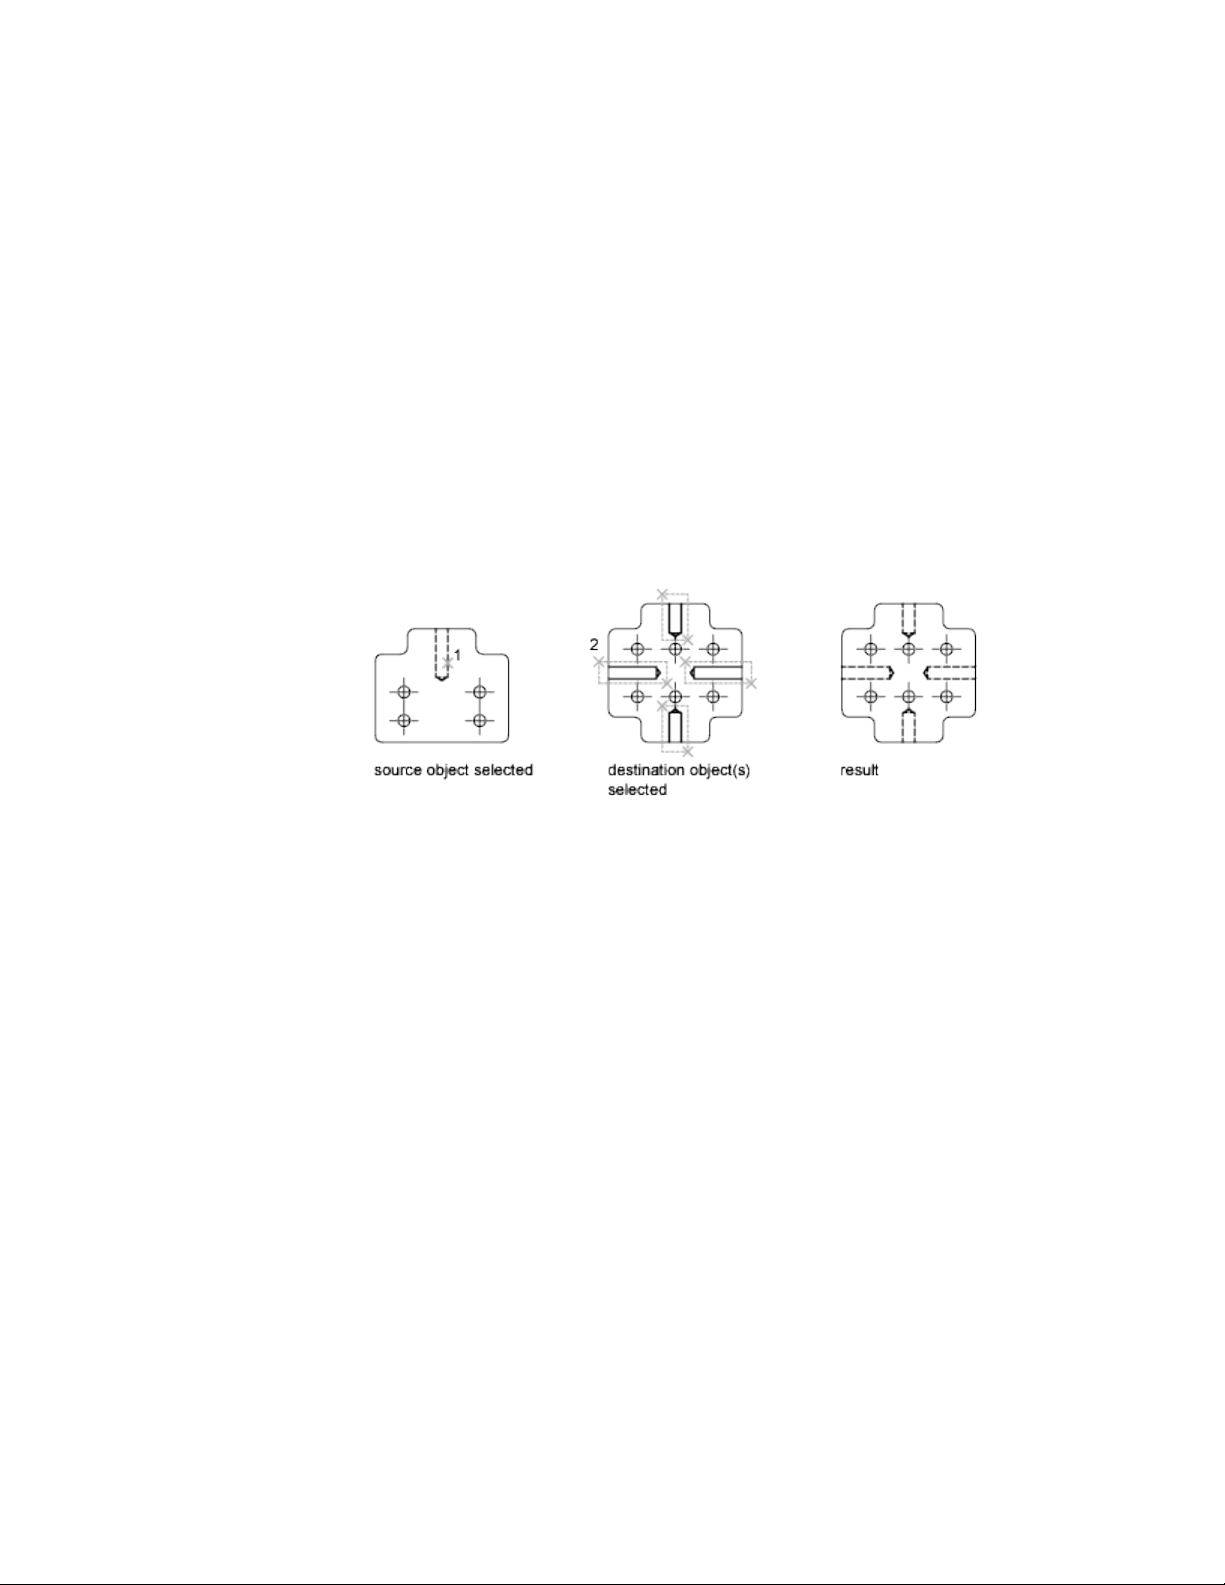
Copy Properties Between Objects
You can copy some or all properties of one object to other objects using Match
Properties.
The types of properties that can be copied include, but are not limited to,
color, layer, linetype, linetype scale, lineweight, plot style, transparency,
viewport property overrides, and 3D thickness.
By default, all applicable properties are automatically copied from the first
object you selected to the other objects. If you don't want a specific property
or properties to be copied, use the Settings option to suppress the copying of
that property. You can choose the Settings option at any time during the
command.
Work with Layers
Layers are like transparent overlays on which you organize and group objects
in a drawing.
Overview of Layers
Layers are used to group information in a drawing by function and to enforce
linetype, color, and other standards.
Layers are the equivalent of the overlays used in paper-based drafting. Layers
are the primary organizational tool used in drawing. Use layers to group
information by function and to enforce linetype, color, and other standards.
Control the Properties of Objects | 119
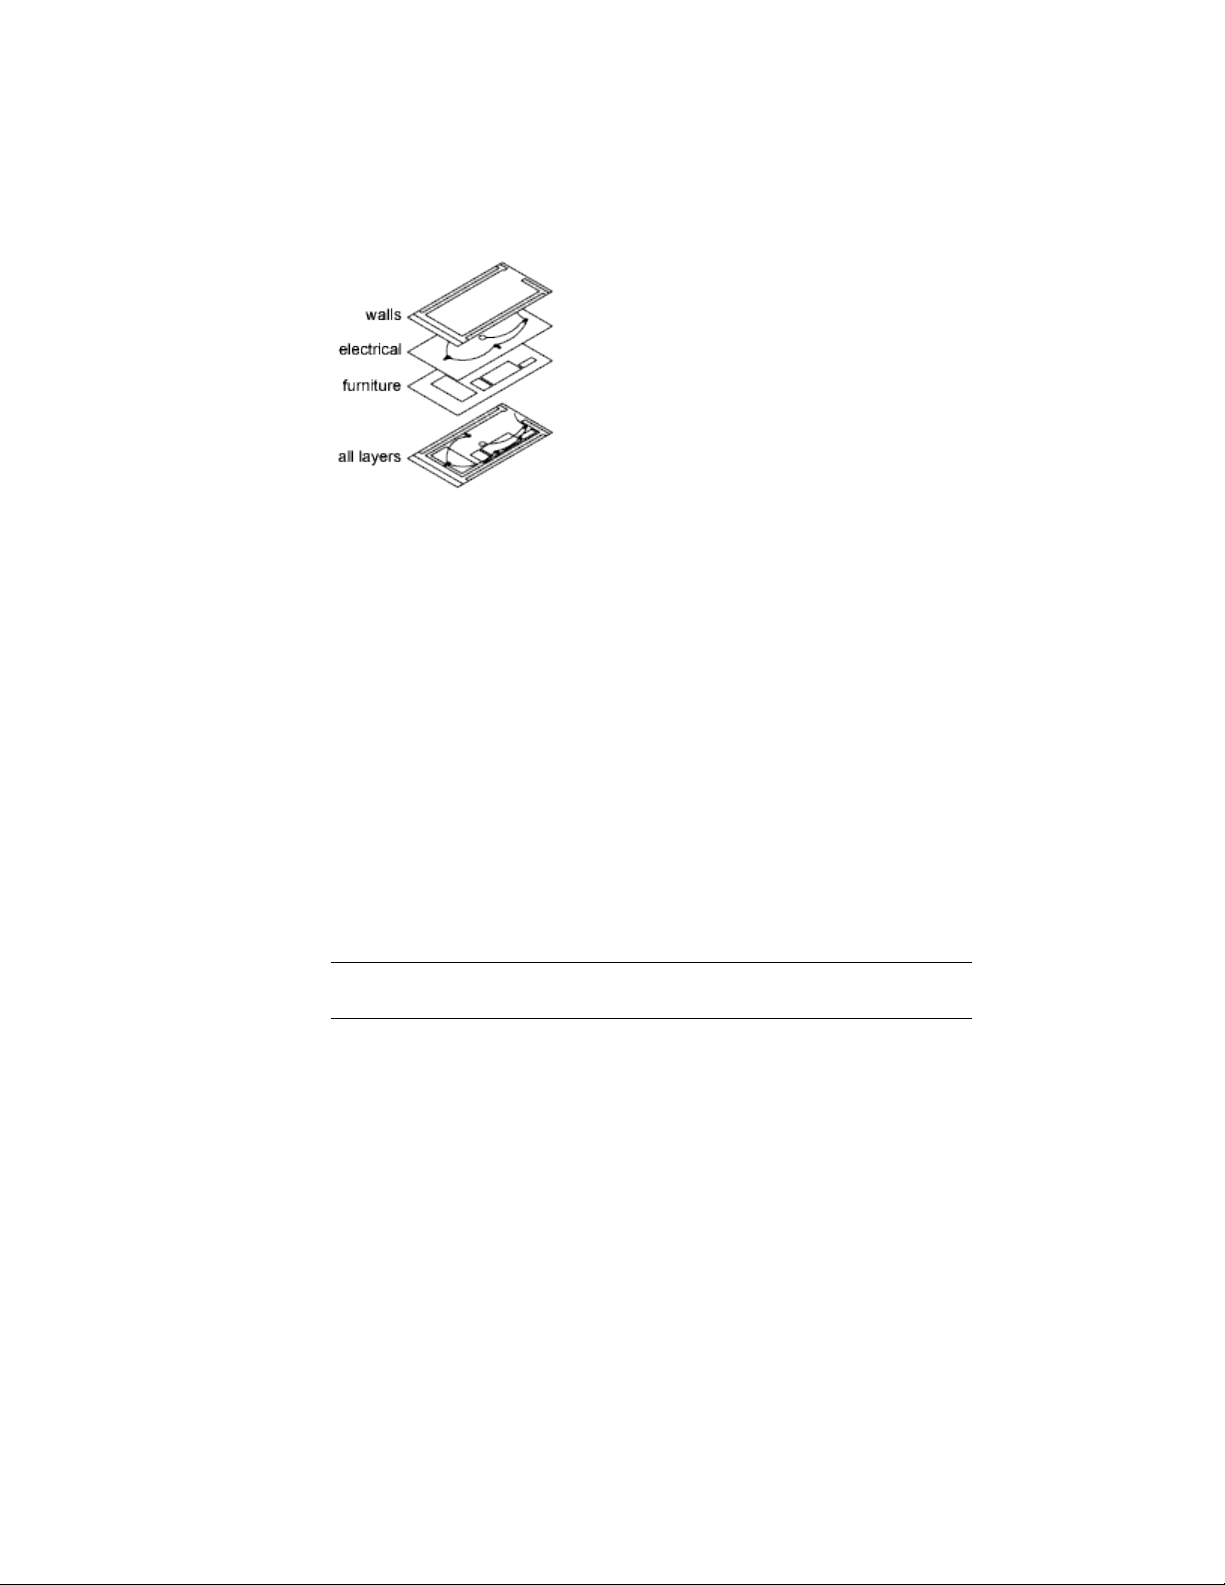
By creating layers, you can associate similar types of objects by assigning them
to the same layer. For example, you can put construction lines, text,
dimensions, and title blocks on separate layers. You can then control the
following:
■ Whether objects on a layer are visible or dimmed in any viewports
■ Whether and how objects are plotted
■ What color is assigned to all objects on a layer
■ What default linetype and lineweight are assigned to all objects on a layer
■ Whether objects on a layer can be modified
■ Whether objects display with different layer properties in individual layout
viewports
Every drawing includes a layer named 0. Layer 0 cannot be deleted or renamed.
It has two purposes:
■ Ensure that every drawing includes at least one layer
■ Provide a special layer that relates to controlling colors in blocks
NOTE It is recommended that you create several new layers with which to organize
your drawing rather than create your entire drawing on layer 0.
Use Layers to Manage Complexity
You can use layers to control the visibility of objects and to assign properties
to objects. Layers can be locked to prevent objects from being modified.
You can reduce the visual complexity of a drawing and improve display
performance by controlling how objects are displayed or plotted. For example,
you can use layers to control the properties and visibility of similar objects,
120 | Chapter 6 Create and Modify Objects

such as electrical parts or dimensions. Also, you can lock a layer to prevent
objects on that layer from being accidentally selected and modified.
Control the Visibility of Objects on a Layer
You can make drawing layers invisible either by turning them off or by freezing
them. Turning off or freezing layers is useful if you need an unobstructed view
when working in detail on a particular layer or set of layers or if you don't
want to plot details such as reference lines. Whether you choose to freeze
layers or turn them off depends on how you work and on the size of your
drawing.
■ On/Off. Objects on turned-off layers are invisible, but they still hide
objects when you use HIDE. When you turn layers on and off, the drawing
is not regenerated.
■ Freeze/Thaw. Objects on frozen layers are invisible and do not hide
other objects. In large drawings, freezing unneeded layers speeds up
operations involving display and regeneration. Thawing one or more layers
may cause the drawing to be regenerated. Freezing and thawing layers
takes more time than turning layers on and off.
In a layout, you can freeze layers in individual layout viewports.
NOTE Instead of turning off or freezing a layer, you can fade the layer by locking
it. See “Lock the Objects on a Layer” below.
Control Transparency on Layers
Set the transparency of layers and layout viewports to enhance drawings by
reducing the visibility of all object on specific layers as needed. Set layer (or
layout viewport) transparency in the Layers palette.
After you apply transparency to a layer, all objects added to that layer are
created at the same level of trasparency. The transparency property for all
objects on the layer is set to ByLayer.
Assign a Default Color and Linetype to a Layer
Each layer has associated properties such as color, linetype, and transparency
that are assumed by all objects on that layer when the setting is ByLayer.
For example, if the Properties Inspector palette set to BYLAYER when no object
is selected, the color of new objects is determined by the color setting for the
layer in the Layers palette.
Control the Properties of Objects | 121

If you set a specific color to the Properties Inspector palette when no objects
are selected, that color is used for all new objects, overriding the default color
for the current layer. The same is true for Linetype, Lineweight, Transparency,
and Plot Style properties on the Properties Inspector palette.
The BYBLOCK setting should be used only for creating blocks. See Control
the Color and Linetype Properties in Blocks (page 319).
Override Layer Properties in a Layout Viewport
Some layer properties can be changed using overrides on a viewport basis in
layouts. Using layer property overrides is an efficient way to display objects
with different property settings for color, linetype, lineweight, transparency,
and plot style. Layer property overrides are applied to the current layout
viewport.
For example, if you want objects on the Electrical layer to display prominently
in one of two layout viewports, you set a Color override on the Electrical layer
for each of the two viewports. By setting the color red for one viewport and
gray for the other, you easily accomplish this objective without changing the
global color property assigned to the layer. See Override Layer Properties in
Viewports (page 125) for more information.
Lock the Objects on a Layer
When a layer is locked, none of the objects on that layer can be modified until
you unlock the layer. Locking layers reduces the possibility of modifying
objects accidentally. You can still apply object snaps to objects on a locked
layer and perform other operations that do not modify those objects.
You can fade the objects on locked layers to make them appear more faint
than other objects. This serves two purposes:
■ You can easily see what objects are on locked layers.
■ You can reduce the visual complexity of a drawing but still maintain visual
reference and object snapping capabilities to those objects.
The LAYLOCKFADECTL system variable controls the fading applied to locked
layers. Locked layers that are faded are plotted normally.
When you lock a layer that contains transparent objects, the visibility of those
objects is further reduced by the specified locked layer fading value.
NOTE Grips are not displayed on objects that are on locked layers.
122 | Chapter 6 Create and Modify Objects

Create and Name Layers
You can create and name a new layer for each conceptual grouping (such as
walls or dimensions) and assign common properties to each layer.
By organizing objects into layers, you can control the visibility and object
properties of a large number of objects separately for each layer and make
changes quickly.
NOTE The number of layers that you can create in a drawing and the number of
objects that you can create on each layer are practically unlimited.
Choose Layer Names Carefully
A layer name can include up to 255 characters (double-byte or alphanumeric):
letters, numbers, spaces, and several special characters. Layer names cannot
include the following characters:
< > / \ “ : ; ? * | = ‘
In many cases, the layer names you choose are dictated by corporate, industry,
or client standards.
The Layers palette sorts layers alphabetically by name. If you organize your
own layer scheme, choose layer names carefully. Use common prefixes to
name layers with related drawing components, this makes it easier to locate
and manipulate groups of layers at a time.
NOTE If you consistently use a specific layering scheme, you can set up a drawing
template with layers, linetypes, and colors already assigned. For more information
about creating templates, see Use a Drawing Template File (page 42).
Select a Layer to Draw On
As you draw, newly created objects are placed on the current layer. The current
layer may be the default layer (0) or a layer you create and name yourself. You
switch from one layer to another by making a different layer current; any
subsequent objects you create are associated with the new current layer and
use its color, linetype, and other properties. You cannot make a layer the
current layer if it is frozen or if it is an xref-dependent layer.
Control the Properties of Objects | 123

Remove Layers
You can remove unused layers from your drawing with PURGE or by deleting
the layer from the Layers palette. You can delete only unreferenced layers.
Referenced layers include layers 0 and DEFPOINTS, layers containing objects
(including objects in block definitions), the current layer, and xref-dependent
layers.
WARNING Be careful about deleting layers if you are working on a drawing in a
shared project or one based on a set of layering standards.
Change Layer Settings and Layer Properties
You can change the name of a layer and any of its properties, including color
and linetype, and you can reassign objects from one layer to another.
Because everything in your drawing is associated with a layer, it's likely that
in the course of planning and creating a drawing, you'll need to change what
you place on a layer or how you view the layers in combination. You can
■ Reassign objects from one layer to another.
■ Change the name of a layer.
■ Change the default color, linetype, or other properties of the layer.
Reassigning an object to a different layer is useful if you create an object on
the wrong layer or decide to change your layer organization. Unless the color,
linetype, or other properties of the object have been set explicitly, an object
that you reassign to a different layer will acquire the properties of that layer.
You change layer properties in the Layers palette. Click the icons to change
settings, and rename layers or change descriptions.
Undo Changes to Layer Settings
You can use Layer Previous to undo changes you make to layer settings. For
example, if you freeze several layers and change some of the geometry in a
drawing, and then want to thaw the frozen layers, you can do this with a
single command without affecting the geometry changes. In another example,
if you changed the color and linetype of several layers but later decide you
prefer the old properties, you can use Layer Previous to undo the changes and
restore the original layer settings.
124 | Chapter 6 Create and Modify Objects

When you use Layer Previous, it undoes the most recent layer change or set
of changes made. Every change you make to layer settings is tracked and can
be undone with Layer Previous. You can use LAYERPMODE to suspend layer
property tracking when you don't need it, such as when you run large scripts.
There is a modest performance gain in turning off Layer Previous tracking.
Layer Previous does not undo the following changes:
■ Renamed layers. If you rename a layer and change its properties, Layer
Previous restores the original properties but not the original layer name.
■ Deleted layers. If you delete or purge a layer, using Layer Previous does
not restore it.
■ Added layers. If you add a new layer to a drawing, using Layer Previous
does not remove it.
Override Layer Properties in Viewports
You can display objects differently by setting property overrides for color,
linetype, lineweight, transparency, and plot style and apply them to individual
layout viewports.
Using property overrides is an efficient way for displaying objects with different
property settings in individual viewports without changing their ByLayer or
ByBlock properties. For example, objects can be made to display more
prominently by changing their color. Because layer property overrides do not
change the layer’s global properties, you can have objects display differently
in various viewports without having to create duplicate geometry or use xrefs
that have different layer settings.
Control the Properties of Objects | 125
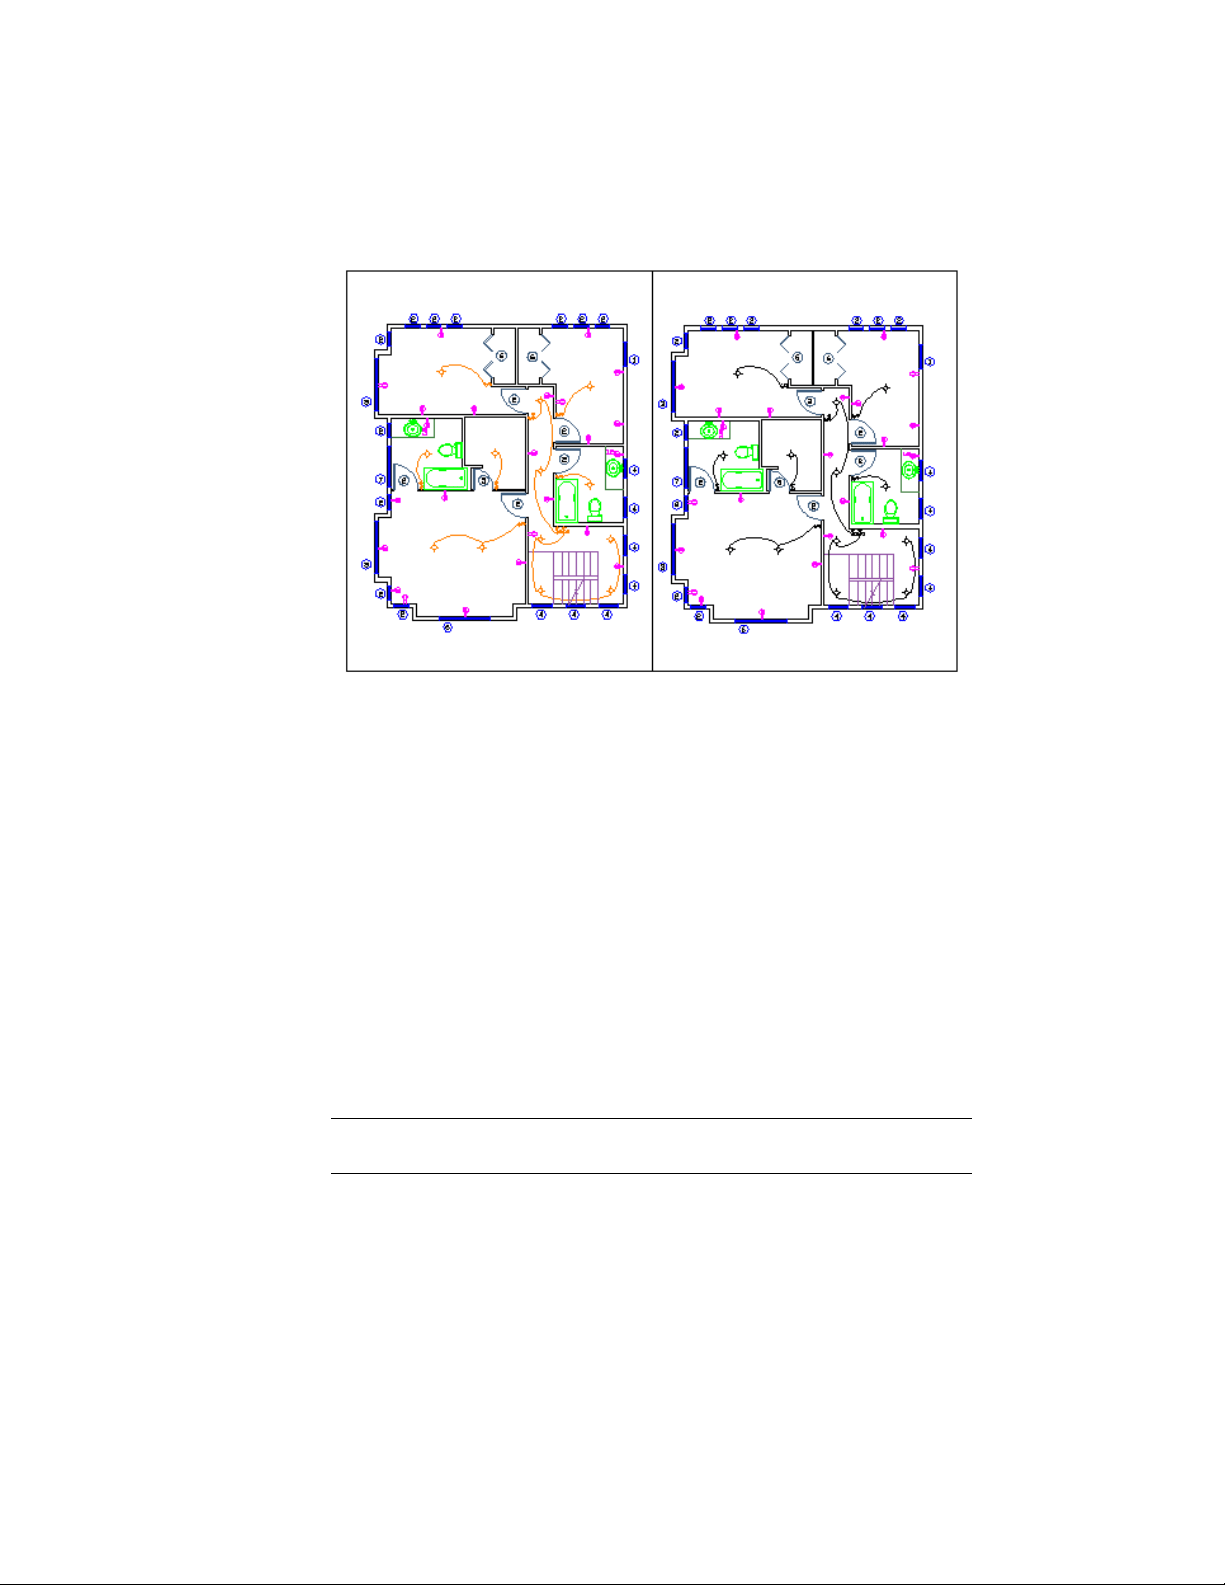
Property override settings for color and lineweight were set on the Wiring layer for
the viewport on the left. Notice the wiring is a different color and lineweight than in
the right viewport.
When the Layers palette is accessed from a layout, five columns for layer
property overrides are displayed
■ Viewport Color
■ Viewport Linetype
■ Viewport Lineweight
■ Viewport Transparency
■ Viewport Plot Style (available only in named-plot style drawings)
When a property override is set for a layer, a Viewport Overrides layer group
is automatically created in the Layers palette.
If you do not want to display or plot property overrides, set the
VPLAYEROVERRIDESMODE system variable to 0. Objects will display and plot
with their global layer properties.
NOTE Property overrides can still be set even when VPLAYEROVERRIDESMODE is
set to 0.
Property overrides that are on xref layers are not retained when the VISRETAIN
system variable is set to 0.
126 | Chapter 6 Create and Modify Objects

Viewport Property Overrides and Visual Styles
Layer property overrides for color, linetype, and lineweights are displayed in
viewports regardless of the visual style that is current. Although plot style
overrides can be set when the visual style is set to Conceptual or Realistic style,
they are not displayed or plotted.
Identify Layers with Property Overrides
Layers containing property overrides are identifiable in the Layers palette
when accessed from a layout. You can see which layers have overrides by the
following:
■ A tooltip displays property override information when the cursor is placed
over the status icon for the layer containing overrides.
■ A predefined filter named Viewport Overrides is displayed in the tree view
where all layers with viewport overrides are listed.
Identify Viewports with Layer Property Overrides
Use the VPLAYEROVERRIDES system variable to check if the current viewport
contains layer property overrides. When VPLAYEROVERRIDES is equal to 1,
the viewport contains overrides.
You can also use the Properties Inspector palette to determine if a viewport
contains overrides. The Properties Inspector palette displays a Layer Property
Overrides field. The value that displays is the same as the setting for
VPLAYEROVERRIDES.
Remove Layer Property Overrides
When you right-click a layer in the Layers palette, a shortcut menu is displayed
that lists options for removing property overrides. You can remove
■ A single property override from the selected layer for the selected viewport
or for all selected viewports
■ All property overrides from the selected layer for the selected viewport or
for all selected viewports
■ All property overrides from all layers in the selected viewport or for all
selected viewports
NOTE Another method for removing property overrides is to use the shortcut
menu when you right-click the border of the selected viewport or viewports. You
can remove viewport overrides for all layers for that viewport.
Control the Properties of Objects | 127

Group and Sort the List of Layers
You can control which layer names are listed in the Layers palette and sort
them by name or by property, such as color or visibility.
A layer group organizes the display of layer names in the Layers palette. In a
large drawing, you can use layer groups to list the layers you need to work
with.
There are two kinds of layer groups
■ Layer dynamic group Includes layers that have names or other
properties in common. For example, you can define a layer group that
includes all layers that are red and whose names include the letters mech.
■ Layer group Includes the layers that are put into the layer group when
you define it, regardless of their names or properties. Selected layers can
be added from the layer list by dragging them to the layer group.
The Layers palette displays some default and any named layer groups that you
create and save in the current drawing. Four default filters are displayed
■ All Used Layers. Displays all the layers on which objects in the current
drawing are drawn.
■ Xref. If xrefs are attached to the drawing, displays all the layers being
referenced from other drawings.
■ Viewport Overrides. If there are layers with overrides for the current
viewport, displays all layers containing property overrides.
■ Unreconciled Layers. If new layers were added since the drawing was
last opened, saved, reloaded, or plotted, displays a list of new unreconciled
layers. See Reconcile New Layers (page 131) for more information.
NOTE The default layer groups cannot be renamed, edited, or deleted.
Once you have named and defined a layer group, you can expand it in the
Layers list to see the layers it contains.
When you select a layer group and right-click, options on the shortcut menu
can be used to delete, rename, or modify the layer group or the layers in the
group. For example, you can convert a dynamic layer group to a layer group.
You can also change a property of all layers in a layer group.
128 | Chapter 6 Create and Modify Objects

Define a Dynamic Layer Group
A layer group rule is defined in the New Dynamic Group dialog box, where
you select any of the following properties you want to include in the layer
group definition:
■ Layer names, colors, linetypes, lineweights, and plot styles
■ Whether layers are in use
■ Whether layers are turned on or off
■ Whether layers are frozen or thawed in the active viewport or all viewports
■ Whether layers are locked or unlocked
■ Whether layers are set to be plotted
You use wild-card characters to filter layers by name. For example, if you want
to display only layers that start with the letters mech, you can enter mech*.
See “Wild-Card Characters” for a complete list.
The layers in a dynamic layer group may change as the properties of the layers
change. For example, if you define a layer group named Site that includes all
layers with the letters site in the name and a CONTINUOUS linetype, and
then you change the linetype of some of those layers, the layers with the new
linetype are no longer part of the Site layer group.
Dynamic layer groups can be nested under other dynamic groups and static
layer groups.
Define a Layer Group
A layer group includes only those layers that you explicitly assign to it. If the
properties of the layers assigned to the layer group change, the layers are still
part of the layer group. Static layer groups can only be nested under other
static layer groups.
TIP Layers from the Layer list can be included added to a layer group by clicking
and dragging the selected layers to the layer group.
Invert a Layer Group
You can invert the layers displayed by a dynamic layer group. For example,
if all the site plan information in a drawing is contained in multiple layers
that include the word site as part of the layer name, you can display all
information except site plan information by first creating a layer group that
Control the Properties of Objects | 129
filters layers by name (*site*) and then using the Invert Group Rules toggle
on the layer group in the Layers list.
Sort Layers
Once you have created layers, you can sort them by name or other properties.
In the Layers palette, click the column heading to sort layers by the property
in that column. Layer names can be sorted in ascending or descending
alphabetical order.
Wild-Card Characters
You can use wild-card characters to sort layers by name.
DefinitionCharacter
Matches any numeric digit# (pound)
Matches any alphabetic character@ (at)
Matches any nonalphanumeric character. (period)
Matches any string and can be used anywhere in the search
string
* (asterisk)
Matches any single character; for example, ?BC matches ABC,
3BC, and so on
? (question mark)
Matches anything but the pattern; for example; ~*AB*matches
all strings that don't contain AB
~ (tilde)
Matches any one of the characters enclosed; for example,
[AB]C matches AC and BC
[ ]
Matches any character not enclosed; for example, [~AB]C
matches XC but not AC
[~]
Specifies a range for a single character; for example, [A-G]C
matches AC, BC, and so on to GC, but not HC
[-]
130 | Chapter 6 Create and Modify Objects
DefinitionCharacter
Reads the next character literally; for example, `~AB matches
~AB
` (reverse quote)
NOTE To filter on a layer name that contains a wild-card character, precede the
character with a reverse quote (`) so that it is not interpreted as a wild-card
character.
See also:
Reconcile New Layers (page 131)
Reconcile New Layers
Unreconciled layers are new layers that have been added to the drawing and
have not yet been acknowledged by the user and manually marked as
reconciled.
Reconciling new layers is the process of manually reviewing new layers so that
you can avoid potential errors before plotting your drawing or when restoring
a layer state.
Unreconciled layers are new layers that have been added to the drawing or to
attached xrefs since the layer list was last evaluated. The layer list is checked
for new layers when a command, such as PLOT is used. In new drawings, the
layer baseline is created when the drawing is saved or plotted for the first time.
When a new drawing is first saved, the layer baseline is created, and all layers
present in the saved drawing are considered reconciled (not new). Layers that
are added after a drawing is first saved are considered new unreconciled layers.
NOTE The layer baseline is created when the LAYEREVAL system variable is set to
1 or 2.
When a command that is set in the LAYERNOTIFY system variable is used,
the layer list is checked at that time and compared to the baseline. If there
are new layers, the Unreconciled Layers layer group is automatically created
and activated in the Layers palette.
Unreconciled layers become reconciled by using the Reconcile option of the
-LAYER command. Once a layer has become reconciled, it is removed from
the Unreconciled Layers layer group. After all new layers are reconciled, the
Unreconciled Layers layer group is removed.
Control the Properties of Objects | 131

NOTE You can reconcile multiple unreconciled layers at the same time.
Work with Layer States
You can save layer settings as named layer states. You can then restore, edit,
import them from other drawings and files, and export them for use in other
drawings.
Save, Restore, and Edit Layer States
You can save the current layer settings in a drawing as a named layer state and
restore them later.
Saving layer settings is convenient if you need to return to particular settings
for all layers during different stages in completing a drawing or for plotting.
Save Layer Settings
Layer settings include layer states, such as on or locked, and layer properties,
such as color or linetype. In a named layer state, you can choose which layer
states and layer properties you want to restore later. For example, you can
choose to restore only the Frozen/Thawed setting of the layers in a drawing,
ignoring all other settings. When you restore that named layer state, all settings
remain as they are currently set except whether each layer is frozen or thawed.
Save Layer Property Override Settings
When layers contain viewport property overrides, those settings are saved to
a layer state when the viewport that contains overrides is active.
If the layer state is saved from model space, any layer property override settings
are not included. This is because only one value can be saved for each layer
property in a layer state. If layer property overrides need to be saved in the
layer state, make the viewport active on the layout tab and then save the layer
state.
Restore Layer Settings
When you restore a layer state, the layer settings (layer states and layer
properties) that were specified when the layer state was saved are restored.
You can specify specific settings to restore with the Restore and Edit options
132 | Chapter 6 Create and Modify Objects

of the -LAYER command. The layer property settings that are not selected
remain unchanged in the drawing.
NOTE To be notified when new layers are added to the drawing, use the LAYEREVAL
and LAYERNOTIFY system variables.
When restoring layer states, the following additional behaviors can occur
■ When restoring a layer state, the layer that was current when the layer
state was saved is made current. If that layer no longer exists, the current
layer does not change.
■ If a layout viewport is active when a layer state is restored, all layers that
need to be visible in the viewport are turned on and thawed in model
space. All layers that should not be visible in the viewport are set to VP
Freeze in the current viewport and the model space visibility is unchanged.
Layer States in Xrefs
Although xref layer states can be restored, they cannot be edited. Xref layer
states are identifiable because the layer state name is preceded by the xref
drawing’ s name and separated by a double underscore symbol. (Example: Xref
Name__Layer State Name.) When the xref is bound to the host drawing, layer
states are identifiable by $0$ that displays between the xref name and layer
state name. (Example: Xref Name$0$Layer State Name.)
Layer states from nested xrefs are also included. Layer states from xrefs are
removed from the host drawing when the xref is detached or unloaded.
Import and Export Layer States
You can import layer settings from other drawings (DWG and DWT) and
export layer states (LAS).
If the layer state is imported from a drawing and it contains a layer property,
such as a linetype or plot style that is not loaded or available in the current
drawing, that property is automatically imported from the source drawing.
If the layer state is imported from an LAS file, and it contains linetype or plot
style properties that do not exist in the drawing, a message is displayed
notifying that the property could not be restored.
NOTE When a layer state contains more than one property that cannot be restored
from an LAS file, the message that displays only indicates the first property it
encountered that cannot be restored.
Control the Properties of Objects | 133

When importing a layer state from an LAS file or from another drawing that
are duplicates of layer states in the current drawing, you can choose to
overwrite the existing layer state or not import it.
Layer states can be imported into a previous release of the program.
Work with Colors
Color helps to group objects visually. You can assign colors to objects by layer
or individually.
Set the Current Color
You can use color to help you identify objects visually. You can assign the
color of an object either by layer or by specifying its color explicitly,
independent of layer.
Assigning colors by layer makes it easy to identify each layer within your
drawing. Assigning colors explicitly provides additional distinctions between
objects on the same layer. Color is also used as a way to indicate lineweight
for color-dependent plotting.
You can use a variety of color palettes when assigning color to objects,
including
■ AutoCAD Color Index (ACI)
■ True Color
■ PANTONE
®
Colors
■ RAL
™
Classic and RAL Design color books
■ DIC
®
Color Guide
■ Colors from imported color books.
ACI Colors
ACI colors are the standard colors used in AutoCAD. Each color is identified
by an ACI number, an integer from 1 through 255. Standard color names are
available only for colors 1 through 7. The colors are assigned as follows: 1 Red,
2 Yellow, 3 Green, 4 Cyan, 5 Blue, 6 Magenta, 7 White/Black.
134 | Chapter 6 Create and Modify Objects

True Colors
True colors use 24-bit color definitions to display over 16 million colors. When
specifying true colors, you can use either an RGB or HSL color model. With
the RGB color model, you can specify the red, green, and blue components
of the color; with the HSL color model, you can specify the hue, saturation,
and luminance aspects of the color.
Color Books
AutoCAD includes several standard PANTONE color books. You can also import
other color books such as the DIC color guide or RAL color sets. Importing
user-defined color books can further expand your available color selections.
You install color books on your system by using the Applications tab in the
Application Preferences dialog box. Once a color book is loaded, you can select
colors from the color book and apply them to objects in your drawings.
All objects are created using the current color, which is displayed in the Color
property of the Properties Inspector palette when no object is selected. You
can also set the current color with the Color Palette dialog box.
If the current color is set to BYLAYER, objects are created with the color
assigned to the current layer. If you do not want the current color to be the
color assigned to the current layer, you can specify a different color.
If the current color is set to BYBLOCK, objects are created using color 7 (white
or black) until the objects are grouped into a block. When the block is inserted
into the drawing, it acquires the current color setting.
PANTONE
®
Color Books
Pantone has updated the PANTONE MATCHING SYSTEM
®
with the
PANTONE
®
PLUS SERIES of Publications that provides a chromatic arrangement
of colors. In AutoCAD-based products, the RGB values of the PANTONE Colors
that are assigned to objects are preserved in all current and legacy drawing
files.
Color book (.acb) files provide access through the Color Palette dialog box to
the names of all PANTONE Colors and color books. These .acb files are installed
in the /Support/Color folder in the AutoCAD installation folder.
Control the Properties of Objects | 135

Change the Color of an Object
You can change the color of an object by reassigning it to another layer, by
changing the color of the layer the object is on, or by specifying a color for
the object explicitly.
You have three choices for changing the color of an object:
■ Reassign the object to another layer with a different color. If an object's
color is set to BYLAYER, and you reassign the object to a different layer, it
acquires its color from the new layer.
■ Change the color assigned to the layer that the object is on. If an object's
color is set to BYLAYER, it acquires the color of its layer. When you change
the color assigned to a layer, all objects on that layer assigned the BYLAYER
color are updated automatically.
■ Specify a color for an object to override the layer's color. You can specify
the color of each object explicitly. If you want to override the
layer-determined color of an object with a different one, change an existing
object's color from BYLAYER to a specific color, such as red.
If you want to set a specific color for all subsequently created objects, change
the Color property on the Properties Inspector palette when no objects are
selected from BYLAYER to a specific color.
See also:
Override Layer Properties in Viewports (page 125)
Use Color Books
When assigning colors to objects, you can choose colors from color books
that are loaded on your system.
You can choose from a wide range of custom colors when using color books.
Color books include third-party or user-defined files that contain named color
swatches. These colors can be used to enhance presentation drawings as well
as to optimize the variety of color used in your drawings. You can apply color
book colors to objects in your drawings by using the Color Books tab in the
Color Palette dialog box.
136 | Chapter 6 Create and Modify Objects

Install Color Books
Color book files must contain an .acb file extension in order to be recognized
by this program. To access color book colors from the Color Palette dialog
box, you must first copy your color book files to a specified color book location.
On the Application tab of the Application Preferences dialog box, you can
define the path where color book files are stored. Multiple locations can be
defined for the color book path. These locations are saved in your user profile.
After loading a color book on your system, to access the new colors, you need
to close the Color Palette dialog box and then open it again. The new color
book is displayed in the Color Book drop-down list on the Color Books tab.
Once you have loaded a color book, you can apply any colors that are defined
in the book to objects in your drawing.
Browse Color Books
Color books are organized alphabetically into pages that you can browse
through. A page holds up to ten colors. If the color book you are browsing
through is not organized into pages, the colors are arranged into pages, with
each page containing up to seven colors.
Work with Linetypes
You can use linetypes to distinguish objects from one another visually and
make your drawing easier to read.
Overview of Linetypes
A linetype is a repeating pattern of dashes, dots, and blank spaces displayed
in a line or a curve. You assign linetypes to objects either by layer or by
specifying the linetype explicitly, independent of layers.
In addition to choosing a linetype, you can set its scale to control the size of
the dashes and spaces, and you can create your own custom linetypes.
NOTE These linetypes should not be confused with the hardware linetypes provided
by some plotters. The two types of dashed lines produce similar results. Do not
use both types at the same time, however, because the results can be
unpredictable.
Control the Properties of Objects | 137
Some linetype definitions include text and symbols.
You can define a custom linetype that will orient the imbedded text to keep
it readable automatically.
For more information about controlling text in linetypes, see Text in Custom
Linetypes.
See also:
Custom Linetypes in the Customization Guide
Load Linetypes
At the start of a project, you load the linetypes that are required for the project
so that they are available when you need them.
If you want to know what linetypes are already available, you can display a
list of linetypes that are loaded in the drawing or stored in an LIN (linetype
definition) file.
This program includes the linetype definition files acad.lin and acadiso.lin.
Which linetype file is appropriate depends on whether you use imperial or
metric measurements.
■ For imperial units, use the acad.lin file.
■ For metric measurements, use the acadiso.lin file.
Both linetype definition files contain several complex linetypes.
If you select a linetype whose name begins with ACAD_ISO, you can use the
ISO pen-width option when you plot.
You can remove unreferenced linetype information with PURGE or by deleting
the linetype from the Linetype Manager. BYBLOCK, BYLAYER, and
CONTINUOUS linetypes cannot be removed.
138 | Chapter 6 Create and Modify Objects

Set the Current Linetype
All objects are created using the current linetype.
You can set the current linetype with the:
■ Linetype property on the Properties Inspector palette
■ Linetype Manager
If the current linetype is set to BYLAYER, objects are created with the linetype
assigned to the current layer.
If the current linetype is set to BYBLOCK, objects are created using the
CONTINUOUS linetype until the objects are grouped into a block. When the
block is inserted into the drawing, those objects acquire the current linetype
setting.
If you do not want the current linetype to be the linetype assigned to the
current layer, you can specify a different linetype explicitly.
The program does not display the linetype of certain objects: text, points,
viewports, hatches, and blocks.
Change the Linetype of an Object
You can change the linetype of an object by reassigning it to another layer,
by changing the linetype of the layer the object is on, or by specifying a
linetype for the object explicitly.
You have three choices for changing the linetype of an object:
■ Reassign the object to another layer with a different linetype. If an object's
linetype is set to BYLAYER, and you reassign the object to a different layer,
it acquires its linetype from the new layer.
■ Change the linetype assigned to the layer that the object is on. If an object's
linetype is set to BYLAYER, it acquires the linetype of its layer. When you
change the linetype assigned to a layer, all objects on that layer assigned
the BYLAYER linetype are updated automatically.
■ Specify a linetype for an object to override the layer's linetype. You can
specify the linetype of each object explicitly. If you want to override the
layer-determined linetype of an object with a different one, change an
existing object's linetype from BYLAYER to a specific linetype, such as
DASHED.
Control the Properties of Objects | 139
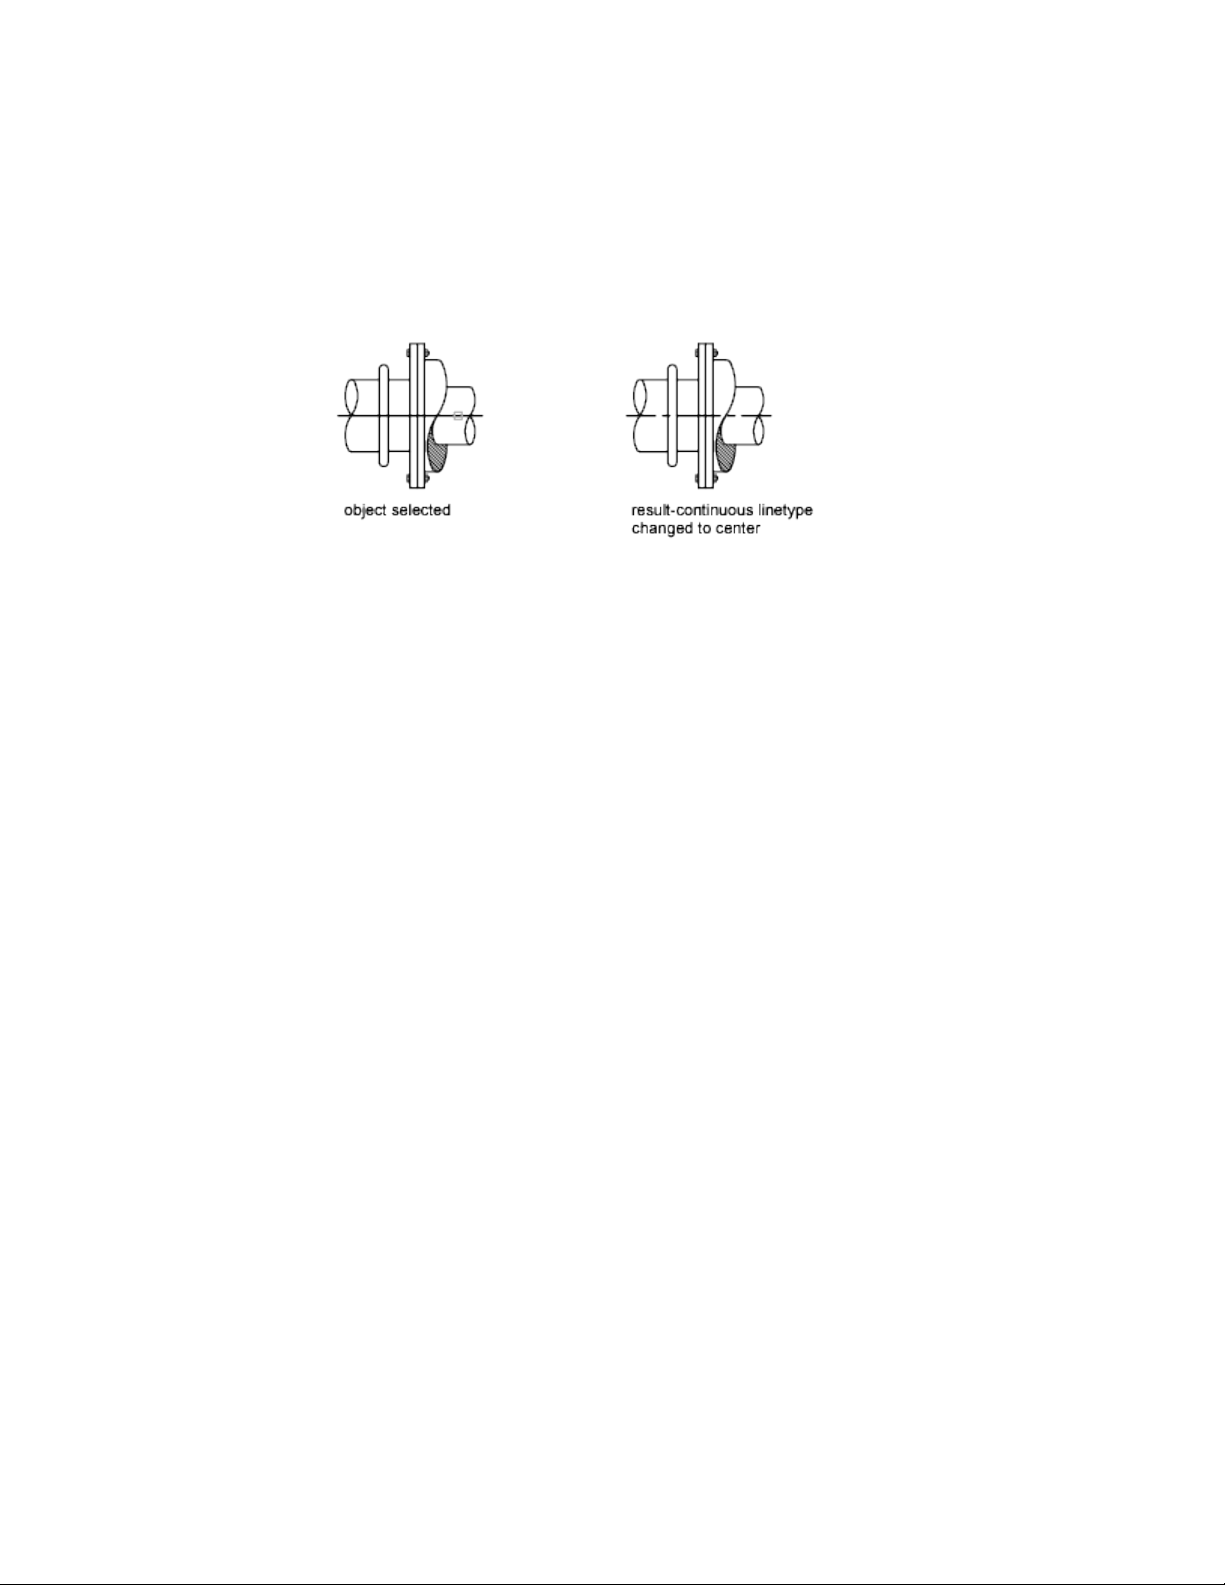
If you want to set a specific linetype for all subsequently created objects,
change the Linetype property on the Properties Inspector palette when no
objects are selected from BYLAYER to a specific linetype.
See also:
Override Layer Properties in Viewports (page 125)
Control Linetype Scale
You can use the same linetype at different scales by changing the linetype
scale factor either globally or individually for each object.
By default, both global and individual linetype scales are set to 1.0. The smaller
the scale, the more repetitions of the pattern are generated per drawing unit.
For example, with a setting of 0.5, two repetitions of the pattern in the linetype
definition are displayed for each drawing unit. Short line segments that cannot
display one full linetype pattern are displayed as continuous. You can use a
smaller linetype scale for lines that are too short to display even one dash
sequence.
The Linetype Manager displays the Global Scale Factor and Current Object
Scale.
■ The Global Scale Factor value controls the LTSCALE system variable, which
changes the linetype scale globally for both new and existing objects.
■ The Current Object Scale value controls the CELTSCALE system variable,
which sets the linetype scale for new objects.
The CELTSCALE value is multiplied by the LTSCALE value to get the displayed
linetype scale. You can easily change linetype scales in your drawing either
individually or globally.
140 | Chapter 6 Create and Modify Objects
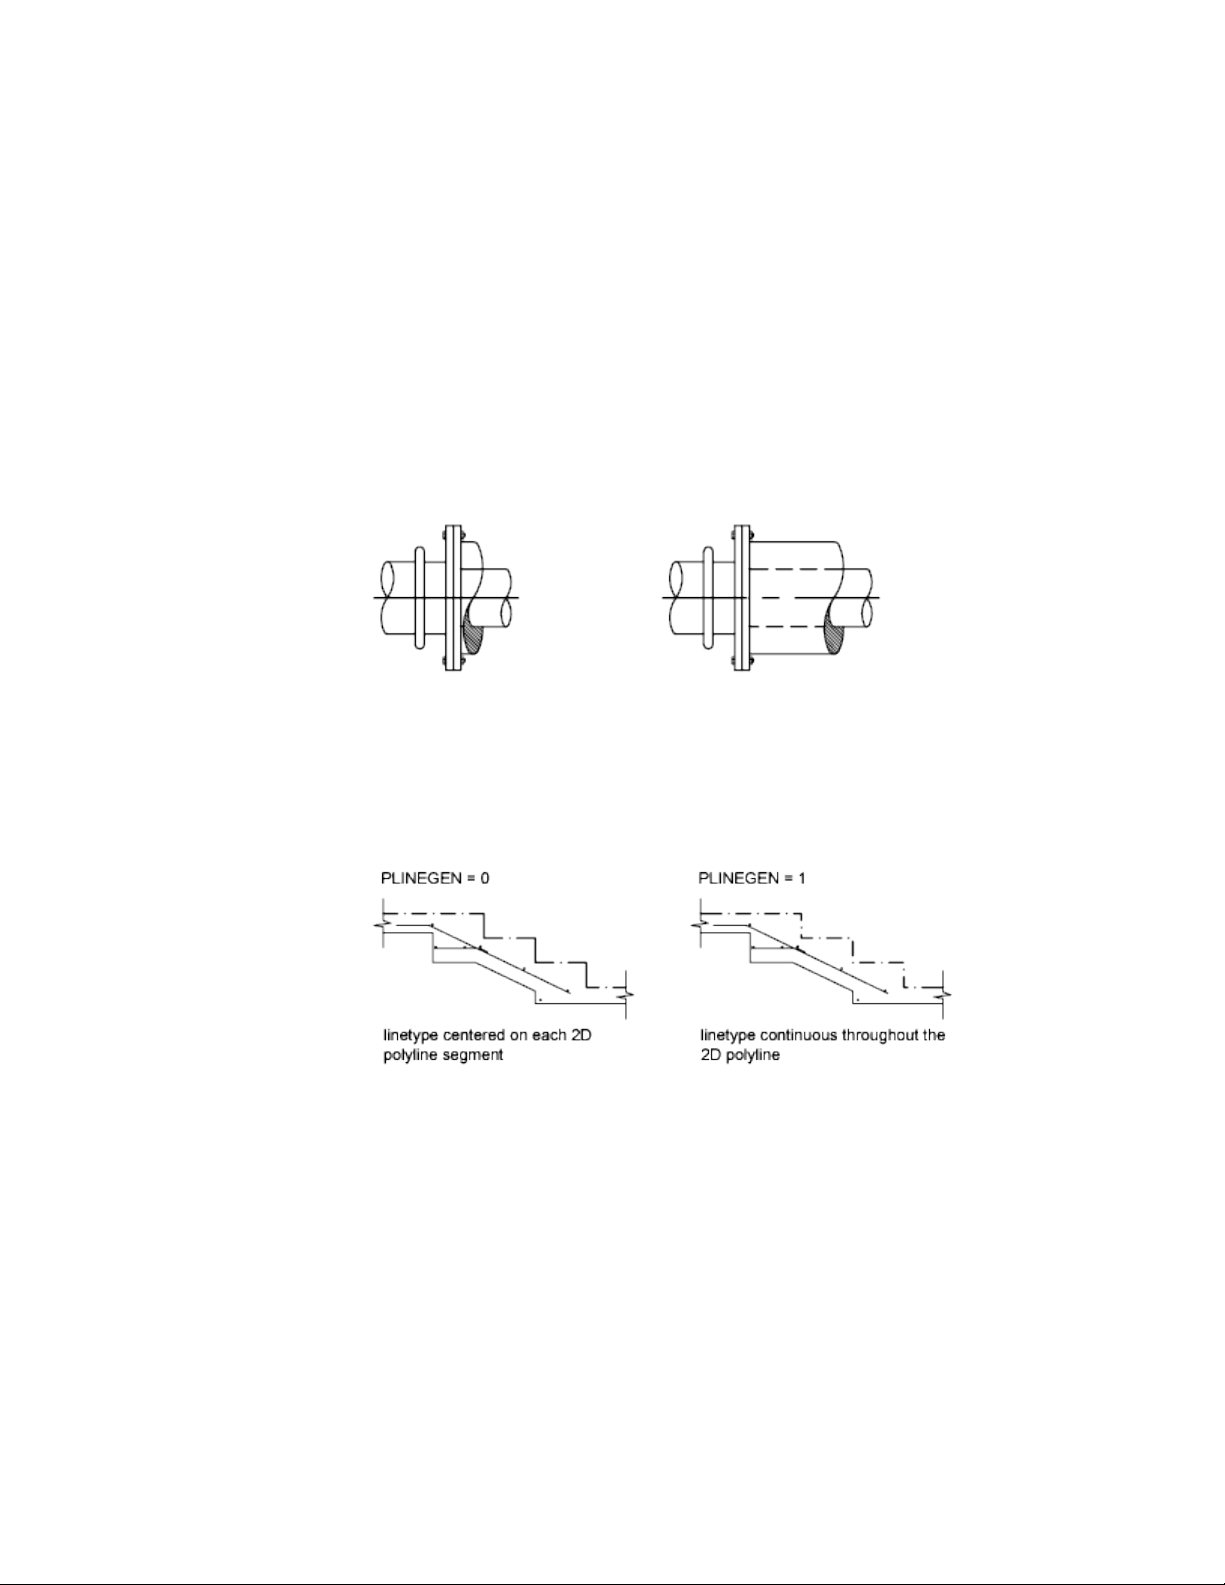
In a layout, you can adjust the scaling of linetypes in different viewports with
PSLTSCALE.
Display Linetypes on Short Segments and Polylines
You can center the pattern of a linetype on each segment of a polyline, and
you can control how the linetype is displayed on short segments.
If a line is too short to hold even one dash sequence, the result is a continuous
line between the endpoints, as shown below.
You can accommodate short segments by using a smaller value for their
individual linetype scales. For more information, see Control Linetype Scale
(page 140).
For polylines, you can specify whether a linetype pattern is centered on each
segment or is continuous across vertices throughout the entire length of the
polyline. You do this by setting the PLINEGEN system variable.
Control Lineweights
You can control the thickness of an object’ s lines in both the drawing display
and plotting.
Control the Properties of Objects | 141

Overview of Lineweights
Lineweights are width values that are assigned to graphical objects as well as
some types of text.
Using lineweights, you can create heavy and thin lines to show cuts in sections,
depth in elevations, dimension lines and tick marks, and differences in details.
For example, by assigning varying lineweights to different layers, you can
easily differentiate between new, existing, and demolition construction.
Lineweights are not displayed unless the Show/Hide Lineweight button on
the status bar is selected.
TrueType fonts, raster images, points, and solid fills (2D solids) cannot display
lineweight. Wide polylines show lineweights only when displayed outside of
the plan view. You can export drawings to other applications or cut objects
to the Clipboard and retain lineweight information.
In model space, lineweights are displayed in pixels and do not change when
zoomed in or out. Thus, you should not use lineweights to represent the exact
width of an object in model space. For example, if you want to draw an object
with a real-world width of 0.5 inches, do not use a lineweight; instead, use a
polyline with a width of 0.5 inches to represent the object.
You can also plot objects in your drawing with custom lineweight values. Use
the Plot Style Table Editor to adjust the fixed lineweight values to plot at a
new value.
Lineweight Scale in Drawings
Objects with a lineweight are plotted with the exact width of the assigned
lineweight value. The standard settings for these values include BYLAYER,
BYBLOCK, and Default. They are displayed in either inches or millimeters,
with millimeters being the default. All layers are initially set to 0.25 mm,
controlled by the LWDEFAULT system variable.
A lineweight value of 0.025 mm or less is displayed as one pixel in model
space and is plotted at the thinnest lineweight available on the specified
plotting device. Lineweight values that you enter at the Command prompt
are rounded to the nearest predefined value.
You set the lineweight units and the default value in the Lineweight Settings
dialog box. You can access the Lineweight Settings dialog box by using the
LWEIGHT command, by right-clicking the Show/Hide Lineweight button on
the status bar and choosing Settings.
142 | Chapter 6 Create and Modify Objects

See also:
Draw Polylines (page 196)
Display Lineweights
Lineweights can be turned on and off in a drawing, and are displayed
differently in model space than in a paper space layout.
■ In model space, a 0-value lineweight is displayed as one pixel, and other
lineweights use a pixel width proportional to their real-unit value.
■ In a paper space layout, lineweights are displayed in the exact plotting
width.
Regeneration time increases with lineweights that are represented by more
than one pixel. Turn off the display of lineweights to optimize performance
of the program.
You can turn the display of lineweights on or off by clicking Show/Hide
Lineweight button on the status bar. This setting does not affect the plotting
of lineweights.
Display Lineweights in Model Space
Lineweight display in model space does not change with the zoom factor. For
example, a lineweight value that is represented by a width of four pixels is
always displayed using four pixels regardless of how far you zoom in. If you
want the lineweights on objects to appear thicker or thinner on the Model
layout, use LWEIGHT to set their display scale. Changing the display scale
does not affect the lineweight plotting value.
In model space, weighted lines that are joined form a beveled joint with no
end caps. You can use plot styles to apply different joins and endcap styles to
objects with lineweights.
NOTE Different styles of endcaps and joins of objects with lineweight are displayed
only in a full preview using PREVIEW or PLOT.
Display Lineweights in Layouts
In layouts and plot preview, lineweights are displayed in real-world units, and
lineweight display changes with the zoom factor. You can control lineweight
Control the Properties of Objects | 143

plotting and scaling in your drawing in the Print dialog box or the Page Setup
Dialog Box.
Set the Current Lineweight
The current lineweight is the lineweight used for any objects you draw until
you make another lineweight current.
All objects are created using the current lineweight. You can set the current
lineweight with the:
■ Lineweight property on the Properties Inspector palette
■ Lineweight Settings dialog box
■ CELWEIGHT system variable
If the current lineweight is set to BYLAYER, objects are created with the
lineweight assigned to the current layer.
If the current lineweight is set to BYBLOCK, objects are created using the
default lineweight setting until the objects are grouped into a block. When
the block is inserted into the drawing, it acquires the current lineweight setting.
If you do not want the current lineweight to be the lineweight assigned to
the current layer, you can specify a different lineweight explicitly.
Objects in drawings created in an earlier release of AutoCAD are assigned the
lineweight value of BYLAYER, and all layers are set to DEFAULT. Lineweight
assigned to objects is displayed as a solid fill drawn in the object's assigned
color.
Change the Lineweight of an Object
You can change the lineweight of an object by reassigning it to another layer,
by changing the lineweight of the layer the object is on, or by specifying a
lineweight for the object explicitly.
You have three choices for changing the lineweight of an object:
■ Reassign the object to another layer with a different lineweight. If an
object's lineweight is set to BYLAYER, and you reassign the object to a
different layer, it acquires its lineweight from the new layer.
■ Change the lineweight assigned to the layer that the object is on. If an
object's lineweight is set to BYLAYER, it acquires the lineweight of its layer.
144 | Chapter 6 Create and Modify Objects

When you change the lineweight assigned to a layer, all objects on that
layer assigned the BYLAYER lineweight are updated automatically.
■ Specify a lineweight for an object to override the layer's lineweight. You
can specify the lineweight of each object explicitly. If you want to override
the layer-determined lineweight of an object with a different one, change
an existing object's lineweight from BYLAYER to a specific lineweight.
If you want to set a specific lineweight for all subsequently created objects,
change the Lineweight property on the Properties Inspector palette when no
objects are selected from BYLAYER to a specific lineweight.
See also:
Override Layer Properties in Viewports (page 125)
Control the Display Properties of Certain Ob-
jects
You can control how overlapping objects and certain other objects are
displayed and plotted.
Control the Display of Polylines, Hatches, Gradient
Fills, Lineweights, and Text
You can simplify the display of certain kinds of objects in order to speed
performance.
Display performance is improved when wide polylines and donuts, solid-filled
polygons (two-dimensional solids), hatches, gradient fills, and text are
displayed in simplified form. Simplified display also increases the speed of
creating test plots.
Turn Off Solid Fill
When you turn off Fill mode, wide polylines, solid-filled polygons, gradient
fill, and hatches are displayed in outline form. Except for patterned hatches
and gradient fills, solid fill is automatically turned off for hidden view and
nonplan views in three dimensions.
Control the Properties of Objects | 145
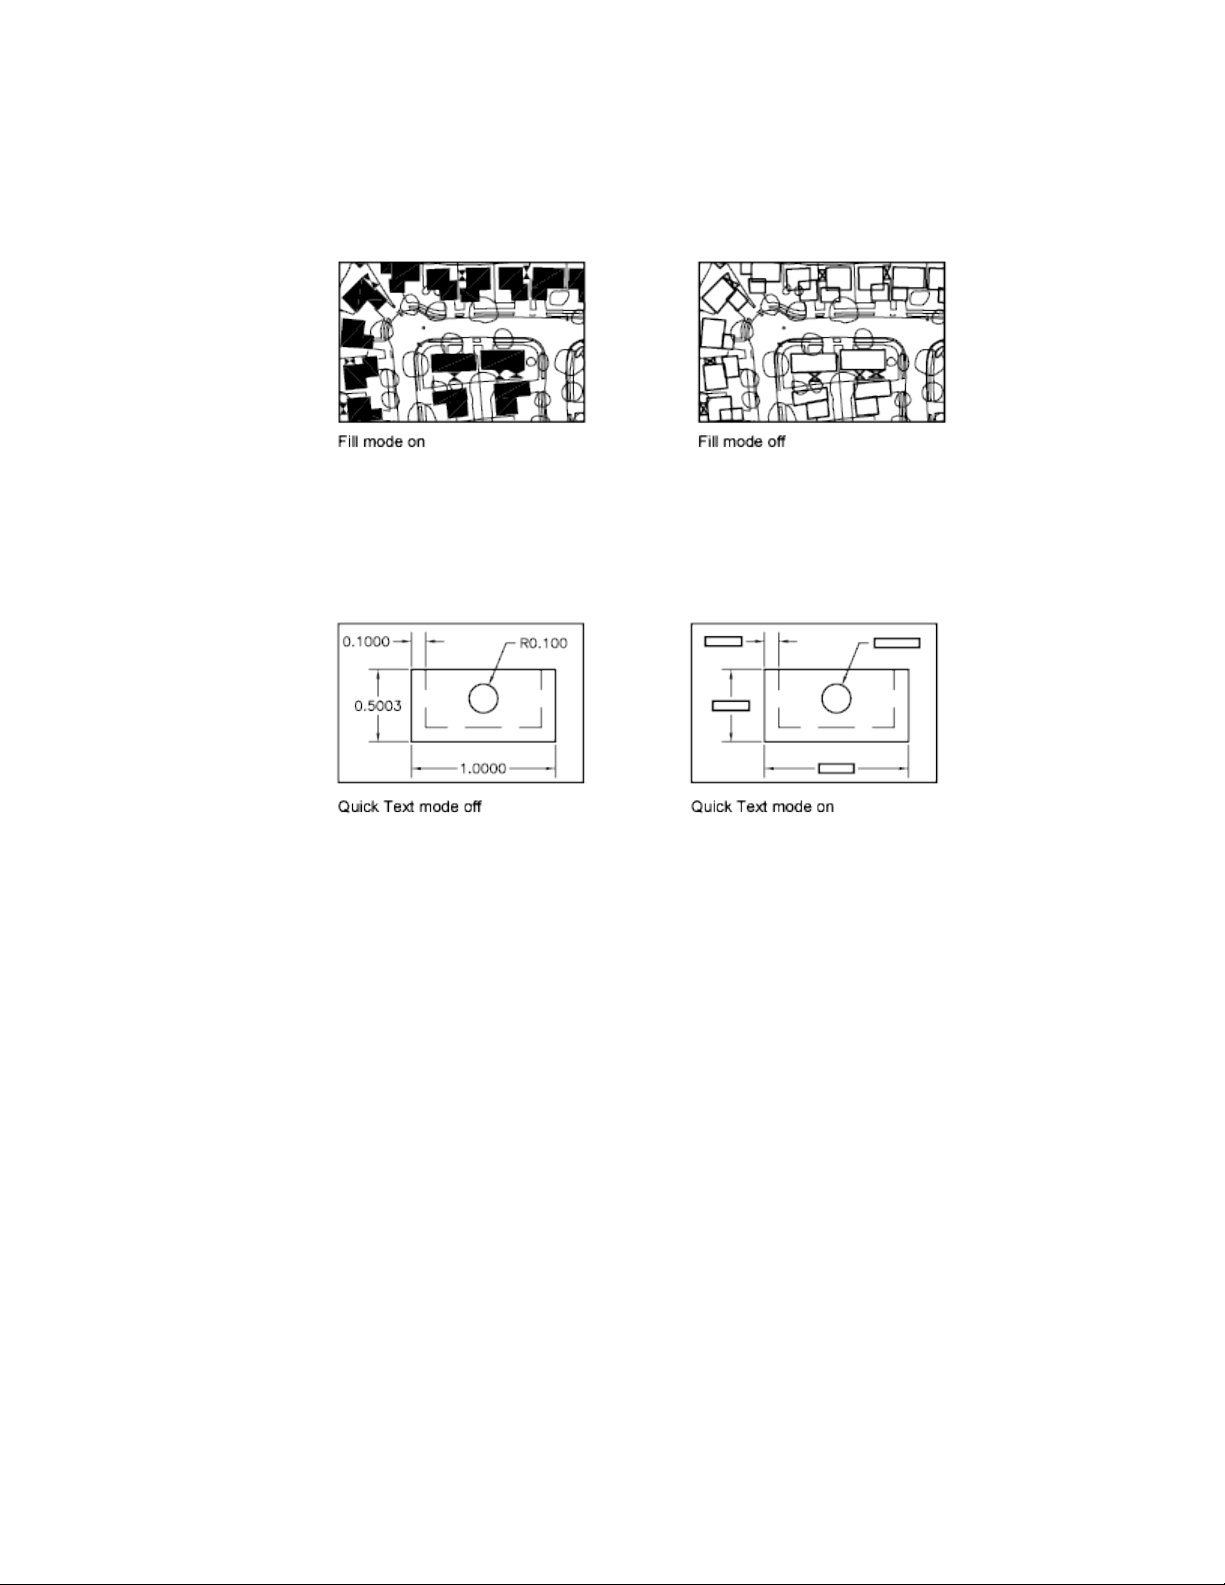
Use Quick Text
When you turn on Quick Text mode in drawings that contain a lot of text
using complex fonts, only a rectangular frame defining the text is displayed
or plotted.
Turn Off Lineweights
Any lineweight width that is represented by more than one pixel may slow
down performance. If you want to improve display performance, turn
lineweights off. You can turn lineweights on and off by choosing the
Show/Hide Lineweight button on the status bar. Lineweights are always plotted
at their real-world value whether their display is turned on or off.
Update the Display
New objects automatically use the current settings for displays of solid fill and
text. Except for lineweights, to update the display of existing objects using
these settings, you must use REGEN.
See also:
Use Layers to Manage Complexity (page 120)
Display Lineweights (page 143)
146 | Chapter 6 Create and Modify Objects

Use TrueType Fonts (page 543)
Control the Transparency of Objects
You can control the transparency level of objects and layers.
Control the Transparency of Objects
Set the transparency level of selected objects or layers to enhance drawings
or reduce the visibility of areas that are included for reference only.
Transparency can be set to ByLayer, ByBlock, or to a specific value.
IMPORTANT For performance reasons, plotting transparency is disabled by default.
To plot transparent objects, check the Plot Transparency option in either the Print
dialog box or Page Setup dialog box.
Control How Overlapping Objects Are Displayed
You can change the draw order, which is the display and plotting order, of
any objects that you select.
You can use DRAWORDER to change the draw order (which is the display
and plotting order) of any objects.
Control the Properties of Objects | 147

Added control is available for certain objects:
■ The draw order of all text, dimensions, and leaders in the drawing can be
specified separately. (TEXTTOFRONT)
■ The draw order of all hatches and fills in the drawing can also be specified
separately. (HATCHTOBACK)
NOTE Overlapping objects cannot be controlled between model space and paper
space. They can be controlled only within the same space.
Control the Display of Objects
Control the display of objects by isolating or hiding a selection set.
Use ISOLATEOBJECTS and HIDEOBJECTS to create a temporary drawing view
with selected objects isolated or hidden. This saves you the time of having to
track objects across layers. If you isolate objects, only the isolated objects
appear in the view. Use UNISOLATEOBJECTS to redisplay the objects. When
you close and reopen the drawing, all previously hidden objects are displayed.
Use the OBJECTISOLATIONMODE system variable to control whether objects
remain hidden between drawing sessions.
Use Precision Tools
You can use a variety of precision drawing tools to help you produce accurate
drawings quickly and without performing tedious calculations.
Work with the User Coordinate System (UCS)
The UCS is the active coordinate system that establishes the XY plane (work
plane) and Z-axis direction for drawing and modeling.
Overview of the User Coordinate System (UCS)
The UCS is the active coordinate system that establishes the XY plane (work
plane) and Z-axis direction for drawing and modeling. You can set the UCS
148 | Chapter 6 Create and Modify Objects

origin and its X, Y, and Z axes to suit your needs. The UCS is useful in 2D
design and essential in 3D design because it controls features that include
■ The XY plane (or work plane)on which objects are created and modified
■ The horizontal and vertical orientation used for features like Ortho mode,
polar tracking, and object snap tracking
■ The alignment and angle of the grid, hatch patterns, text, and dimension
objects
■ The origin and orientation for coordinate entry and absolute reference
angles
■ For 3D operations, the orientation of work planes, projection planes, and
the Z axis (for vertical direction and axis of rotation)
Understand the World Coordinate System (WCS)
The WCS is a fixed Cartesian coordinate system. Internally, all objects are
defined by their WCS coordinates, and the WCS and the UCS are coincident
in a new drawing. However, it is usually more convenient to create and edit
objects based on the UCS, which can be customized to suit your needs.
Understand the UCS Icon
The UCS icon indicates the location and orientation of the current UCS. You
can manipulate the UCS icon using grips. For more information, see The UCS
Icon (page 25) and the UCSICON command.
NOTE If the location of the UCS origin is not visible in a viewport, the UCS icon
is displayed in the lower-left corner of the viewport instead.
Understand the UCS in 3D
When you create or modify objects in a 3D environment, you can move and
reorient the UCS anywhere in 3D space to simplify your work. The UCS is
useful for entering coordinates, creating 3D objects on 2D work planes, and
rotating objects in 3D.
NOTE The UCS icon follows the traditional right-hand rule in determining positive
axis directions and rotation directions.
Use Precision Tools | 149
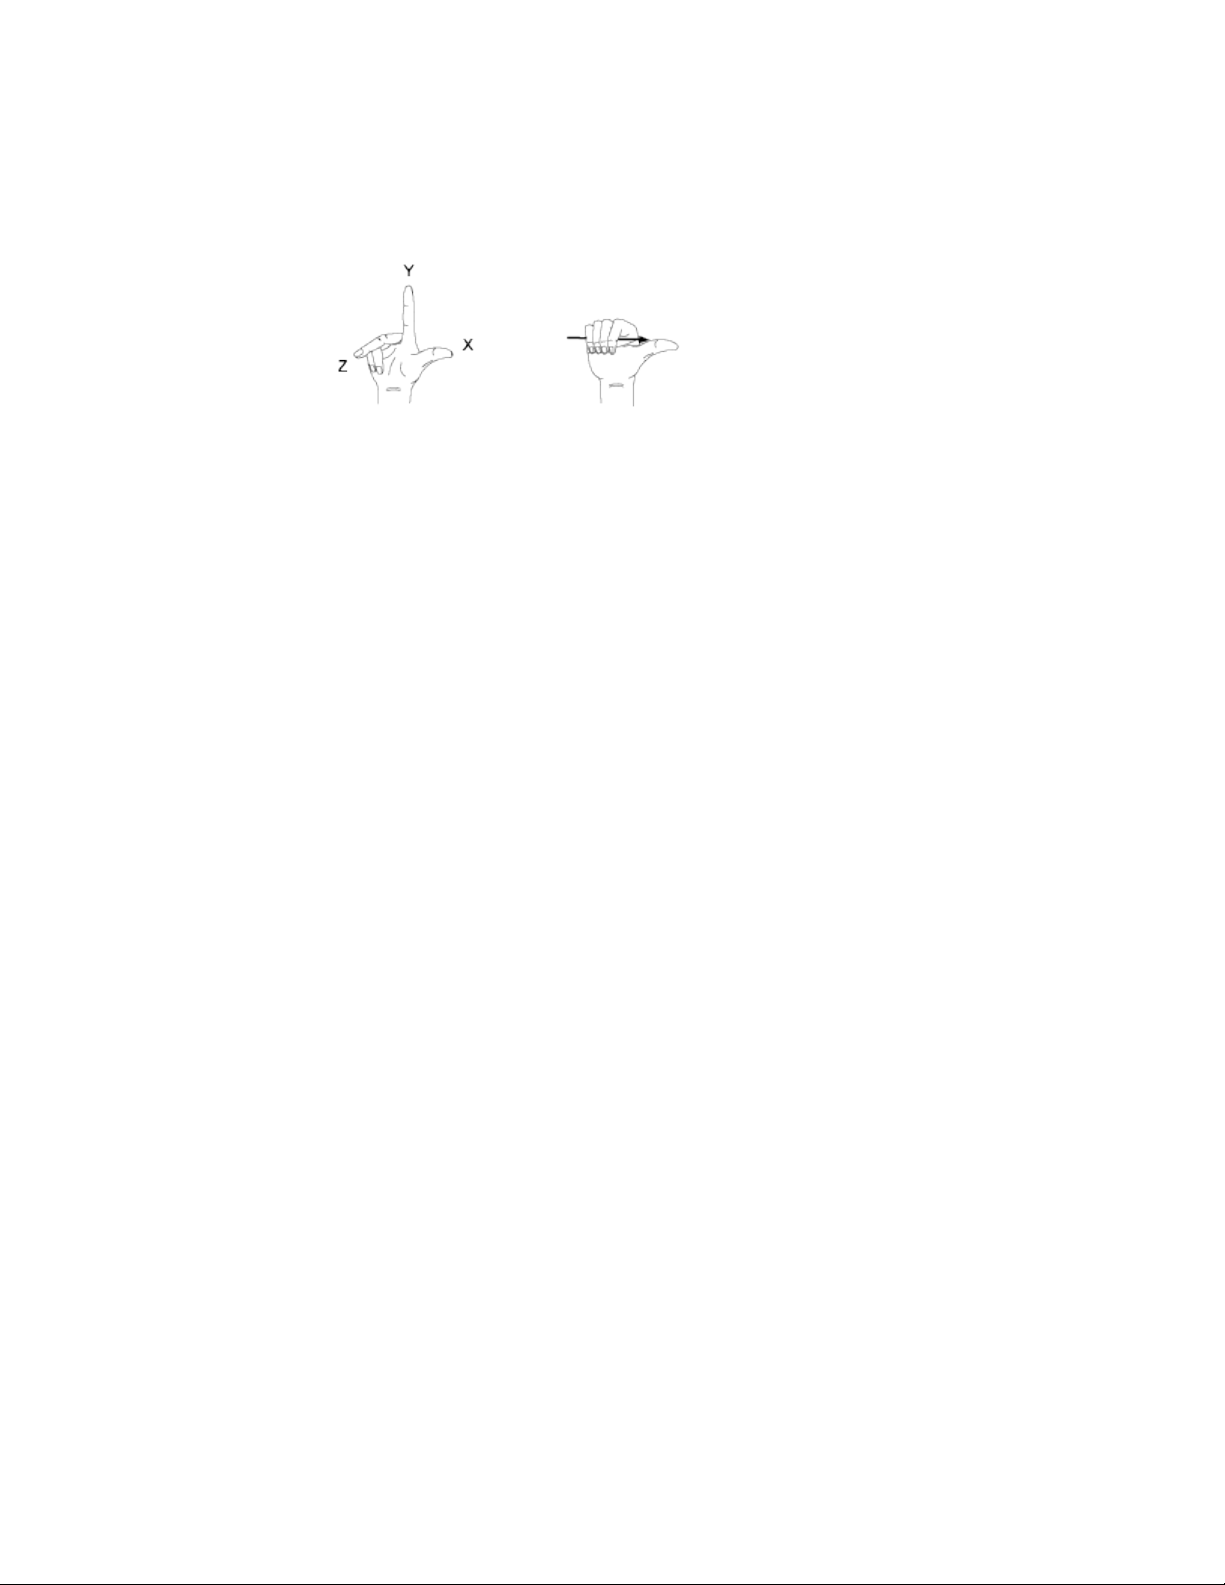
Change the UCS in Paper Space
You can define a new UCS in paper space just as you can in model space;
however, the UCS in paper space is restricted to 2D manipulation. Although
you can enter 3D coordinates in paper space, you cannot use 3D viewing
commands such as PLAN and VPOINT.
See also:
Control the User Coordinate System (UCS) (page 150)
Work with Named UCS Definitions and Preset Orientations (page 150)
Control the User Coordinate System (UCS)
Customize the UCS origin and orientation using the UCS origin and axes
grips, the UCS icon shortcut menu, or the UCS command.
You can align the UCS icon with existing objects, including 3D faces or edges.
Work with Named UCS Definitions and Preset Orient-
ations
Create and save as many UCS definitions as you need. Each UCS definition
can have its own origin and X, Y, and Z axes. You can also choose from several
preset orientations.
See also:
Overview of the User Coordinate System (UCS) (page 148)
Control the User Coordinate System (UCS) (page 150)
150 | Chapter 6 Create and Modify Objects
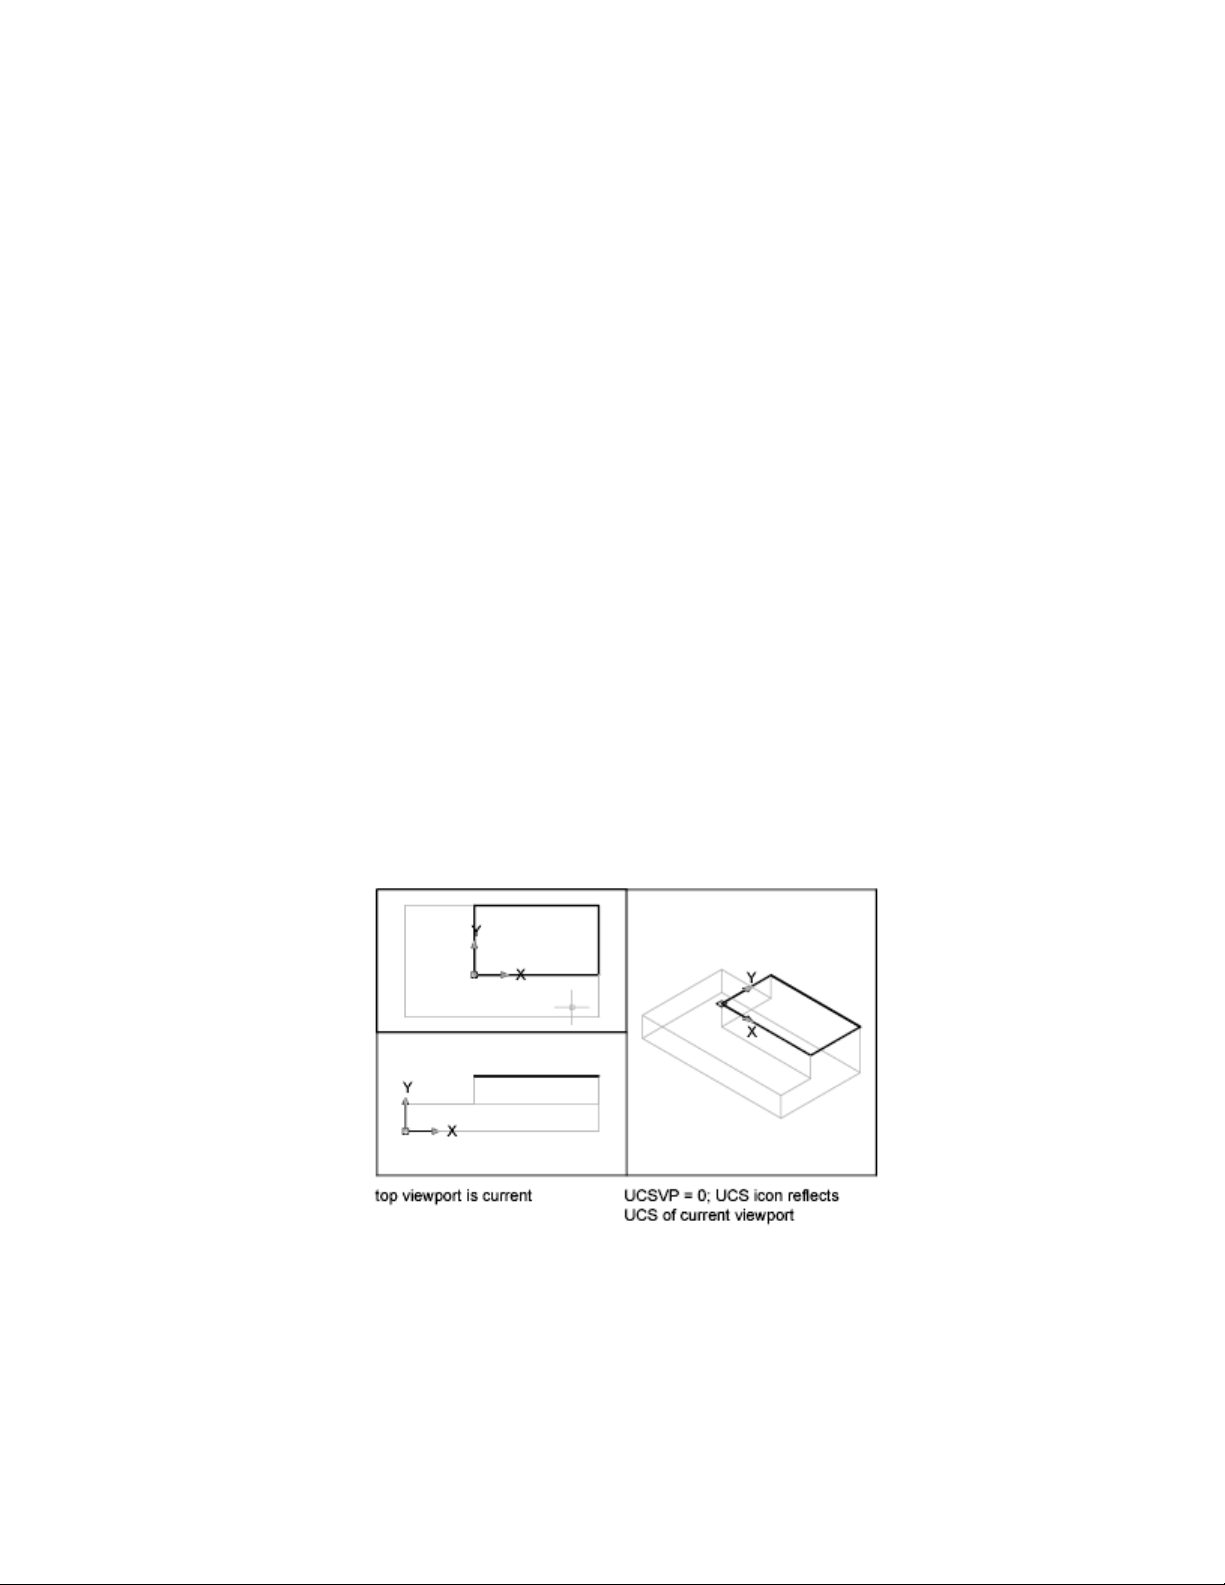
Assign UCS Definitions to Viewports
To facilitate editing objects in different views, you can define a different UCS
(User Coordinate System) for each view.
Multiple viewports provide different views of your model. For example, you
might set up viewports that display top, front, right side, and isometric views.
To facilitate editing objects in different views, you can create a different UCS
definition for each view. Each time you make a viewport current, you can
begin drawing using the same UCS you used the last time that viewport was
current.
The UCS in each viewport is controlled by the UCSVP system variable. When
UCSVP is set to 1 in a viewport, the UCS last used in that viewport is saved
with the viewport and is restored when the viewport is made current again.
When UCSVP is set to 0 in a viewport, its UCS is always the same as the UCS
in the current viewport.
For example, you might set up three viewports: a top view, front view, and
isometric view. If you set the UCSVP system variable to 0 in the isometric
viewport, you can use the Top UCS in both the top viewport and the isometric
viewport. When you make the top viewport current, the isometric viewport's
UCS reflects the UCS top viewport. Likewise, making the front viewport current
switches the isometric viewport's UCS to match that of the front viewport.
The example is illustrated in the following figures. The first figure shows the
isometric viewport reflecting the UCS of the upper-left, or top, viewport, which
is current.
Use Precision Tools | 151
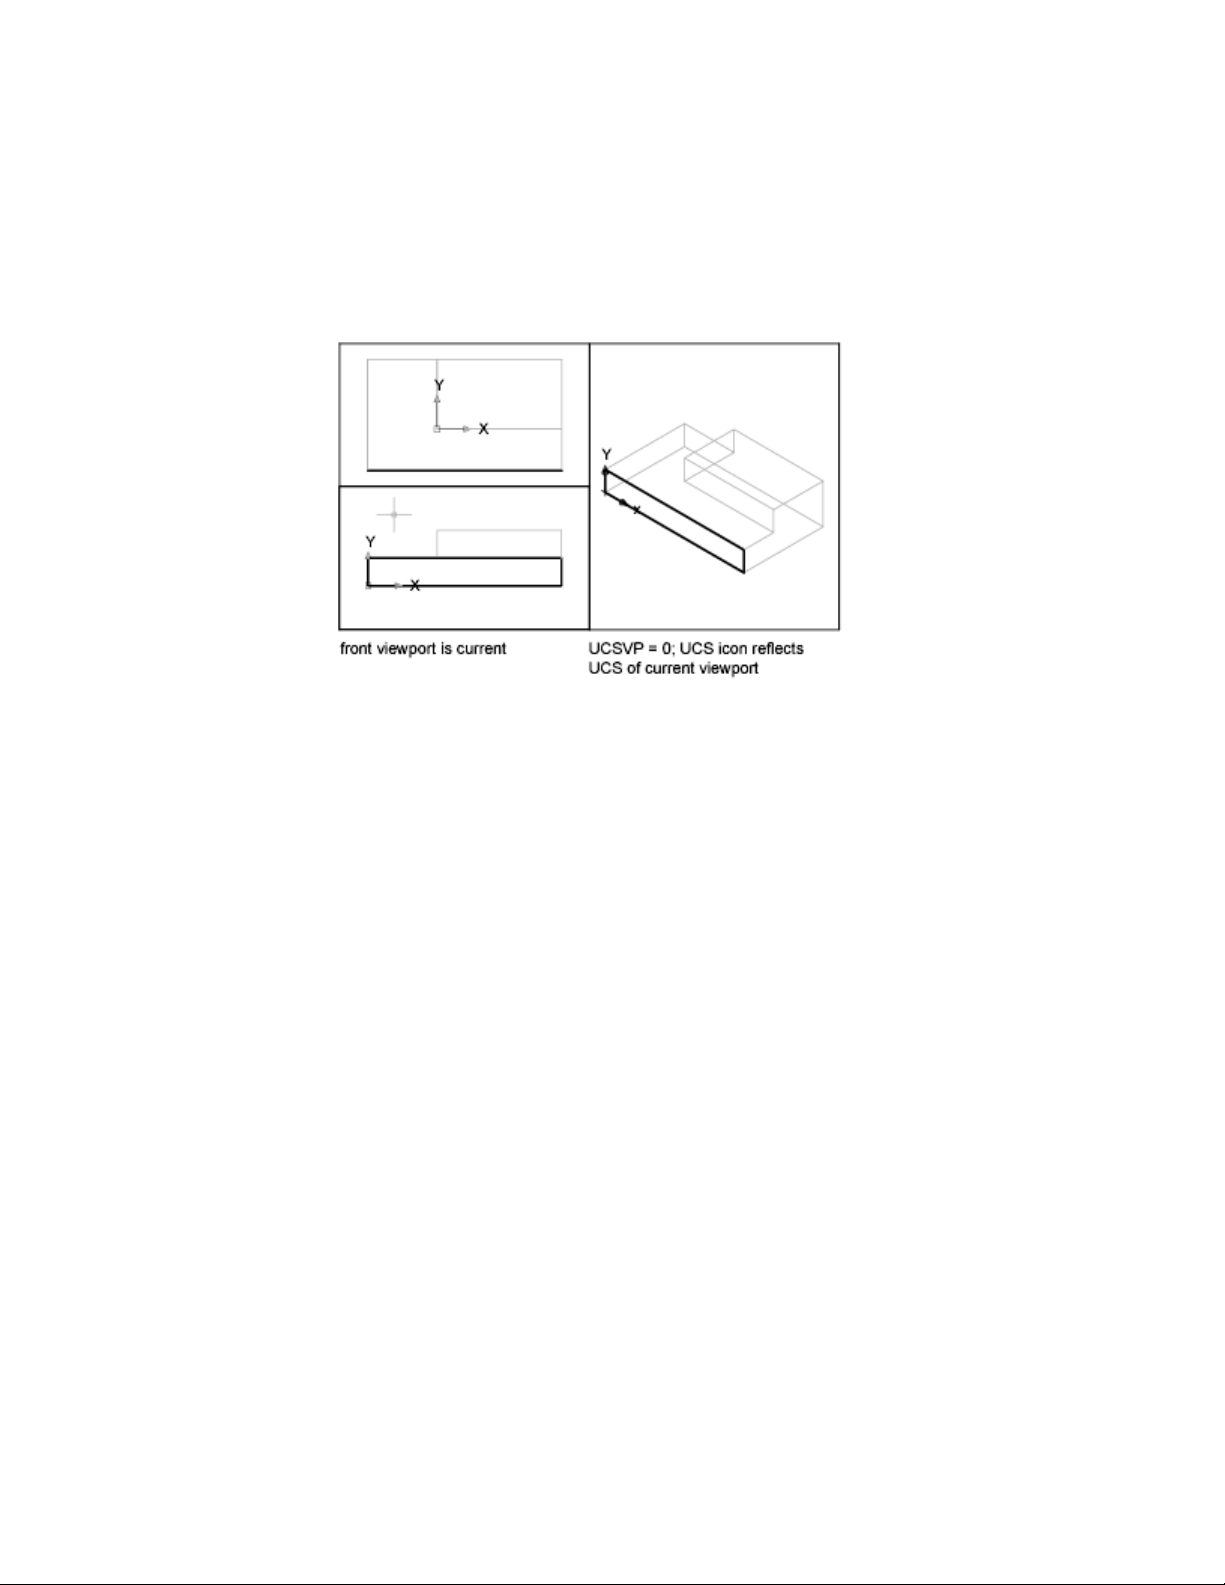
The second figure shows the change that occurs when the lower-left, or front,
viewport is made current. The UCS in the isometric viewport is updated to
reflect the UCS of the front viewport.
In previous releases, the UCS was a global setting for all viewports in either
model or paper space. If you want to restore the behavior of earlier releases,
you can set the value of the UCSVP system variable to 0 in all active viewports.
Use the Dynamic UCS with Solid Models
With the dynamic UCS feature, you can temporarily and automatically align
the XY plane of the UCS with a plane on a solid model while creating objects.
When in a draw command, you align the UCS by moving your pointer over
an edge of a face rather than having to use the UCS command. After you finish
the command, the UCS returns to its previous location and orientation.
For example, you can use the dynamic UCS to create a rectangle on an angled
face of a solid model as shown in the illustration.
152 | Chapter 6 Create and Modify Objects
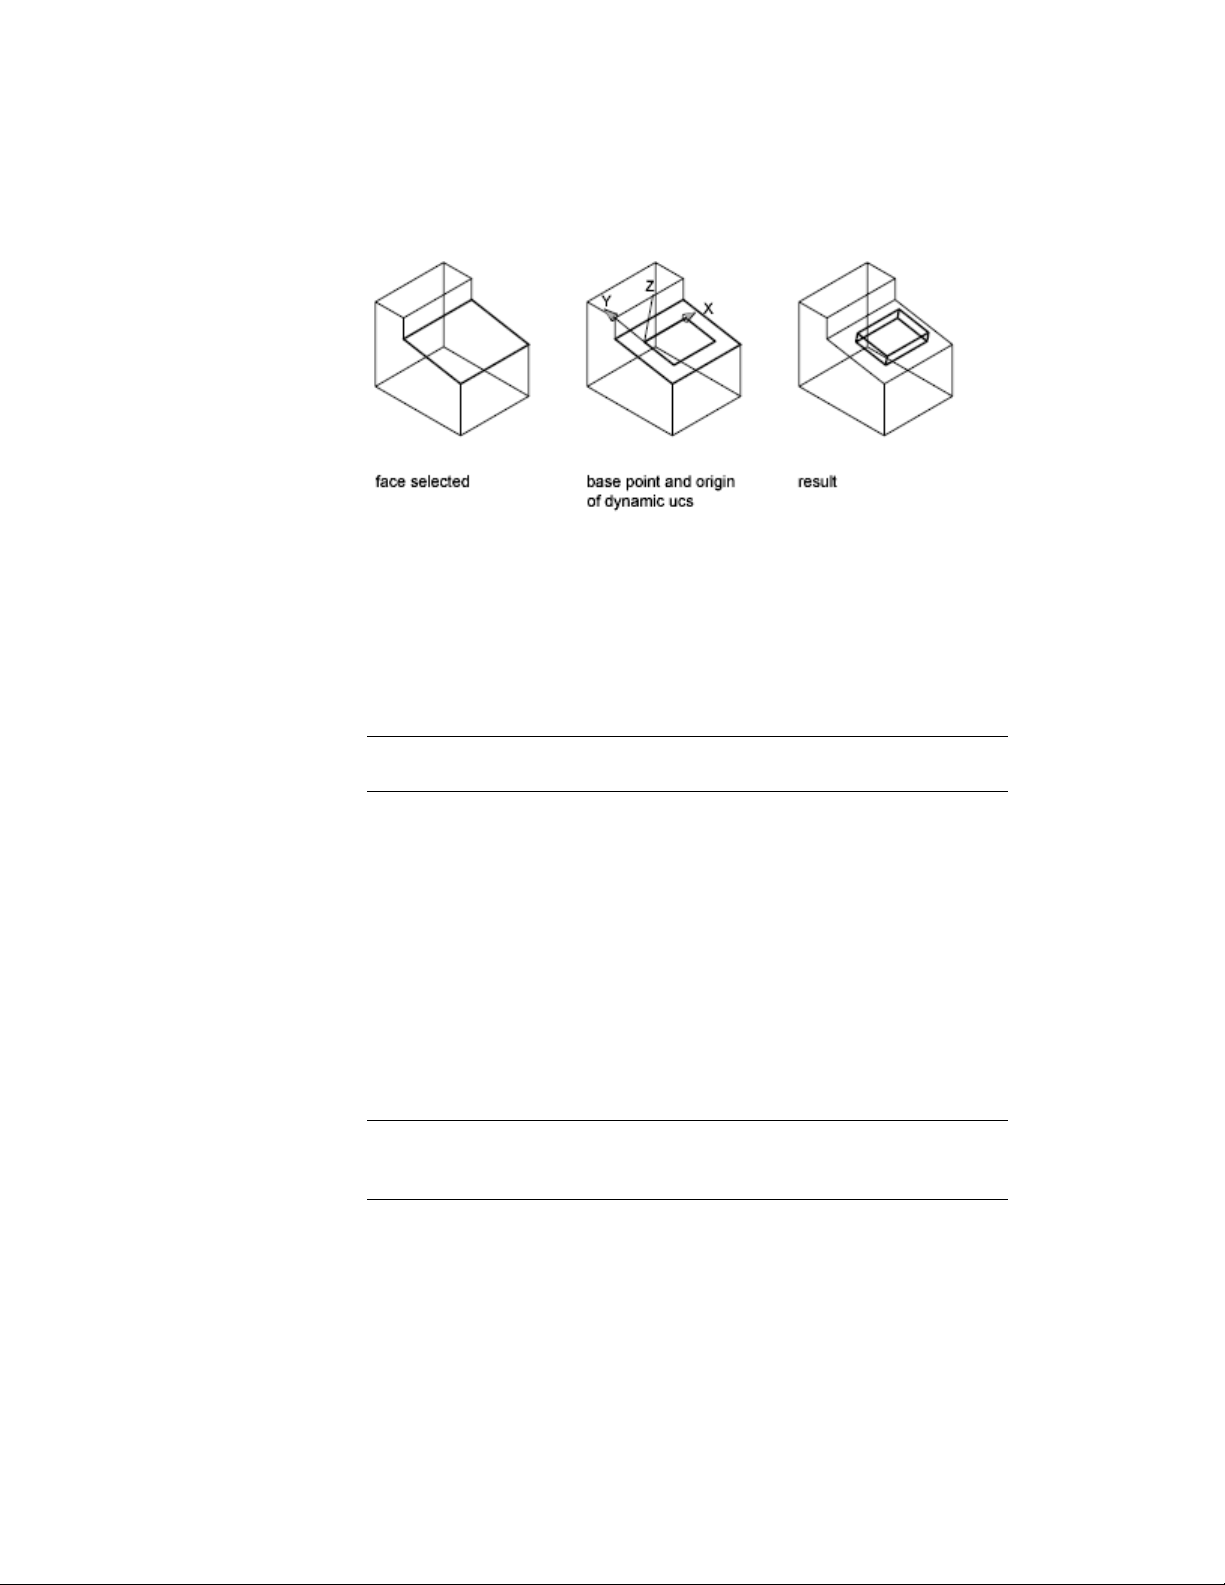
In the illustration on the left, the UCS is not aligned with the angled face.
Instead of relocating the UCS, you turn on the dynamic UCS on the status
bar or by pressing Fn-F6.
When you move the pointer completely over an edge as shown in the middle
illustration, the cursor changes to show the direction of the dynamic UCS
axes. You can then create objects on the angled face easily as shown in the
illustration on the right.
NOTE To display the XYZ labels on the cursor, right-click the DUCS button and
click Display Crosshair Labels.
The X axis of the dynamic UCS is located along an edge of the face and the
positive direction of the X axis always points toward the right half of the
screen. Only the front faces of a solid are detected by the dynamic UCS.
The types of commands that can use a dynamic UCS include the following:
■ Simple geometry. Line, polyline, rectangle, arc, circle
■ Text. Text, Multiline text, table
■ References. Insert, xref
■ Solids. Primitives and POLYSOLID
■ Editing. Rotate, mirror, align
■ Other. UCS, area, grip tool manipulation
TIP You can easily align the UCS with a plane on a solid model by turning on the
dynamic UCS feature and then using the UCS command to locate the origin on
that plane.
Use Precision Tools | 153
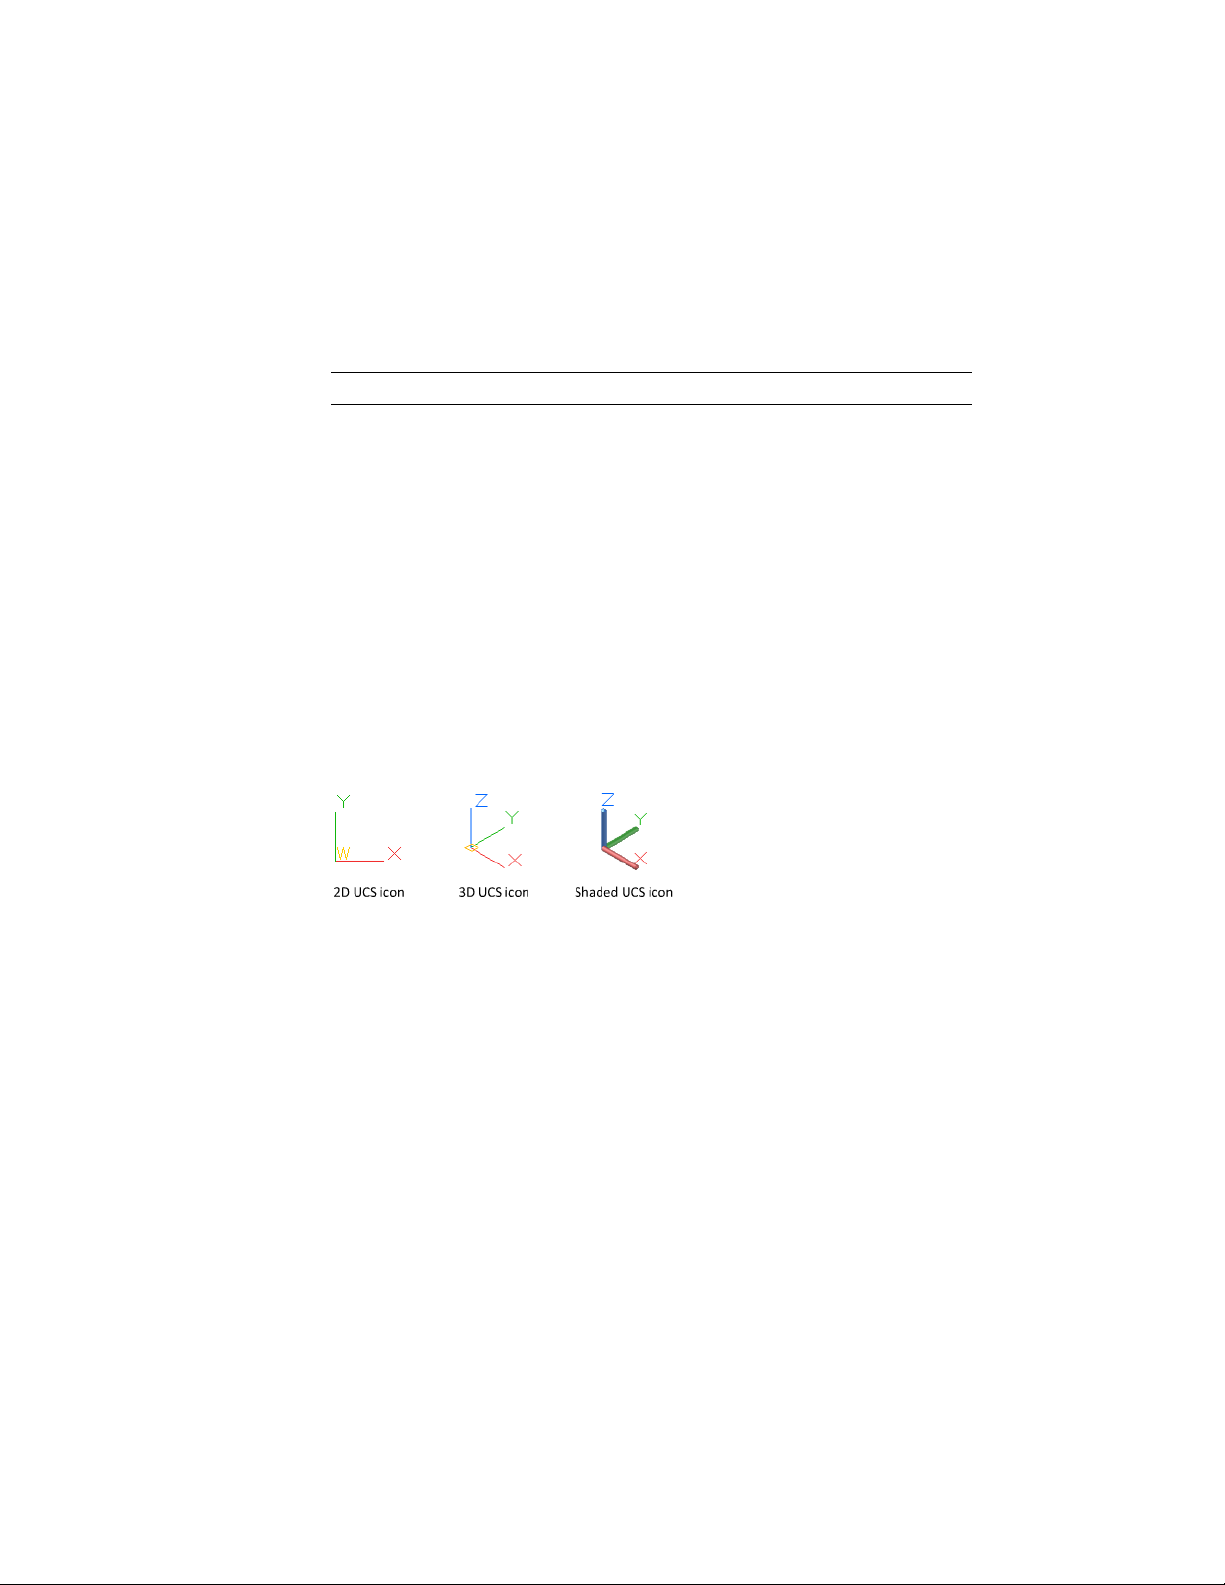
If Grid and Snap mode are turned on, they align temporarily to the dynamic
UCS. The limits of the grid display are set automatically.
You can temporarily turn off the dynamic UCS by pressing Fn-F6 or Shift-Z
while moving the pointer over a face.
NOTE The dynamic UCS is available only while a command is active.
Control the Display of the User Coordinate System
Icon
The user coordinate system icon (UCS icon) helps you visualize the current
orientation of the UCS. Several versions of this icon are available, and you
can change its size, location, and color.
To indicate the location and orientation of the UCS, the UCS icon is displayed
either at the UCS origin point or in the lower-left corner of the current
viewport.
You can choose a 2D or 3D style of the icon to represent the UCS when
working in 2D environment. Shaded style of icon is displayed to represent
the UCS in the 3D environment.
Use the UCSICON command to choose between displaying the 2D or the 3D
UCS icon. The shaded UCS icon is displayed for a shaded 3D view. To indicate
the origin and orientation of the UCS, you can display the UCS icon at the
UCS origin point using the UCSICON command.
The UCS Icon and Multiple Viewports
If you have multiple viewports, each viewport displays its own UCS icon.
Display and Hide the UCS Icon
In some circumstances, you might need to hide the UCS icon. With the
UCSICON command, you can turn off the UCS icon in a single viewport or
all viewports. Each layout also provides a UCS icon in paper space.
154 | Chapter 6 Create and Modify Objects
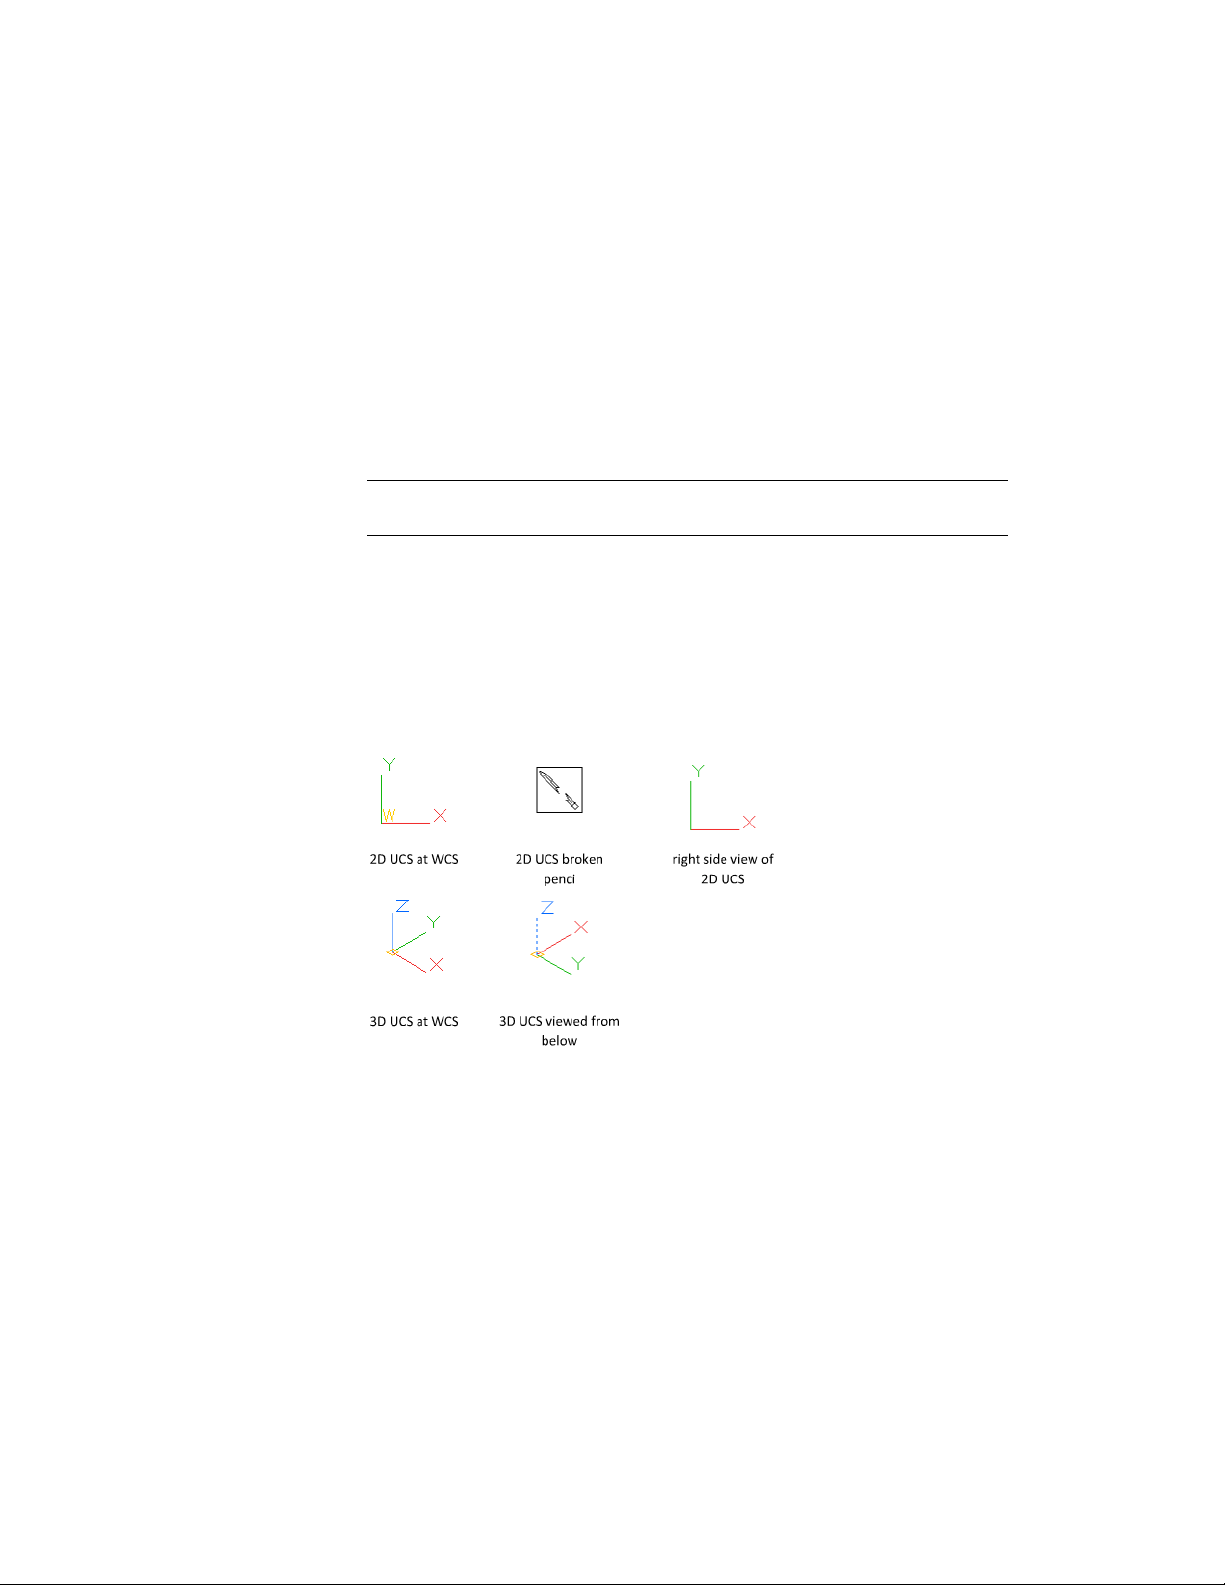
You can also hide the UCS icon based on the current visual style, and whether
perspective is turned on. Three system variables are available:
■ Use UCS2DDISPLAYSETTING to hide the UCS icon when the current visual
style is 2D Wireframe.
■ Use UCS3DPARADISPLAYSETTING to hide the UCS icon when perspective
(PERSPECTIVE) is turned off in a viewport with a 3D visual style.
■ Use UCS3DPERPDISPLAYSETTING to hide the UCS icon when perspective
is turned on in a viewport with a 3D visual style.
NOTE These system variables take precedence over the UCSICON setting in
viewports with certain visual styles.
You can also hide the UCS icon when the current visual style is set to 2D
Wireframe with the UCS2DDISPLAYSETTING system variable.
Variations in UCS Icon Types
The UCS icon is displayed in various ways to help you visualize the orientation
of the work plane. The following figure shows some of the possible icon
displays.
You can use the UCSICON command to switch between the 2D UCS icon and
the 3D UCS icon. You can also use the command to change the size, color,
and icon line width of the 3D UCS icon.
The UCS broken pencil icon replaces the 2D UCS icon when the viewing
direction is in a plane parallel to the UCS XY plane. The broken pencil icon
indicates that the edge of the XY plane is almost perpendicular to your viewing
Use Precision Tools | 155

direction. This icon warns you not to use your pointing device to specify
coordinates.
When you use the pointing device to locate a point, it's normally placed on
the XY plane. If the UCS is rotated so that the Z axis lies in a plane parallel to
the viewing plane—that is, if the XY plane is edge-on to the viewer—it may
be difficult to visualize where the point will be located. In this case, the point
will be located on a plane parallel to your viewing plane that also contains
the UCS origin point. For example, if the viewing direction is along the X axis,
coordinates specified with a pointing device will be located on the YZ plane,
which contains the UCS origin point.
Use the 3D UCS icon to help you visualize which plane these coordinates will
be projected on; the 3D UCS icon does not use a broken pencil icon.
Enter Coordinates to Specify Points
When a command prompts you for a point, you can use the pointing device
to specify a point, or you can enter a coordinate value at the command prompt.
Overview of Coordinate Entry
You can enter two-dimensional coordinates as either Cartesian (X,Y) or polar
coordinates. When dynamic input is on, you can enter coordinate values in
tooltips near the cursor.
Cartesian and Polar Coordinates
A Cartesian coordinate system has three axes, X, Y, and Z. When you enter
coordinate values, you indicate a point's distance (in units) and its direction
(+ or -) along the X, Y, and Z axes relative to the coordinate system origin
(0,0,0).
In 2D, you specify points on the XY plane, also called the work plane. The
work plane is similar to a flat sheet of grid paper. The X value of a Cartesian
coordinate specifies horizontal distance, and the Y value specifies vertical
distance. The origin point (0,0) indicates where the two axes intersect.
Polar coordinates use a distance and an angle to locate a point. With both
Cartesian and polar coordinates, you can enter absolute coordinates based on
the origin (0,0), or relative coordinates based on the last point specified.
156 | Chapter 6 Create and Modify Objects

Another method of entering a relative coordinate is by moving the cursor to
specify a direction and then entering a distance directly. This method is called
direct distance entry.
You can enter coordinates in scientific, decimal, engineering, architectural,
or fractional notation. You can enter angles in grads, radians, surveyor's units,
or degrees, minutes, and seconds. The UNITS command controls unit format.
See also:
Enter Cartesian Coordinates (page 157)
Enter Polar Coordinates (page 159)
Enter 3D Coordinates (page 161)
Use Dynamic Input (page 166)
Enter 2D Coordinates
Absolute and relative 2D Cartesian and polar coordinates determine precise
locations of objects in a drawing.
Enter Cartesian Coordinates
You can use absolute or relative Cartesian (rectangular) coordinates to locate
points when creating objects.
To use Cartesian coordinates to specify a point, enter an X value and a Y value
separated by a comma (X,Y). The X value is the positive or negative distance,
in units, along the horizontal axis. The Y value is the positive or negative
distance, in units, along the vertical axis.
Absolute coordinates are based on the UCS origin (0,0), which is the
intersection of the X and Y axes. Use absolute coordinates when you know
the precise X and Y values of the point.
With dynamic input, you can specify absolute coordinates with the # prefix.
If you enter coordinates on the command line instead of in the tooltip, the
# prefix is not used. For example, entering #3,4 specifies a point 3 units along
the X axis and 4 units along the Y axis from the UCS origin. For more
information about dynamic input, see Use Dynamic Input (page 166).
The following example draws a line beginning at an X value of -2, a Y value
of 1, and an endpoint at 3,4. Enter the following in the tooltip:
Use Precision Tools | 157
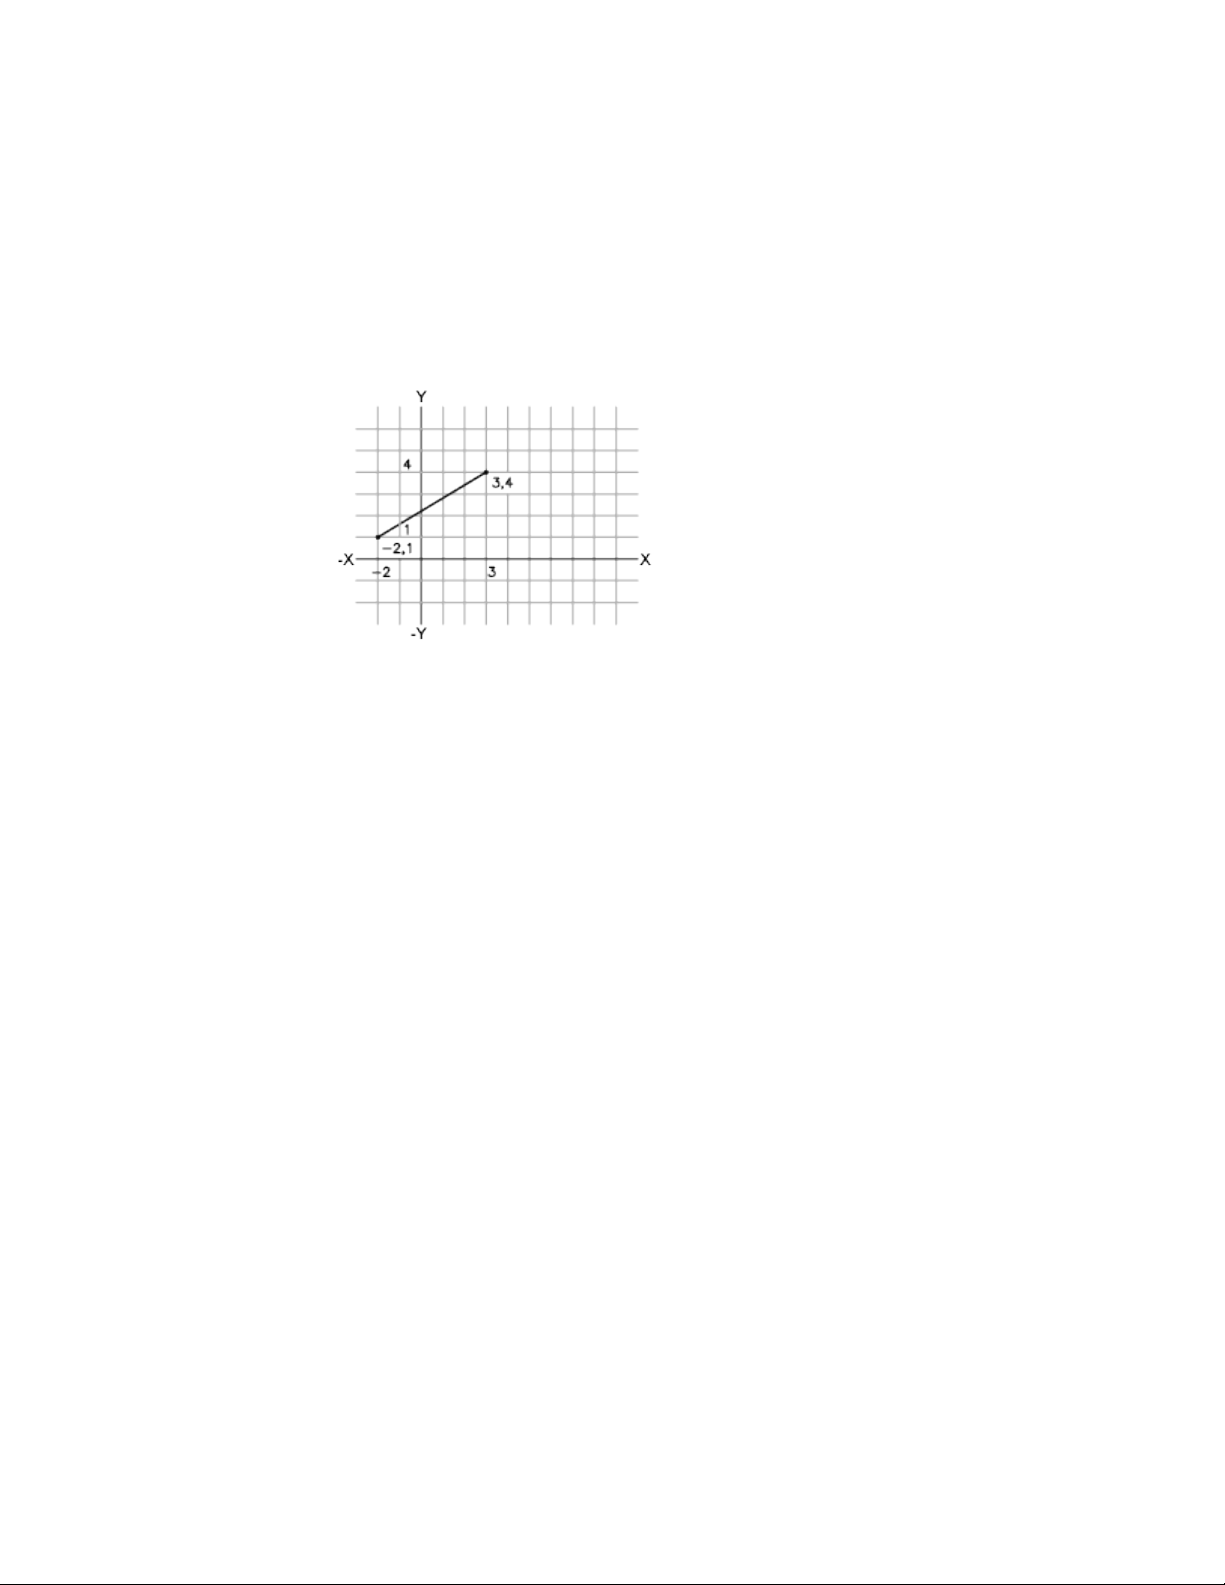
Command: line
From point: #-2,1
To point: #3,4
The line is located as follows:
Relative coordinates are based on the last point entered. Use relative
coordinates when you know the location of a point in relation to the previous
point.
To specify relative coordinates, precede the coordinate values with an @ sign.
For example, entering @3,4 specifies a point 3 units along the X axis and 4
units along the Y axis from the last point specified.
The following example draws the sides of a triangle. The first side is a line
starting at the absolute coordinates -2,1 and ending at a point 5 units in the
X direction and 0 units in the Y direction. The second side is a line starting
at the endpoint of the first line and ending at a point 0 units in the X direction
and 3 units in the Y direction. The final line segment uses relative coordinates
to return to the starting point.
Command: line
From point: #-2,1
To point: @5,0
To point: @0,3
To point: @-5,-3
158 | Chapter 6 Create and Modify Objects
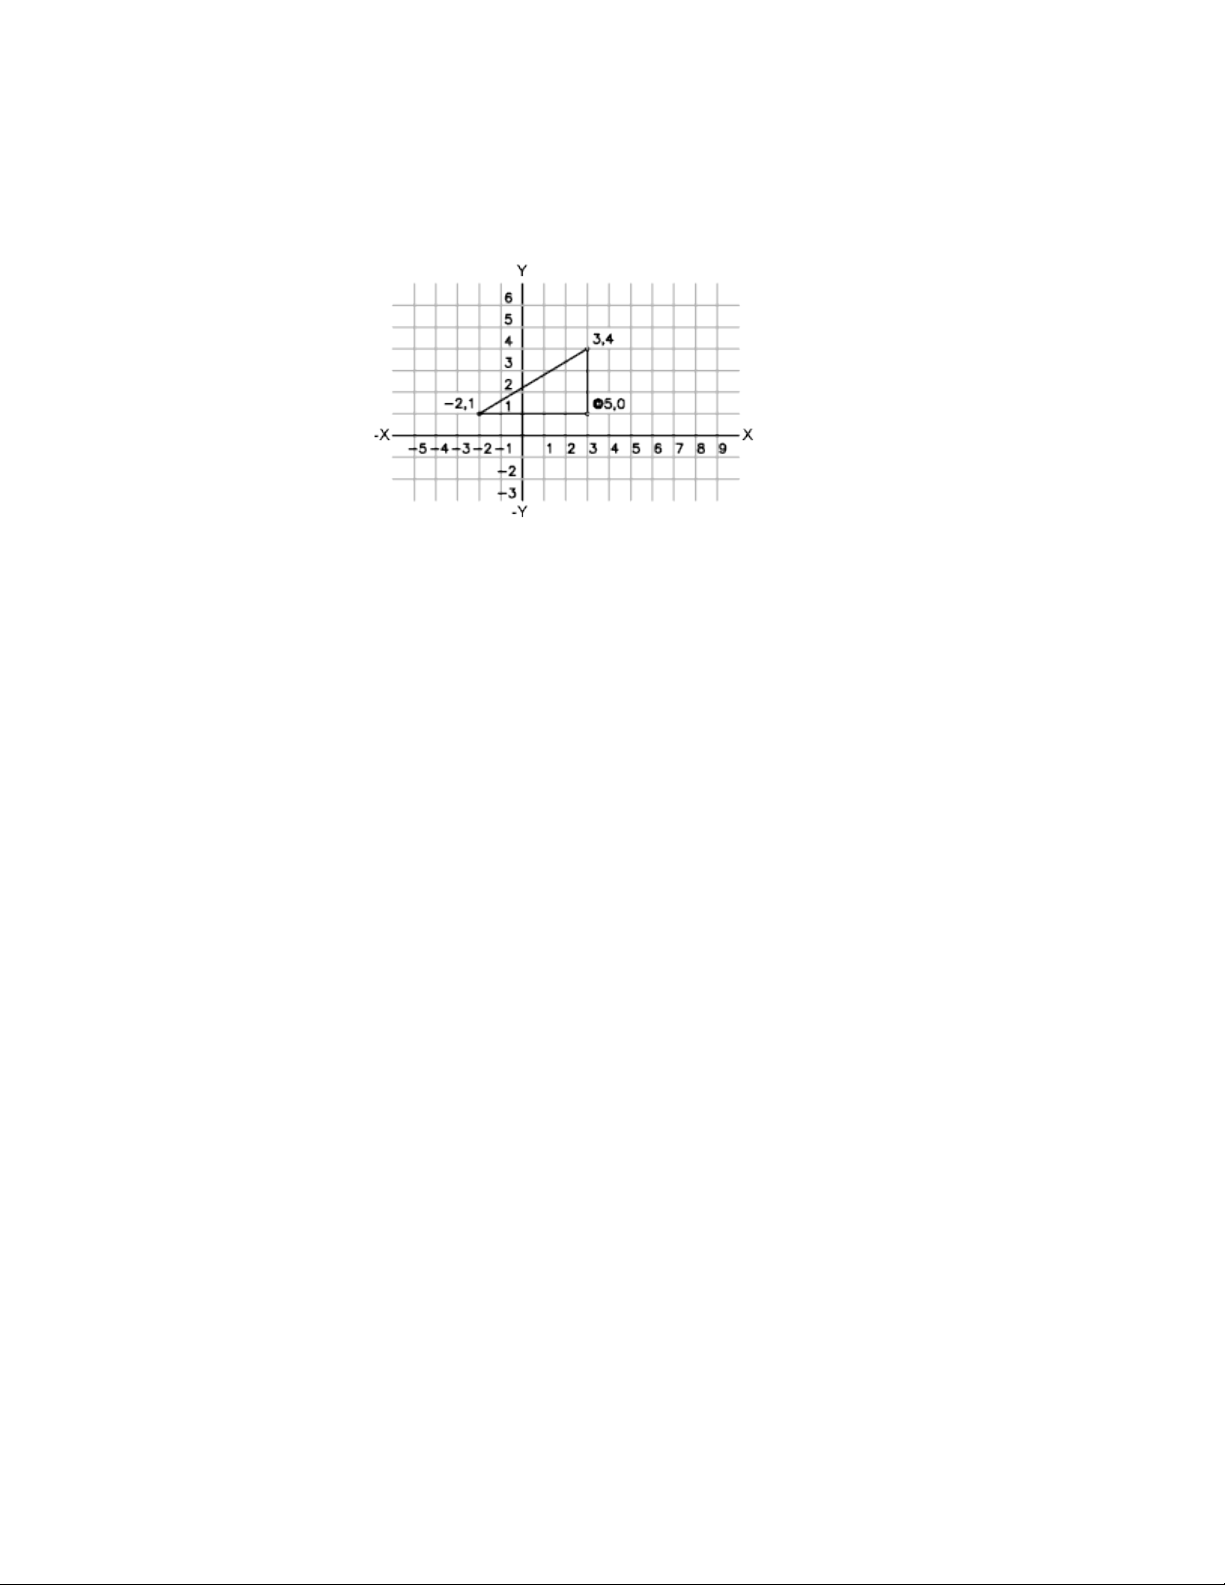
Enter Cartesian Coordinates
To enter absolute Cartesian coordinates (2D)
■ At a prompt for a point, enter coordinates in the tooltip using the following
format:
#x,y
If dynamic input is turned off, enter coordinates on the command line
using the following format:
x,y
To enter relative Cartesian coordinates (2D)
■ At a prompt for a point, enter coordinates using the following format:
@x,y
Enter Polar Coordinates
You can use absolute or relative polar coordinates (distance and angle) to
locate points when creating objects.
To use polar coordinates to specify a point, enter a distance and an angle
separated by an angle bracket (<).
By default, angles increase in the counterclockwise direction and decrease in
the clockwise direction. To specify a clockwise direction, enter a negative value
for the angle. For example, entering 1<315 locates the same point as entering
Use Precision Tools | 159
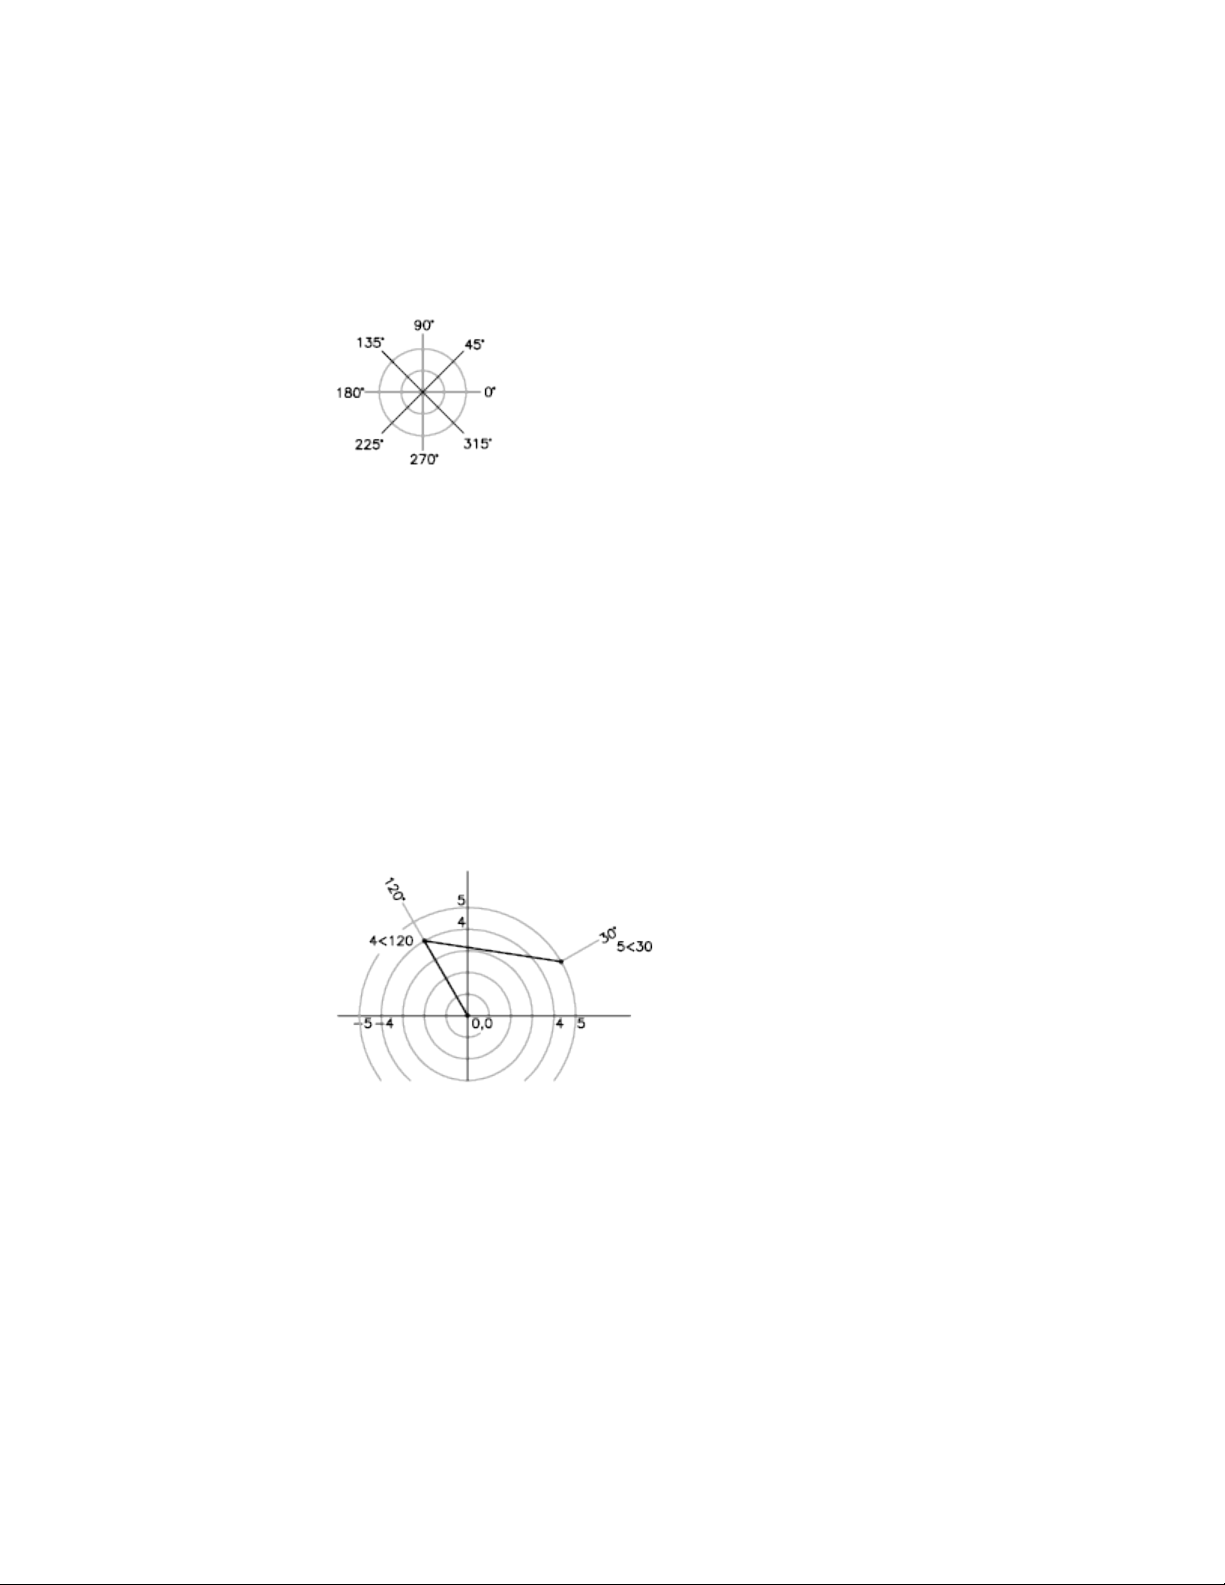
1<-45. You can change the angle conventions for the current drawing with
UNITS.
Absolute polar coordinates are measured from the UCS origin (0,0), which is
the intersection of the X and Y axes. Use absolute polar coordinates when you
know the precise distance and angle coordinates of the point.
With dynamic input, you can specify absolute coordinates with the # prefix.
If you enter coordinates on the command line instead of in the tooltip, the
# prefix is not used. For example, entering #3<45 specifies a point 3 units
from the origin at an angle of 45 degrees from the X axis. For more information
about dynamic input, see Use Dynamic Input (page 166).
The following example shows two lines drawn with absolute polar coordinates
using the default angle direction setting. Enter the following in the tooltip:
Command: line
From point: #0,0
To point: #4<120
To point: #5<30
Relative coordinates are based on the last point entered. Use relative
coordinates when you know the location of a point in relation to the previous
point.
To specify relative coordinates, precede the coordinate values with an @ sign.
For example, entering @1<45 specifies a point at a distance of 1 unit from
the last point specified at an angle of 45 degrees from the X axis.
160 | Chapter 6 Create and Modify Objects
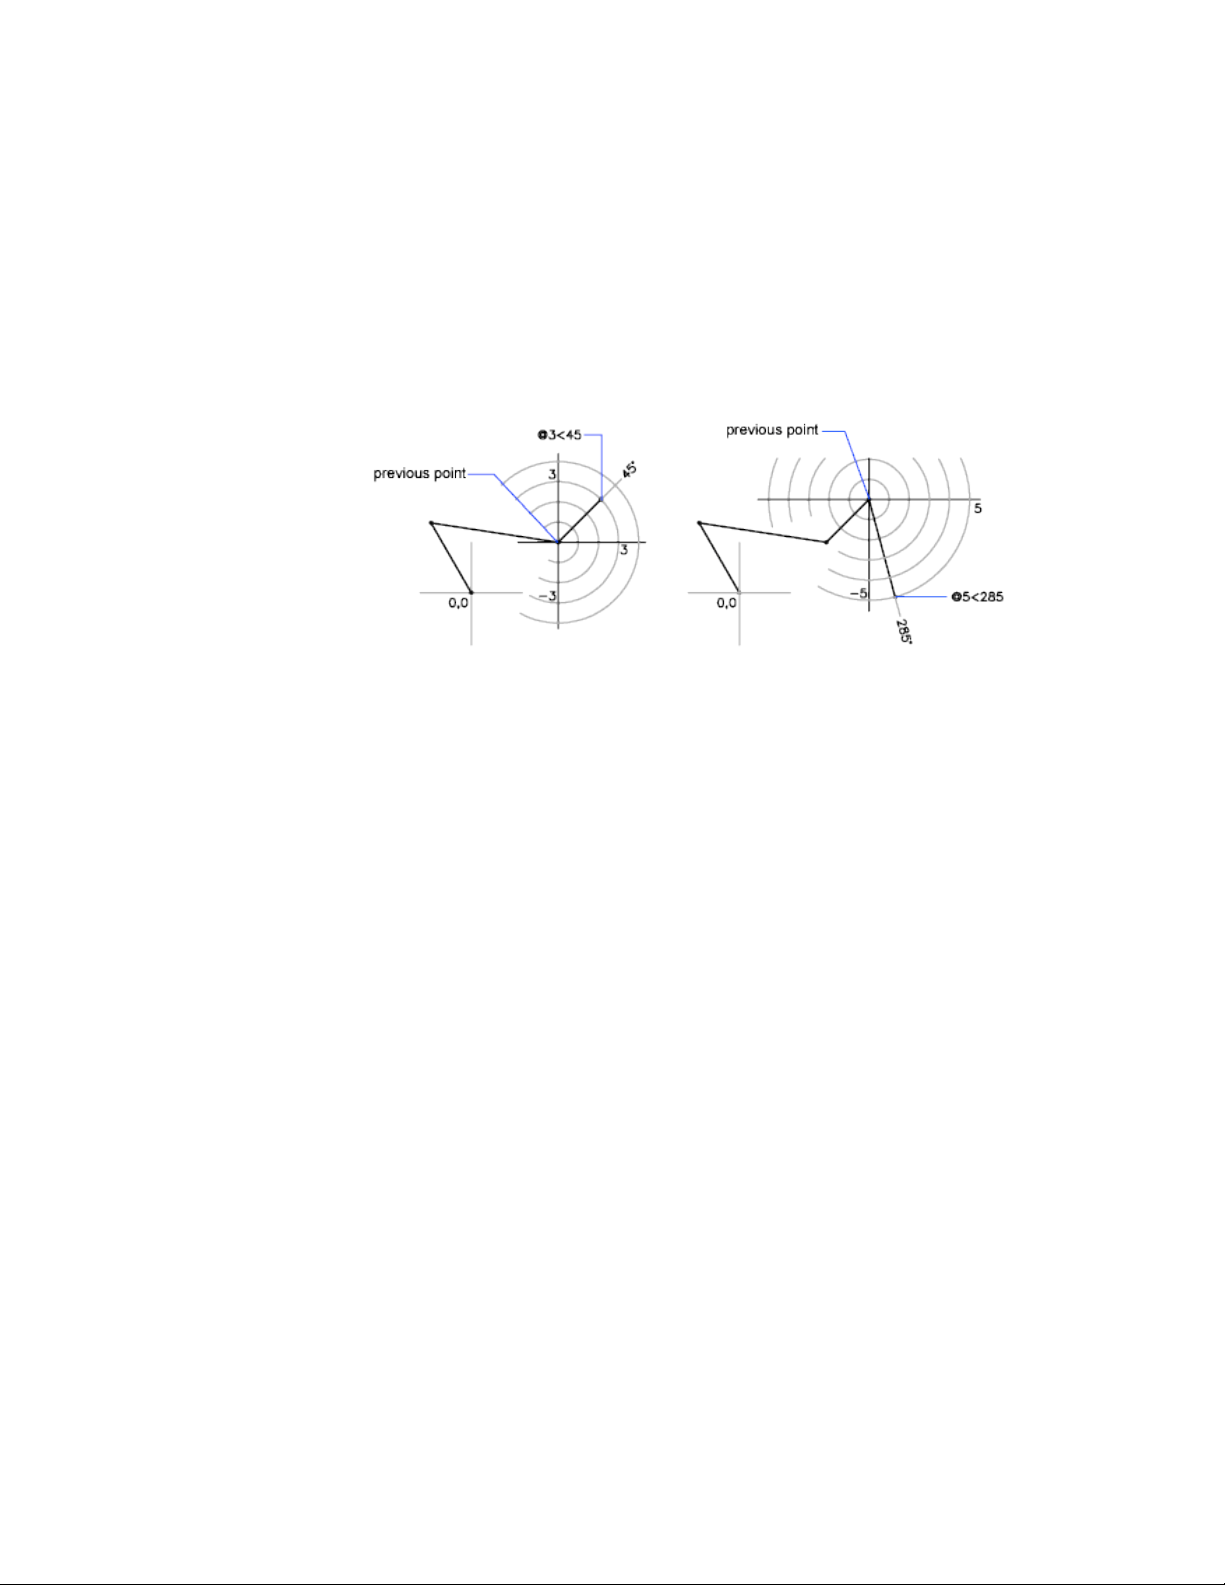
The following example shows two lines drawn with relative polar coordinates.
In each illustration, the line begins at the location labeled as the previous
point.
Command: line
From point: @3<45
To point: @5<285
Enter Polar Coordinates
To enter absolute polar coordinates (2D)
■ At a prompt for a point, enter coordinates in the tooltip using the following
format:
#distance<angle
If dynamic input is turned off, enter coordinates on the command line
using the following format:
distance<angle
To enter relative polar coordinates (2D)
■ At a prompt for a point, enter coordinates using the following format:
@distance<angle
Enter 3D Coordinates
Cartesian, cylindrical, or spherical coordinates locate points when you are
creating objects in 3D.
Use Precision Tools | 161
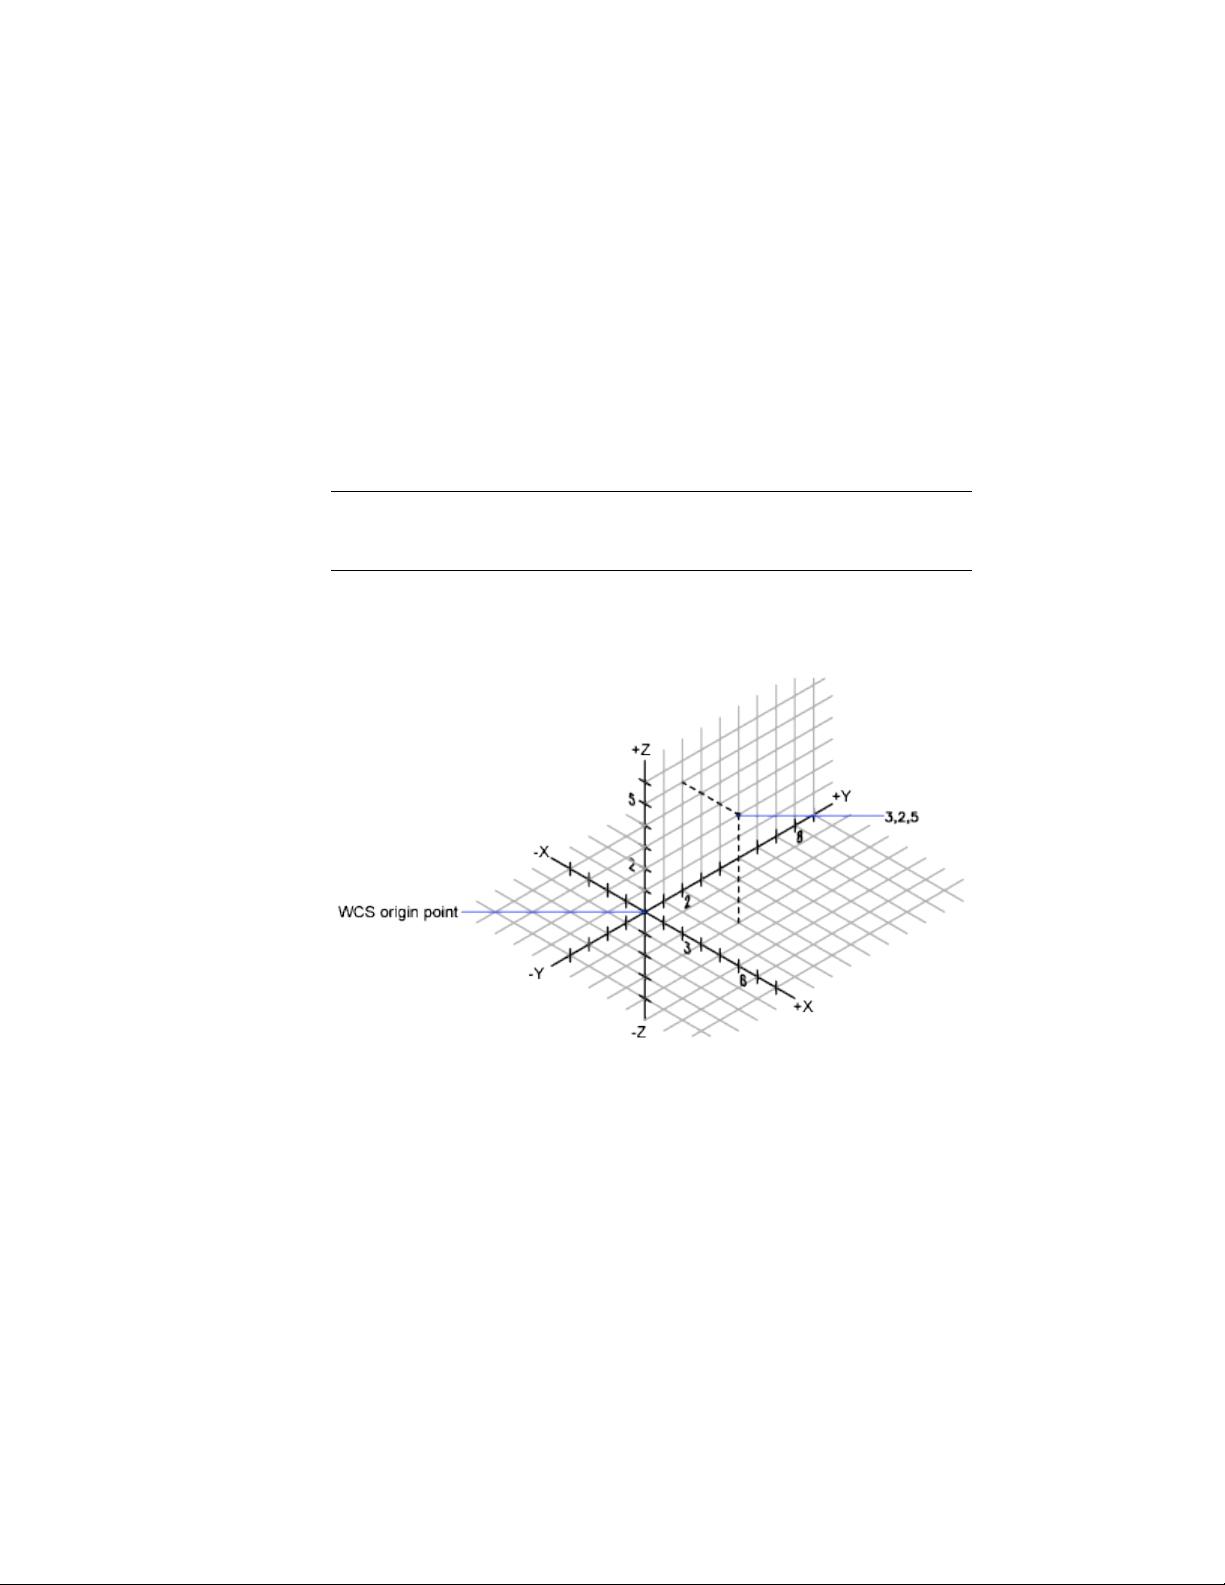
Enter 3D Cartesian Coordinates
3D Cartesian coordinates specify a precise location by using three coordinate
values: X, Y, and Z.
Entering 3D Cartesian coordinate values (X,Y,Z) is similar to entering 2D
coordinate values (X,Y). In addition to specifying X and Y values, you also
specify a Z value using the following format:
X,Y,Z
NOTE For the following examples, it is assumed that dynamic input is turned off
or that the coordinates are entered on the command line. With dynamic input,
you specify absolute coordinates with the # prefix.
In the illustration below, the coordinate values of 3,2,5 indicates a point 3
units along the positive X axis, 2 units along the positive Y axis, and 5 units
along the positive Z axis.
Use Default Z Values
When you enter coordinates in the format X,Y, the Z value is copied from the
last point you entered. As a result, you can enter one location in the X,Y,Z
format and then enter subsequent locations using the X,Y format with the Z
value remaining constant. For example, if you enter the following coordinates
for a line
162 | Chapter 6 Create and Modify Objects

From point: 0,0,5
To point: 3,4
both endpoints of the line will have a Z value of 5. When you begin or open
any drawing, the initial default value of Z is greater than 0.
Use Absolute and Relative Coordinates
As with 2D coordinates, you can enter absolute coordinate values, which are
based on the origin, or you can enter relative coordinate values, which are
based on the last point entered. To enter relative coordinates, use the @ sign
as a prefix. For example, use @1,0,0 to enter a point one unit in the positive
X direction from the previous point. To enter absolute coordinates at the
Command prompt, no prefix is necessary.
Enter 3D Cartesian Coordinates
To enter absolute coordinates (3D)
■ At a prompt for a point, enter coordinates in the tooltip using the following
format:
#x,y,z
If dynamic input is turned off, enter coordinates on the command line
using the following format:
x,y,z
To enter relative coordinates (3D)
■ At a prompt for a point, enter coordinates using the following format:
@x,y,z
Enter Cylindrical Coordinates
3D cylindrical coordinates describe a precise location by a distance from the
UCS origin in the XY plane, an angle from the X axis in the XY plane, and a
Z value.
Cylindrical coordinate entry is the 3D equivalent of 2D polar coordinate entry.
It specifies an additional coordinate on an axis that is perpendicular to the
XY plane. Cylindrical coordinates define points by a distance in the XY plane
Use Precision Tools | 163
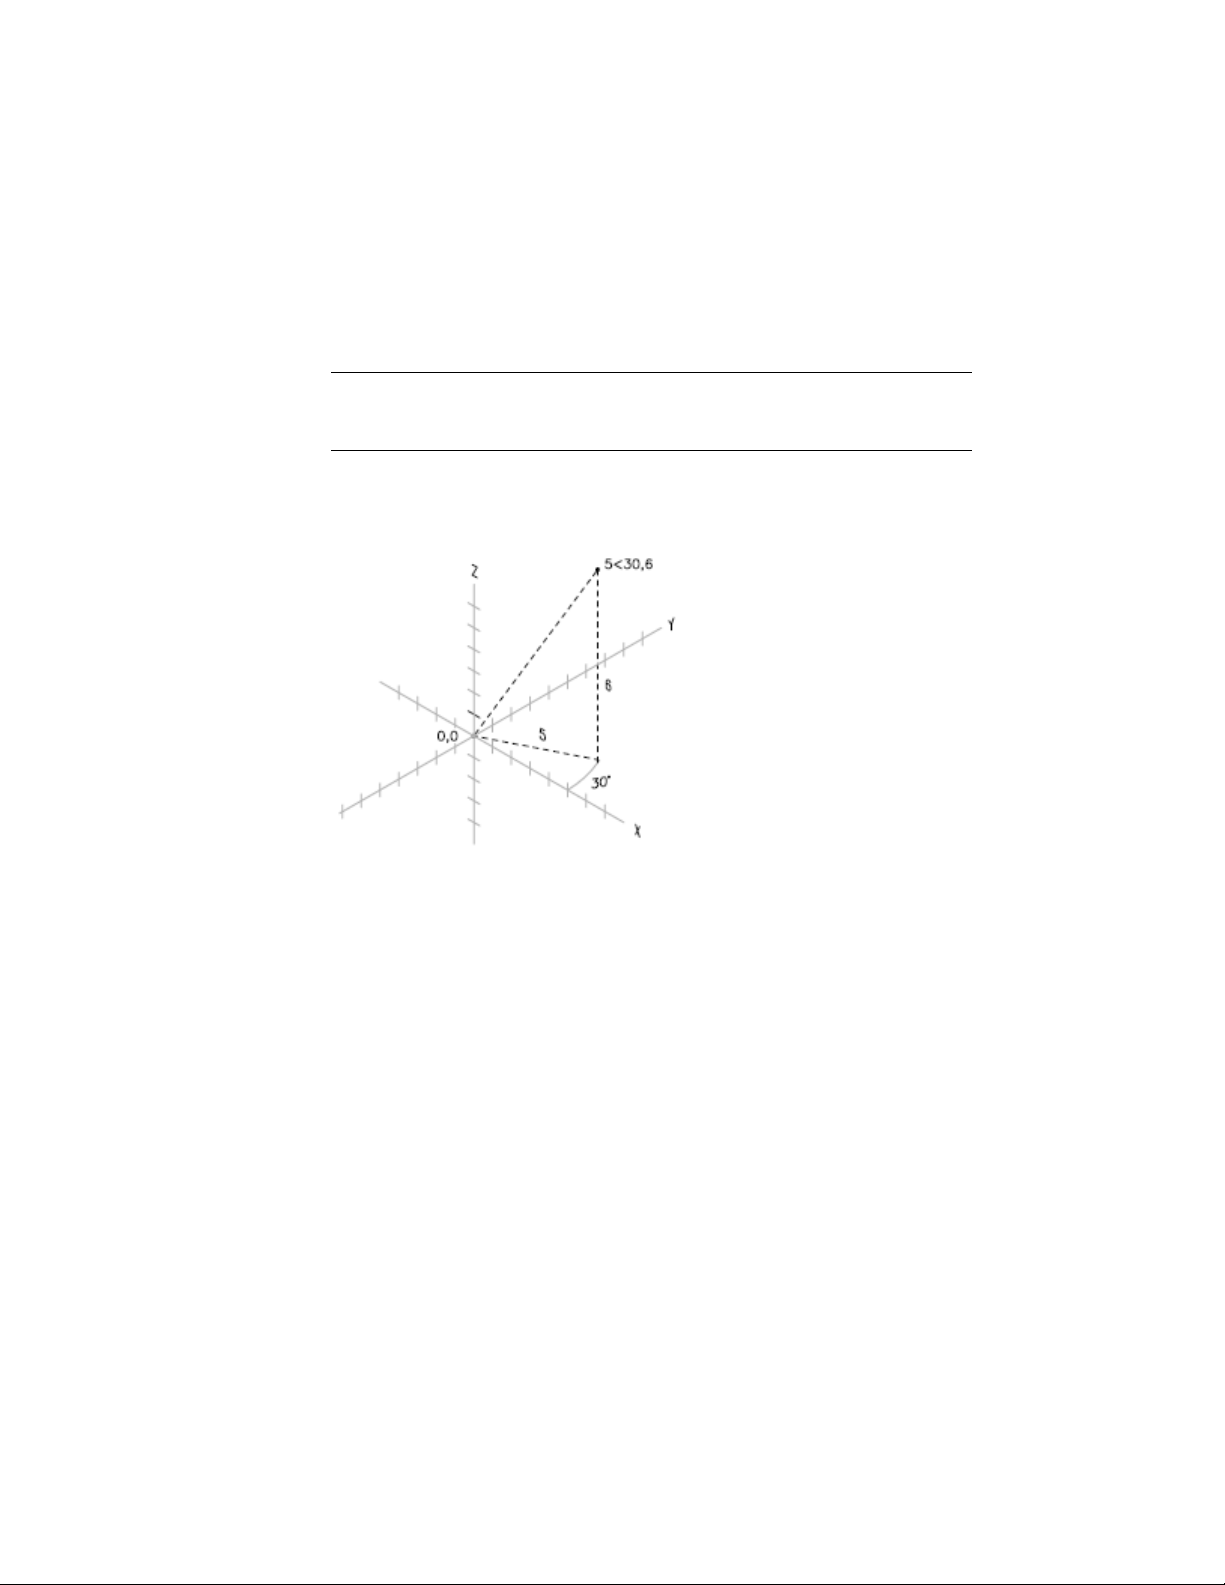
from the UCS origin, an angle from the X axis in the XY plane, and a Z value.
You specify a point using absolute cylindrical coordinates with the following
syntax:
X<[angle from X axis],Z
NOTE For the following examples, it is assumed that dynamic input is turned off
or that the coordinates are entered on the command line. With dynamic input,
you specify absolute coordinates with the # prefix.
In the illustration below, 5<30,6 indicates a point 5 units from the origin of
the current UCS, 30 degrees from the X axis in the XY plane, and 6 units along
the Z axis.
When you need to define a point based on a previous point rather than the
UCS origin, you can enter relative cylindrical coordinate values with the @
prefix. For example, @4<45,5 specifies a point 4 units in the XY plane from
the last point entered, at an angle of 45 degrees from the positive X direction,
and extending 5 units in the positive Z direction.
Enter Cylindrical Coordinates
To enter relative cylindrical coordinates
■ At a prompt for a point, enter the coordinate values using the following
format:
@x<angle from the X axis,z
164 | Chapter 6 Create and Modify Objects
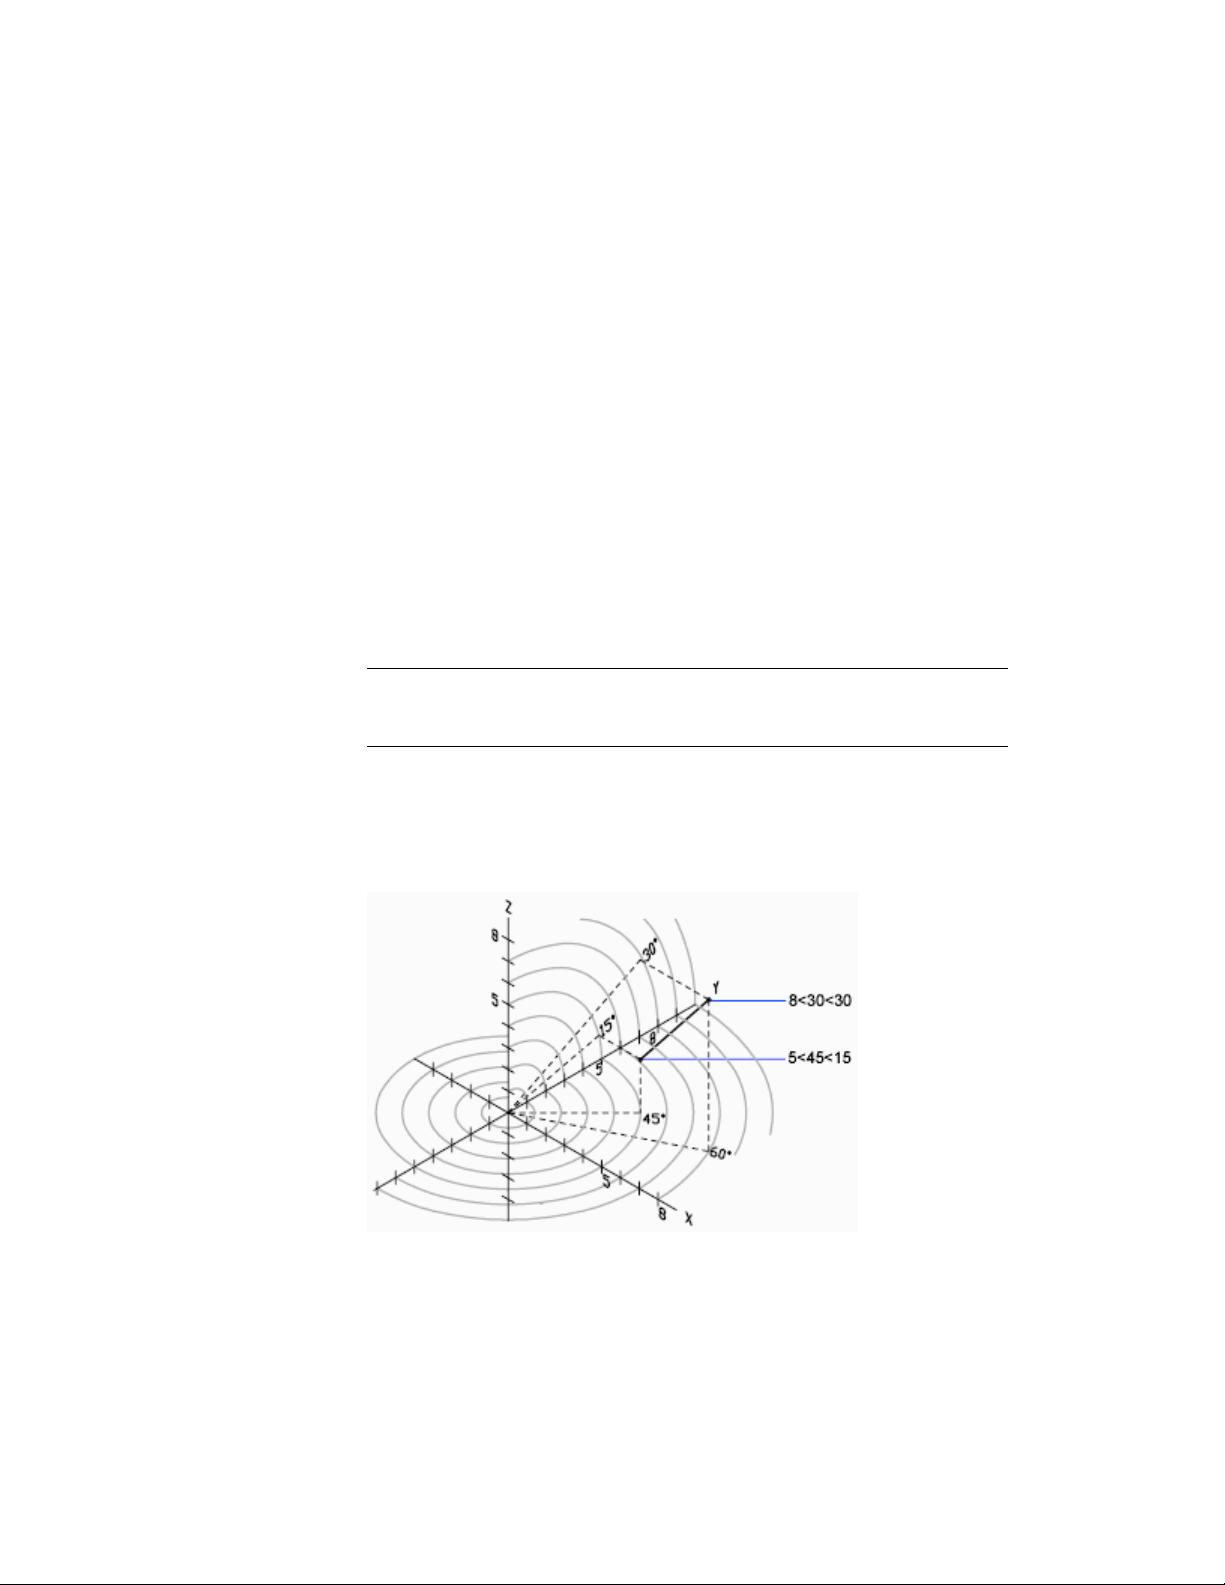
For example, @4<60,2 represents a location that is 4 units along the X axis
from the last point measured at 60 degrees from the positive X axis and at 2
units in the positive Z direction.
Enter Spherical Coordinates
3D spherical coordinates specify a location by a distance from the origin of
the current UCS, an angle from the X axis in the XY plane, and an angle from
the XY plane.
Spherical coordinate entry in 3D is similar to polar coordinate entry in 2D.
You locate a point by specifying its distance from the origin of the current
UCS, its angle from the X axis (in the XY plane), and its angle from the XY
plane, each angle preceded by an open angle bracket (<) as in the following
format:
X<[angle from X axis]<[angle from XY plane]
NOTE For the following examples, it is assumed that dynamic input is turned off
or that the coordinates are entered on the command line. With dynamic input,
you specify absolute coordinates with the # prefix.
In the following illustration, 8<60<30 indicates a point 8 units from the origin
of the current UCS in the XY plane, 60 degrees from the X axis in the XY
plane, and 30 degrees up the Z axis from the XY plane. 5<45<15 indicates a
point 5 units from the origin, 45 degrees from the X axis in the XY plane, and
15 degrees up from the XY plane.
Use Precision Tools | 165

When you need to define a point based on a previous point, enter the relative
spherical coordinate values by preceding them with the @ sign.
Enter Spherical Coordinates
To enter relative spherical coordinates
■ At a prompt for a point, enter the coordinate values using the following
format:
@x<angle from the x axis<angle from the xy plane
For example, @4<60<30 represents a location that is 4 units from the last point
measured at 60 degrees from the positive X axis in the XY plane and at 30
degrees from the XY plane.
Use Dynamic Input
Dynamic Input provides a command interface near the cursor to help you
keep your focus in the drafting area.
When dynamic input is on, tooltips display information near the cursor that
is dynamically updated as the cursor moves. When a command is active, the
tooltips provide a place for user entry.
After you type a value in an input field and press Tab, the field then displays
a lock icon, and the cursor is constrained by the value that you entered. You
can then enter a value for the second input field. Alternately, if you type a
value and press Enter, the second input field is ignored and the value is
interpreted as direct distance entry.
The actions required to complete a command or to use grips are similar to
those for the Command prompt. The difference is that your attention can
stay near the cursor.
Dynamic input is not designed to replace the command line. You can hide
the command line to add screen area for drawing, but you will need to display
it for some operations.
166 | Chapter 6 Create and Modify Objects

Turn On or Turn Off Dynamic Input
Click the dynamic input button on the status bar to turn dynamic input
on and off. Dynamic input has three components: pointer input, dimensional
input, and dynamic prompts. Right-click the dynamic input button and click
Settings to control what is displayed by each component when dynamic input
is on.
Pointer Input
When pointer input is on and a command is active, the location of the
crosshairs is displayed as coordinates in a tooltip near the cursor. You can
enter coordinate values in the tooltip instead of on the command line.
The default for second and subsequent points is relative polar coordinates
(relative Cartesian for RECTANG). There is no need to type the at sign (@). If
you want to use absolute coordinates, use the pound sign (#) prefix. For
example, to move an object to the origin, for the second point prompt, enter
#0,0.
Use the pointer input settings to change the default format for coordinates
and to control when pointer input tooltips are displayed.
Dimensional Input
When dimensional input is on, the tooltips display distance and angle values
when a Command prompts for a second point. The values in the dimensional
tooltips change as you move the cursor. Press Tab to move to the value you
want to change. Dimensional input is available for ARC, CIRCLE, ELLIPSE,
LINE, and PLINE.
When you use grips to edit an object, the dimensional input tooltips can
display the following information:
■ Original length
■ A length that updates as you move the grip
■ The change in the length
■ Angle
■ The change in the angle as you move the grip
■ The radius of an arc
Use Precision Tools | 167
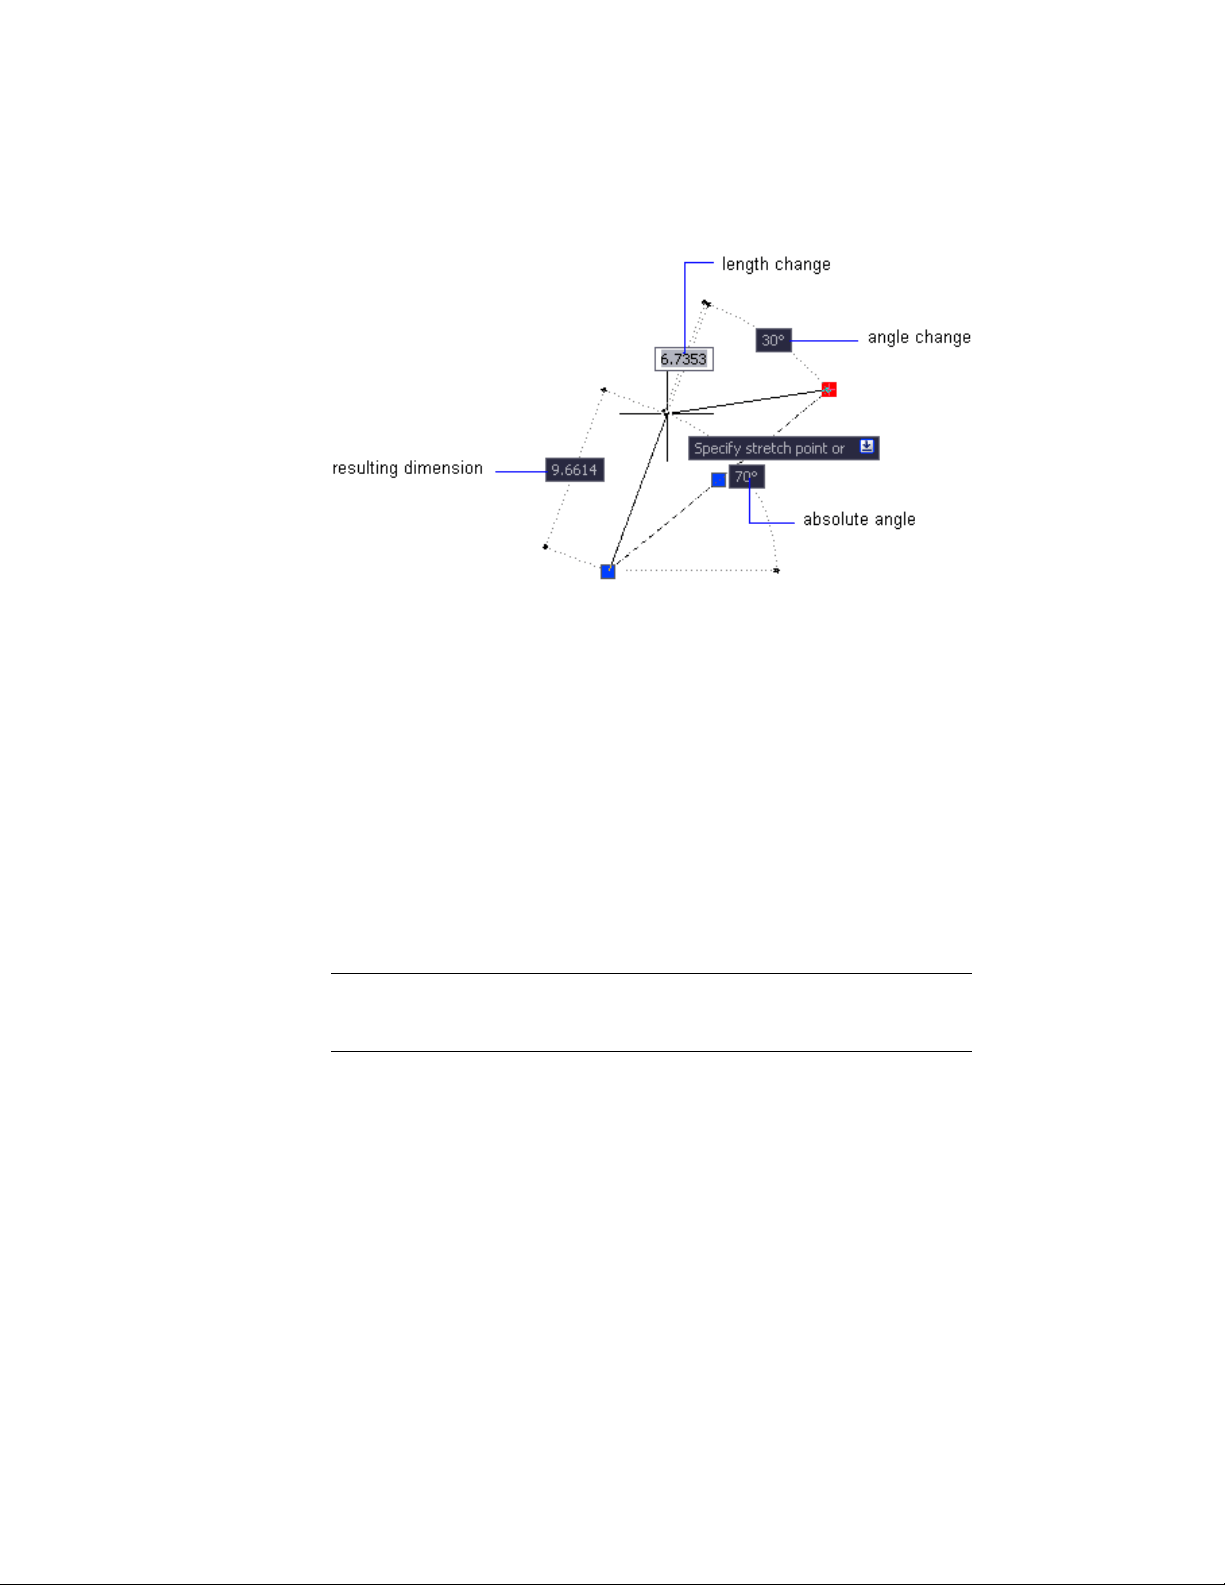
Use the dimensional input settings to display only the information you want
to see.
When you use grips to stretch objects or when you create new objects,
dimensional input displays only acute angles, that is, all angles are displayed
as 180 degrees or less. Thus, an angle of 270 degrees is displayed as 90 degrees
regardless of the ANGDIR system variable setting (set in the Drawing Units
dialog box). Angles specified when creating new objects rely on the cursor
location to determine the positive angle direction.
Dynamic Prompts
When dynamic prompts are on, prompts are displayed in a tooltip near the
cursor. You can enter a response in the tooltip instead of on the command
line. Press the Down Arrow key to view and select options. Press the Up Arrow
key to display recent input.
NOTE To use paste text into a dynamic prompt tooltip, type a letter and then
backspace to delete it before you paste the entry. Otherwise, the entry is pasted
into the drawing as text.
Snap to Locations on Objects (Object Snaps)
Instead of entering coordinates, you can specify points relative to existing
objects such as endpoints of lines or center points of circles.
168 | Chapter 6 Create and Modify Objects
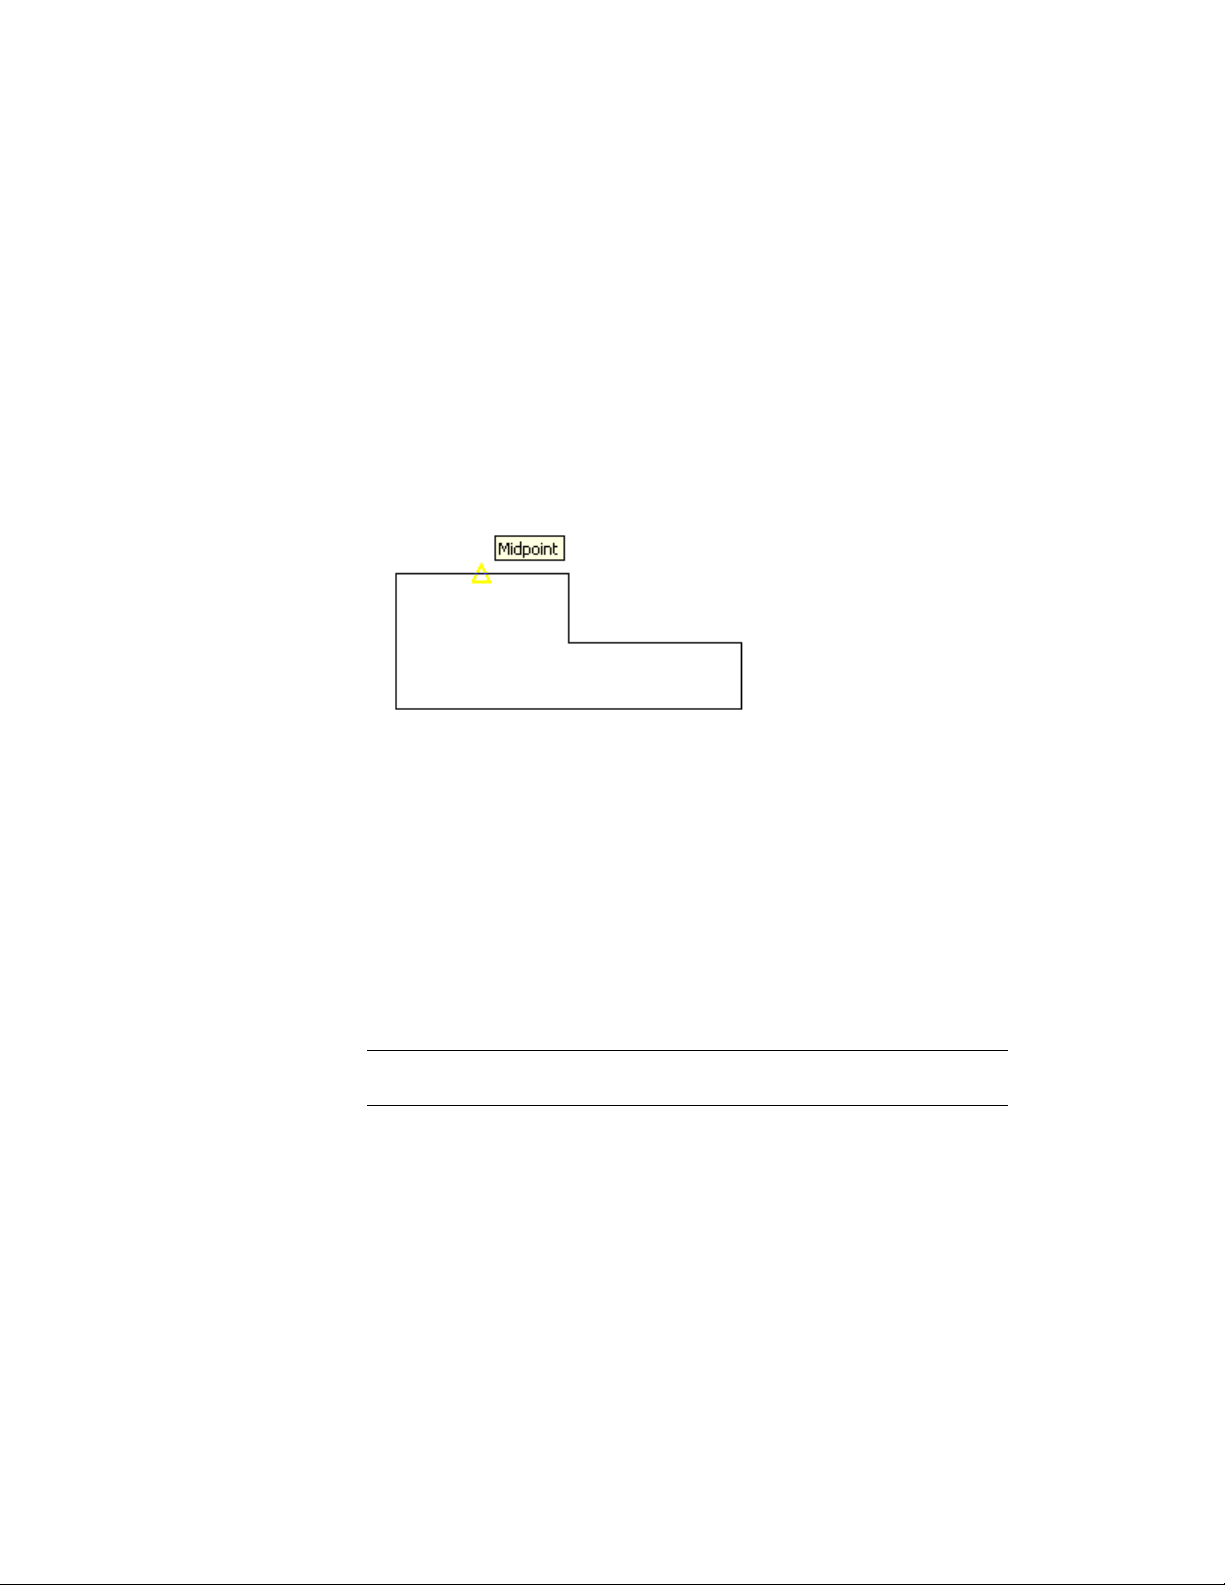
Use Object Snaps
Use object snaps to specify precise locations on objects. For example, you can
use an object snap to draw a line to the center of a circle or to the midpoint
of a polyline segment.
You can specify an object snap whenever you are prompted for a point. By
default, a marker and a tooltip are displayed when you move the cursor over
an object snap location on an object. This feature, called AutoSnap
™
, provides
a visual clue that indicates which object snaps are in effect.
For a list of object snaps, see OSNAP.
Specify an Object Snap
To specify an object snap at a prompt for a point, you can
■ When prompted for a point, right-click and choose an object snap from
the Snap Overrides sub-menu
■ Enter the name of an object snap at the Command prompt
■ On the status bar, right-click the object snap button
When you specify an object snap at a prompt for a point, the object snap stays
in effect only for the next point that you specify.
NOTE Object snaps work only when you are prompted for a point. If you try to
use an object snap at the Command prompt, an error message is displayed.
Use Running Object Snaps
If you need to use one or more object snaps repeatedly, you can turn on running
object snaps. For example, you might set Center as a running object snap if
you need to connect the centers of a series of circles with a line.
Use Precision Tools | 169

You can specify one or more running object snaps on the Object Snaps tab in
the Drafting Settings dialog box, which is accessible from the Tools menu. If
several running object snaps are on, more than one object snap may be eligible
at a given location. Press Tab to cycle through the possibilities before you
specify the point.
Click the object snap button on the status bar or press Fn-F3 to turn running
object snaps on and off.
NOTE If you want object snaps to ignore hatch objects, set the OSOPTIONS system
variable to 1.
Use Object Snaps in 3D
By default, the Z-value of an object snap location is determined by the object's
location in space. However, if you work with object snaps on the plan view
of a building or the top view of a part, a constant Z-value is more useful.
If you turn on the OSNAPZ system variable, all object snaps are projected
onto the XY plane of the current UCS or, if ELEV is set to a non-zero value,
onto a plane parallel to XY plane at the specified elevation.
NOTE When you draw or modify objects, make sure that you know whether
OSNAPZ is on or off. There is no visual reminder, and you can get unexpected
results.
The Object Snap Menu
Specify an object snap quickly and conveniently from a shortcut menu.
The object snap menu is displayed at your cursor location when you hold
down Shift and click the right mouse button or the equivalent button on
another pointing device. You can also right-click while being prompted for a
point and click Snap Overrides.
See also:
Use Object Snaps (page 169)
170 | Chapter 6 Create and Modify Objects

Set Visual Aids for Object Snaps (AutoSnap)
Object snaps include a visual aid called AutoSnap
™
to help you see and use
object snaps more efficiently. AutoSnap displays a marker and a tooltip when
you move your cursor over an object snap location.
AutoSnap Tools
AutoSnap consists of the following snap tools:
■ Marker. Displays the object snap location when the cursor moves over
or near an object. Marker shape is dependent on the snap it is marking.
■ Tooltip. Describes which part of the object you are snapping to in a small
flag at the cursor location.
■ Aperture box. Surrounds the crosshairs and defines an area within which
object snaps are evaluated. You can choose to display or not display the
aperture box, and you can change the aperture box size.
The AutoSnap markers and tooltips are turned on by default. You can change
AutoSnap marker size on the Cursor & Selection tab in the Application
Preferences dialog box.
Use AutoSnap to Confirm or Change an Object Snap
If you have set more than one running object snap, you can press Tab to cycle
through all the object snap points available for a particular object.
Override Object Snap Settings
While you work, you can turn running object snaps on and off temporarily
by using an override key. Temporary override keys can also be used for other
drawing aids; for example, Ortho mode and Polar mode.
For example, if you have set running object snaps but you want to turn them
off for one point, you can hold down Fn-F3. When you release this override
key, running object snaps are restored.
There are also temporary override keys for individual object snaps. Override
keys are set up to be easy to find by touch without looking away from your
drawing.
Use Precision Tools | 171
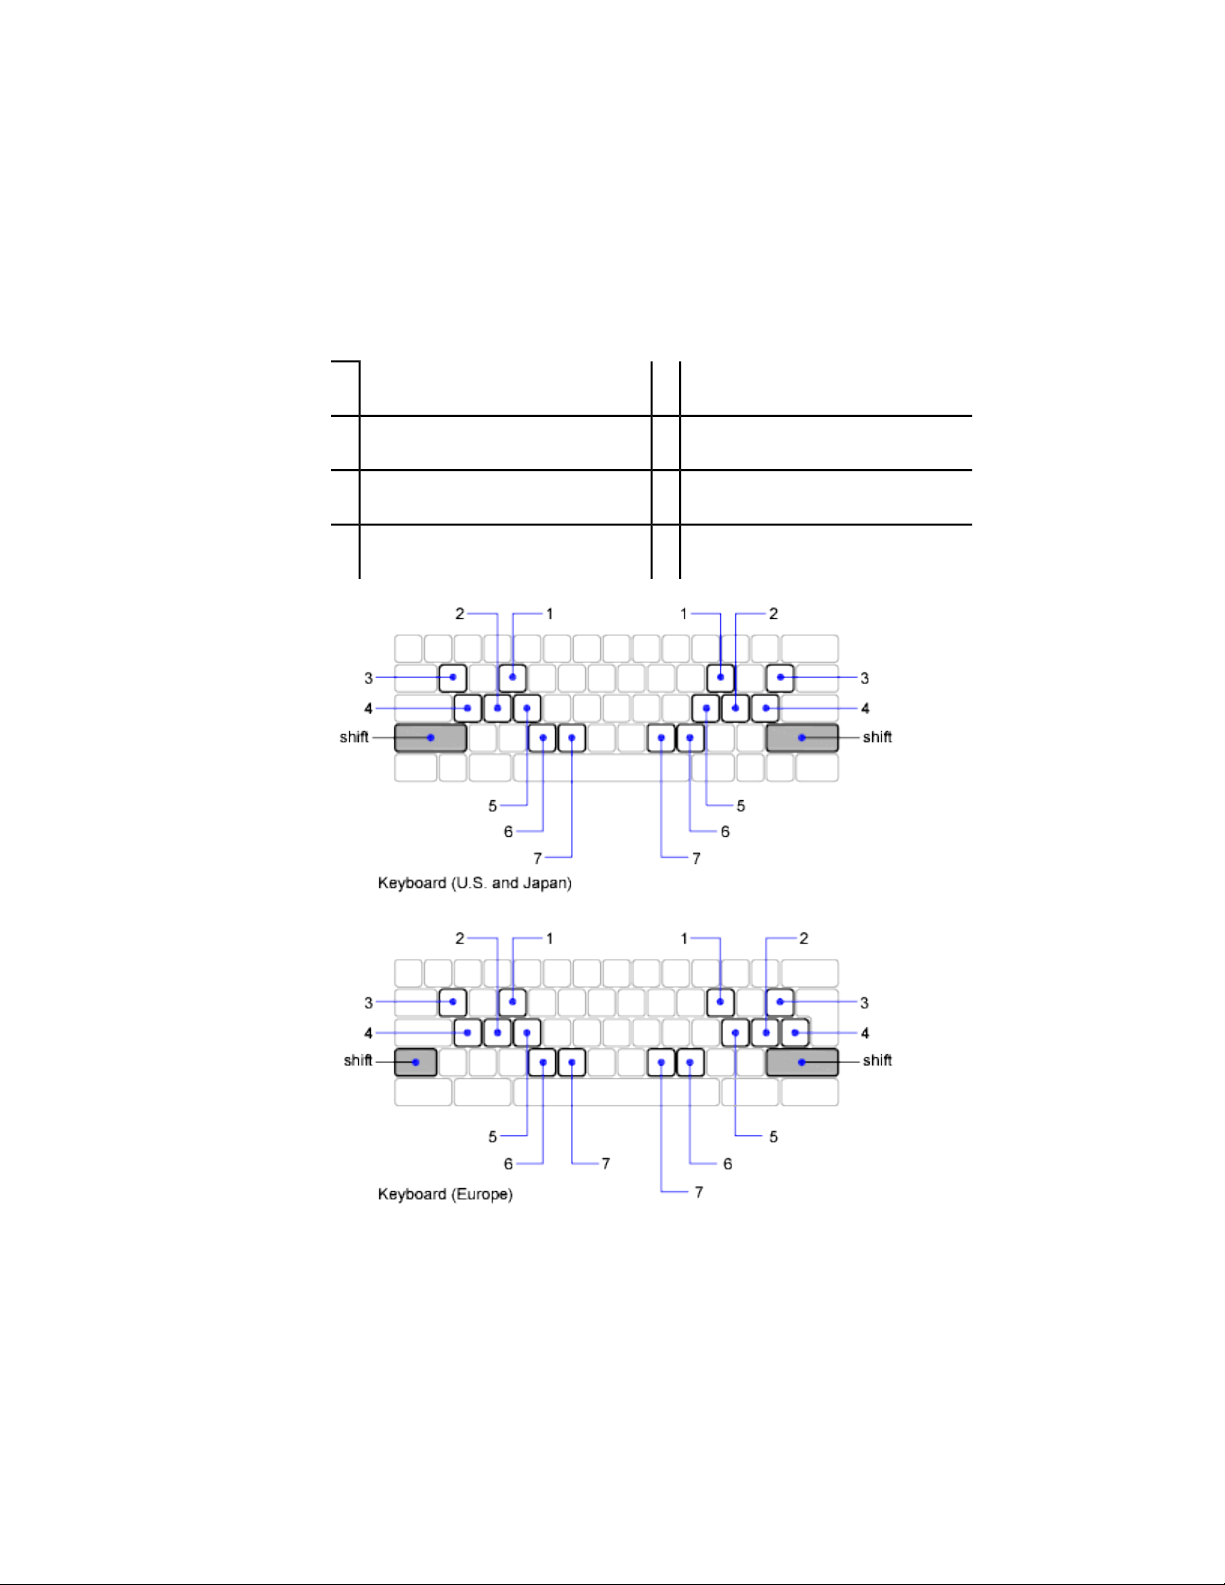
The keys in the following illustration are the default keys, but you can change
key assignments and add your own as needed.
Hold down Shift and one of the temporary override keys in the illustration:
Turns off all snapping and tracking5Object snap override: Endpoint
1
Object snap override: Center6Enforces object snap selection2
Object snap override: Midpoint7Toggles object snap tracking3
Toggles object snap mode (OSNAP)4
172 | Chapter 6 Create and Modify Objects

Temporary override keys are also available for the other drawing aids that you
set in the Drafting Settings dialog box.
See also:
Adjust Grid and Grid Snap (page 173)
Use Orthogonal Locking (Ortho Mode) (page 176)
Use Polar Tracking and PolarSnap (page 177)
Use Dynamic Input (page 166)
Restrict Cursor Movement
Several tools are available that you can use to restrict or lock the movement
of your cursor.
Adjust Grid and Grid Snap
To enhance drawing speed and efficiency, you can display and snap to a
rectangular grid. You can also control its spacing, angle, and alignment.
The grid is a rectangular pattern of lines or dots that covers the entire XY plane
of the user coordinate system (UCS). Using the grid is similar to placing a
sheet of grid paper under a drawing. The grid helps you align objects and
visualize the distances between them. The grid is not plotted.
Grid Snap restricts the movement of the crosshairs to intervals that you define.
When Snap is turned on, the cursor seems to adhere, or "snap," to an invisible
rectangular grid when you create or modify objects. Snap is useful for specifying
precise points with the arrow keys or the pointing device.
Grid mode and Snap mode are independent but are often used in combination
with each other.
Control the Display Style and Area of the Grid
You can display the grid either as a rectangular pattern of dots or as rectangular
pattern of lines. The grid displays lines for all visual styles. The grid displays
dots only when the current visual style is set to 2D Wireframe. By default, a
lined grid is displayed while working in both 2D and 3D. There are several
methods to change the current visual style, including the VSCURRENT
command.
Use Precision Tools | 173
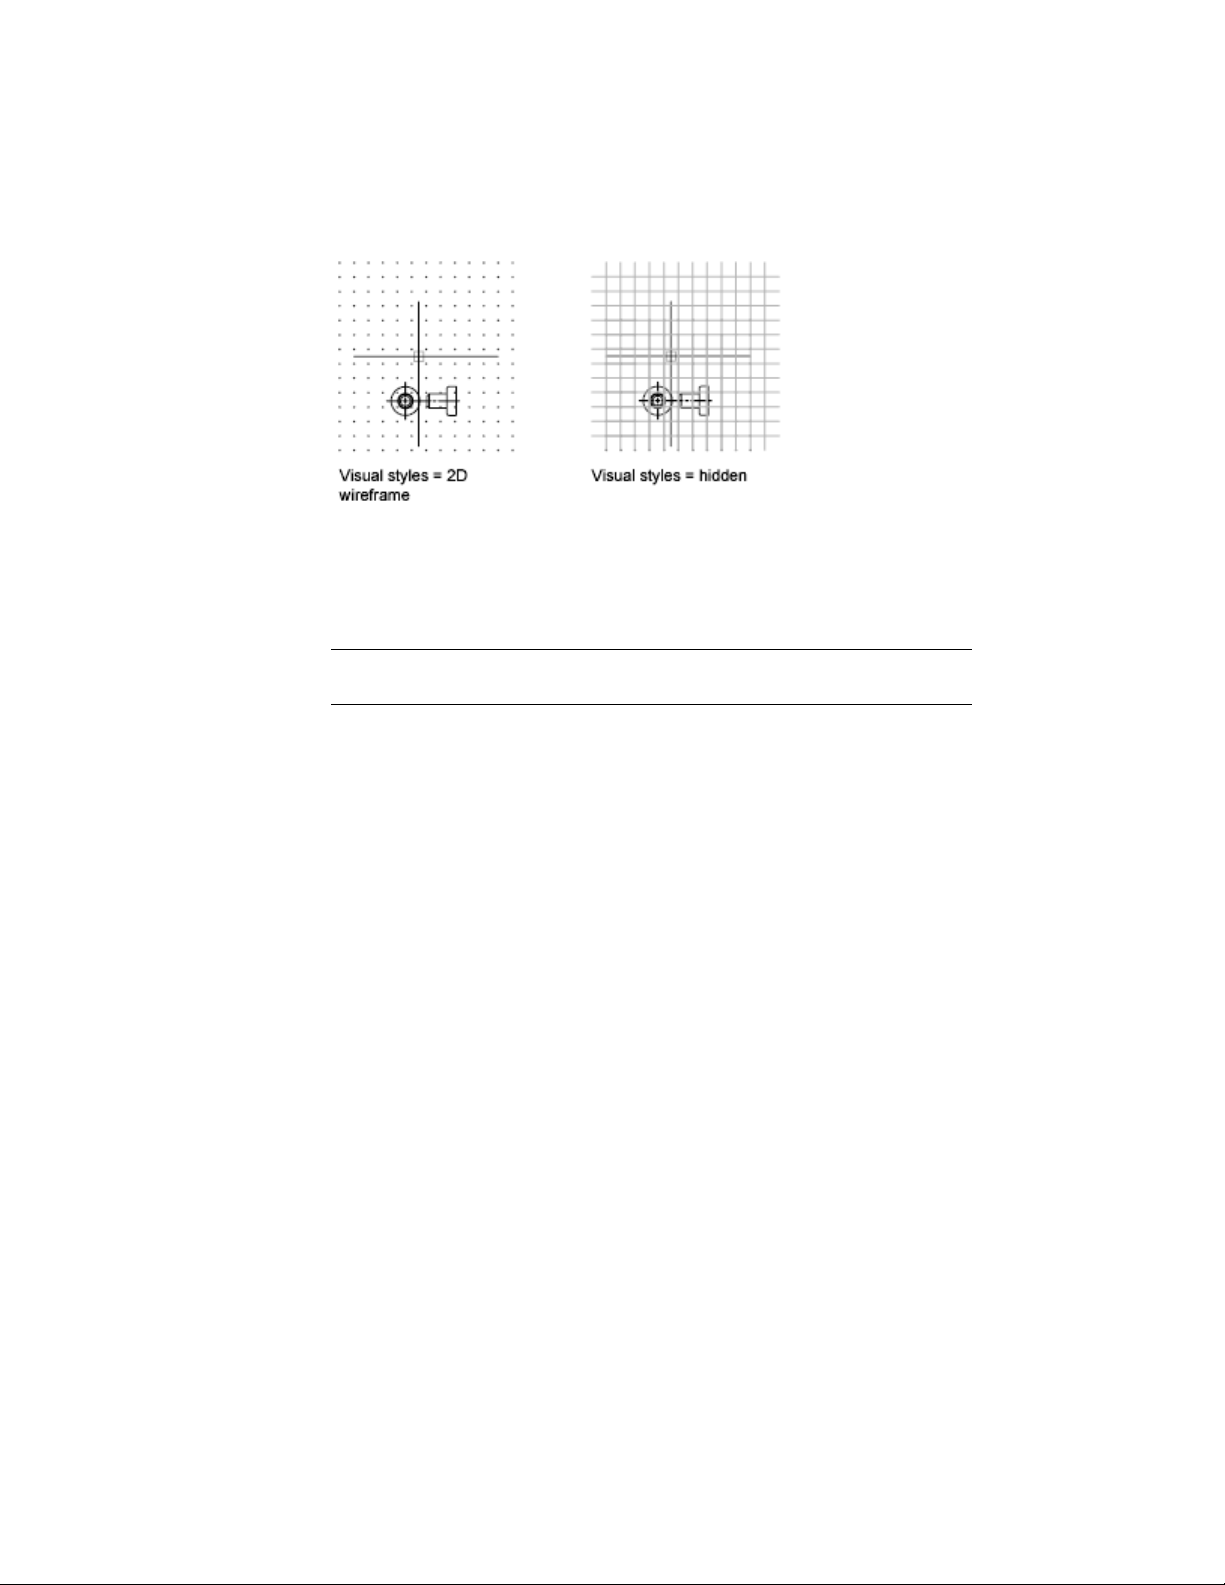
The LIMITS command controls the drawing area covered by the grid. As an
option, you can override the limits to make the grid cover the entire XY plane
of the user coordinate system (UCS). You can access this option in the Drafting
Settings dialog box or use the GRIDDISPLAY system variable.
NOTE When you use dynamic UCS, the grid limits are set automatically relative
to the size of the selected face of the solid and the drawing area available.
Control the Frequency of Major Grid Lines
If the grid is displayed as lines rather than dots, darker lines called major grid
lines display at intervals. When working in decimal units or with feet and
inches, major grid lines are especially useful for measuring distances quickly.
You can control the frequency of major grid lines in the Drafting Settings
dialog box.
174 | Chapter 6 Create and Modify Objects
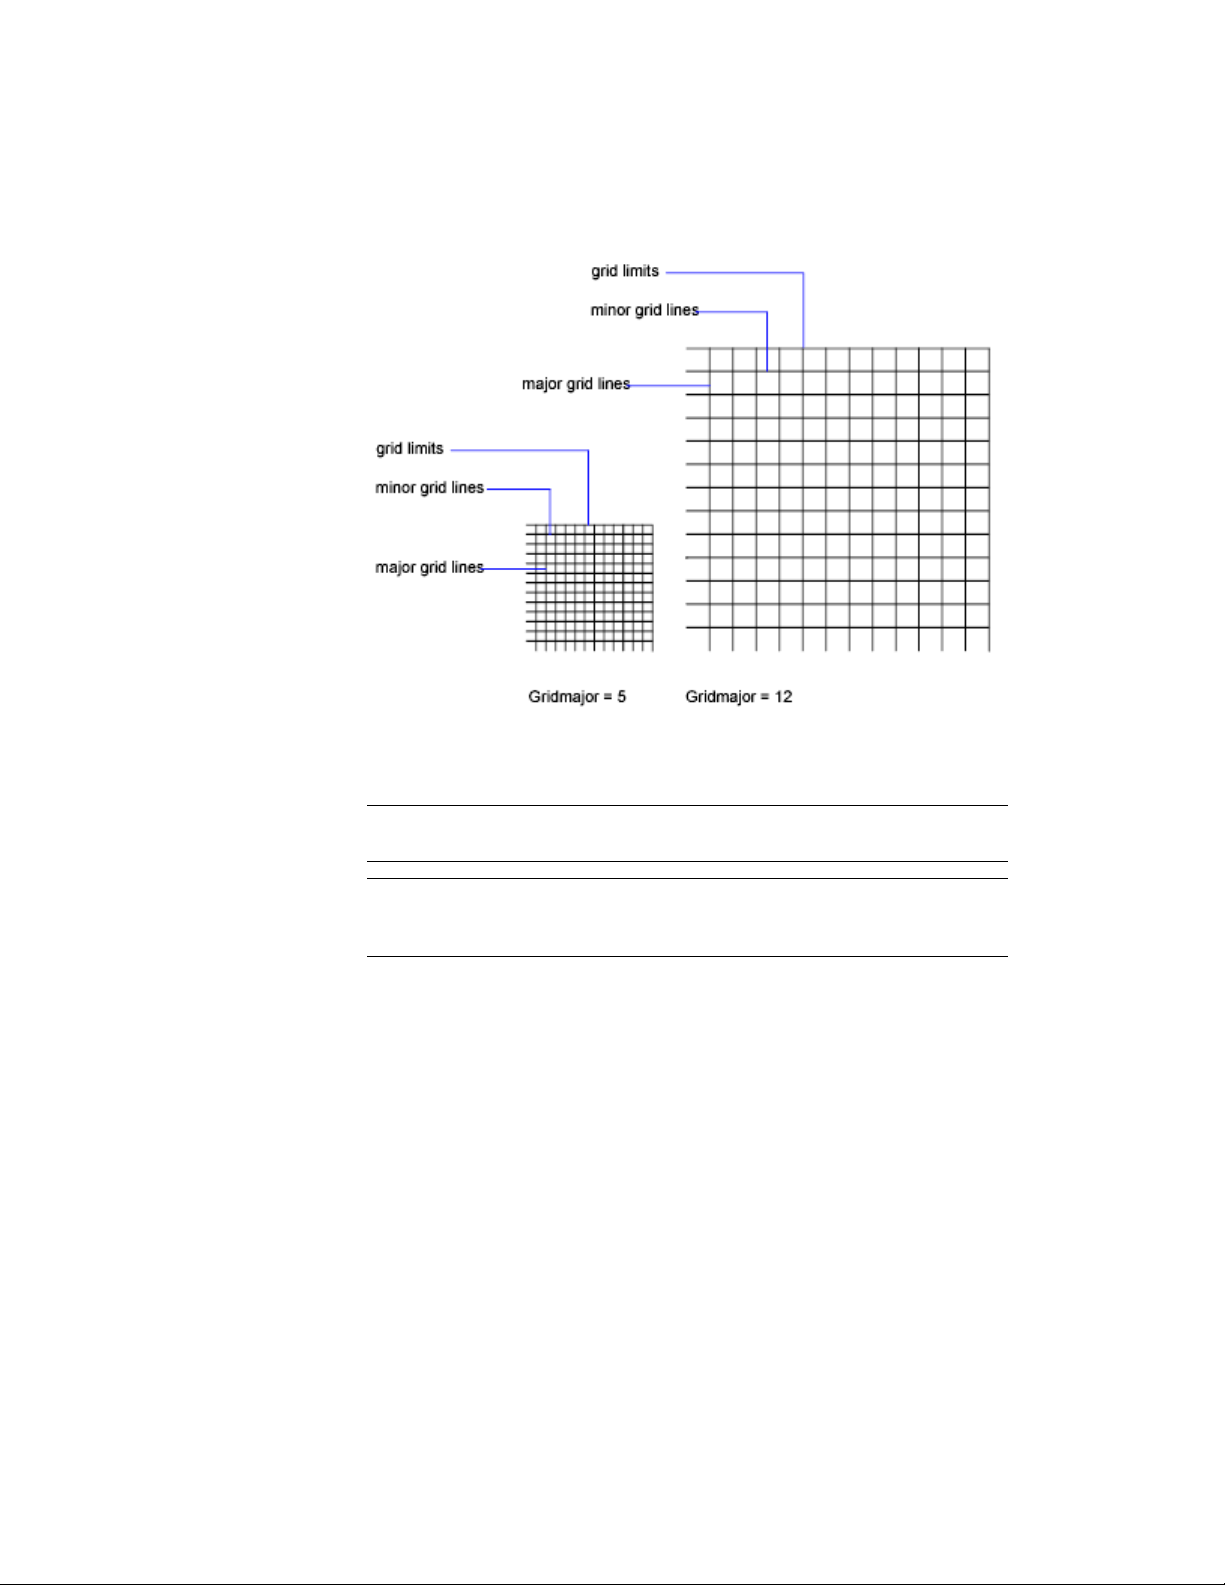
To turn off the display of major grid lines, set the frequency of major grid
lines to 1.
NOTE If the grid is displayed as lines, the grid limits are displayed also as darker
lines. Do not confuse these boundaries with major grid lines.
NOTE When the grid is displayed as lines and SNAPANG is set to a value other
than 0, the grid will not display. SNAPANG does not affect the display of the dotted
grid.
Change the Grid Dynamically During Zooming
If you zoom in or out of your drawing, the grid spacing is adjusted
automatically to be more appropriate for the new magnification. This is called
adaptive grid display.
For example, if you zoom way out, the density of displayed grid lines reduces
automatically. Conversely, if you zoom way in, additional grid lines display
in the same proportion as the major grid lines.
Use Precision Tools | 175
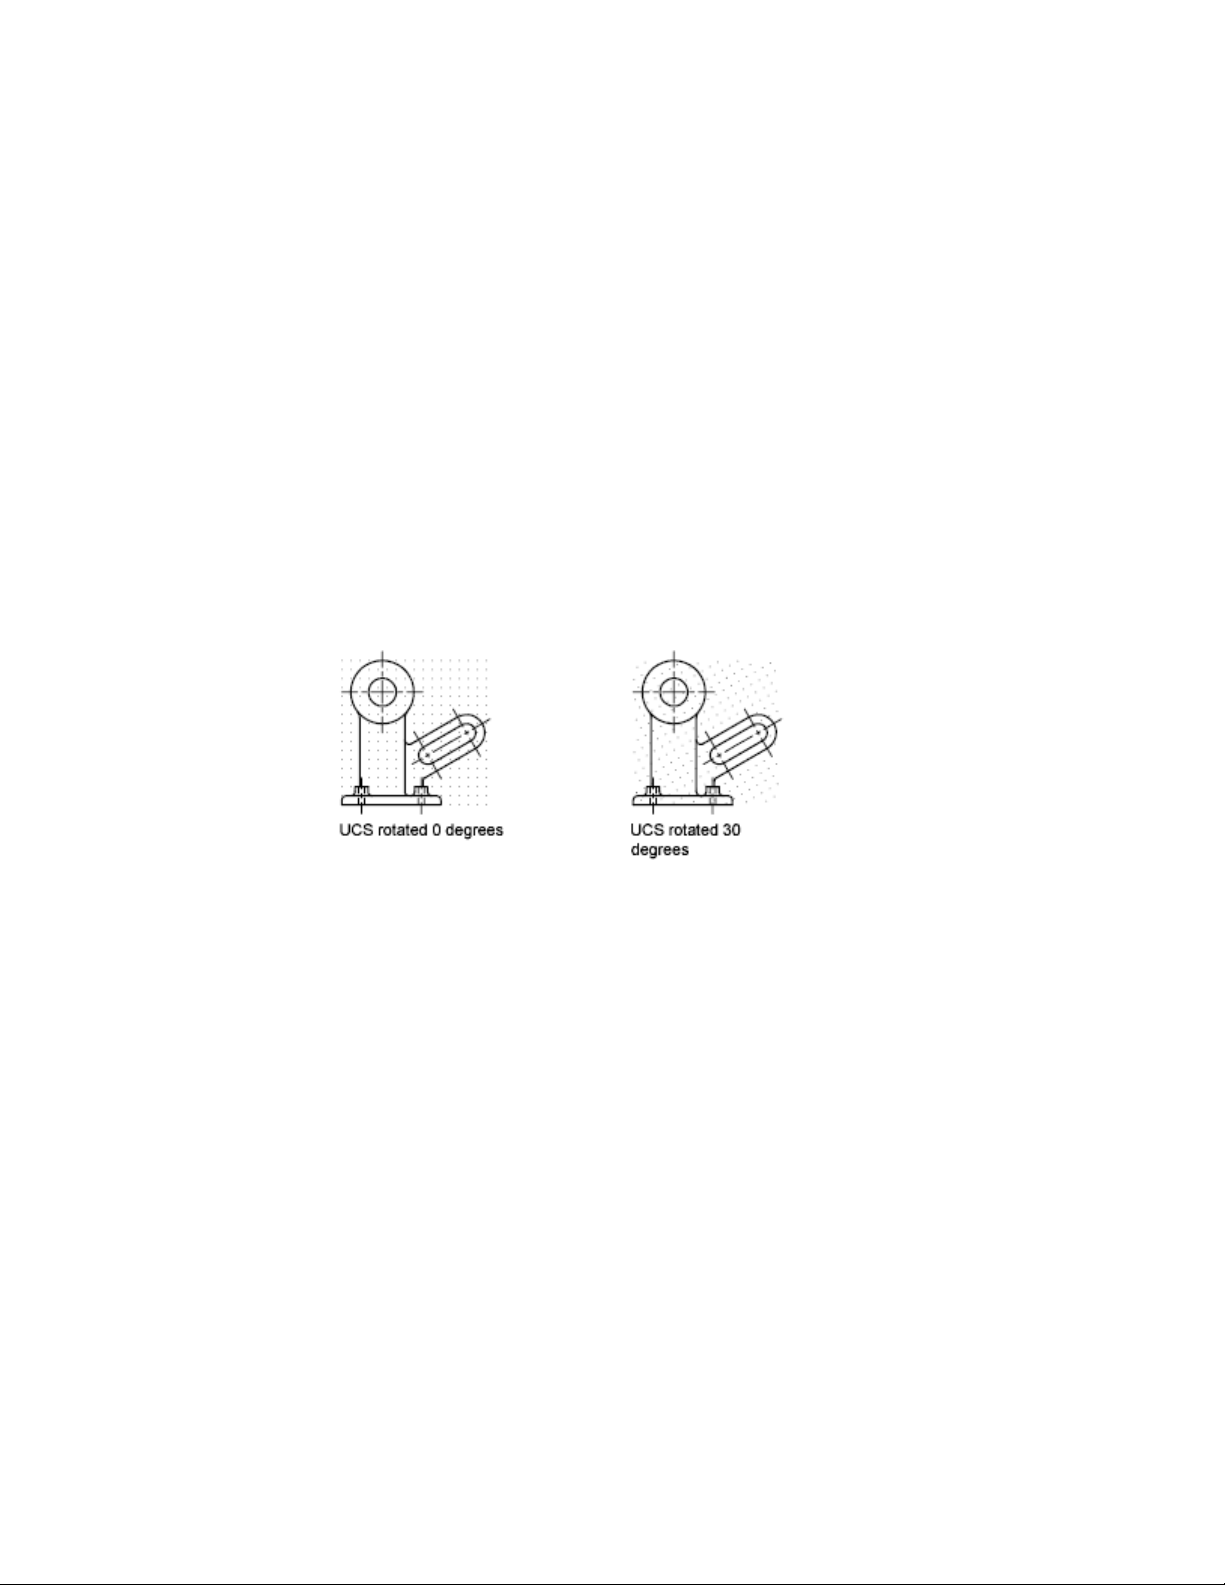
Change Grid and Snap Spacing
As you work, you can turn Grid and Snap mode on and off, and you can
change the grid and snap spacing. You can turn Snap mode on and off
temporarily by using an override key.
Snap spacing does not have to match grid spacing. For example, you might
set a wide grid spacing to be used as a reference but maintain a closer snap
spacing for accuracy in specifying points.
Change the Grid and Snap Angle and Base
If you need to draw along a specific alignment or angle, you can change the
grid and snap angle by rotating the user coordinate system (UCS). This rotation
realigns the crosshairs on the screen to match the new angle. In the following
example, the UCS is rotated 30 degrees to match the angle of the anchor
bracket.
The grid and snap points are always aligned with the UCS origin. If you need
to shift the grid and grid snap origin, move the UCS.
See also:
Set Isometric Grid and Snap (page 711)
Override Object Snap Settings (page 171)
Use a Visual Style to Display Your Model (page 63)
Use Orthogonal Locking (Ortho Mode)
You can restrict cursor movement to horizontal and vertical for convenience
and precision when creating and modifying objects.
176 | Chapter 6 Create and Modify Objects

As you create or move objects, you can use Ortho mode to restrict the cursor
to the horizontal or vertical axis. As you move the cursor, the rubber-band
line follows the horizontal or vertical axis, whichever is nearest the cursor.
The orientation of the current user coordinate system (UCS) determines the
horizontal and vertical directions. In 3D views, Ortho mode additionally
restricts the cursor to the up and down directions. In that case, the tooltip
displays a +Z or -Z for the angle.
TIP
Use direct distance entry with Ortho mode turned on to create orthogonal
lines of specified lengths or to move objects specified distances.
You can turn Ortho on and off at any time during drawing and editing. Ortho
is ignored when you enter coordinates or specify an object snap. To turn Ortho
on or off temporarily, hold down the temporary override key, Shift. While
you use the temporary override key, the direct distance entry method is not
available.
For drawing or editing objects at angles that are not parallel to the horizontal
or vertical axis, see Use Polar Tracking and PolarSnap (page 177).
If turned on, the isometric snap setting takes priority over the UCS in
determining horizontal and vertical directions.
NOTE
Ortho mode and polar tracking cannot be on at the same time. Turning on
Ortho turns off polar tracking.
See also:
Override Object Snap Settings (page 171)
Use Polar Tracking and PolarSnap
Polar tracking restricts cursor movement to specified angles. PolarSnap restricts
cursor movement to specified increments along a polar angle.
When you are creating or modifying objects, you can use polar tracking to
display temporary alignment paths defined by the polar angles you specify.
In 3D views, polar tracking additionally provides an alignment path in the
up and down directions. In that case, the tooltip displays a +Z or -Z for the
angle.
Use Precision Tools | 177
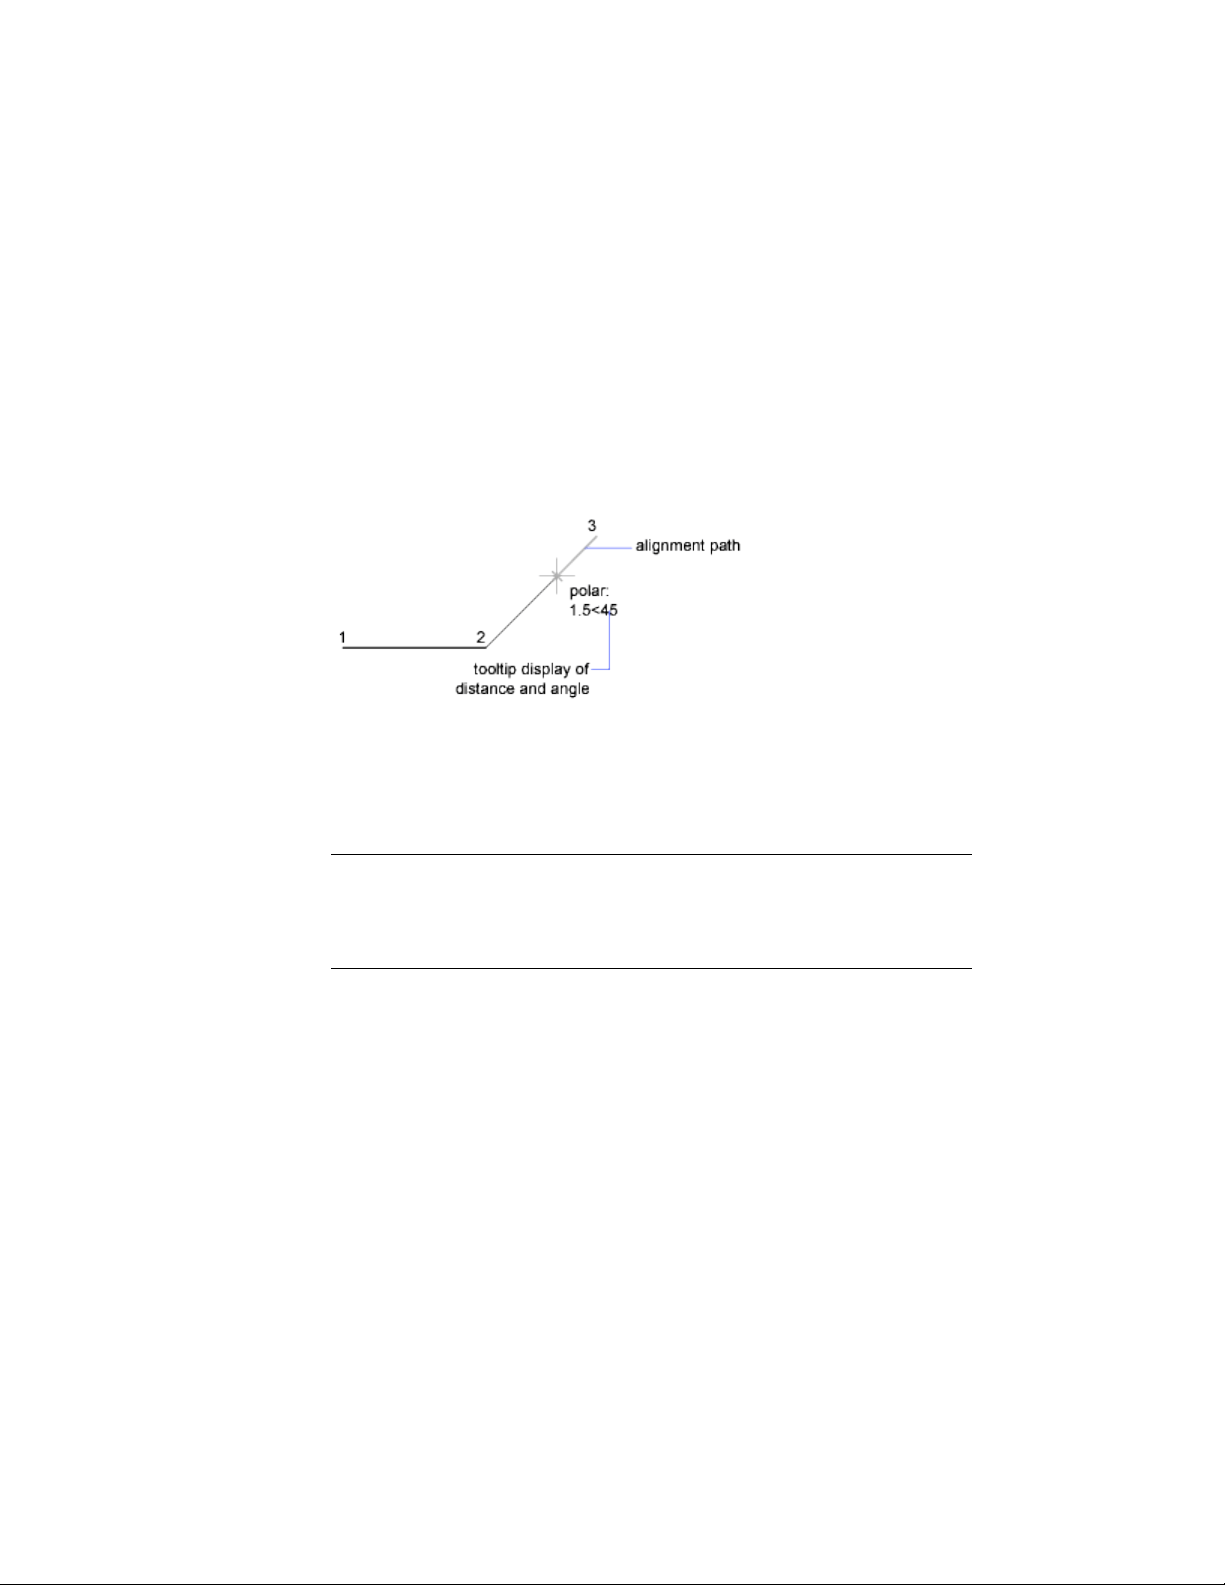
Polar angles are relative to the orientation of the current user coordinate
system (UCS) and the setting for the base angle convention in a drawing. The
angle base direction is set in the Drawing Units dialog box (UNITS).
Use PolarSnap
™
to snap to specified distances along the alignment path. For
example, in the following illustration you draw a two-unit line from point 1
to point 2, and then draw a two-unit line to point 3 at a 45-degree angle to
the line. If you turn on the 45-degree polar angle increment, an alignment
path and tooltip are displayed when your cursor crosses the 0 or 45-degree
angle. The alignment path and tooltip disappear when you move the cursor
away from the angle.
As you move your cursor, alignment paths and tooltips are displayed when
you move the cursor near polar angles. The default angle measurement is 90
degrees. Use the alignment path and tooltip to draw your object. You can use
polar tracking with Intersection and Apparent Intersection object snaps to
find where a polar alignment path intersects another object.
NOTE
Ortho mode and polar tracking cannot be on at the same time. Turning on
polar tracking turns off Ortho mode. Similarly, PolarSnap and grid snap cannot
be on at the same time. Turning on PolarSnap turns off grid snap.
Specify Polar Angles (Polar Tracking)
You can use polar tracking to track along polar angle increments of 90, 60,
45, 30, 22.5, 18, 15, 10, and 5 degrees, or you can specify other angles. The
following illustration shows the alignment paths displayed as you move your
cursor 90 degrees with the polar angle increment set to 30 degrees.
178 | Chapter 6 Create and Modify Objects
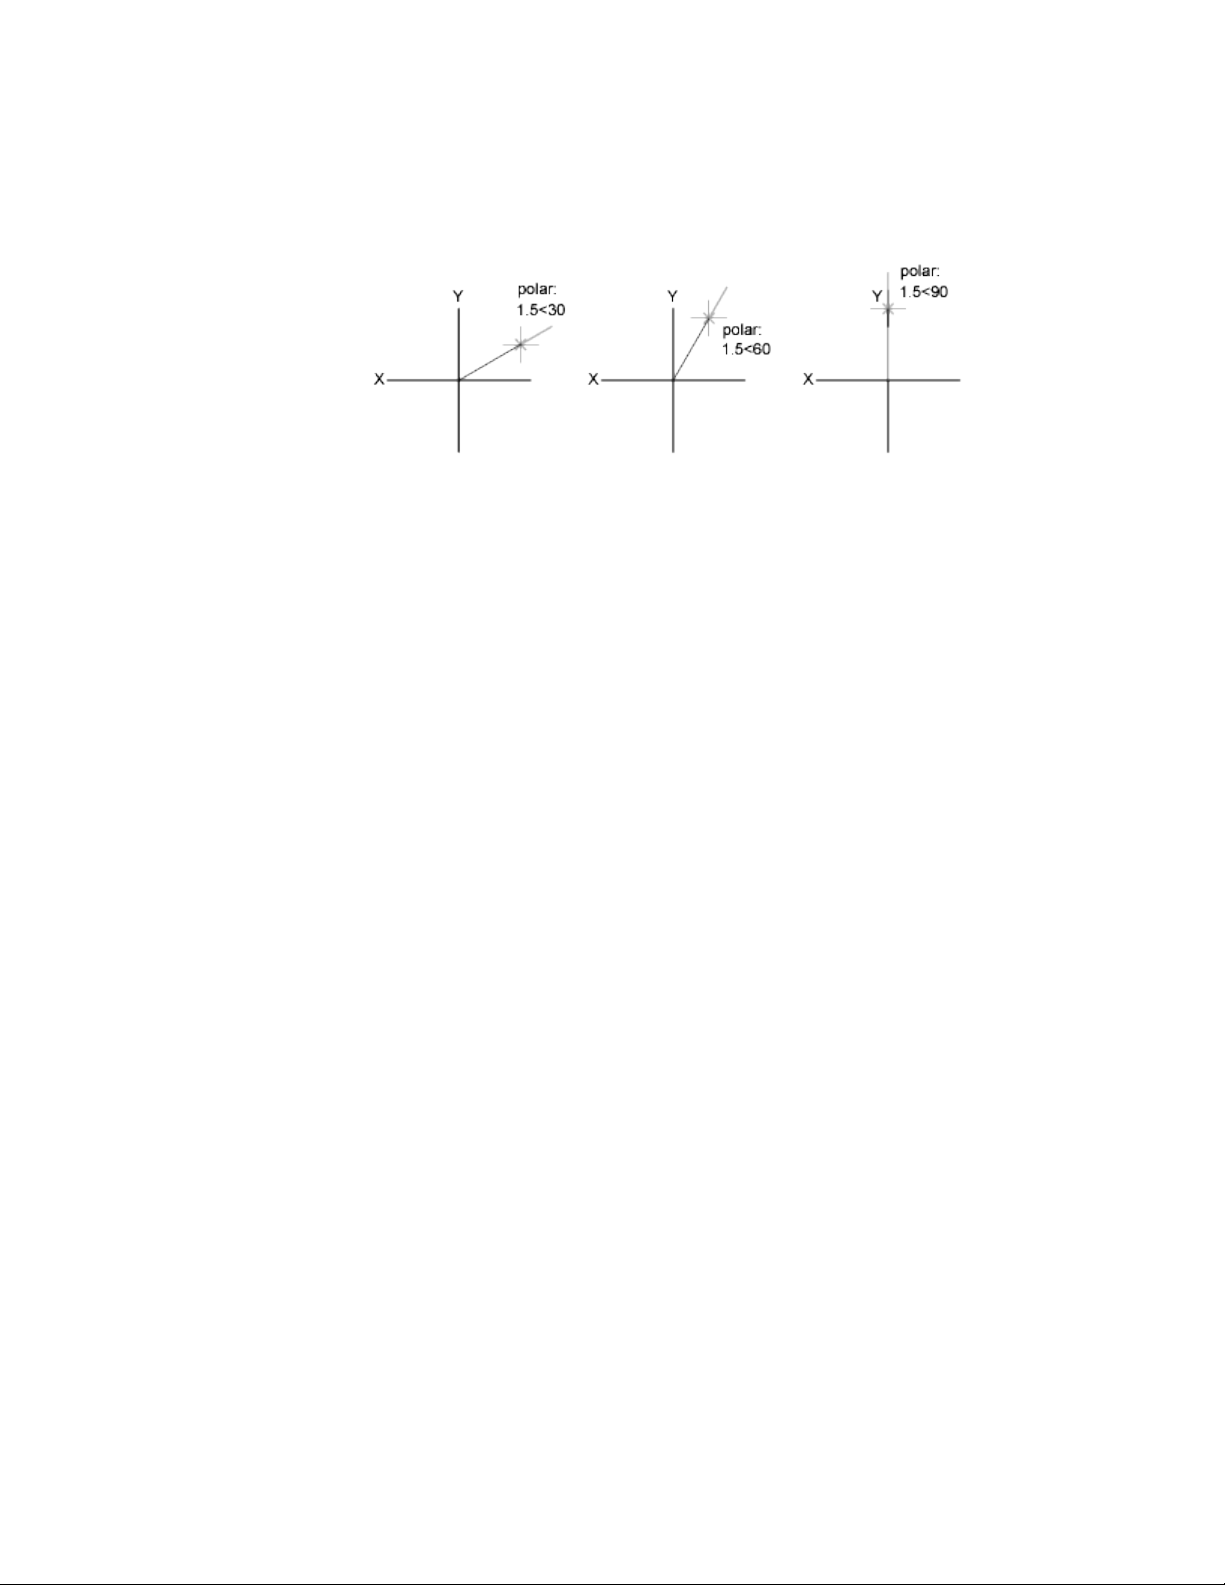
The orientation of 0 depends on the angle you set in the Drawing Units dialog
box. The direction of snap (clockwise or counterclockwise) depends on the
units direction you specify when setting units of measurement.
You can turn polar tracking on and off temporarily by using an override key.
The direct distance entry method is not available while you are using the
temporary override key for polar tracking.
Specify Polar Distances (PolarSnap)
PolarSnap restricts cursor movement to increments of a polar distance you
specify. For example, if you specify a length of 4 units, the cursor snaps from
the first point specified to lengths of 0, 4, 8, 12, 16, and so on. As you move
your cursor, a tooltip indicates the nearest PolarSnap increment. To restrict
point entry to polar distances, both polar tracking and Snap mode (set to
PolarSnap) must be on. You can turn off all snapping and tracking temporarily
by using an override key.
See also:
Override Object Snap Settings (page 171)
Lock an Angle for One Point (Angle)
You can specify an angle override that locks the cursor for the next point
entered.
To specify an angle override, enter a left angle bracket (<) followed by an angle
whenever a command asks you to specify a point. The Command prompt
sequence below shows a 30-degree override entered during a LINE command.
Command: line
Specify first point: Specify a start point for the line
Specify next point or [Undo]: <30
Use Precision Tools | 179
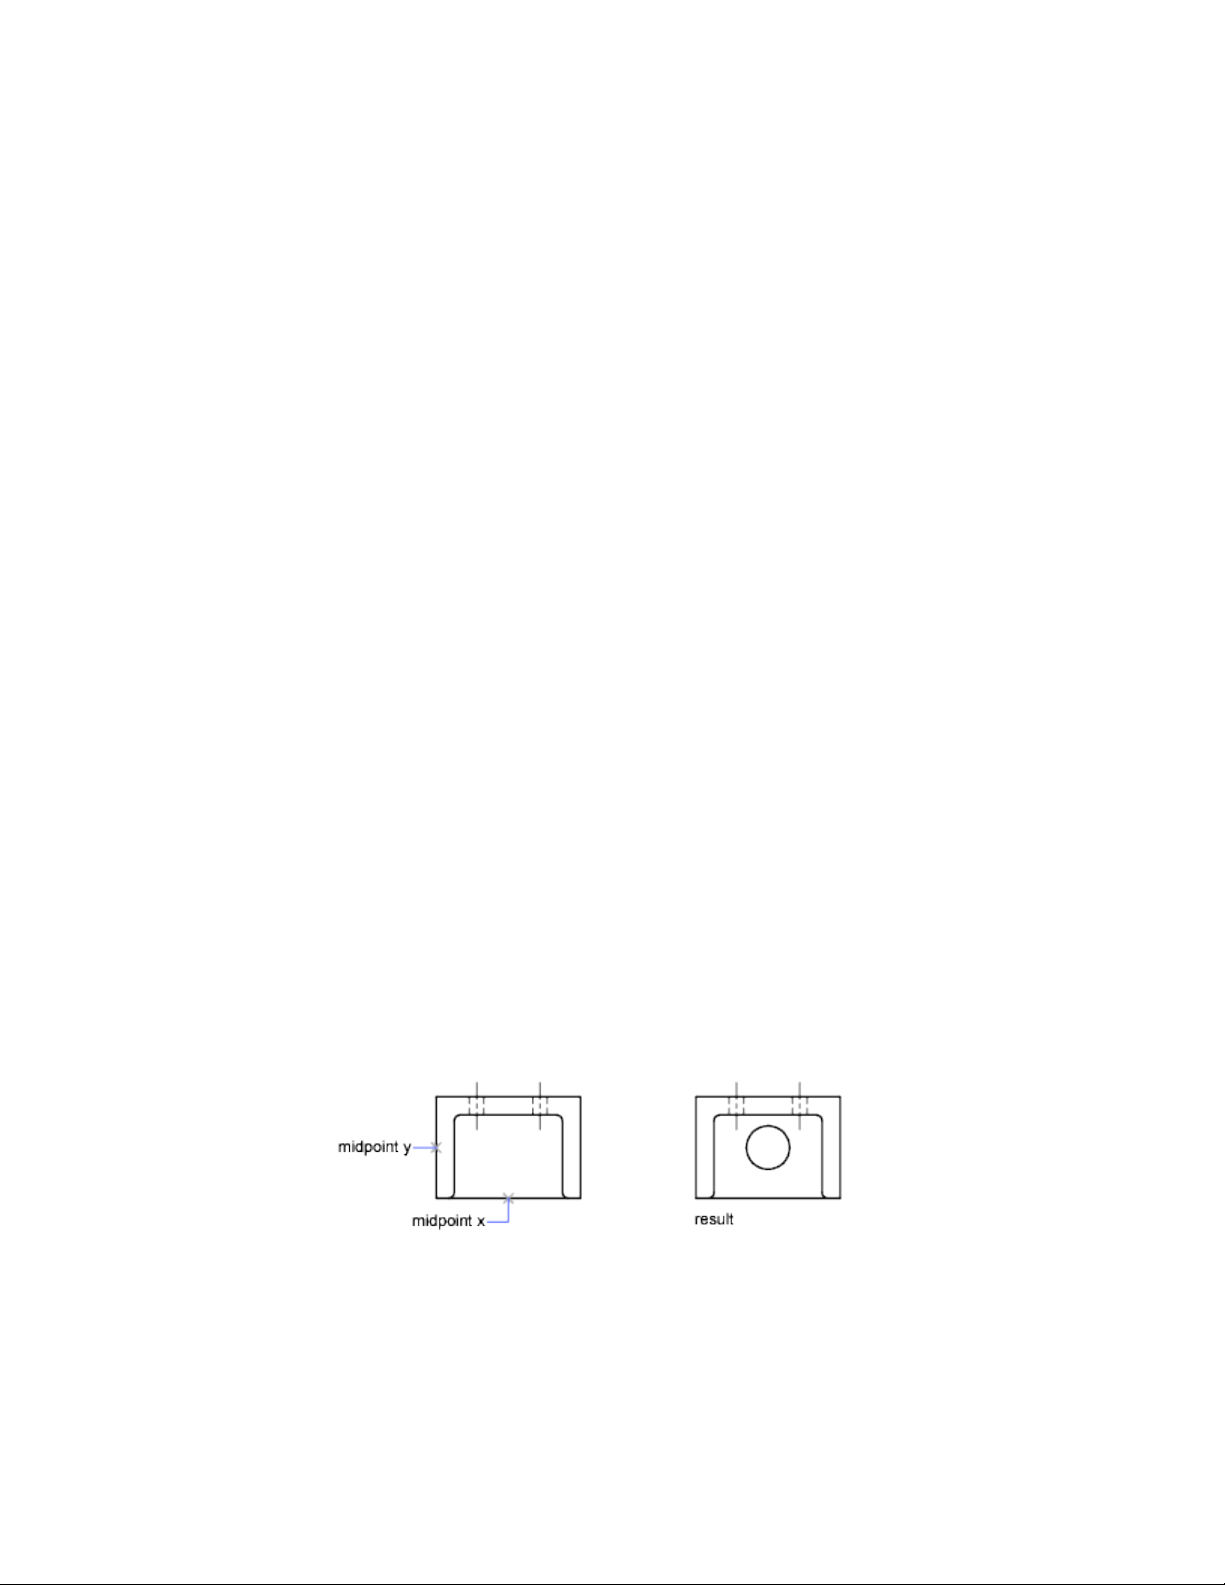
Angle Override: 30
Specify next point or [Undo]: Specify a point
The angle you specify will lock the cursor, overriding Grid Snap, Ortho mode,
and PolarSnap. Coordinate entry and object snaps have precedence over an
angle override.
Combine or Offset Points and Coordinates
To specify a new point location, you can combine coordinate values from
several points or you can specify offsets from existing objects.
Combine Coordinate Values (Coordinate Filters)
You can use coordinate filters to extract one coordinate value at a time from
locations on existing objects.
Coordinate filters specify a new coordinate location by using the X value from
one location, the Y value of a second location, and, for 3D coordinates, the
Z value of a third location. When used with object snaps, coordinate filters
extract coordinate values from an existing object.
Coordinate filters are commonly used to locate the center of a rectangle and
to locate the projection of a 3D point on the XY plane of the UCS.
To specify a filter at the Command prompt, enter a period and one or more
of the letters X, Y, and Z. The next entry is limited to a specific coordinate
value.
Example: Use of Coordinate Filters in 2D
In the following illustration, the hole in the holding plate was centered in the
rectangle by extracting the X,Y coordinates from the midpoints of the plate's
horizontal and vertical line segments.
180 | Chapter 6 Create and Modify Objects
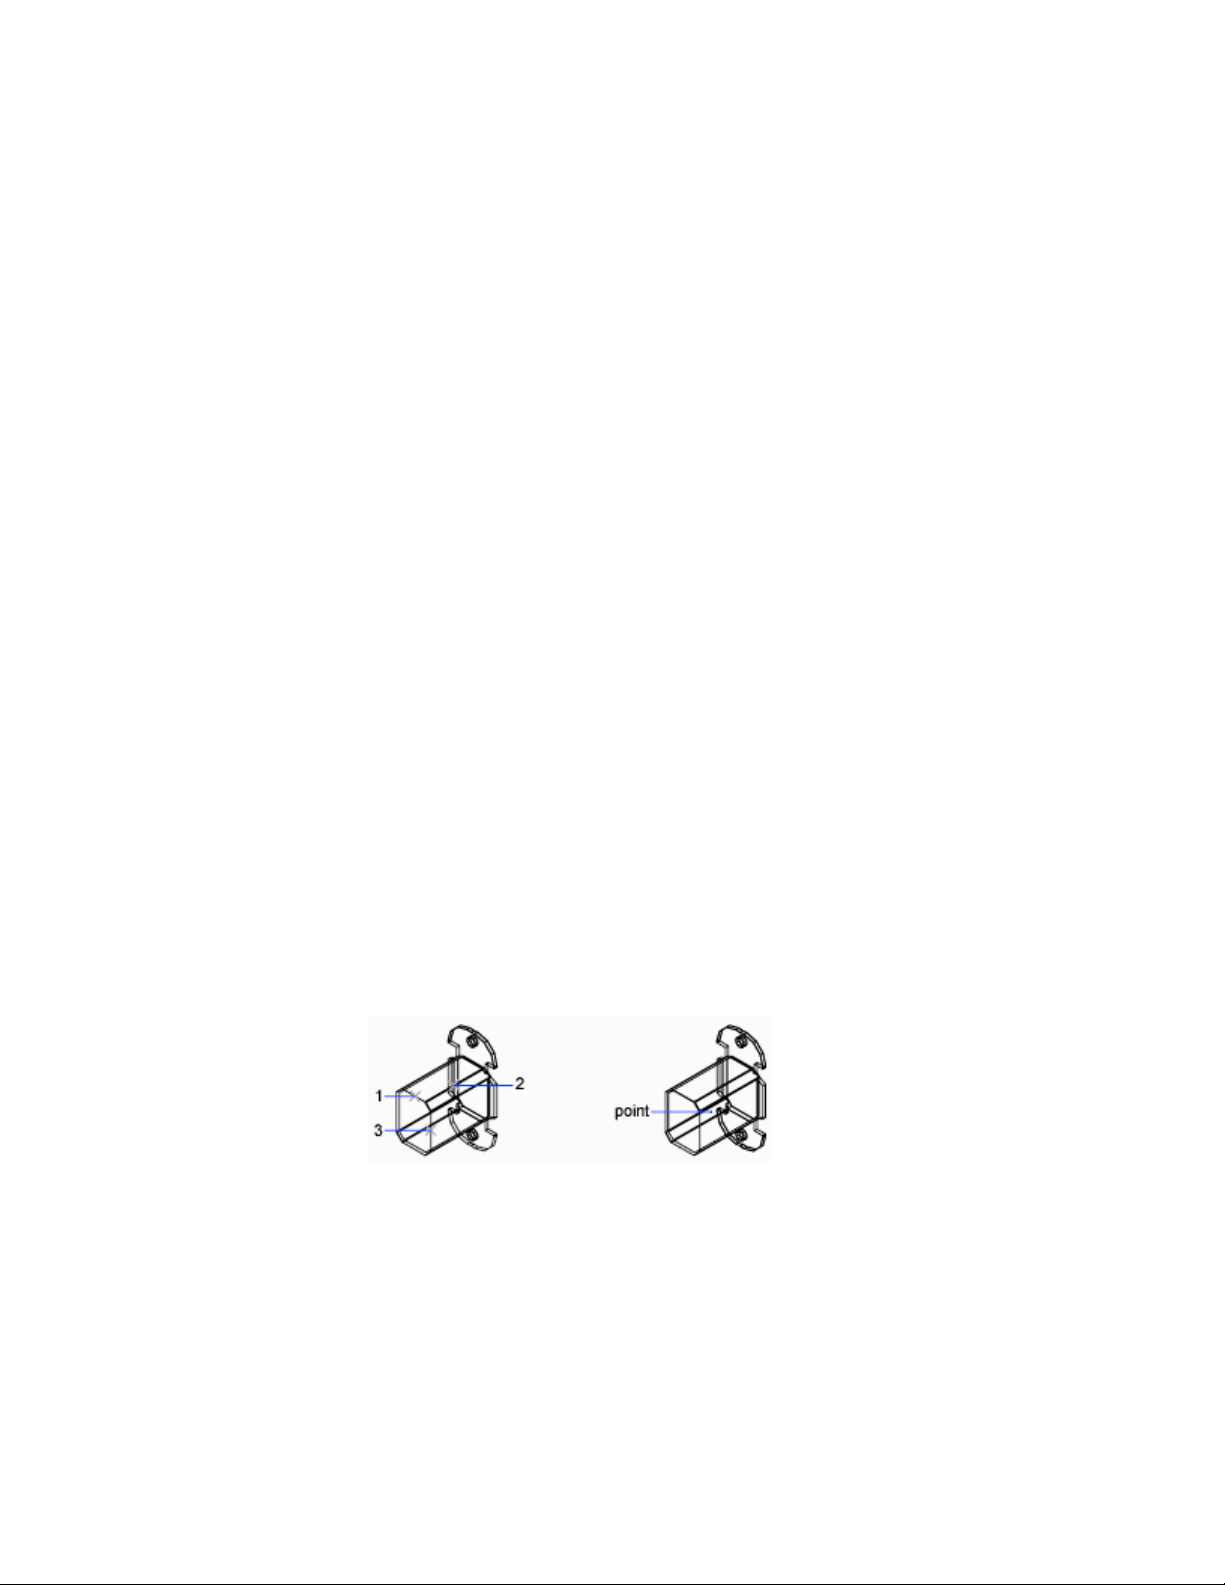
Here is the Command prompt sequence:
Command: circle
Specify center point for circle or [3P/2P/Ttr (tangent tangent
radius)]: .x
of: mid
of: Select the horizontal line on the lower edge of the holding plate
of: (need YZ): mid
of: Select the vertical line on the left side of the holding plate
of: Diameter/<Radius> Specify the radius of the hole
Coordinate filters work only when the program prompts you for a point. If
you try to use a coordinate filter at the Command prompt, you see an error
message.
Example: Use of Coordinate Filters in 3D
This example shows how to use coordinate filters to create a point object at
the center (centroid) of a 3D object. Hidden lines have been removed for
clarity. The X value of the new point is extracted from the first location
specified, the Y value from the second location, and the Z value from the
third. The three values are combined to form the coordinate values of the new
point.
Command: point
Point: .x
of mid
of select object (1)
(need YZ): .y
of mid
of select object (2)
(need Z): mid
of select object (3)
Use Precision Tools | 181

Combine Coordinate Values (Coordinate Filters)
To use coordinate filters to specify a point in 2D
1 At the prompt for a point, enter a coordinate filter (.x or .y).
For example, enter .x to specify the X value first.
2 To extract the first coordinate value, specify a point.
For example, if you entered .x in step 1, the X value is extracted from
this point.
3 To extract the next coordinate value, specify a different point.
The new point location combines the coordinate values extracted from
the points you specified in steps 2 and 3.
NOTE
Instead of specifying a point in steps 2 or 3, you can enter a numeric value.
To use coordinate filters to specify a point in 3D
1 At the prompt for a point, enter a coordinate filter (.x, .y, .z, .xy, .xz,
or .yz).
For example, enter .x to specify the X value first.
2 To extract the specified coordinate value(s), specify a point.
For example, if you entered .x in step 1, the X value is extracted from
this point.
3 At the prompt for the remaining coordinates, do one of the following:
■ Extract the remaining coordinate values by specifying a point.
■ Enter another coordinate filter and return to step 2.
For example, if you entered .x in step 1, specify a second point to extract
the Y and Z coordinates simultaneously, or enter .y or .z to specify Y
and Z values separately.
The new point location combines the coordinate values extracted from
the points specified in steps 2 and 3.
NOTE
Instead of specifying a point in steps 2 or 3, you can enter a numeric value.
182 | Chapter 6 Create and Modify Objects
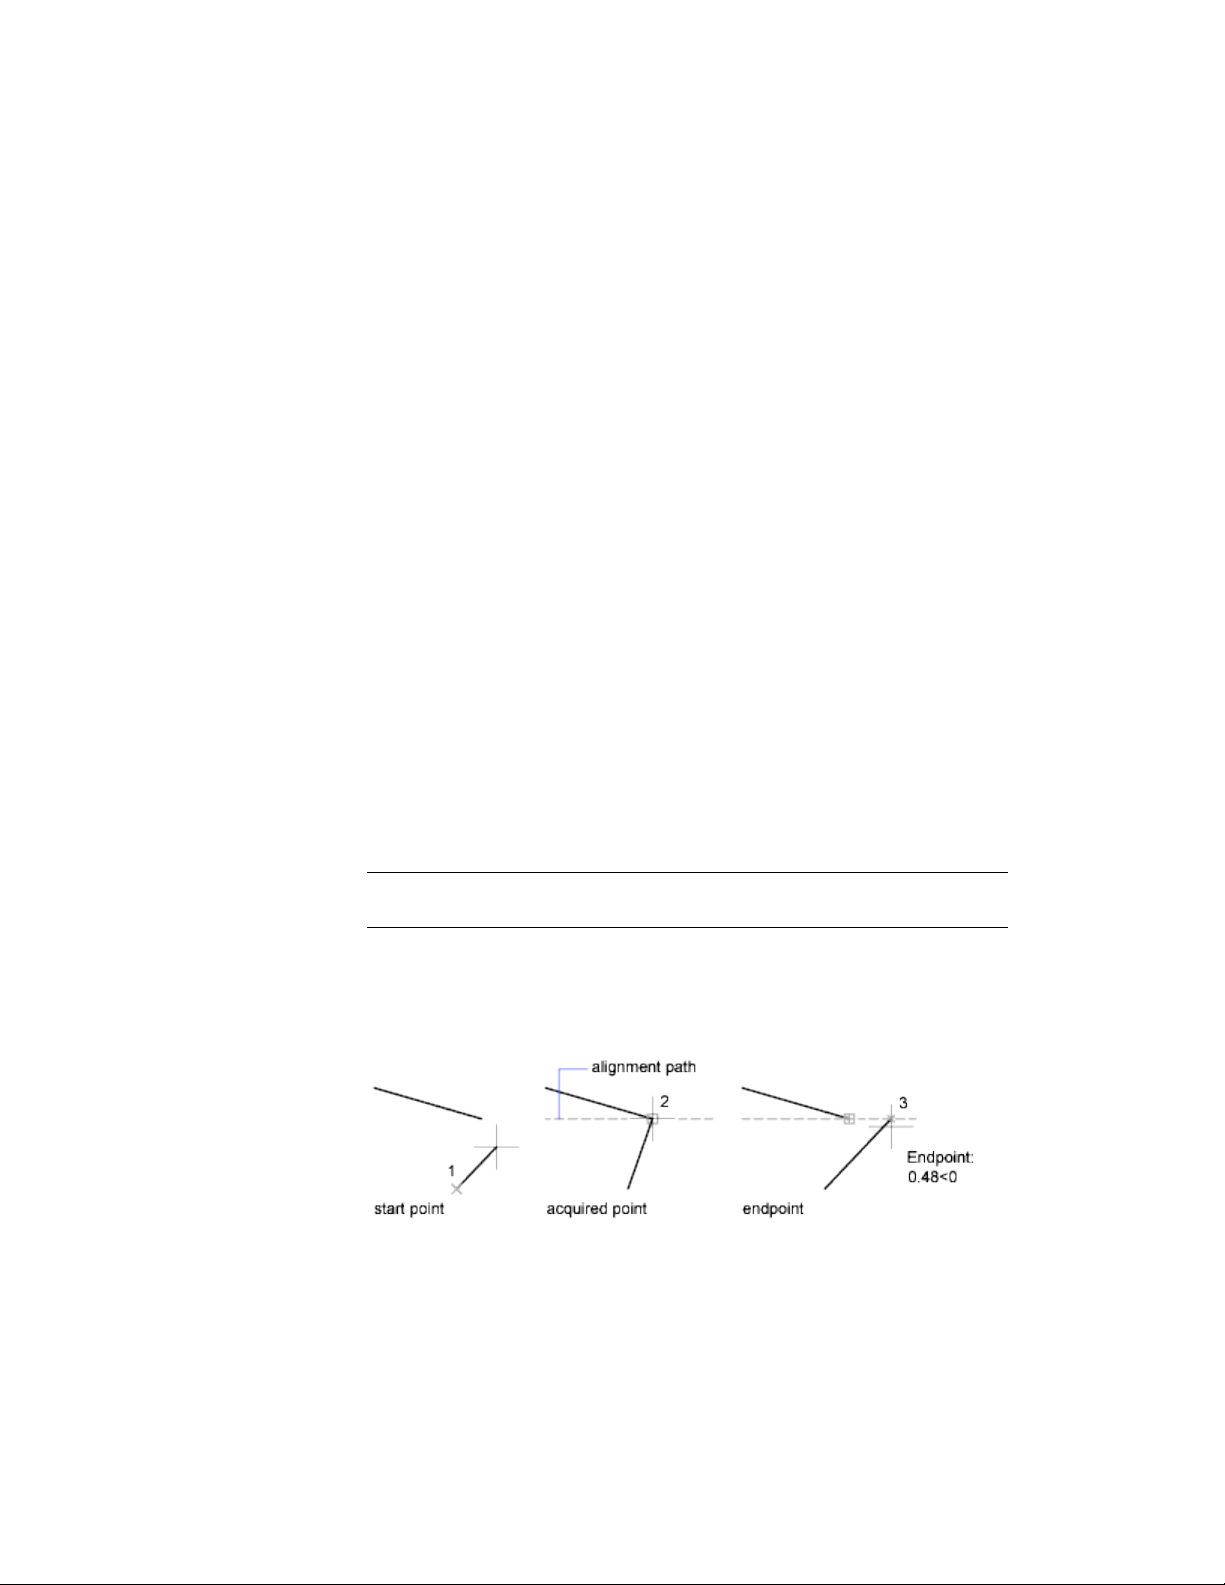
Track to Points on Objects (Object Snap Tracking)
You can draw objects at specific angles or in specific relationship to other
objects along specified directions called alignment paths.
AutoTrack
™
helps you draw objects at specific angles or in specific relationships
to other objects. When you turn on AutoTrack, temporary alignment paths
help you create objects at precise positions and angles. AutoTrack includes
two tracking options: polar tracking and object snap tracking.
You can toggle AutoTrack on and off with the Polar and Otrack buttons on
the status bar. Use temporary override keys to turn object snap tracking on
and off or to turn off all snapping and tracking. See the keyboard illustration
in Override Object Snap Settings (page 171).
Object snap tracking works in conjunction with object snaps. You must set
an object snap before you can track from an object's snap point.
Object Snap Tracking
Use object snap tracking to track along alignment paths that are based on
object snap points. Acquired points display a small plus sign (+), and you can
acquire up to seven tracking points at a time. After you acquire a point,
horizontal, vertical, or polar alignment paths relative to the point are displayed
as you move the cursor over their drawing paths. For example, you can select
a point along a path based on an object endpoint or midpoint or an
intersection between objects.
NOTE You can track Perpendicular or Tangent object snap from the last picked
point in a command even if the object snap tracking is off.
In the following illustration, the Endpoint object snap is on. You start a line
by clicking its start point (1), move the cursor over another line's endpoint
(2) to acquire it, and then move the cursor along the horizontal alignment
path to locate the endpoint you want for the line you are drawing (3).
Use Precision Tools | 183

Change Object Snap Tracking Settings
By default, object snap tracking is set to orthogonal. Alignment paths are
displayed at 0, 90, 180, and 270 degrees from acquired object points. However,
you can use polar tracking angles instead. For object snap tracking, object
points are automatically acquired.
Change Alignment Path Display
You can change how AutoTrack displays alignment paths, and you can change
how object points are acquired for object snap tracking. By default, alignment
paths stretch to the end of the drawing window. You can change their display
to abbreviated lengths, or no length.
Tips for Using Object Snap Tracking
As you use AutoTrack (polar tracking and object snap tracking), you will
discover techniques that make specific design tasks easier. Here are a few you
might try.
■ Use Perpendicular, End, and Mid object snaps with object snap tracking
to draw to points that are perpendicular to the end and midpoints of
objects.
■ Use the Tangent and End object snaps with object snap tracking to draw
to points that are tangent to the endpoints of arcs.
■ Use object snap tracking with temporary tracking points. At a point prompt,
enter tt, then specify a temporary tracking point. A small + appears at the
point. As you move your cursor, AutoTrack alignment paths are displayed
relative to the temporary point. To remove the point, move the cursor
back over the +.
■ After you acquire an object snap point, use direct distance to specify points
at precise distances along alignment paths from the acquired object snap
point. To specify a point prompt, select an object snap, move the cursor
to display an alignment path, then enter a distance at the Command
prompt.
NOTE The direct distance entry method is not available while you are using
the temporary override key for object snap tracking.
184 | Chapter 6 Create and Modify Objects
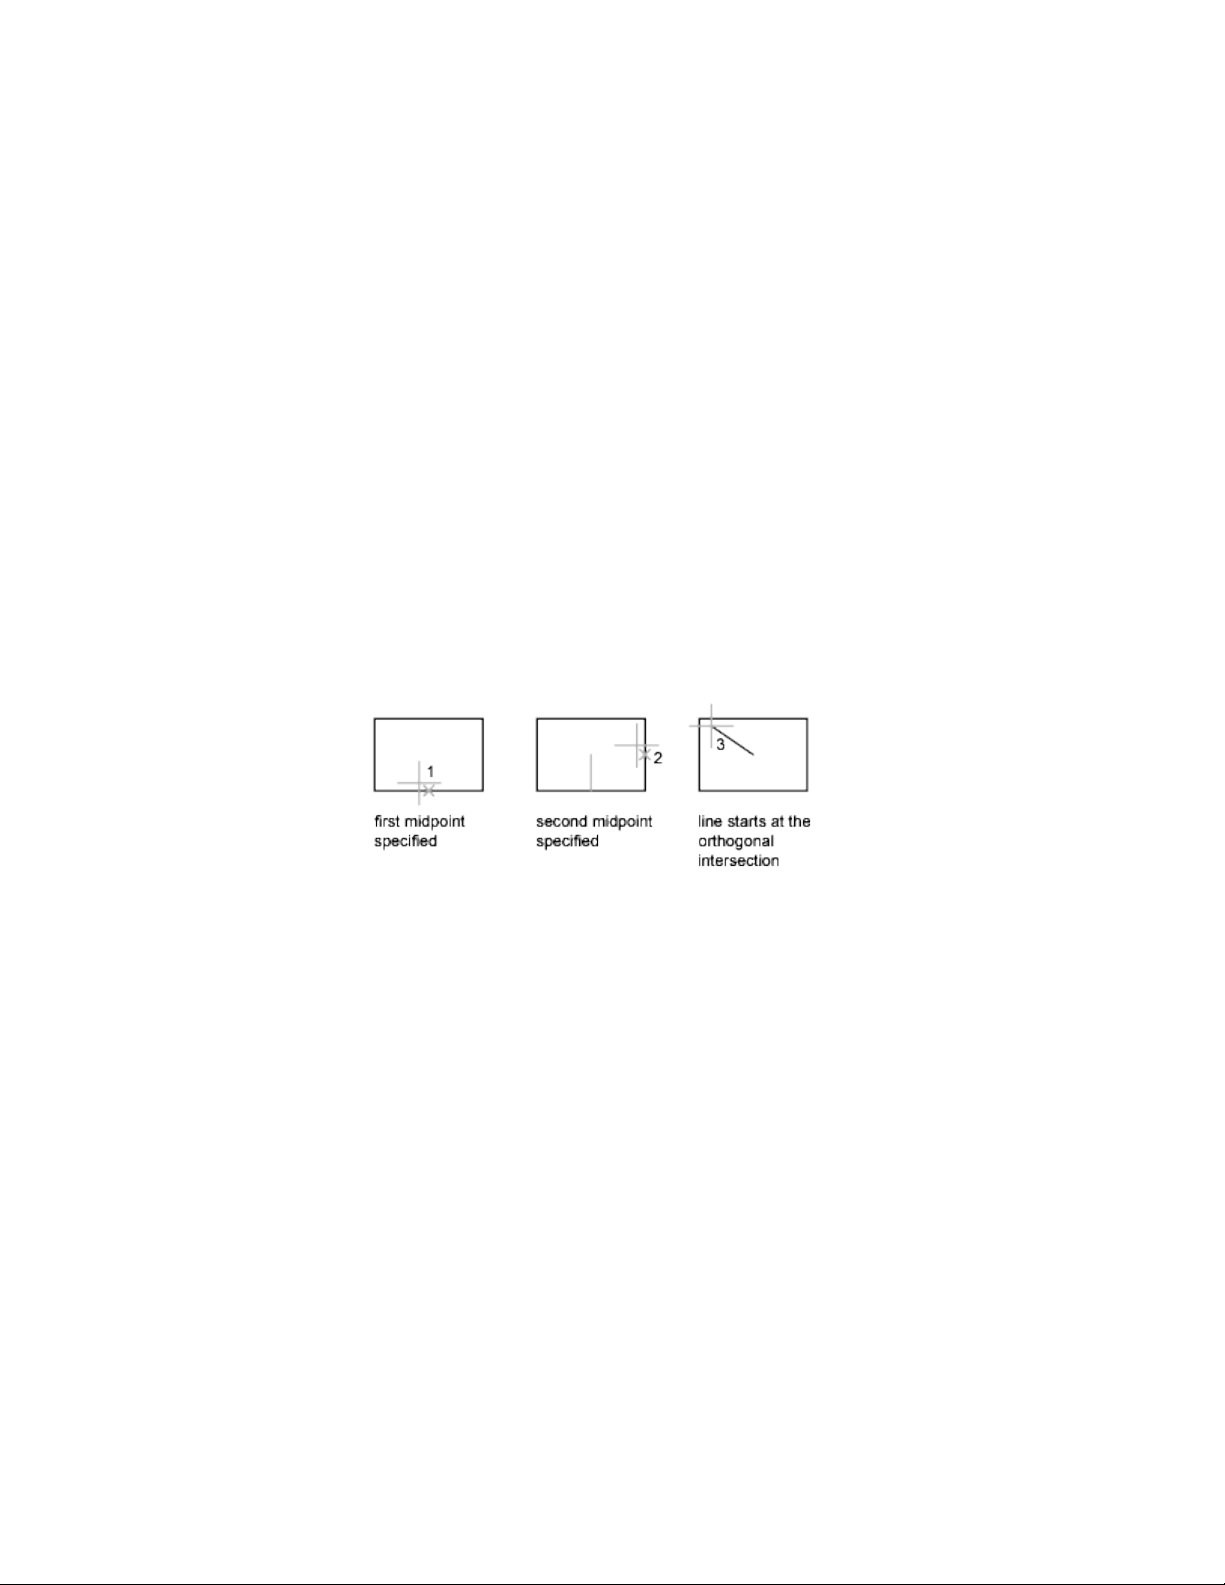
Track to Offset Point Locations (Tracking)
You can use tracking to specify a point by offsetting vertically and horizontally
from a series of temporary points.
You can use the tracking method whenever you are prompted for a point.
Tracking uses the pointing device to specify a point by offsetting vertically
and horizontally from a series of temporary points. When you start tracking
and specify an initial reference point, the next reference point is constrained
to a path that extends vertically or horizontally from that point. The direction
of the offset is indicated by the rubber-band line. You change the direction
of the offset by moving the cursor through the reference point. You can track
as many points as you need. Typically, you use tracking in combination with
object snaps or direct distance entry.
For example, you can use tracking to find the center point of a rectangle
without using construction lines. Start tracking, and specify the midpoint of
a horizontal line. Drag the cursor vertically and specify the midpoint of a
vertical line (2). Press Enter to accept the point (3) at the center of the rectangle.
Specify Distances
When specifying a point, you can enter distances, offsets, and measured
intervals.
Enter Direct Distances
You can specify a point by moving the cursor to indicate a direction and then
entering the distance.
To specify a line length quickly, without entering coordinate values, you can
specify a point by moving the cursor to indicate a direction and then entering
Use Precision Tools | 185

the distance from the first point. You can enter calculated distances and points
using the AutoCAD calculator (CAL).
You can use direct distance entry to specify points for all commands requiring
more than one point. When Ortho mode or polar tracking is on, this method
is an efficient way to draw lines of specified length and direction, and to move
or copy objects.
NOTE The direct distance entry method is not available while you are using the
temporary override keys for Ortho mode, object snap tracking, or polar tracking.
See also:
Use Polar Tracking and PolarSnap (page 177)
Lock an Angle for One Point (Angle ) (page 179)
Offset from Temporary Reference Points
You can establish a temporary reference point as a base point for offsetting
subsequent points.
The From command modifier establishes a temporary reference point as a
base point for offsetting subsequent points. The From method does not
constrain the cursor to orthogonal movement. The From method usually is
used in combination with object snaps.
Specify Intervals on Objects
You can mark off equal distances along objects.
Overview of Specifying Intervals on Objects
Provides a high-level overview of two options for marking off equal distances
along objects.
Sometimes you need to create points or insert symbols (blocks) at intervals
on an object.
You can
■ Specify the length of the segments (MEASURE)
186 | Chapter 6 Create and Modify Objects

■ Specify the number of equal segments (DIVIDE)
You can measure or divide lines, arcs, splines, circles, ellipses, and polylines.
With both methods, you can identify the intervals by inserting either a point
or a block.
By specifying points, you can use the Node object snap to align other objects
at intervals on the measured or divided object. By specifying blocks, you can
create precise geometric constructions or insert custom markers. The blocks
can rotate at each insertion point.
You cannot insert a block unless it has already been defined within the
drawing. Variable attributes within the block are not included when you insert
the block references.
The points or blocks you draw using MEASURE or DIVIDE are placed in a
selection set. Therefore, if you want to edit them immediately, you can use
the Previous option of SELECT.
See also:
Work with Blocks (page 307)
Specify Measured Intervals on Objects
You can mark off equal lengths from one end of a selected object.
You can use MEASURE to mark an object at specified intervals. You can mark
the intervals with either points or blocks. The last segment of a measured
object may be shorter than the interval you specify.
The starting point for measurements or divisions varies with the object type.
For lines or open polylines, the starting point is the endpoint closest to the
selection point. For closed polylines, it is the polyline start point. For circles,
it is at the angle from the center point that is equivalent to the current snap
angle. For example, if the snap angle is 0, the circle starts at the three o'clock
position and continues counterclockwise.
If the point marker is displayed as a single dot (the default setting), you may
not be able to see the measured intervals. You can change the style of the
point markers with the Point Style dialog box (DDPTYPE). The PDMODE
system variable also controls the appearance of point markers. For example,
you can change the value to make points appear as crosses. PDSIZE controls
the size of point objects.
Use Precision Tools | 187

Divide an Object into Equal Segments
You can divide a selected object into a specified number of equal lengths.
You can create points or insert blocks on an object at a specific number of
equal intervals. This operation does not actually break an object into individual
objects; it only identifies the location of the divisions so that you can use
them as geometric reference points.
The starting point for measurements or divisions varies with the object type.
For lines or open polylines, the starting point is the endpoint closest to the
selection point. For closed polylines, it is the polyline start point. For circles,
it is at the angle from the center point that is equivalent to the current snap
angle. For example, if the snap angle is 0, the circle starts at the three o'clock
position and continues counterclockwise.
If the point marker is displayed as a single dot (the default setting), you may
not be able to see the segments. You can change the style of the point markers
with the Point Style dialog box (DDPTYPE). The PDMODE system variable
also controls the appearance of point markers. For example, you can change
the value to make points appear as crosses. PDSIZE controls the size of point
objects.
Extract Geometric Information from Objects
The inquiry and calculation commands can provide information about objects
in your drawing and do useful calculations.
Obtain Distances, Angles, and Point Locations
You can obtain information about the relation between two specified points
or multiple points; for example, the distance between points or their angle in
the XY plane.
188 | Chapter 6 Create and Modify Objects
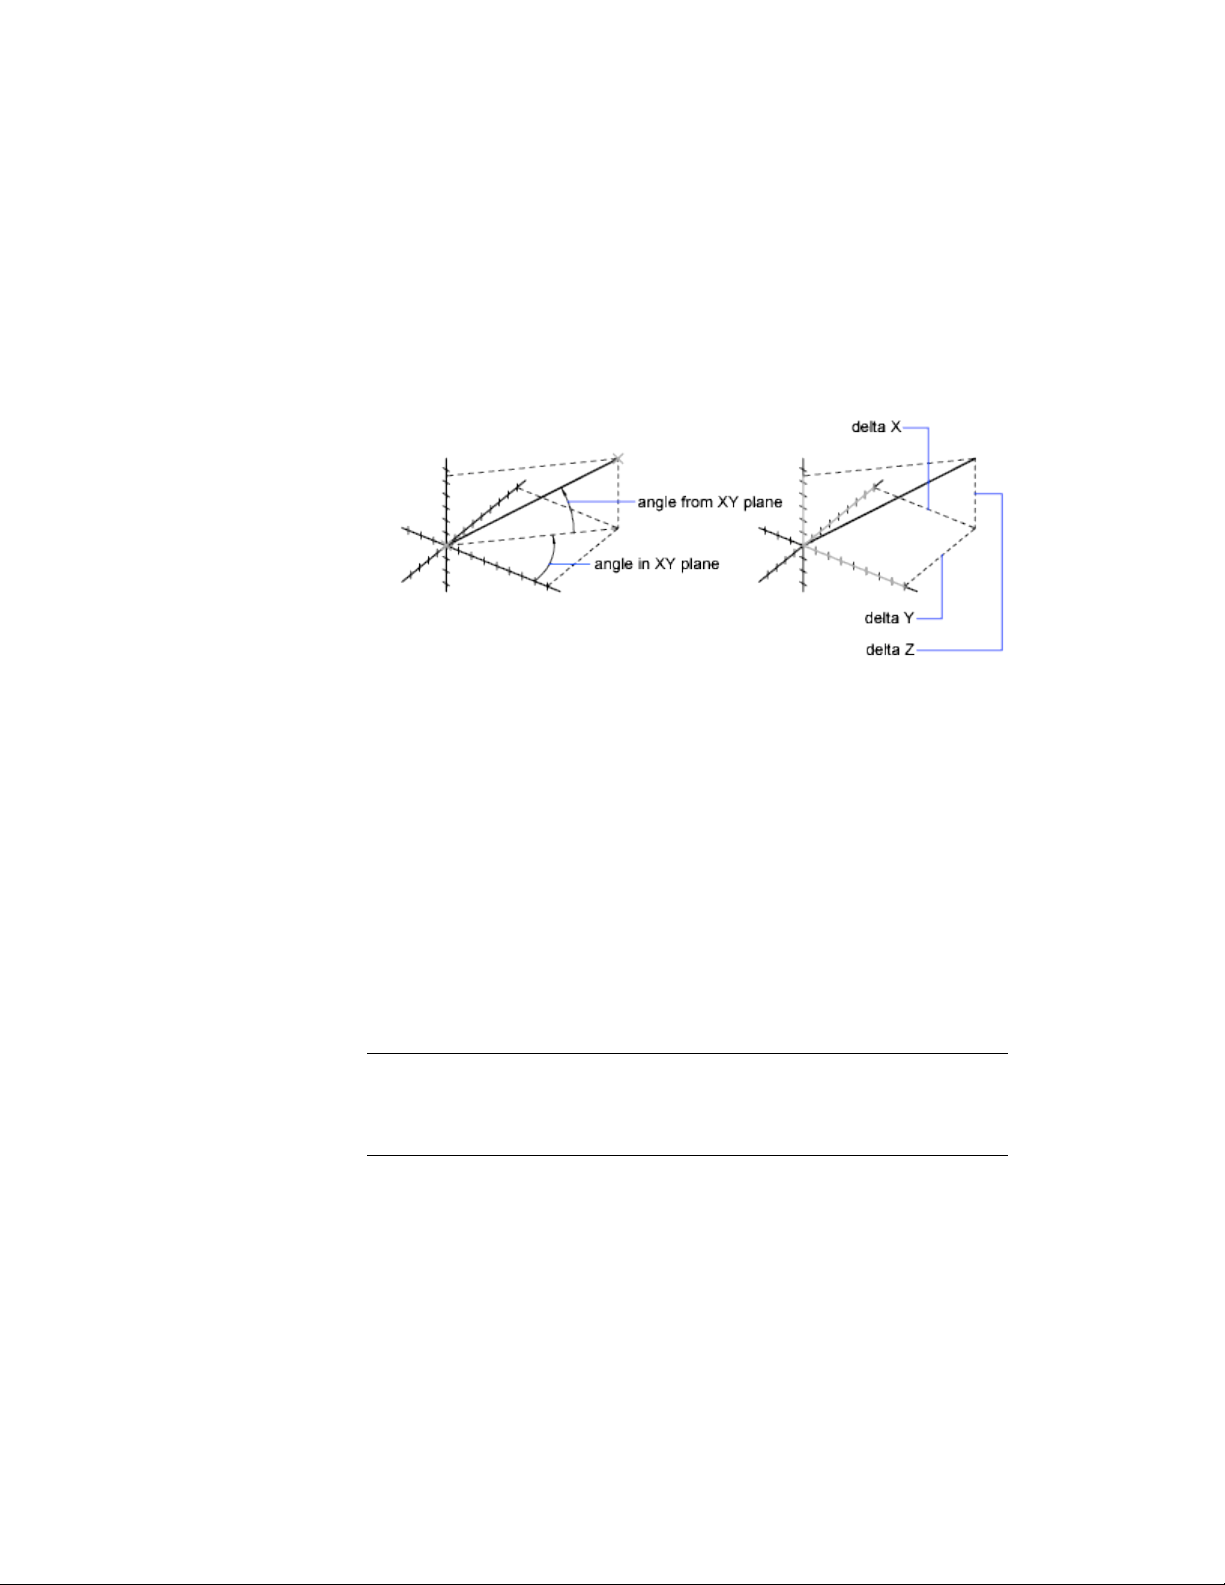
To determine the relation between points, you can display the
■ Distance between them
■ Angle between the points in the XY plane
■ Angle of the points from the XY plane
■ Delta, or changed, X, Y, and Z distances between them
The ID command lists the X, Y, and Z coordinate values of a specified point.
See also:
Overview of Coordinate Entry (page 156)
Obtain Area and Mass Properties Information
You can obtain the area, perimeter, and mass properties defined by selected
objects or a sequence of points.
You can calculate the area and perimeter of a sequence of points. You can also
obtain the area, perimeter, and mass properties of any of several types of
objects.
TIP A fast way to calculate an area bounded by several objects in 2D is to use the
BOUNDARY command. With BOUNDARY, you can pick a point within the area to
create a closed polyline or region. You can then use the Properties Inspector palette
or the LIST command to find the area and perimeter of the polyline or region.
Use Precision Tools | 189

Use Commands to Calculate Area
With the MEASUREGEOM and AREA commands, you can specify a series of
points or select an object to calculate area. If you need to calculate the
combined area of multiple objects, you can keep a running total as you add
or subtract one area at a time from the selection set. You cannot use window
selection or crossing selection to select objects.
Total area and perimeter are saved in the AREA and PERIMETER system
variables.
In addition to area, with the MEASUREGEOM command, you can obtain
geometric information from objects such as distance, radius, angle, and volume.
Define an Area
You can measure an arbitrary closed region defined by the points you specify.
The points must lie on a plane parallel to the XY plane of the current UCS.
Calculate the Area, Perimeter, or Circumference of an Object
You can calculate the enclosed area and perimeter or circumference of circles,
ellipses, polylines, polygons, regions, and AutoCAD 3D solids. The information
displayed depends on the type of object selected:
■ Circles. Area and circumference display.
■ Ellipses, closed polylines, polygons, planar closed spline curves,
and regions. Area and perimeter display. For wide polylines, this area is
defined by the center of the width.
■ Open objects such as open spline curves and open polylines. Area
and length display. Area is calculated as though a straight line connects
the start point and endpoint.
■ AutoCAD 3D solids. Total 3D area for the object displays.
190 | Chapter 6 Create and Modify Objects
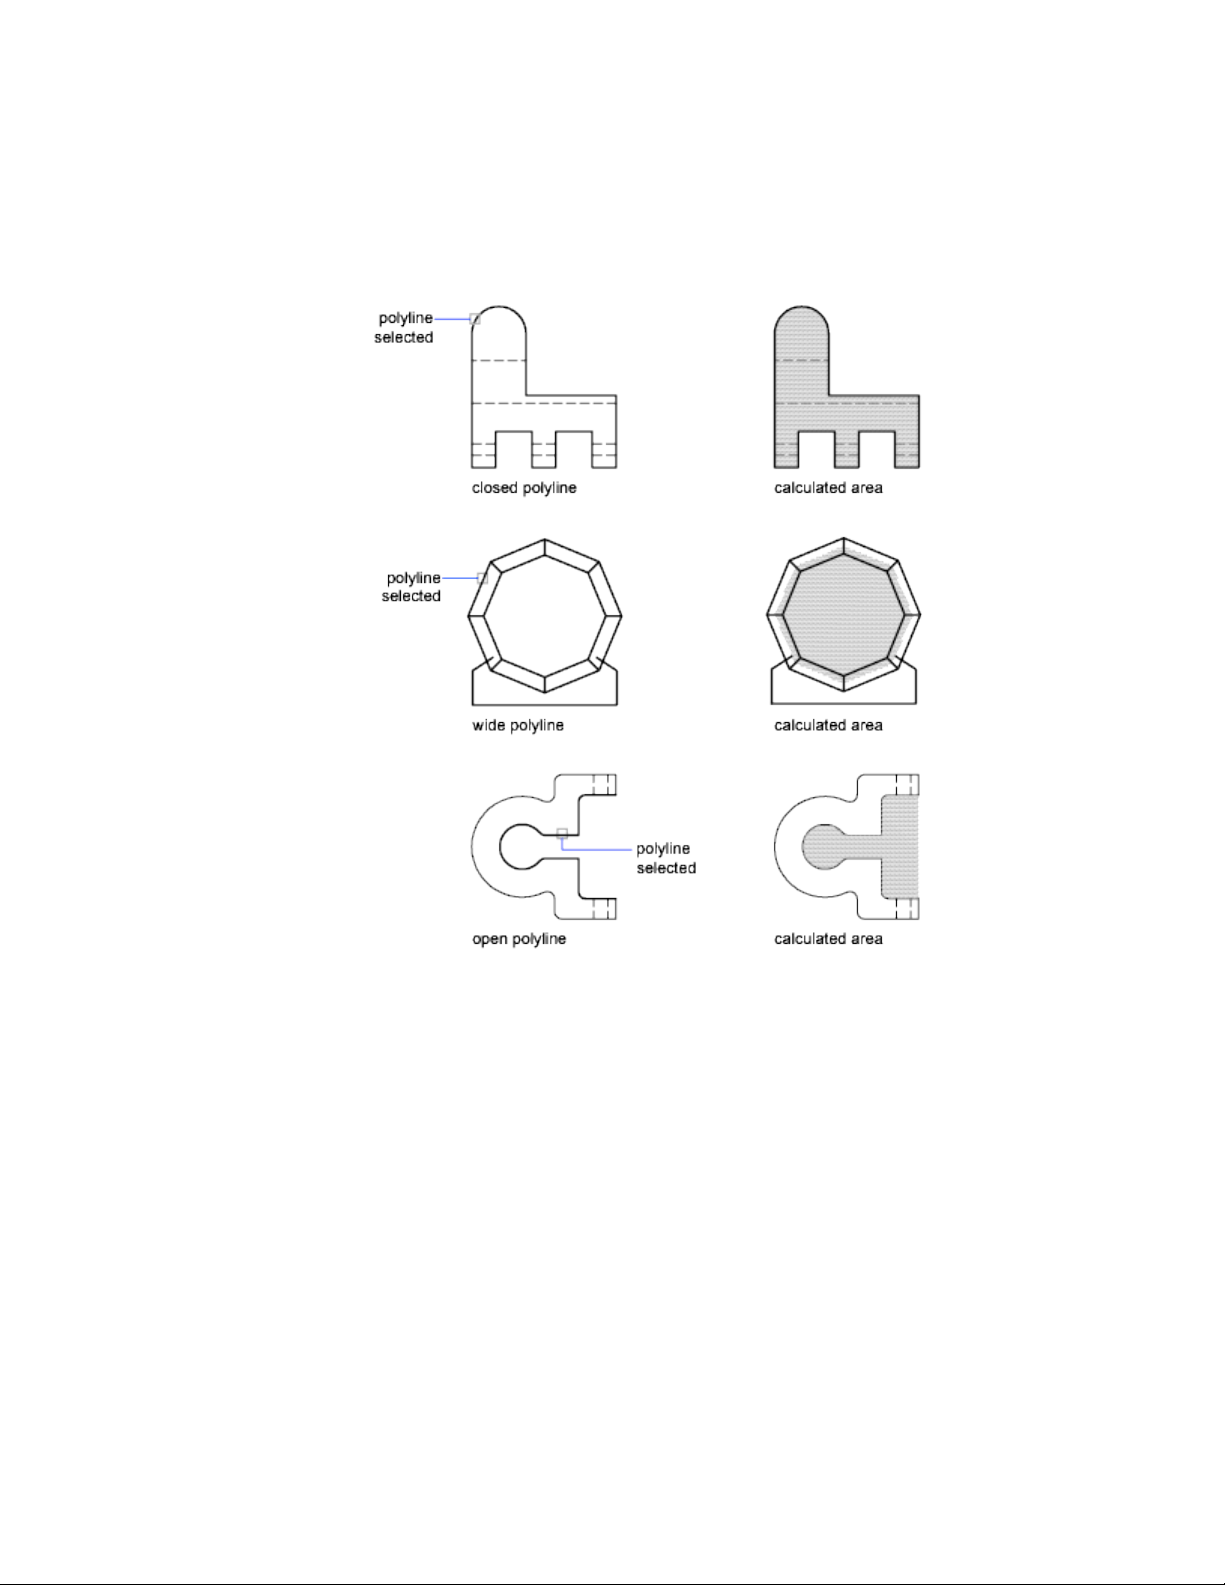
Example: How Various Areas Are Calculated
Combined Areas
Calculate Combined Areas
You can calculate the total area of multiple areas by specifying points or by
selecting objects. For example, you can measure the total area of selected
rooms in a floor plan.
Use Precision Tools | 191
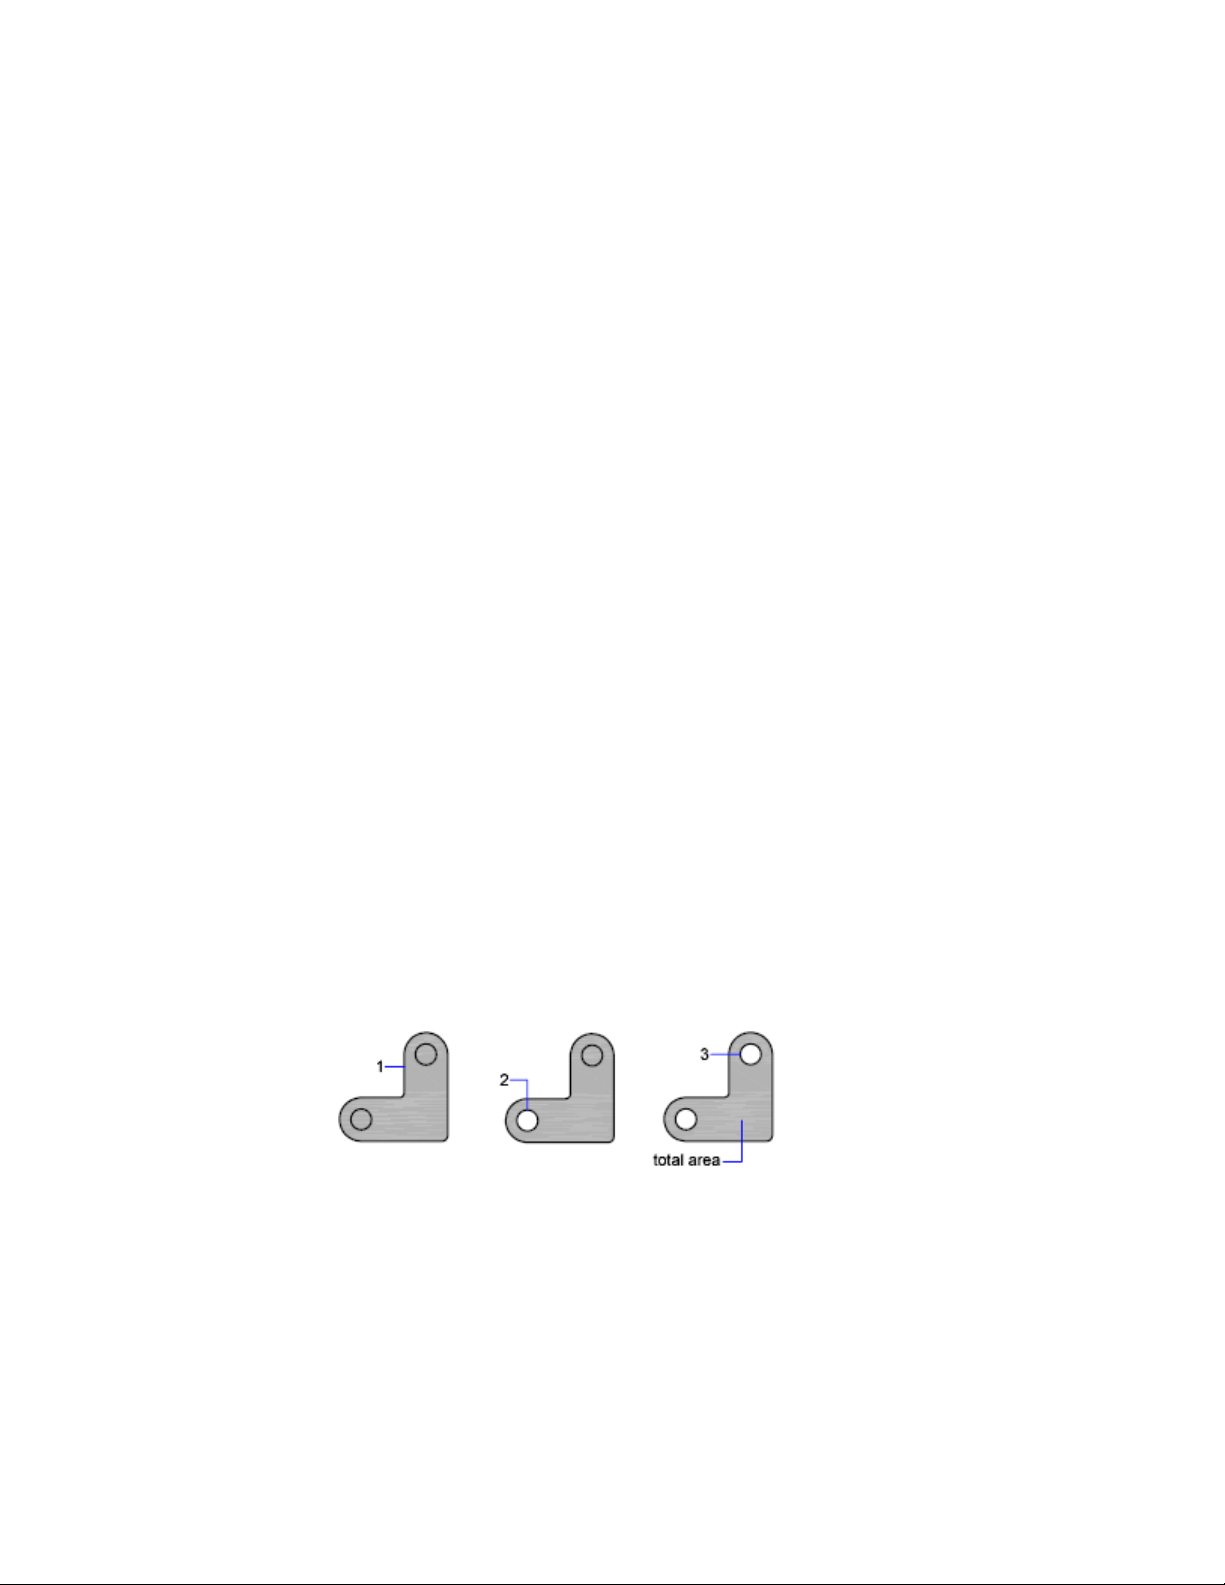
Subtract Areas from Combined Areas
You can subtract more than one area from a combined area as you calculate.
For example, if you have calculated the area of a floor plan, you can subtract
the area of a room.
Example: Subtraction of Areas from a Calculation
In the following example, the closed polyline represents a metal plate with
two large holes. The area of the polyline is first calculated and then the area
of each hole is subtracted. The area and perimeter or circumference of each
object displays, with a running total after each step.
The Command prompt sequence is
Command: area
Specify first corner point or [Object/Add area/Subtract area]
<Object>: a
Specify first corner point or [Object/Subtract area]: o
(ADD mode) Select objects: Select the polyline (1)
Area = 0.34, Perimeter = 2.71
Total area = 0.34
(ADD mode) Select objects: Press Enter
Specify first corner point or [Object/Subtract area]: s
Specify first corner point or [Object/Add area]: o
(SUBTRACT mode) Select objects: Select the lower circle (2)
Area = 0.02, Circumference = 0.46
Total area = 0.32
(SUBTRACT mode) Select objects: Select the upper circle (3)
Area = 0.02, Circumference = 0.46
Total area = 0.30
(SUBTRACT mode) Select circle or polyline: Press Enter
Specify first corner point or [Object/Add area]: Press Enter
192 | Chapter 6 Create and Modify Objects

You can also use REGION to convert the plate and the holes to regions, subtract
the holes, and then use the Properties Inspector palette or the LIST command
to find the area of the plate.
TIP Use the CAL command to convert from one system of area units to another.
Calculate Mass Properties
With the MASSPROP command, you can analyze 3D solids and 2D regions
for their mass properties including volume, area, moments of inertia, center
of gravity, and so on. In addition, the result of the computations can be saved
to a text file.
See also:
Create and Combine Areas (Regions) (page 217)
Overview of Object Properties (page 117)
Use a Calculator
You can access a calculator function as you work with the program. You can
use the CAL command at the Command prompt transparently while a
command is active or not.
Use the Command Prompt Calculator
By entering an expression in the Command prompt calculator, you can quickly
solve a mathematical problem or locate points in your drawing.
The CAL command runs the 3D calculator utility to evaluate vector expressions
(combining points, vectors, and numbers) and real and integer expressions.
The calculator performs standard mathematical functions. It also contains a
set of specialized functions for calculations involving points, vectors, and
AutoCAD geometry. With the CAL command, you can
■ Calculate a vector from two points, the length of a vector, a normal vector
(perpendicular to the XY plane), or a point on a line
■ Calculate a distance, radius, or angle
■ Specify a point with the pointing device
■ Specify the last-specified point or intersection
Use Precision Tools | 193
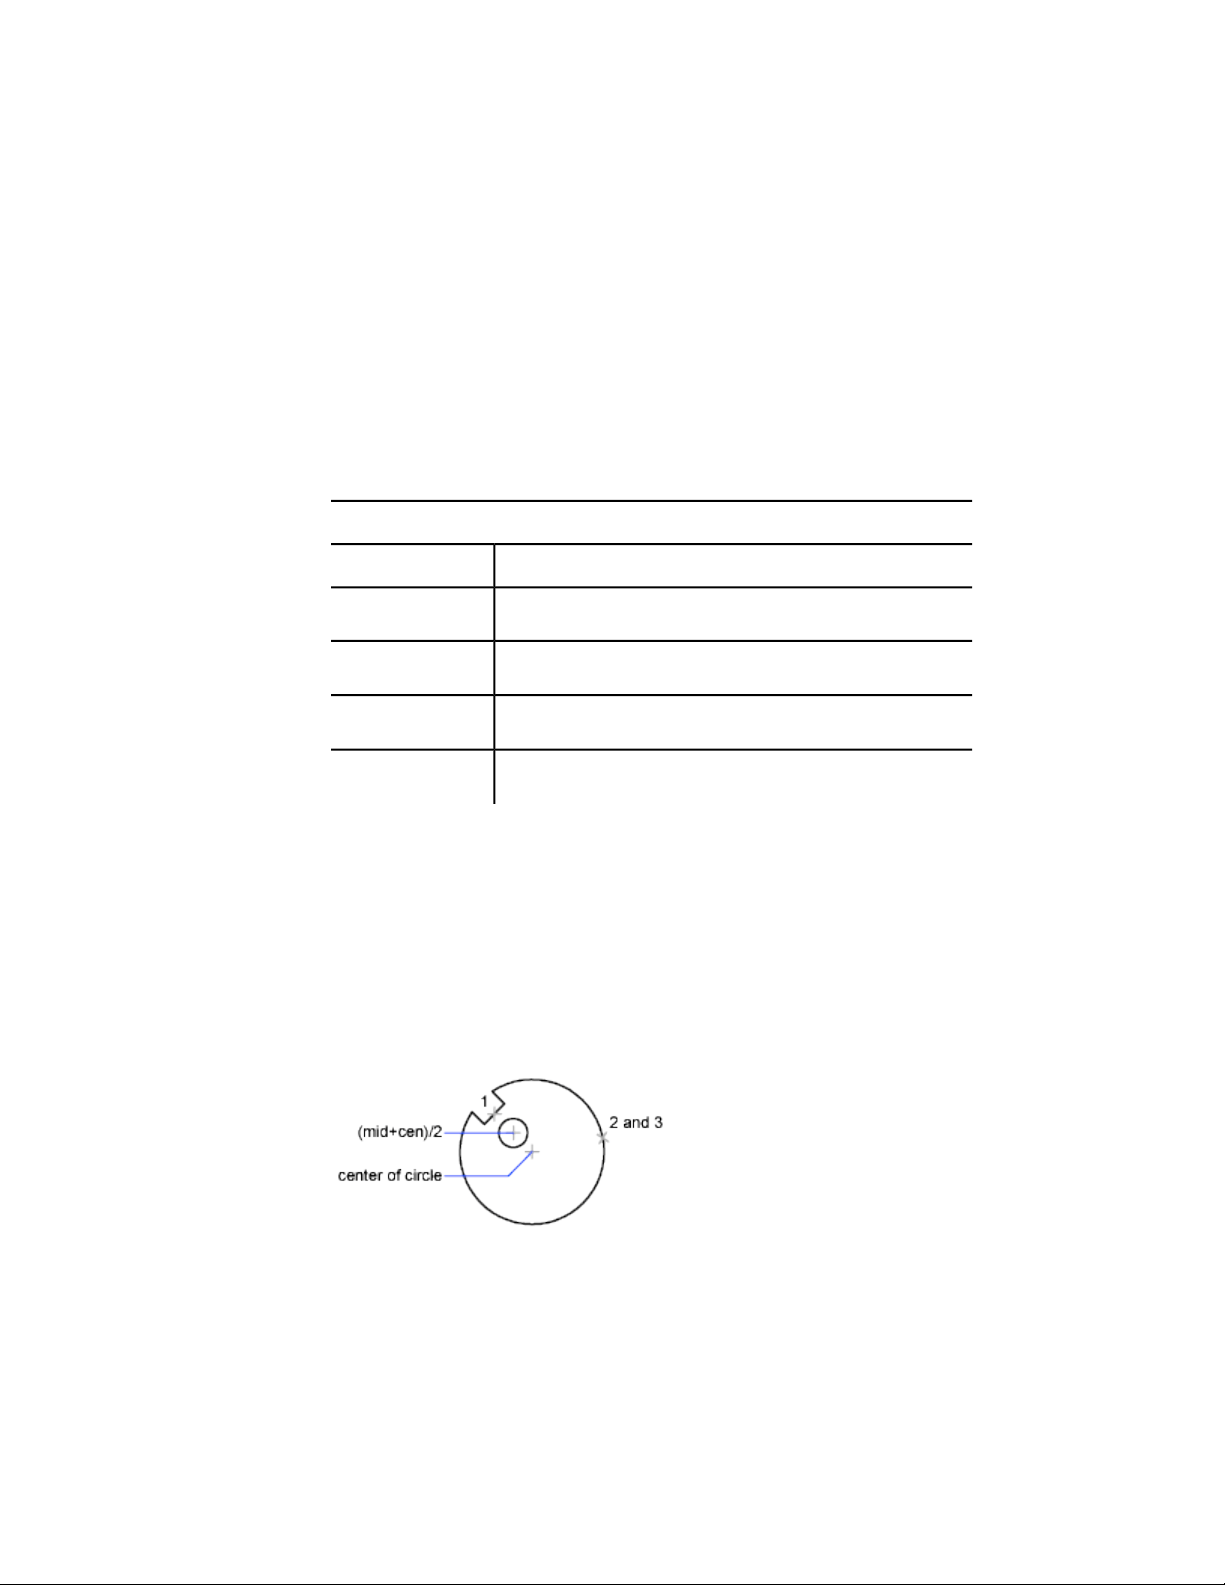
■ Use object snaps as variables in an expression
■ Convert points between a UCS and the WCS
■ Filter the X, Y, and Z components of a vector
■ Rotate a point around an axis
Evaluating Expressions
CAL evaluates expressions according to standard mathematical rules of
precedence.
Mathematical operators in order of precedence
OperationOperator
Groups expressions( )
Indicates numeric exponent^
Multiplies and divides numbers*, /
Adds and subtracts numbers+, -
Calculating Points
You can use CAL whenever you need to calculate a point or a number within
a command.
For example, you enter (mid+cen)/2 to specify a point halfway between the
midpoint of a line and the center of a circle.
The following example uses CAL as a construction tool. It locates a center
point for a new circle, and then calculates one fifth of the radius of an existing
circle.
194 | Chapter 6 Create and Modify Objects

Here is the command prompt sequence:
Command: circle
Specify center point for circle or [3P/2P/Ttr (tan tan
radius)]: 'cal
>> Expression: (mid+cen)/2
>> Select entity for MID snap: Select the notch line (1)
>> Select entity for CEN snap: Select the large circle (2)
Diameter/<Radius>: 'cal
>> Expression: 1/5*rad
>> Select circle, arc or polyline segment for RAD function:
Select the large circle (3)
Use the Command Prompt Calculator
To start the Command prompt calculator
Do one of the following:
■ At the Command prompt, enter CAL. Then, enter a CAL expression.
■ At a prompt for a command in progress, enter ‘CAL to start the CAL
command transparently. Then, enter a CAL expression to calculate a value
for that prompt.
Create Objects
Drawings are made up of objects. In general, you draw objects by specifying
points with the pointing device or by entering coordinate values at the
Command prompt.
You can create a range of objects, from simple lines and circles to spline curves,
and ellipses. In general, you draw objects by specifying points with the pointing
device or by entering coordinate values at the Command prompt.
Draw Linear Objects
A line, the most basic object, can be one segment or a series of connected
segments.
Create Objects | 195

Draw Lines
You can close a sequence of line segments so that the first and last segments
are joined.
You can assign properties to lines including color, linetype, and lineweight.
For more information about properties, see Work with Object Properties (page
117).
You specify the locations that define the endpoints of each line with precision.
You can
■ Enter the coordinate values for an endpoint, using either absolute or relative
coordinates
■ Specify an object snap relative to an existing object. For example, you can
specify the center of a circle as one endpoint of the line
■ Turn grid snap on and snap to a location
There are other methods for creating precise lines. A highly efficient technique
is to offset a line from an existing line, and then trim or extend it to the desired
length.
Use polyline objects instead of line objects if you want the segments to be
connected as a single object.
See also:
Enter Coordinates to Specify Points (page 156)
Adjust Grid and Grid Snap (page 173)
Draw Polylines (page 196)
Offset an Object (page 251)
Break and Join Objects (page 270)
Infer Geometric Constraints (page 293)
Draw Polylines
A polyline is a connected sequence of segments created as a single object. You
can create straight line segments, arc segments, or a combination of the two.
196 | Chapter 6 Create and Modify Objects
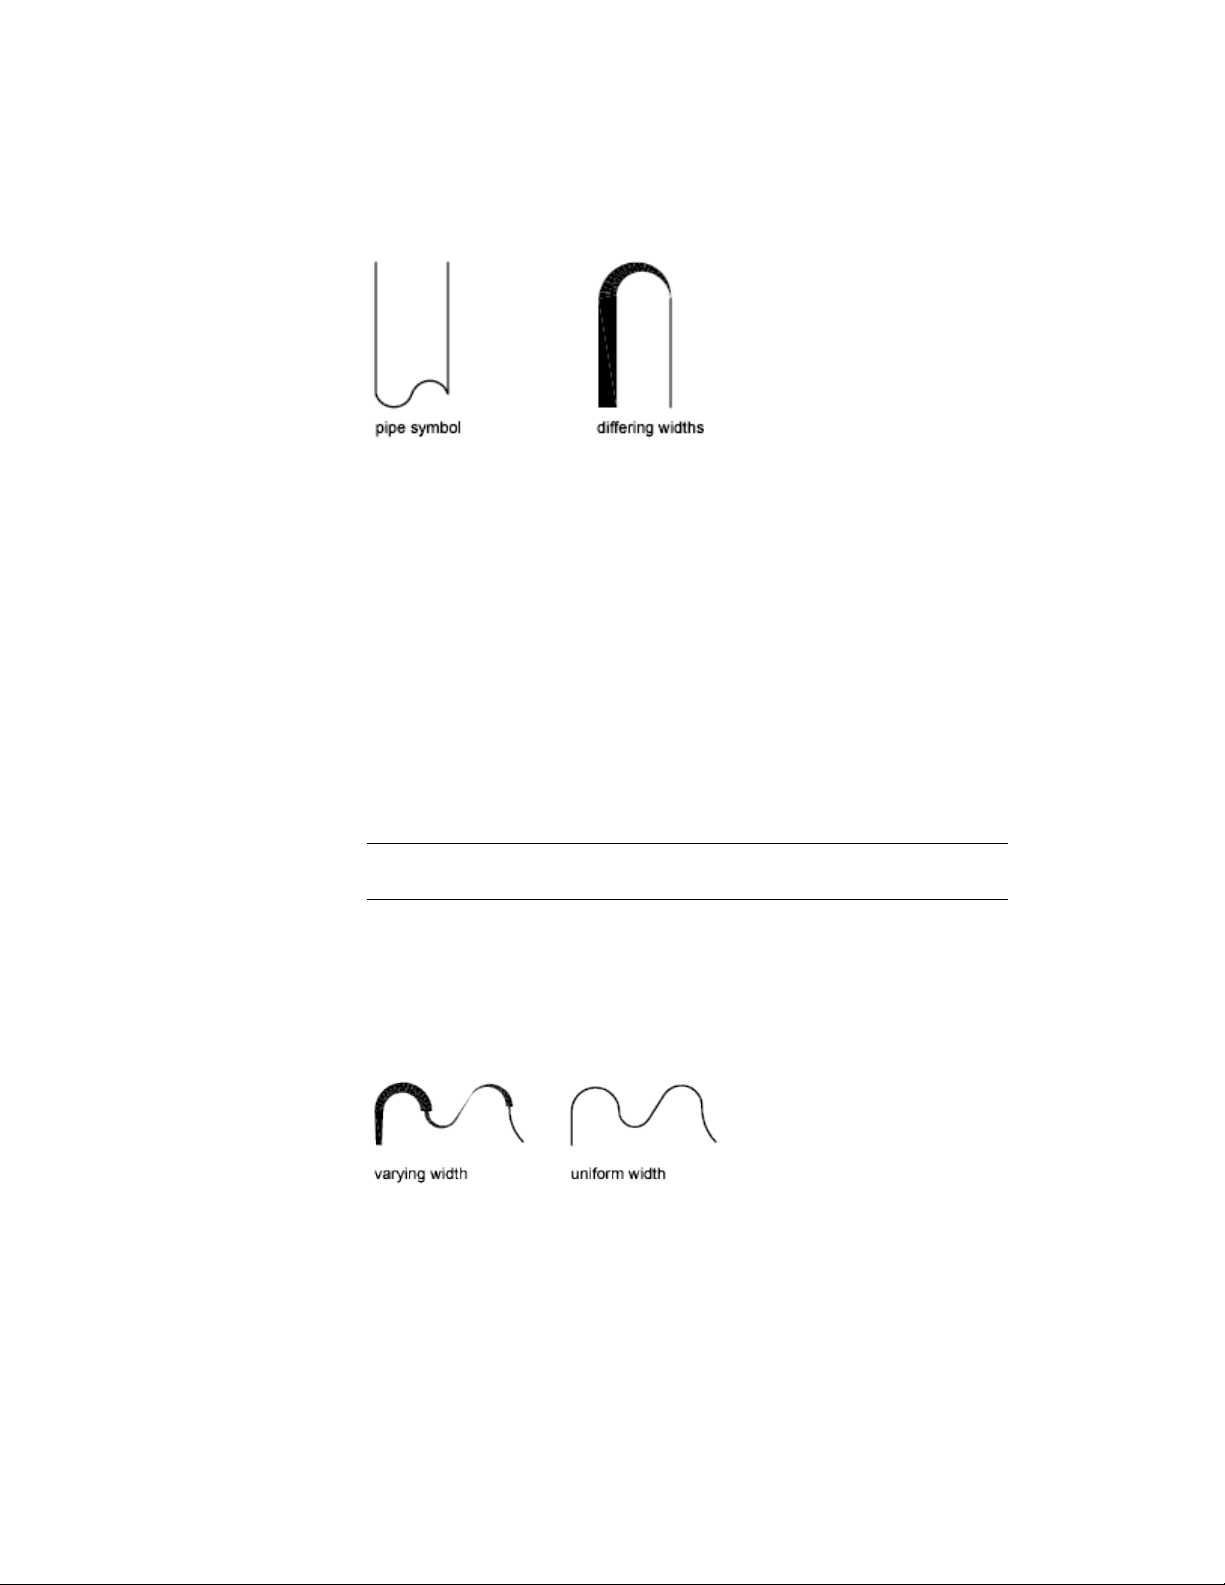
Polylines are ideal for applications including the following:
■ Contour lines for topographic, isobaric, and other scientific applications
■ Wiring diagrams and printed cicuit board layouts
■ Process and piping diagrams
■ Extrusion profiles and extrusion paths for 3D solid modeling
Polylines can be created with several commands including PLINE, RECTANG,
POLYGON, DONUT, BOUNDARY, and REVCLOUD. All of these commands
result in a LWPOLYLINE (lightweight polyline) object type.
With the 3DPOLY command, you can create non-planar polylines that result
in a POLYLINE object type. Fewer options are available with 3D polylines.
After you create a polyline, you can edit it using grips or PEDIT. You can use
EXPLODE to convert polylines to individual line and arc segments.
NOTE You can convert a spline-fit polyline created with PEDIT into a true spline
object with SPLINE.
Create Wide Polylines
You can draw polylines of various widths by using the Width and Halfwidth
options. You can set the width of individual segments and make them taper
gradually from one width to another. These options become available after
you specify a starting point for the polyline.
Create Objects | 197
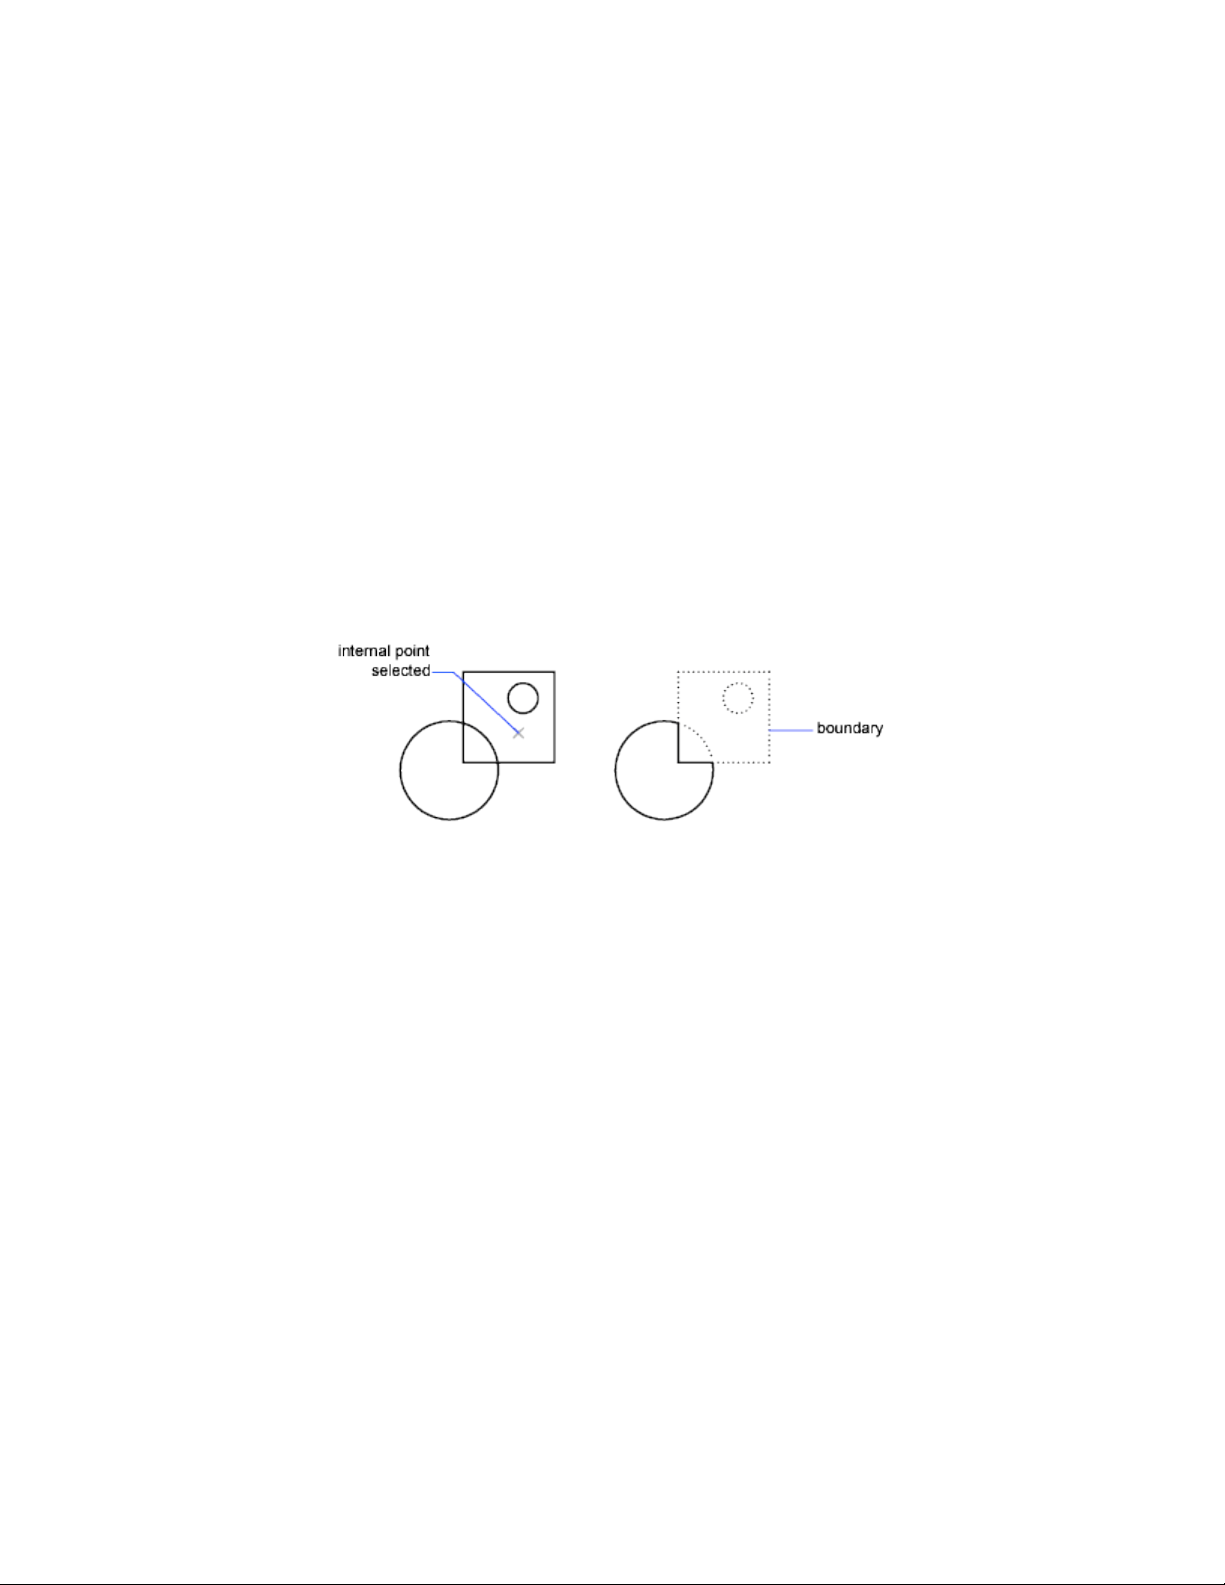
The Width and Halfwidth options set the width of the next polyline segments
you draw. Widths greater than zero produce wide lines, which are filled if Fill
mode is on and outlined if Fill mode is off.
Intersections of adjacent wide segments are usually beveled. However,
nontangent arc segments, acute angles, or segments that use a dash-dot
linetype are not beveled.
Create Polylines from the Boundaries of Objects
You can create a polyline from the boundaries of objects that form a closed
area with BOUNDARY. A polyline created using this method is a separate
object, distinct from the objects used to create it.
To expedite the boundary selection process in large or complex drawings, you
can specify a group of boundary candidates, called a boundary set. You create
this set by selecting the objects you want to use define the boundary.
See also:
Draw Rectangles and Polygons (page 198)
Modify Objects (page 232)
Break and Join Objects (page 270)
Control Lineweights (page 141)
Infer Geometric Constraints (page 293)
Draw Rectangles and Polygons
You can create rectangles and regular polygons quickly. Creating polygons is
a simple way to draw equilateral triangles, squares, pentagons, hexagons, and
so on.
If necessary, you can use EXPLODE to convert the resulting polyline object
into lines.
198 | Chapter 6 Create and Modify Objects
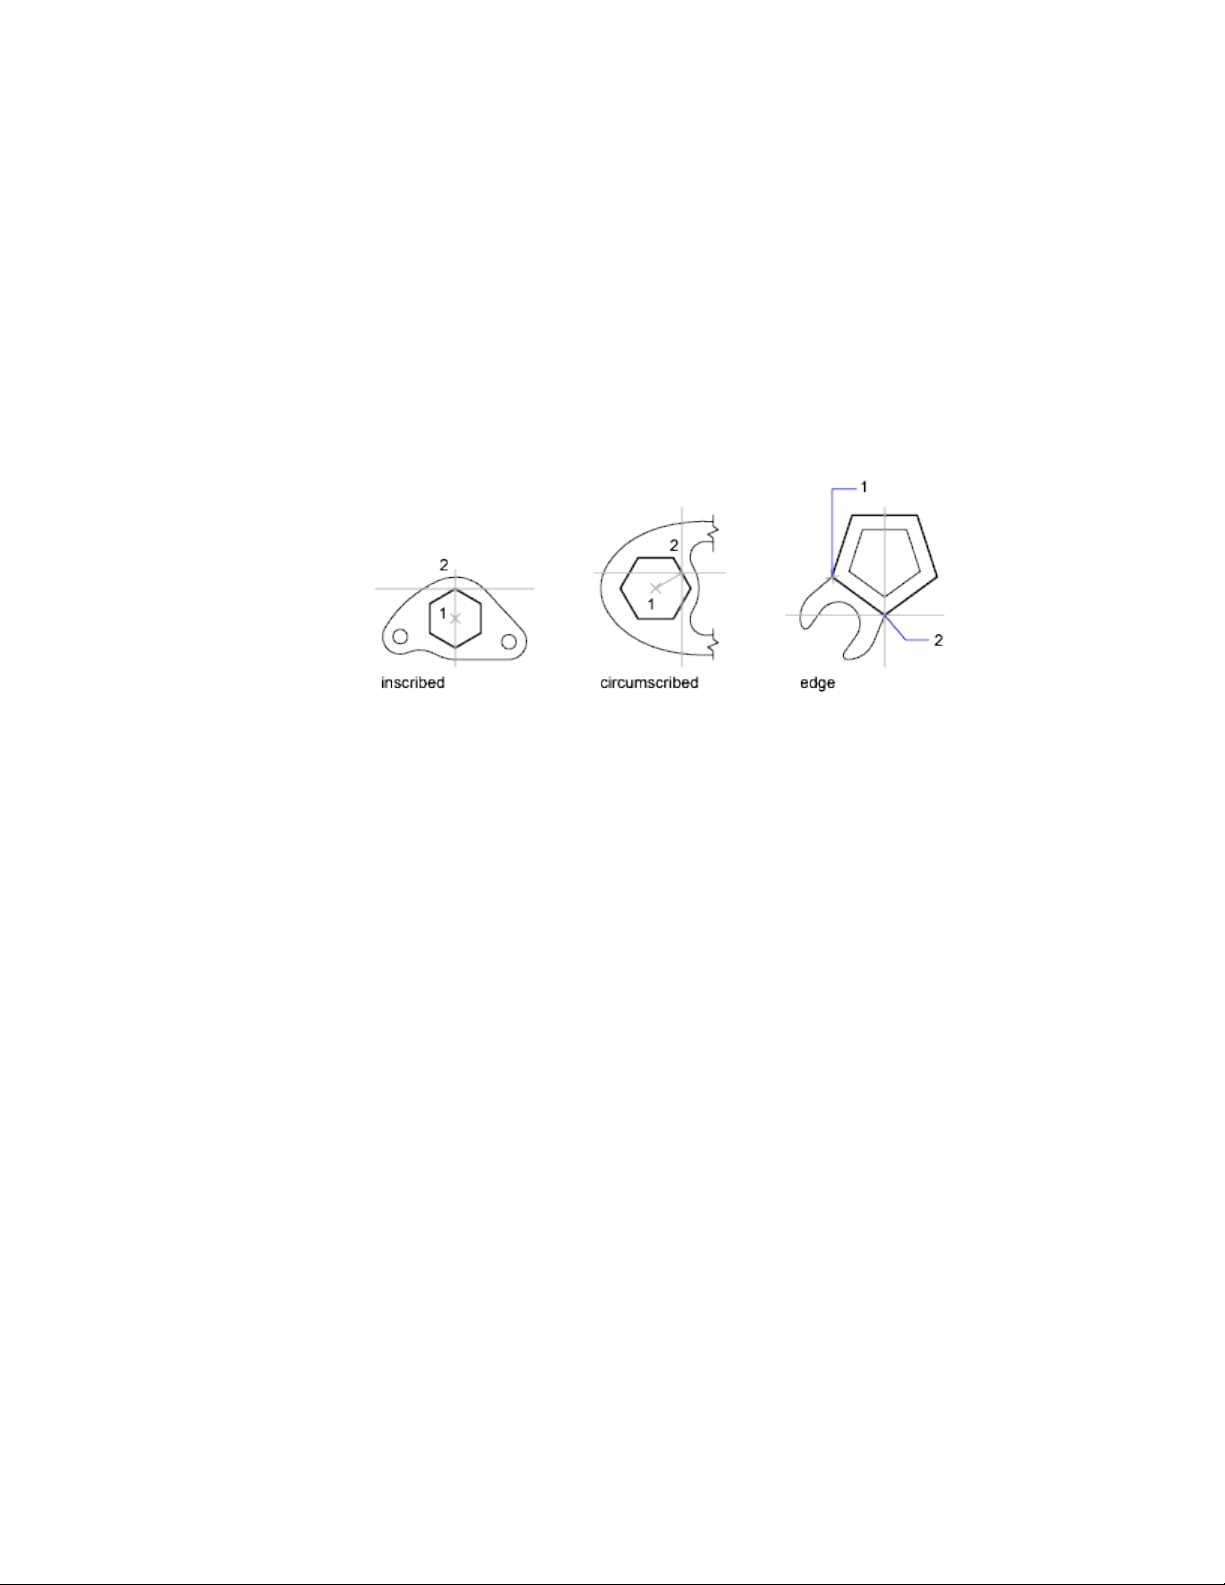
Draw Rectangles
Use RECTANG to create closed polylines in a rectangular shape.
Draw Regular Polygons
Use POLYGON to create closed polylines with between 3 and 1,024
equal-length sides. The following illustrations show polygons created using
three methods. In each case, two points are specified.
See also:
Draw Polylines (page 196)
Infer Geometric Constraints (page 293)
Draw Multiline Objects
Multilines are composed of parallel lines, called elements.
When you draw a multiline, you can use the STANDARD style, which has two
elements, or specify a style that you created previously. You can also change
the justification and scale of the multiline before you draw it.
Multiline justification determines which side of the cursor that the multiline
is drawn, or whether it is centered on the cursor.
Multiline scale controls the overall width of the multiline using the current
units. Multiline scale does not affect linetype scale. If you change the multiline
scale, you might need to make equivalent changes to the linetype scale to
prevent dots or dashes from being disproportionately sized.
Create Objects | 199
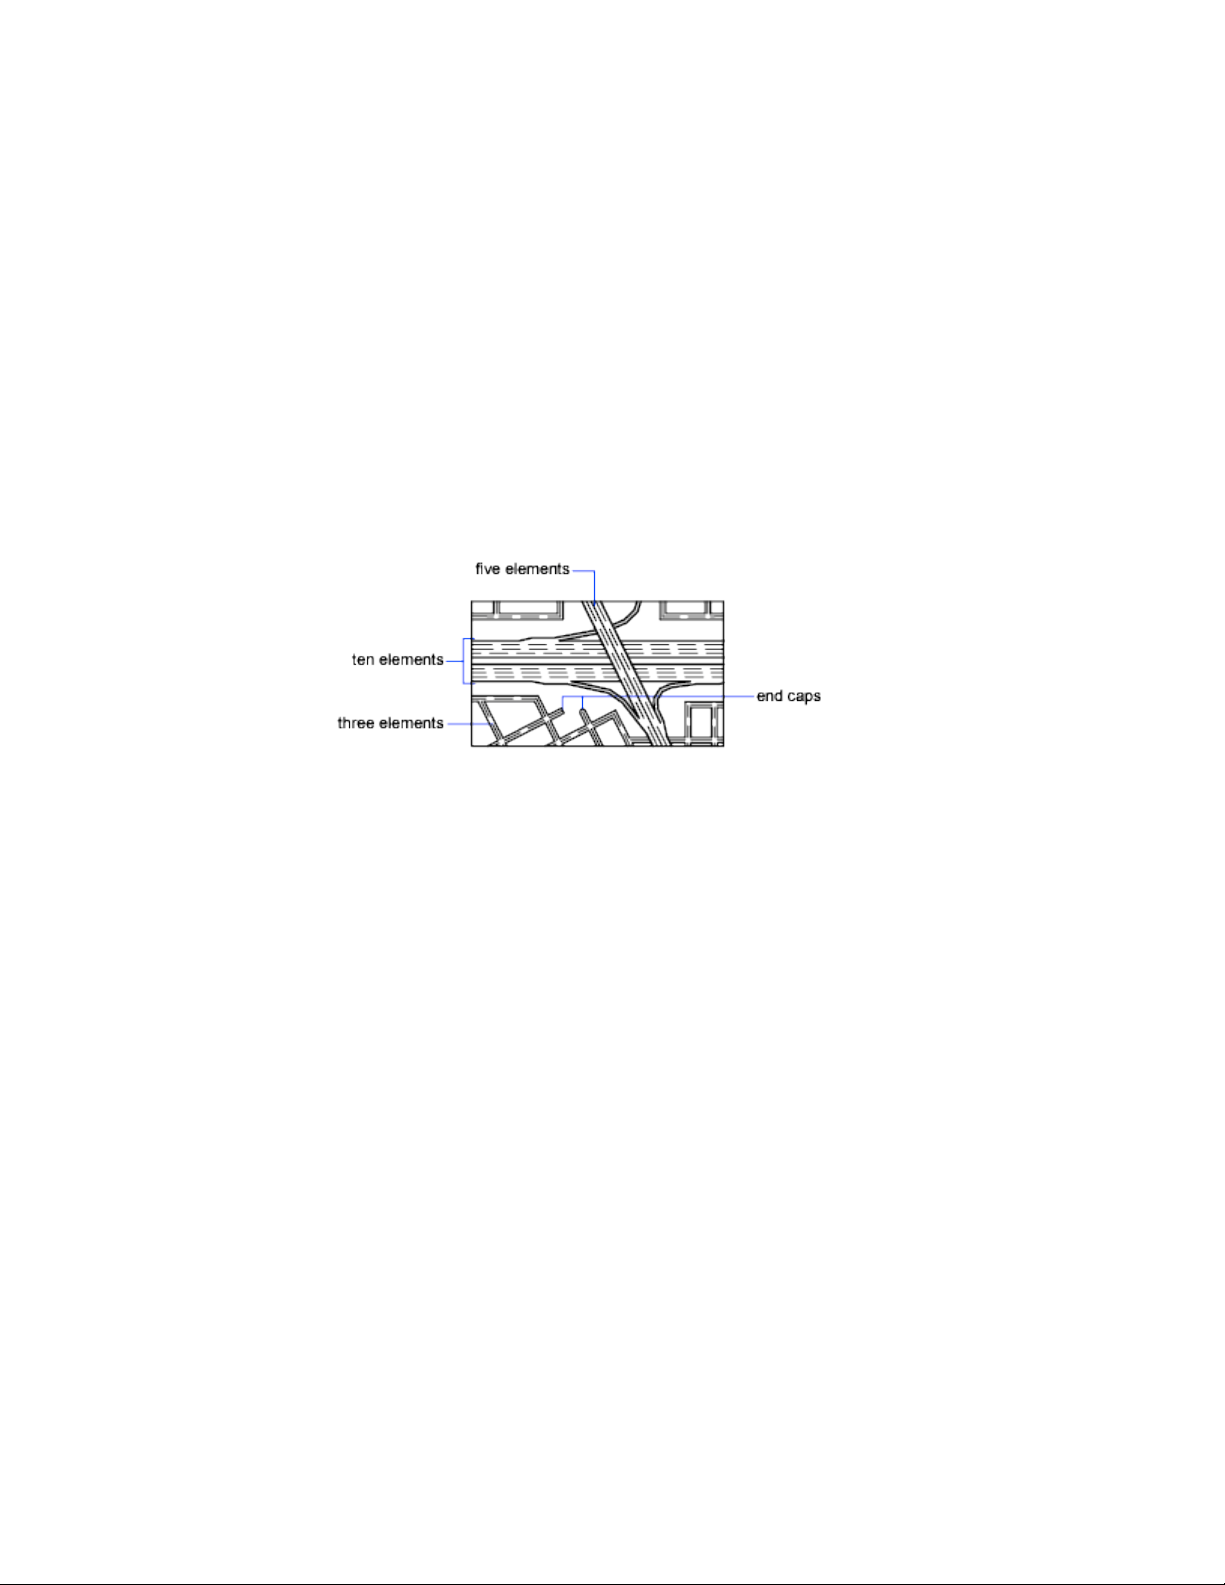
Create Multiline Styles
You can create named styles for multilines to control the number of elements
and the properties of each element. The properties of multilines include
■ The total number of elements and position of each element
■ The offset distance for each element from the middle of the multiline
■ The color and linetype of each element
■ The visibility of the lines, called joints, that appear at each vertex
■ The type of end caps that are used
■ The background fill color of the multiline
Elements with a positive offset appear on one side of the middle of the
multiline; elements with a negative offset appear on the other side of the
middle of the multiline.
See also:
Modify Multilines (page 280)
Draw Freehand Sketches
Sketching is useful for creating irregular boundaries or for tracing with a
digitizer.
Draw freehand sketches with the SKETCH command. Freehand sketches
comprise many line segments that are converted into a line, polyline, or spline.
For Splines, you can determine how closely the spline’s curve fits to the
freehand sketch.
200 | Chapter 6 Create and Modify Objects
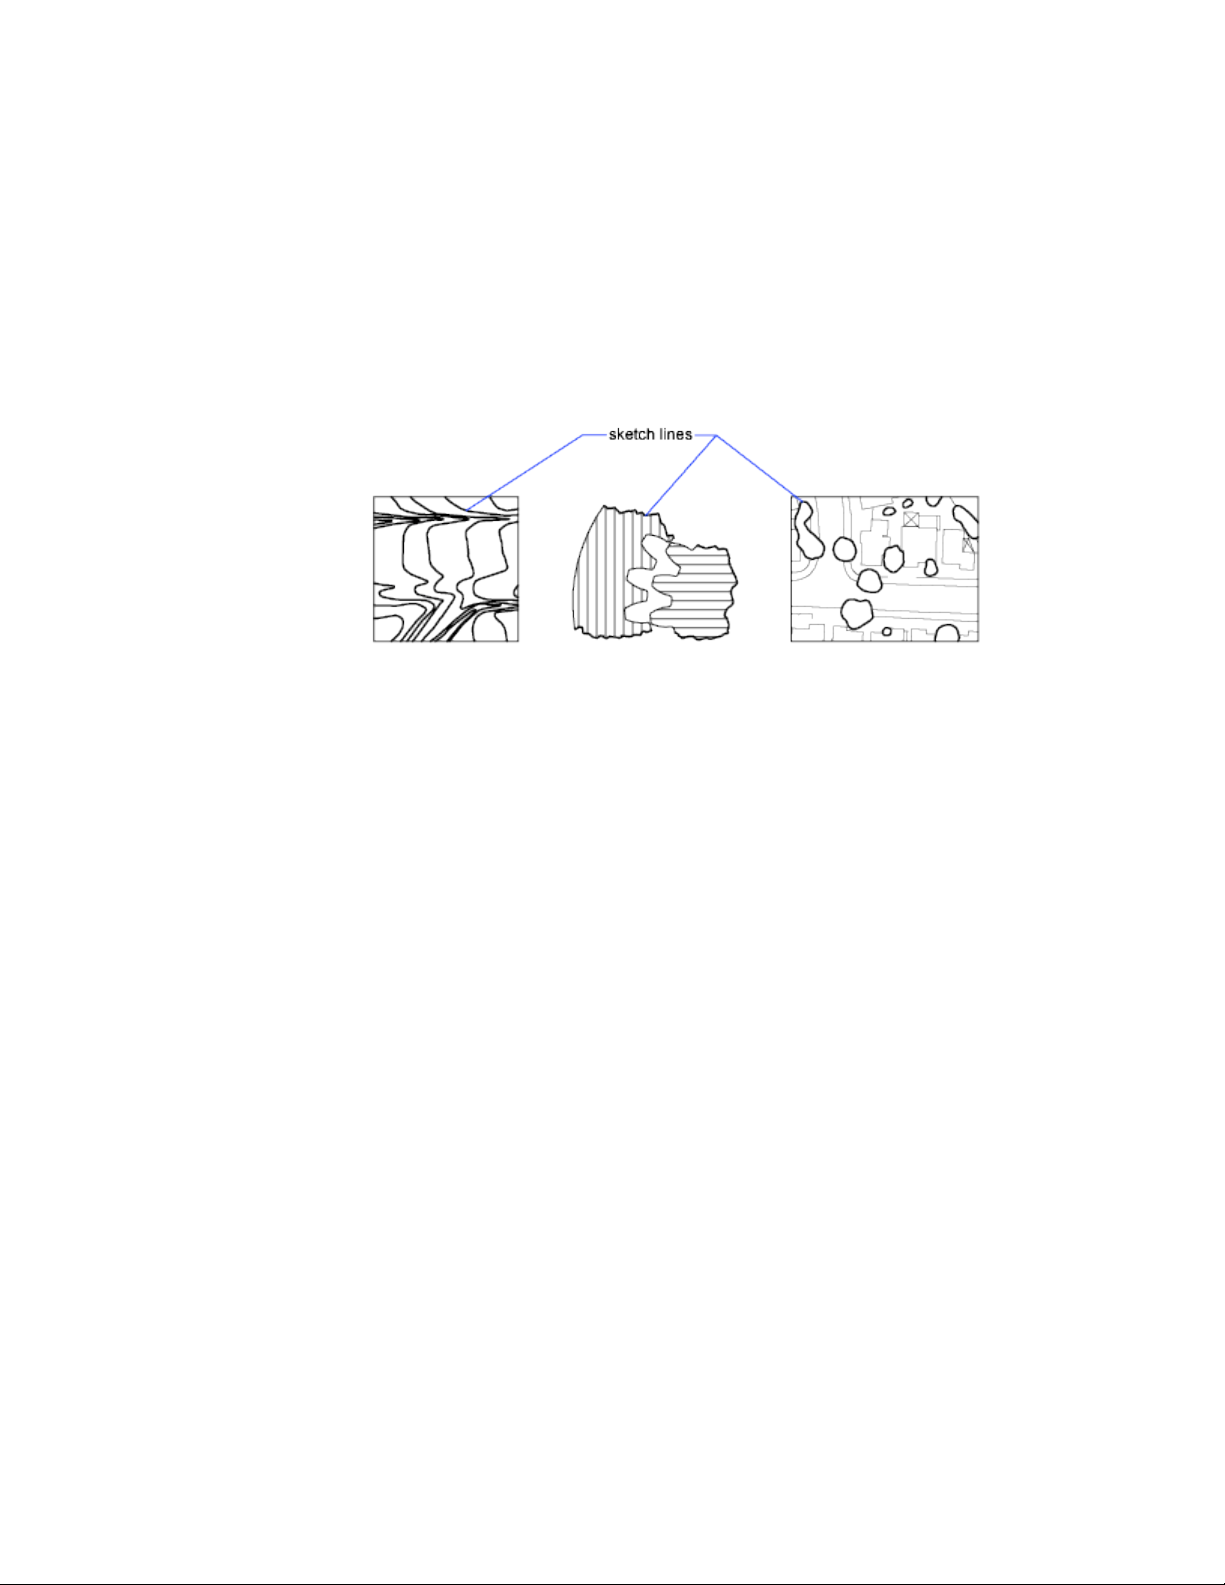
For any sketch type, set the minimum length (increment) of the line segments.
Small line segments allow greater accuracy, but they can greatly increase the
drawing file size.
Before sketching, check the CELTYPE system variable to make sure the current
linetype is BYLAYER. When you sketch with dot or dash linetypes, smaller
line segments can become invisible.
Draw Curved Objects
Curved objects are arcs, circles, polyline arcs, donuts, ellipses, and splines.
Draw Arcs
To create an arc, you can specify various combinations of center, endpoint,
start point, radius, angle, chord length, and direction values.
You can create arcs in several ways. With the exception of the first method,
arcs are drawn counterclockwise from the start point to the endpoint.
Draw Arcs by Specifying Three Points
You can create an arc by specifying three points. In the following example,
the start point of the arc snaps to the endpoint of a line. The second point of
the arc snaps to the middle circle in the illustration.
Create Objects | 201
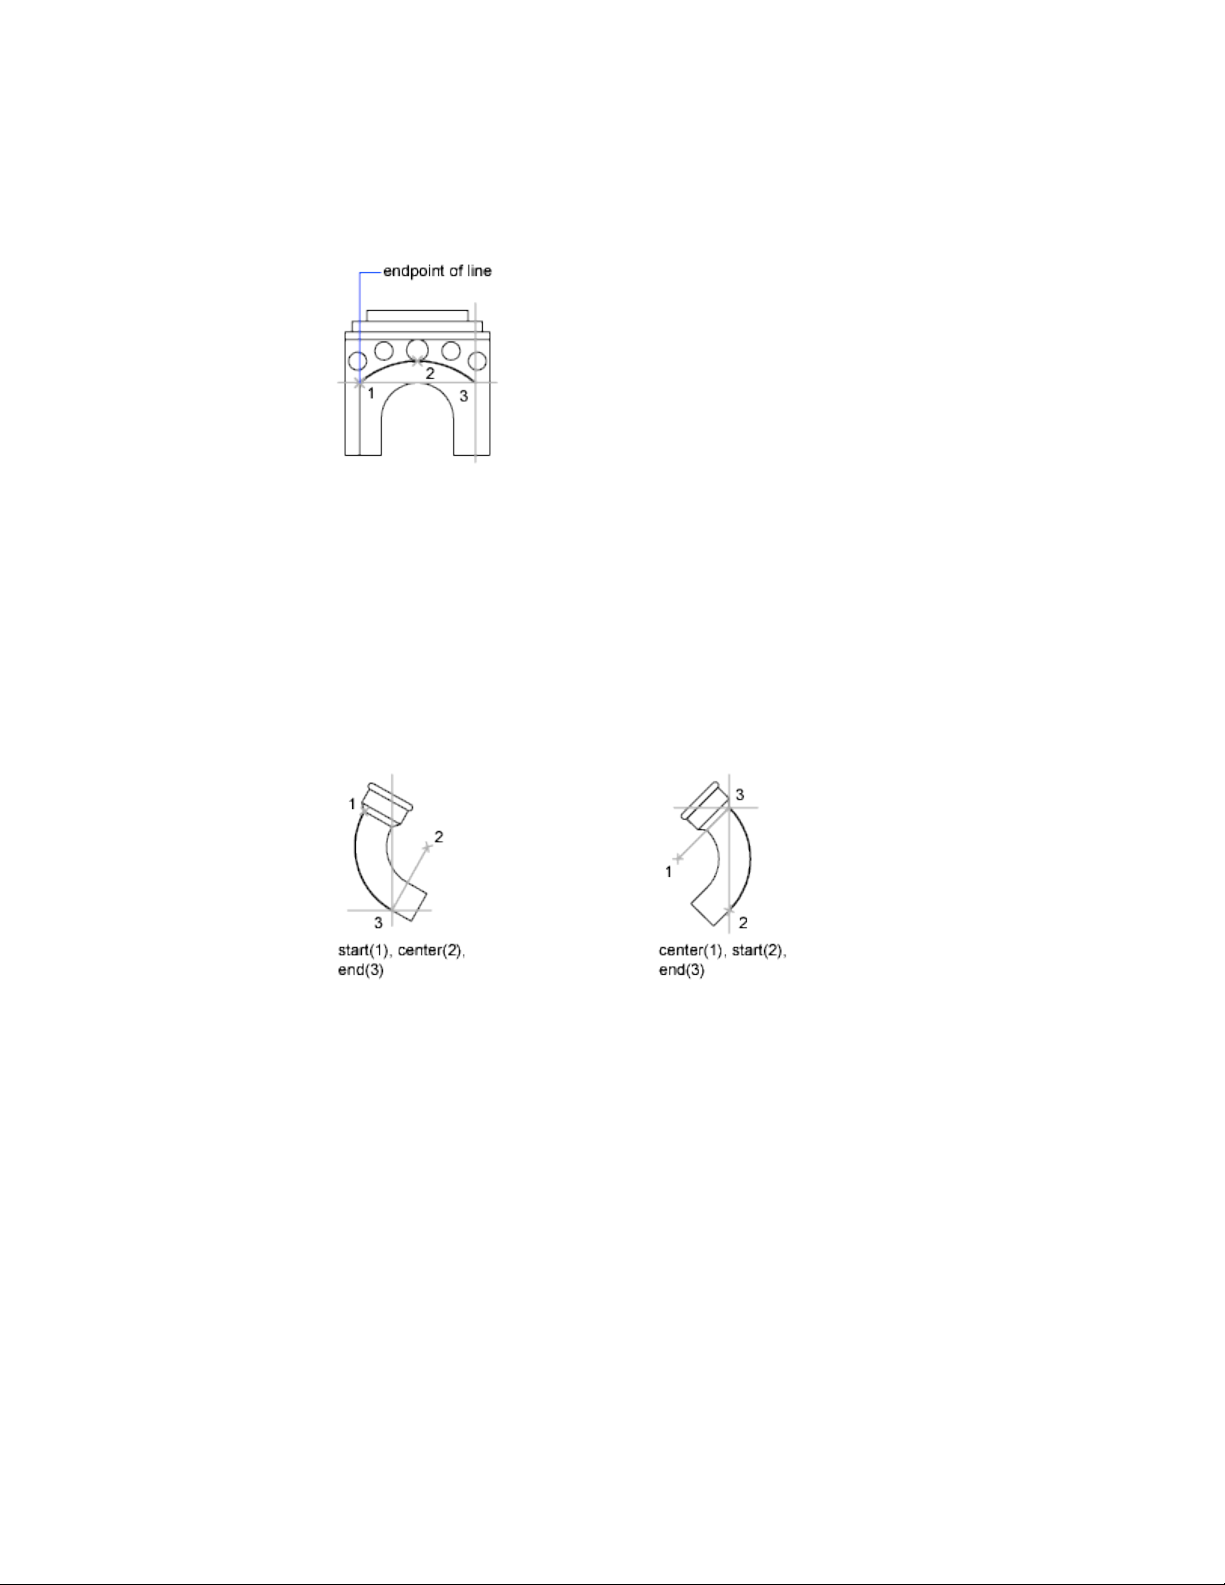
Draw Arcs by Specifying Start, Center, End
You can create an arc using a start point, center, and a third point that
determines the endpoint.
The distance between the start point and the center determines the radius.
The endpoint is determined by a line from the center that passes through the
third point. The resulting arc is always created counterclockwise from the start
point.
Using different options, you can specify either the start point first or the center
point first.
Draw Arcs by Specifying Start, Center, Angle
You can create an arc using a start point, center, and an included angle.
The distance between the start point and the center determines the radius.
The other end of the arc is determined by specifying an included angle that
uses the center of the arc as the vertex. The resulting arc is always created
counterclockwise from the start point.
Using different options, you can specify either the start point first or the center
point first.
202 | Chapter 6 Create and Modify Objects
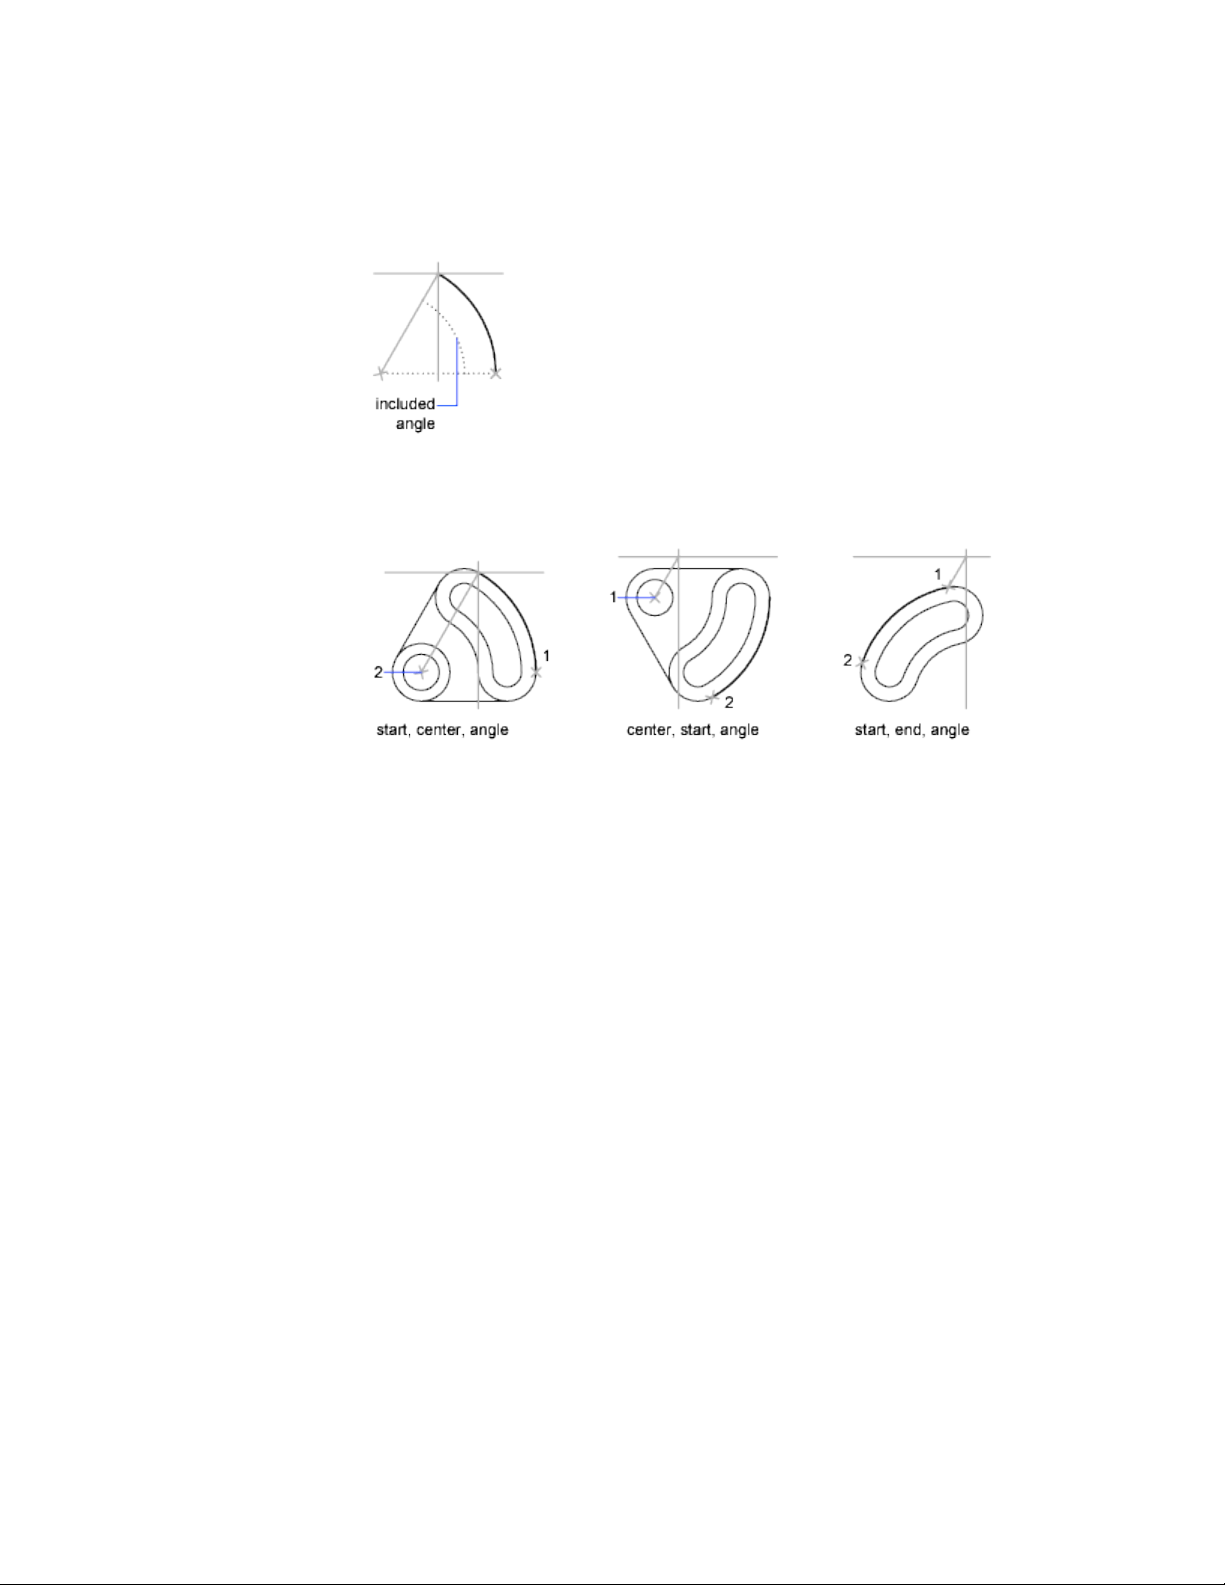
The included angle determines the endpoint of the arc. Use the Start, End,
Angle method when you know both endpoints but cannot snap to a center
point.
Draw Arcs by Specifying Start, Center, Length
You can create an arc using a start point, center, and the length of a chord.
The distance between the start point and the center determines the radius.
The other end of the arc is determined by specifying the length of a chord
between the start point and the endpoint of the arc. The resulting arc is always
created counterclockwise from the start point.
Using different options, you can specify either the start point first or the center
point first.
Create Objects | 203
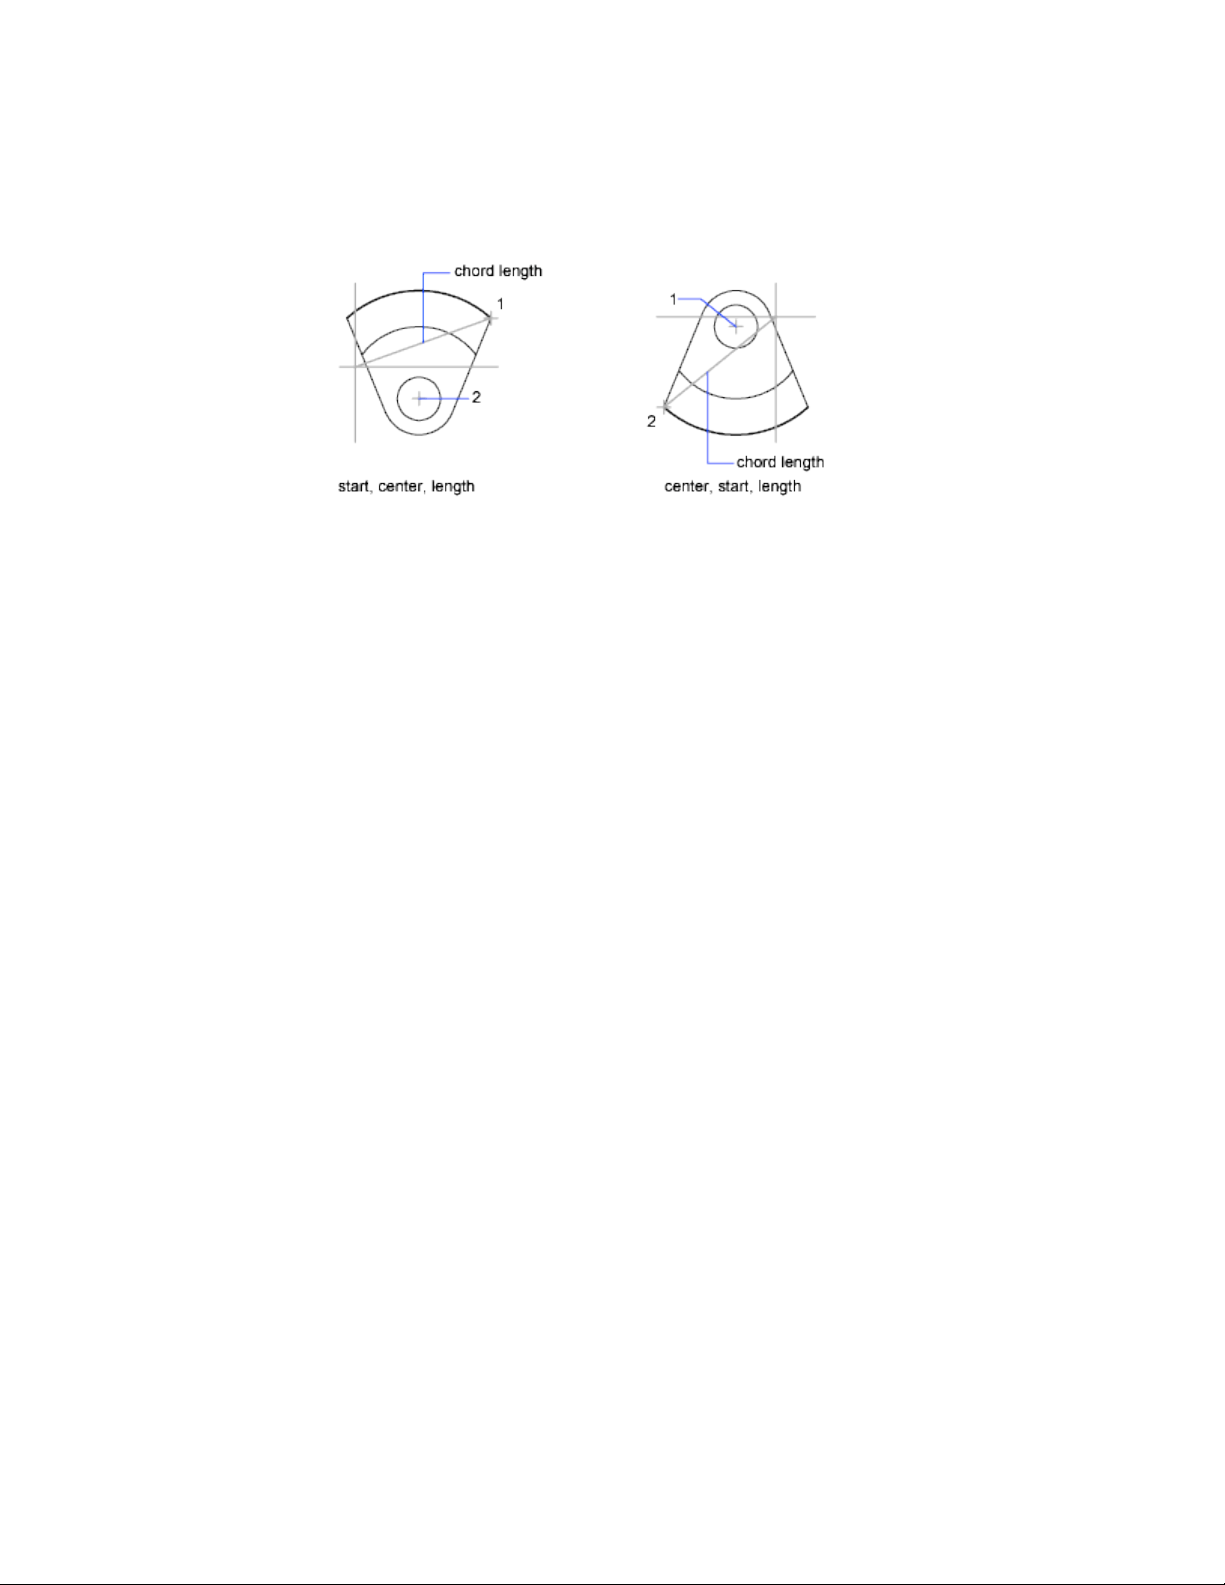
The length of the chord of the arc determines the included angle.
Draw Arcs by Specifying Start, End, Angle
You can create an arc using a start point, endpoint, and an included angle.
The included angle between the endpoints of the arc determines the center
and the radius of the arc.
Draw Arcs by Specifying Start, End, Direction
You can create an arc using a start point, endpoint, and a tangent direction
at the start point.
The tangent direction can be specified either by locating a point on the desired
tangent line, or by entering an angle. You can determine which endpoint
controls the tangent by changing the order in which you specify the two
endpoints.
Draw Arcs by Specifying Start, End, Radius
You can create an arc using a start point, endpoint, and a radius.
The direction of the bulge of the arc is determined by the order in which you
specify its endpoints. You can specify the radius either by entering it or by
specifying a point at the desired radius distance.
204 | Chapter 6 Create and Modify Objects
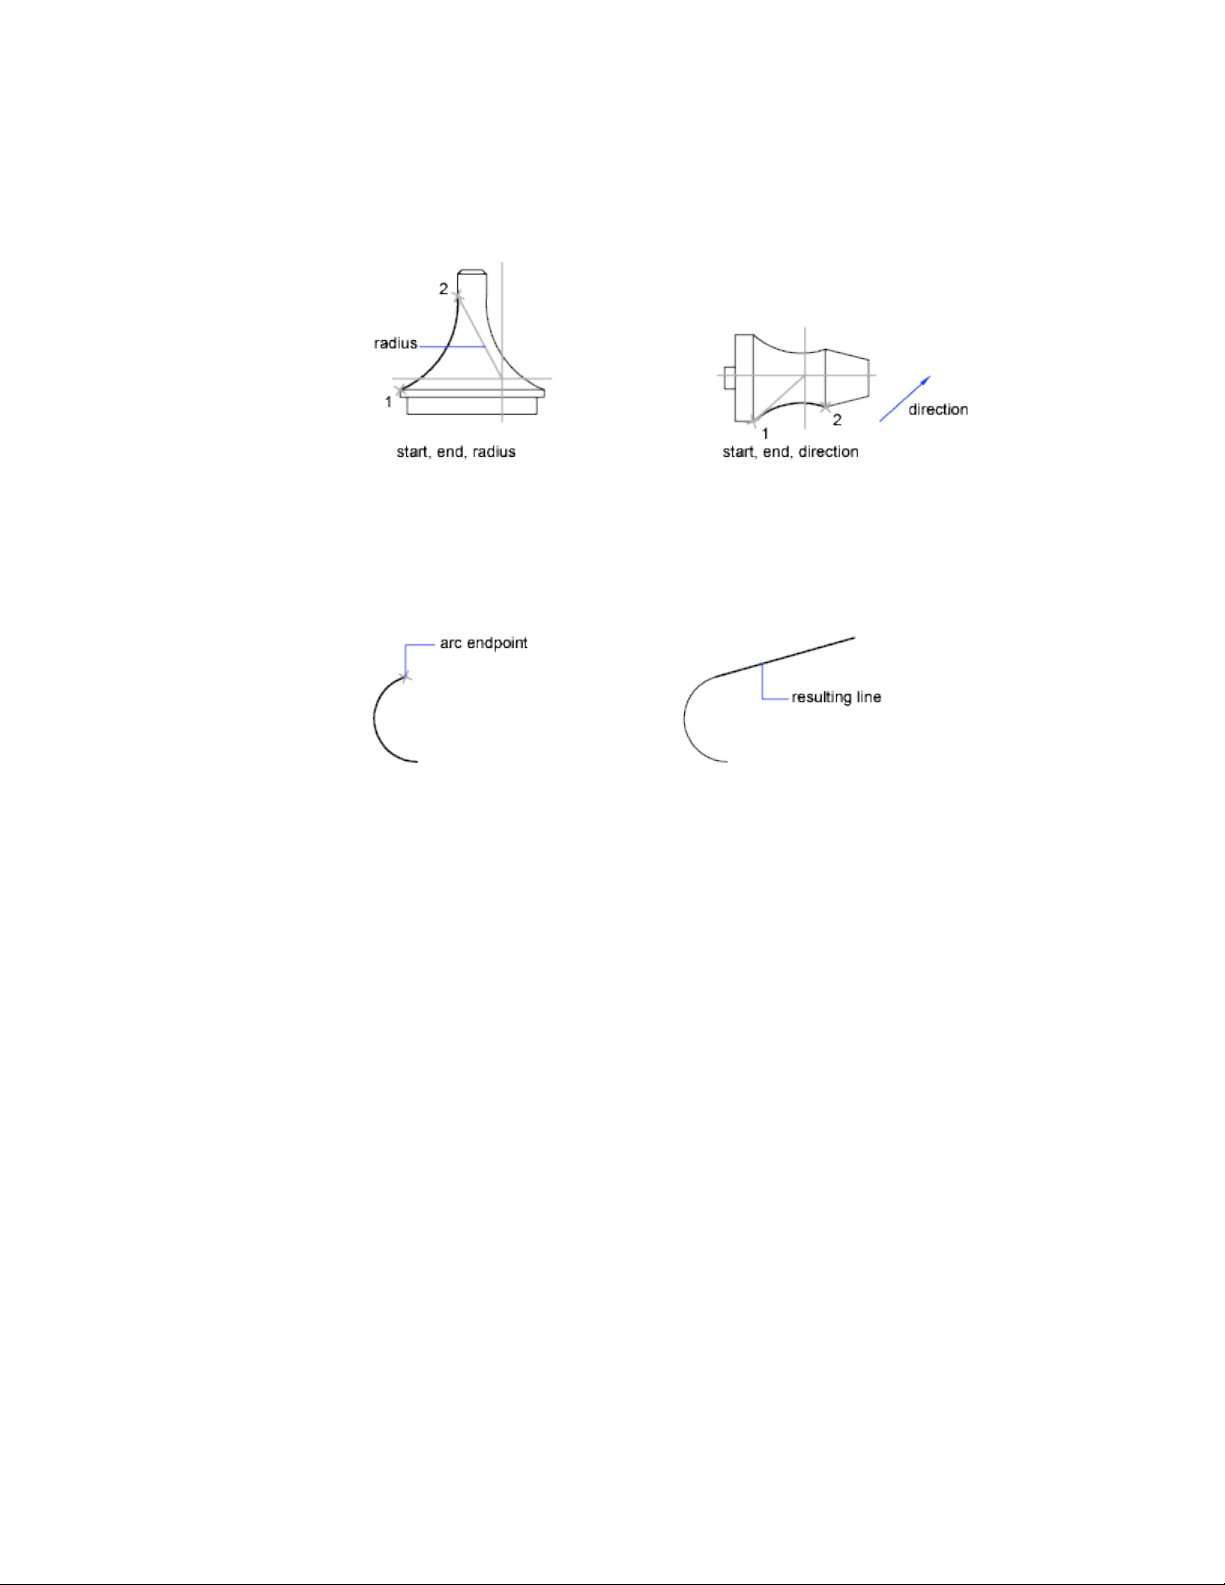
Draw Contiguous Tangent Arcs and Lines
Immediately after you create an arc, you can start a line that is tangent to the
arc at an endpoint by starting the LINE command and pressing Enter at the
Specify First Point prompt. You need to specify only the line length.
Immediately after you create a line or an arc, you can start an arc that is
tangent at an endpoint by starting the ARC command and pressing Enter at
the Specify Start Point prompt. You need to specify only the endpoint of the
new arc.
See also:
Draw Polylines (page 196)
Break and Join Objects (page 270)
Draw Circles
To create circles, you can specify various combinations of center, radius,
diameter, points on the circumference, and points on other objects.
You can create circles in several ways. The default method is to specify the
center and the radius. Three other ways to draw a circle are shown in the
illustration.
Create Objects | 205
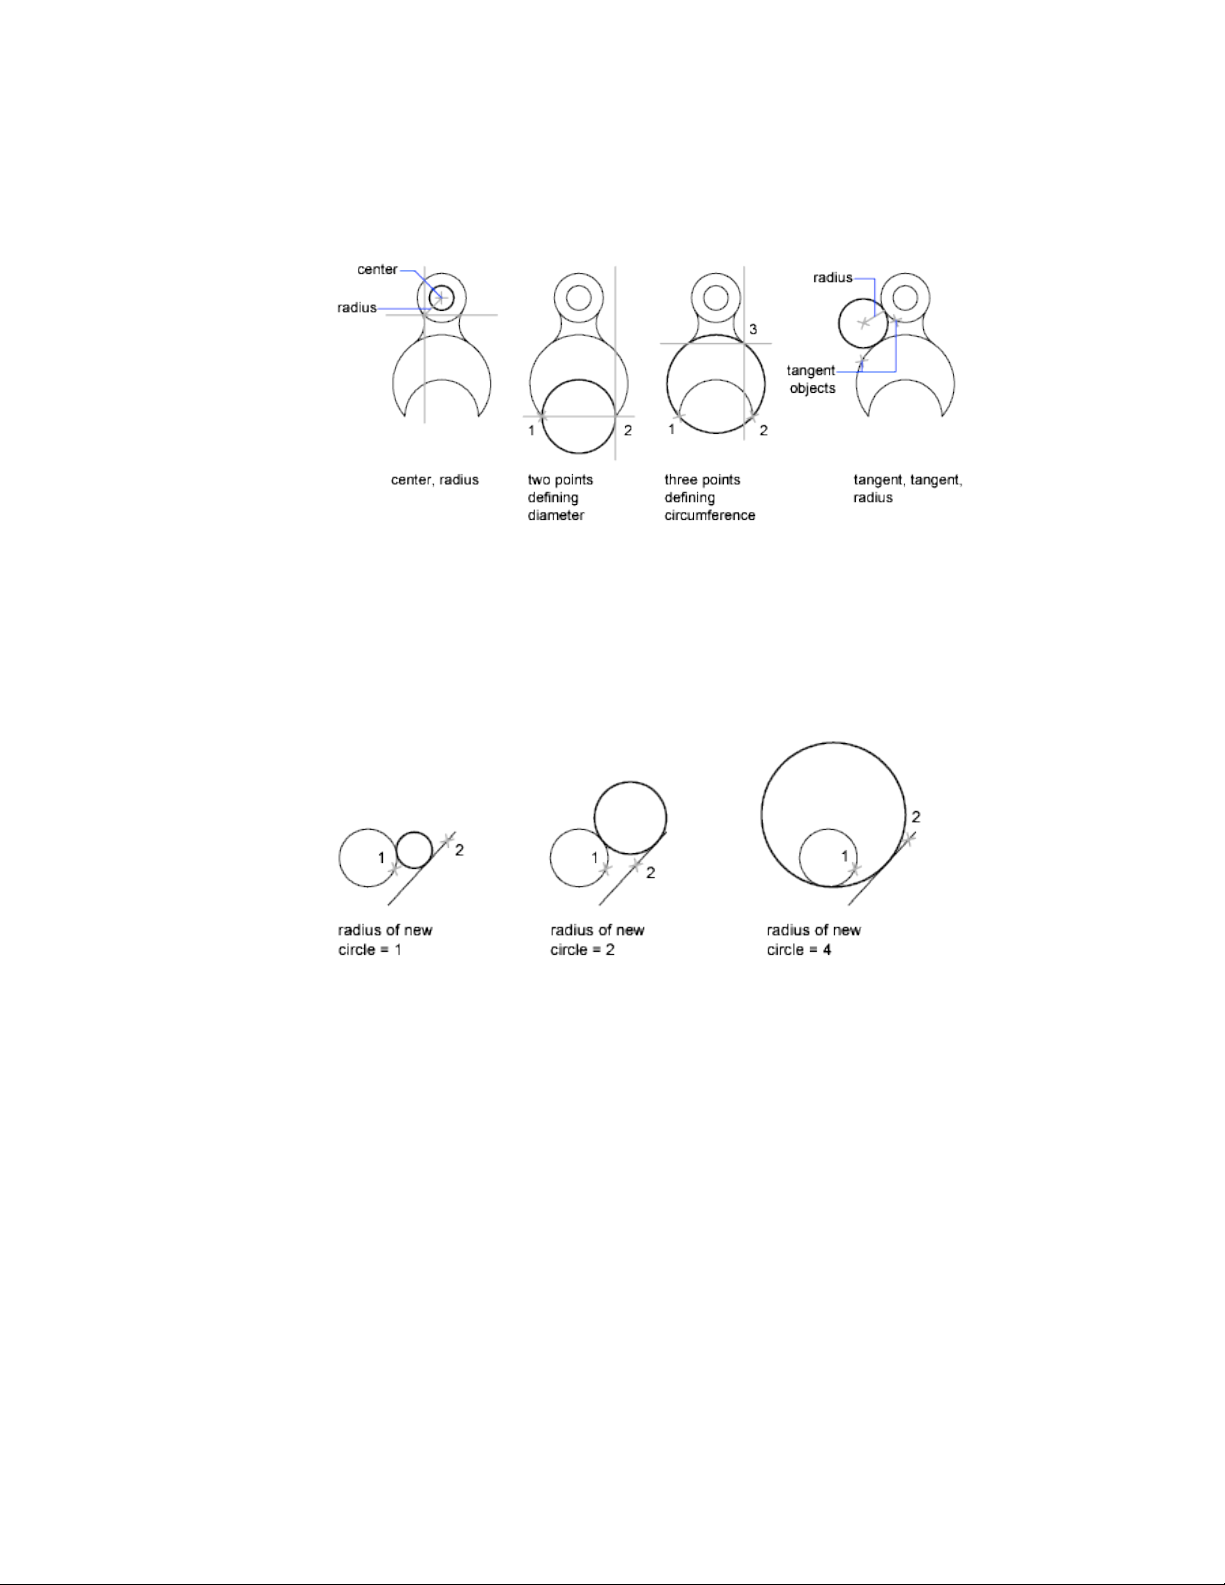
Draw a Circle Tangent to Other Objects
The tangent point is a point where an object touches another object without
intersecting it. To create a circle that is tangent to other objects, select the
objects and then specify the radius of the circle. In the illustrations below,
the bold circle is the one being drawn, and points 1 and 2 select the objects
to which it is tangent.
To create a circle tangent at three points, set running object snaps (OSNAP)
to Tangent and use the three-point method to create the circle.
See also:
Use Object Snaps (page 169)
Draw Isometric Circles (page 712)
206 | Chapter 6 Create and Modify Objects
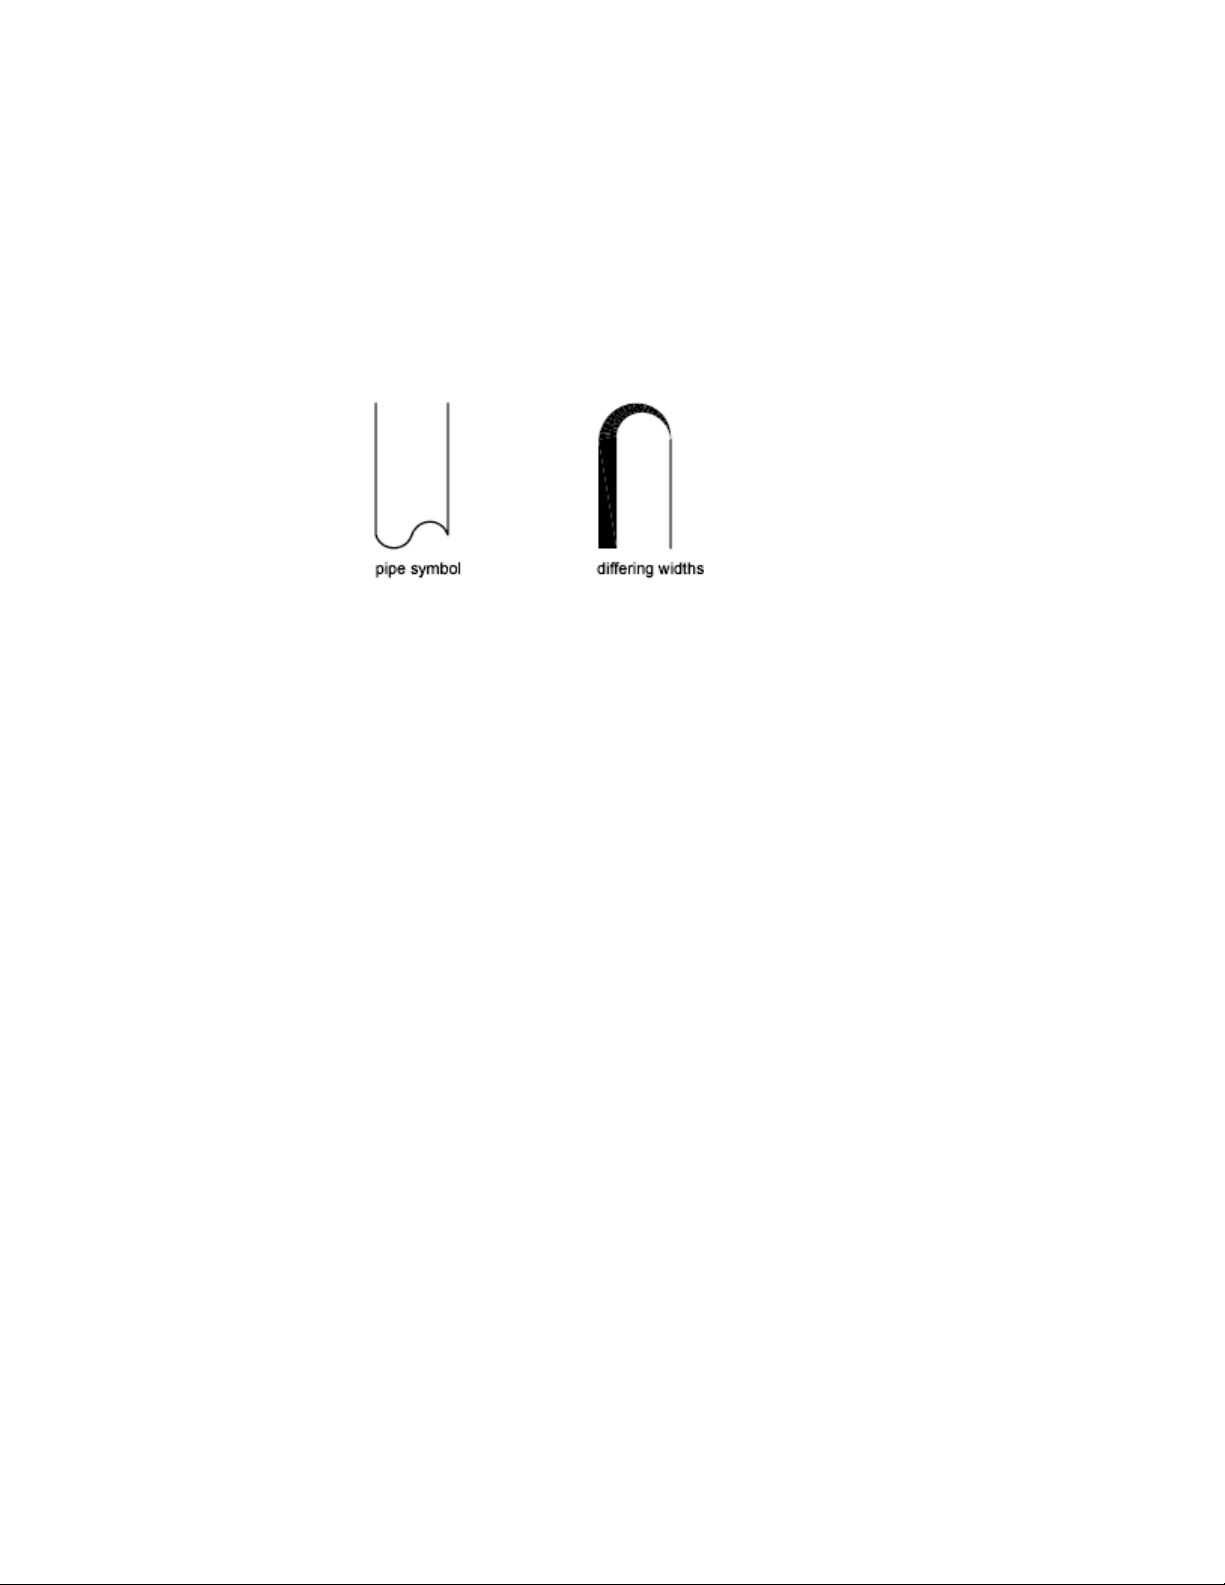
Draw Polyline Arcs
A polyline is a connected sequence of line segments created as a single object.
You can create straight line segments, arc segments, or a combination of the
two.
Multisegmented lines provide editing capabilities unavailable for single lines.
For example, you can adjust their width and curvature. After you've created
a polyline, you can edit it with PEDIT or use EXPLODE to convert it to
individual line and arc segments. You can
■ Convert a spline-fit polyline into a true spline with SPLINE
■ Use closed polylines to create a polygon
■ Create a polyline from the boundaries of overlapping objects
Create Arc Polylines
When you draw arc segments in a polyline, the first point of the arc is the
endpoint of the previous segment. You can specify the angle, center point,
direction, or radius of the arc. You can also complete the arc by specifying a
second point and an endpoint.
Create Closed Polylines
You can draw a closed polyline to create a polygon. To close a polyline, specify
the starting point of the last side of the object, enter c (Close), and press Enter.
Create Wide Polylines
You can draw polylines of various widths by using the Width and Halfwidth
options. You can set the width of individual segments and make them taper
gradually from one width to another. These options become available after
you specify a starting point for the polyline.
Create Objects | 207
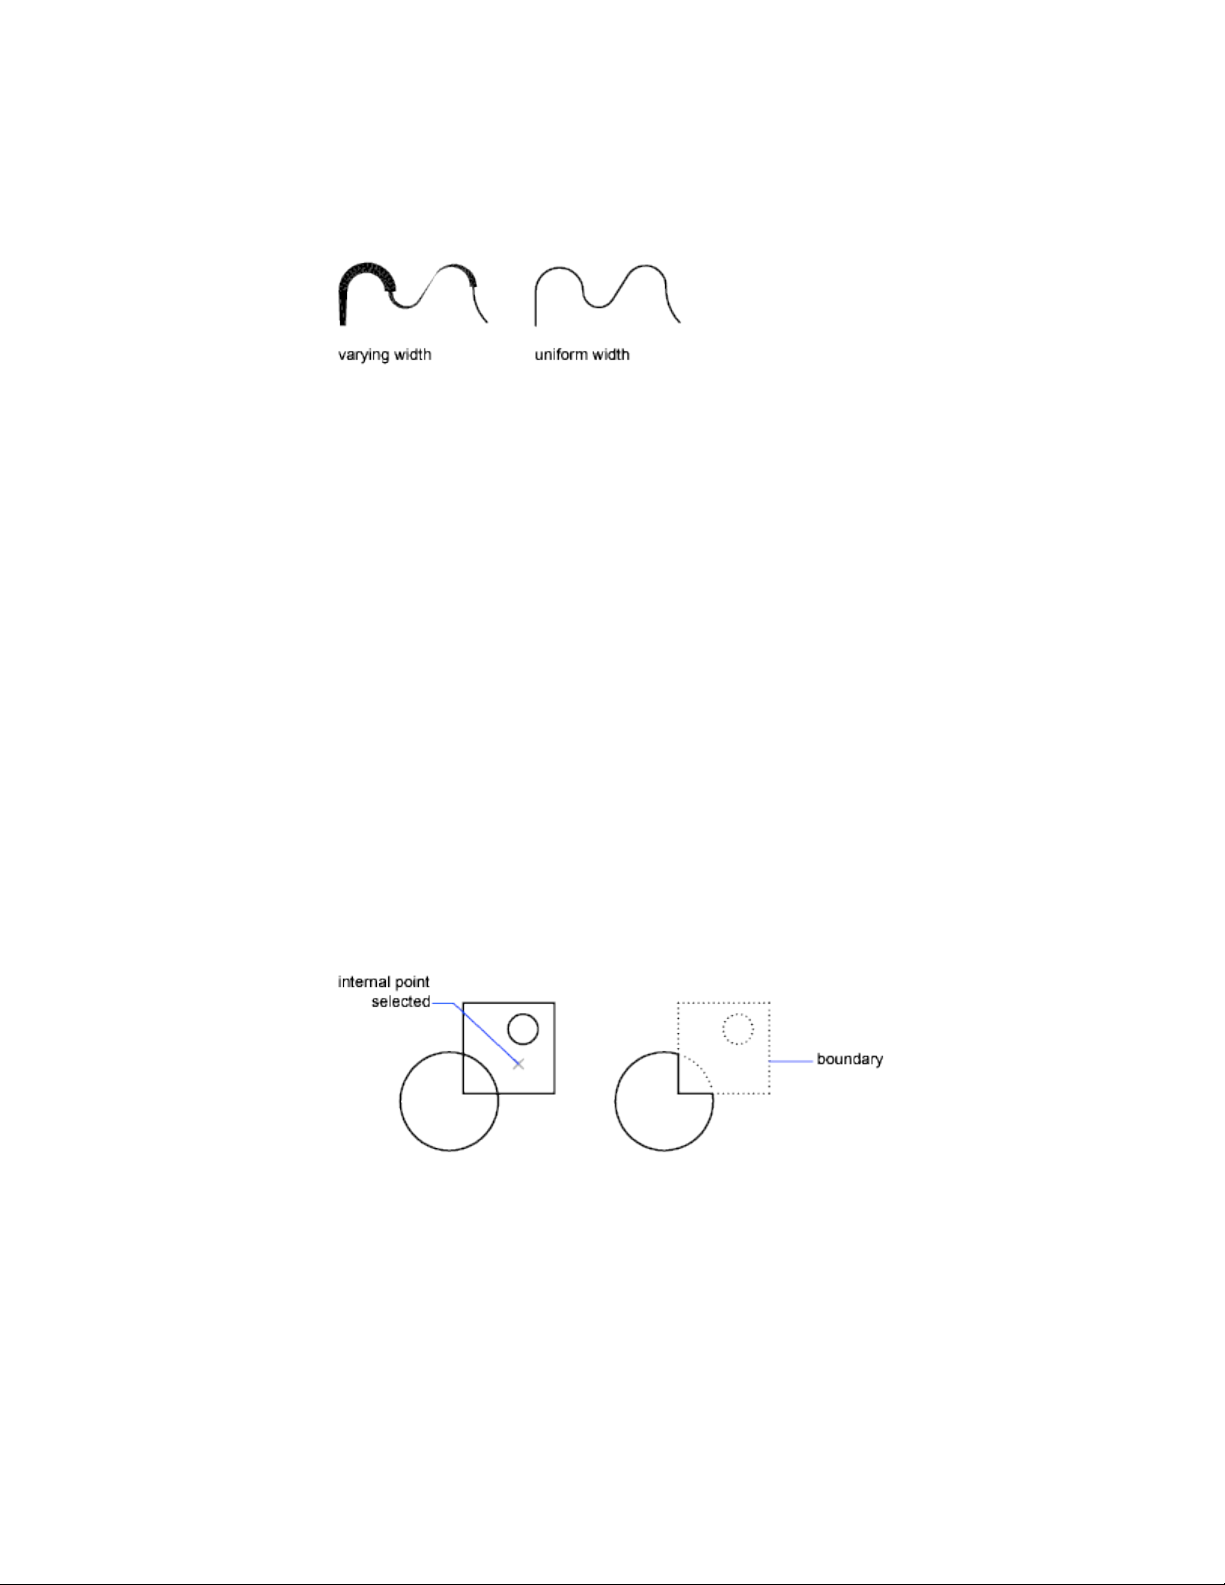
The Width and Halfwidth options set the width of the next polyline segments
you draw. Zero (0) width produces a thin line. Widths greater than zero
produce wide lines, which are filled if Fill mode is on and outlined if Fill mode
is off. The Halfwidth option sets width by specifying the distance from the
center of the wide polyline to an outside edge.
Taper
When you use the Width option, you are prompted for both a starting and
an ending width. By entering different values, you can taper the polyline. The
starting and ending points of wide polyline segments are in the center of the
line. Intersections of adjacent wide segments are usually beveled. However,
nontangent arc segments, acute angles, or segments that use a dash-dot
linetype are not beveled.
Create Polylines from the Boundaries of Objects
You can create a polyline from the boundaries of overlapping objects that
form a closed area. A polyline created using the boundary method is a separate
object, distinct from the objects used to create it. You can edit it using the
same methods used to edit other polylines.
To expedite the boundary selection process in large or complex drawings, you
can specify a group of boundary candidates, called a boundary set. You create
this set by selecting the objects you want to use to define the boundary.
See also:
Modify Splines (page 274)
208 | Chapter 6 Create and Modify Objects
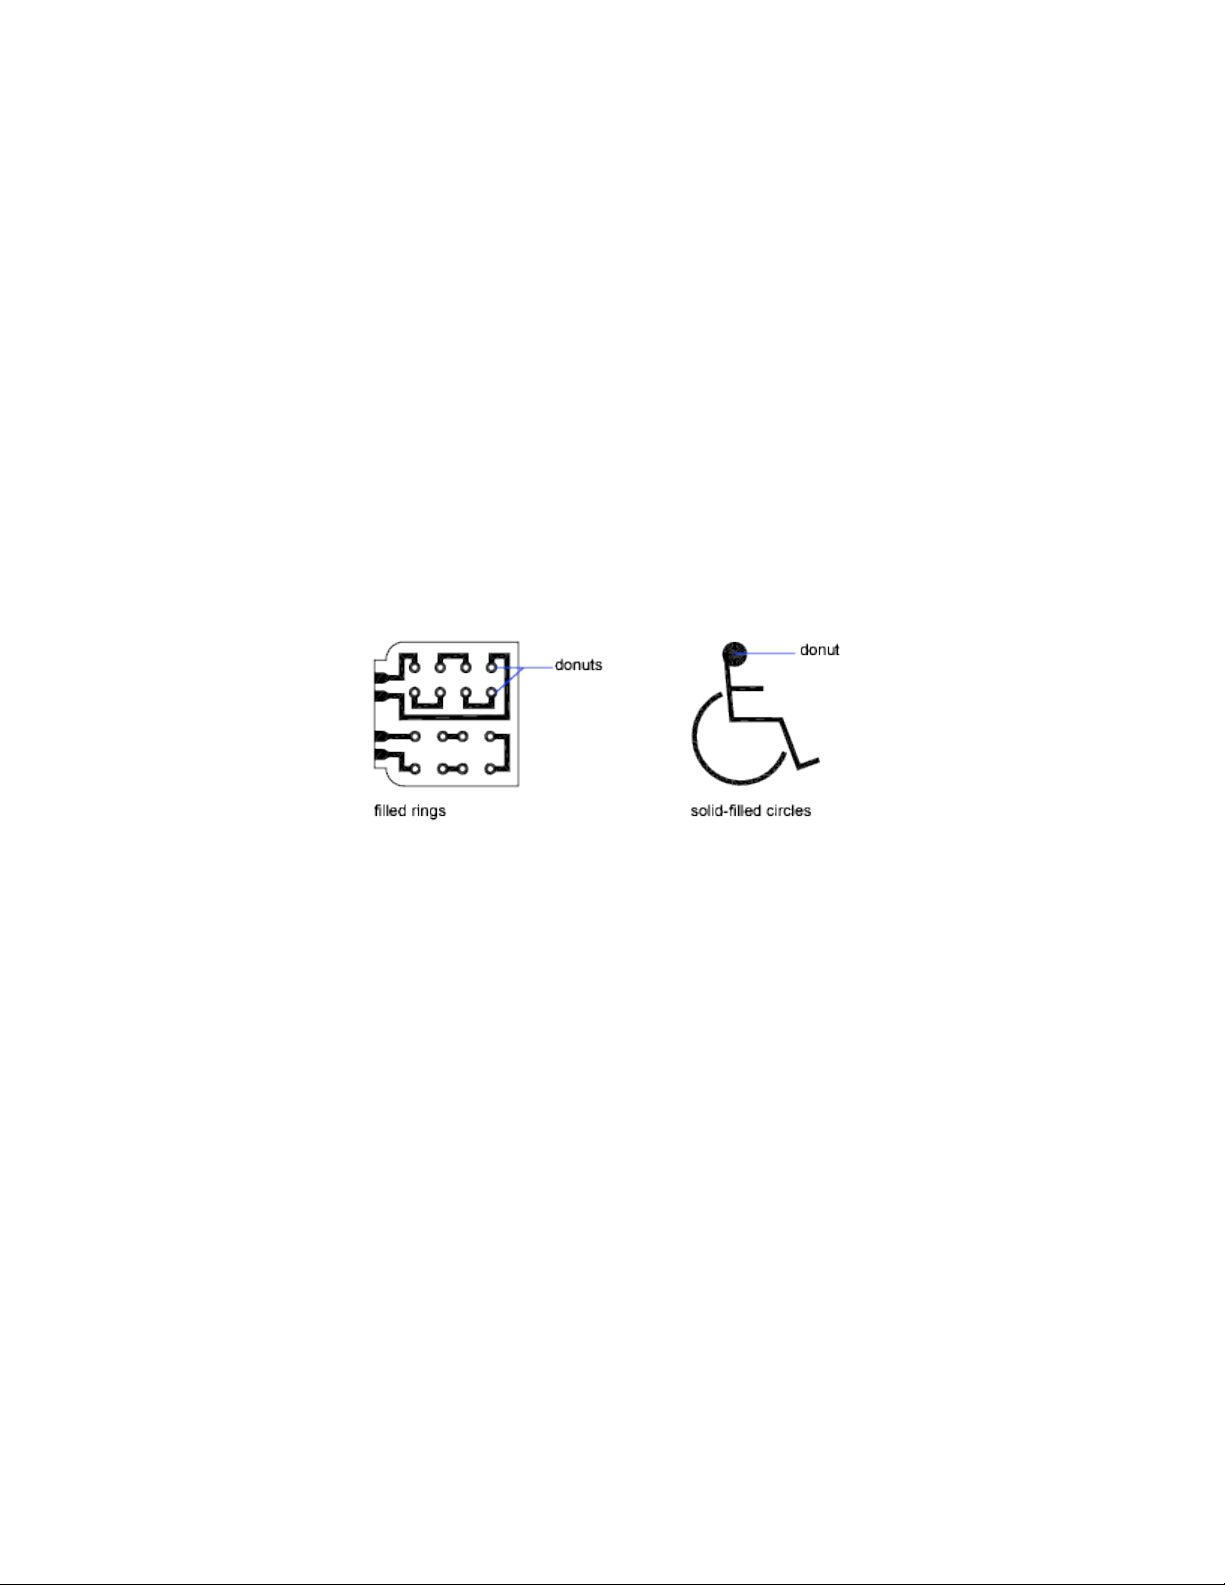
Modify Polylines (page 272)
Break and Join Objects (page 270)
Control Lineweights (page 141)
Infer Geometric Constraints (page 293)
Draw Donuts
Donuts are filled rings or solid-filled circles that actually are closed polylines
with width.
To create a donut, you specify its inside and outside diameters and its center.
You can continue creating multiple copies with the same diameter by
specifying different center points. To create solid-filled circles, specify an inside
diameter of 0.
Draw Ellipses
The shape of an ellipse is determined by two axes that define its length and
width. The longer axis is called the major axis, and the shorter one is the
minor axis.
Create Objects | 209
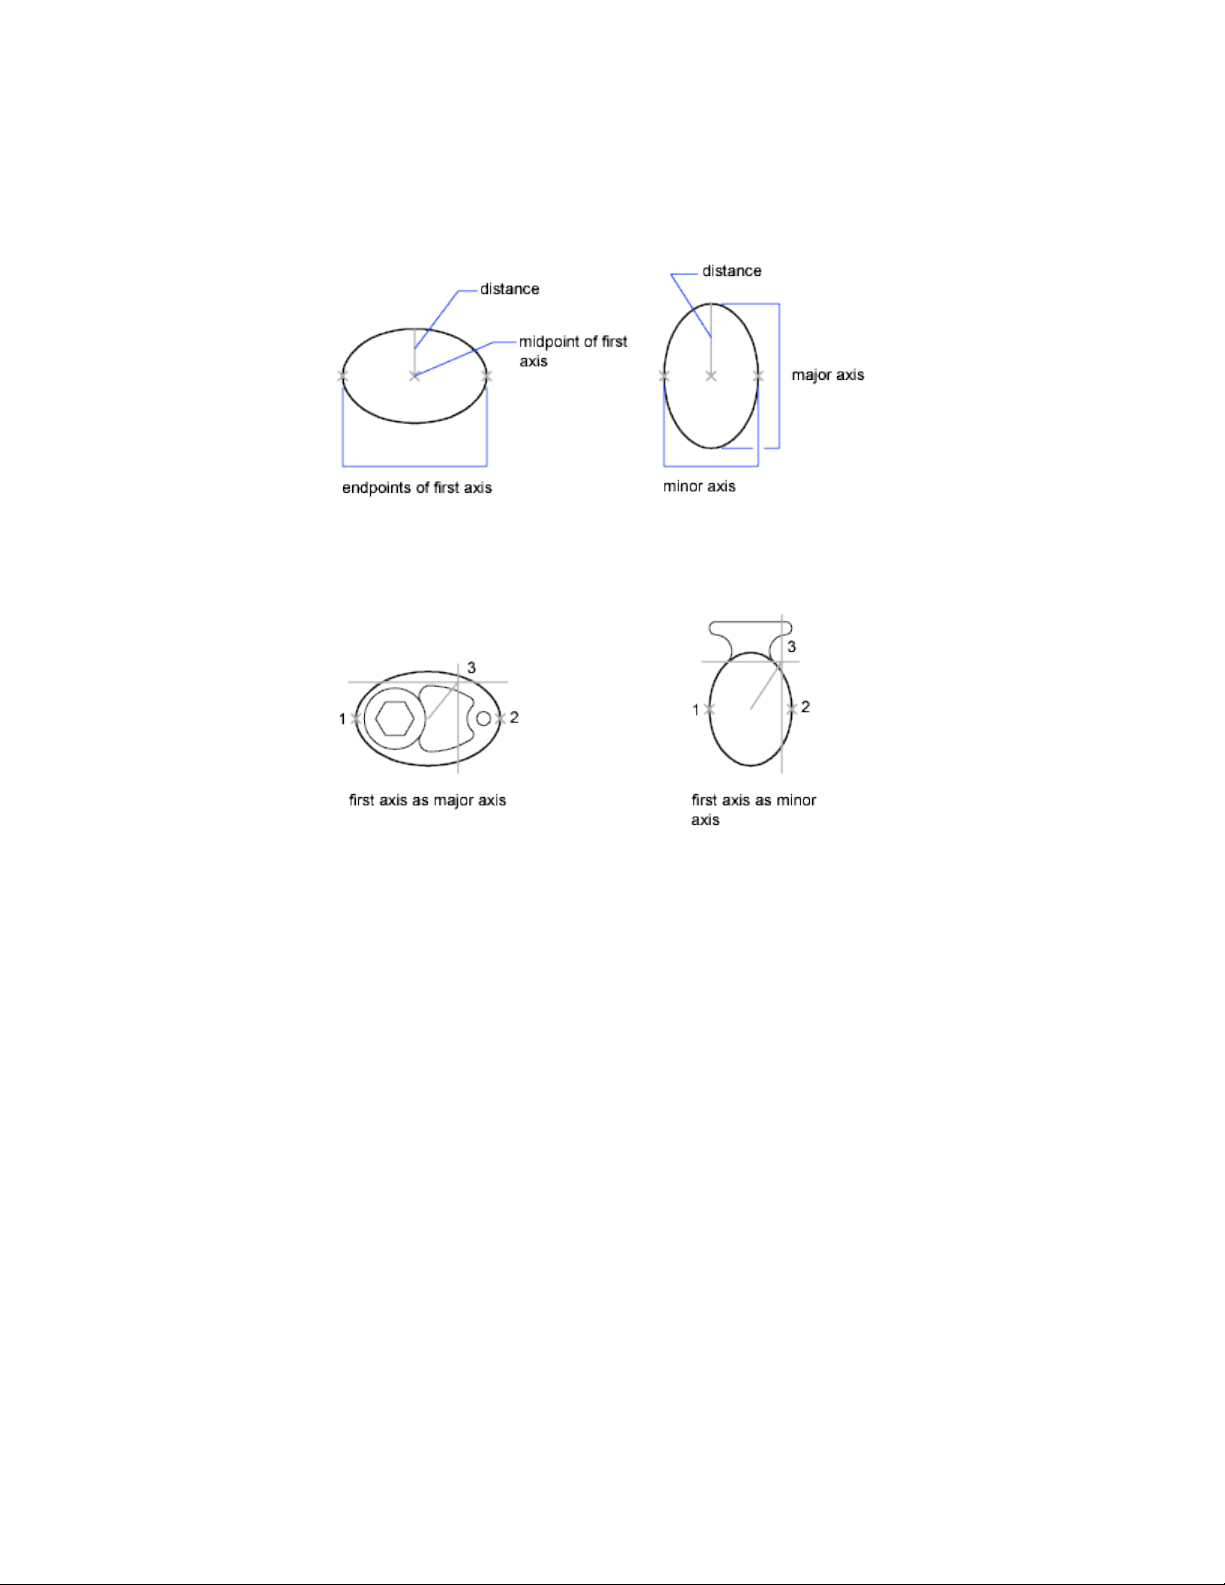
The illustrations below show two different ellipses created by specifying axis
and distance. The third point specifies only a distance and does not necessarily
designate the axis endpoint.
If you are drawing on isometric planes to simulate 3D, you can use ellipses to
represent isometric circles viewed from an oblique angle. First you need to
turn on Isometric Snap in the Drafting Settings dialog box (DSETTINGS
command).
See also:
Draw Isometric Circles (page 712)
Break and Join Objects (page 270)
Draw Splines
A spline is a smooth curve that passes through or near a set of points that
influence the shape of the curve.
210 | Chapter 6 Create and Modify Objects
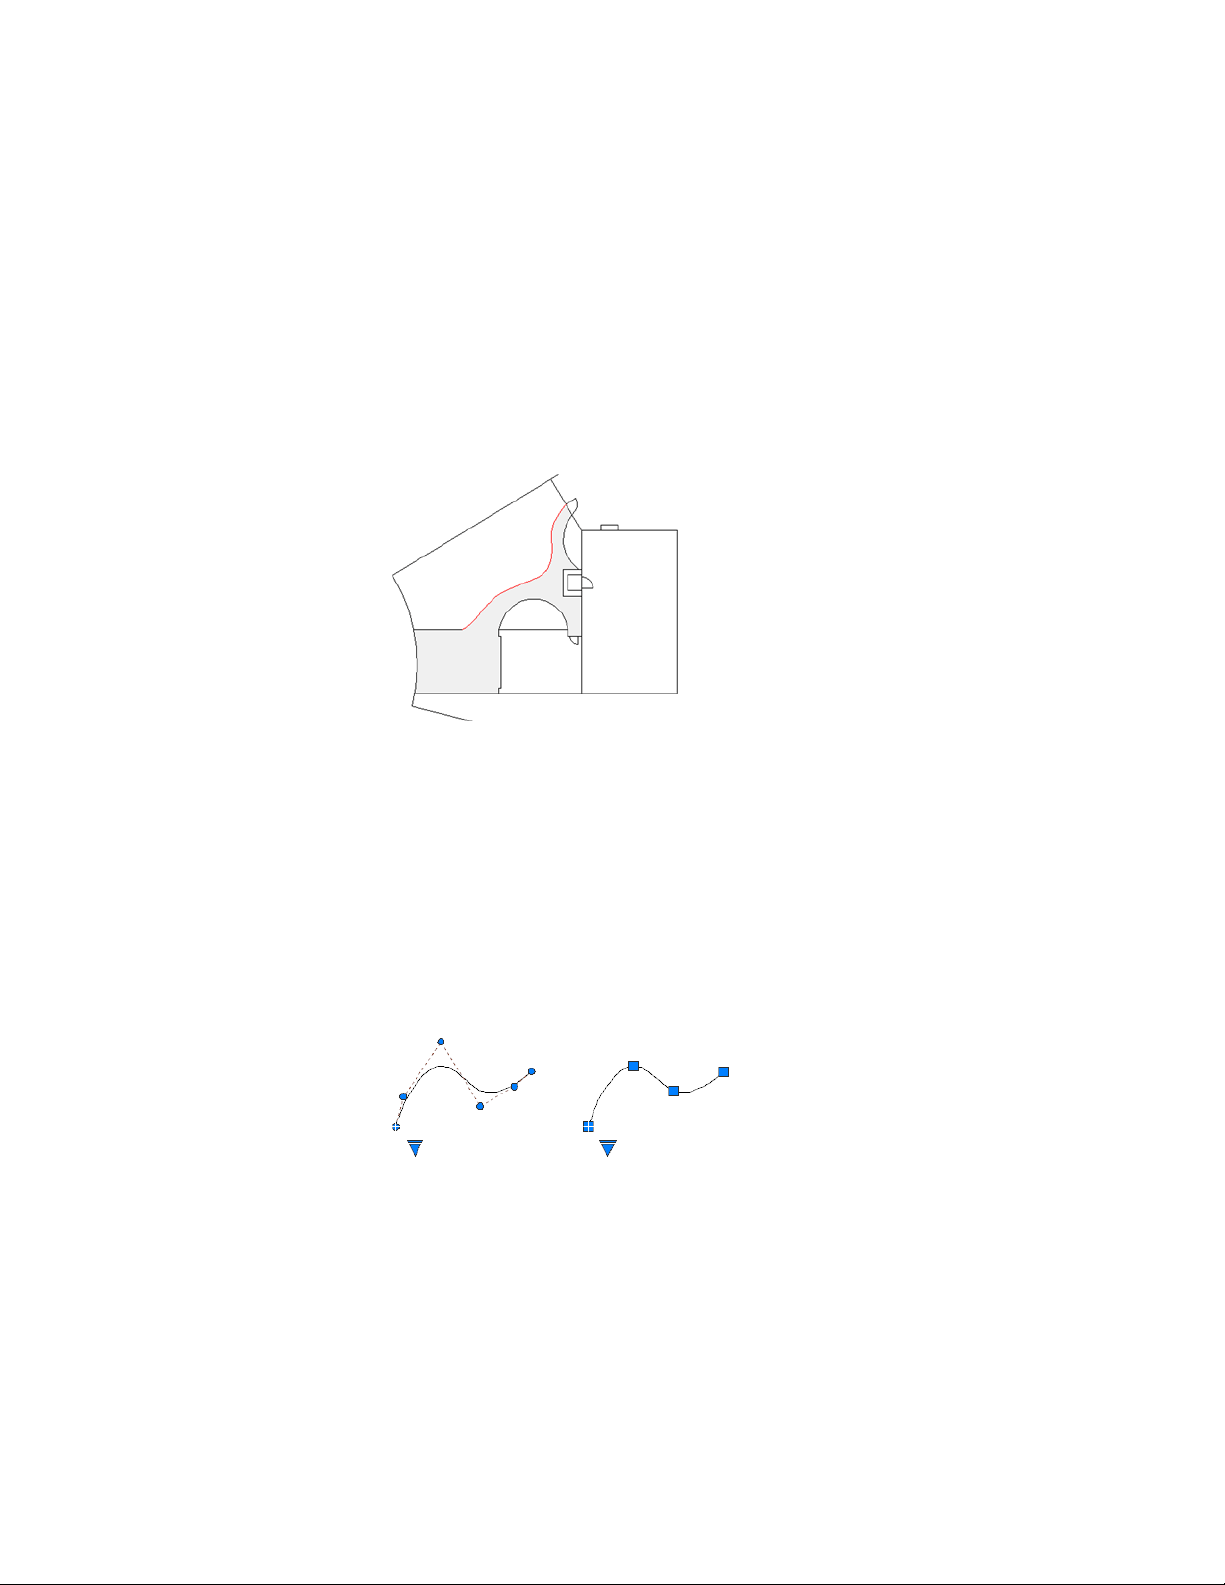
SPLINE and BLEND create curves called nonuniform rational B-splines (NURBS),
referred to as splines for simplicity.
By default, a spline is a series of blended curve segments of degree 3 (also
called cubic) polynomials. Cubic splines are the most common, and mimic
the splines that are created manually using flexible strips that are shaped by
weights at data points.
In the following example, SPLINE was used to create the highlighted boundary
of the concrete walkway.
BLEND was used to create splines between lines and arcs for a golf course
design. The resulting splines are tangent to the selected lines and curves
without changing the lengths of the selected objects.
Splines are also used for creating solids and surfaces for 3D modeling. For more
information, see Create Solids and Surfaces from Lines and Curves (page 342).
Understand Control Vertices and Fit Points
You can create or edit splines using either control vertices, or fit points. The
spline on the left displays control vertices along a control polygon, and the
spline on the right displays fit points.
The options available in SPLINE depend on which method is used to create
the spline.
Create Objects | 211
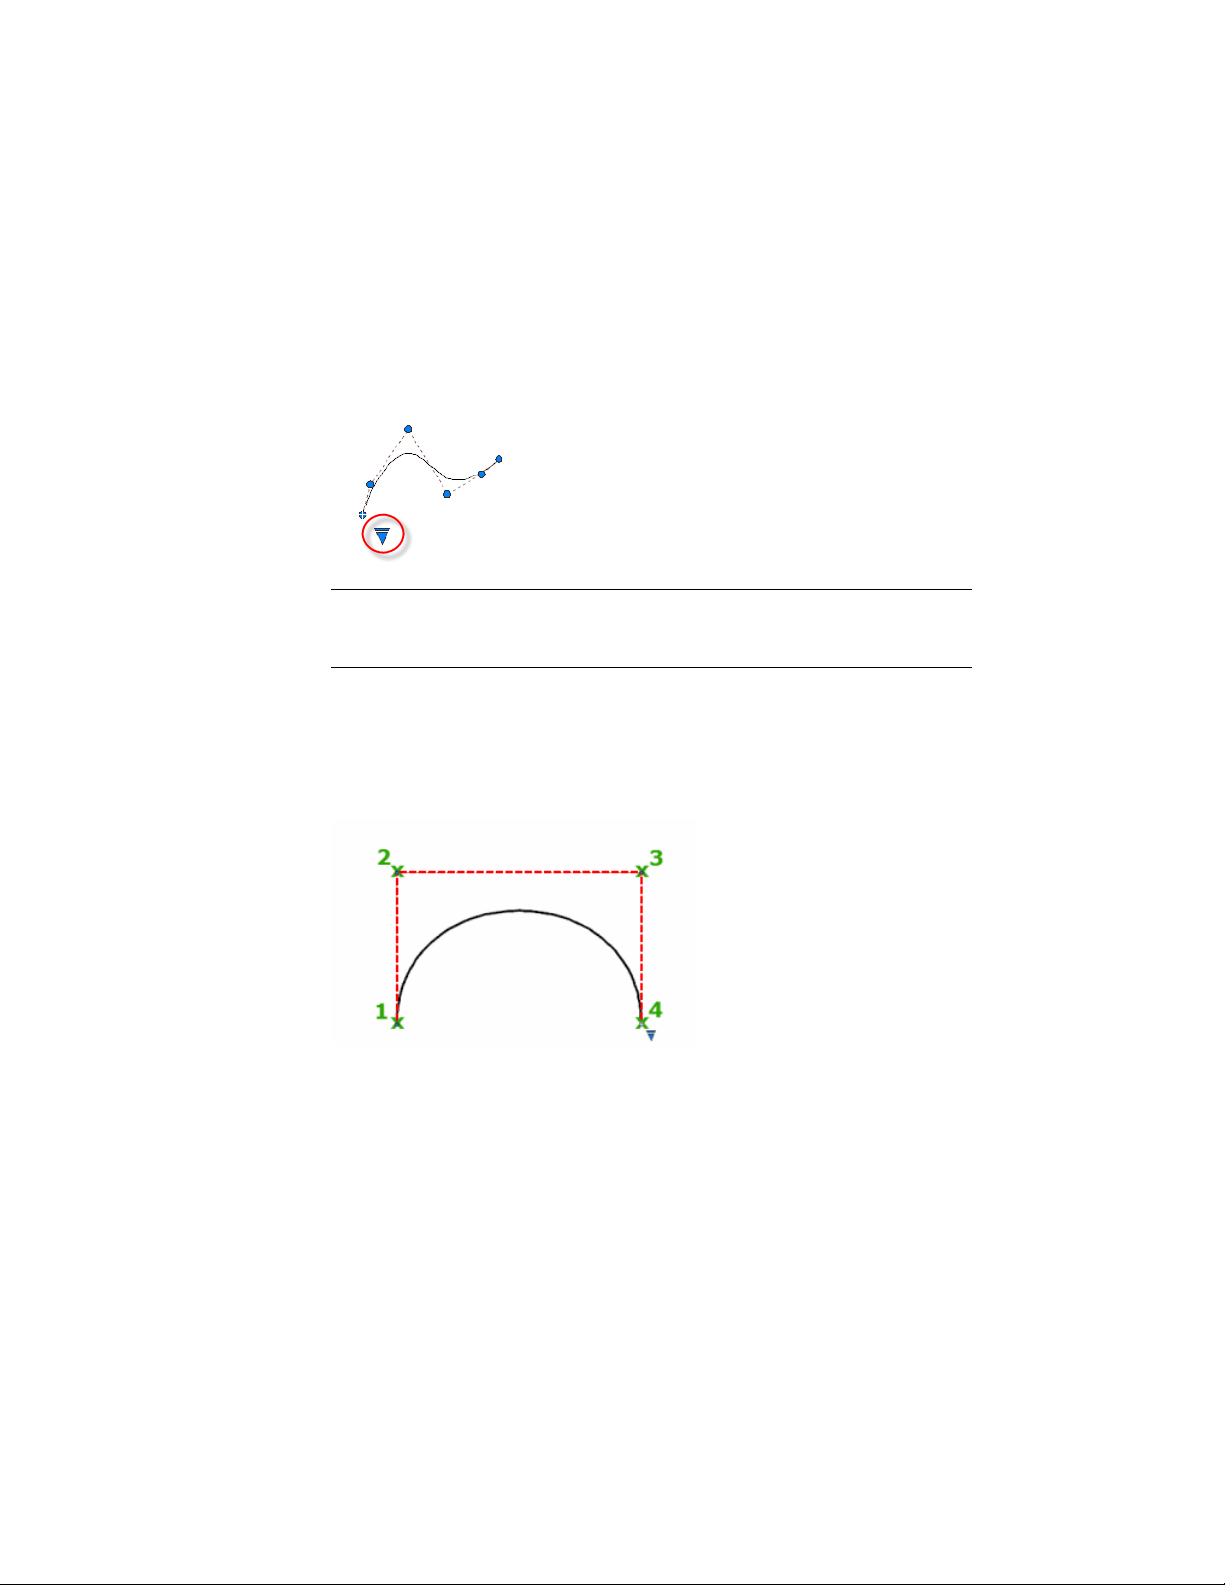
CVSHOW and CVHIDE determine whether the control vertices are displayed
on a spline even when the spline is not selected.
Use the triangular grip on a selected spline to switch between displaying
control vertices and displaying fit points. You can use the round and square
grips to modify a selected spline. For more information, see Modify Splines
(page 274).
IMPORTANT Switching the display from control vertices to fit points automatically
changes the selected spline to degree 3. Splines originally created using
higher-degree equations will likely change shape as a result.
Create Splines Using Control Vertices
When you create splines using control vertices, the points you specify display
temporary lines between them, forming a control polygon that determines
the shape of the spline.
The advantage of changing the shape of a spline using control vertices is the
fine control this method provides. With this method, you can also specify
lower or higher degree polynomials, including degree 1 (linear), degree 2
(quadratic), degree 3 (cubic), and so on up to degree 10.
212 | Chapter 6 Create and Modify Objects
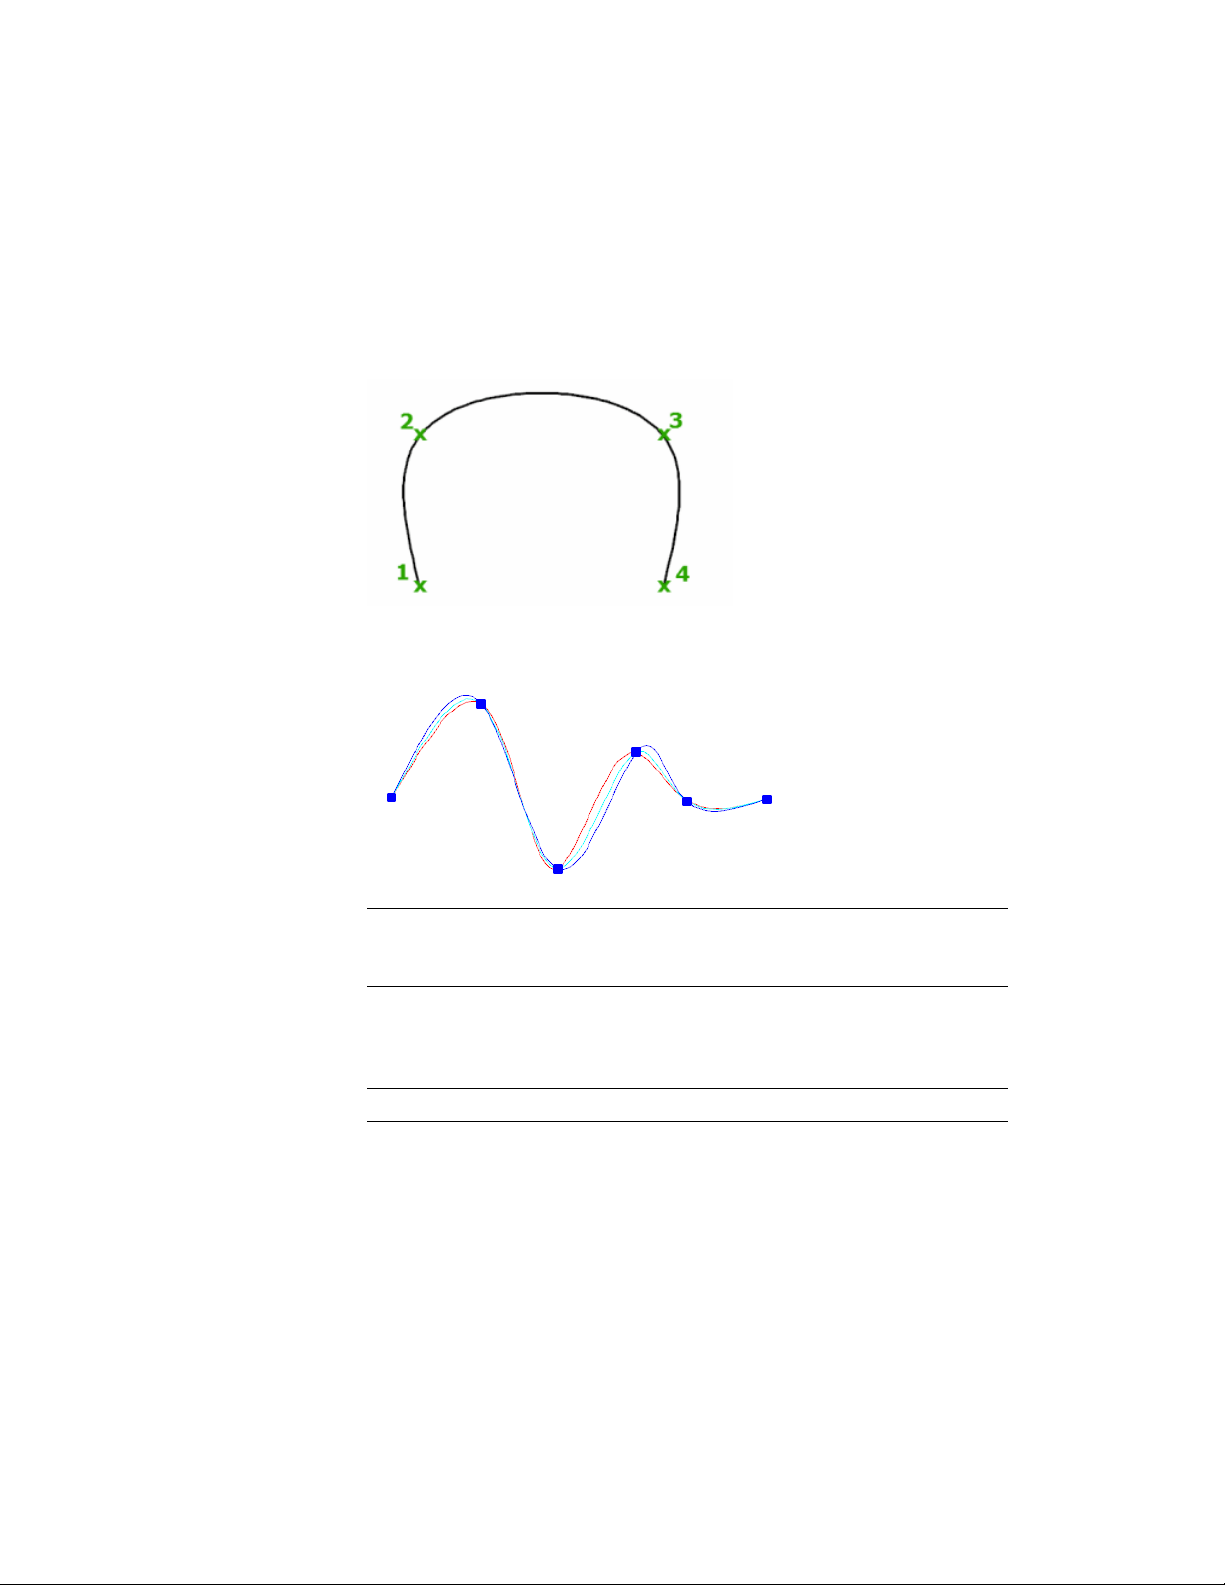
Create Splines Using Fit Points
When you create splines using fit points, the resulting curve passes through
the specified points, and is influenced by the spacing of mathematical knots
in the curve.
You can choose the spacing of these knots with the knot parameterization
option, which will result in different curves as shown in the example.
NOTE There is no best choice for knot parameterization for all cases. The chord
length parameterization is commonly used, and the square root (centripetal)
parameterization often produces better curves depending on the data set.
When the Tolerance value is set to 0, the spline passes directly through the
fit points. With larger tolerance values, the spline passes near the fit points.
Optionally, you can specify the tangent direction for the spline at each end.
NOTE The fit point method always results in a degree 3 spline.
Special Cases
You can create a spline with a parabolic shape by specifying a degree 2 spline
created with exactly 3 control vertices as shown on the left. Degree 3 splines
Create Objects | 213
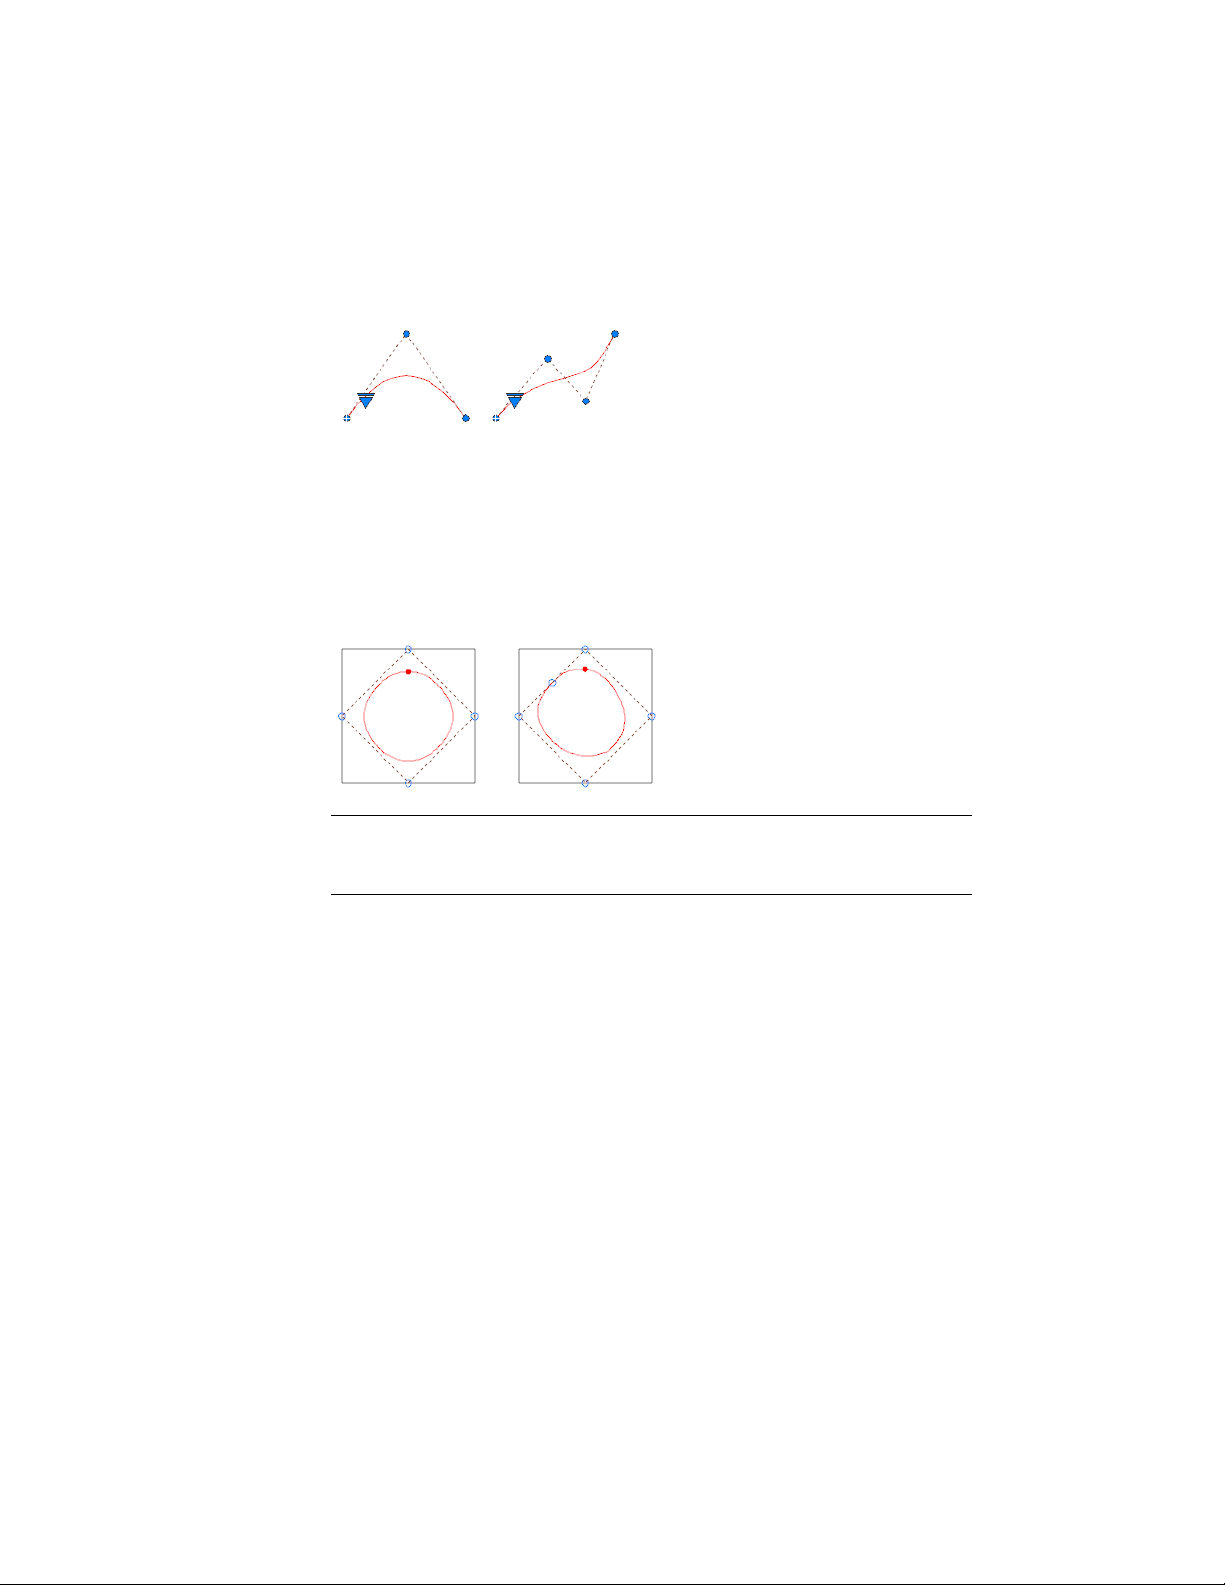
created with 4 control vertices have the same shape as Bezier curves of degree
3 as shown on the right.
You can close a spline so that the start point and end point are coincident
and tangent. By default, closed splines are mathematically periodic, meaning
that they have the smoothest (C2) continuity at the point of closure.
In the example, both splines are closed, and the point of closure is marked
with a dot. The result of setting the SPLPERIODIC system variable to periodic
is shown on the left, while the result of the legacy setting is shown on the
right.
NOTE The legacy method for creating B-splines by creating a polyline, and then
using the Spline option of the PEDIT command generates only an approximate
“spline-fit” polyline.
See also:
Modify Splines (page 274)
Break and Join Objects (page 270)
Create Solids and Surfaces from Lines and Curves (page 342)
Draw Helixes
A helix is an open 2D or 3D spiral.
You can use a helix as a path with the SWEEP command. For example, you
might sweep a circle along a helix path to create a solid model of a spring.
214 | Chapter 6 Create and Modify Objects

When you create a helix, you can specify the following:
■ Base radius
■ Top radius
■ Height
■ Number of turns
■ Turn height
■ Twist direction
If you specify the same value for both the base radius and the top radius, then
a cylindrical helix is created. By default, the top radius is set to the same value
as the base radius. You cannot specify 0 for both the base radius and top radius.
If you specify different values for the top radius and the base radius, then a
conical helix is created.
If you specify a height value of 0, then a flat, 2D spiral is created.
NOTE
A helix is a spline approximation of a real helix. Length values may not be
completely accurate. However, when you use a helix as a sweep path, the
resulting values will be accurate regardless of the approximation.
See also:
Modify Helixes (page 278)
Create a Solid or Surface by Sweeping (page 348)
Draw Construction and Reference Geometry
Construction lines and reference points are temporary objects you create to
help you draw accurately.
Draw Reference Points
Point objects are useful as nodes or reference geometry for object snaps and
relative offsets.
Create Objects | 215

You can set the style of the points and their size relative to the screen or in
absolute units. Changing the style of points
■ Makes them more visible and easier to differentiate from grid dots
■ Affects the display of all point objects in the drawing
■ Requires using REGEN to make the change visible
Draw Construction Lines (and Rays)
Lines that extend to infinity in one or both directions, known as rays and
construction lines, respectively, can be used as references for creating other
objects.
For example, you can use construction lines to find the center of a triangle,
prepare multiple views of the same item, or create temporary intersections to
use for object snaps.
Infinite lines do not change the total area of the drawing. Therefore, their
infinite dimensions have no effect on zooming or viewpoints, and they are
ignored by commands that display the drawing extents. You can move, rotate,
and copy infinite lines just as you can move, rotate, and copy other objects.
You may want to create infinite lines on a construction line layer that can be
frozen or turned off before plotting.
Construction Lines
A construction line (also known as xlines) can be placed anywhere in
three-dimensional space. You can specify its orientation in several ways. The
default method for creating the line is the two-point method: you specify two
points to define the orientation. The first point, the root, is the conceptual
midpoint of the construction line, that is, the point snapped to by the
Midpoint object snap.
You can also create construction lines in several other ways.
■ Horizontal and Vertical. Create construction lines that pass through
a point you specify and are parallel to the X or Y axis of the current UCS.
■ Angle. Creates a construction line in one of two ways. Either you select
a reference line and then specify the angle of the construction line from
that line, or you create a construction line at a specific angle to the
horizontal axis by specifying an angle and then a point through which
the construction line should pass.
■ Bisector. Creates a construction line that bisects an angle you specify.
You specify the vertex and the lines that create the angle.
216 | Chapter 6 Create and Modify Objects
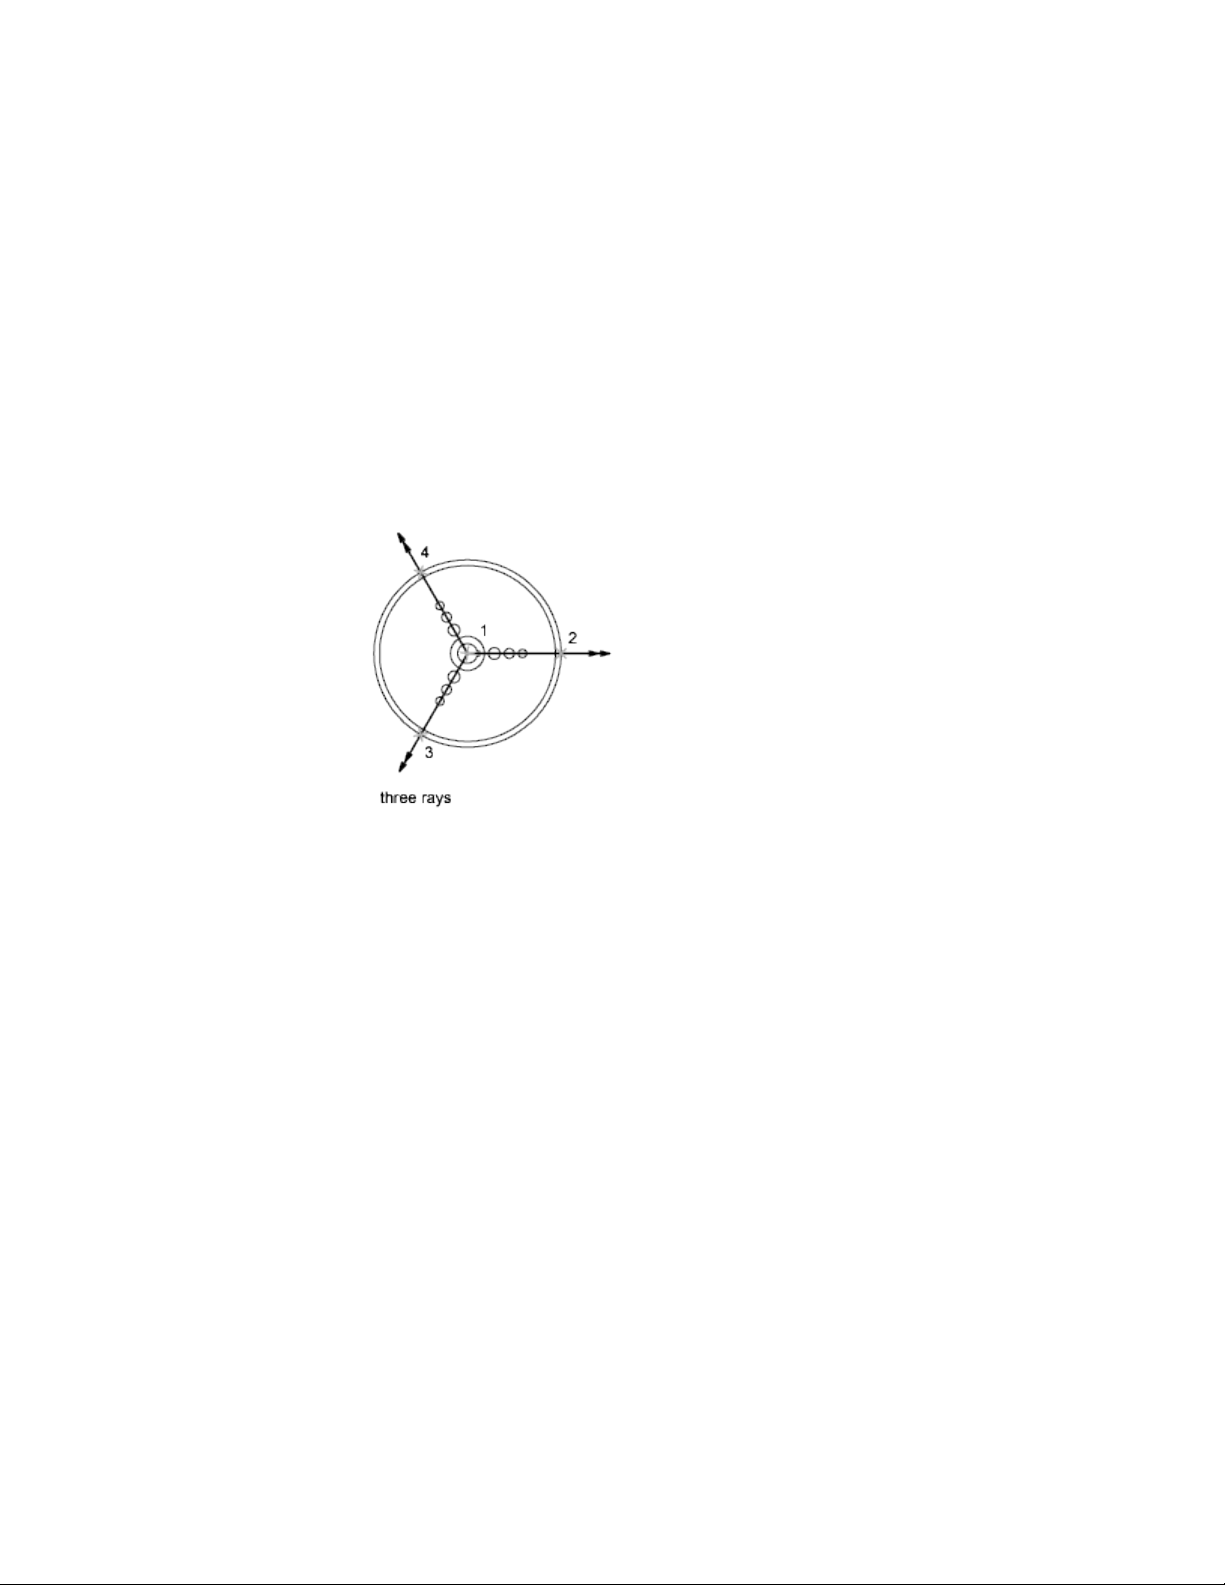
■ Offset. Creates a construction line parallel to a baseline you specify. You
specify the offset distance, select the baseline, and then indicate on which
side of the baseline to locate the construction line.
Rays
A ray is a line in three-dimensional space that starts at a point you specify and
extends to infinity. Unlike construction lines, which extend in two directions,
rays extend in only one direction. Using rays instead of construction lines can
help reduce visual clutter. Like construction lines, rays are ignored by
commands that display the drawing extents.
Create and Combine Areas (Regions)
Regions are 2D enclosed areas that have physical properties such as centroids
or centers of mass. You can combine existing regions into a single, complex
region.
Regions can be used for
■ Extracting design information, such as areas and centroids, using
MASSPROP
■ Applying hatching and shading
■ Combining simple objects into more complex ones with Boolean
operations.
Create Objects | 217
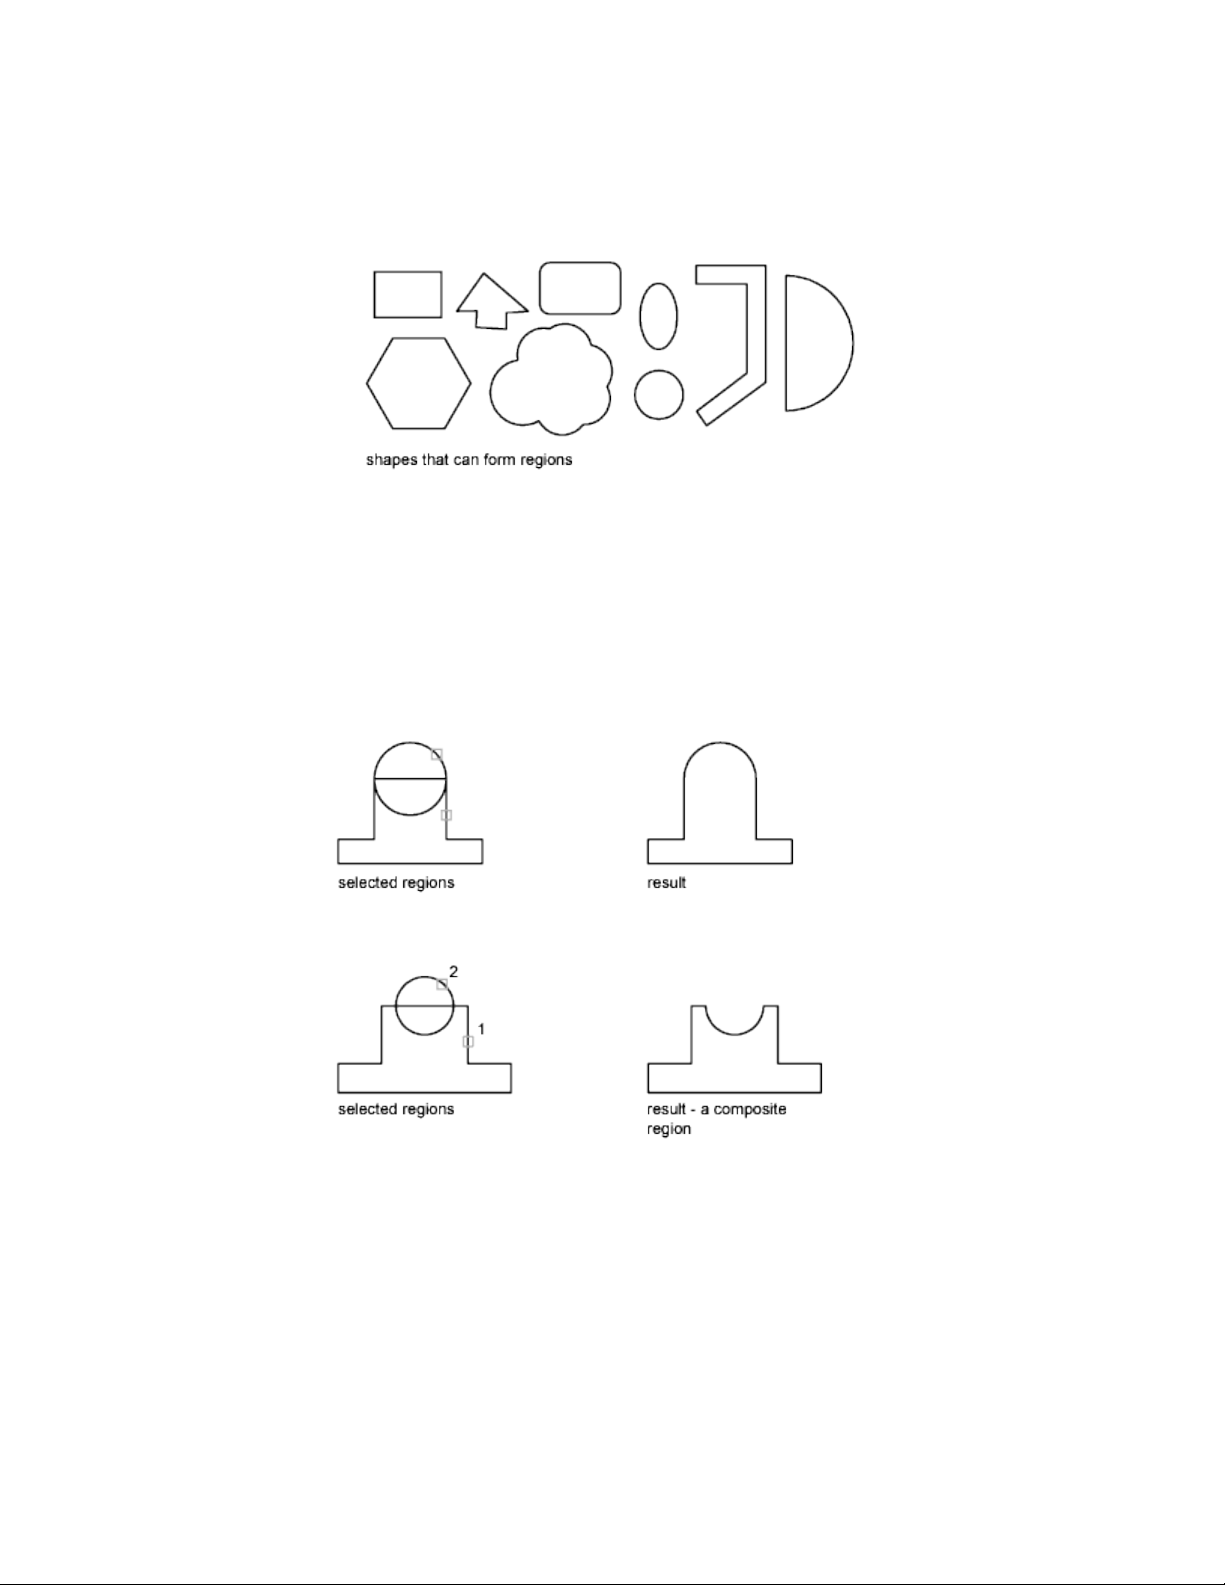
You can create regions from objects that form closed loops. Loops can be
combinations of lines, polylines, circles, arcs, ellipses, elliptical arcs, and splines
that enclose an area.
You create regions using the REGION command to convert a closed object
into a region, and the BOUNDARY command to create a region from an area
enclosed by objects. You can combine regions by unifying, subtracting, or
intersecting them.
Objects combined using UNION:
Objects combined using SUBTRACT:
Objects combined using INTERSECT:
218 | Chapter 6 Create and Modify Objects
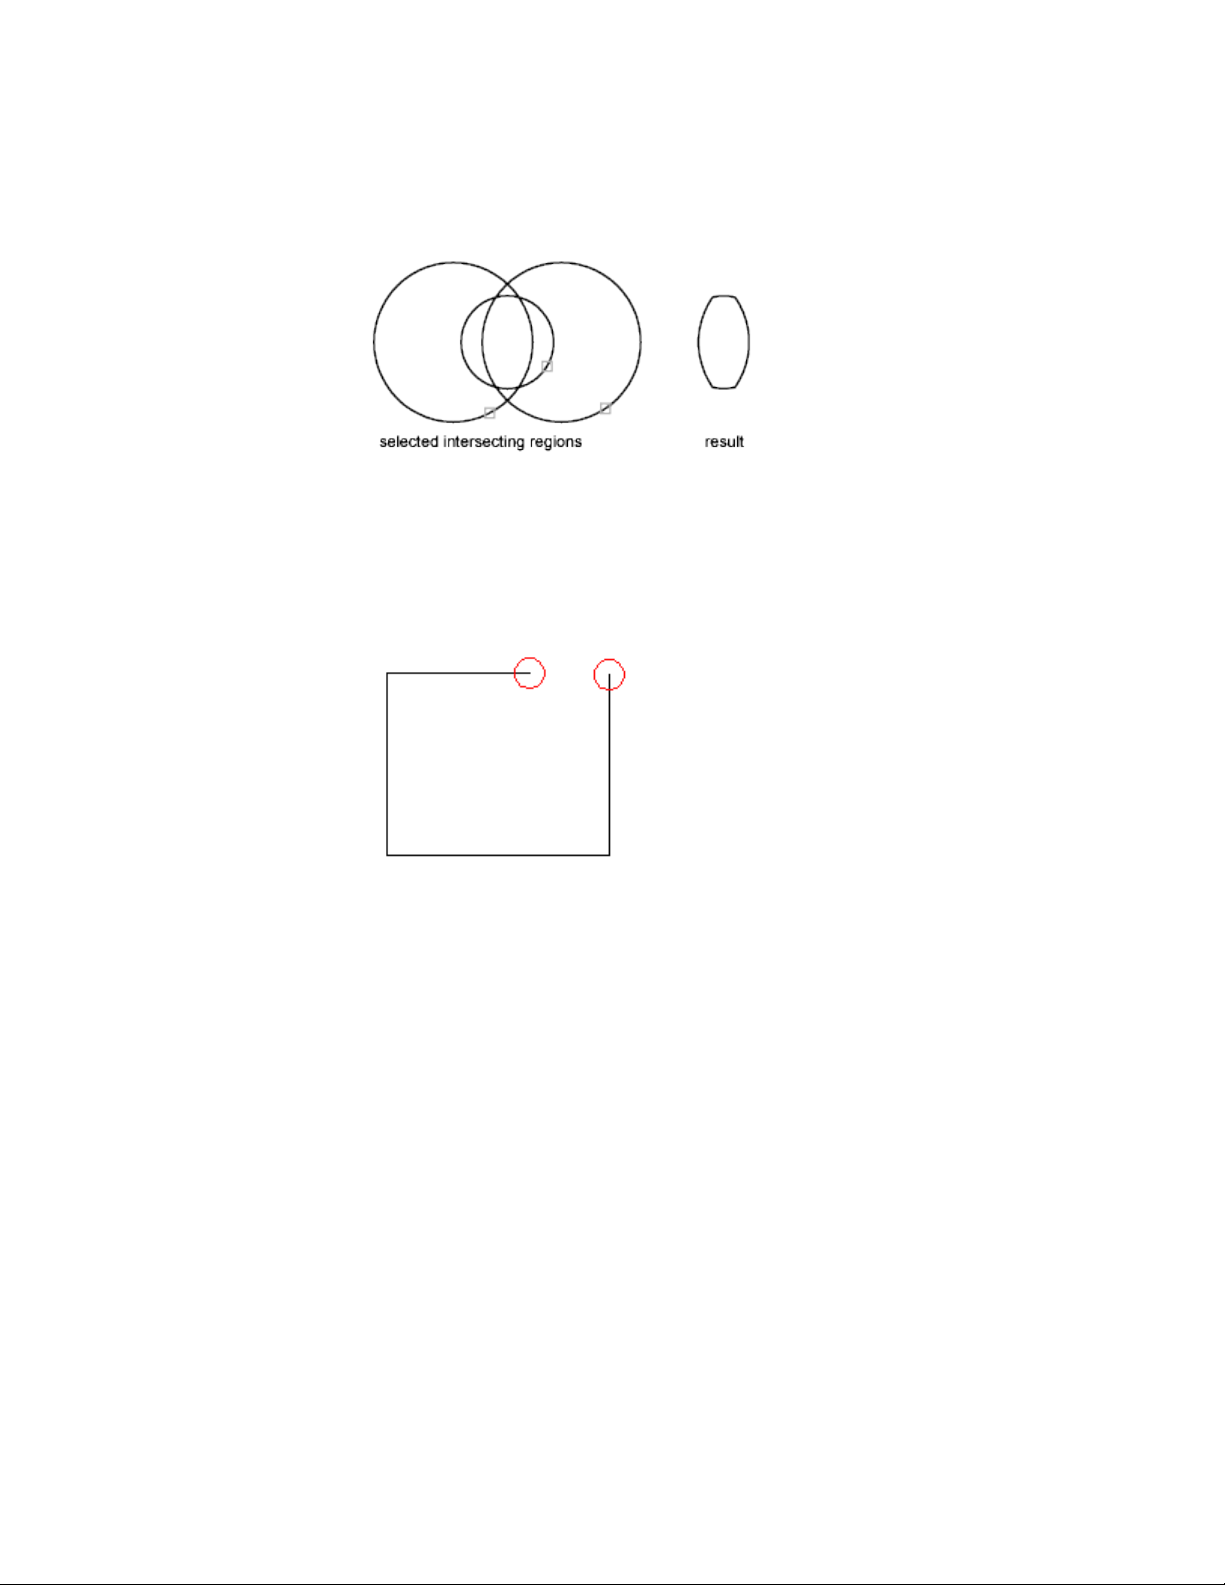
Invalid Boundaries
When a boundary cannot be determined, it might be because the specified
internal point is not within a fully enclosed area. With the BOUNDARY
command, red circles are displayed around unconnected endpoints of the
boundary to identify gaps in the boundary.
The red circles remain displayed even after you exit the command. They are
removed when you specify a closed boundary, or by using REDRAW, REGEN,
or REGENALL.
Create Revision Clouds
Revision clouds are polylines that consist of sequential arcs. They are used to
call attention to parts of a drawing during the review stage.
If you review or redline drawings, you can increase your productivity by using
the Revision Cloud feature to highlight your markups. REVCLOUD creates a
polyline of sequential arcs to form a cloud-shaped object. You can select a
style for a revision cloud: Normal or Calligraphy. If you select Calligraphy,
the revision cloud looks as if it was drawn with a calligraphy pen.
Create Objects | 219
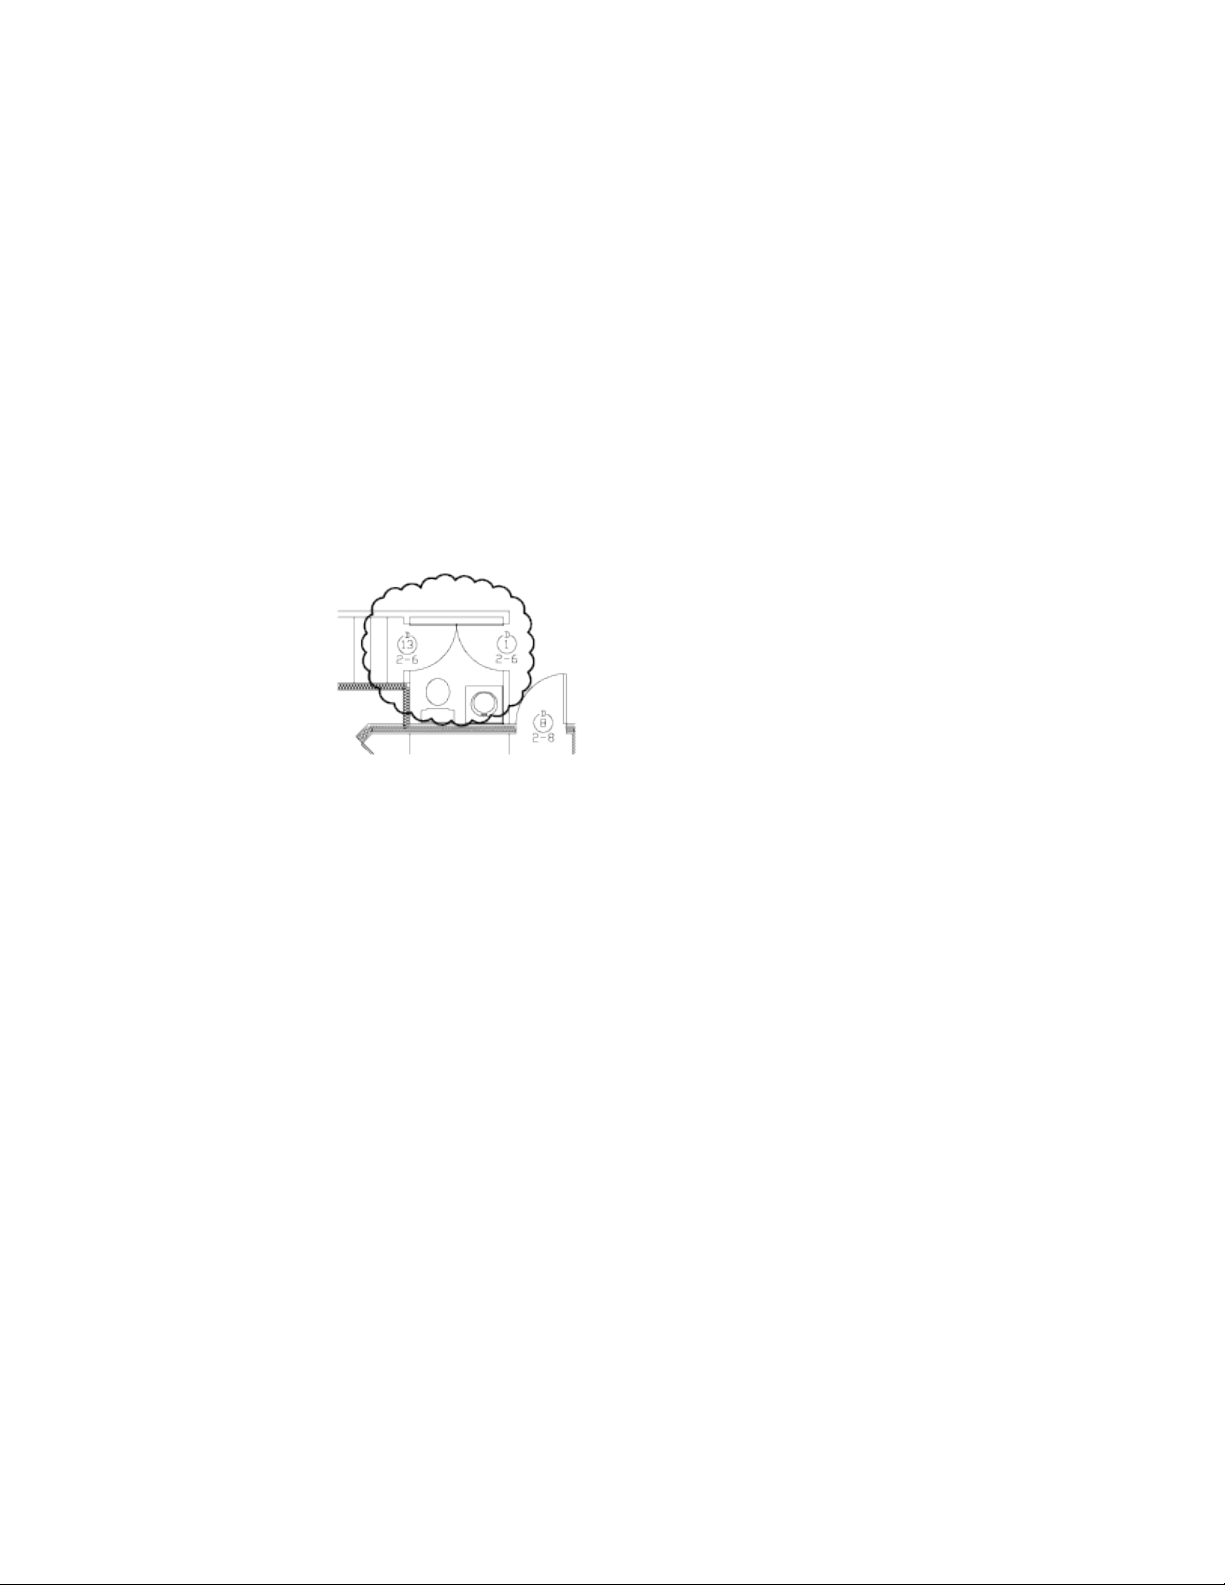
You can create a revision cloud from scratch, or you can convert objects, such
as a circle, ellipse, polyline, or spline, to a revision cloud. When you convert
an object to a revision cloud, the original object is deleted if DELOBJ is set to
1 (the default).
You can set the minimum and maximum default values for the arc lengths
of a revision cloud. When you draw a revision cloud, you can vary the size of
the arcs by using pick points for the smaller arc segments. You can also edit
the individual arc lengths and chord lengths of a revision cloud by adjusting
the pick points.
REVCLOUD stores the last used arc length as a multiple of the DIMSCALE
system variable to provide consistency among drawings with different scale
factors.
Make sure that you can see the entire area to be outlined with REVCLOUD
before you begin the command. REVCLOUD is not designed to support
transparent and real-time panning and zooming.
Select and Modify Objects
You can select objects, view and edit object properties, and perform general
and object-specific editing operations.
See also:
Work with Custom and Proxy Objects (page 702)
Select Objects
You have a wide range of options when you need to select objects for editing
operations.
220 | Chapter 6 Create and Modify Objects
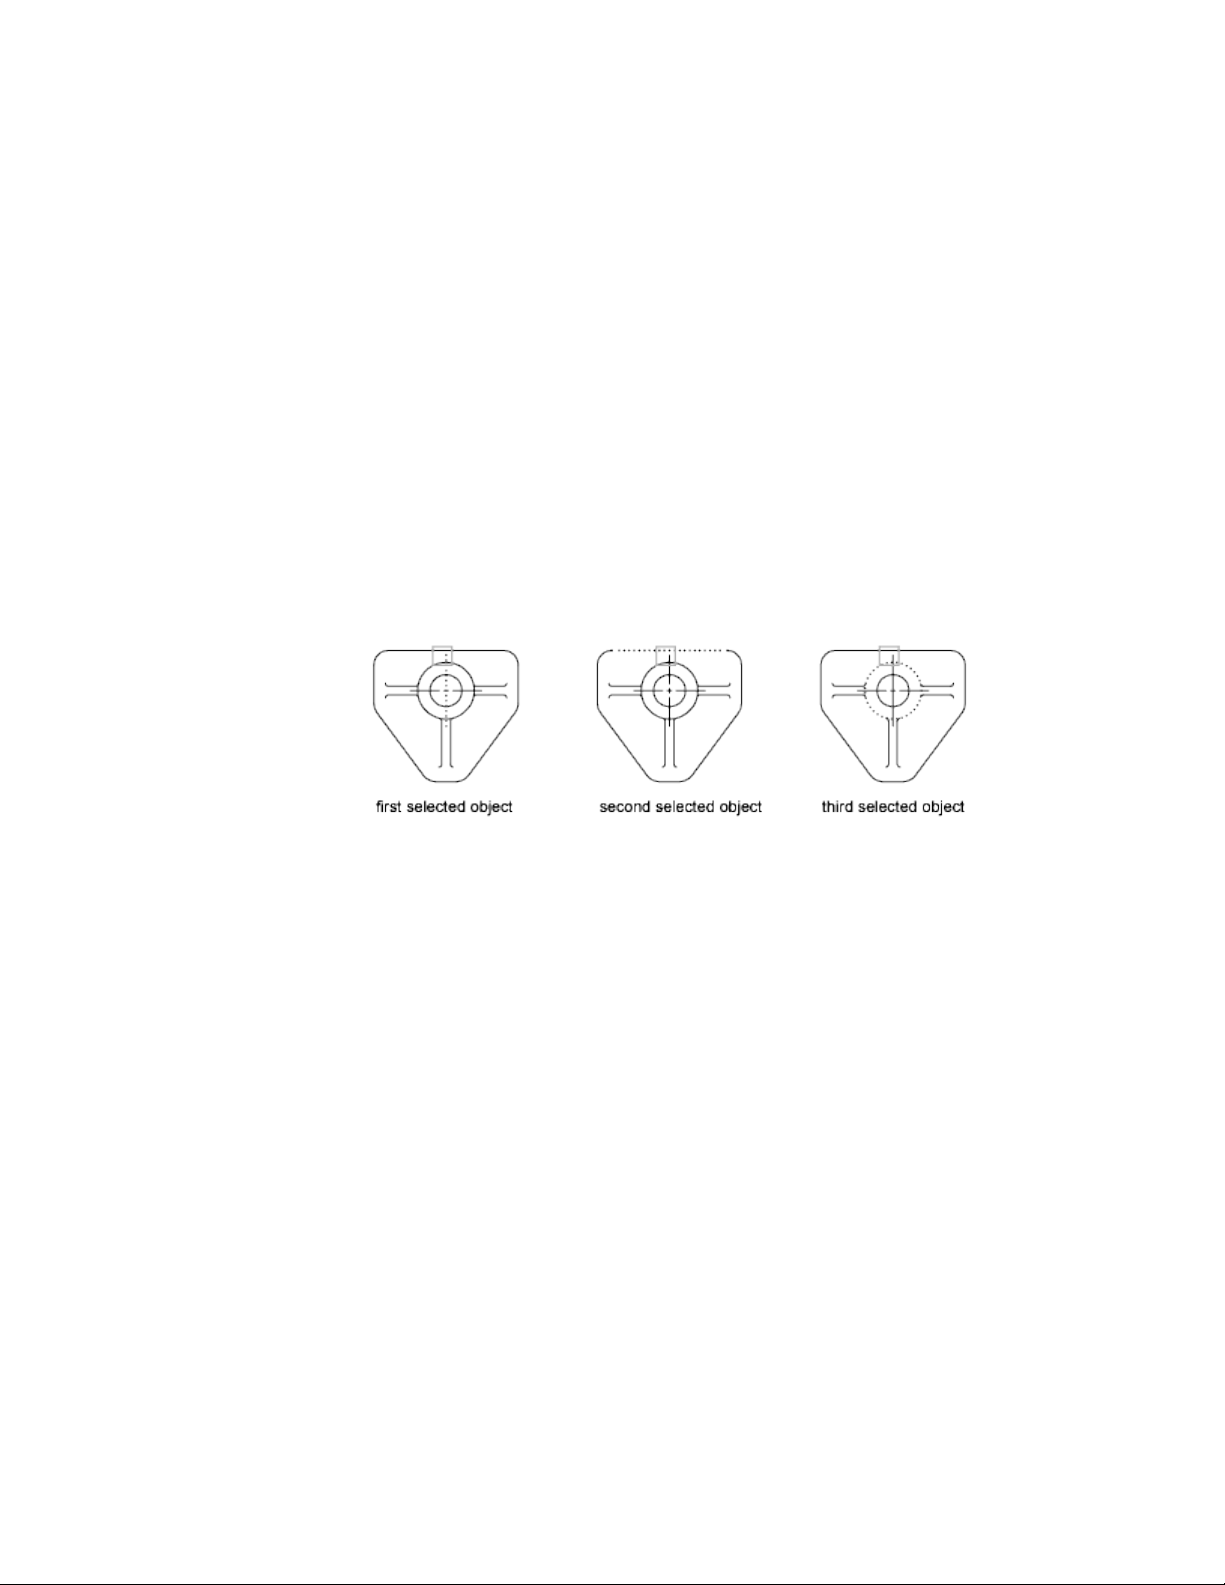
Select Objects Individually
At the Select Objects prompt, you can select one or more objects individually.
Use the Pickbox Cursor
When the square pickbox cursor is in position to select an object, the object
is highlighted. Click to select the object.
You can control the size of the pickbox in the Application Preferences dialog
box, Cursor & Selection tab.
Select Overlapping or Close Objects
It is sometimes difficult to select objects that overlap or are close together. In
the illustration, two lines and a circle lie within the pickbox.
If selection preview is turned on, you can cycle through the objects by rolling
over the object on top to highlight it, or you can press and hold Shift and
then press the Spacebar. When the required object is highlighted, left-click to
select it.
If selection preview is turned off, hold down Shift and Spacebar at a Select
Objects prompt while you left-click to cycle through the objects until the one
you want is highlighted, and then press Enter . Press Esc to turn off cycling.
Remove Selection from Objects
Remove objects from the current selection set by holding down Shift and
selecting them again.
See also:
Modify 3D Subobjects (page 423)
Modify Composite Solids and Surfaces (page 435)
Select and Modify Objects | 221
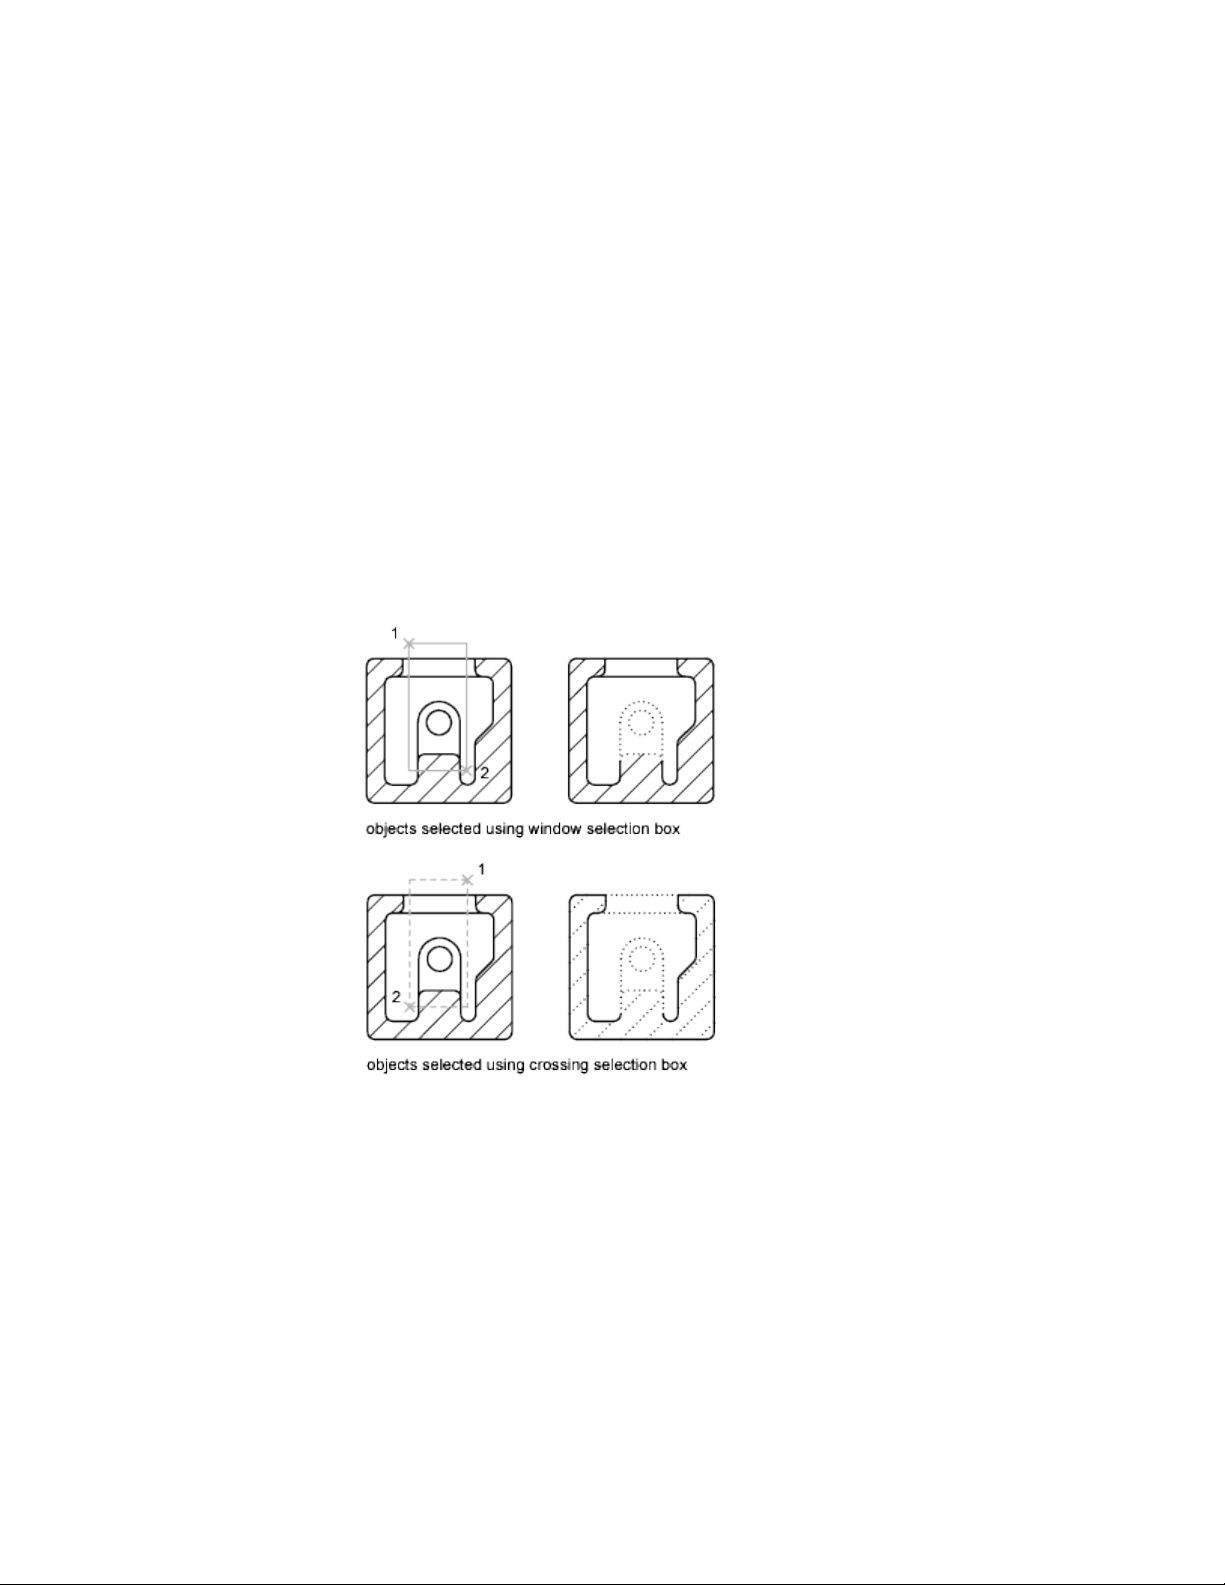
Select Multiple Objects
At the Select Objects prompt, you can select many objects at the same time.
Specify a Rectangular Selection Area
Specify opposite corners to define a rectangular area. The background inside
the area changes color and becomes transparent. The direction that you drag
your cursor from the first point to the opposite corner determines which
objects are selected.
■ Window selection. Drag your cursor from left to right to select only
objects that are entirely enclosed by the rectangular area.
■ Crossing selection. Drag your cursor from right to left to select objects
that the rectangular window encloses or crosses.
With a window selection, usually the entire object must be contained in the
rectangular selection area. However, if an object with a noncontinuous (dashed)
linetype is only partially visible in the viewport and all the visible vectors of
the linetype can be enclosed within the selection window, the entire object
is selected.
222 | Chapter 6 Create and Modify Objects
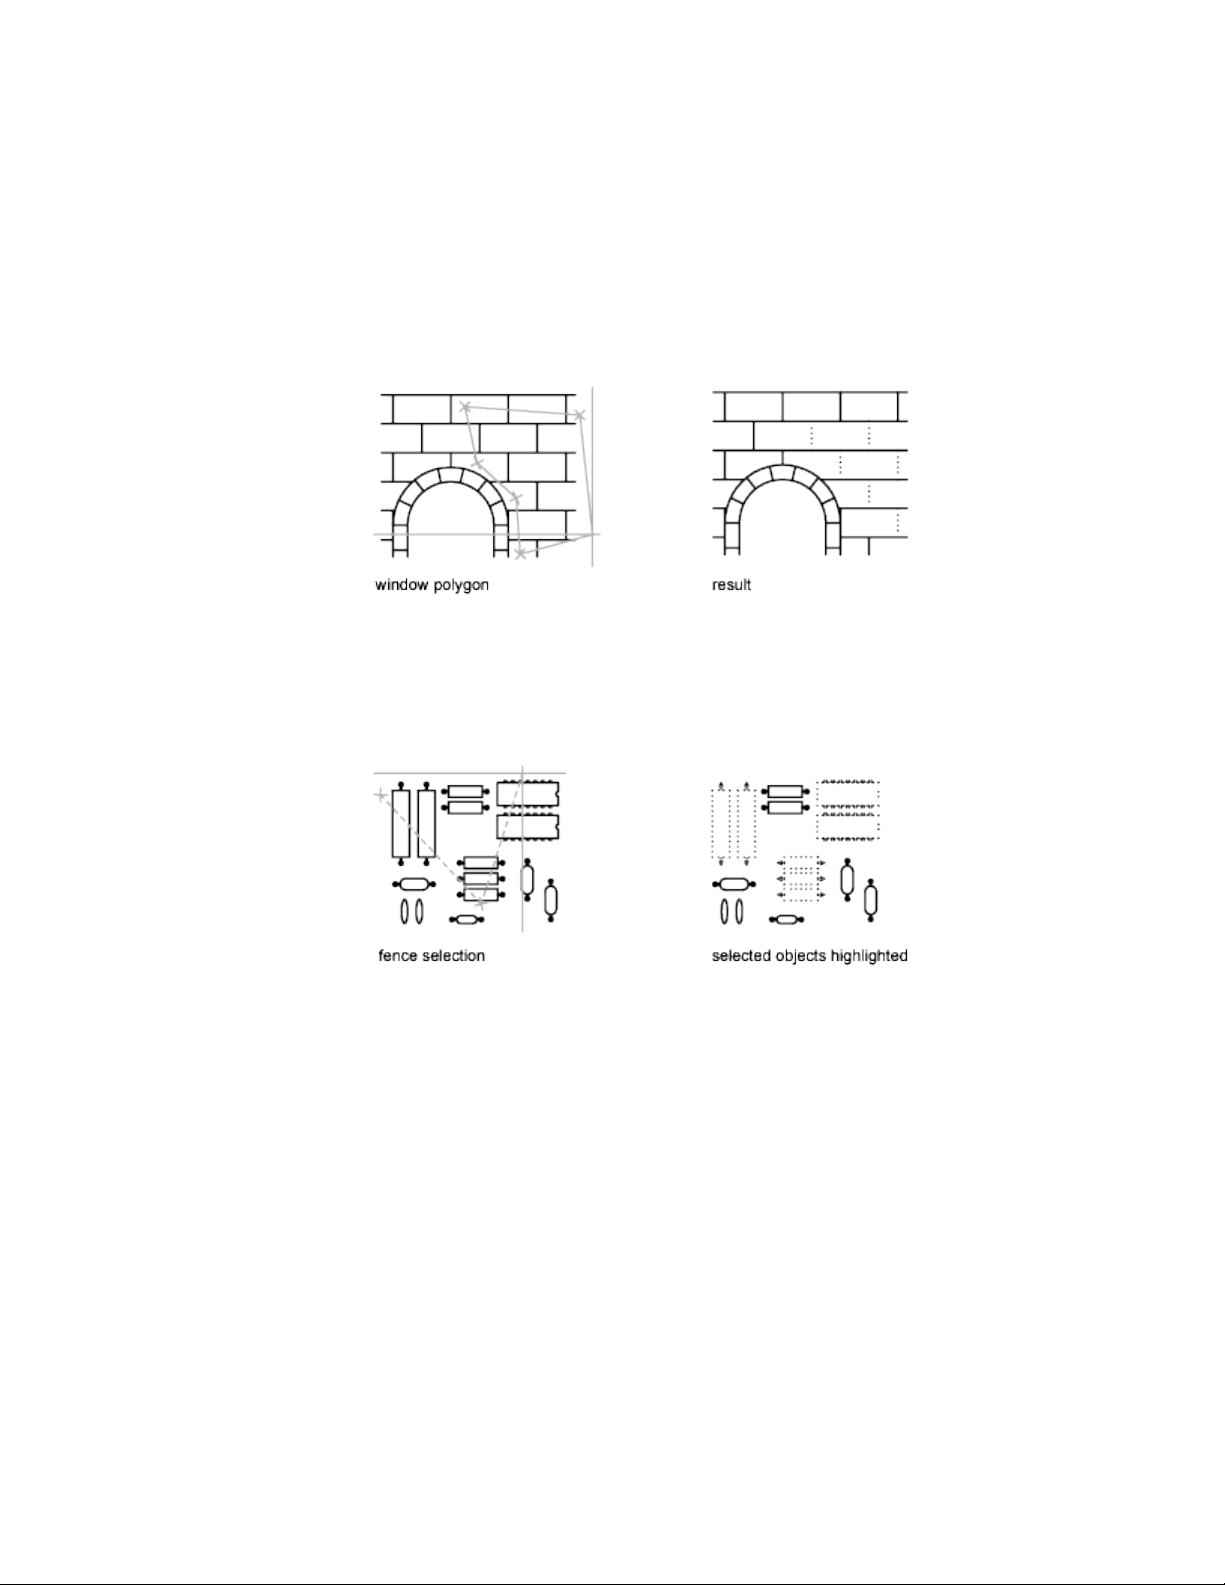
Specify an Irregularly Shaped Selection Area
Specify points to define an irregularly shaped area. Use window polygon
selection to select objects entirely enclosed by the selection area. Use crossing
polygon selection to select objects enclosed or crossed by the selection area.
Specify a Selection Fence
In a complex drawing, use a selection fence. A selection fence looks like a
polyline and selects only the objects it passes through. The circuit board
illustration shows a fence selecting several components.
Use Other Selection Options
You can see all selection options by entering ? at the Select Objects prompt.
For a description of each of the selection options, see SELECT.
Remove Selection from Multiple Objects
You can enter r (Remove) at the Select Objects prompt and use any selection
option to remove objects from the selection set. If you are using the Remove
option and want to return to adding objects to the selection set, enter a (Add).
Select and Modify Objects | 223

You can also remove objects from the current selection set by holding down
Shift and selecting them again, or by holding down Shift and then clicking
and dragging window or crossing selections. You can add and remove objects
repeatedly from the selection set.
Prevent Objects from Being Selected
You can prevent objects on specified layers from being selected and modified
by locking those layers.
Typically, you lock layers to prevent accidental editing of particular objects.
Other operations are still possible when a layer is locked. For example, you
can make a locked layer current, and you can add objects to it. You can also
use inquiry commands (such as LIST), use object snaps to specify points on
objects on locked layers, and change the draw order of objects on locked layers.
To help you differentiate between locked and unlocked layers, you can do the
following:
■ Hover over an object to see whether a lock icon is displayed
■ Dim the objects on locked layers
NOTE Grips are not displayed on objects that are on locked layers.
Select Objects by Properties
Use object properties or object types to include objects in a selection set, or
to exclude them.
To quickly define a selection set based on specified filtering criteria, use
■ Select Similar (SELECTSIMILAR) to select similar objects of the same type
based on specified matching properties
■ AutoLISP function SSGET to create a custom selection filter
With object selection filters, to filter your selection set based on color, linetype,
or lineweight, consider whether these properties are set to BYLAYER for any
objects in your drawing. For example, an object may appear red because its
color is set to BYLAYER and the layer color is red.
By default, objects of the same type are considered similar if they are on the
same layer, and, for blocks and other referenced objects, have the same name.
Subobjects are only considered at the object level. For example, when a mesh
224 | Chapter 6 Create and Modify Objects

vertex is selected, SELECTSIMILAR selects other mesh objects, not just the
mesh vertices.
See also:
Customize Object Selection (page 225)
Work with Layers (page 119)
Customize Object Selection
You can control several aspects of selecting objects, such as whether you enter
a command first or select objects first, the size of the pickbox cursor, and how
selected objects are displayed.
For commands that use the Select Objects prompt, you can
■ Enter a command first, and then select objects
■ Select the objects first, and then enter a command
You can also choose
■ Whether objects to be selected are previewed during selection
■ Whether selected objects are highlighted
■ How you define selection areas and how you create selection sets
Select the Command First
When you use an editing command, a Select Objects prompt is displayed and
the crosshairs is replaced with a pickbox. You can respond to the Select Objects
prompt in various ways:
■ Select objects one at a time.
■ Click an empty area. Drag the cursor to define a rectangular selection area.
■ Enter a selection option. Enter ? to display all selection options.
■ Combine selection methods. For example, to select most of the objects in
the drawing area, select all objects and then remove the objects that you
do not want selected.
Select and Modify Objects | 225

Select Objects First
You can use one of two methods to select objects before starting a command:
■ Use the SELECT command, and enter ? to display all selection options. All
objects selected are put into the Previous selection set. To use the Previous
selection set, enter p at the Select Objects prompt of any subsequent
command.
■ When noun/verb selection is turned on, select objects at the Command
prompt before entering a command such as MOVE, COPY, or ERASE. With
this method, you can only select objects by clicking them individually or
by using automatic selection.
Highlight Objects to Be Selected
Objects are highlighted when the pickbox cursor rolls over them, providing
a preview of which object will be selected when you click. When you specify
an area to select multiple objects, the background of the area becomes
transparent.
These selection previewing effects are turned on by default. You can turn them
off with the SELECTIONPREVIEW system variable. When the PICKBOX system
variable is set to 0, selection previewing of objects is not available.
Control the Appearance of Selected Objects
By default, selected objects are displayed with dashed lines. You can increase
program performance by setting the HIGHLIGHT system variable to 0. Turning
off selection highlighting does not affect grips on selected objects.
Set Up Default Selection Methods
The default selection methods are:
■ Use selection previewing and selection area effects to preview selection.
■ Select objects before entering a command (noun-verb selection) or after
entering a command. (PICKFIRST)
■ Press Shift to append objects to the selection set. (PICKADD)
■ Click and drag to create a selection window. Otherwise you must click
twice to define the corners of a selection window. (PICKDRAG)
■ Start Window or Crossing selection automatically when you click an empty
space. Otherwise, you must enter c or w to specify window crossing
selection. (PICKAUTO)
226 | Chapter 6 Create and Modify Objects

■ Change the size of the pickbox. (PICKBOX)
■ Select all objects in a group when you select one object in that group.
■ Include the boundary in the selection set when you select a hatch.
Group Objects
A group is a saved set of objects that you can select and edit together or
separately as needed. Groups provide an easy way to combine drawing elements
that you need to manipulate as a unit.
See also:
Work with Blocks (page 307)
Overview of Groups
A group is a saved set of objects that you can select and edit together or
separately as needed. Groups provide an easy way to combine drawing elements
that you need to manipulate as a unit. You can create them quickly and with
a default name.
TIP Groups are useful in associating 3D solids when you do not want to combine
them with a Boolean operation.
You can change the components of groups as you work by adding or removing
objects.
In some ways, groups resemble blocks, which provide another method of
combining objects into a named set. For example, groups are saved from
session to session. However, you can edit individual objects in groups more
easily than you can edit them in blocks, which must be exploded first. Unlike
blocks, groups cannot be shared with other drawings.
Create Groups
In addition to choosing the objects that will become the members of a group,
you can give the group a name and description.
Select and Modify Objects | 227

When you create a group, you can give the group a name and description. If
you copy a group, the copy is given the default name Ax and is considered
unnamed.
The objects in your drawing can be members of more than one group, and
groups themselves can be nested in other groups. You can ungroup a nested
group to restore the original group configuration.
When group selection is on (PICKSTYLE system variable set to 1 or 3), selecting
a member of an existing group for inclusion in a new group, selects all members
of the former group. To enable individual selection of grouped objects turn
group selection off (PICKSTYLE set to 0 or 2).
Named groups are not maintained when you use a drawing as an external
reference or insert it as a block. However, you can bind and then explode the
external reference or explode the block to make the group available as an
unnamed group.
NOTE Avoid creating large groups containing hundreds or thousands of objects.
A large group significantly degrades the performance of this program.
Select Objects in Groups
There are several methods for choosing a group, including selecting the group
by name or selecting one of the members of the group.
By default, groups are selectable; that is, selecting any member of a group
selects all the objects in that group. You can then edit the group as a unit.
Selecting an object that belongs to multiple groups selects all groups to which
that object belongs. Turn off group selection to select grouped objects
individually.
TIP Toggle group selection off or on by pressing Ctrl-H or Shift-Ctrl-A.
All members of selectable groups are also selected when you use object selection
cycling (for example, if you want to select an object that lies directly behind
another object). To select groups for editing with grips, use the pointing device
to select the group at the Command prompt.
228 | Chapter 6 Create and Modify Objects

Edit Groups
You can modify groups in a number of ways, including changing their
membership, modifying their properties, revising the names and descriptions
of groups, and removing them from the drawing.
Edit Objects as a Group
When group selection is turned on, you can move, copy, rotate, and modify
groups just as you can modify individual objects. If you need to edit objects
within a group, turn off group selection or use grips to edit individual objects.
For more information, see Select Objects in Groups (page 228).
In some circumstances, it is useful to control the order in which objects that
belong to the same group are selected. For example, a custom routine that
generates paths for numerical control devices might depend on a series of
contiguous objects in a specified order.
You can reorder group members in two ways: either change the numerical
position of individual members or ranges of group members, or reverse the
order of all members. The first object in each group is number 0, not number
1.
Change Group Components, Name, or Description
You can specify objects to be added to or removed from a group at any time.
You can also rename a group or change it’s description. If deleting an object
or removing it from a group leaves the group empty, the group remains defined
but without any members.
NOTE Exploding an object such as a block or hatch that belongs to a group does
not automatically add the resulting components to any group.
Remove Groups
You can delete a group definition, to ungroup the contained objects.
As a result, objects are ungrouped but not otherwise changed.
Correct Mistakes
You can backtrack your recent actions using one of several methods.
Select and Modify Objects | 229

Undo a Single Action
The simplest method of backtracking is to use the UNDO or U commands to
undo a single action. Many commands include their own U (undo) option so
that you can correct mistakes without leaving the command. When you are
creating lines and polylines, for example, enter u to undo the last segment.
NOTE By default, the UNDO command is set to combine consecutive pan and
zoom commands into a single operation when you undo or redo. However, pan
and zoom commands that are started from the menu are not combined, and
always remain separate actions.
Undo Several Actions at Once
Use the Mark option of UNDO to mark an action as you work. You can then
use the Back option of UNDO to undo all actions that occurred after the
marked action. Use the Begin and End options of UNDO to define a set of
actions to be treated as a group.
You can also undo several actions at once with the Undo list on the Standard
toolbar.
Reverse the Effect of Undo
You can reverse the effect of a single U or UNDO command by using REDO
immediately after using U or UNDO.
You can also redo several actions at once with the Redo list on the Standard
toolbar.
Erase Objects
You can erase any object that you draw. If you accidentally erase the wrong
object, you can use the UNDO command or the OOPS command to restore
it.
For more information, see Erase Objects (page 231).
Cancel a Command
You can cancel a command without completing it by pressing Esc.
230 | Chapter 6 Create and Modify Objects

Erase Objects
There are many ways to delete objects from your drawing and clean up the
display.
Remove Unused Definitions, Styles, and Objects
You can remove unused named and unnamed objects with PURGE. Some of the
unnamed objects you can purge include block definitions, dimension styles,
layers, linetypes, and text styles. With PURGE you can also remove zero-length
geometry and empty text objects.
Delete Duplicate Objects
You can remove duplicate and overlapping lines, arcs, polylines, and segments
of these object types with OVERKILL. Set a tolerance value and specify whether
object properties such as layer, color, or plot style are honored or ignored
when comparing suspected duplicate objects. OVERKILL also provides a
method to consolidate objects.
Clean Up the Display
You can remove stray pixels that are left over from some editing operations
from the display area with the REGEN or REGENALL commands.
See also:
Correct Mistakes (page 229)
Cut, Copy, and Paste with the Clipboard
When you want to use objects from a drawing file in another application, you
can cut or copy these objects to the Clipboard and then paste them from the
Clipboard into the other application.
Cut Objects
Cutting deletes selected objects from the drawing and stores them on the
Clipboard. The objects are now available to be pasted into other programs.
Select and Modify Objects | 231
Copy Objects
You can use the Clipboard to copy part or all of a drawing into a document
created by another application. The objects are copied in vector format, which
retains the high resolution in other applications. The information stored in
the Clipboard can then be pasted in other programs.
Paste Objects
Applications use different internal formats to store Clipboard information.
When you copy objects to the Clipboard, information is stored in all available
formats. When you paste the Clipboard contents into a drawing, the format
that retains the most information is used.
Modify Objects
You can modify the size, shape, and location of objects.
See also:
Work with Custom and Proxy Objects (page 702)
Modify Existing Dimensions (page 596)
Choose a Method to Modify Objects
Access object editing options using the following methods:
DescriptionsMethods
Enter a command and then select the ob-
jects to modify. Alternatively, select the
objects first and then enter a command.
Command line
Select and right-click an object to display a
shortcut menu with relevant editing op-
tions.
Shortcut menu
Double-click an object to display the Prop-
erties Inspector palette or, in some cases, a
Double-click
232 | Chapter 6 Create and Modify Objects
DescriptionsMethods
dialog box or editor that is specific to that
type of object.
Use grips to reshape, move, rotate and
manipulate objects:
Grips
■ Grip modes. Select an object grip to
work with the default grip
mode—stretch—or press Enter or
Spacebar to cycle through the addition-
al grip modes—move, rotate, scale, and
mirror.
■ Multi-functional grips. For many
objects, you can also hover over a grip
to access a menu with object-specific,
and sometimes grip-specific, editing
options.
See also:
Change Text (page 549)
Select Objects (page 220)
Modify Existing Dimensions (page 596)
Display and Change the Properties of Objects (page 118)
Work with Custom and Proxy Objects (page 702)
Modify Objects Using Grips
Grips are displayed at strategic points on selected objects.
Use Object Grips
You can reshape, move, or manipulate objects in other ways using different
types of grips and grip modes.
Select and Modify Objects | 233
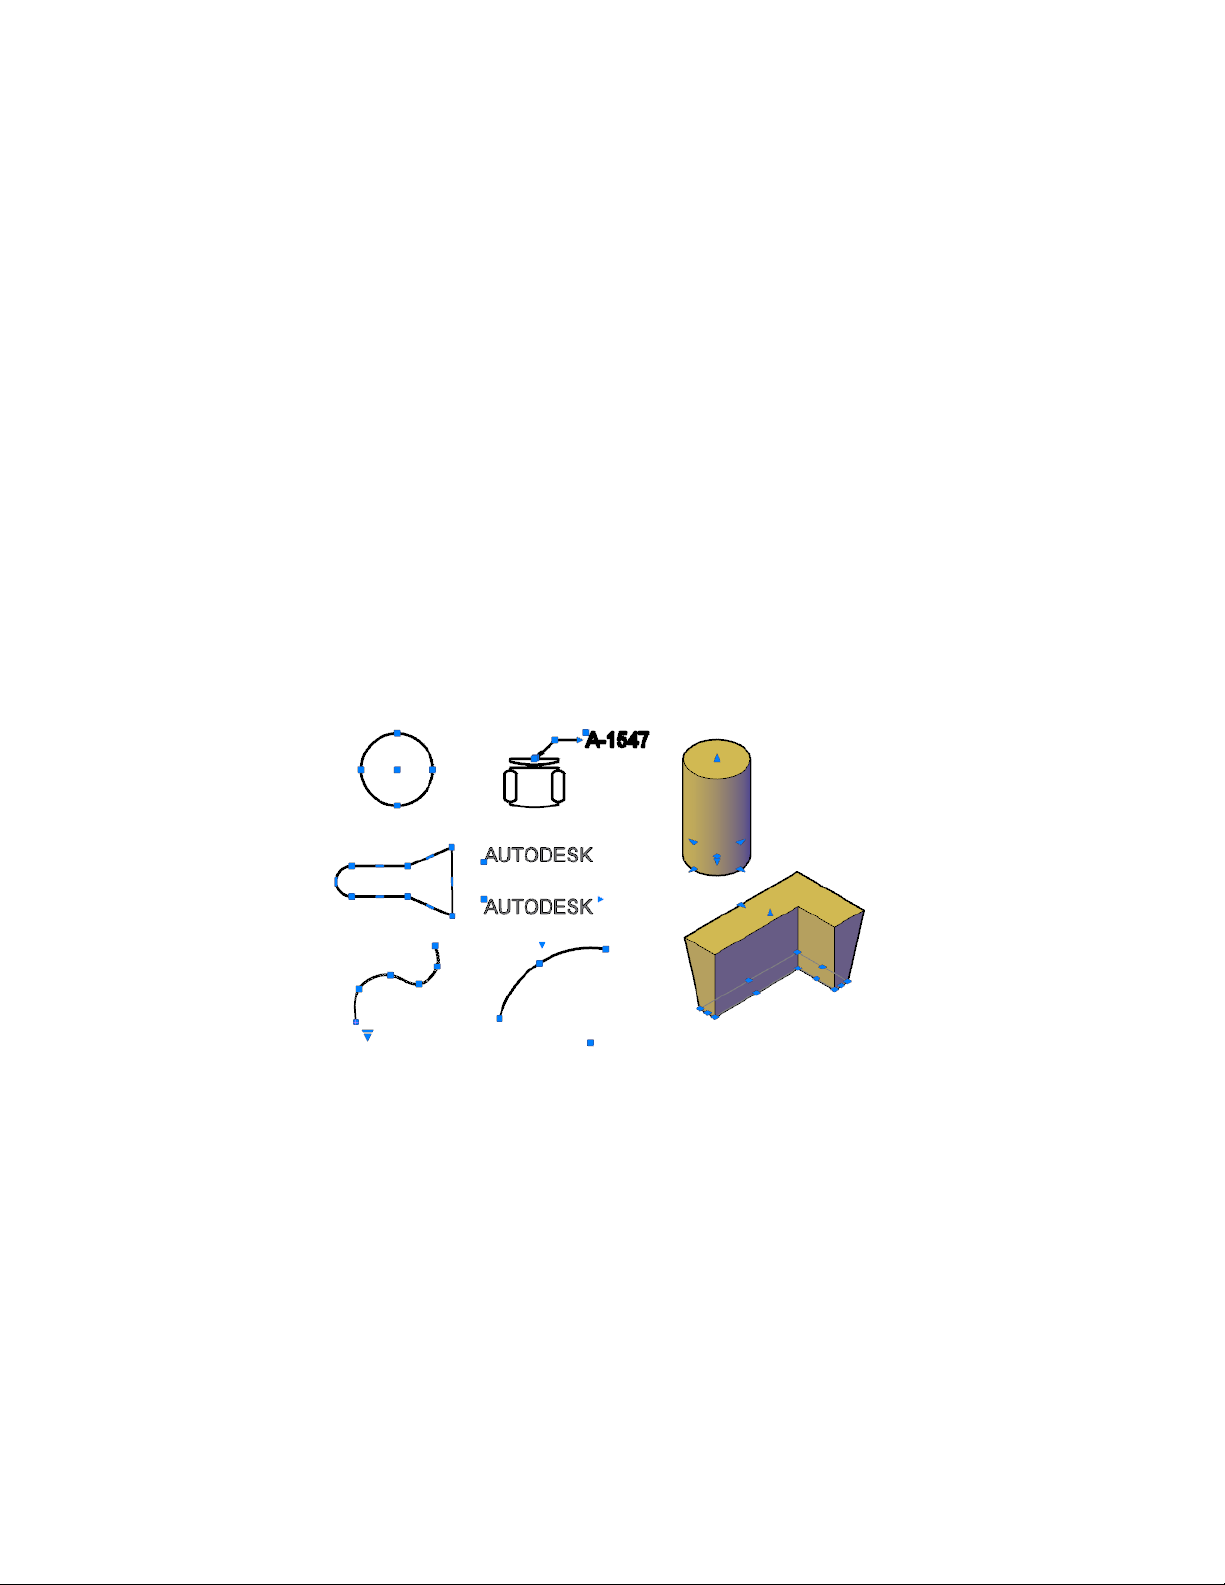
Overview
You can use grips in different ways:
■ Use grip modes. Select an object grip to work with the default grip
mode—stretch—or press Enter or Spacebar to cycle through the additional
grip modes—move, rotate, scale, and mirror. You can also right-click a selected
grip to see all available options on a shortcut menu.
■ Use multi-functional grips. For many objects, you can also hover over
a grip to access a menu with object-specific, and sometimes grip-specific,
editing options. Press Ctrl to cycle through the grip menu options.
Objects with Multi-Functional Grips
The following objects have multi-functional grips that offer object-specific
and, in some cases, grip-specific options:
■ 2D objects: Lines, polylines, arcs, elliptical arcs, and splines.
■ Annotation objects: Dimension objects and multileaders.
■ 3D solids: 3D faces, edges, and vertices.
Important Notes
■ Grips are not displayed on objects that are on locked layers.
■ When you select multiple objects that share coincident grips, you can edit
these objects using grip modes; however, any object- or grip-specific options
are not available.
234 | Chapter 6 Create and Modify Objects

Tips for Stretching with Grips
■ When you select more than one grip on an object to stretch it, the shape
of the object is kept intact between the selected grips. To select more than
one grip, press and hold the Shift key, and then select the appropriate
grips.
■ Grips on text, block references, midpoints of lines, centers of circles, and
point objects move the object rather than stretching it.
■ When a 2D object lies on a plane other than the current UCS, the object
is stretched on the plane on which it was created, not on the plane of the
current UCS.
■ If you select a quadrant grip to stretch a circle or ellipse and then specify
a distance at the Command prompt for the new radius—rather than moving
the grip—this distance is measured from the center of the circle, not the
selected grip.
Limit the Display of Grips to Improve Performance
You can limit the maximum number of objects that display grips. For example,
when a drawing contains hatch objects or polylines with many grips, selecting
these objects can take a long time. The GRIPOBJLIMIT system variable
suppresses the display of grips when the initial selection set includes more
than the specified number of objects. If you add objects to the current selection
set, the limit does not apply.
See also:
Choose a Method to Modify Objects (page 232)
Modify Polylines (page 272)
Modify Hatches and Fills (page 512)
Use Dynamic Input (page 166)
Use 3D Subobject Grips (page 418)
Modify Leaders Using Grips (page 532)
Modify Dimension Geometry (page 597)
Make Multiple Copies with Grips
You can create multiple copies of objects as you modify them with any of the
grip modes.
Select and Modify Objects | 235
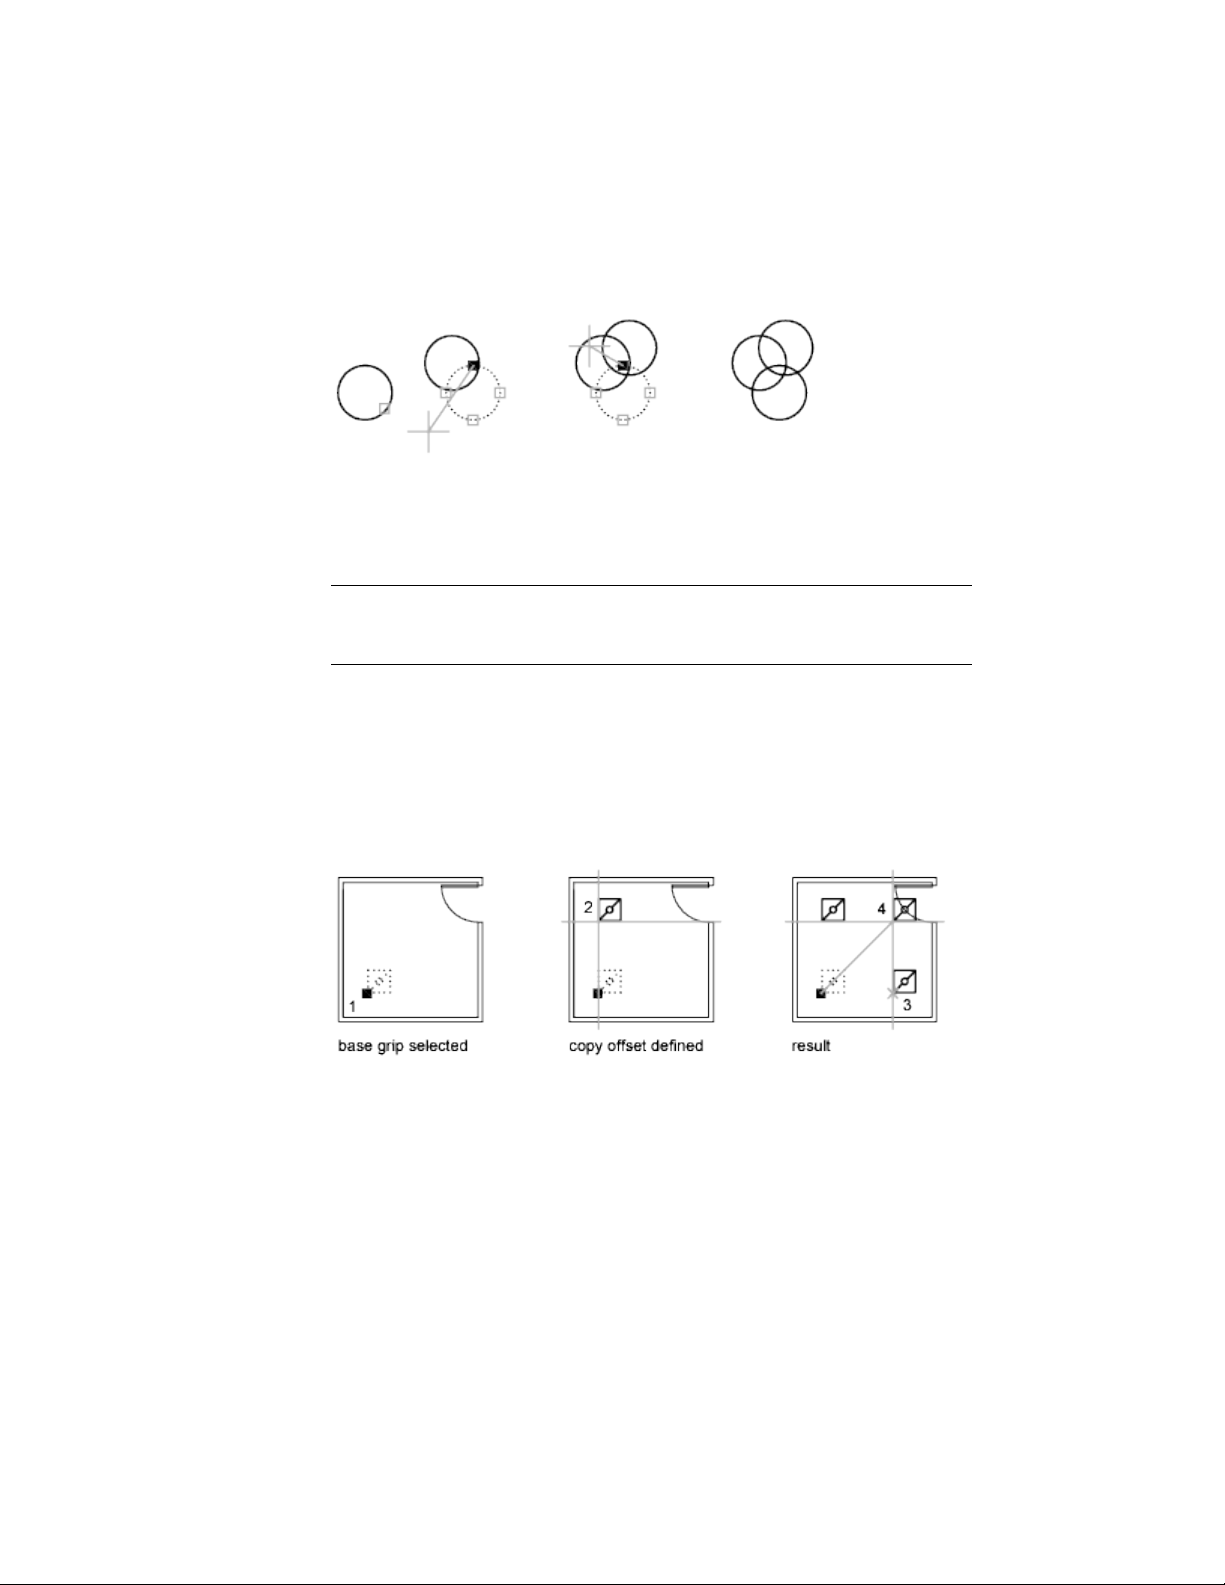
For example, by using the Copy option, you can rotate the selected objects,
leaving copies at each location you specify with the pointing device.
You can also make multiple copies by holding down Ctrl as you select the
first point. For example, with the Stretch grip mode, you can stretch an object,
such as a line, and then copy it to any point in the drawing area. Multiple
copies continue being made until you turn off grips.
NOTE When you use grips to make multiple copies of an annotative object that
contains multiple scale representations, only the current scale representation is
copied.
Define an Offset Snap or a Rotation Snap
You can place multiple copies at regularly spaced intervals with an offset snap.
The offset snap is defined by the distance between an object and the next
copy. In the lighting layout below, the first copy of the light fixture symbol
is placed at an offset of two units. All subsequent copies are then placed two
units apart.
If you hold down Ctrl while you select multiple copy points with the pointing
device, the graphics cursor snaps to an offset point based on the last two points
you selected. In the illustration below, the midpoint of line 1 is at coordinate
8,5. Based on that midpoint, line 2 was copied using the Ctrl key and Stretch
grip mode; its midpoint is at 9,5. The third line snaps to an offset based on
the coordinate values 10,5.
236 | Chapter 6 Create and Modify Objects
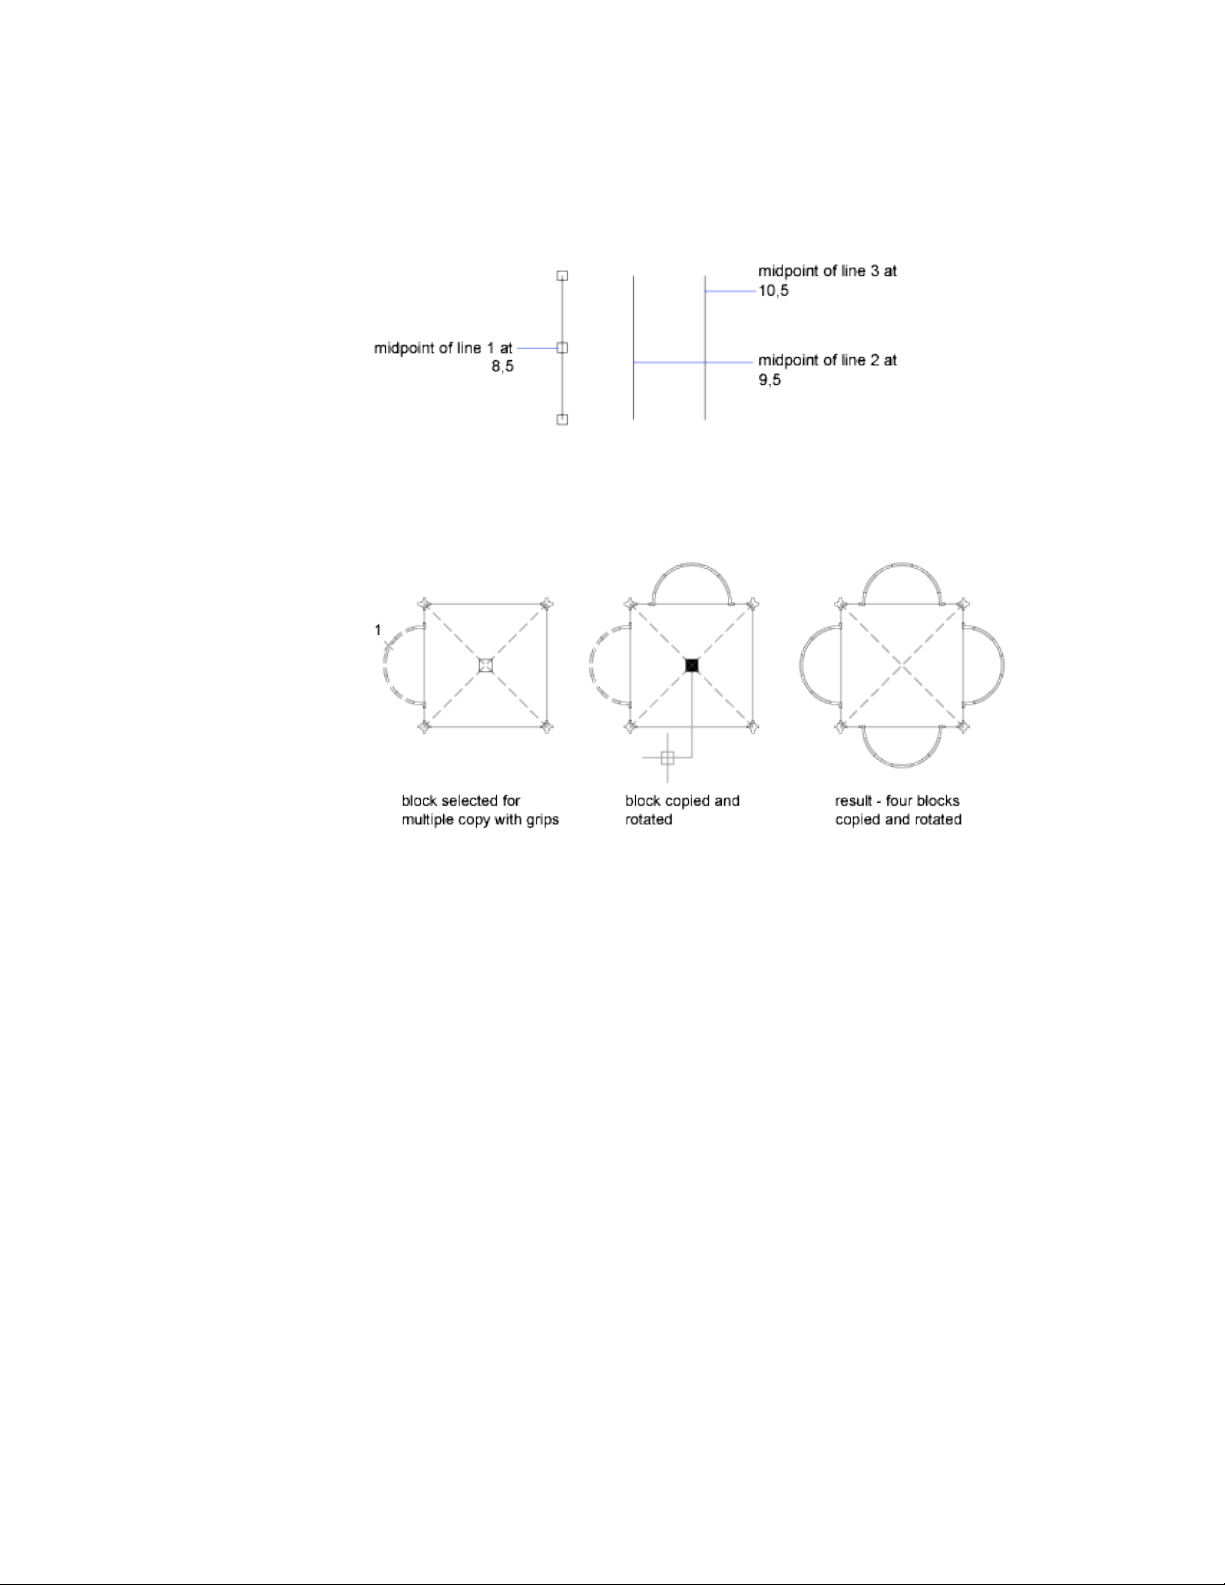
Similarly, you can place multiple copies at angular intervals around a base
grip with a rotation snap. The rotation snap is defined as the angle between
an object and the next copy when you are using Rotate grip mode. Hold down
Ctrl to use the rotation snap.
Control Grips in Blocks
You can specify whether a block displays a single grip or multiple grips.
You can specify whether a selected block reference displays a single grip at its
insertion point or displays multiple grips associated with the objects grouped
within the block.
Select and Modify Objects | 237
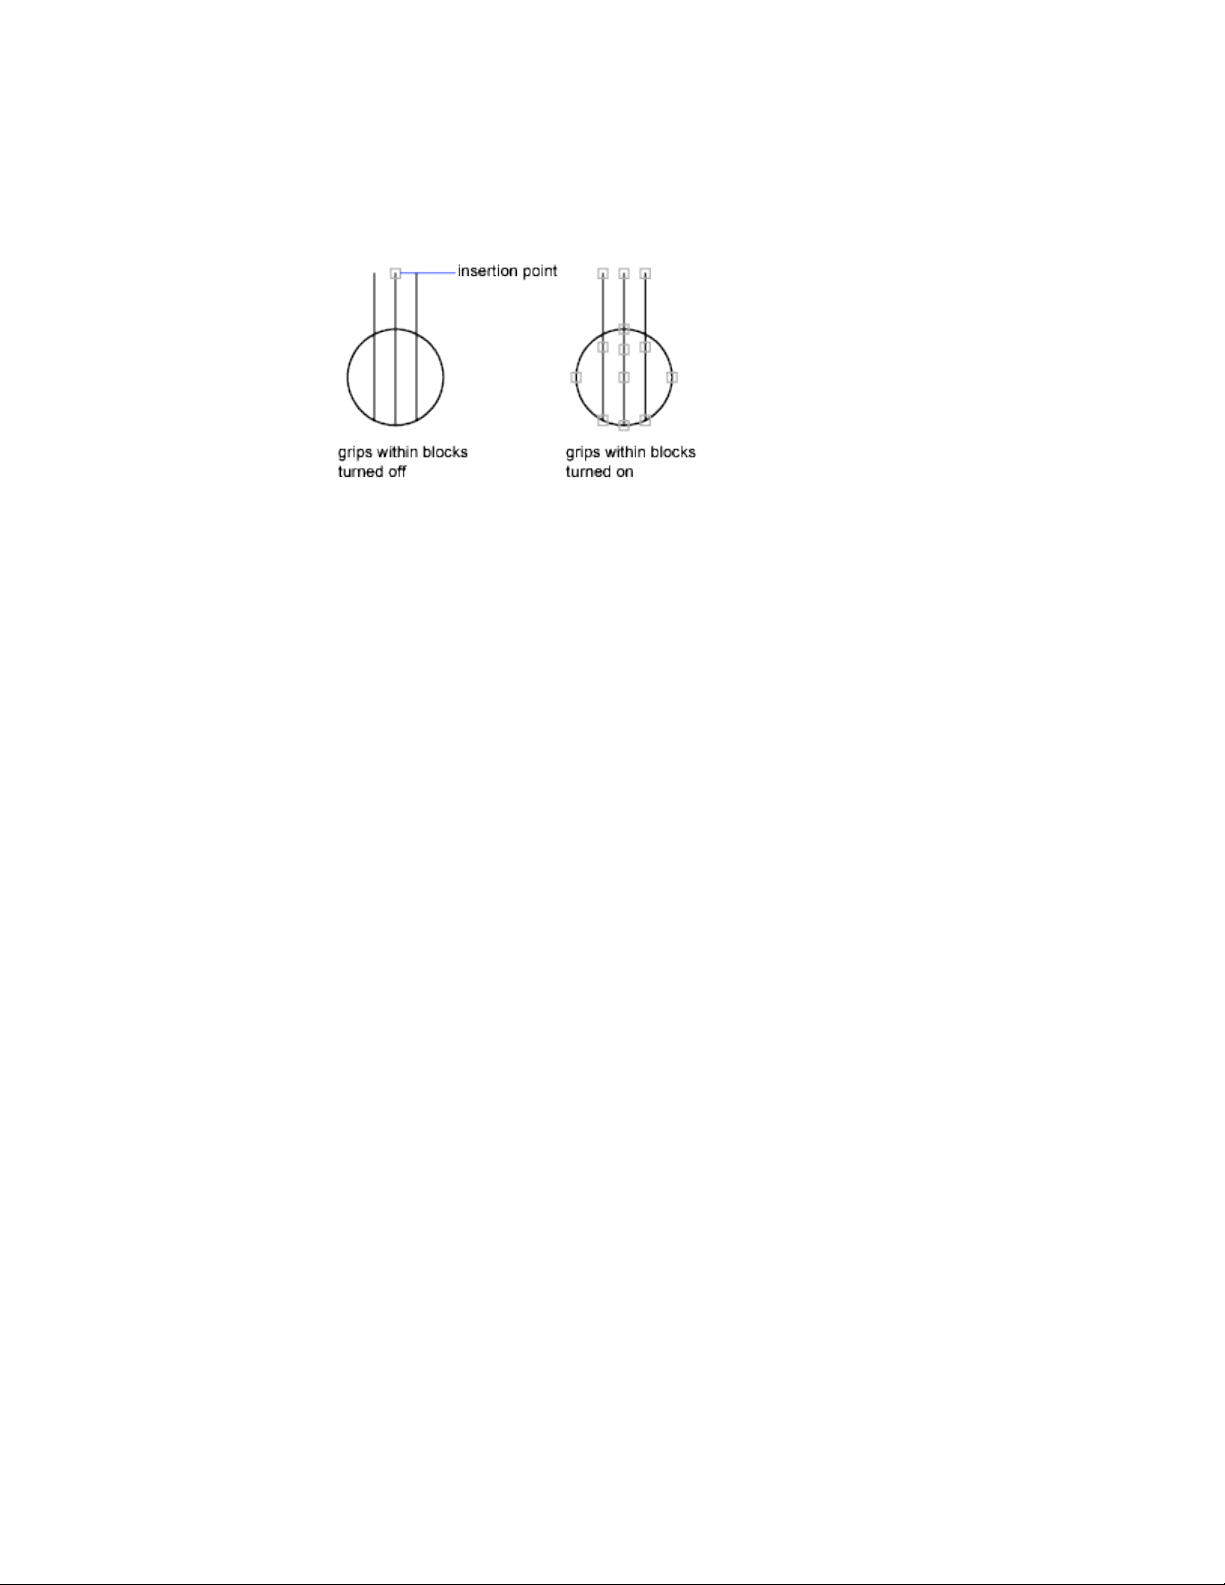
See also:
Use Object Grips (page 233)
Move or Rotate Objects
You can move objects to a different location, or change the orientation of
objects by rotating them by an angle or to other objects.
Move Objects
You can move objects at a specified distance and direction from the originals.
Use coordinates, grid snap, object snaps, and other tools to move objects with
precision.
Specify Distance with Two Points
Move an object using the distance and direction specified by a base point
followed by a second point. In this example, you move the block representing
a window. Select the object to be moved (1). Specify the base point for the
move (2) followed by a second point (3). The object is moved the distance
and direction of point 2 to point 3.
238 | Chapter 6 Create and Modify Objects
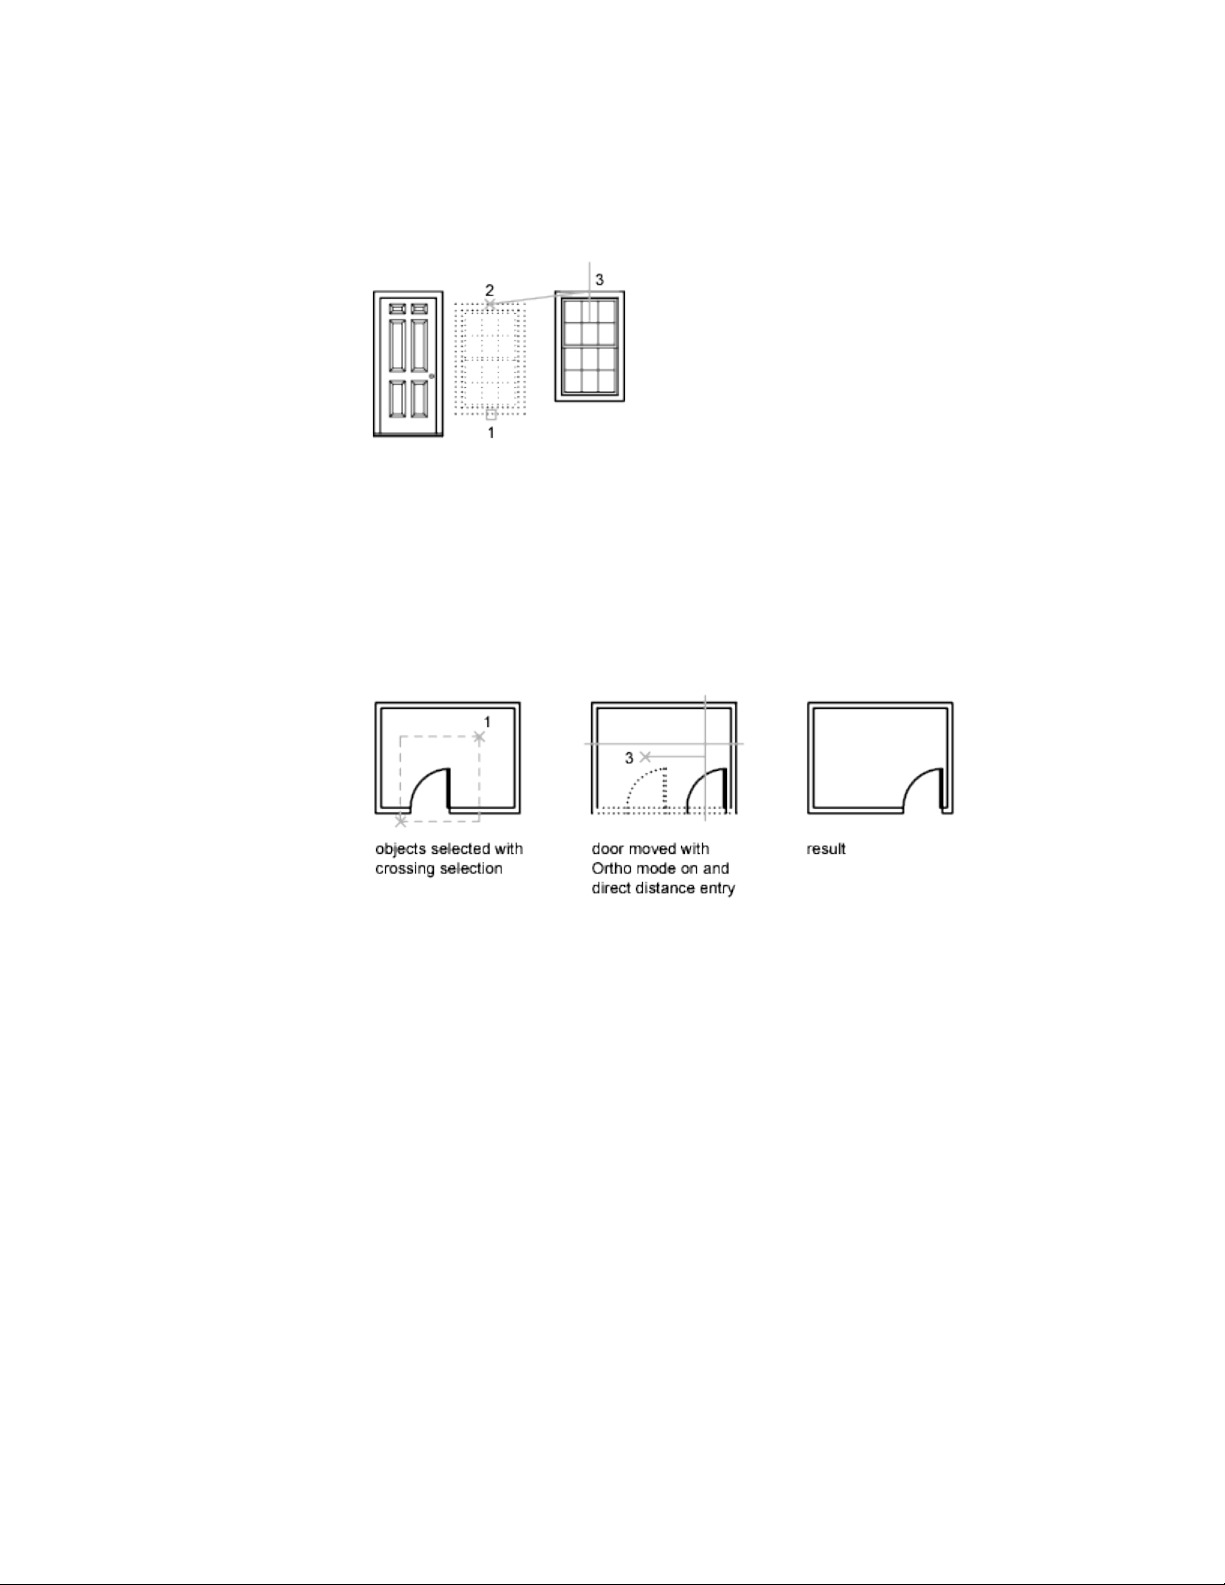
Use a Stretch-Move
You can also use STRETCH to move objects if all their endpoints lie entirely
within the selection window. Turn on Ortho mode or polar tracking to move
the objects at a specific angle.
A practical example is moving a door in a wall. The door in the illustration is
entirely within a crossing selection, while the wall lines are only partly within
the crossing selection area.
The result is that only the endpoints that lie within the crossing selection
move.
Nudge Objects
Selected objects can be nudged in orthogonal increments by pressing Ctrl +
arrow keys. Snap mode affects the distance and direction in which the objects
are nudged.
■ Nudge objects with Snap mode turned off: Objects move two pixels
at a time; movement is relative and orthogonal to the screen, regardless
of the view direction or the UCS orientation.
Select and Modify Objects | 239
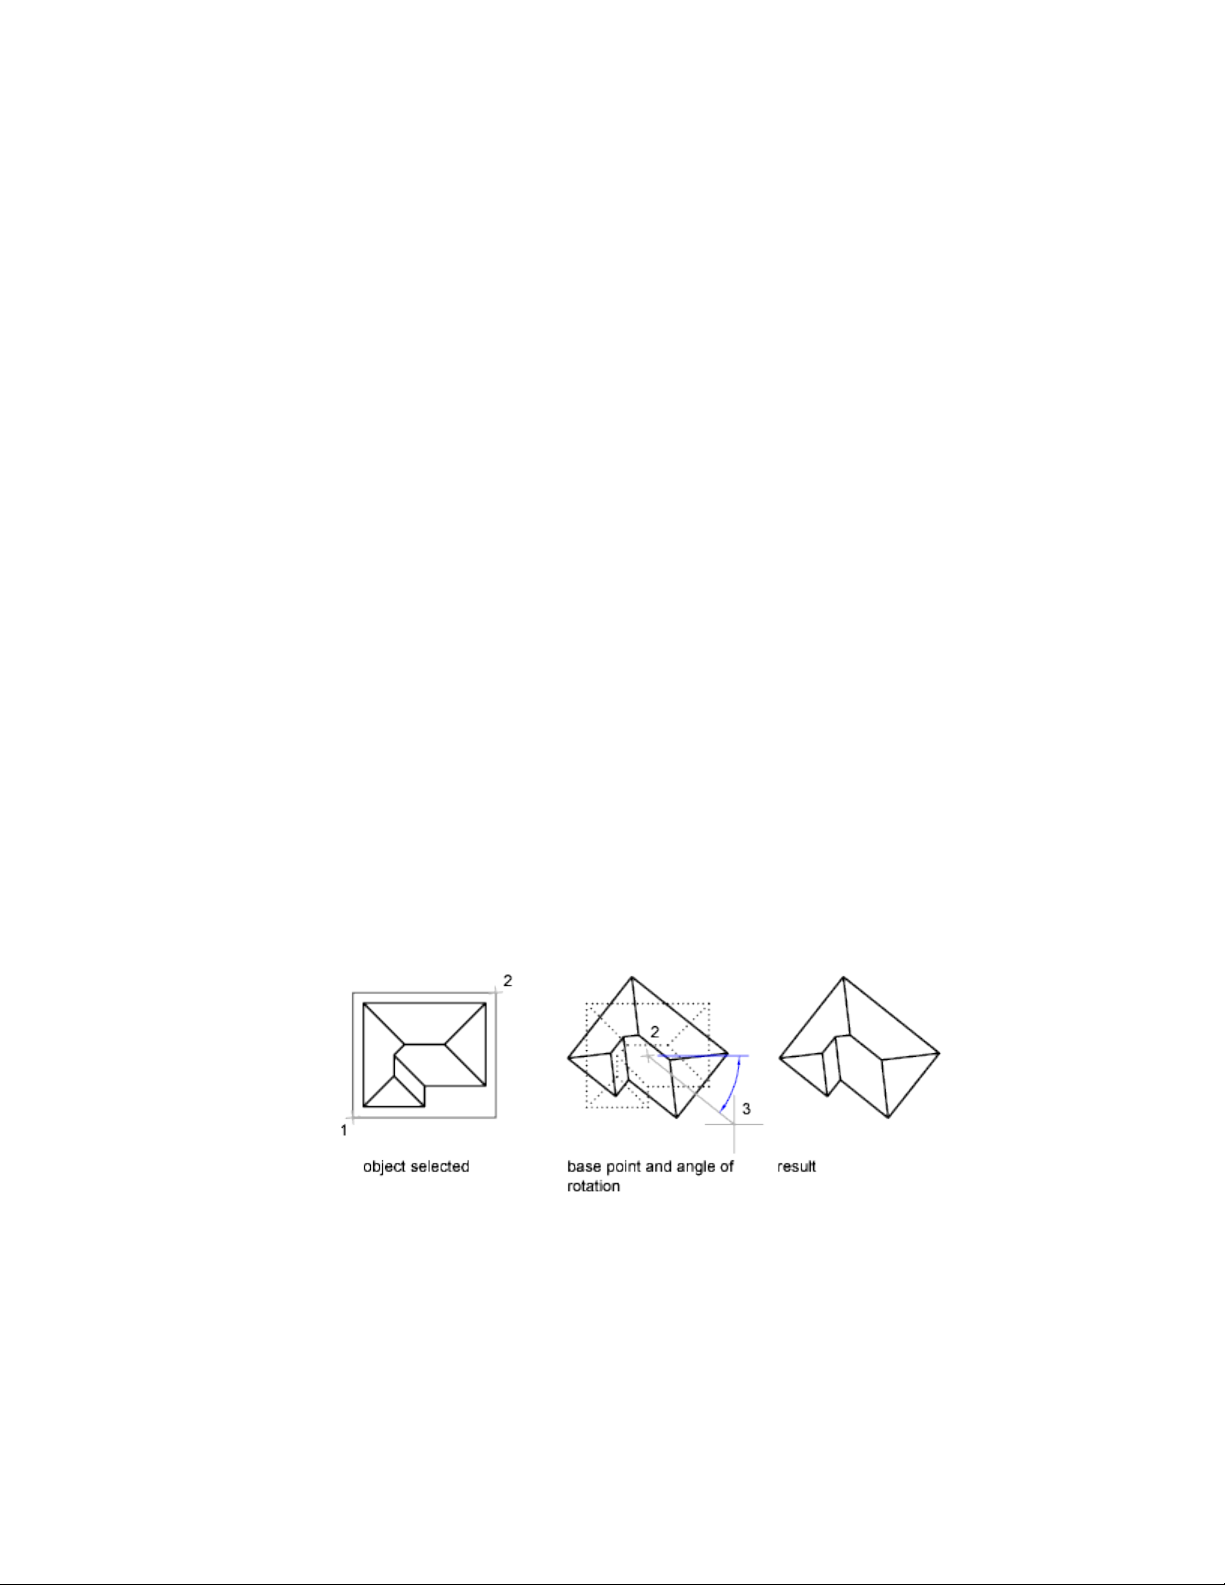
■ Nudge objects with Snap mode turned on: Objects are moved in
increments specified by the current snap spacing; movement is orthogonal
to the X and Y axes of the current UCS and relative to the view direction.
See also:
Modify Objects Using Grips (page 233)
Rotate Objects
You can rotate objects in your drawing around a specified base point.
To determine the angle of rotation, you can enter an angle value, drag using
the cursor, or specify a reference angle to align to an absolute angle.
Rotate an Object by a Specified Angle
Enter a rotation angle value from 0 to 360 degrees. You can also enter values
in radians, grads, or surveyor bearings. Entering a positive angle value rotates
the objects counterclockwise or clockwise, depending on the base angle
direction setting in the Drawing Units dialog box.
Rotate an Object by Dragging
Drag the object around the base point and specify a second point. Use Ortho
mode, polar tracking, or object snaps for greater precision.
For example, you can rotate the plan view of a house by selecting the objects
(1), specifying a base point (2), and specifying an angle of rotation by dragging
to another point (3).
240 | Chapter 6 Create and Modify Objects
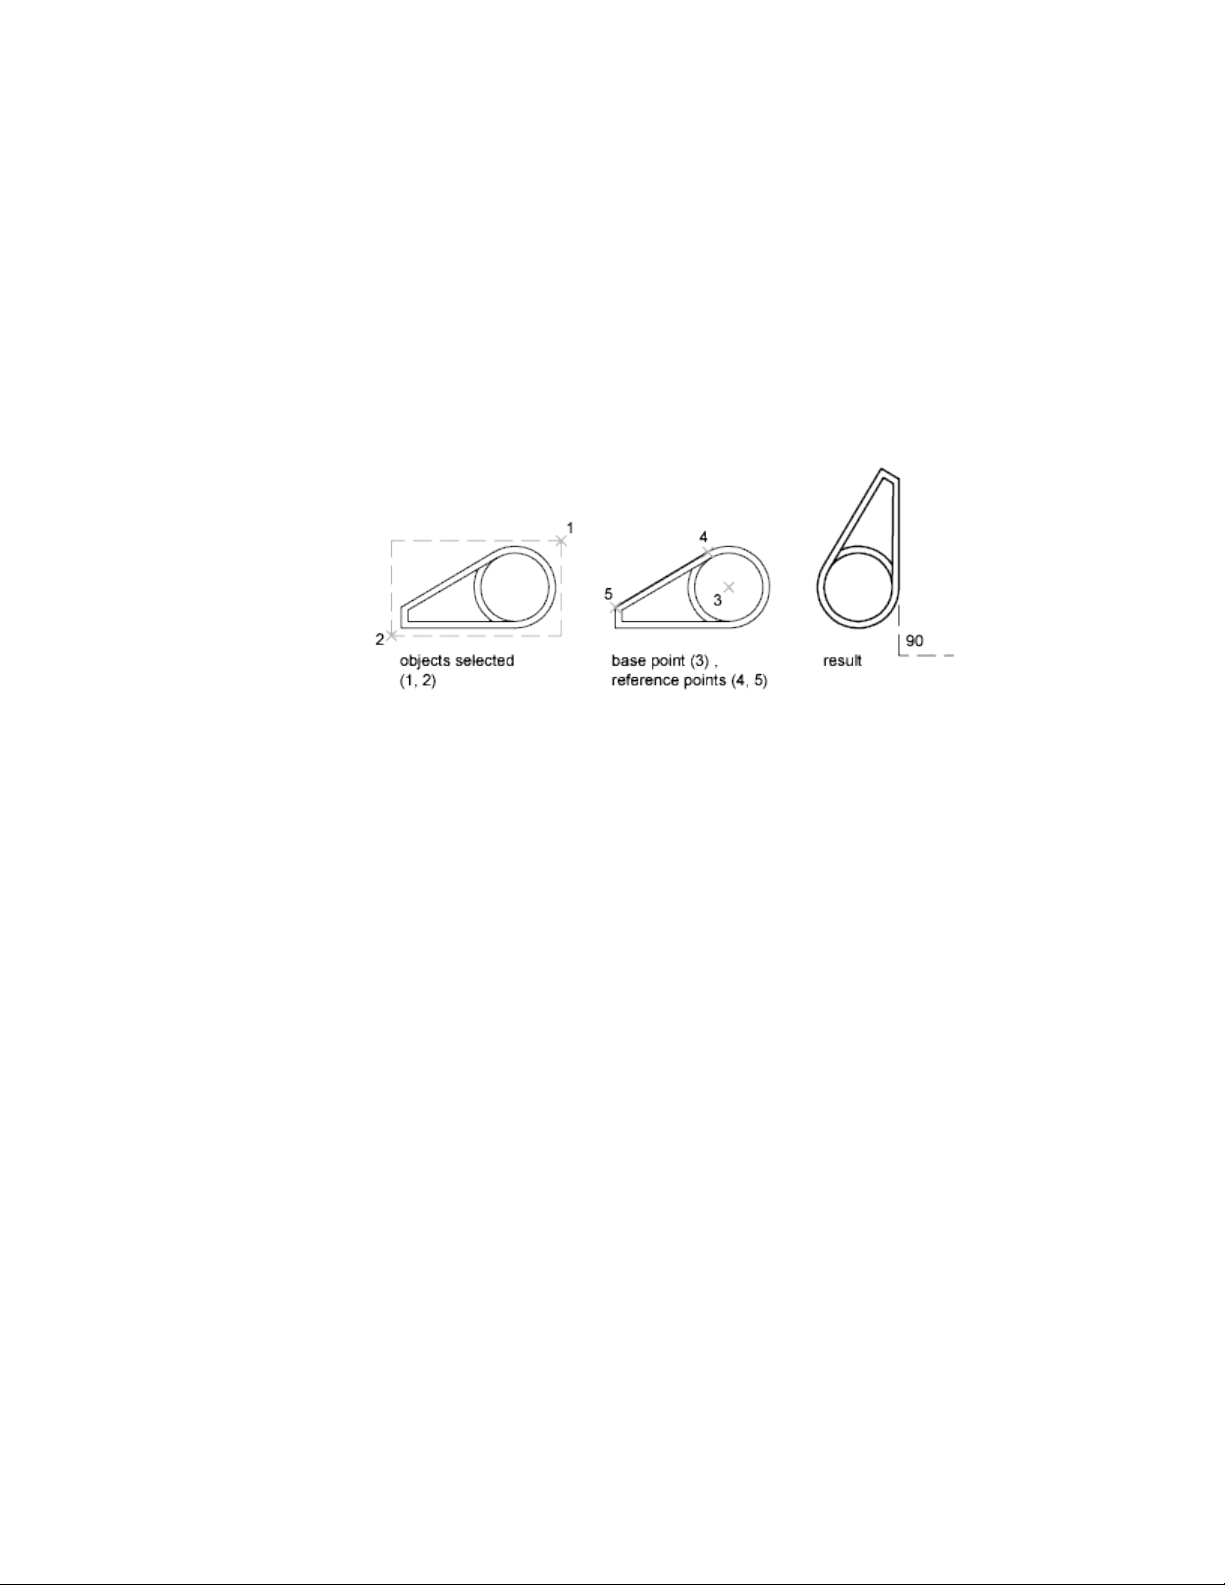
Rotate an Object to an Absolute Angle
With the Reference option, you can rotate an object to align it to an absolute
angle.
For example, to rotate the part in the illustration so the diagonal edge rotates
to 90 degrees, you select the objects to be rotated (1, 2), specify the base point
(3), and enter the Reference option. For the reference angle, specify the two
endpoints of the diagonal line (4, 5). For the new angle, enter 90.
Rotate an Object in 3D
To rotate 3D objects, you can use either ROTATE or ROTATE3D.
■ With ROTATE, you can rotate objects around a specified base point. The
axis of rotation passes through the base point and is parallel to the Z axis
of the current UCS.
■ With ROTATE3D, you can specify the axis of rotation using either two
points; an object; the X, Y, or Z axis; or the Z direction of the current view.
See also:
Rotate Views in Layout Viewports (page 100)
Align Objects
You can move, rotate, or tilt an object so that it aligns with another object.
In the following example, two pairs of points are used to align the piping in
2D using the ALIGN command. Endpoint object snaps align the pipes precisely.
Select and Modify Objects | 241
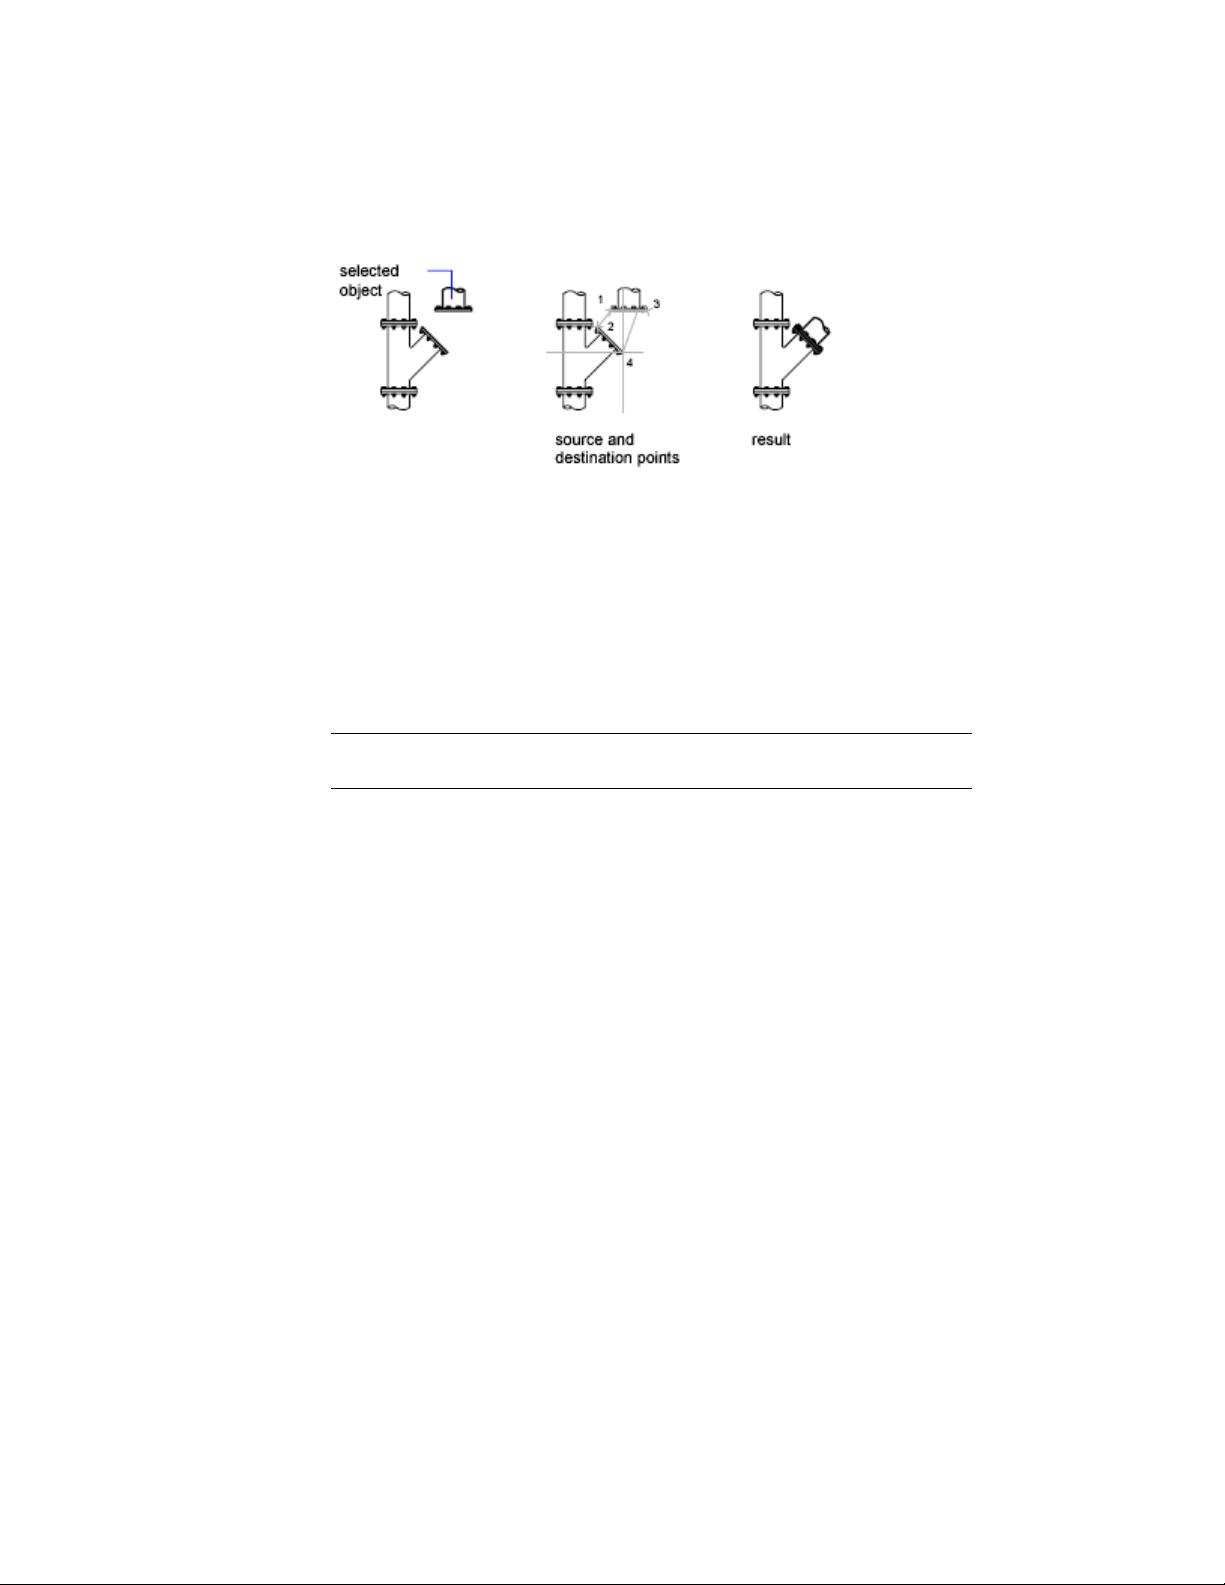
In 3D, use the 3DALIGN command to specify up to three points to define the
source plane followed by up to three points to define the destination plane.
■ The first source point on an object, called the base point, is always moved
to the first destination point.
■ Specifying a second point for either the source or the destination results
in the selected objects being rotated.
■ A third point for either the source or the destination results in further
rotation of the selected objects.
TIP With 3D solid models, it is recommended that you turn on dynamic UCS to
speed the selection of the destination plane.
Copy, Array, Offset, or Mirror Objects
You can create duplicates of objects in your drawing that are either identical
or similar to selected objects.
Copy Objects
You can create duplicates of objects at a specified distance and direction from
the originals.
Use coordinates, grid snap, object snaps, and other tools to copy objects with
precision.
You can also use grips to move and copy objects quickly.
242 | Chapter 6 Create and Modify Objects
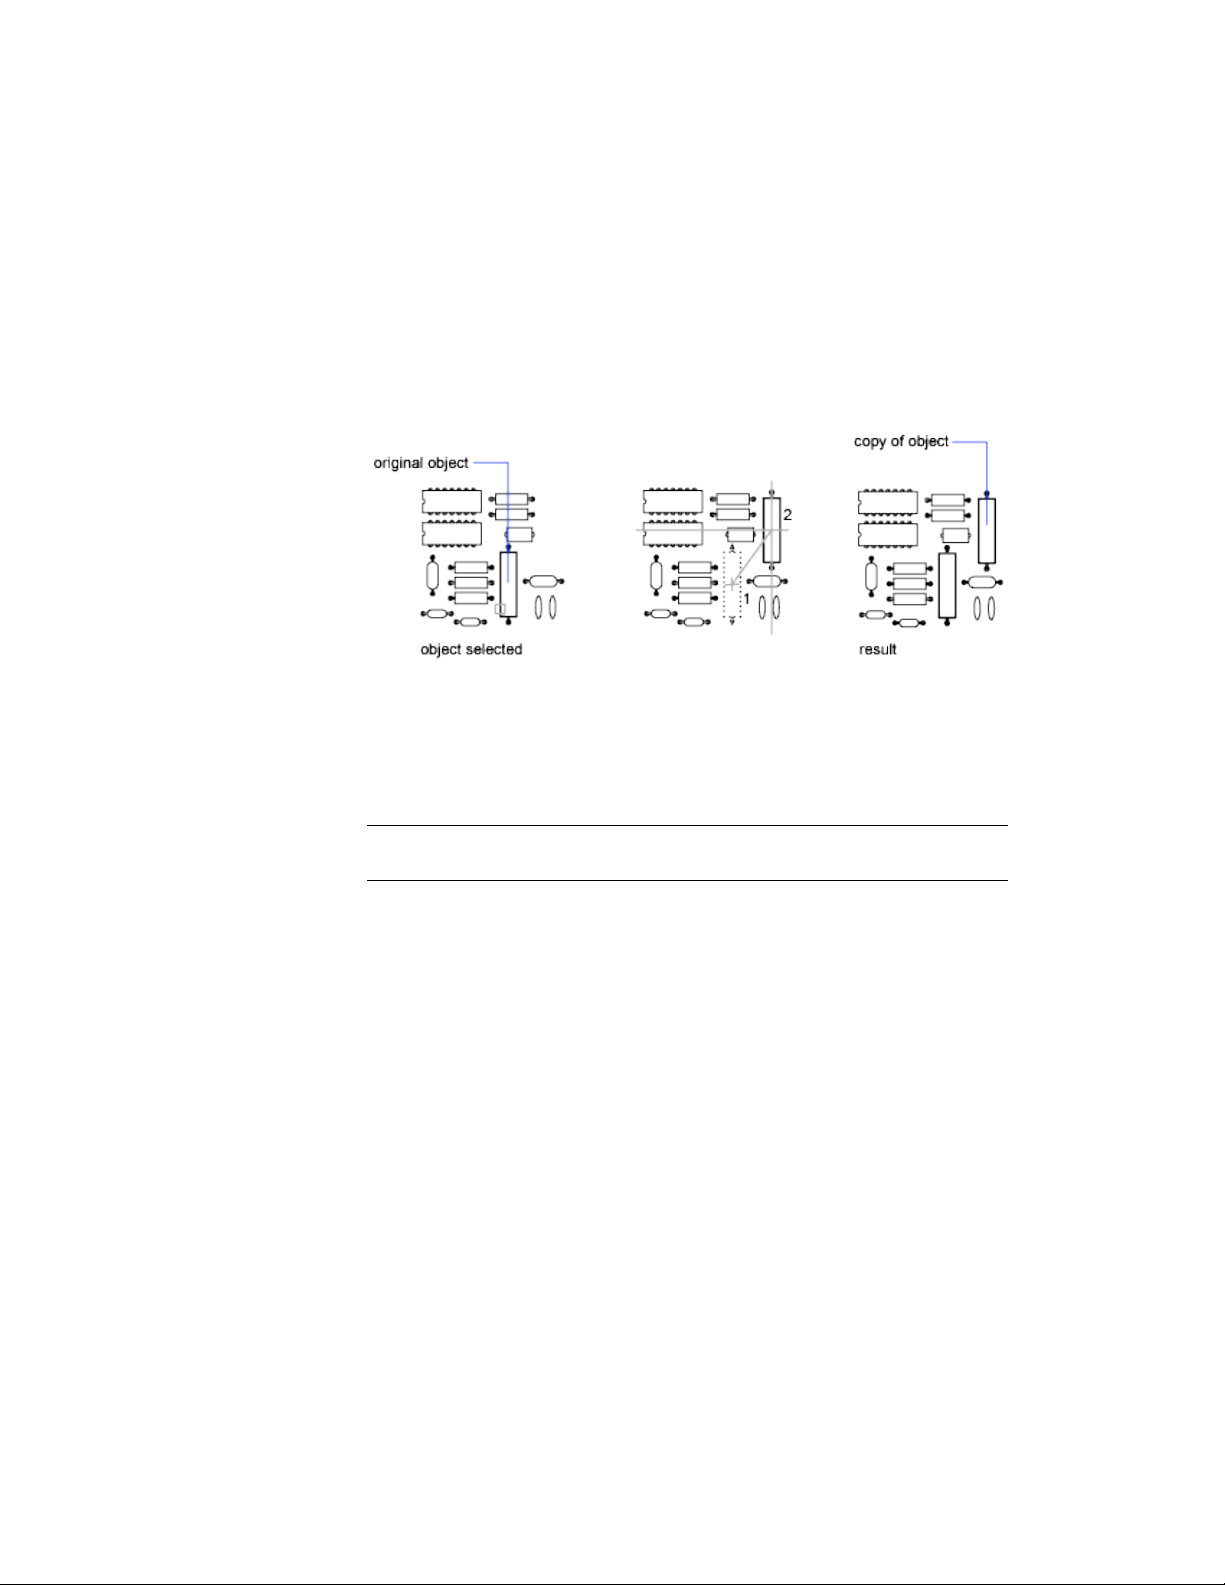
Specify Distance with Two Points
Copy an object using the distance and direction specified by a base point
followed by a second point. In this example, you copy the block representing
an electronic component. Select the original object to be copied. Specify the
base point for the move (1) followed by a second point (2). The object is copied
the distance and direction of point 1 to point 2.
Specify Distance with Relative Coordinates
Copy an object using a relative distance by entering coordinate values for the
first point and pressing Enter for the second point. The coordinate values are
used as a relative displacement rather than the location of a base point.
NOTE Do not include an @ sign as you normally would for relative coordinates,
because relative coordinates are expected.
To copy objects a specified distance, you can also use direct distance entry
with Ortho mode and polar tracking.
Create Multiple Copies
With COPY, you can create multiple copies from the specified selection set
and base point.
Select and Modify Objects | 243
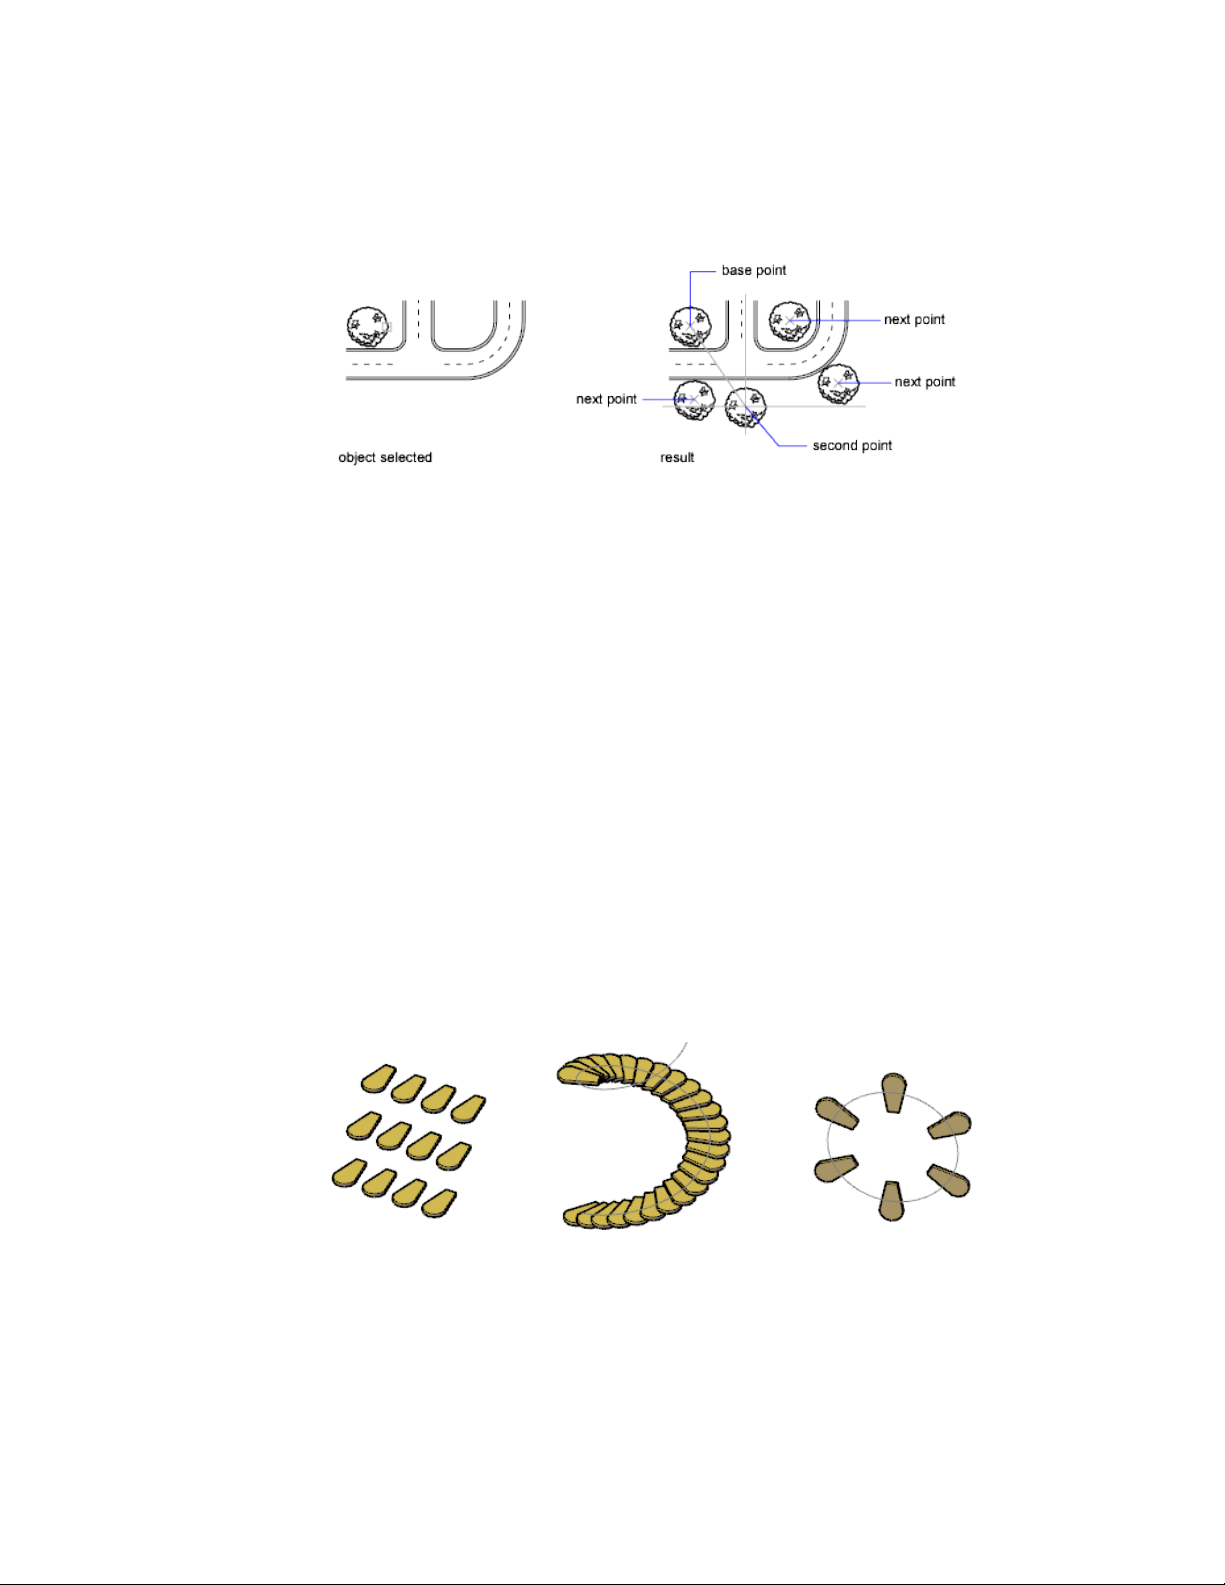
See also:
Modify Objects Using Grips (page 233)
Enter Direct Distances (page 185)
Array Objects (page 244)
Array Objects
Create multiple copies of objects that are evenly distributed in a rectangular
or circular pattern, or along a specified path.
Overview of Arrays
Create copies of objects arranged in a pattern called an array.There are three
types of arrays:
■ Rectangular
■ Path
■ Polar
244 | Chapter 6 Create and Modify Objects
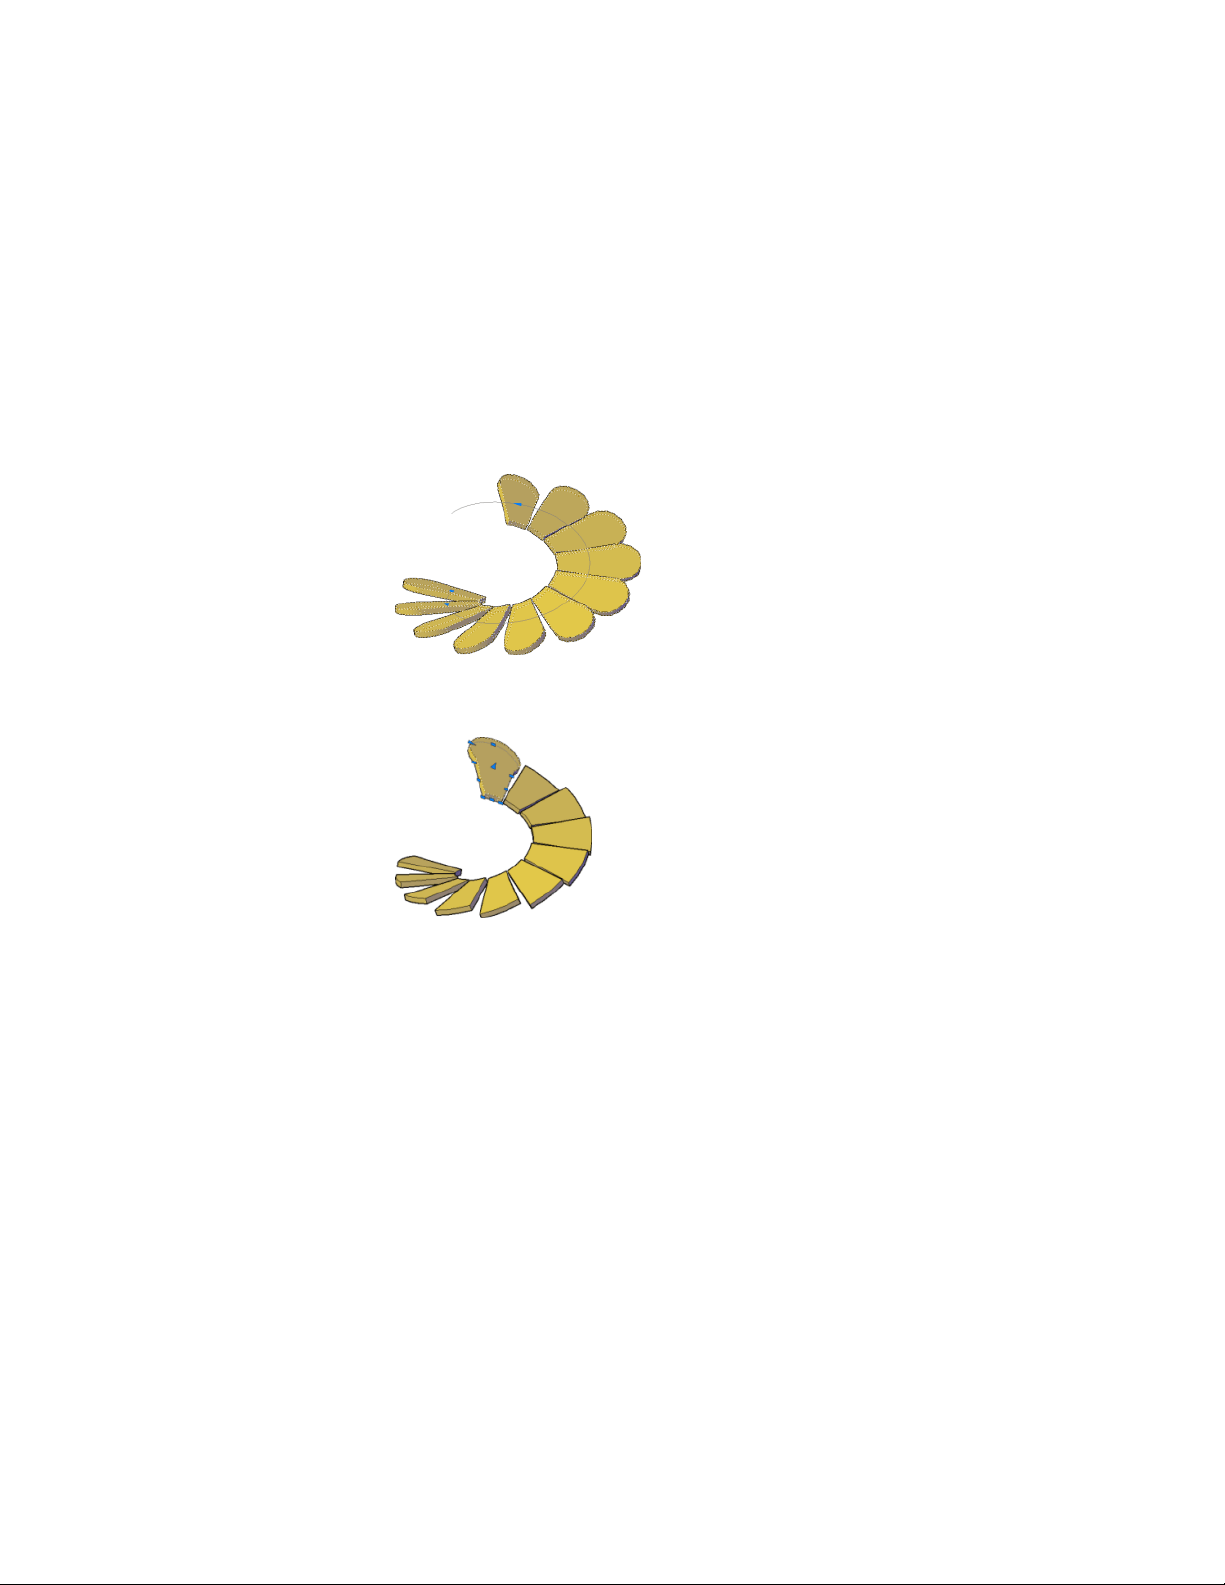
Control Array Associativity
Associativity allows you to quickly propagate changes throughout an array
by maintaining relationships between items. Arrays can be associative or
non-associative.
■ Associative. Items are contained in a single array object, similar to a block.
Edit the array object properties, such as the spacing or number of items.
Override item properties or replace an item’ s source objects. Edit an item’ s
source objects to change all items that reference those source objects.
■ Non-associative.Items in the array are created as independent objects.
Changes to one item do not affect the other items.
Create Rectangular Arrays
In rectangular arrays, items are distributed into any combination of rows,
columns, and levels.
A dynamic preview allows you to quickly derive the number and spacing of
rows and columns. Add levels to make a 3D array.
The following illustration shows a rectangular array with three rows, three
columns, and three levels.
Select and Modify Objects | 245
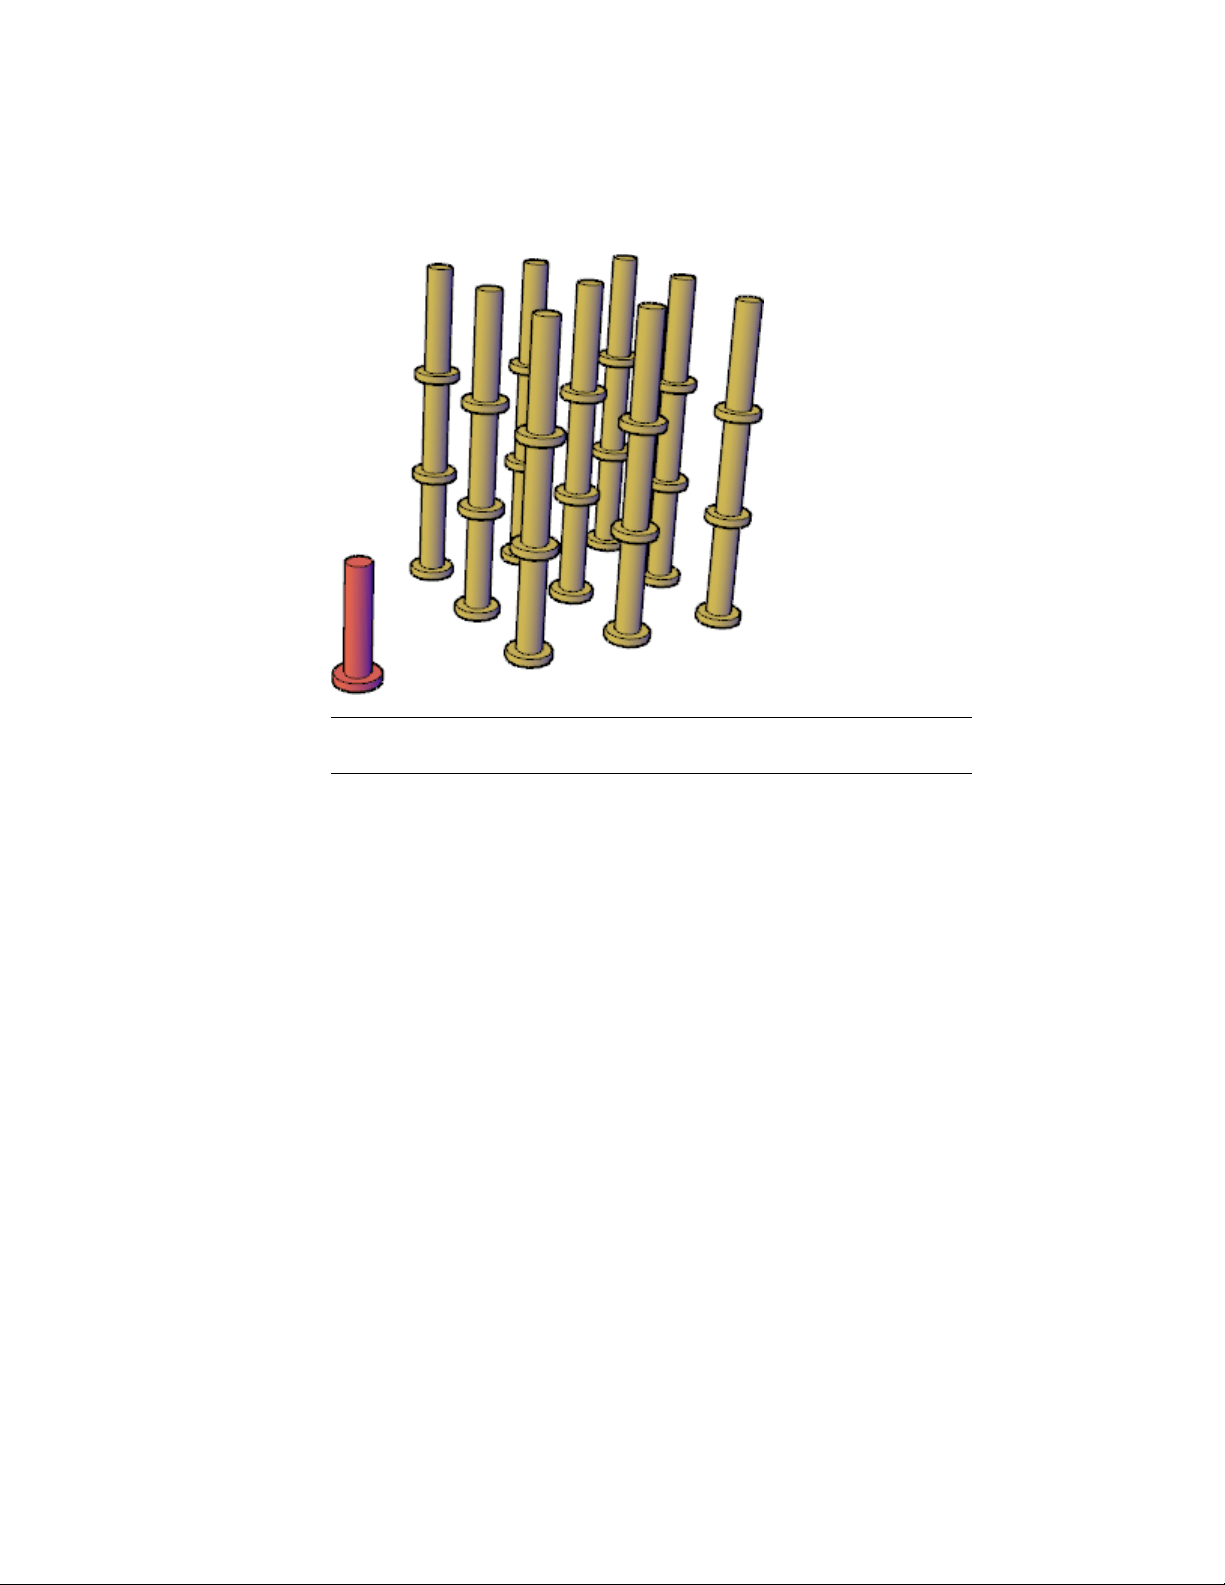
NOTE Although you cannot create the objects in this example in AutoCAD LT,
you can create an array with multiple levels.
By dragging the array grips, you can increase or decrease the number and
spacing of the rows and columns in the array.
You can rotate the array around the base point in the XY plane. At creation,
the row and column axes are orthogonal to each other; for associative arrays,
you can later edit the axis angles.
Create Path Arrays
In path arrays, items are evenly distributed along a path or a portion of a path.
A path can be a line, polyline, 3D polyline, spline, helix, arc, circle, or ellipse.
246 | Chapter 6 Create and Modify Objects
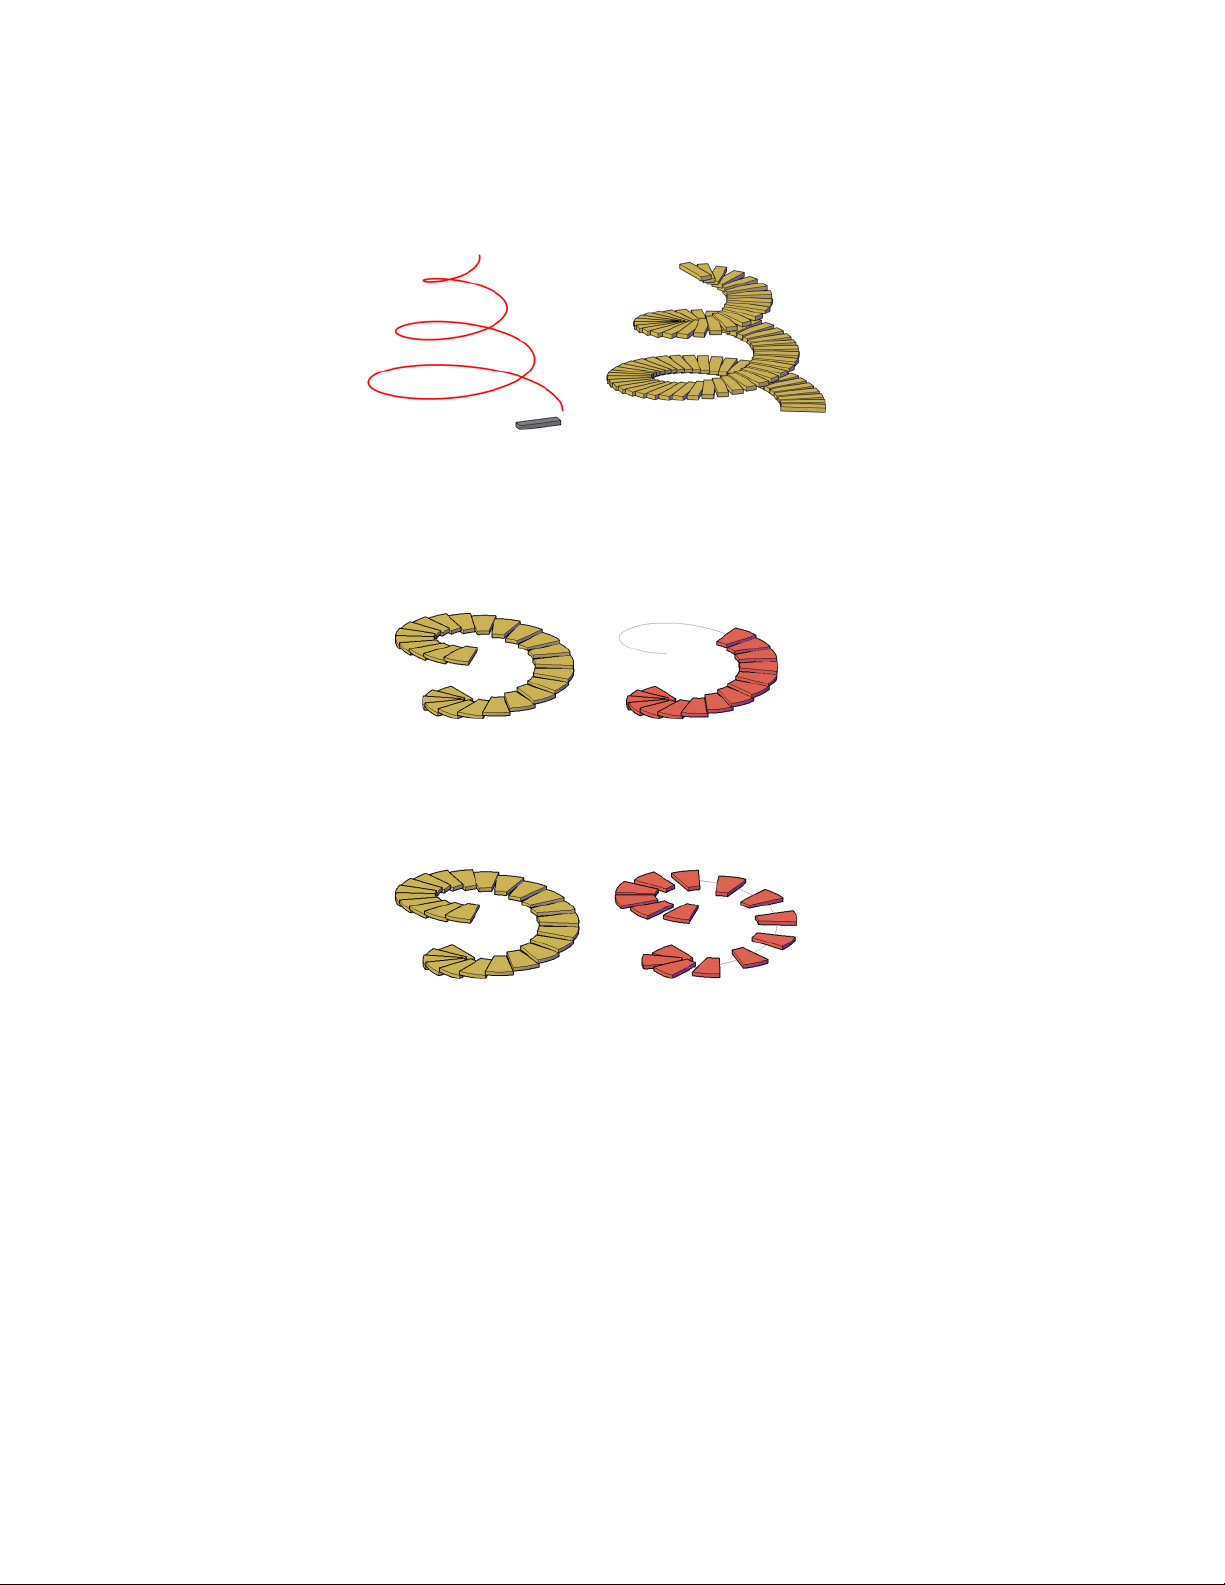
Control Item Distribution
The distribution of items along the path can be measured or divided.
■ Measure. The array follows the path when it is edited but the number of
objects and spacing do not change. If the path is edited and becomes too
short to display all objects, the count is automatically adjusted.
■ Divide. The number of objects and the length of the path determine the
spacing of the objects in the array. The objects are always spaced evenly
along the entire length of the path. When the array is associative, the
spacing between the objects automatically adjusts as the length of the path
changes after it is created.
Create Polar Arrays
In polar arrays, items are evenly distributed about a center point or axis of
rotation.
When you create a polar array using the center point, the axis of rotation is
the Z axis of the current UCS. You can redefine the axis of rotation by
specifying two points..
Select and Modify Objects | 247
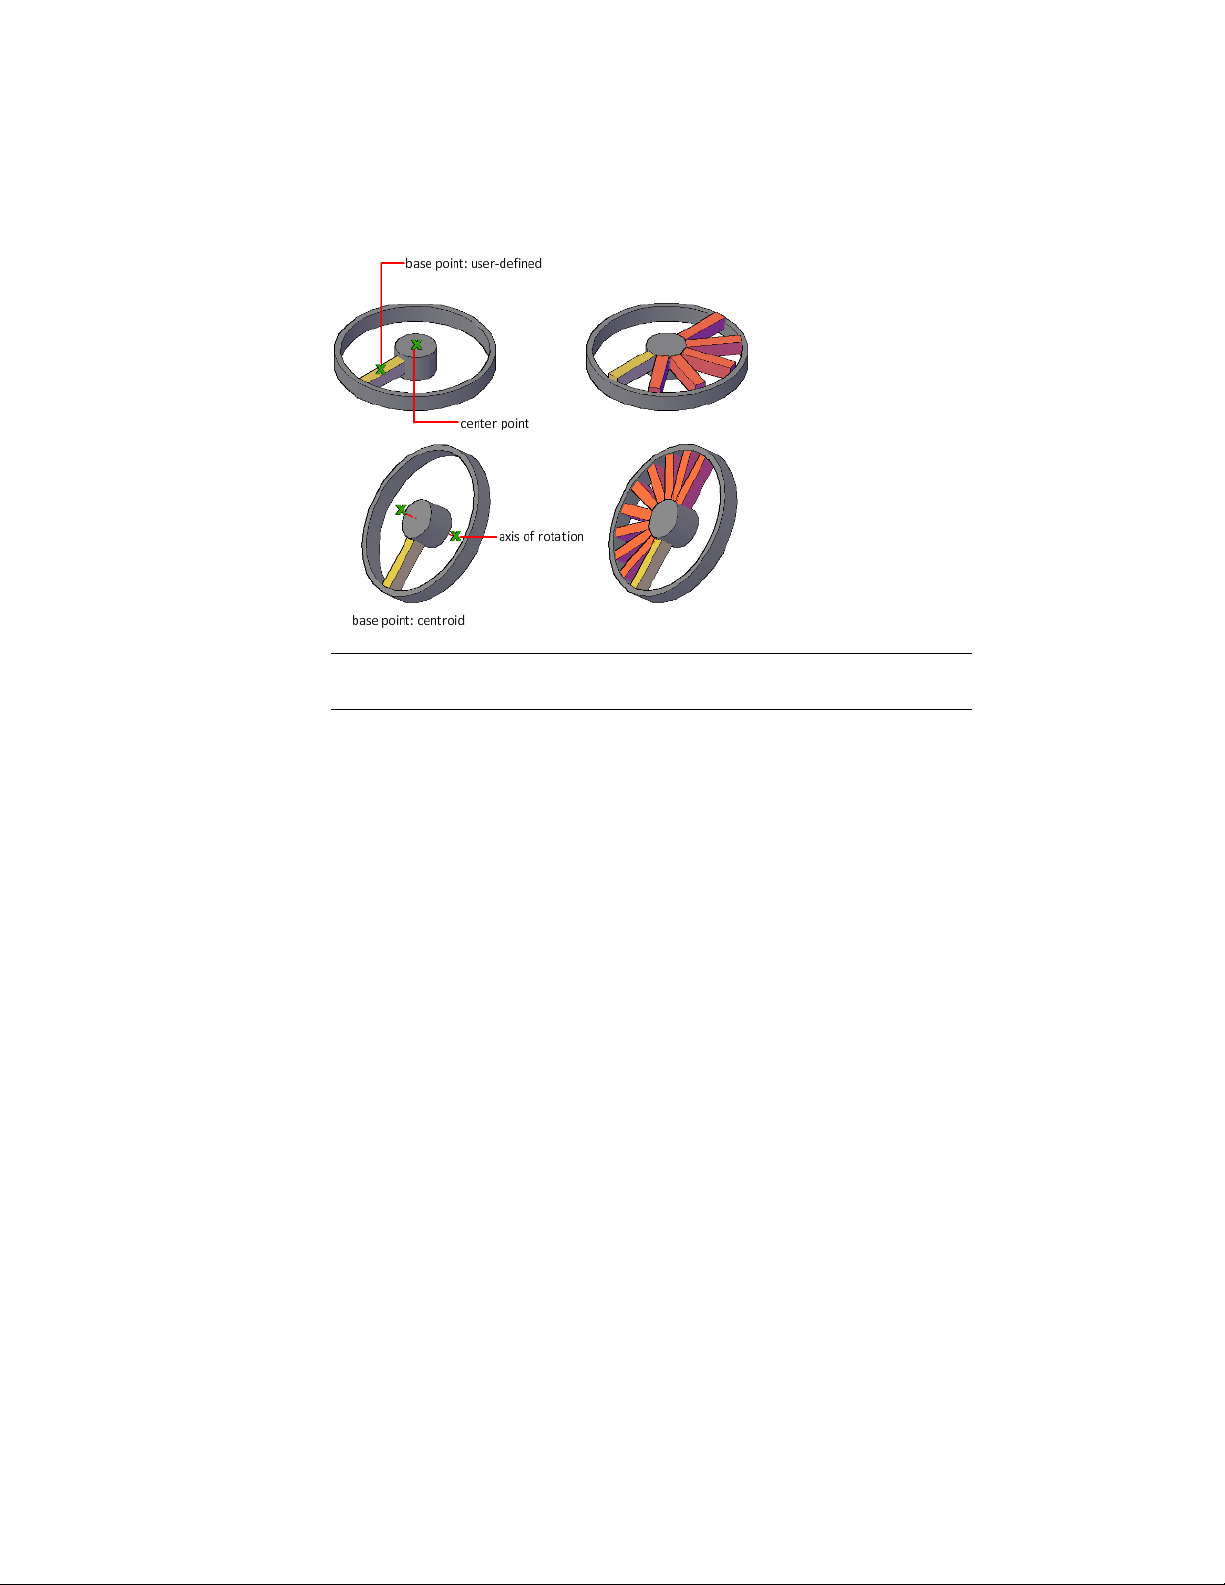
NOTE Although you cannot create the objects in this example in AutoCAD LT,
you can create an array that is aligned along an axis of rotation.
The direction in which the array is drawn depends on whether you enter a
positive or negative value for the fill angle. For associative arrays, you can
change the direction in the Properties Inspector.
Edit Associative Arrays
Modify associative arrays by editing the array properties, applying item
overrides, replacing selected items, or editing source objects.
The advantage of using associative arrays is that changes made to one object
in the array can affect other objects in array. You can use several editing
methods:
■ Grip editing
■ ARRAYEDIT command
■ <type> Array visors
■ Properties Inspector.
248 | Chapter 6 Create and Modify Objects
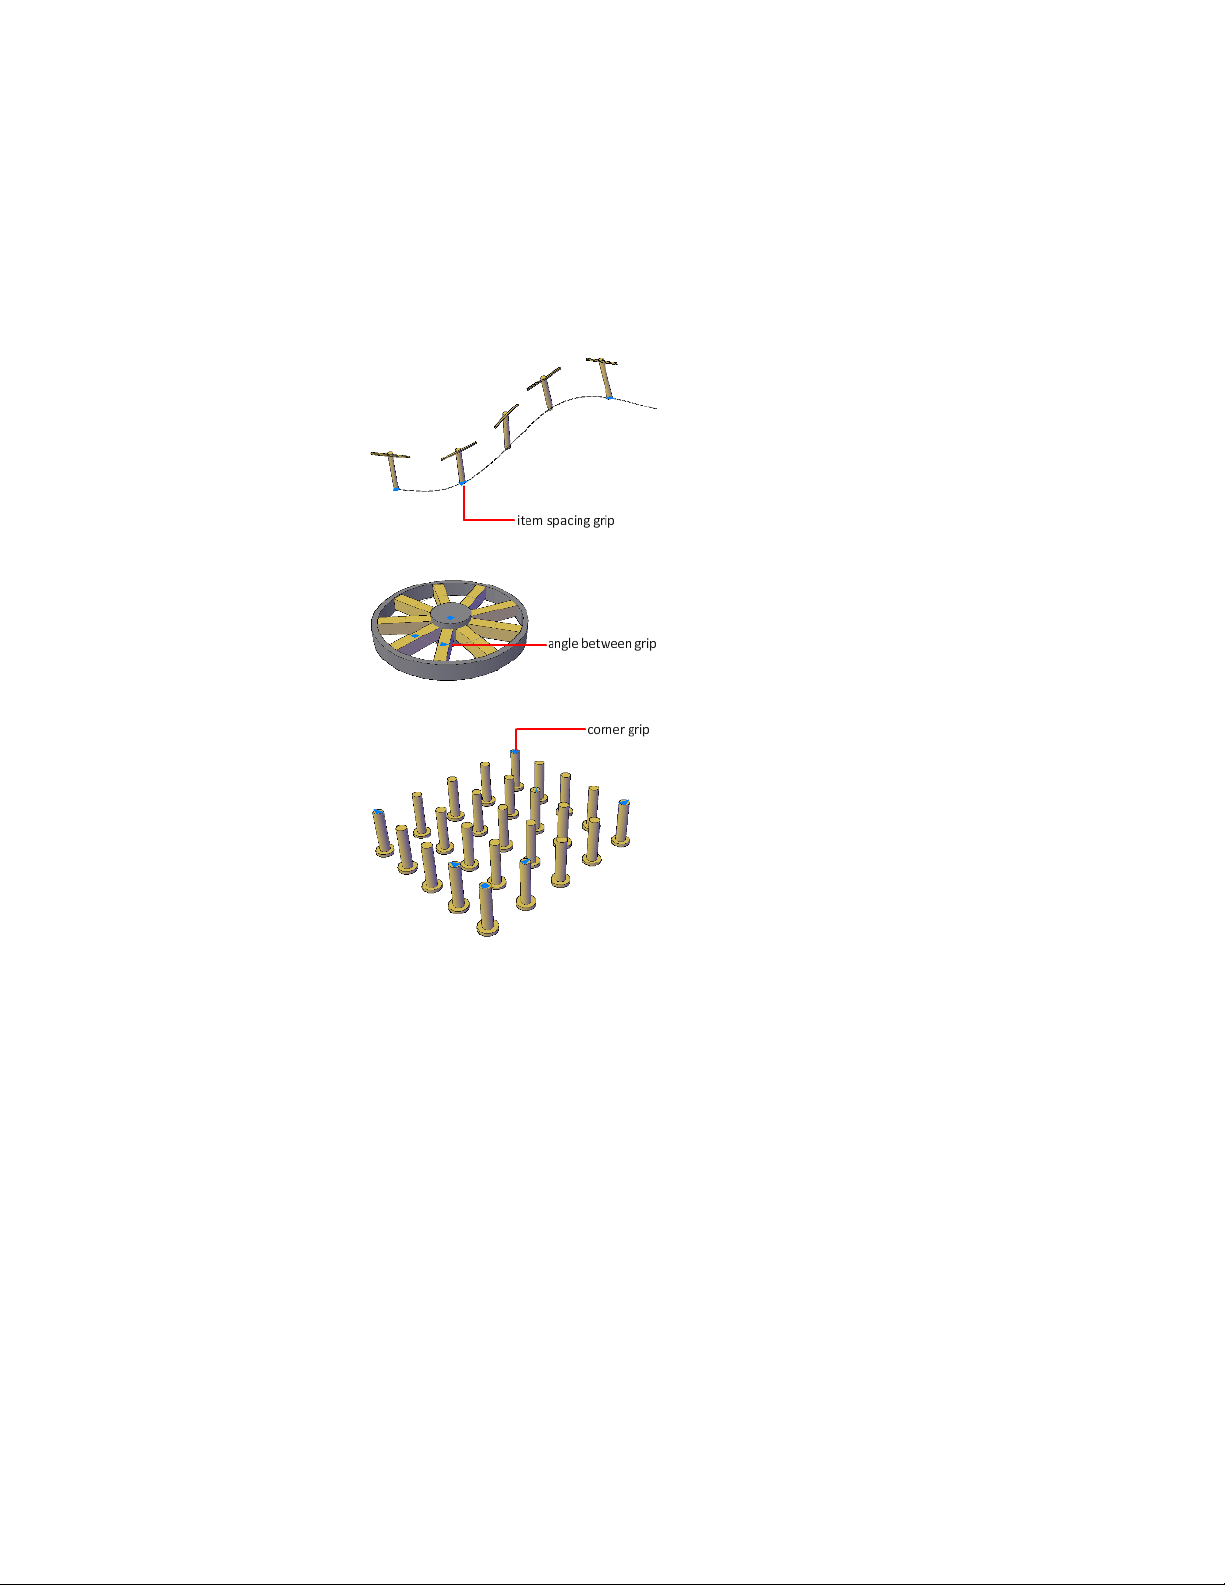
Array Grips
The type of grips and dynamic menu options displayed depend on the type
of array.
Apply Item Overrides
Ctrl-click items in the array to erase, move, rotate, or scale the selected items
without affecting the rest of the array. Reset the array to remove all item
overrides.
Select and Modify Objects | 249
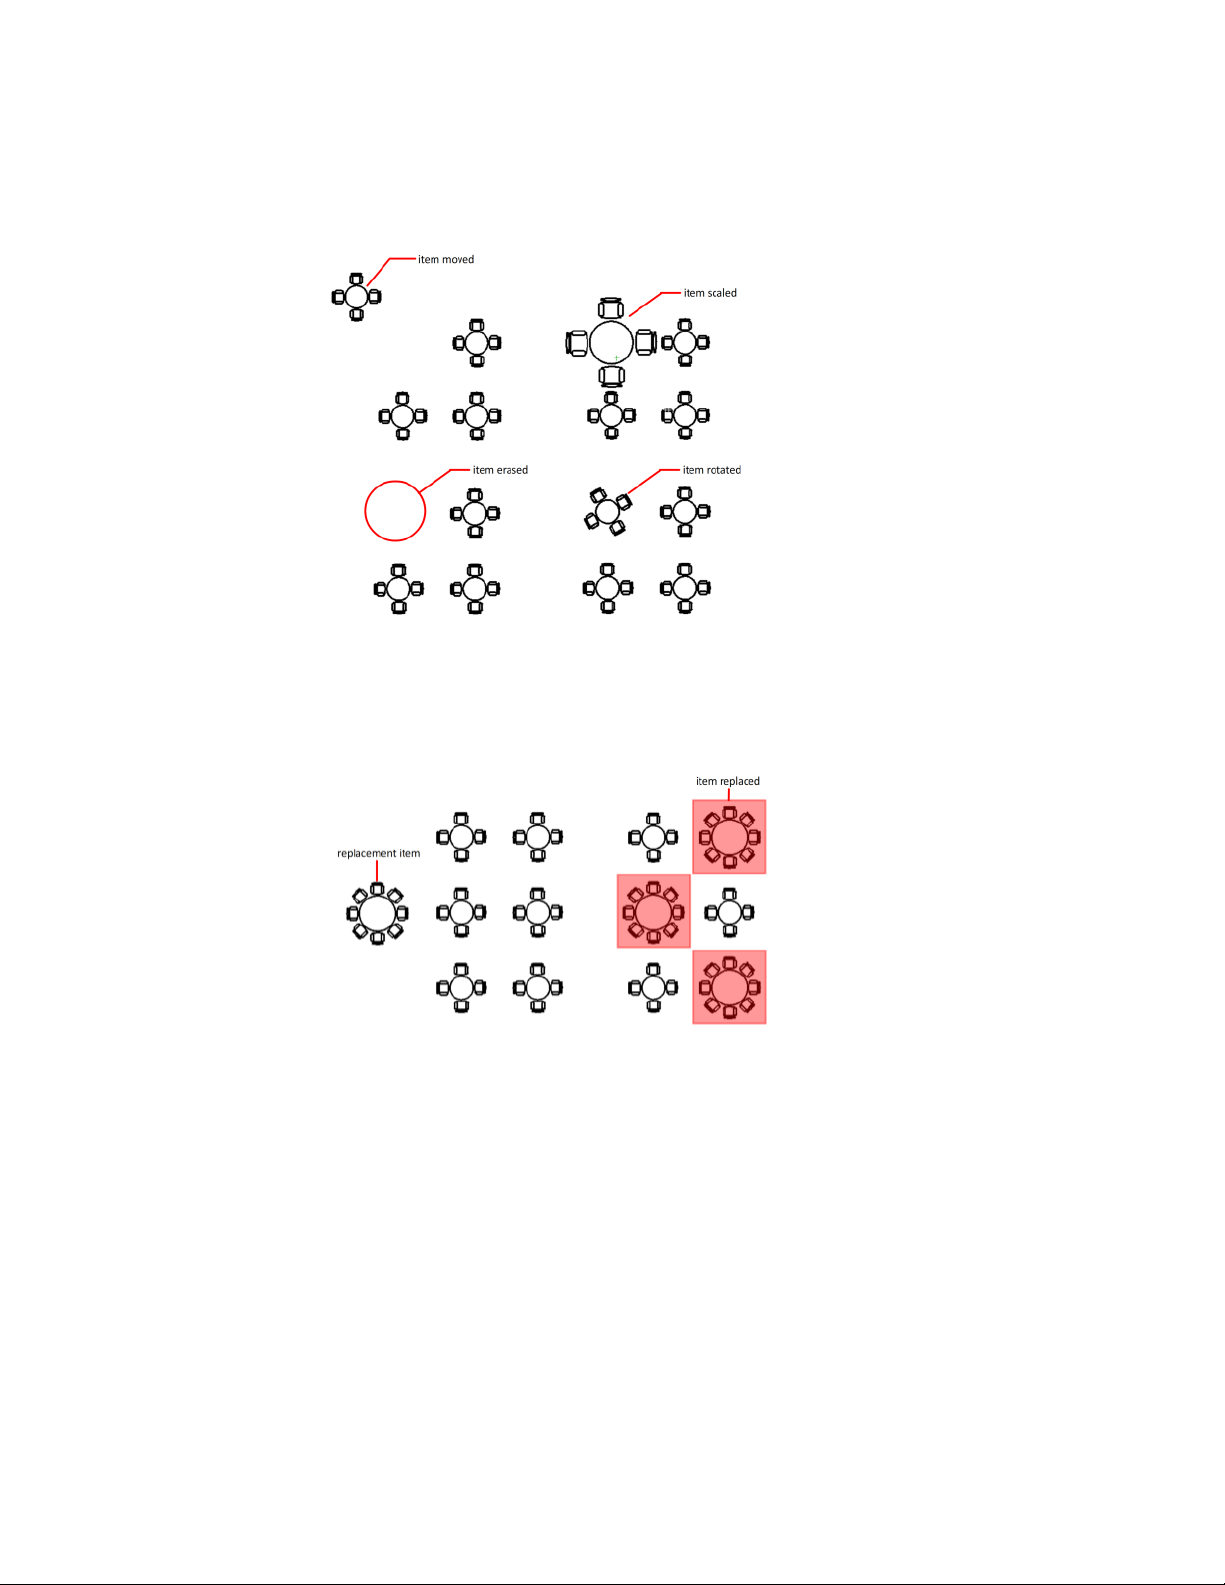
Replace Items
Replace selected items with other objects. Any item overrides are maintained.
You can also replace all items that reference the original source objects, rather
than selecting individual items.
Edit Source Objects
To edit an item’s source objects, activate an editing state for a selected item.
All changes (including the creation of new objects) are instantly applied to
all items referencing the same set of source objects. Save or discard your
changes to exit the editing state.
250 | Chapter 6 Create and Modify Objects
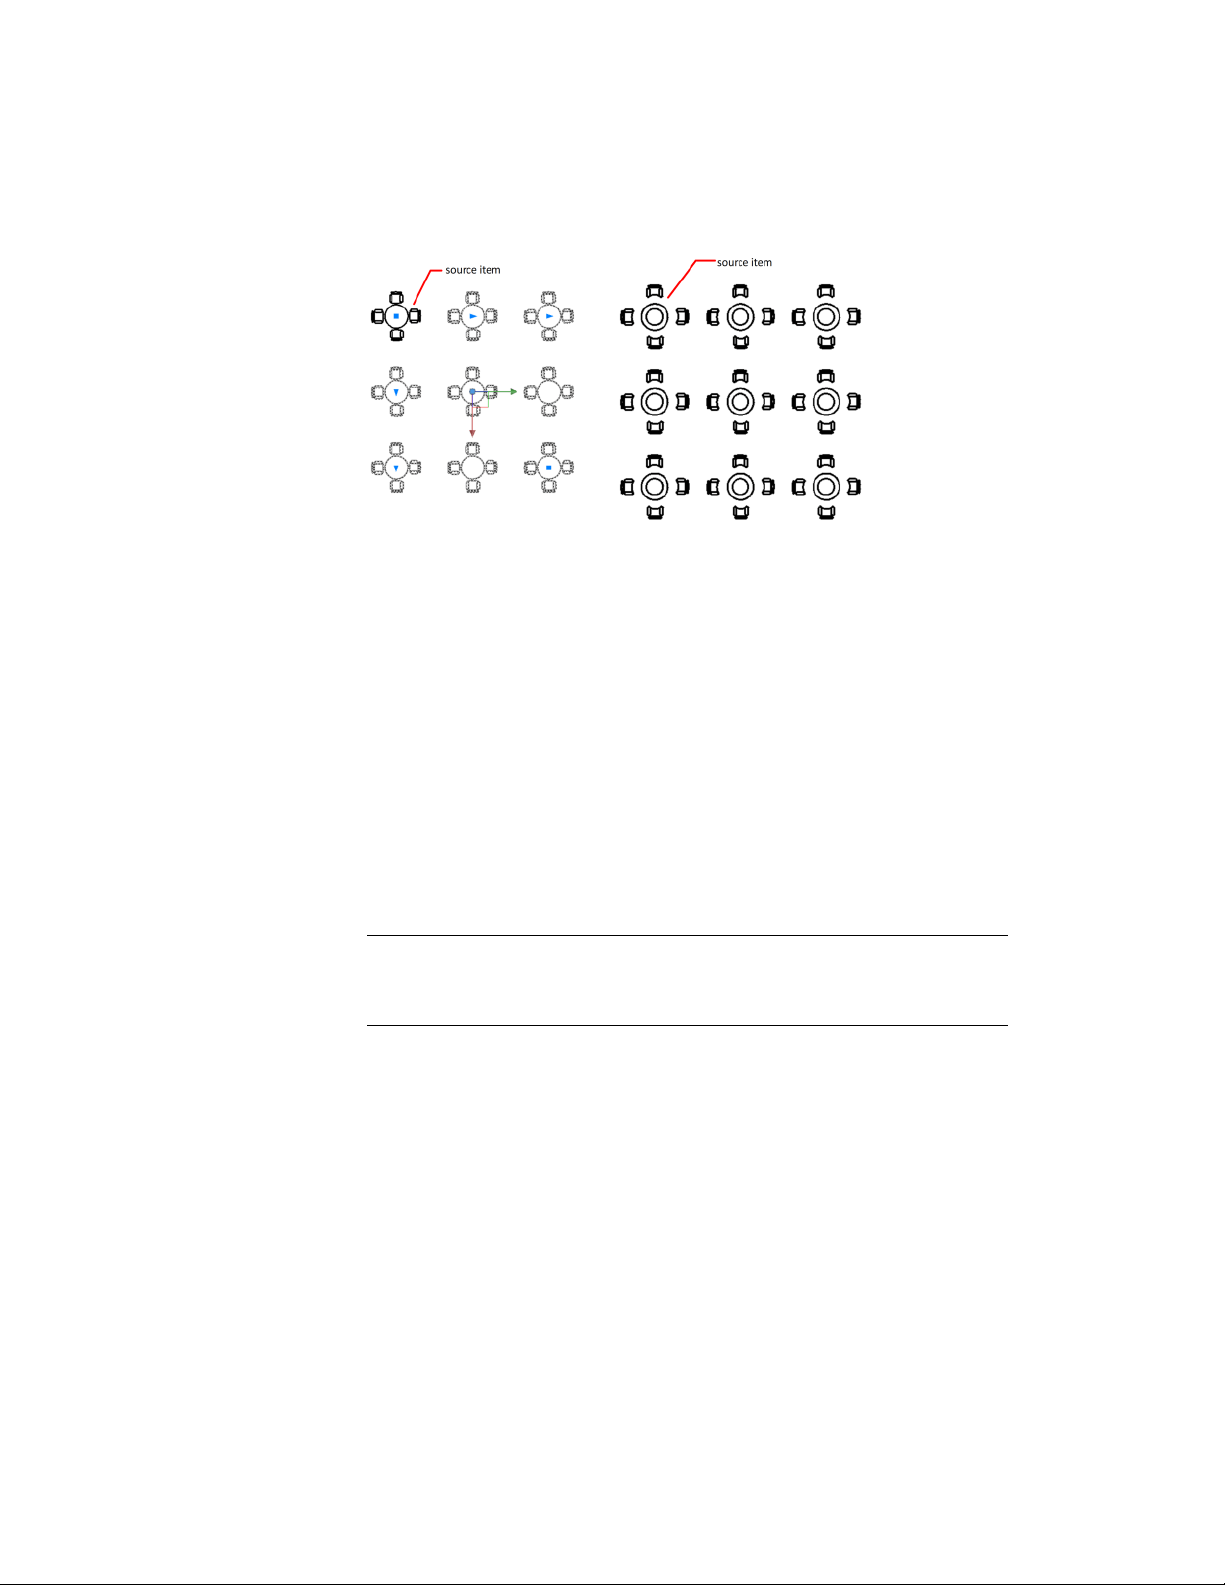
Limit the Size of Arrays
The number of array elements that can be generated by one ARRAY command
is limited to approximately 100,000.
This limit is controlled by the MaxArray setting in the registry. If you specify
a large number of rows and columns for an array, it may take a long time to
create the copies.
You can change the limit by setting the MaxArray system registry variable
using (setenv “MaxArray” “n”) where n is a number from 100 through
10000000 (ten million).
The MaxArray system registry variable is validated when using the ARRAYEDIT
command. The Array Limit Object task dialog is displayed when the total
count of the modified array exceeds the current MaxArray value.
NOTE
When changing the value of MaxArray, you must enter MaxArray with the
capitalization shown.
Offset an Object
Offset an object to create a new object whose shape is parallel to the original
object.
For example, if you offset a circle or an arc, a larger or smaller circle or arc is
created, depending on which side you specify for the offset. If you offset a
polyline, the result is a polyline that parallels the original.
Select and Modify Objects | 251
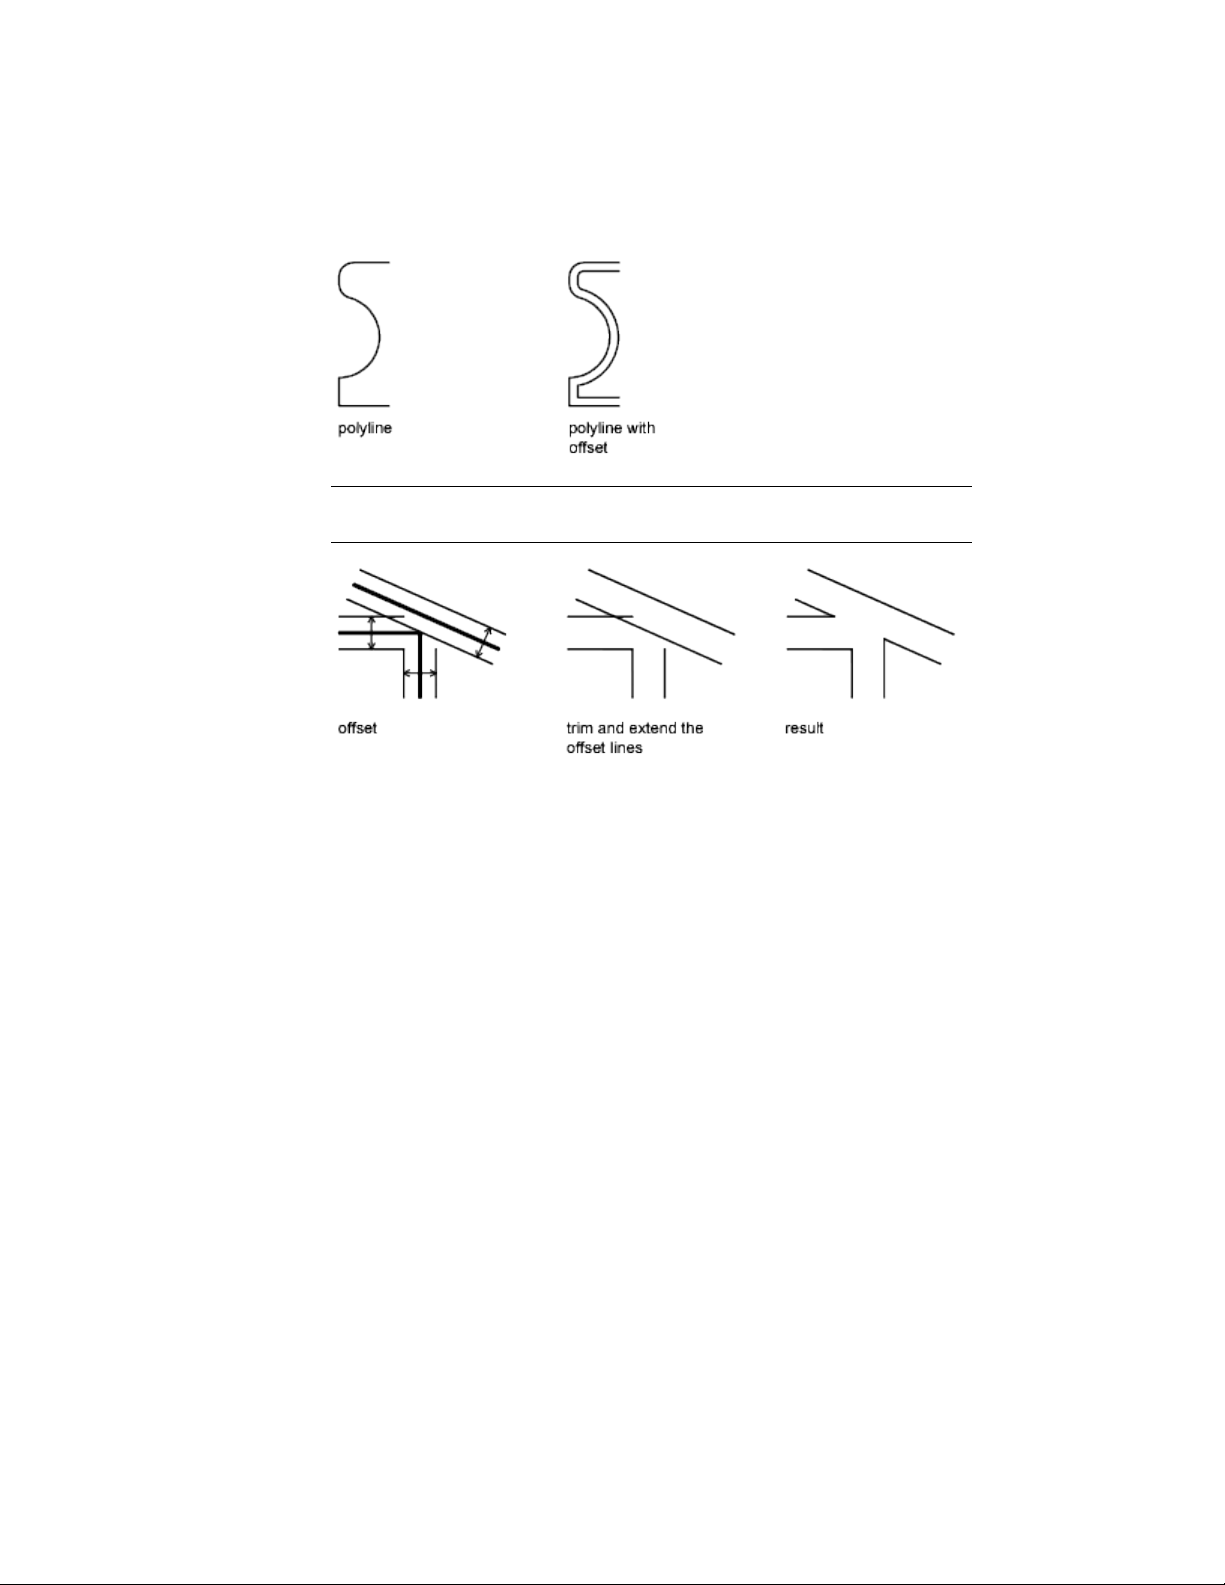
TIP An effective drawing technique is to offset objects and then trim or extend
their ends.
Use OFFSET to offset the following object types:
■ Lines
■ Arcs
■ Circles
■ Ellipses and elliptical arcs (resulting in an oval-shaped spline)
■ 2D polylines
■ Construction lines (xlines) and rays
■ Splines
Special Cases for Offset Polylines and Splines
2D polylines are offset as individual line segments, resulting in either
intersections or gaps between segments. To complete the offset, intersecting
lines are trimmed and gaps are filled.
252 | Chapter 6 Create and Modify Objects
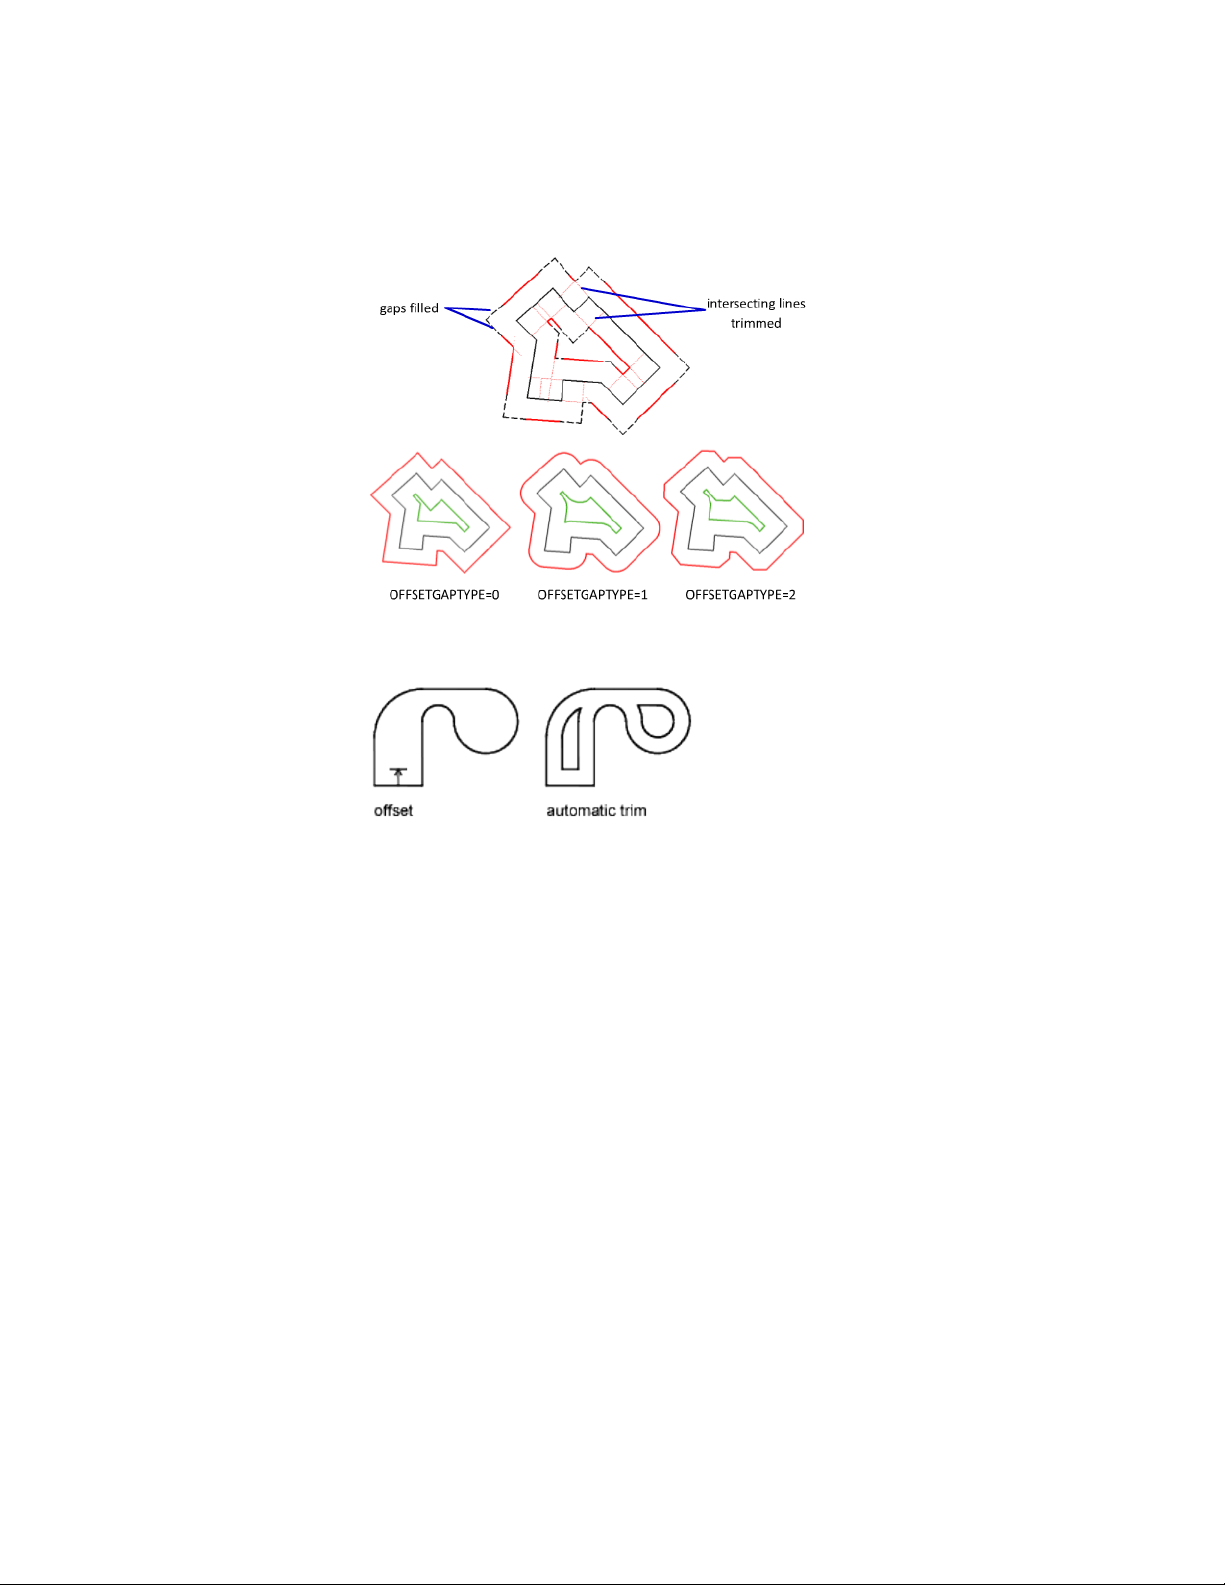
Splines are trimmed automatically when the offset distance is larger than can
otherwise be accommodated.
Offset the Edges of Faces on Solids and Surfaces
The OFFSETEDGE command creates a closed polyline or a spline from the
edges of a planar face on a 3D solid or surface. Splines result when one or
more edge segments cannot be represented as lines, arcs, or a circle. For
example
■ In the left illustration, the edge of the top surface of the solid was offset,
resulting in the closed, yellow polyline shown.
■ In the middle illustration, the polyline was extruded.
■ In the right illustration, the polyline was extruded and then subtracted.
Select and Modify Objects | 253
With the Corner option, you can specify sharp corners or rounded corners
for the polyline. External and internal corners create rounded corners
differently depending whether the corners are concave or convex—the radius
of the arcs maintain the specified offset distance.
Mirror Objects
You can flip objects about a specified axis to create a symmetrical mirror image.
Mirroring is useful for creating symmetrical objects because you can quickly
draw half the object and then mirror it instead of drawing the entire object.
You flip objects about an axis called a mirror line to create a mirror image. To
specify this temporary mirror line, you enter two points. You can choose
whether to erase or retain the original objects.
254 | Chapter 6 Create and Modify Objects
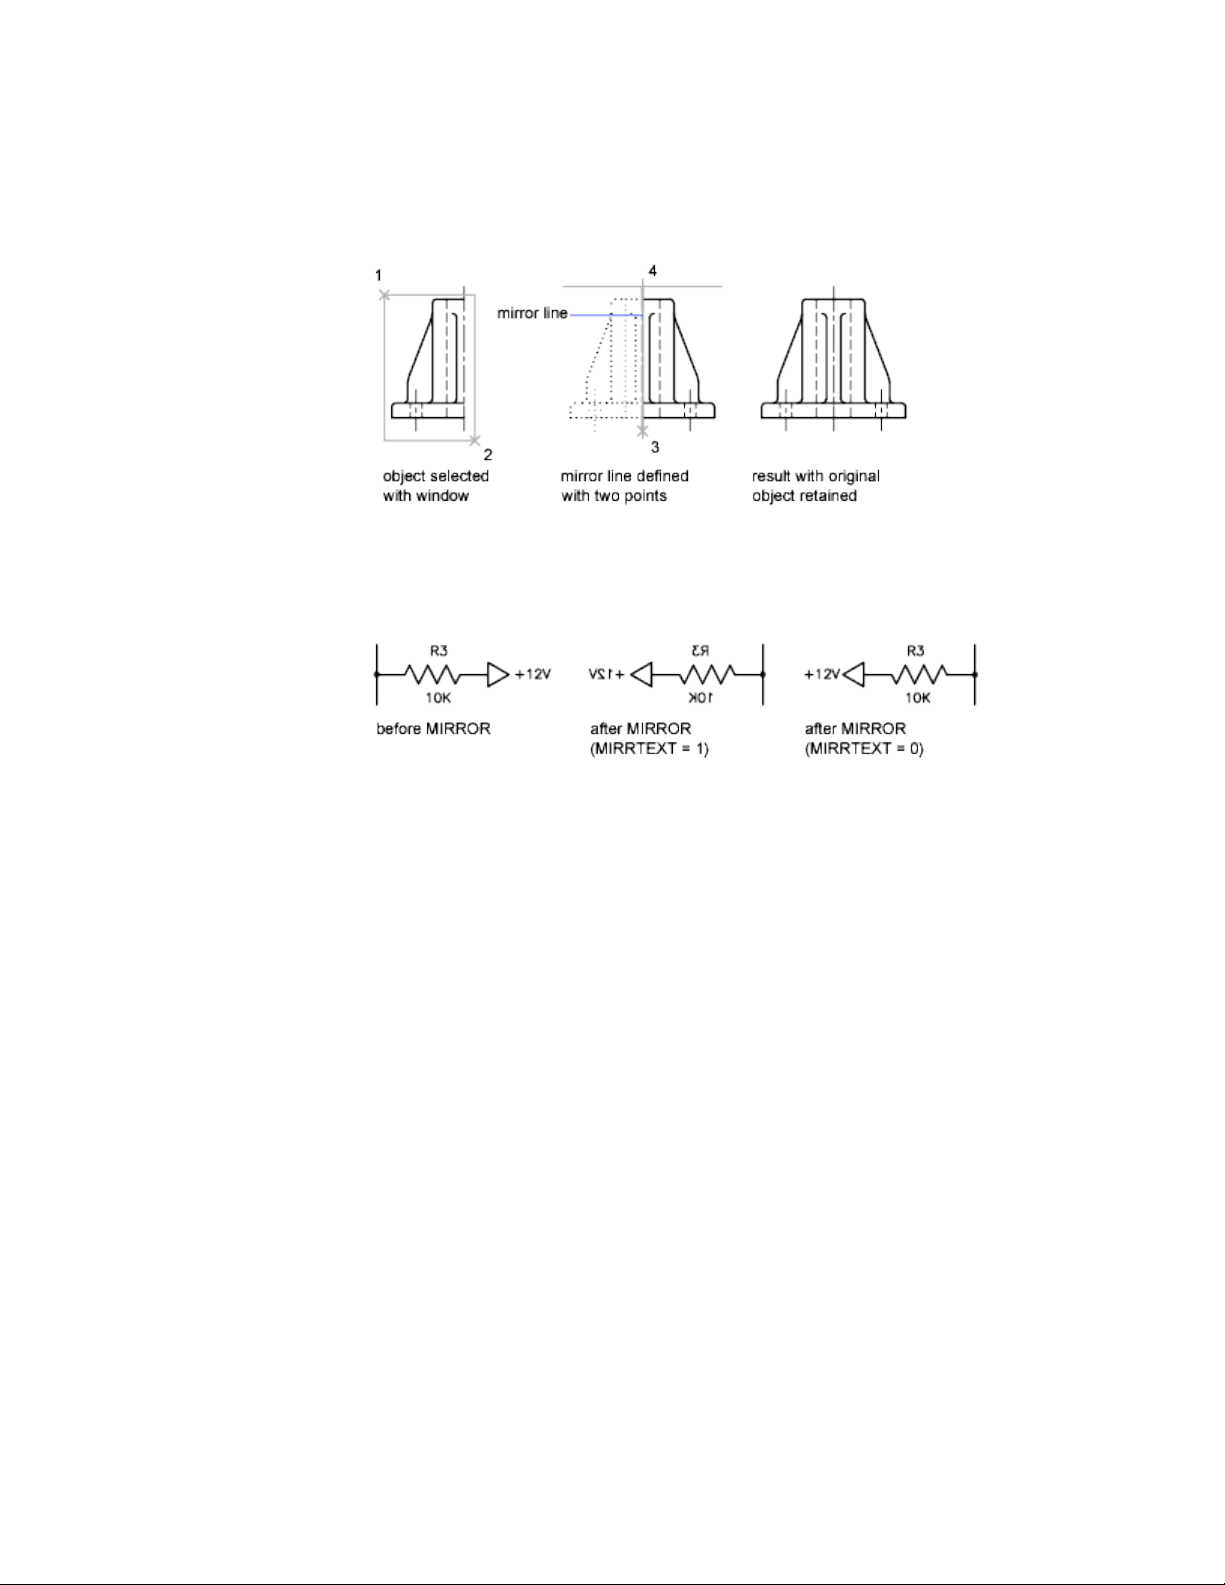
By default, when you mirror text, hatches, attributes, and attribute definitions,
they are not reversed or turned upside down in the mirror image. The text
has the same alignment and justification as before the object was mirrored.
If you do want text to be reversed, set the MIRRTEXT system variable to 1.
MIRRTEXT affects text that is created with the TEXT, ATTDEF, or MTEXT
commands; attribute definitions; and variable attributes. Text and constant
attributes that are part of an inserted block are reversed when the block is
mirrored regardless of the value of MIRRTEXT.
MIRRHATCH affects hatch objects created with the GRADIENT or HATCH
commands. Use the MIRRHATCH system variable control whether hatch
pattern direction is mirrored or retained.
Mirror in 3D
■ The plane of a planar object
■ A plane parallel to the XY, YZ, or XZ plane of the current UCS that passes
through a specified point
■ A plane defined by three specified points (2, 3, and 4)
Select and Modify Objects | 255
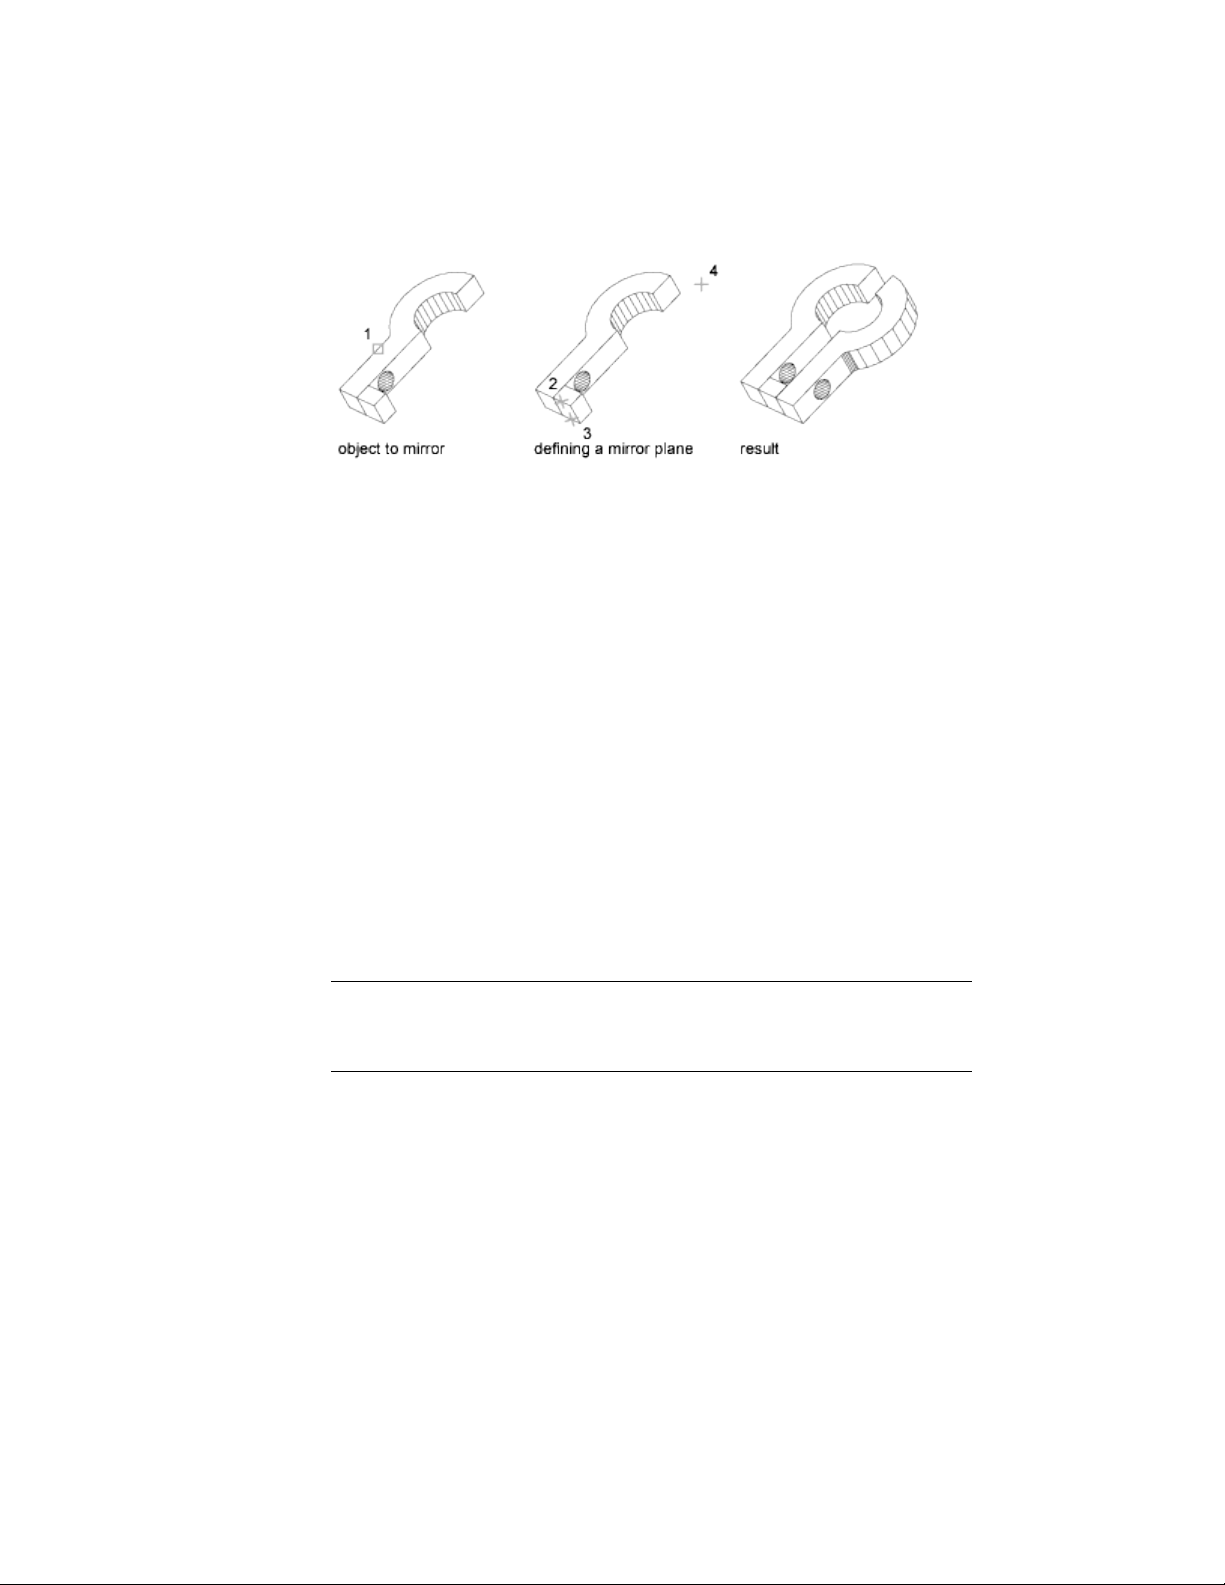
Change the Size and Shape of Objects
There are several methods for adjusting the lengths of existing objects relative
to other objects, both symmetrically and asymmetrically.
Trim or Extend Objects
You can shorten or lengthen objects to meet the edges of other objects.
This means you can first create an object such as a line and then later adjust
it to fit exactly between other objects.
Objects you select as cutting edges or boundary edges are not required to
intersect the object being trimmed. You can trim or extend an object to a
projected edge or to an extrapolated intersection; that is, where the objects
would intersect if they were extended.
If you do not specify a boundary and press Enter at the Select Objects prompt,
all displayed objects become potential boundaries.
NOTE
To select cutting edges or boundary edges that include blocks, you can use
only the single selection, Crossing, Fence, and Select All options.
Trim Objects
You can trim objects so that they end precisely at boundary edges defined by
other objects.
For example, you can clean up the intersection of two walls smoothly by
trimming.
256 | Chapter 6 Create and Modify Objects
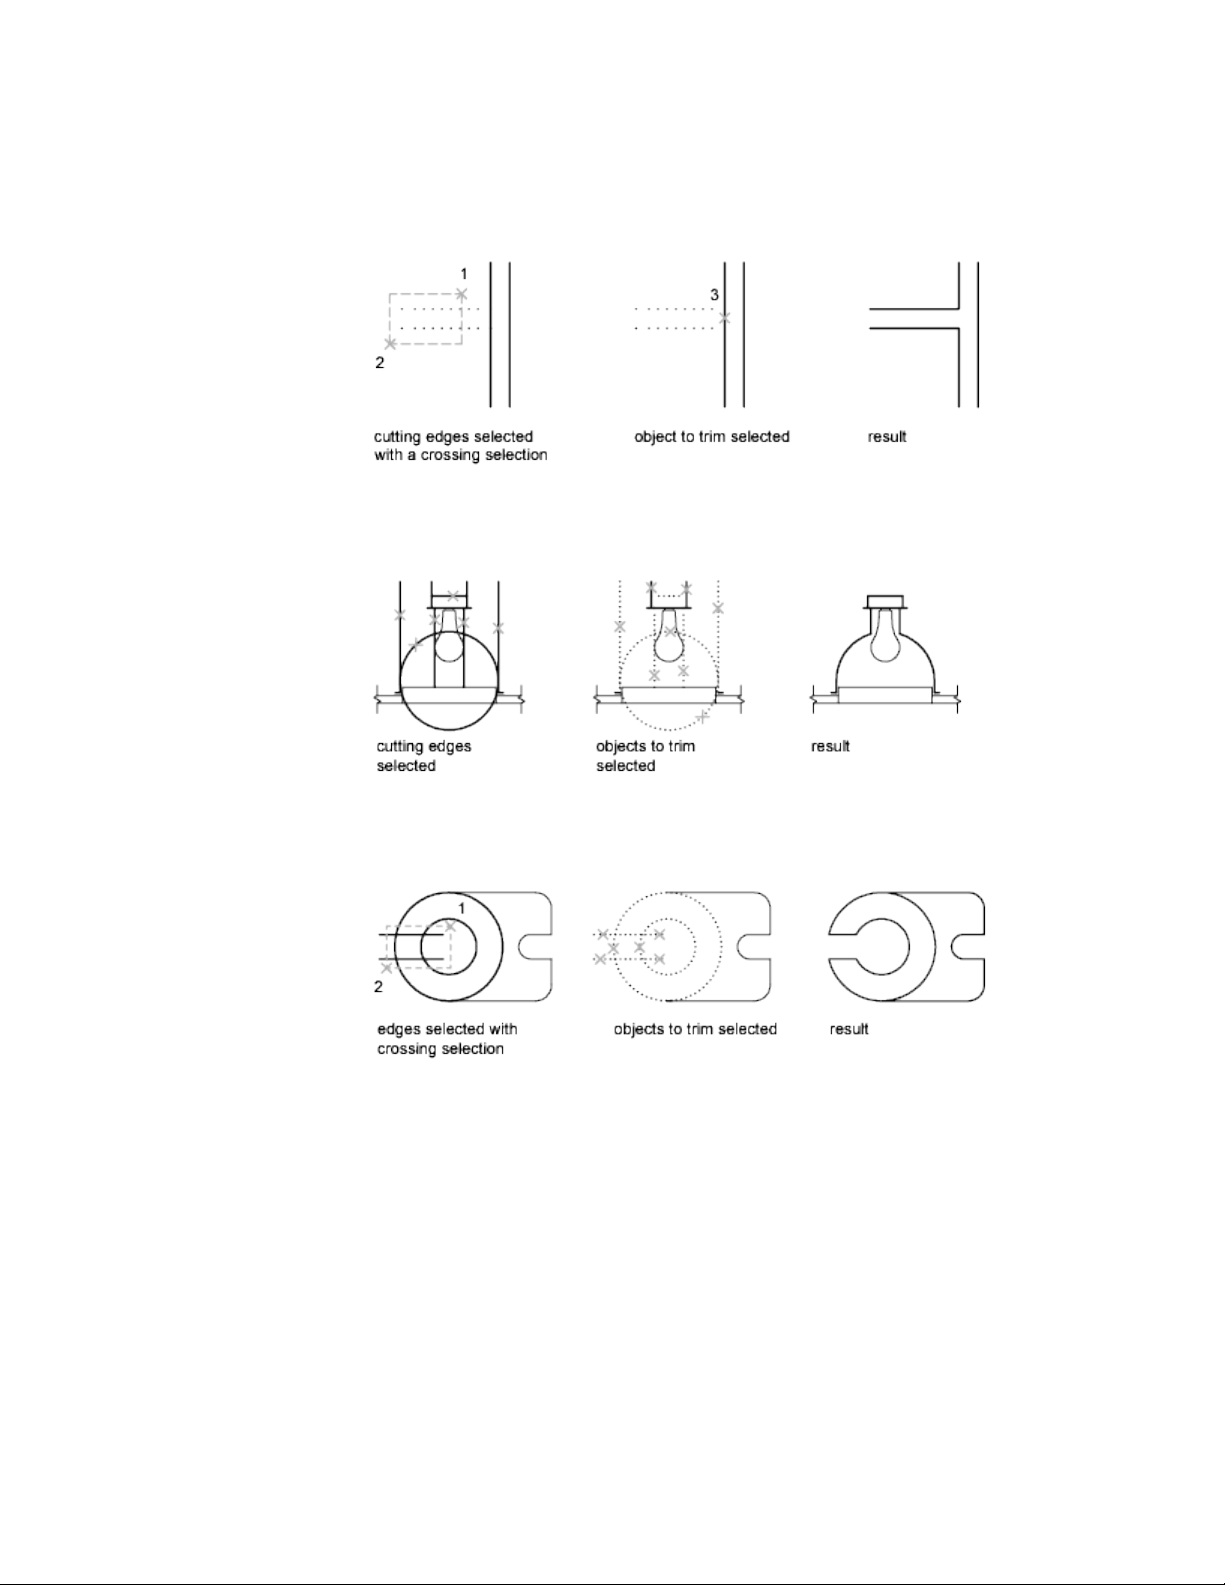
An object can be one of the cutting edges and one of the objects being
trimmed. For example, in the illustrated light fixture, the circle is a cutting
edge for the construction lines and is also being trimmed.
When you trim several objects, the different selection methods can help you
choose the current cutting edges and objects to trim. In the following example,
the cutting edges are selected using crossing selection.
The following example uses the fence selection method to select a series of
objects for trimming.
Select and Modify Objects | 257
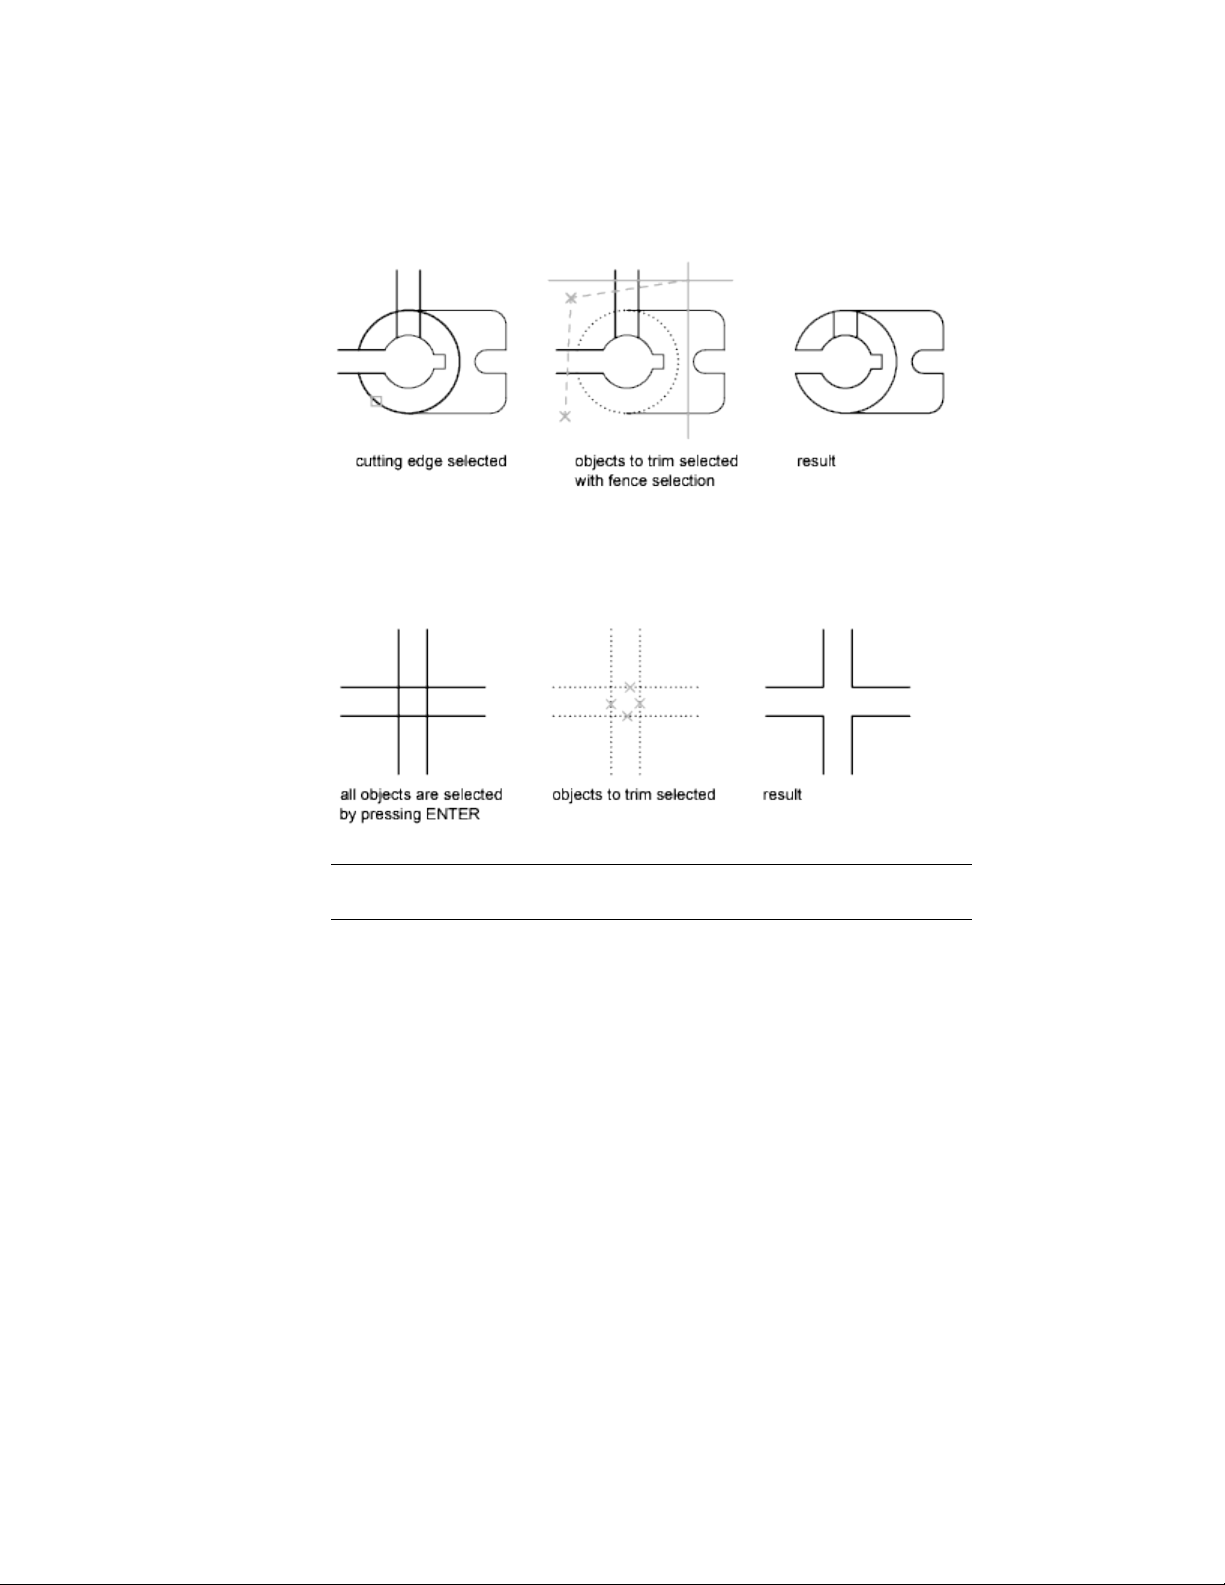
You can trim objects to their nearest intersection with other objects. Instead
of selecting cutting edges, you press Enter. Then, when you select the objects
to trim, the nearest displayed objects act as cutting edges. In this example,
the walls are trimmed so that they intersect smoothly.
NOTE You can extend objects without exiting the TRIM command. Press and hold
Shift while selecting the objects to be extended.
Extend Objects
Extending operates the same way as trimming. You can extend objects so they
end precisely at boundary edges defined by other objects. In this example,
you extend the lines precisely to a circle, which is the boundary edge.
258 | Chapter 6 Create and Modify Objects
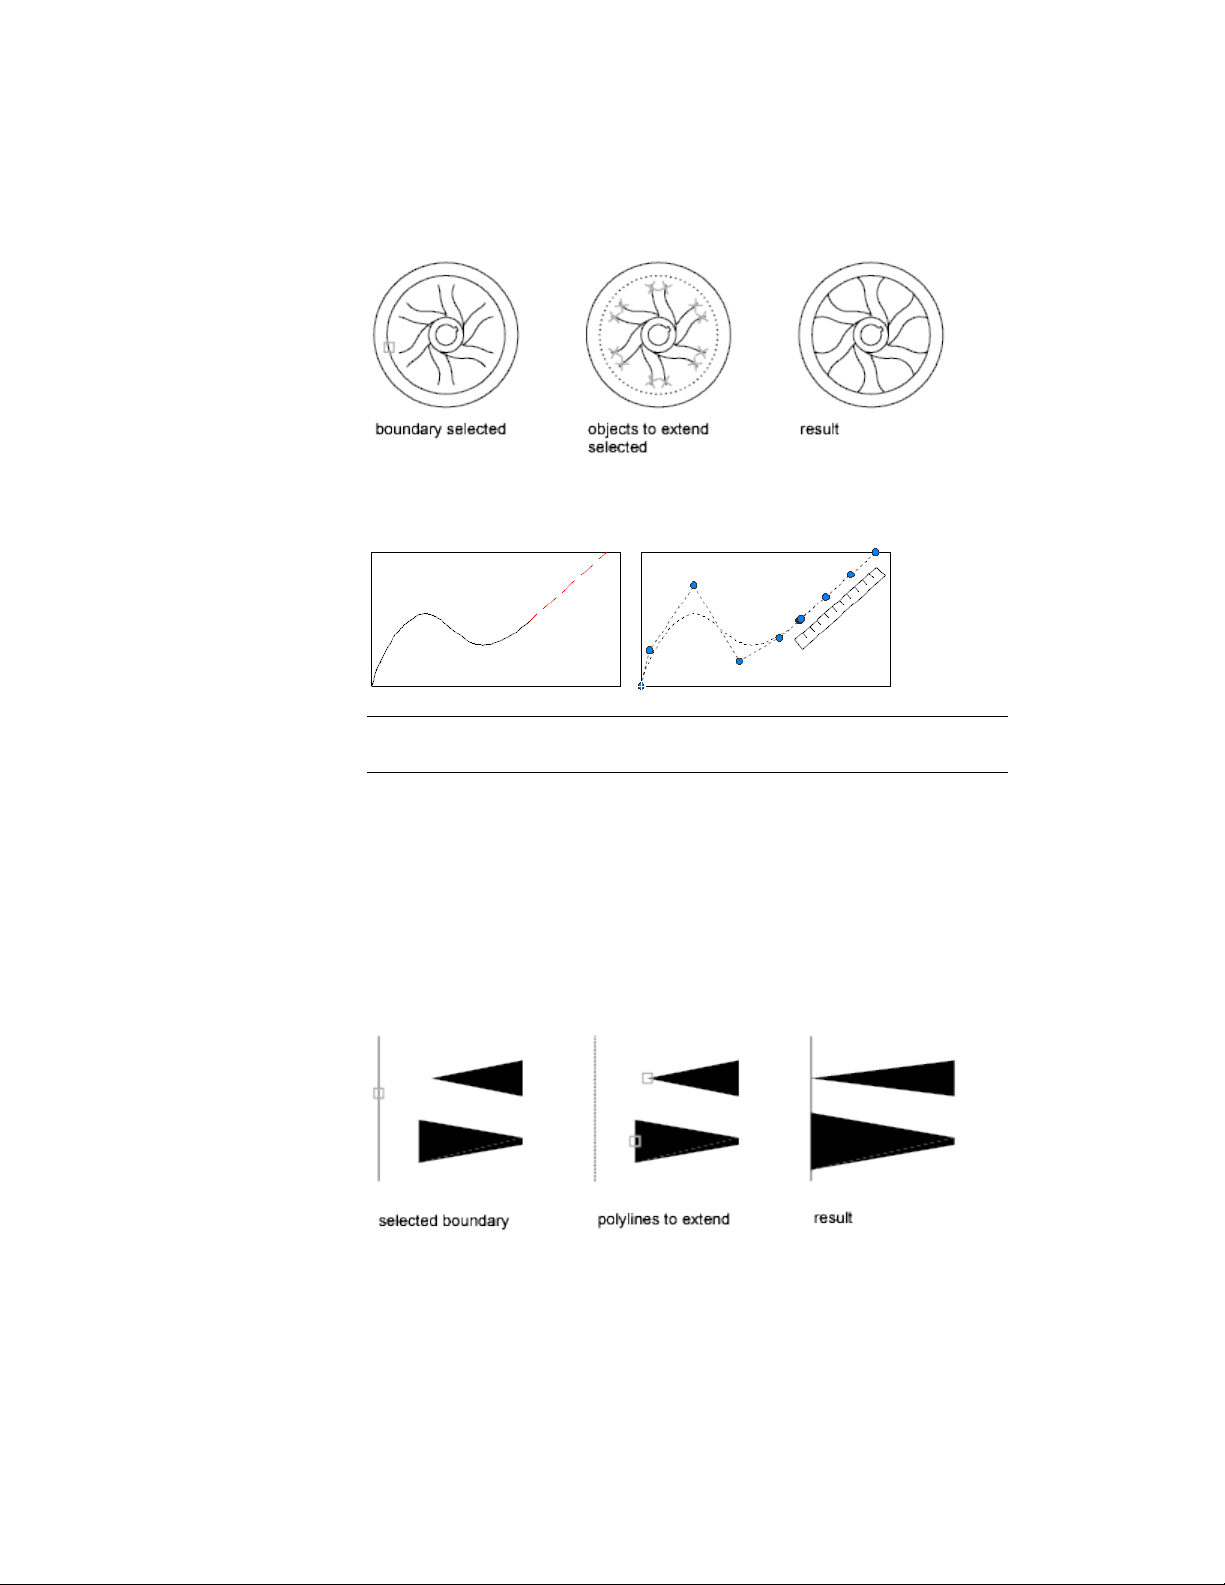
Extending a spline preserves the shape of the original portion of the spline,
but the extended portion is linear and tangent to the end of the original spline.
NOTE You can trim objects without exiting the EXTEND command. Press and
hold Shift while selecting the objects to be trimmed.
Trim and Extend Wide Polylines
2D wide polylines trim and extend at their centerlines. The ends of wide
polylines are always square. Trimming a wide polyline at an angle causes
portions of the end to extend beyond the cutting edge
If you trim or extend a tapered 2D polyline segment, the width of the extended
end is corrected to continue the original taper to the new endpoint. If this
correction gives the segment a negative ending width, the ending width is
forced to 0.
Select and Modify Objects | 259

Trim and Extend Spline-Fit Polylines
Trimming a spline-fit polyline removes the curve-fit information and changes
the spline-fit segments into ordinary polyline segments.
Extending a spline-fit polyline adds a new vertex to the control frame for the
polyline.
Trim or Extend in 3D
You can trim or extend an object to any other object in 3D space, regardless
of whether the objects are on the same plane or parallel to the cutting or
boundary edges. In the TRIM and EXTEND commands, use the Project and
Edge options to select one of three projections for trimming or extending:
■ The XY plane of the current UCS
■ The plane of the current view
■ True 3D, which is not a projection
See also:
Break and Join Objects (page 270)
Resize or Reshape Objects
You can resize objects to make them longer or shorter in only one direction
or to make them proportionally larger or smaller.
You can also stretch certain objects by moving an endpoint, vertex, or control
point.
Lengthen Objects
With LENGTHEN, you can change the included angle of arcs and the length
of the following objects:
■ Lines
■ Arcs
■ Open polylines
■ Elliptical arcs
■ Open splines.
260 | Chapter 6 Create and Modify Objects
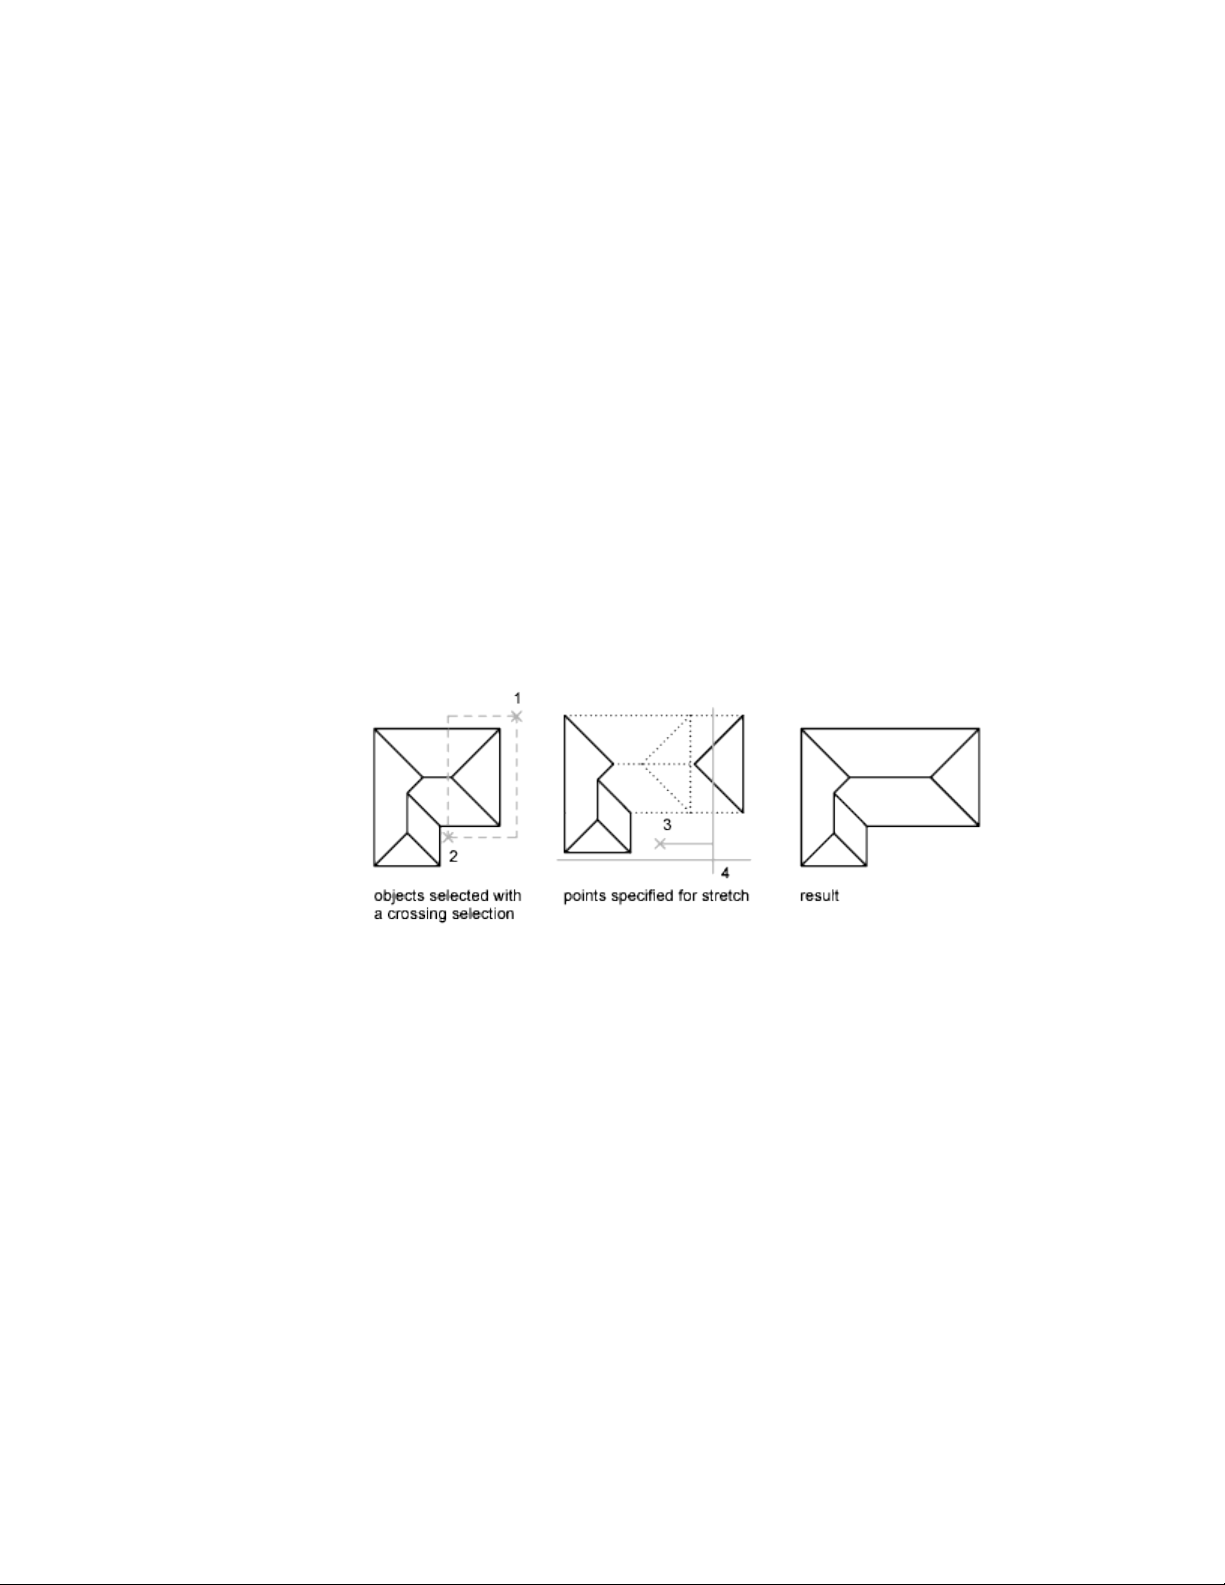
The results are similar to extending and trimming. You can
■ Drag an object endpoint dynamically
■ Specify a new length or angle as a percentage of the total length or angle
■ Specify an incremental length or angle measured from an endpoint
■ Specify the object's total absolute length or included angle
Stretch Objects
With STRETCH, you relocate the endpoints of objects that lie across or within
a crossing selection window.
■ Objects that are partially enclosed by a crossing window are stretched.
■ Objects that are completely enclosed within the crossing window, or that
are selected individually, are moved rather than stretched.
You stretch an object by specifying a base point and then a point of
displacement.
Use object snaps, grid snaps, and relative coordinate entry to stretch with
precision.
Scale Objects Using a Scale Factor
With SCALE, you can make an object uniformly larger or smaller. To scale an
object, you specify a base point and a scale factor. Alternatively, you can
specify a length to be used as a scale factor based on the current drawing units.
A scale factor greater than 1 enlarges the object. A scale factor between 0 and
1 shrinks the object.
Scaling changes the size of all dimensions of the selected object. A scale factor
greater than 1 enlarges the object. A scale factor less than 1 shrinks the object.
Select and Modify Objects | 261
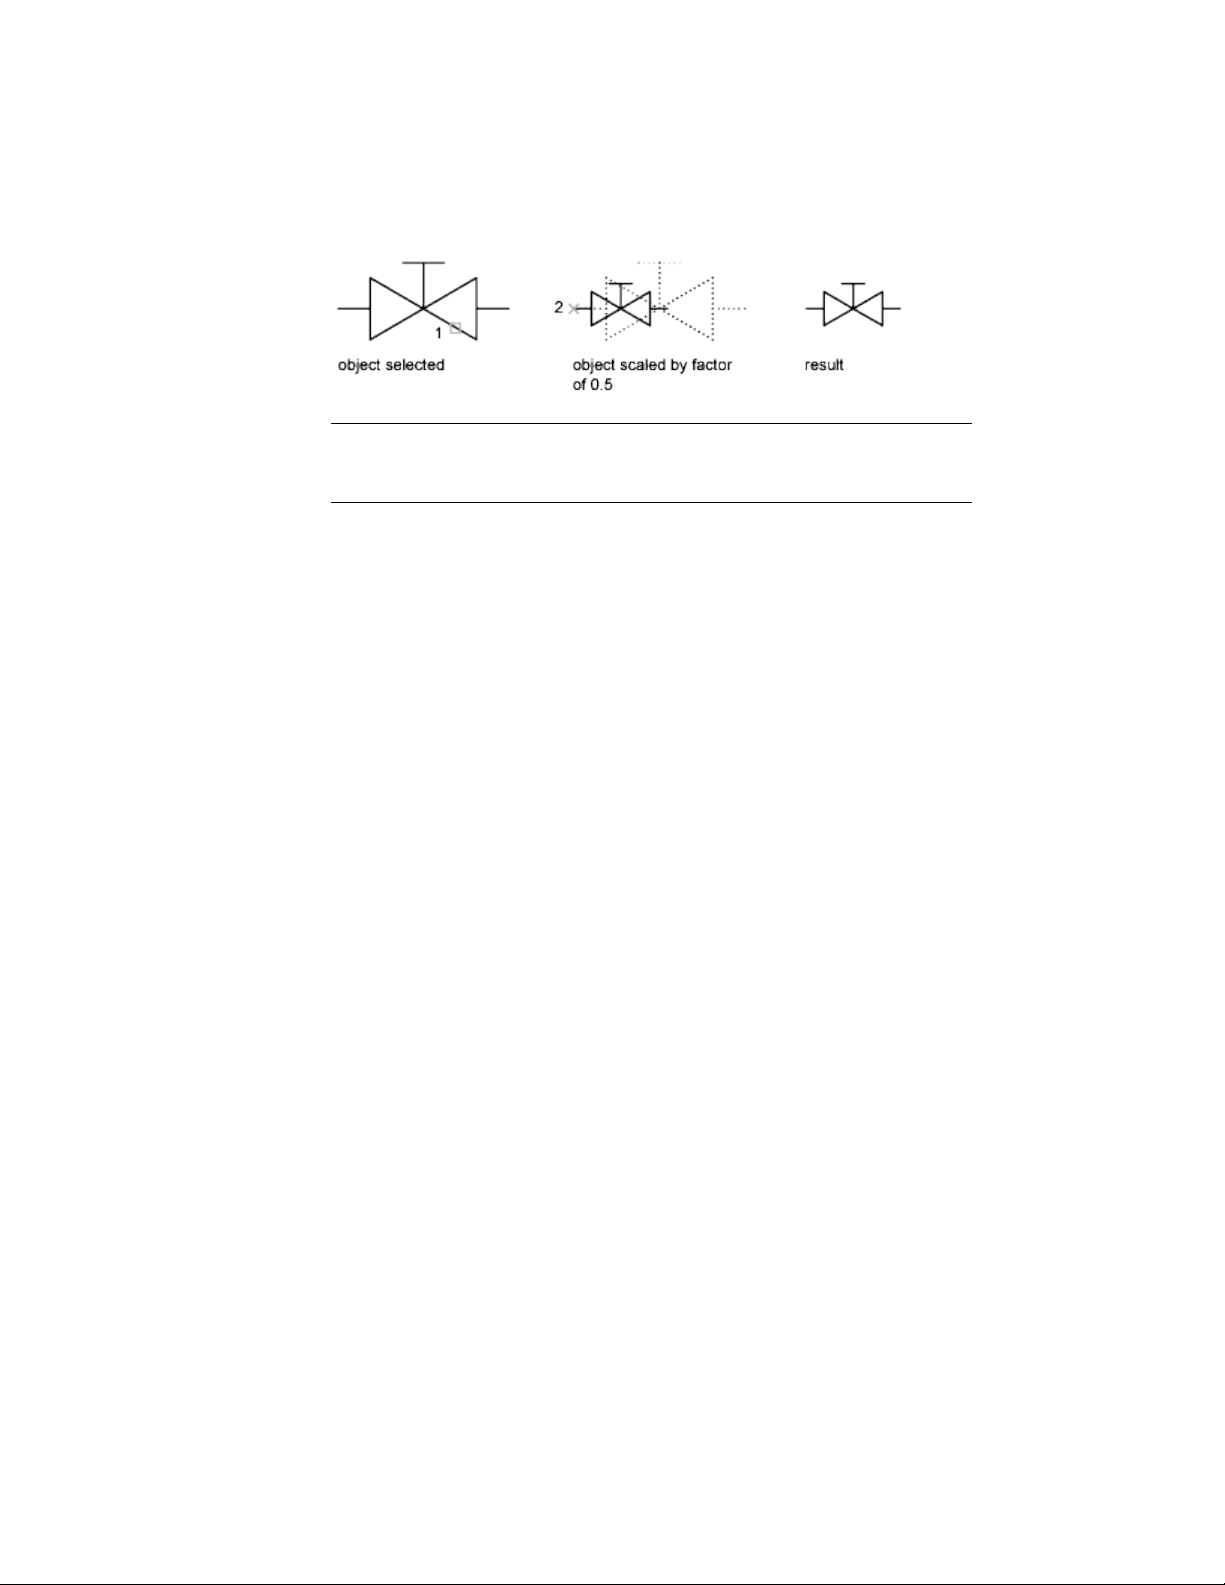
NOTE When you use the SCALE command with annotative objects, the position
or location of the object is scaled relative to the base point of the scale operation,
but the size of the object is not changed.
Scale Objects Using a Reference Distance
You can also scale by reference. Scaling by reference uses an existing distance
as a basis for the new size. To scale by reference, specify the current distance
and then the new desired size. For example, if one side of an object is 4.8 units
long and you want to expand it to 7.5 units, use 4.8 as the reference length.
You can use the Reference option to scale an entire drawing. For example, use
this option when the original drawing units need to be changed. Select all
objects in the drawing. Then use Reference to select two points and specify
the intended distance. All the objects in the drawing are scaled accordingly.
See also:
Break and Join Objects (page 270)
Fillet, Chamfer, Break, or Join Objects
You can change objects to meet in rounded or flattened corners. You can also
create or close gaps in objects.
Create Fillets
A fillet connects two objects with an arc that is tangent to the objects and has
a specified radius.
262 | Chapter 6 Create and Modify Objects
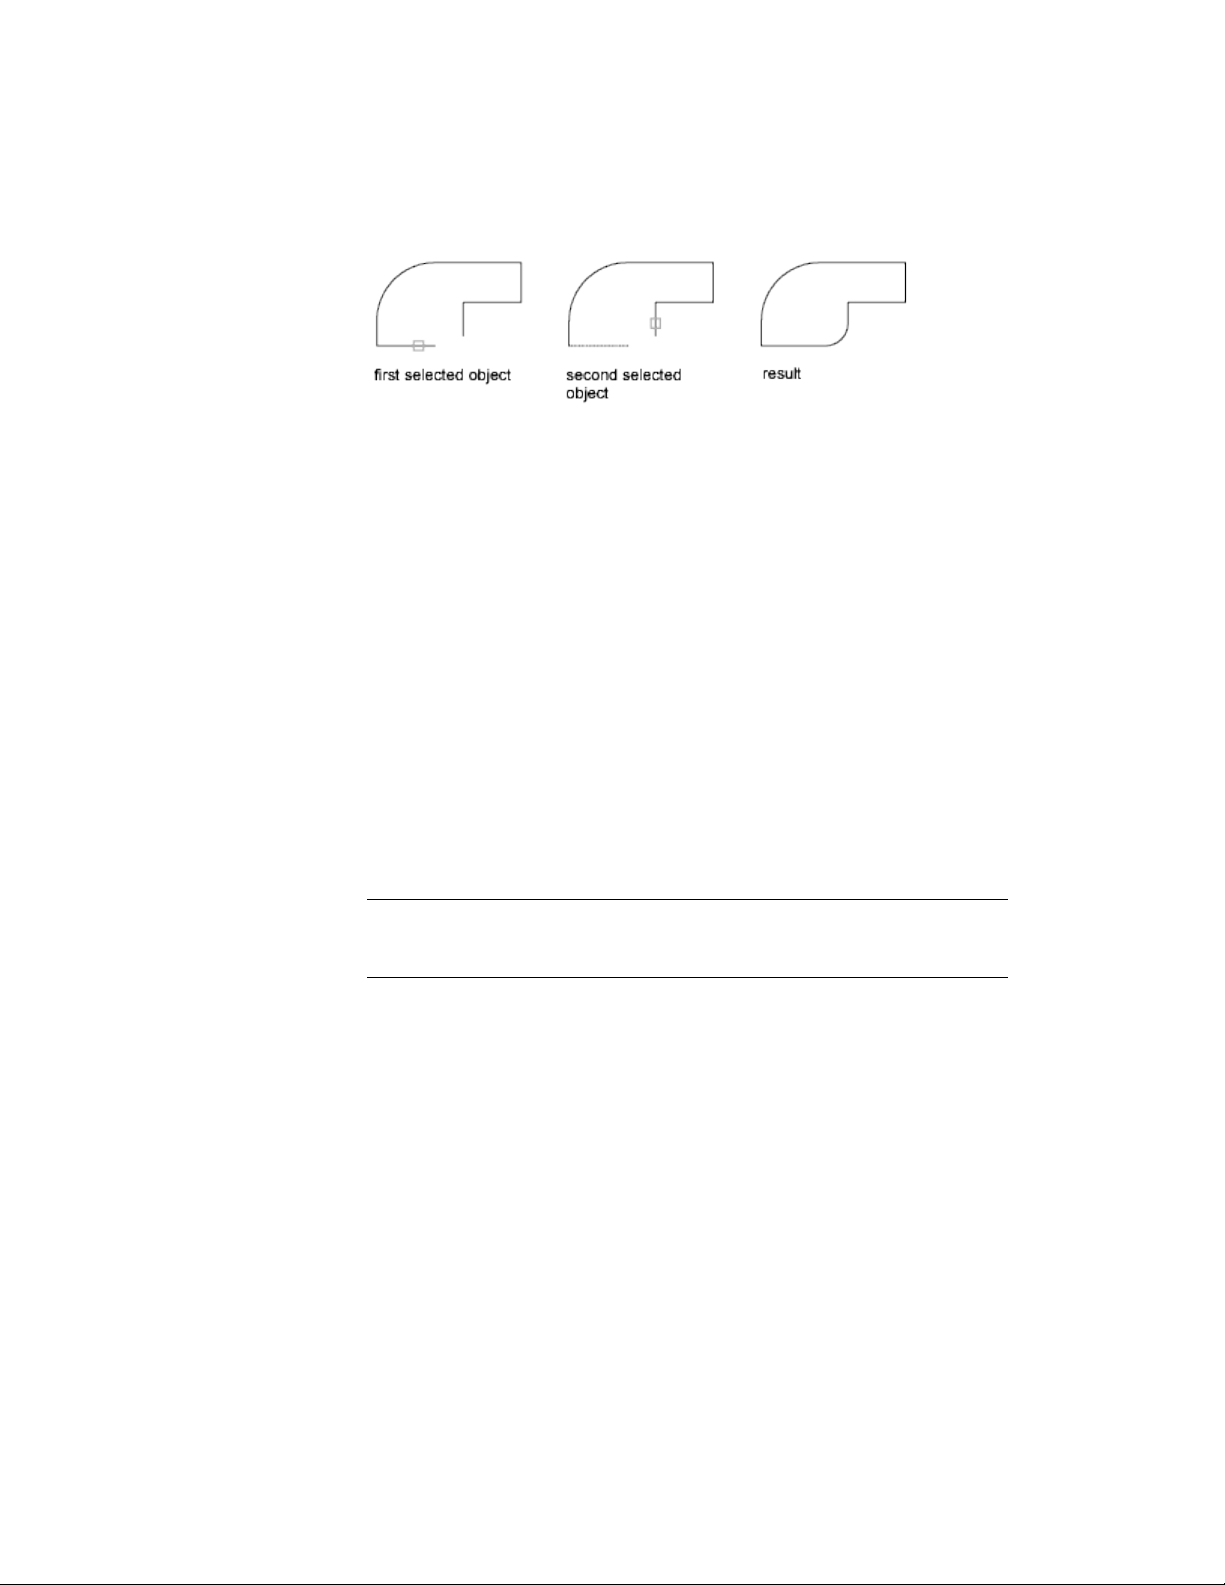
An inside corner is called a fillet and an outside corner is called a round; you
can create both using the FILLET command.
You can fillet
■ Arcs
■ Circles
■ Ellipses and elliptical arcs
■ Lines
■ Polylines
■ Rays
■ Splines
■ Xlines
■ 3D solids
FILLET can be used to round all corners on a polyline using a single command.
Also, you can use the Multiple option to fillet more than one set of objects
without leaving the command.
NOTE Filleting a hatch boundary that was defined from line segments removes
hatch associativity. If the hatch boundary was defined from a polyline, associativity
is maintained.
If both objects being filleted are on the same layer, the fillet arc is created on
that layer. Otherwise, the fillet arc is created on the current layer. The layer
affects object properties including color and linetype.
Instead of an arc, you can use BLEND to create a spline that connects two
lines or curves, and is tangent to them.
Set the Fillet Radius
The fillet radius is the radius of the arc that connects filleted objects. Changing
the fillet radius affects subsequent fillets. If you set the fillet radius to 0, filleted
objects are trimmed or extended until they intersect, but no arc is created.
Select and Modify Objects | 263
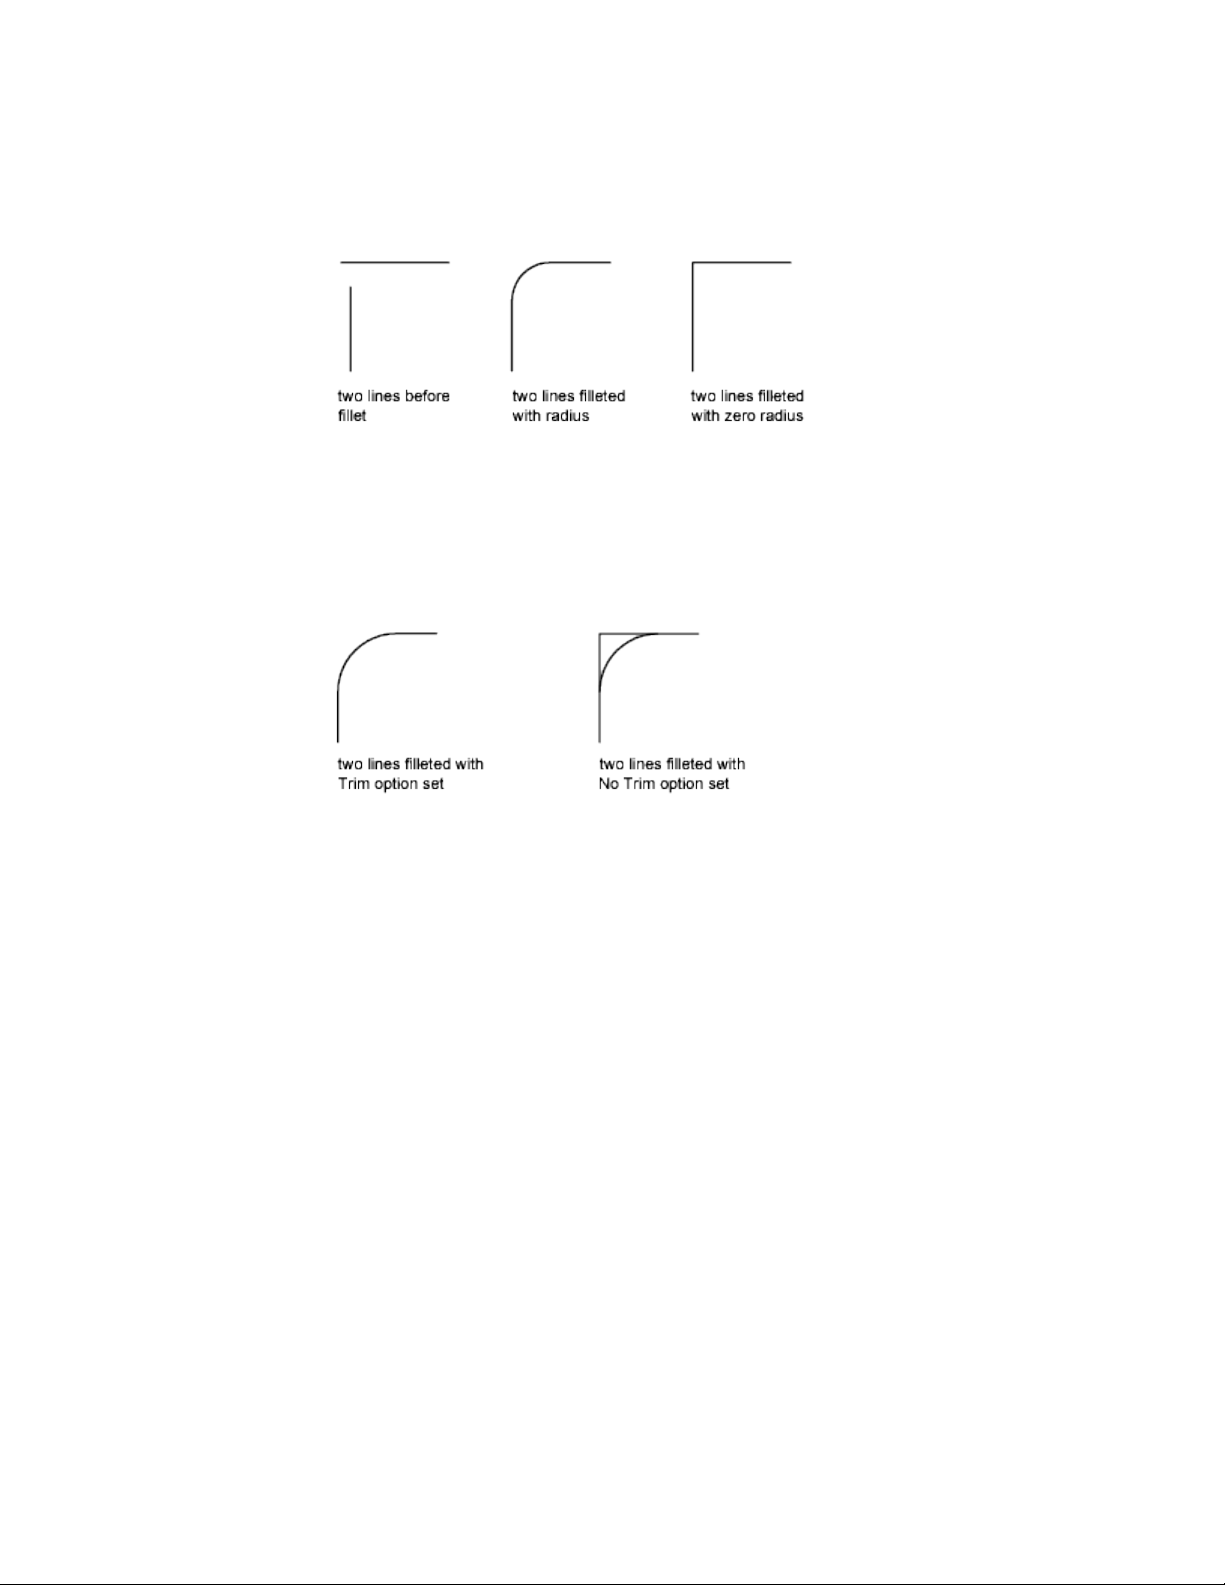
You can press and hold Shift while selecting the objects to override the current
fillet radius with a value of 0.
Trim and Extend Filleted Objects
You can use the Trim option to specify whether the selected objects are
trimmed or extended to the endpoints of the resulting arc or left unchanged.
Control the Location of the Fillet
Depending on the locations you specify, more than one possible fillet can
exist between the selected objects. Compare the selection locations and
resulting fillets in the illustrations.
264 | Chapter 6 Create and Modify Objects
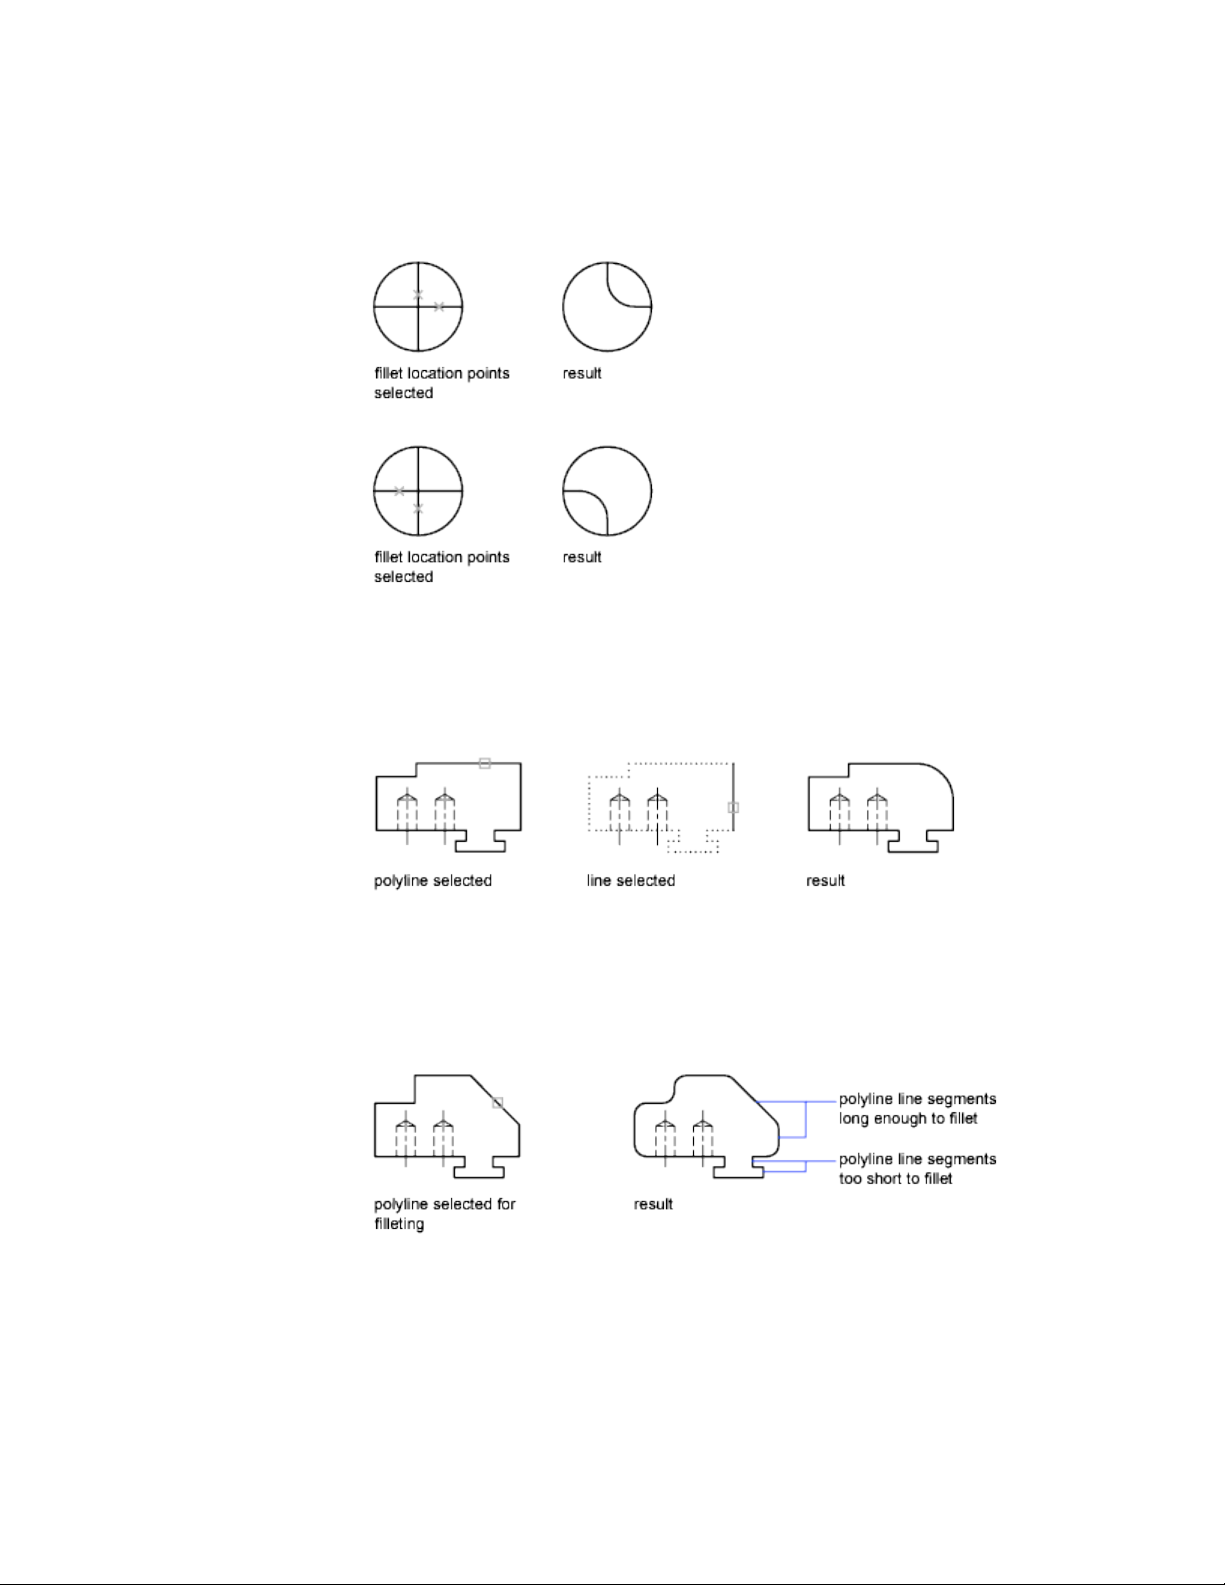
Fillet Line and Polyline Combinations
To fillet lines with polylines, each line or its extension must intersect one of
the polyline line segments. If the Trim option is on, the filleted objects and
the fillet arc join to form a single new polyline.
Fillet an Entire Polyline
You can fillet an entire polyline or remove fillets from an entire polyline.
If you set a nonzero fillet radius, FILLET inserts fillet arcs at the vertex of each
polyline segment that is long enough to accommodate the fillet radius.
Select and Modify Objects | 265
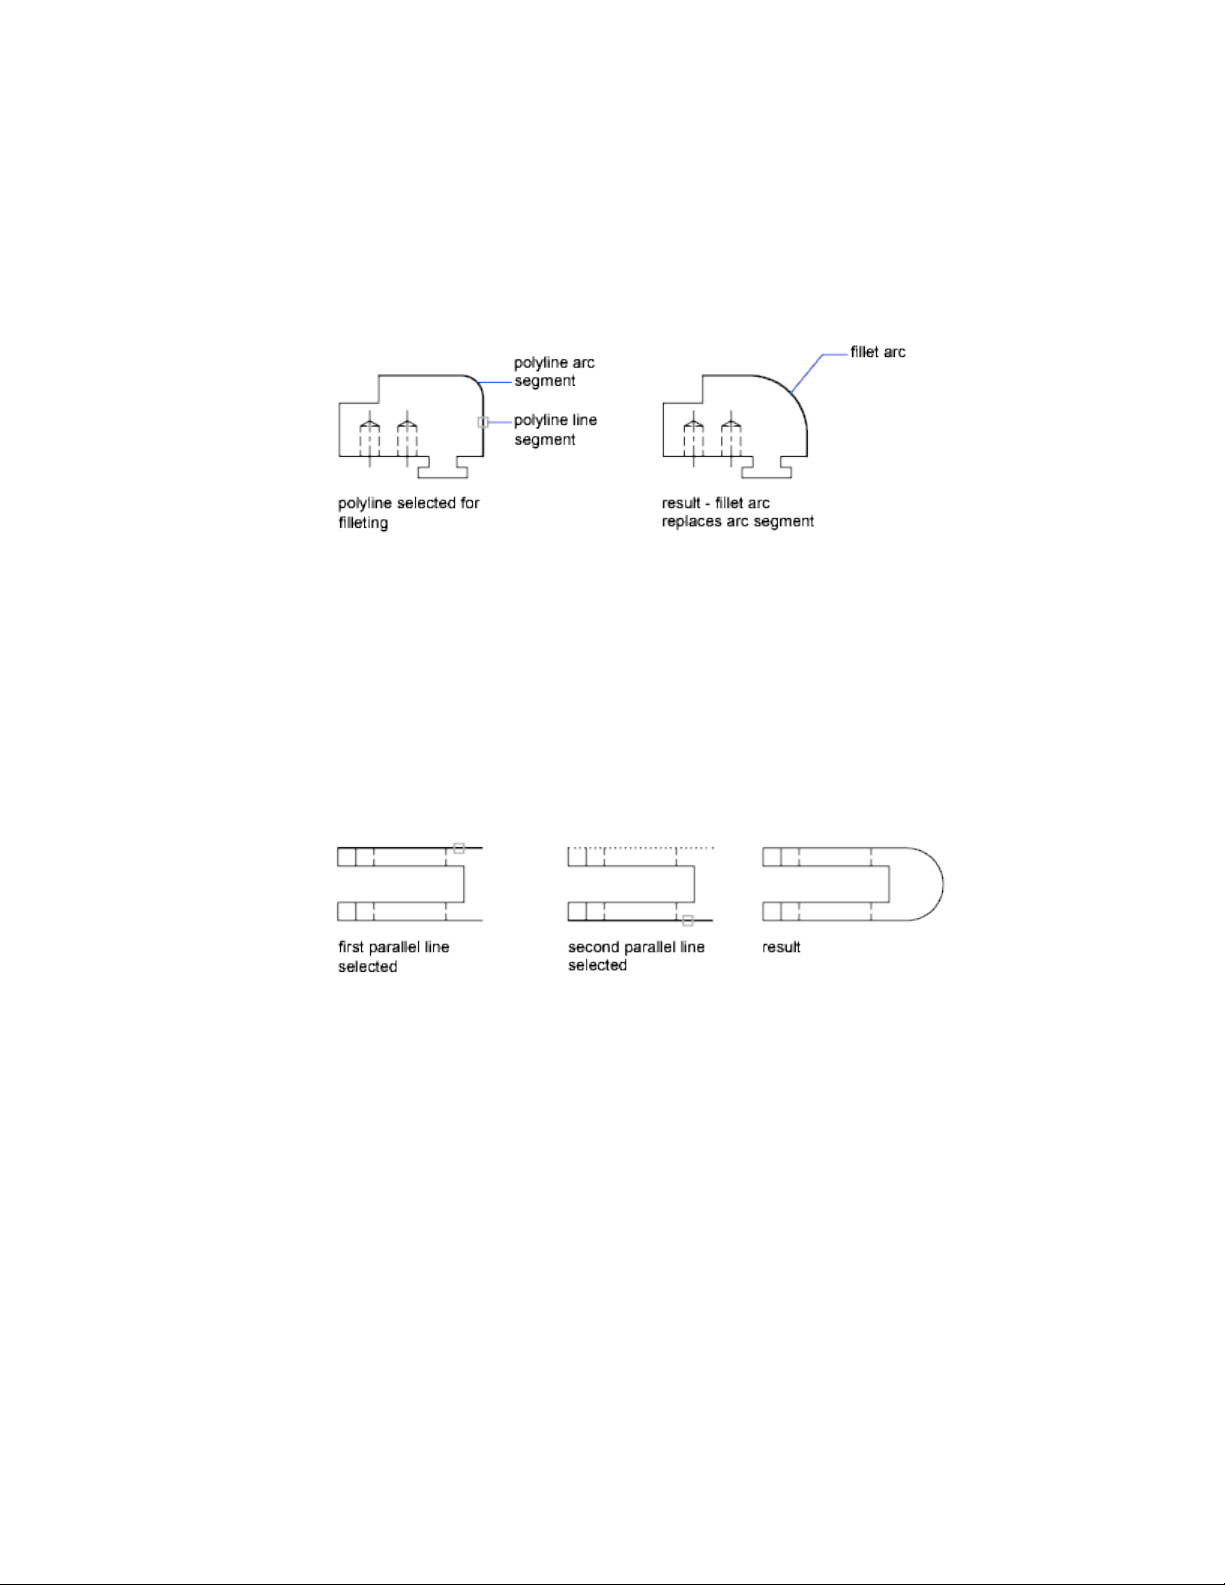
If two linear segments in a polyline are separated by an arc segment between
them, FILLET removes the arc segment and replaces it with a new arc segment
of the current fillet radius.
If you set the fillet radius to 0, no fillet arcs are inserted. If two linear polyline
segments are separated by one arc segment, FILLET removes that arc and
extends the linear segments until they intersect.
Fillet Parallel Lines
You can fillet parallel lines, xlines, and rays. The current fillet radius
temporarily adjusts to create an arc that is tangent to both objects and located
in the plane common to both objects.
The first selected object must be a line or a ray, but the second object can be
a line, an xline, or a ray. The fillet arc connects as shown in the illustration.
Create Chamfers
A chamfer connects two objects to meet in a flattened or beveled corner.
A chamfer connects two objects with an angled line. It is usually used to
represent a beveled edge on a corner.
266 | Chapter 6 Create and Modify Objects
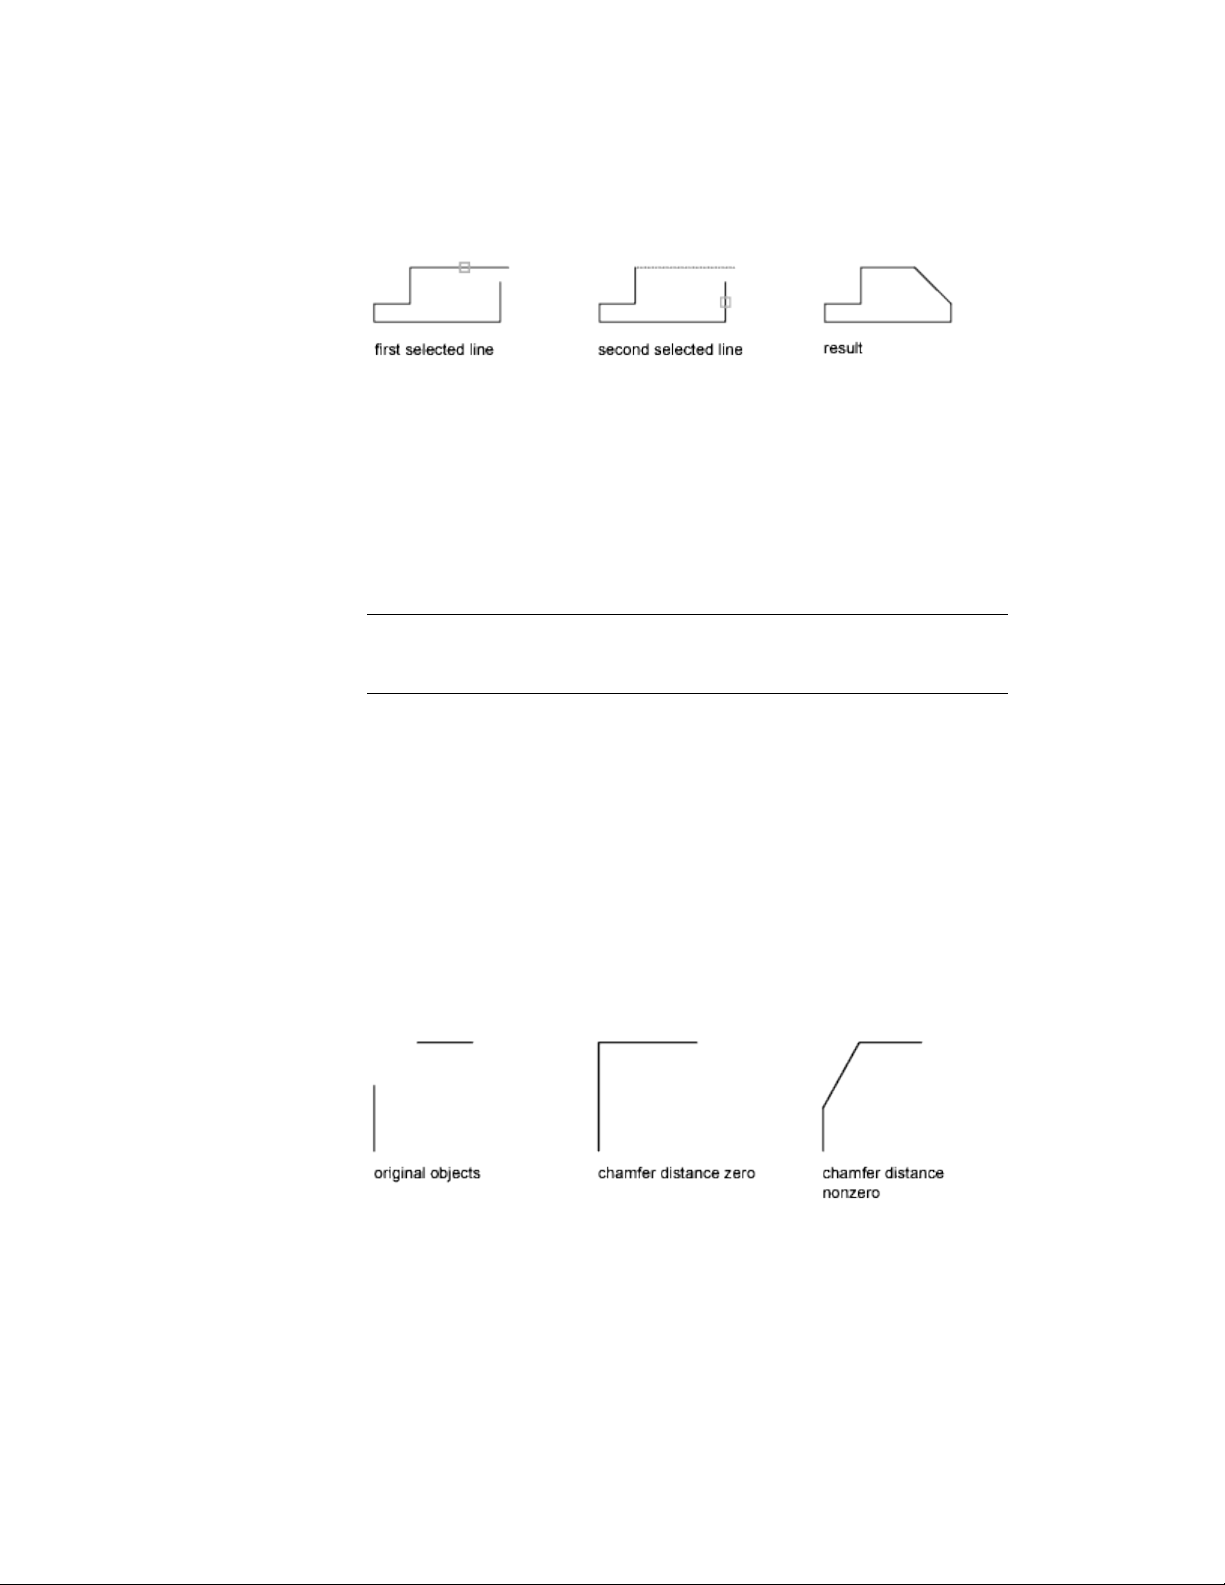
You can chamfer
■ Lines
■ Polylines
■ Rays
■ Xlines
CHAMFER can be used to bevel all corners of a polyline using a single
command.
NOTE Chamfering a hatch boundary that was defined from line segments removes
hatch associativity. If the hatch boundary was defined from a polyline, associativity
is maintained.
If both objects being chamfered are on the same layer, the chamfer line is
created on that layer. Otherwise, the chamfer line is created on the current
layer. The layer affects object properties including color and linetype.
Use the Multiple option to chamfer more than one set of objects without
leaving the command.
Chamfer by Specifying Distances
The chamfer distance is the amount each object is trimmed or extended to
meet the chamfer line or to intersect the other. If both chamfer distances are
0, chamfering trims or extends the two objects until they intersect but does
not create a chamfer line. You can press and hold Shift while selecting the
objects to override the current chamfer distances with a value of 0.
Select and Modify Objects | 267
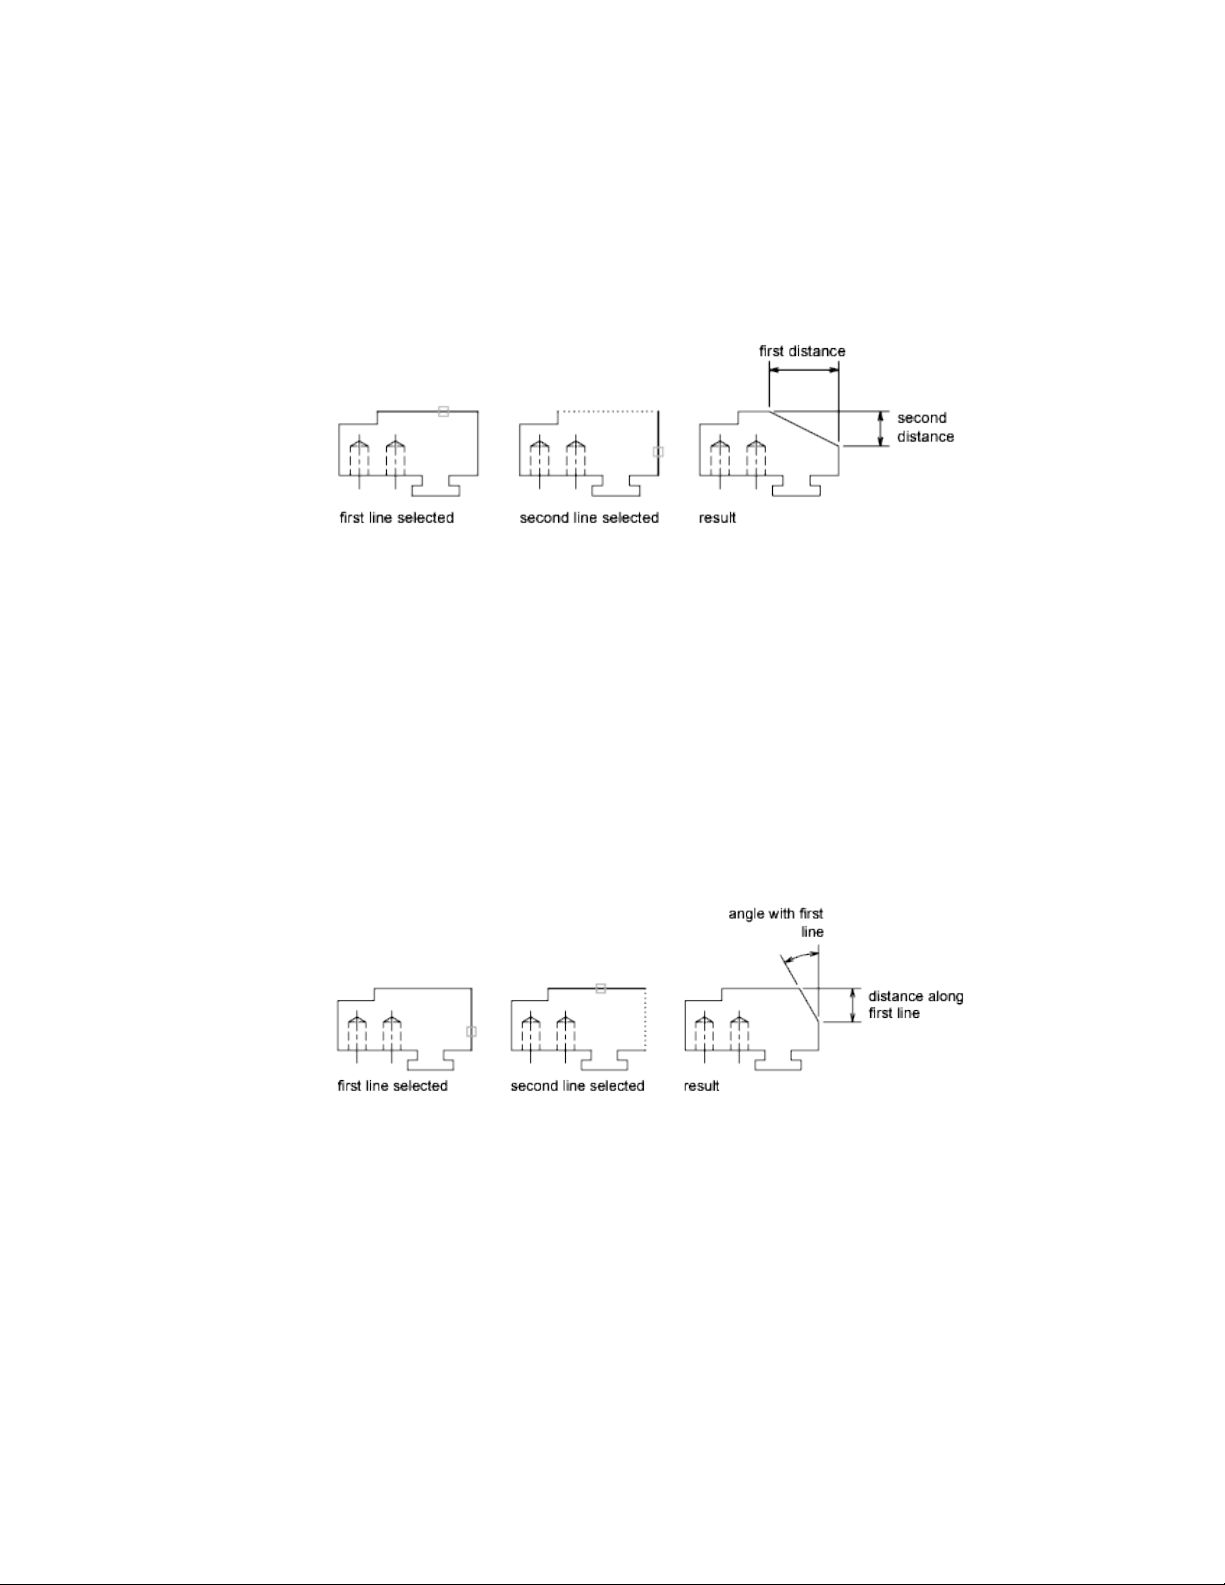
In the following example, you set the chamfer distance to 0.5 for the first line
and 0.25 for the second line. After you specify the chamfer distance, you select
the two lines as shown.
Trim and Extend Chamfered Objects
By default, objects are trimmed when chamfered, but you can use the Trim
option to specify that they remain untrimmed.
Chamfer by Specify Length and Angle
You can chamfer two objects by specifying where on the first selected object
the chamfer line starts, and then the angle the chamfer line forms with this
object.
In this example, you chamfer two lines so that the chamfer line starts 1.5
units from the intersection along the first line and forms an angle of 30 degrees
with this line.
Chamfer Polylines and Polyline Segments
If the two objects you select for chamfering are segments of a polyline, they
must be adjacent or separated by no more than one arc segment. If they are
268 | Chapter 6 Create and Modify Objects
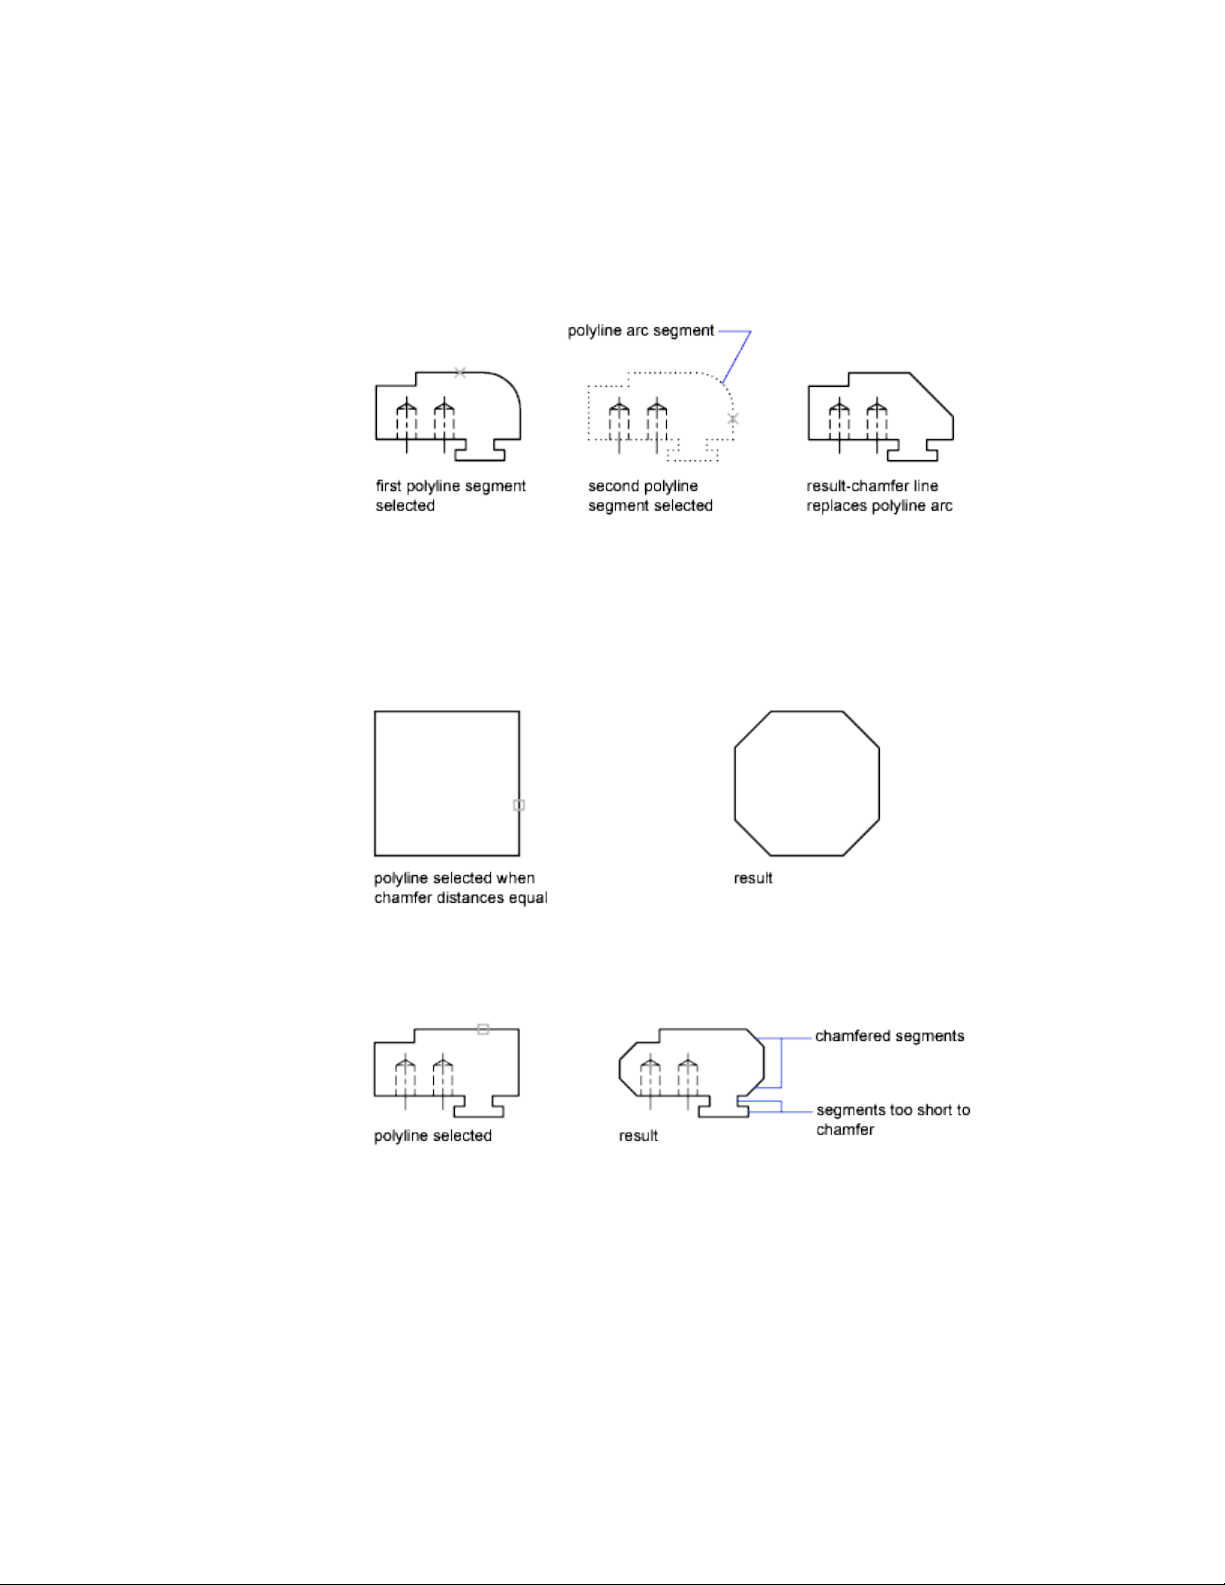
separated by an arc segment, as shown in the illustration, chamfering deletes
the arc and replaces it with a chamfer line.
Chamfer an Entire Polyline
When you chamfer an entire polyline, each intersection is chamfered. For
best results, keep the first and second chamfer distances equal.
In this example, the chamfer distances are set to equal values.
When you chamfer an entire polyline, only the segments that are long enough
to accommodate the chamfer distance are chamfered. The polyline in the
following illustration has some segments too short to be chamfered.
Select and Modify Objects | 269
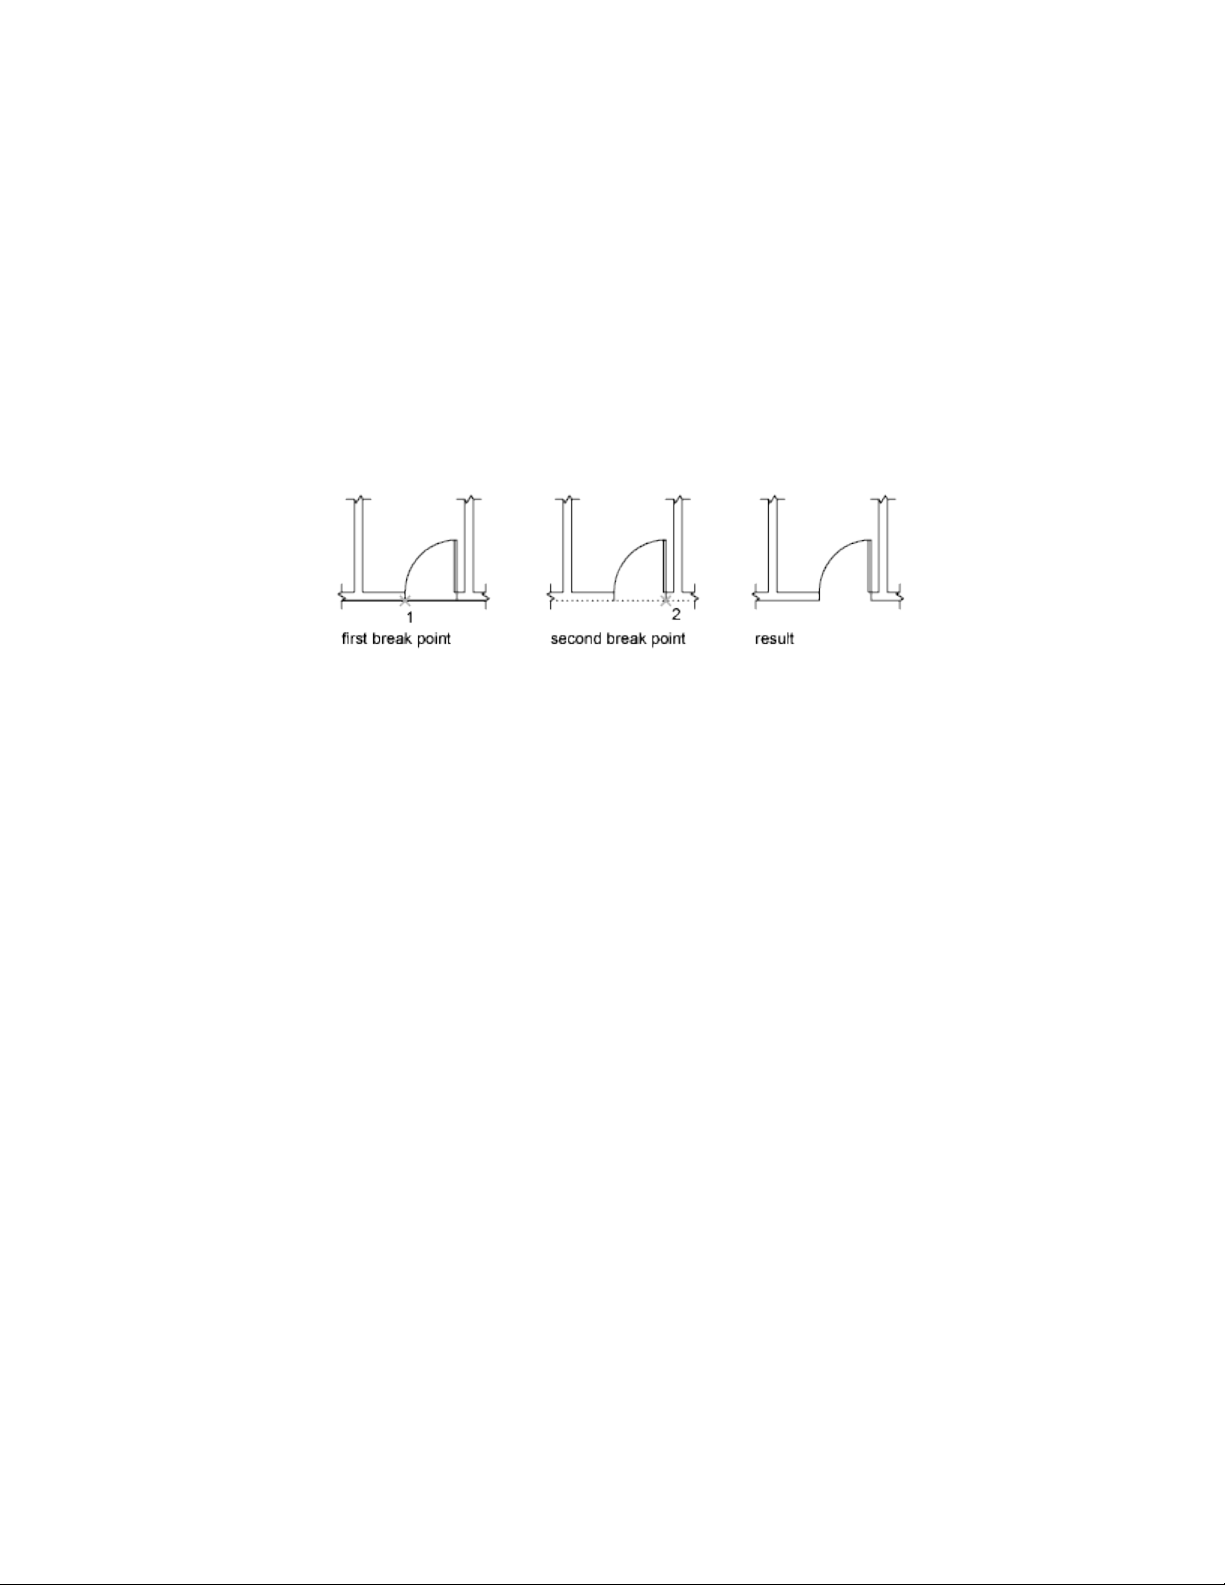
Break and Join Objects
You can break an object into two objects with or without a gap between them.
You can also join objects to create single object or multiple objects.
Break Objects
Use BREAK to create a gap in an object, resulting in two objects with a gap
between them. BREAK is often used to create space for block or text.
To break an object without creating a gap, specify both break points at the
same location.
You can create breaks in most geometric objects except blocks, dimensions,
multilines, and regions. As an alternative, use EXPLODE on these types of
objects, and create breaks in the dissociated geometry.
Join Objects
Use JOIN to combine lines, arcs, elliptical arcs, polylines, 3D polylines, helixes,
and splines by their endpoints into a single object.
The result of the join operation varies depending on the objects selected.
Typical applications include
■ Replacing two collinear lines with a single line.
■ Closing the gap in a line that resulted from a BREAK.
■ Completing an arc into a circle or an elliptical arc into an ellipse. To access
the Close option, select a single arc or elliptical arc.
■ Combining several long polylines in a topographic map.
■ Joining two splines, leaving a kink between them.
In general cases, joining objects that touch end-to-end, but that are not in
the same plane result in 3D polylines and splines.
270 | Chapter 6 Create and Modify Objects

NOTE You can also use the Join option of the PEDIT command to combine a series
of lines, arcs, and polylines into a single polyline
See also:
Modify Polylines (page 272)
Modify Splines (page 274)
Modify Multilines (page 280)
Disassociate Compound Objects (Explode)
You can convert a compound object, such as a polyline, dimension, hatch,
or block reference, into individual elements.
You can explode a compound object, such as a polyline, dimension, hatch,
or block reference, to convert it into individual elements. For example,
exploding a polyline breaks it down to simple lines and arcs. Exploding a
block reference or an associative dimension replaces it with copies of the
objects that compose the block or dimension.
Explode Dimensions and Hatches
When you explode a dimension or a hatch, all associativity is lost and the
dimension or hatch object is replaced by individual objects such as lines, text,
points, and 2D solids. To explode dimensions automatically when you create
them, set the DIMASSOC system variable to 0.
Explode Polylines
When you explode a polyline, any associated width information is discarded.
The resulting lines and arcs follow the polyline's centerline. If you explode a
block that contains a polyline, you need to explode the polyline separately.
If you explode a donut, its width becomes 0.
Explode Block References
If you explode a block with attributes, the attribute values are lost, leaving
only the attribute definitions. The colors and linetypes of objects in exploded
block references can change.
Select and Modify Objects | 271
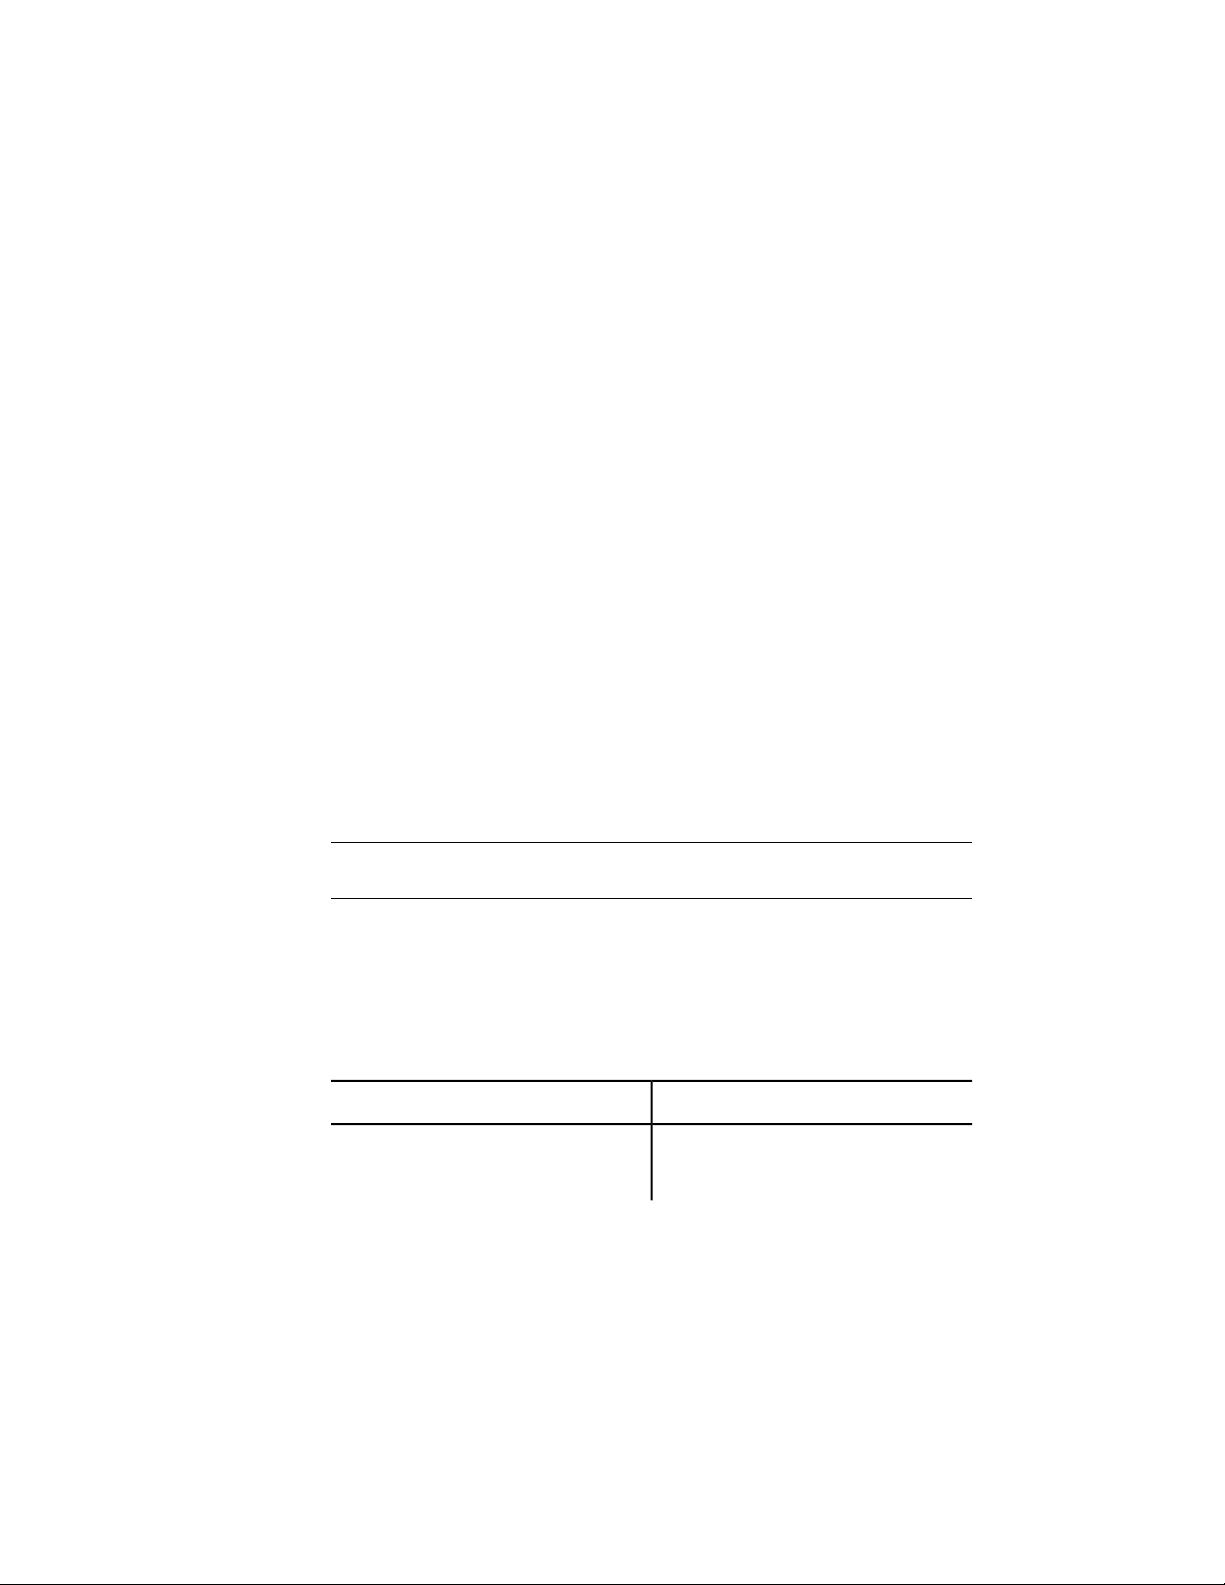
Explode External References
An external reference (xref) is a drawing file linked (or attached) to another
drawing. You cannot explode xrefs and their dependent blocks.
Modify Polylines
Change the shape and display of polyline objects with polyline editing options.
You can also join separate polylines.
You can modify polylines using PEDIT, the Properties Inspector palette, or
grips.
■ Move, add, or delete individual vertices
■ Set a uniform width for the entire polyline or control the width of each
segment
■ Create an approximation of a spline called a spline-fit polyline
■ Display noncontinuous linetypes with or without a dash before and after
each vertex
■ Change the orientation of text in a polyline’s linetype by reversing its
direction
Modify Polylines with Grips
NOTE For general information about working with grips, see Modify Objects Using
Grips (page 233).
Polyline grips offer some grip-specific options, depending on
■ The grip’s location (vertex or midpoint)
■ The segment type (line or arc)
■ The type of Polyline (standard, curve-fit, or spline-fit)
Polyline grip menu options
AnimationOption
Stretch or Stretch Vertex. Specify a
stretch point.
272 | Chapter 6 Create and Modify Objects
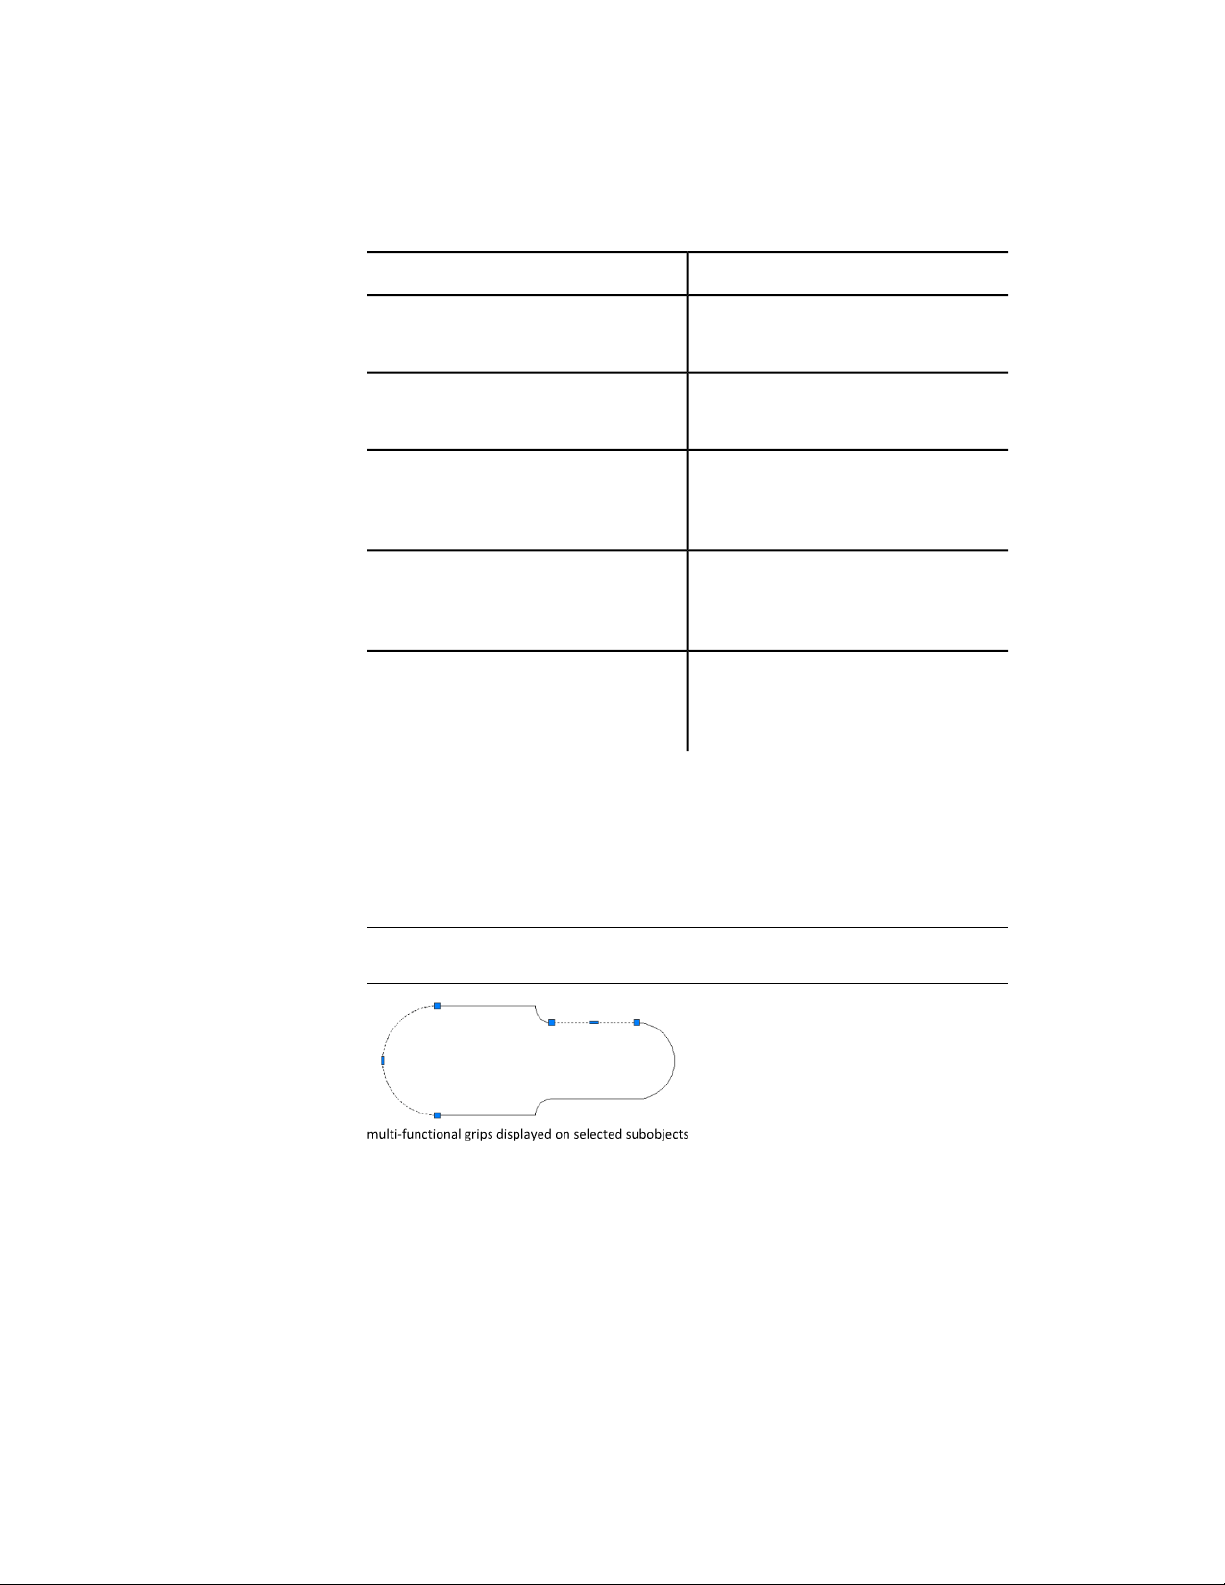
AnimationOption
Add Vertex. Specify a point for the new
vertex.
Remove Vertex. Delete the selected
vertex.
Convert to Arc. Specify the midpoint of
a straight segment to convert it to an arc
segment.
Convert to Line. Specify the midpoint
of an arc segment to convert into a straight
segment.
Tangent Direction. Manipulate the
tangent directions to redefine the shape of
a curve-fit polyline.
Modify a Segment Within a Polyline
To select individual segments (or subobjects) of a polyline, press Ctrl while
clicking the segments. You can use grips to modify the segments. You can use
the to change the width of individual segments; changing any other property
affects the entire polyline even if only a segment is selected.
TIP The GRIPSUBOBJMODE system variable controls whether grips are
automatically selected (or made “hot”) when subobjects are selected.
Select and Modify Objects | 273

Join Polyline Segments
You can join a line, an arc, or another polyline to an open polyline if their
ends connect or are close to each other.
If the ends are not coincident but are within a distance that you can set, called
the fuzz distance, the ends are joined by either trimming them, extending
them, or connecting them with a new segment.
Spline-fit polylines return to their original shape when joined. Polylines cannot
be joined into a Y shape.
If the properties of several objects being joined into a polyline differ, the
resulting polyline inherits the properties of the first object that you selected.
See also:
Choose a Method to Modify Objects (page 232)
Modify Objects Using Grips (page 233)
Overview of Constraints (page 282)
Trim or Extend Objects (page 256)
Break and Join Objects (page 270)
Modify Splines
Several methods are available for editing splines and changing their underlying
mathematical parameters.
You can edit splines using multi-functional grips, SPLINEDIT, 3DEDITBAR,
and the Properties Inspector palette. In addition to these operations, splines
can be trimmed, extended, and filleted.
Edit Splines with Multi-Functional Grips
Multi-functional grips provide options that include adding control vertices
and changing the tangent direction of the spline at its endpoints. Display a
menu of options by hovering over a grip.
274 | Chapter 6 Create and Modify Objects
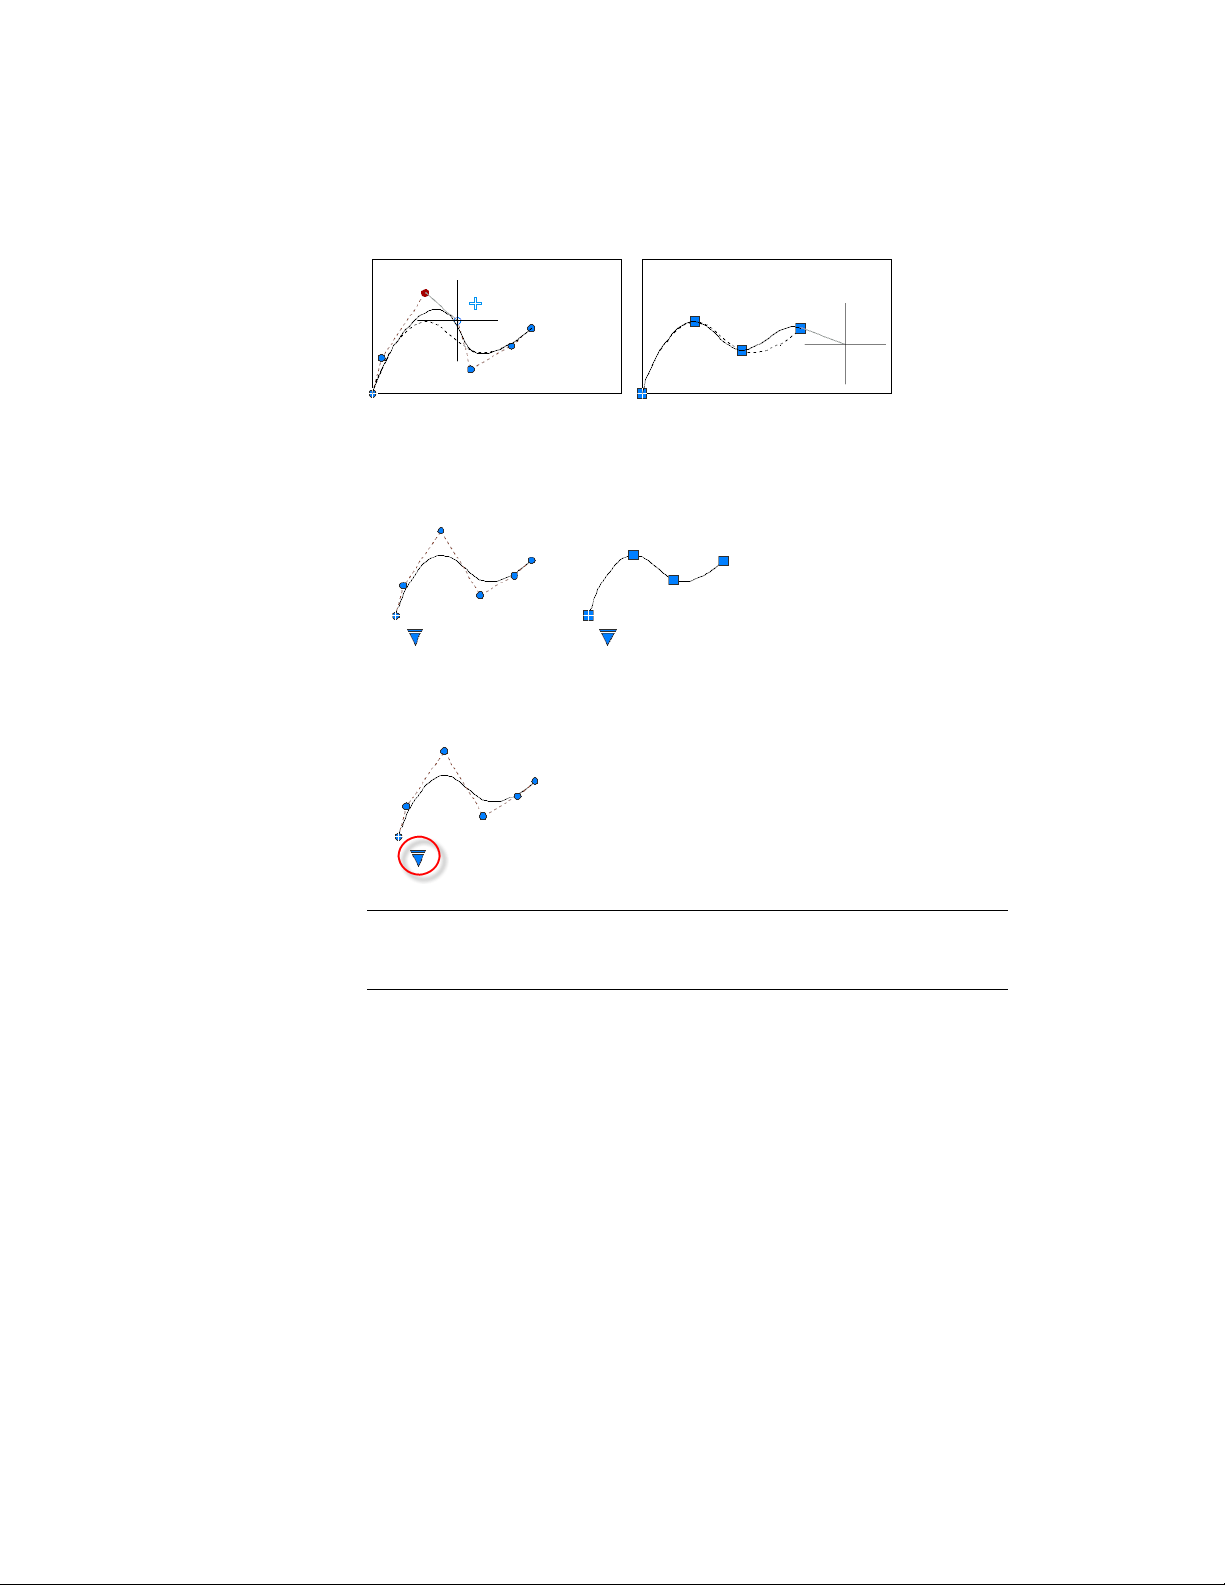
The editing options available with multi-functional grips differ depending on
whether the spline is set to display control vertices or fit points. The spline on
the left displays control vertices, and the one on the right displays fit points.
To switch between displaying control vertices and displaying fit points, click
the triangular grip.
IMPORTANT Switching from displaying control vertices to fit points automatically
changes the selected spline to degree 3. Splines originally created using
higher-degree equations will likely change shape as a result.
In general, editing a spline with control vertices provides finer control over
reshaping a small section of the curve than editing a spline with fit points.
Select and Modify Objects | 275
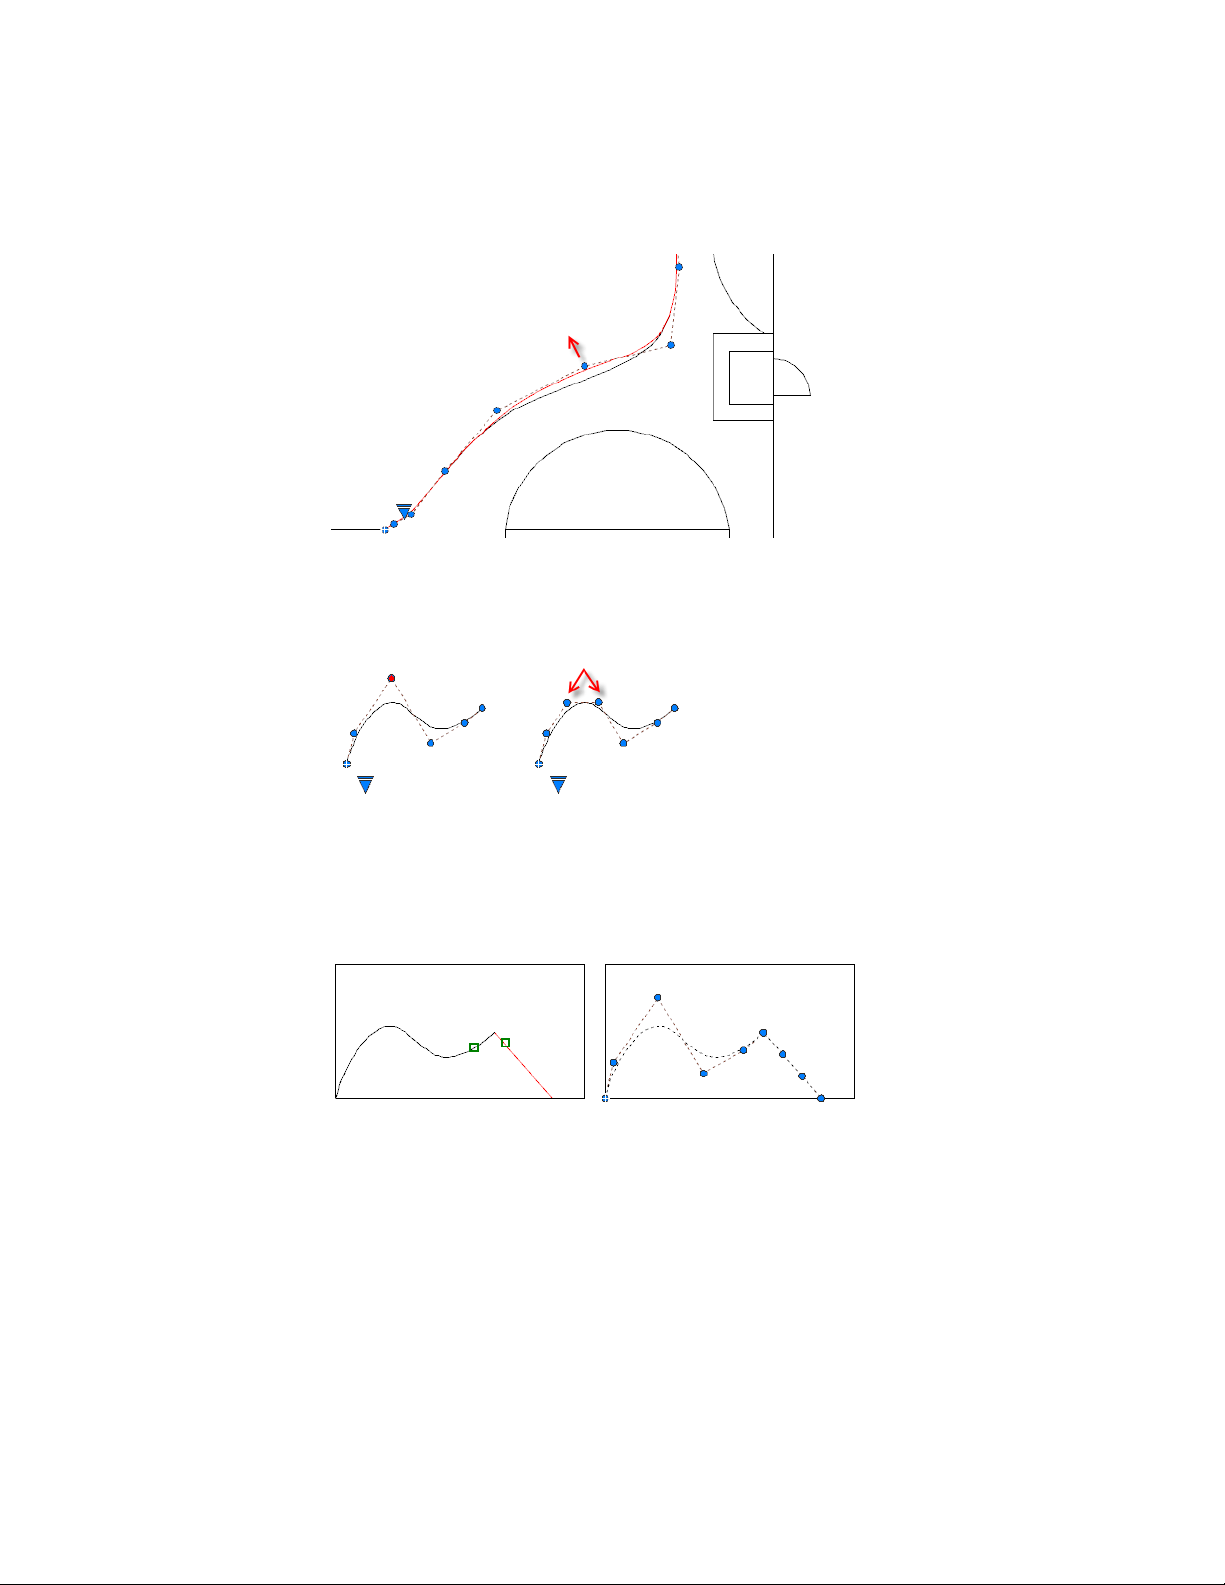
You can insert additional control vertices to a section of a spline to obtain
greater control in that section at the expense of making the shape of the spline
more complicated. The Refine option adds a knot to the spline resulting in
replacing the selected control vertex with two control vertices.
Edit Splines with SPLINEDIT
SPLINEDIT provides additional editing options, such as adding a kink to the
spline, and joining a spline to another contiguous object, such as a line, arc,
or other spline. As shown, objects are joined to splines with C0 continuity.
Edit Splines with 3DEDITBAR
3DEDITBAR displays a gizmo that can move a portion of a spline
proportionately, or change the direction and magnitude of the tangent at a
276 | Chapter 6 Create and Modify Objects
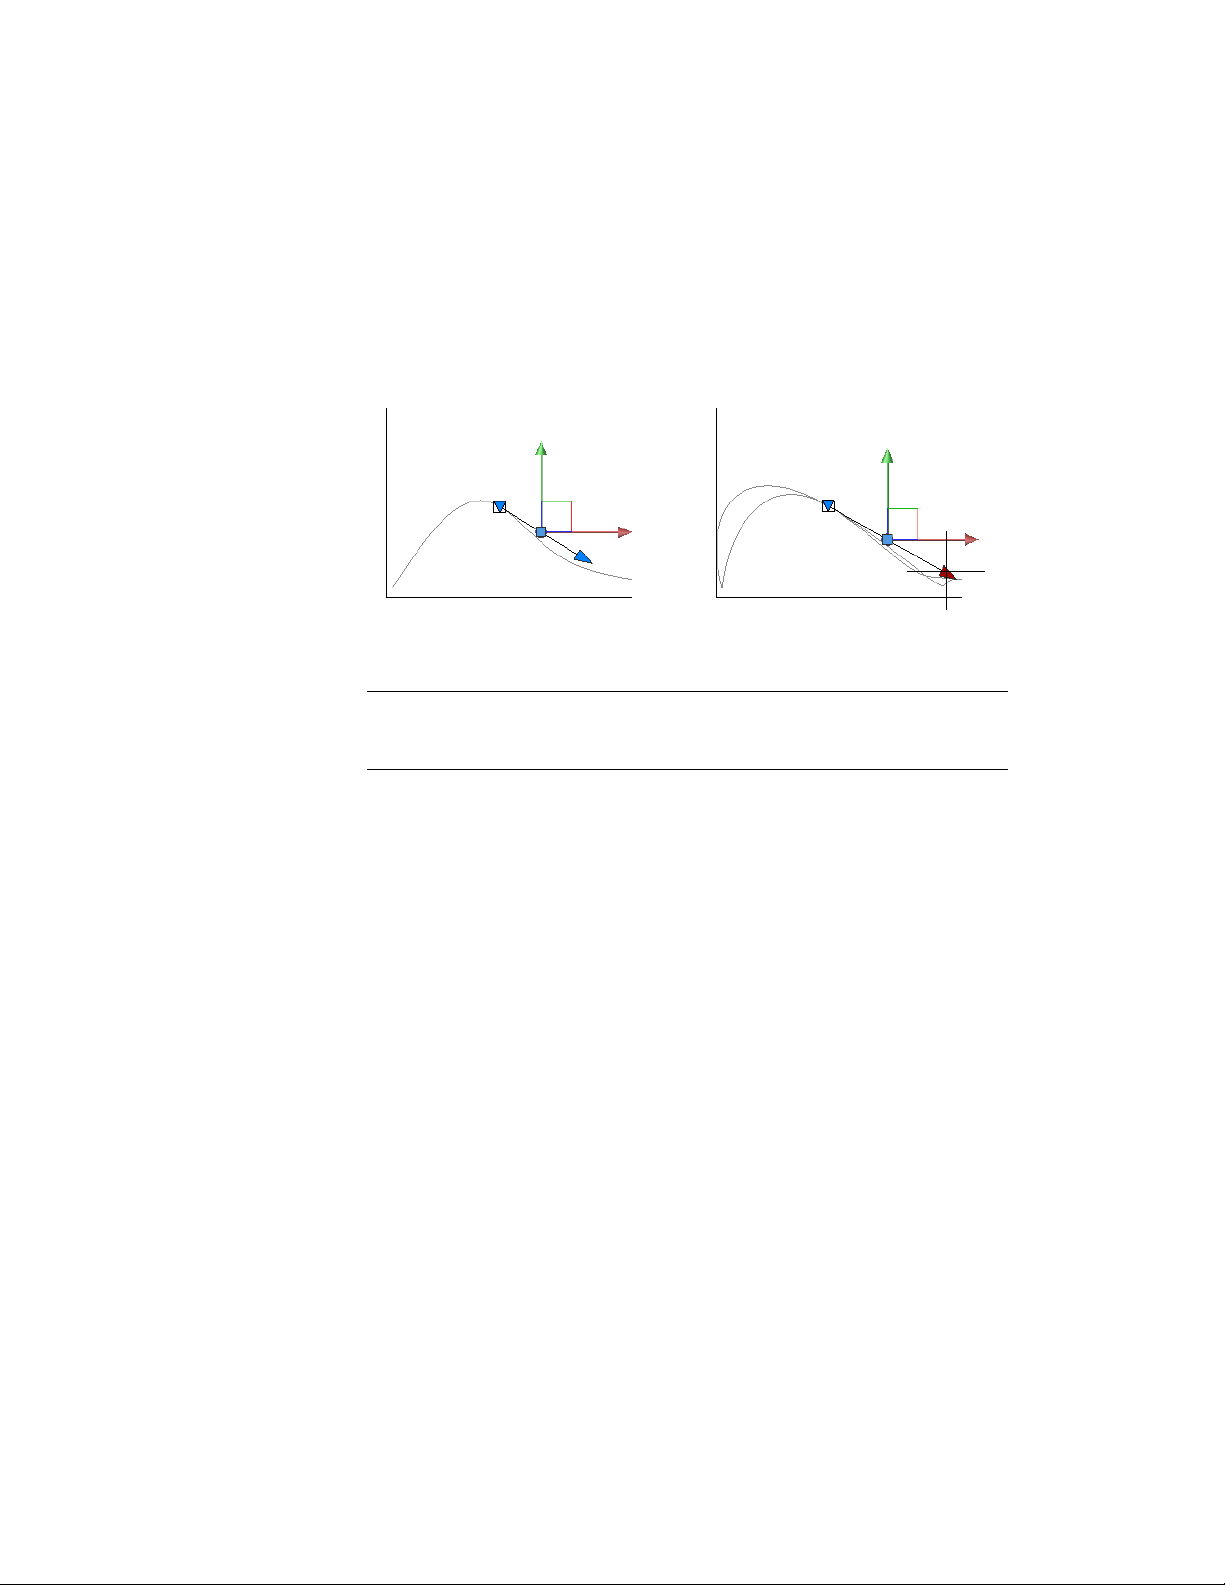
specified base point on the spline. To display a menu of control options,
right-click the gizmo.
The gizmo in the illustration is the default setting, which is the Move Point
Location option. The square grip is located at a specified base point on the
spline, and is used to stretch a portion of the spline.
The red and green axis arrow grips constrain the movement of the square grip
in their respective directions.
TIP Not visible in the illustration is a blue axis arrow grip that points toward you.
This axis is visible in other views such as a 3D isometric view, and can be used to
modify the shape of a spline in 3D.
Click the downward-pointing triangular grip to switch to the Move Tangent
Direction option as illustrated below. Even though the axes of the gizmo
change their location, the base point remains the same. With this option,
moving the square grip changes the slope of the tangent at the base point.
The tangent arrow grip changes the magnitude of the tangent at the base
point, creating either a sharper or a flatter curvature at the base point. In the
illustration, the magnitude of the tangent is being increased.
Edit Splines with a Palette
The Properties Inspector palette provides access to several spline parameters
and options, including the degree of the spline, the weight for each control
point, the knot parameterization method used in conjunction with fit points,
and whether the spline is closed. For more information, see Draw Splines (page
210).
Trim, Extend, and Fillet Splines
Trimming a spline shortens it without changing the shape of the portion that
remains. Extending a spline lengthens it by adding a linear portion that is
Select and Modify Objects | 277
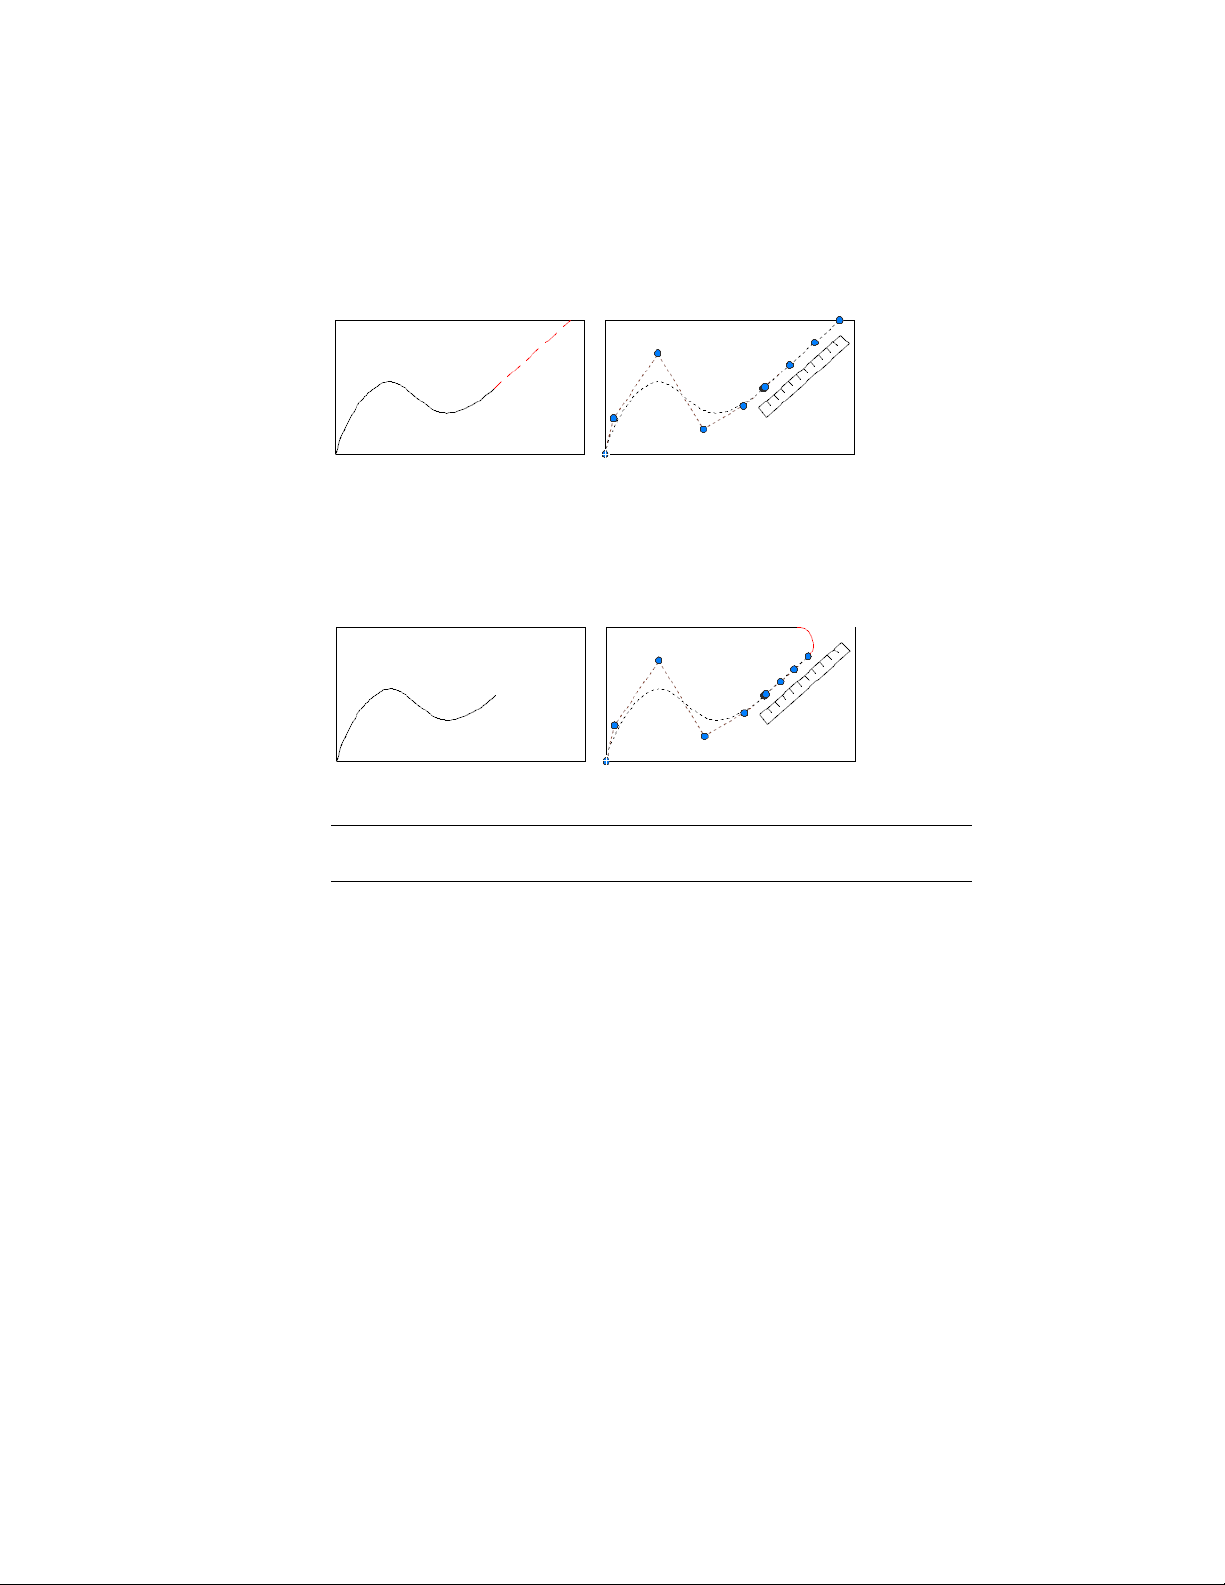
tangent to the end of the spline (C1 continuity). If the shape of the spline is
later changed, the tangency of the linear portion is not maintained.
Trimming a spline shortens it without changing the shape of the portion that
remains.
Filleting a spline creates an arc that is tangent to the spline and the other
selected object. The spline might be extended with a linear portion to complete
the fillet operation.
For more information, see Modify Objects Using Grips (page 233).
NOTE Because periodic curves and surfaces are not currently supported, the objects
may kink if they are reshaped.
See also:
Draw Splines (page 210)
Break and Join Objects (page 270)
Use Object Grips (page 233)
Edit NURBS Surfaces (page 448)
Rebuild NURBS Surfaces and Curves (page 449)
Modify Helixes
You can use grips or the Properties Inspector palette to modify the shape and
size of a helix.
278 | Chapter 6 Create and Modify Objects
You can use the grips on a helix to change the following properties:
■ Start point
■ Base radius
■ Top radius
■ Height
■ Location
When you use a grip to change the base radius of a helix, the top radius scales
to maintain the current ratio. Use the Properties Inspector palette to change
the base radius independent of the top radius.
You can use the Properties Inspector palette to change other helix properties,
such as
■ Number of turns (Turns)
■ Turn height
■ Direction of the twist — clockwise (CW) or counterclockwise (CCW)
With the Constrain property, you can specify that the Height, Turns, or Turn
Height properties of the helix are constrained. The Constrain property affects
how the helix changes when the Height, Turns, or Turn Height properties are
changed either through the Properties Inspector palette or through grip editing.
The table below shows the behavior of the helix depending on which property
is constrained.
Effect on these helix propertiesProperty to
change
Constrained
property
Turn HeightTurnsHeight
ChangedFixedChangedHeightHeight
ChangedChangedFixedTurns
ChangedChangedFixedTurn Height
ChangedFixedChangedHeightTurns
ChangedChangedFixedTurns
Select and Modify Objects | 279
Effect on these helix propertiesProperty to
change
Constrained
property
Turn HeightTurnsHeight
ChangedFixedChangedTurn Height
FixedChangedChangedHeightTurn Height
FixedChangedChangedTurns
ChangedChangedFixedTurn Height
See also:
Draw Helixes (page 214)
Modify Multilines
Multiline objects are composed of 1 to 16 parallel lines, called elements. To
modify multilines or their elements, you can use common multiline editing
commands.
Special multiline editing features are available with the -MLEDIT command
including the following:
■ Add or delete a vertex
■ Control the visibility of corner joints
■ Control the style of intersection with other multilines
■ Open or close gaps in a multiline object
Add and Delete Multiline Vertices
You can add or delete any vertex in a multiline.
280 | Chapter 6 Create and Modify Objects
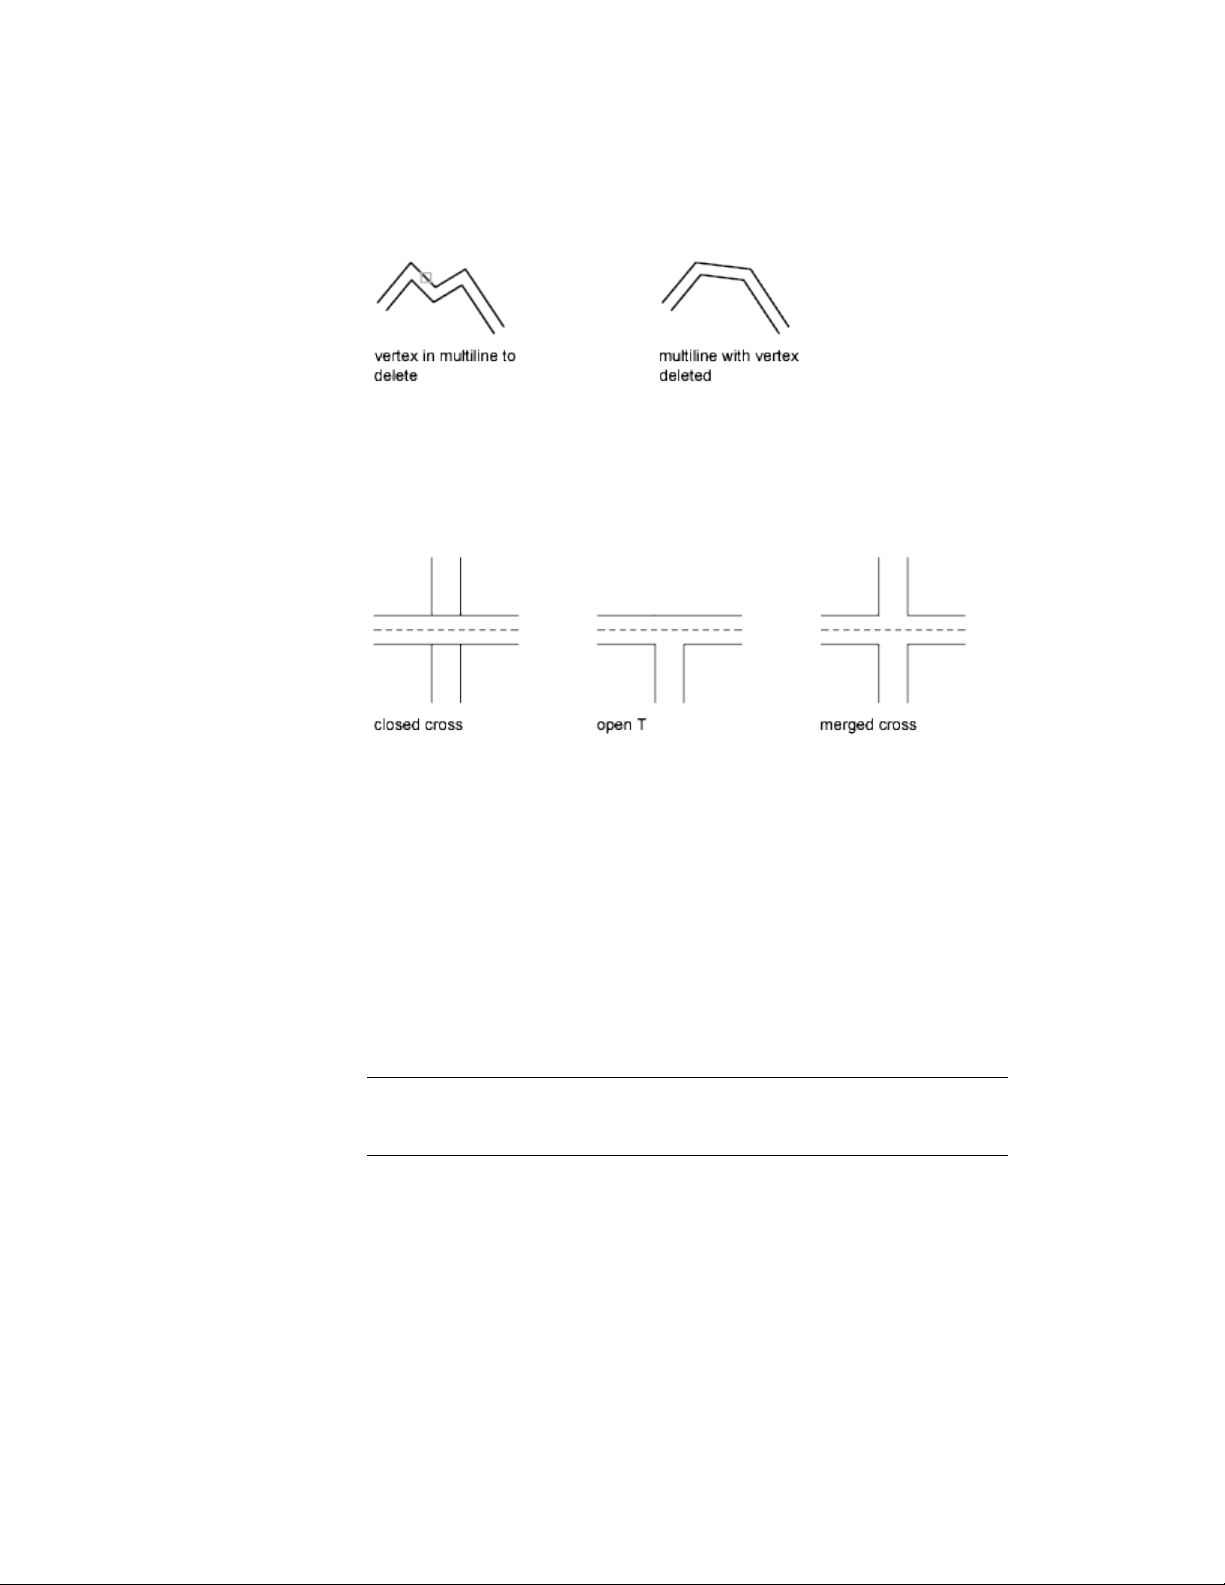
Edit Multiline Intersections
If you have two multilines in a drawing, you can control the way they intersect.
Multilines can intersect in a cross or a T shape, and the crosses or T shapes
can be closed, open, or merged.
Use Common Editing Commands on Multilines
You can use most of the common editing commands on multilines except
■ BREAK
■ CHAMFER
■ FILLET
■ LENGTHEN
■ OFFSET
To perform these operations, first use EXPLODE to replace the multiline object
with separate line objects.
NOTE If you trim or extend a multiline object, only the first boundary object
encountered determines the shape of the end of the multiline. A multiline cannot
have a complex boundary at its endpoint.
See also:
Draw Multiline Objects (page 199)
Select and Modify Objects | 281
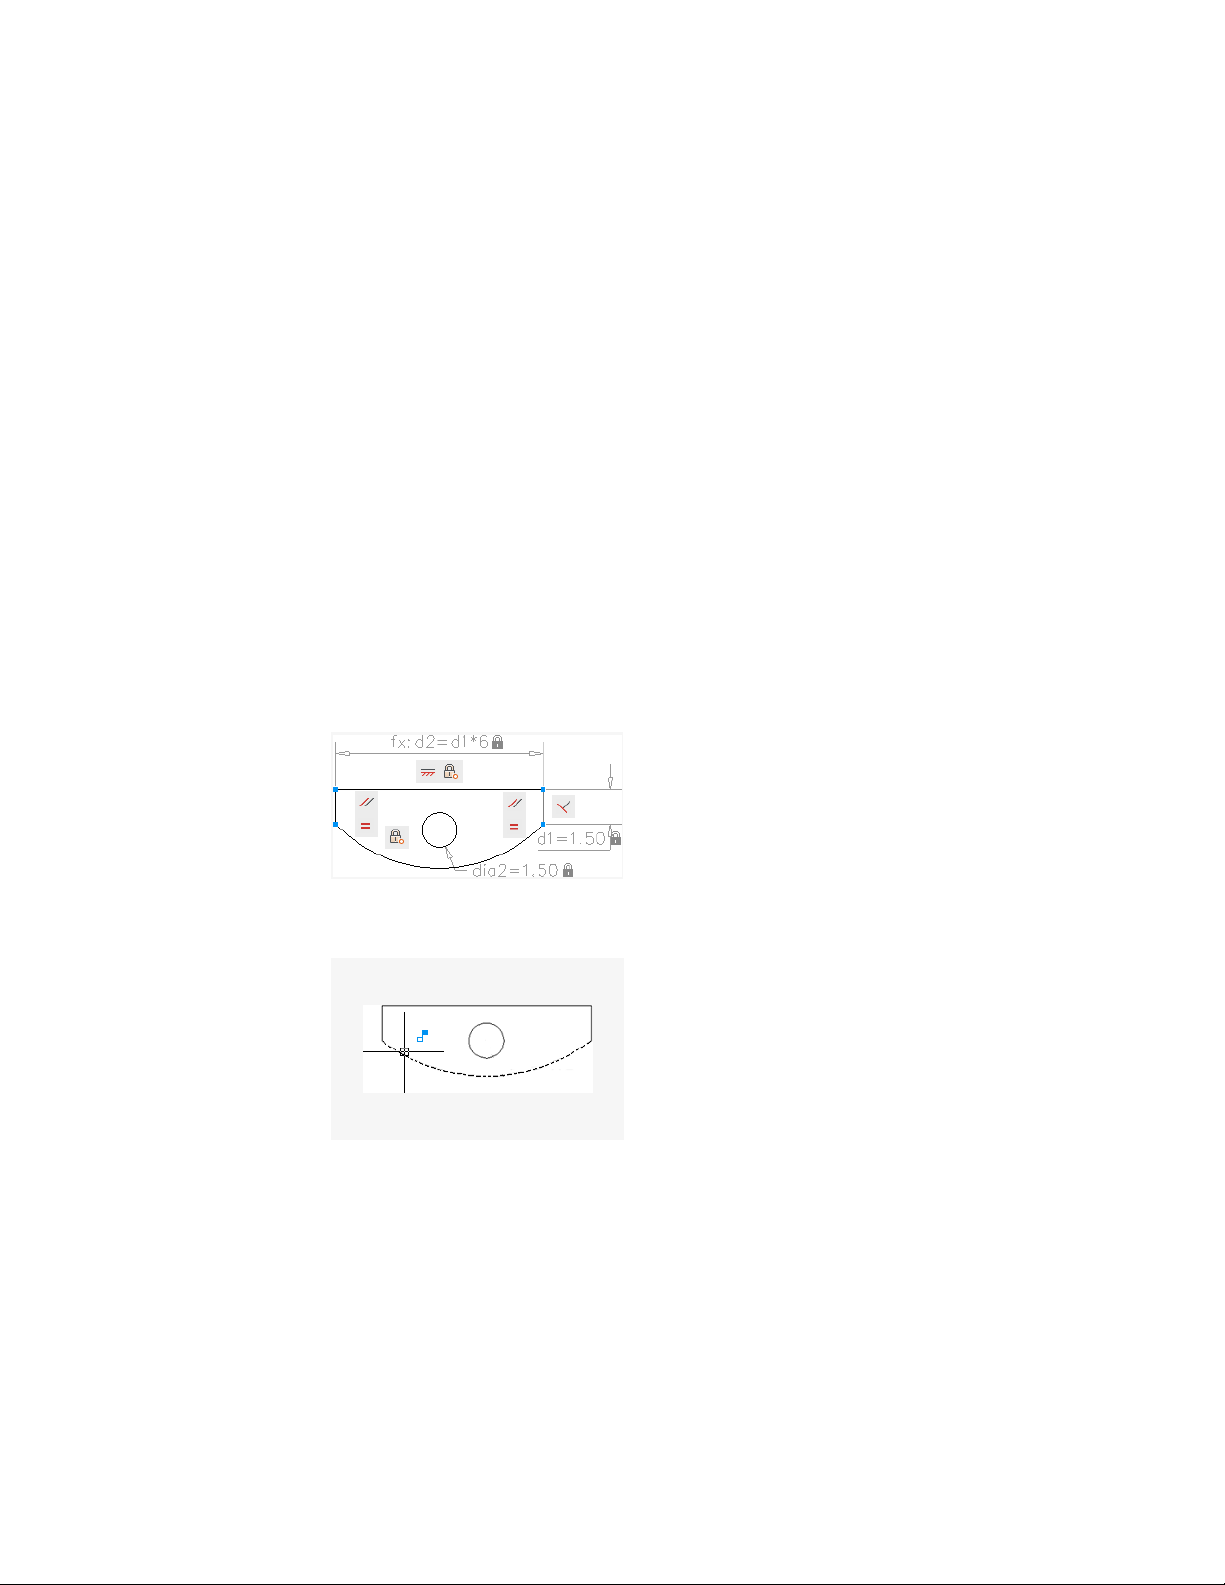
Add Constraints to Geometry
With parametric drawing, you can add constraints to geometry to ensure that
the design conforms to specified requirements.
Overview of Constraints
Parametric drawing is a technology that is used for designing with constraints.
Constraints are associations and restrictions applied to 2D geometry.
There are two general types of constraints:
■ Geometric constraints control the relationships of objects with respect to
each other
■ Dimensional constraints control the distance, length, angle, and radius
values of objects
The following illustration displays geometric and dimensional constraints
using the default format and visibility.
A blue cursor icon always displays when you move the cursor over an object
that has constraints applied to it.
In the design phase of a project, constraints provide a way to enforce
requirements when experimenting with different designs or when making
changes. Changes made to objects can adjust other objects automatically, and
restrict changes to distance and angle values.
282 | Chapter 6 Create and Modify Objects

With constraints, you can
■ Maintain design specifications and requirements by constraining the
geometry within a drawing
■ Apply multiple geometric constraints to objects instantly
■ Include formulas and equations within dimensional constraints
■ Make design changes quickly by changing the value of a variable
BEST PRACTICE It is recommended that you first apply geometric constraints to
determine the shape of a design, and then apply dimensional constraints to
determine the size of objects in a design.
Design Using Constraints
When you are creating or changing a design, a drawing will be in one of three
states:
■ Unconstrained. No constraints are applied to any geometry.
■ Underconstrained. Some constraints are applied to the geometry.
■ Fully constrained. All relevant geometric and dimensional constraints are
applied to the geometry. A fully constrained set of objects also needs to
include at least one Fix constraint to lock the location of the geometry.
Thus, there are two general methods for designing with constraints:
■ You can work in an underconstrained drawing and make changes as you
go, using a combination of editing commands, grips, and adding or
changing constraints.
■ You can create and fully constrain a drawing first, and then control the
design exclusively by relaxing and replacing geometric constraints, and
changing the values in dimensional constraints.
The method that you choose depends on your design practices and the
requirements of your discipline.
NOTE The program prevents you from applying any constraints that result in an
overconstrained condition.
Add Constraints to Geometry | 283

Remove or Relax Constraints
There are two ways to cancel the effects of constraints when you need to make
design changes:
■ Delete the constraints individually and later apply new constraints. While
the cursor hovers over a geometric constraint icon, you can use the Delete
key or the shortcut menu to delete the constraint.
■ Relax the constraints temporarily on selected objects to make the changes.
With a grip selected or when you specify options during an editing
command, tap the Shift key to alternate between relaxing constraints
and maintaining constraints.
Relaxed constraints are not maintained during editing. Constraints are restored
automatically if possible when the editing process is complete. Constraints
that are no longer valid are removed.
NOTE The DELCONSTRAINT command deletes all geometric and dimensional
constraints from an object.
Constrain Objects Geometrically
Geometric constraints determine the relationships between 2D geometric
objects or points on objects relative to each other.
Overview of Geometric Constraints
You can specify geometric constraints between 2D objects or points on objects.
When you later edit the constrained geometry, the constraints are maintained.
Thus, using geometric constraints, you have a method of including design
requirements in your drawing.
For example, in the illustration below, the following constraints are applied
to the geometry.
■ Every endpoint is constrained to remain coincident with the endpoint of
every adjacent object—these constraints are displayed as small blue squares
■ The vertical lines are constrained to remain parallel with each other and
to remain equal to each other in length
■ The left vertical line is constrained to remain perpendicular to the
horizontal line
284 | Chapter 6 Create and Modify Objects
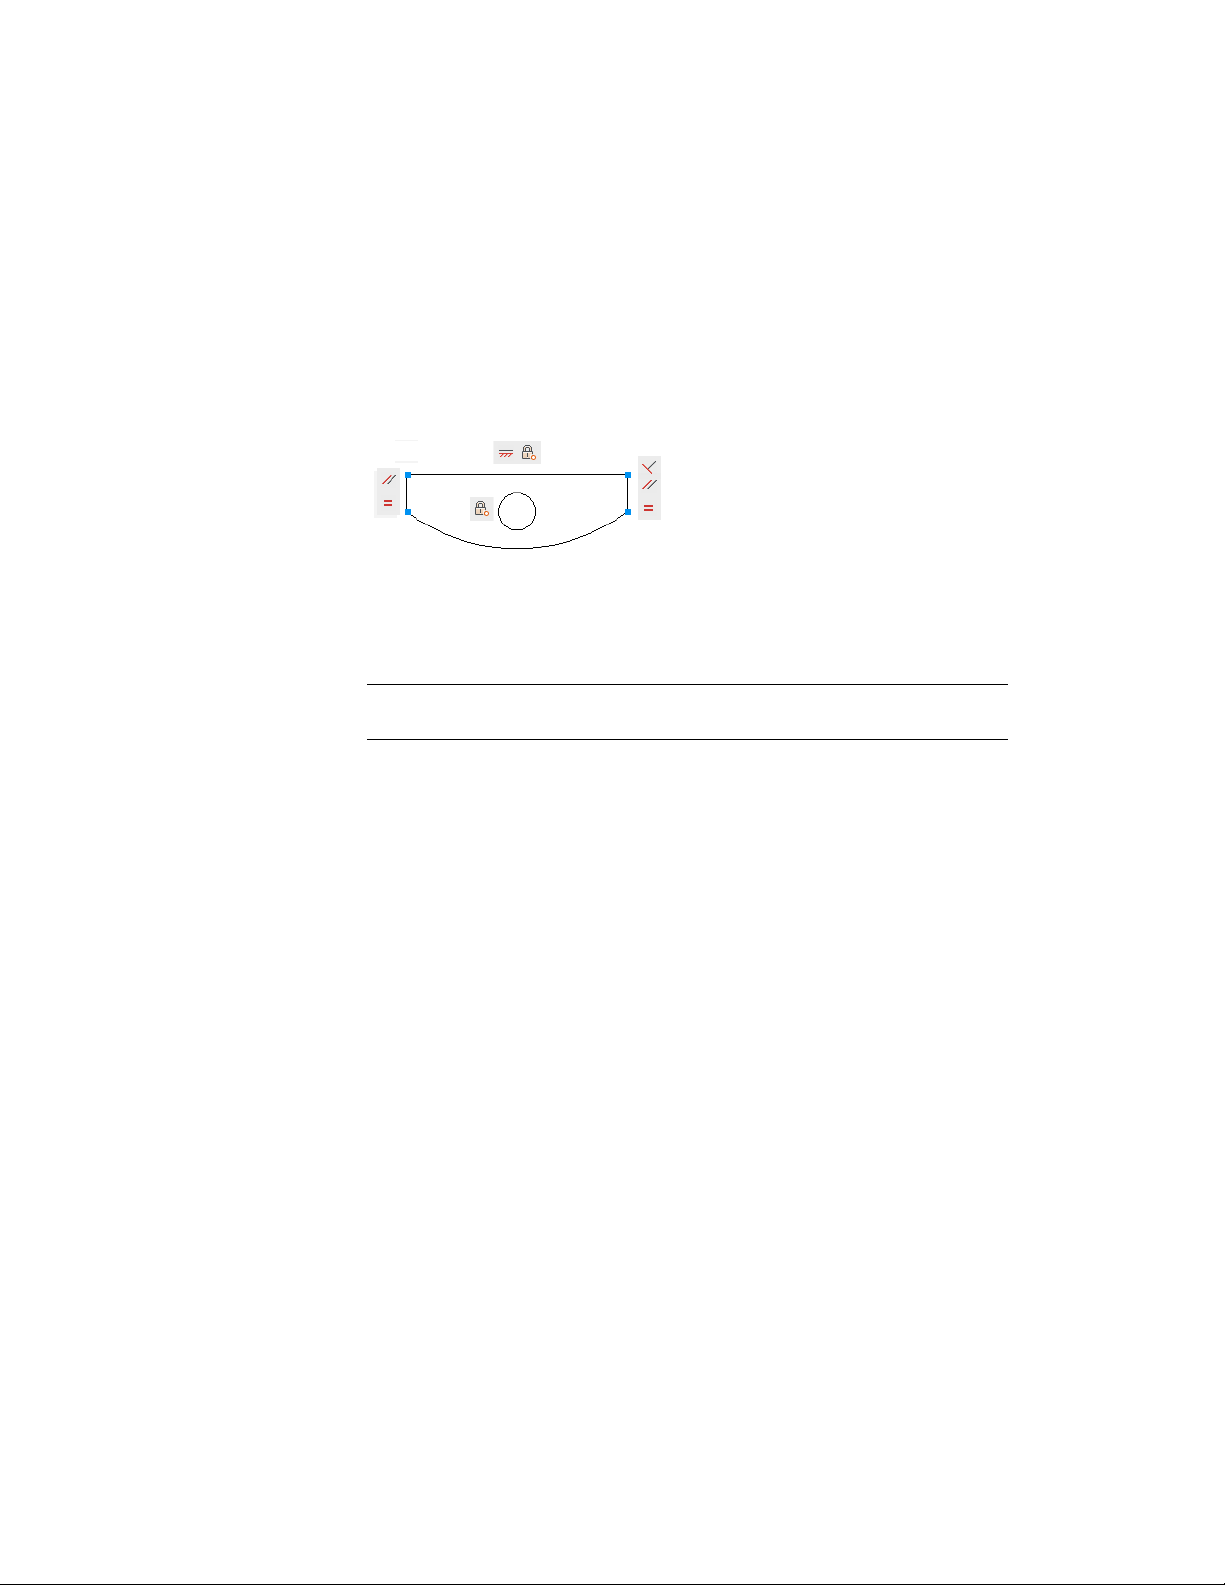
■ The horizontal line is constrained to remain horizontal
■ The location of the circle and the horizontal line are constrained to remain
fixed in space—these constraints are displayed as lock icons
NOTE The locked geometry is not associated to the other geometry without
geometric constraints linked to it.
The geometry is not fully constrained, however. Using grips, you can still change
the radius of the arc, the diameter of the circle, the length of the horizontal
line, and the length of the vertical lines. To specify these distances, you need
to apply dimensional constraints.
NOTE Constraints can be added to segments within a polyline as if they were
separate objects.
See also:
Overview of Dimensional Constraints (page 295)
Apply or Remove Geometric Constraints
Geometric constraints associate geometric objects together, or specify a fixed
location or angle.
For example, you can specify that a line should always be perpendicular to
another one, that an arc and a circle should always remain concentric, or that
a line should always be tangent to an arc.
Add Constraints to Geometry | 285
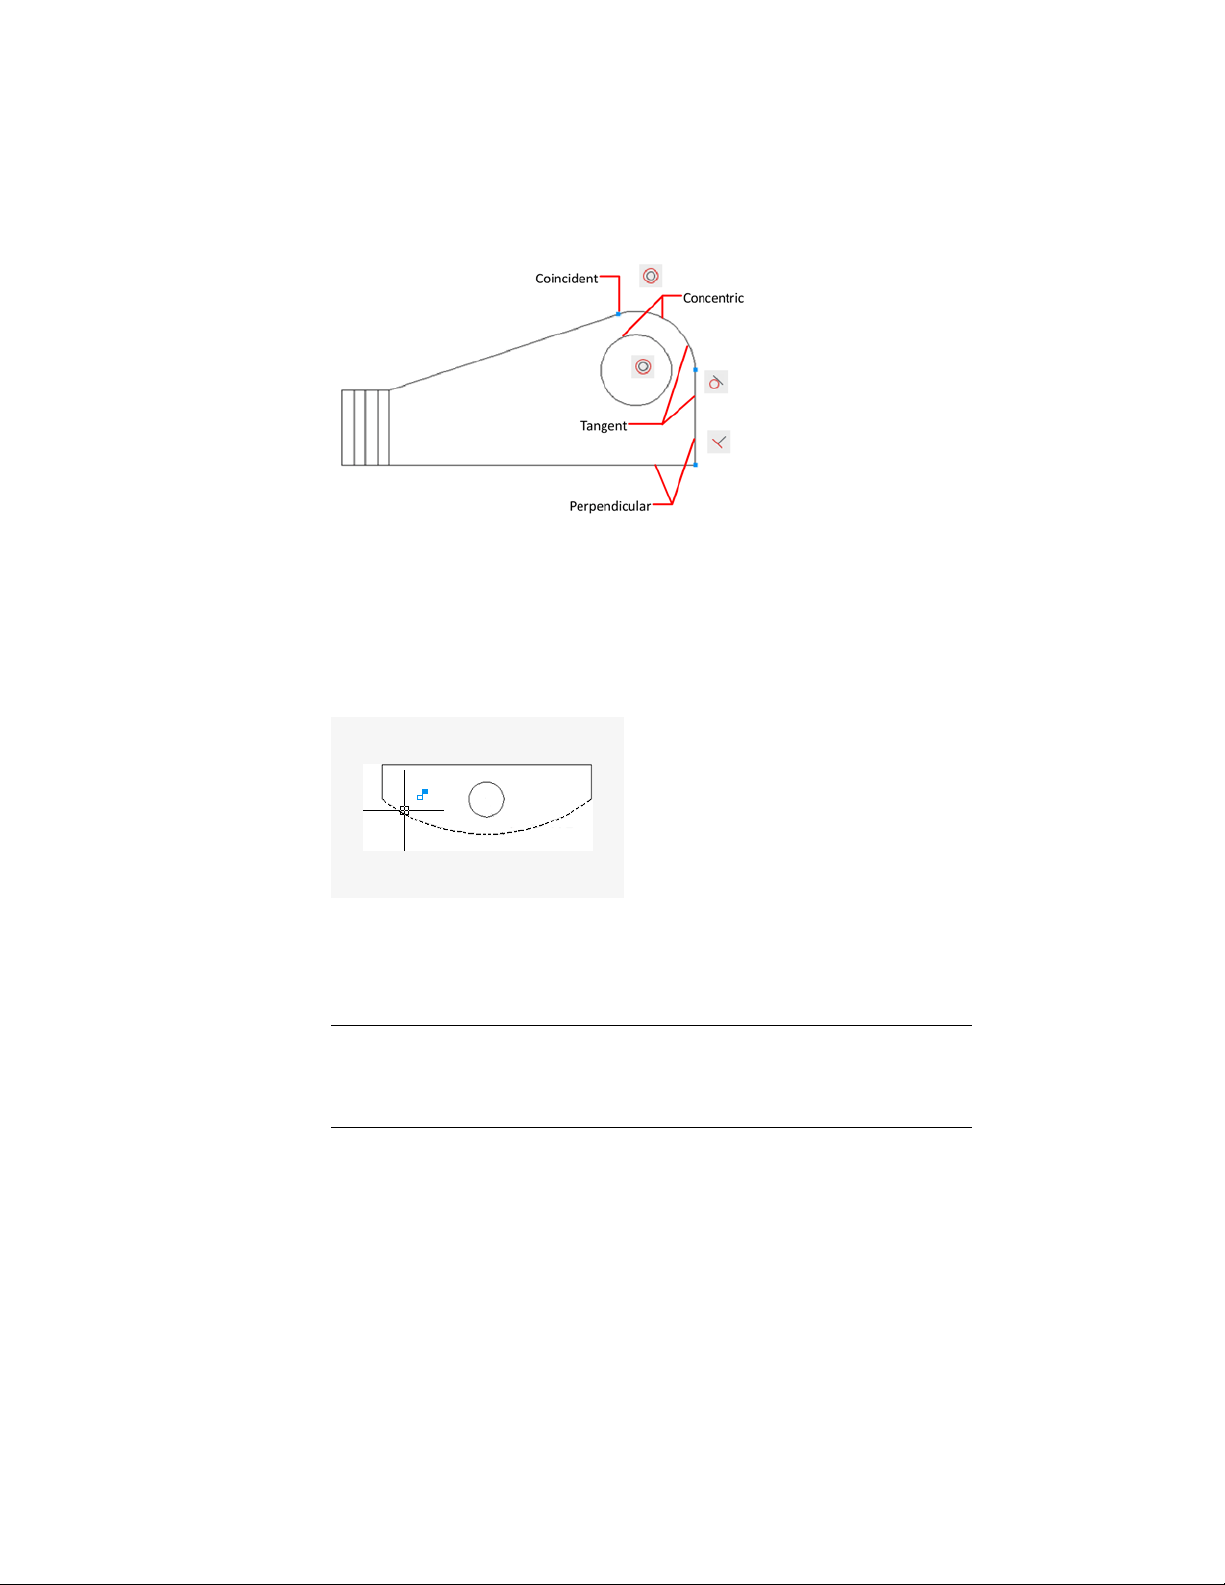
When you apply a constraint, two things occur:
■ The object that you select adjusts automatically to conform to the specified
constraint
■ By default, a gray constraint icon displays near the constrained object as
shown in the previous illustration, and a small blue glyph displays with
your cursor when you move it over a constrained object
Once applied, constraints permit only those changes to the geometry that do
not violate the constraints. This provides a method for exploring design options
or making design changes while maintaining the requirements and
specifications of the design.
NOTE The order in which you select two objects when you apply a constraint is
important in some cases. Normally, the second object you select adjusts to the
first object. For example, when you apply a perpendicular constraint, the second
object you select will adjust to become perpendicular to the first.
You can apply geometric constraints to 2D geometric objects only. Objects
cannot be constrained between model space and paper space.
286 | Chapter 6 Create and Modify Objects
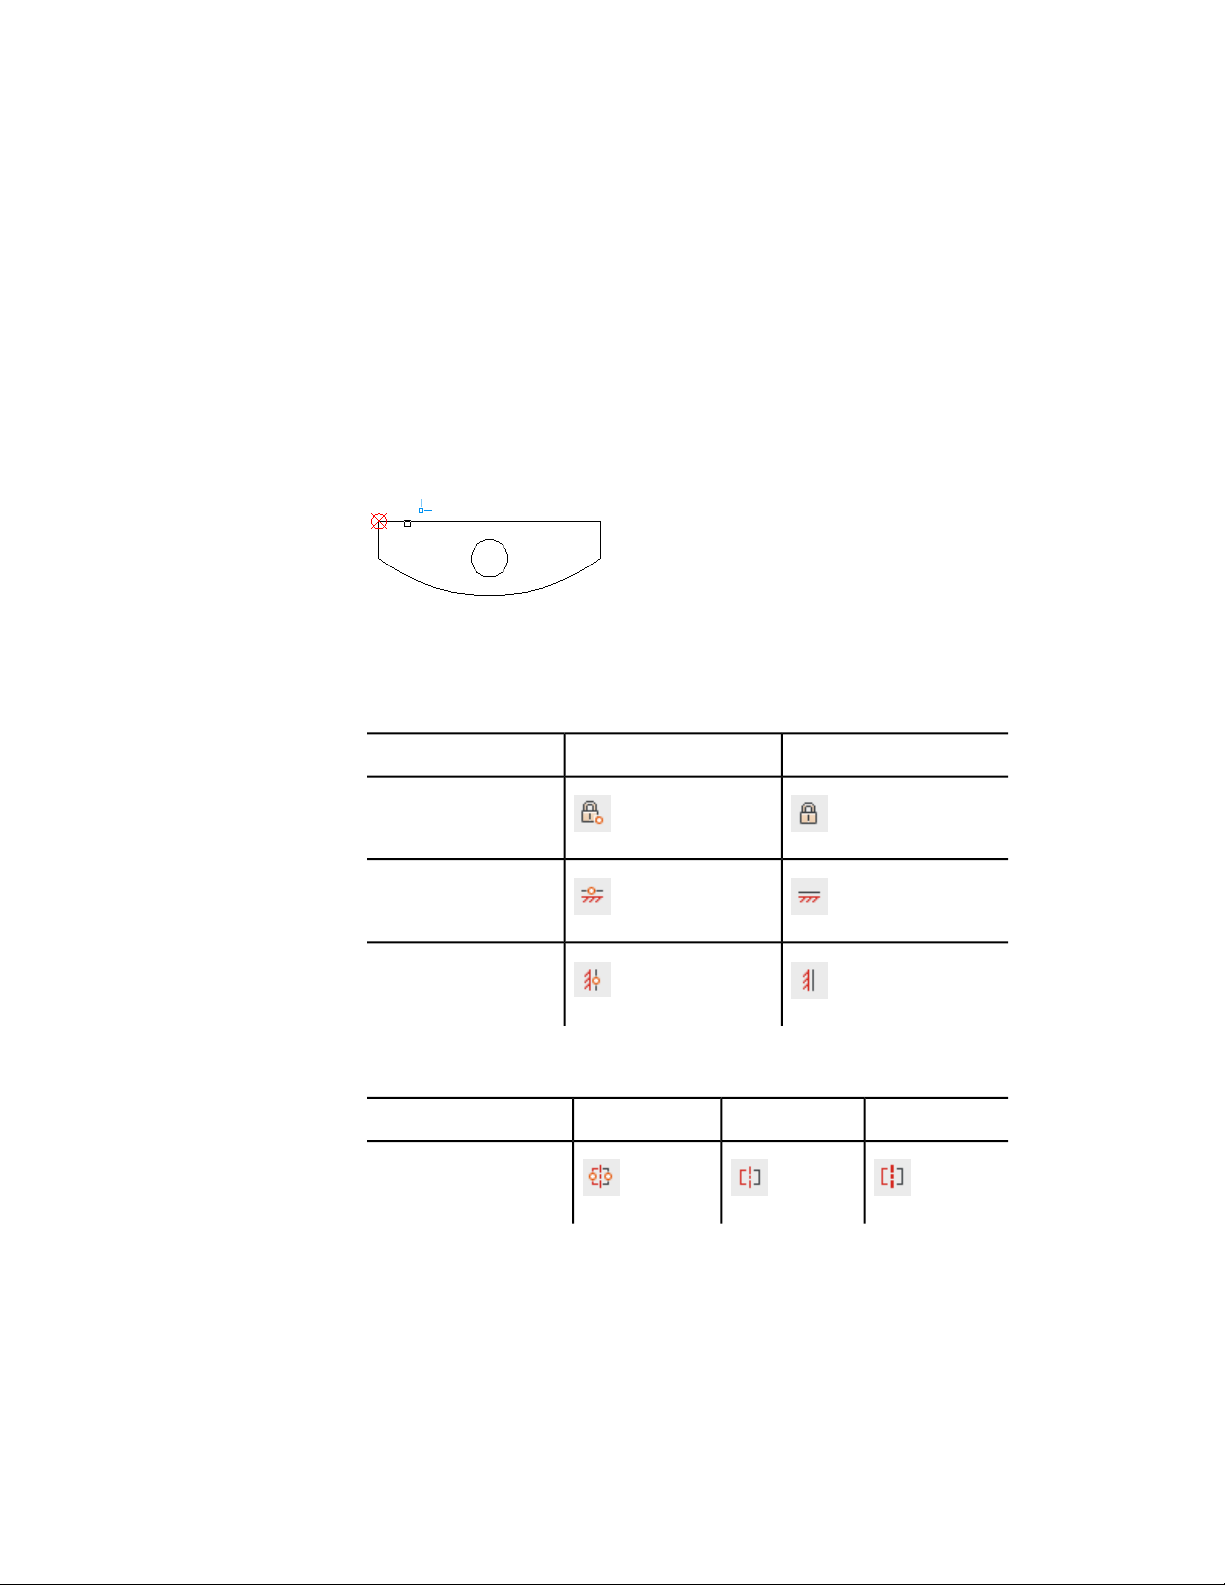
Specify Constraint Points
With some constraints, you specify constraint points on objects instead of
selecting the objects. This behavior is similar to that of object snaps, but the
locations are limited to endpoints, midpoints, center points, and insertion
points.
For example, a coincident constraint can restrict the location of the endpoint
of one line to the endpoint of another line.
The following glyph is displayed on the object as you roll over the object.
You use this glyph to confirm whether you are specifying the intended point
to constrain.
The fix, horizontal, and vertical constraint icons indicate whether the
constraints are applied to an object or a point.
ObjectPointConstraint
Fix
Horizontal
Vertical
The symmetric constraint icons indicate whether it identifying a symmetrical
point or object, or the symmetrical line.
LineObjectPointConstraint
Symmetric
Add Constraints to Geometry | 287
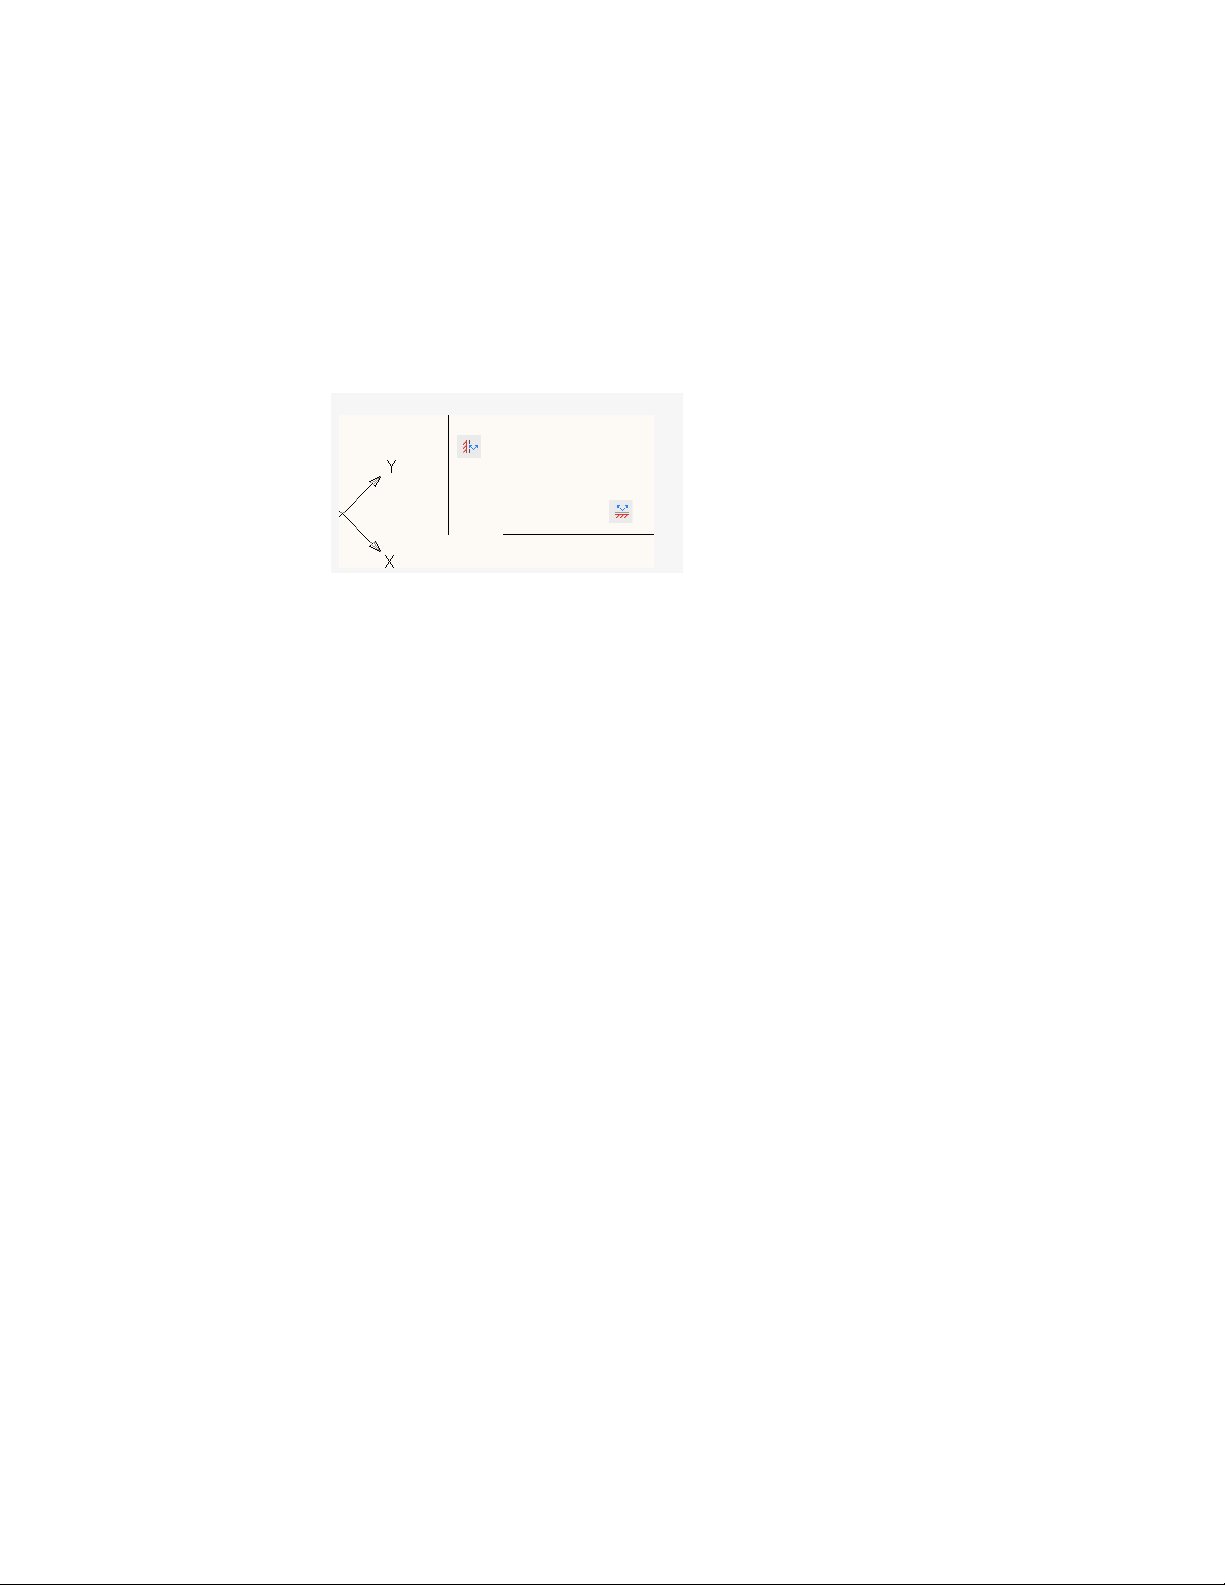
When rolling over any icon, the constraint point markers are displayed
indicating the constrained points. You do not need to roll over the icon to
identify the constraints that are applied to the points of the selected object.
A different set of constraint bar icons are displayed when a horizontal or
vertical constraint is not parallel or perpendicular with the current UCS.
Use Fix Constraints
A fix constraint associates a constraint point on an object, or the object itself
with a fixed location with respect to the World Coordinate System.
It is often advisable to specify a fix constraint at an important geometric
feature. This locks the location of that point or object, and prevents geometry
from relocating when you make changes to the design.
When you fix an object, the angle of a line, or the center of an arc or circle is
also fixed.
Apply Multiple Geometric Constraints
You can apply multiple geometric constraints to objects either manually or
automatically.
When you want to apply all essential geometric constraints to a design
automatically, you can use AUTOCONSTRAIN with the objects that you select
in your drawing. This helps constrain the geometric shape of the
design—depending on your design, there might be cases where you need to
apply additional geometric constraints.
AUTOCONSTRAIN also provides settings in which you can specify the
following options:
■ What geometric constraints to apply
■ What order to apply geometric constraints
■ What tolerances are used to determine whether objects are horizontal,
vertical, or touching
288 | Chapter 6 Create and Modify Objects
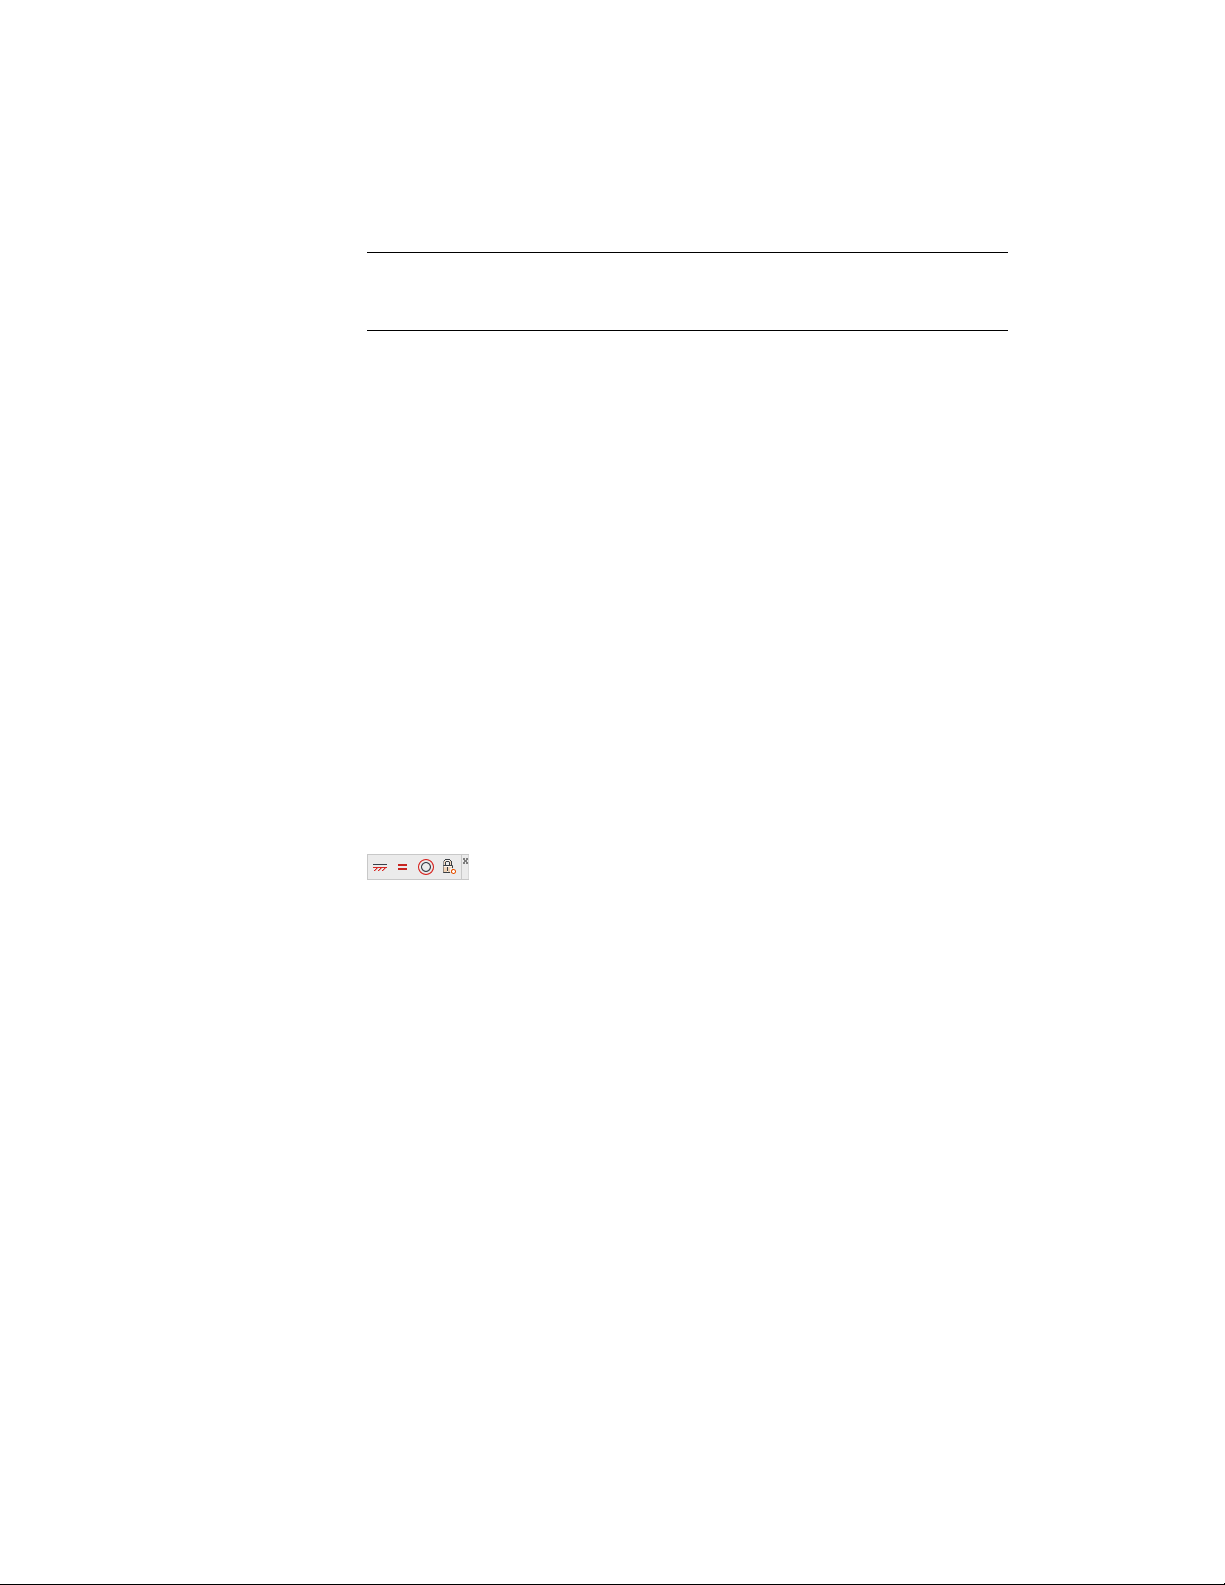
NOTE Fix constraint is not applied with AUTOCONSTRAIN. You must apply the
constraint individually. Equal constraint applied with AUTOCONSTRAIN resizes
the selected arcs to the same radius only. It is not applied to the arc length.
To fully constrain the size and proportions of a design, you will later need to
apply dimensional constraints.
Remove Geometric Constraints
A geometric constraint cannot be modified, but you can delete it and apply
a different one. Several constraint options, including Delete, are available from
the shortcut menu that is displayed when you right-click a constraint icon in
the drawing.
You can delete all constraints from a selection set in a single operation with
DELCONSTRAINT.
Display and Verify Geometric Constraints
You can determine visually what objects are associated with any geometric
constraint, or what constraints are associated with any object.
Constraint icons provide information about how objects are constrained. A
constraint bar displays one or more icons that represent the geometric
constraints applied to an object.
You can drag constraint bars when you need to move them out of the way,
and you can also control whether they are displayed or hidden.
Verify the Geometric Constraints on Objects
You can confirm the association of geometric constraints with objects in two
ways.
■ When you roll over a constraint icon on a constraint bar, the objects
associated with that geometric constraint are highlighted.
Add Constraints to Geometry | 289
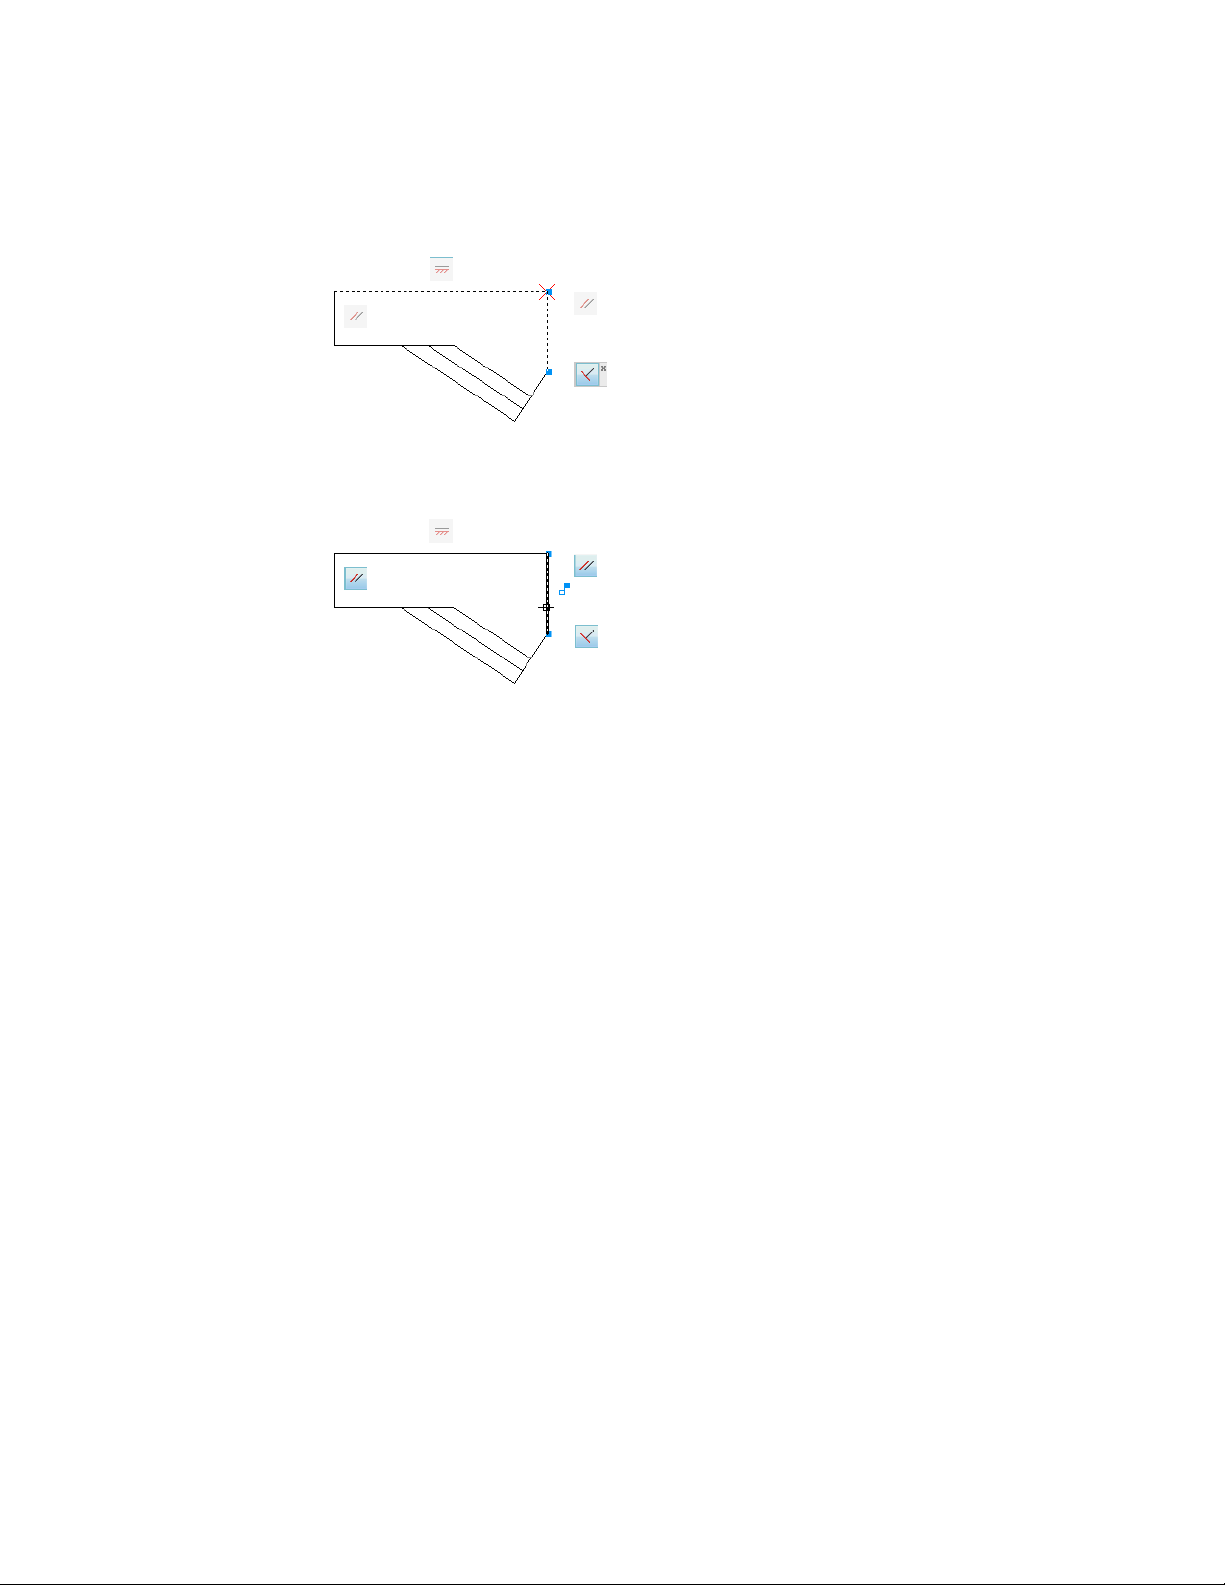
■ When you roll over an object that has geometric constraints applied to it,
all constraint bars that are associated with the object are highlighted.
These highlighting features simplify working with constraints especially when
you have many constraints applied throughout a drawing.
Control the Display of Constraint Bars
Geometric constraints and constraint bars can be displayed or hidden, either
individually or globally. You can do any of the following:
■ Display or hide all geometric constraints
■ Display or hide specified types of geometric constraints
■ Display or hide all geometric constraints associated with a selected object
■ Temporarily display the geometric constraints of the selected object
Use the Constraint Settings dialog box to control the types of geometric
constraints that are displayed or hidden on constraint bars.
You can set the constraint bars to automatically and temporarily display when
the constrained geometry is selected. When the geometry is no longer selected,
the temporarily displayed constraint bars are hidden.
290 | Chapter 6 Create and Modify Objects
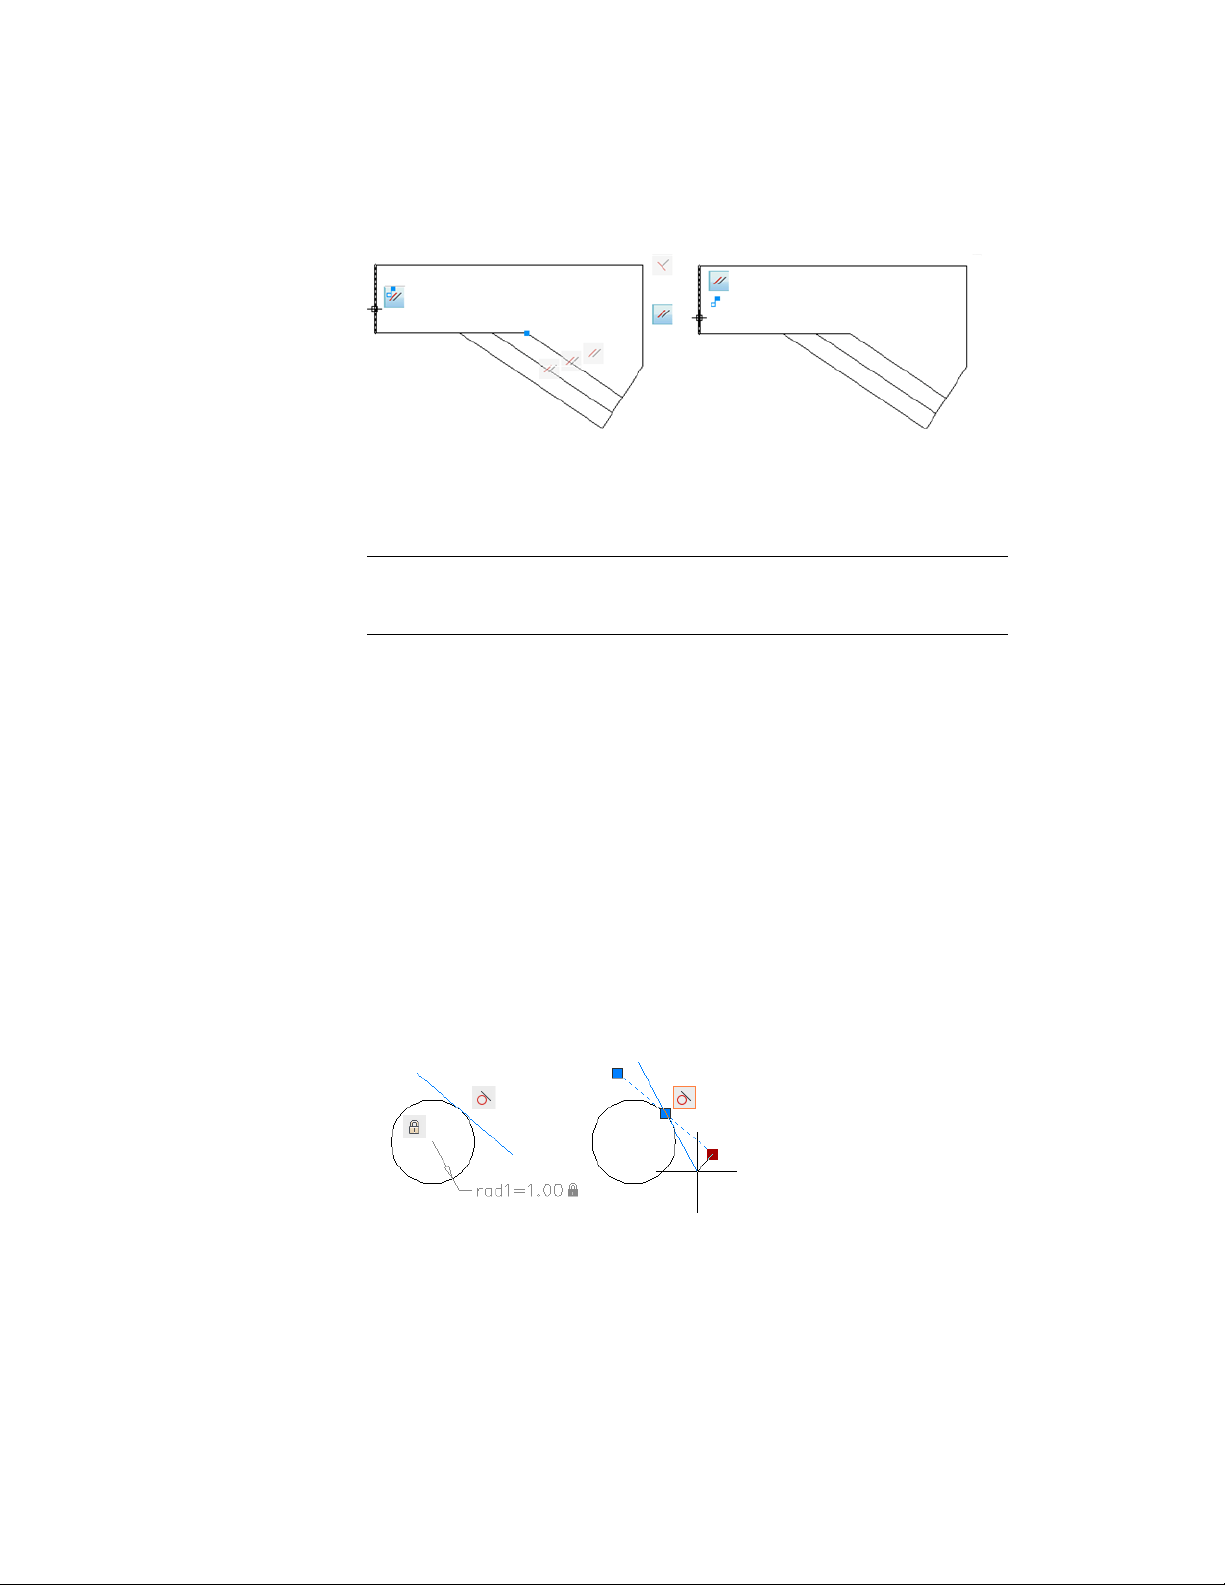
Hiding geometric constraints is useful when you analyze a design and want
to filter the display of geometric constraints. For example, you can choose to
display the icons for Parallel constraints only. Next, you might choose to
display the icons for Perpendicular constraints only.
NOTE To reduce clutter, Coincident constraints display by default as small,
light-blue squares. You can use an option in the Constraint Settings dialog box to
turn them off if necessary.
Modify Objects with Geometric Constraints Applied
You can edit constrained geometric objects with grips, editing commands, or
by relaxing or applying geometric constraints.
By definition, geometric constraints that are applied to geometric objects limit
the editing actions that you perform on the objects.
Modify Constrained Objects with Grips
You can modify constrained geometry using grip editing modes. The geometry
will maintain all applied constraints.
For example, if a line object is constrained to remain tangent to a circle, you
can rotate the line and change its length and endpoints, but the line or its
extension will remain tangent to the circle.
Add Constraints to Geometry | 291
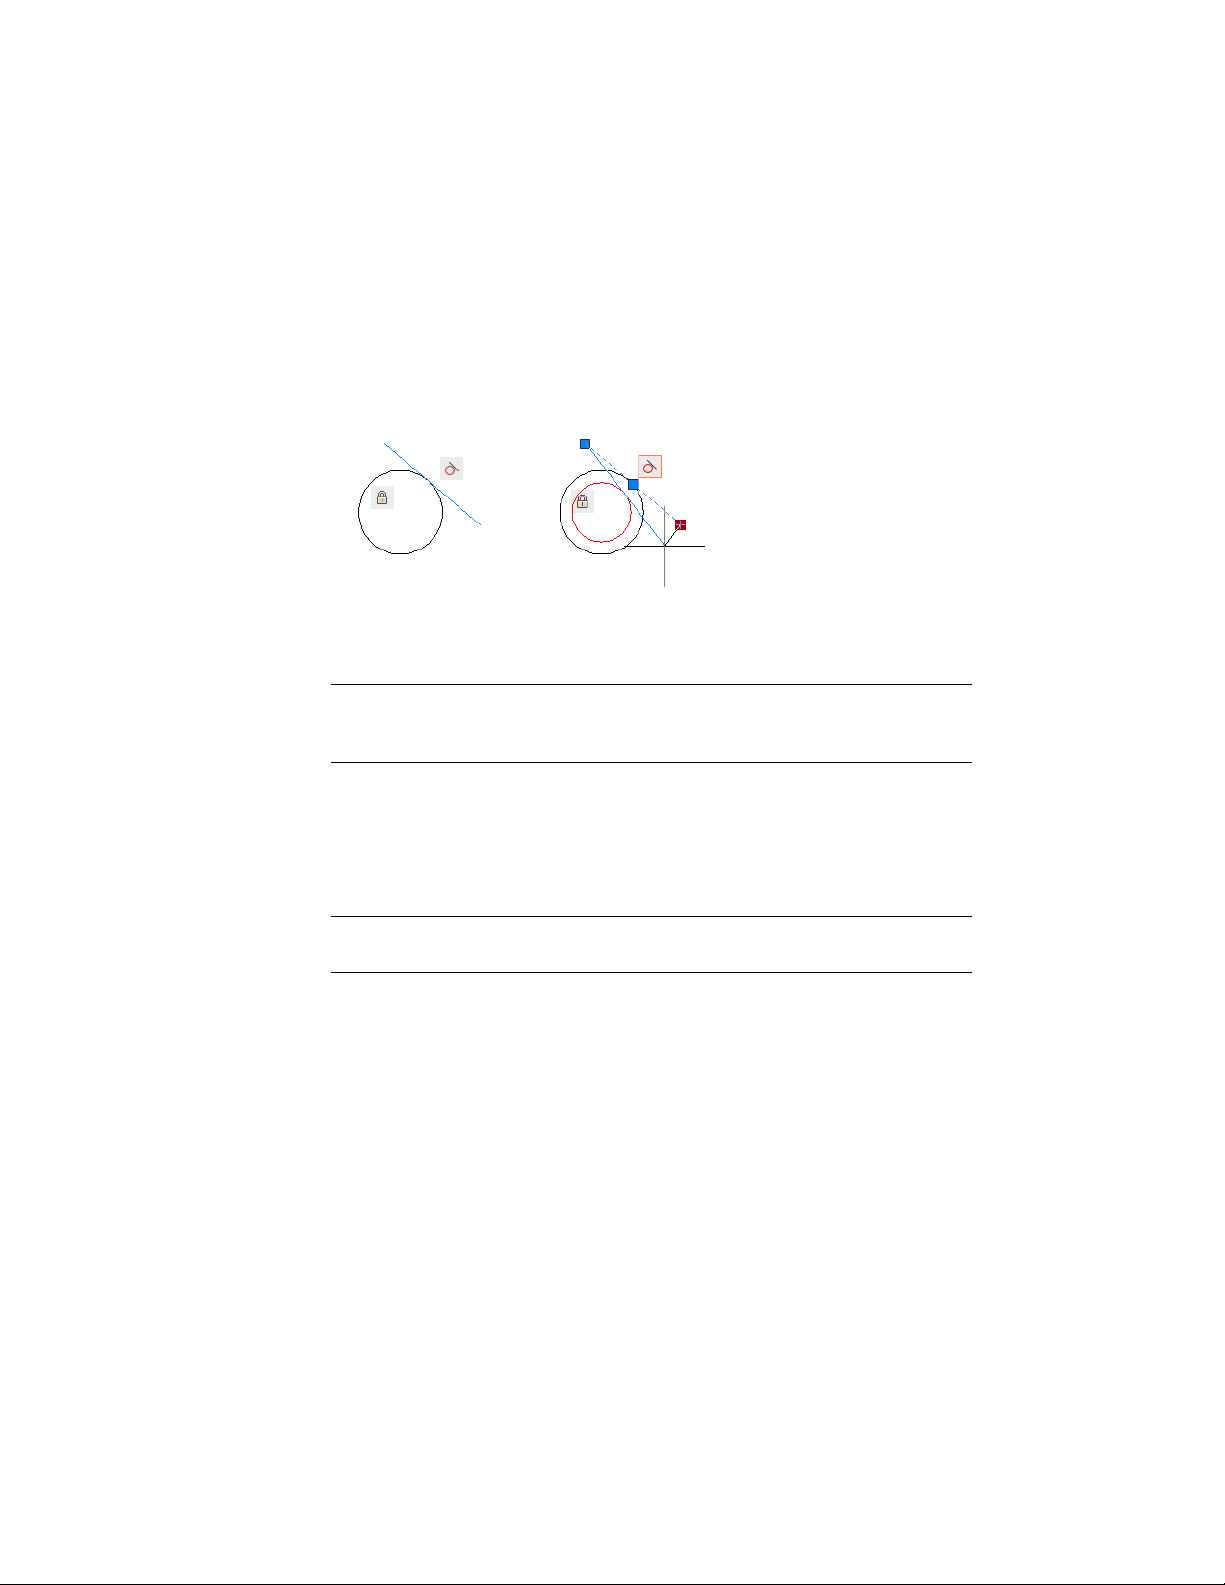
If the circle was an arc instead, the line or its extension would remain tangent
to the arc or its extension.
The results of modifying underconstrained objects are based on what
constraints have already been applied and the object types involved. For
example, if the Radius constraint had not been applied, the radius of the circle
would have been modified instead of the tangent point of the line.
The CONSTRAINTSOLVEMODE system variable determines the way an object
behaves when constraints are applied or when grips are used to edit it.
BEST PRACTICE You can limit unexpected changes by applying additional
geometric or dimensional constraints. Common choices include coincident and
fix constraints.
Modify Constrained Objects with Editing Commands
You can use editing commands such as MOVE, COPY, ROTATE, SCALE, and
STRETCH to modify constrained geometry. The results maintain the constraints
applied to the objects.
NOTE The TRIM, EXTEND, BREAK, and JOIN commands in some circumstances
can remove constraints.
By default, if an editing command results in copying the constrained objects,
the constraints applied to the original objects will also be duplicated. This
behavior is controlled by the PARAMETERCOPYMODE system variable. Using
the copying technique, you can save work by taking advantage of multiple
instances of objects, bilateral symmetry, or radial symmetry.
For information about temporarily relaxing constraints, see Overview of
Constraints (page 282).
292 | Chapter 6 Create and Modify Objects

Infer Geometric Constraints
You can automatically apply geometric constraints while creating and editing
geometric objects.
Enabling Infer Constraints mode automatically applies constraints between the
object you are creating or editing and the object or points associated with
object snaps.
Similar to the AUTOCONSTRAIN command, constraints are applied only if
the objects meet the constraint conditions. Objects are not repositioned as a
result of inferring constraints.
With Infer Constraints turned on, the object snaps that you specify when
creating geometry are used to infer geometric constraints. However, the
following object snaps are not supported: Intersection, Apparent Intersection,
Extension, and Quadrant.
The following constraints cannot be inferred:
■ Fix
■ Smooth
■ Symmetric
■ Concentric
■ Equal
■ Collinear
Infer Constraints with Line and Polyline
Certain object creation and editing commands can infer constraints regardless
of the current object snap settings.
LINE and PLINE commands infer coincident point-to-point constraints. The
Close option infers a coincident constraint between the start point of the first
line and the endpoint of the last line.
Infer Constraints with Rectangle, Fillet, and Chamfer
The RECTANG, FILLET, and CHAMFER commands infer constraints as follows:
■ RECTANG applies a pair of parallel constraints and a perpendicular
constraint to the closed polyline.
■ FILLET applies tangent and coincident constraints between the newly
created arc and the existing trimmed or extended pair of lines.
Add Constraints to Geometry | 293

■ CHAMFER applies coincident contraints between the newly created line
and the existing trimmed or extended pair of lines.
The following commands are unaffected by the Infer Constraints setting:
■ SCALE
■ MIRROR
■ OFFSET
■ BREAK
■ TRIM
■ EXTEND
■ ARRAY
Infer Constraints with Move, Copy, and Stretch
When moving, copying, or stretching with the Infer Constraints on, you can
apply coincident, perpendicular, parallel, or tangent constraints between the
object being edited and the object being snapped to if the base point of the
edited object is a valid constraint point of that object.
For example, if a line is stretched and snapped to an endpoint of another line,
a coincident constraint is applied between the endpoints of the two lines.
A vertical or horizontal constraint can be applied between objects when you
move, copy, or stretch an object from a valid constraint point while object
tracking vertically or horizontally along a valid constraint point on another
object.
See also:
Use Object Snaps (page 169)
Constrain Distances and Angles between Ob-
jects
You can control distances or angles between 2D geometric objects or points
on objects applying dimensional constraints and specifying values. You can
also constrain geometry with variables and equations.
294 | Chapter 6 Create and Modify Objects
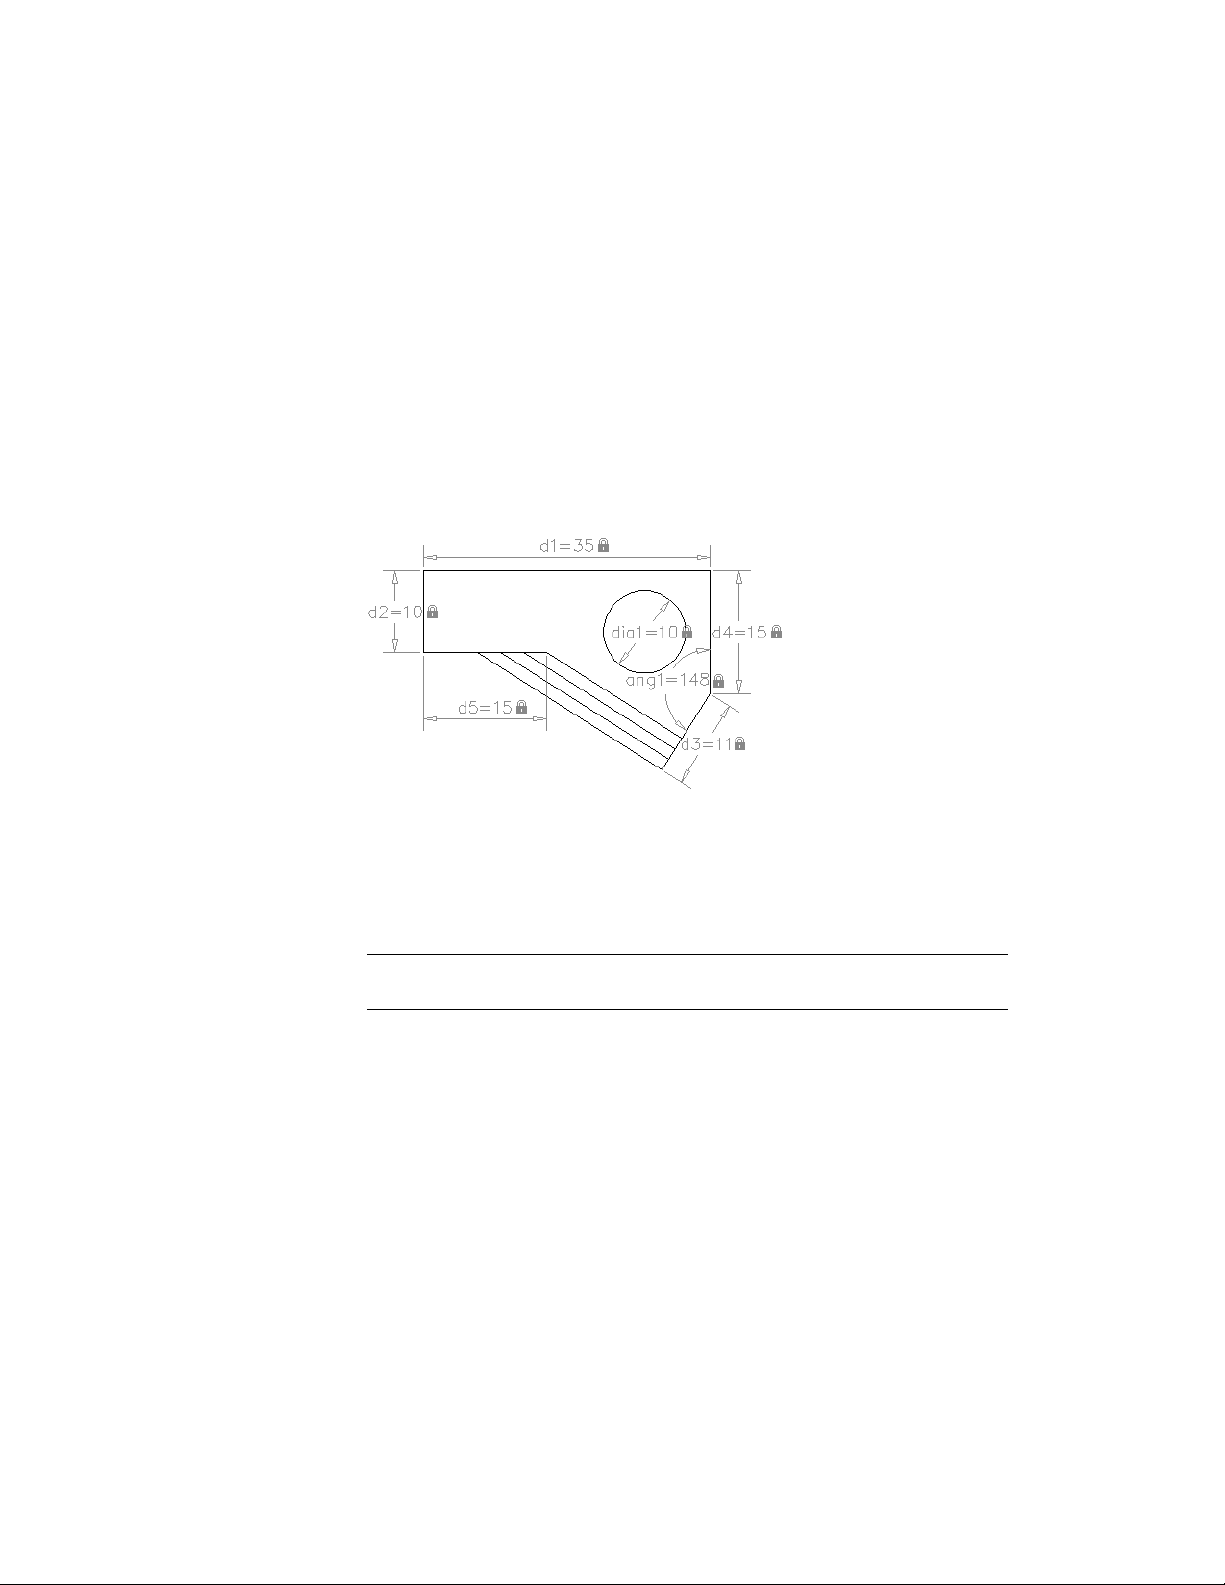
Overview of Dimensional Constraints
Dimensional constraints control the size and proportions of a design. They
can constrain the following:
■ Distances between objects, or between points on objects
■ Angles between objects, or between points on objects
■ Sizes of arcs and circles
For example, the following illustration includes linear, aligned, angular, and
diameter constraints.
If you change the value of a dimensional constraint, all the constraints on
the object are evaluated, and the objects that are affected are updated
automatically.
Also, constraints can be added directly to segments within a polyline as if they
were separate objects.
NOTE The number of decimal places displayed in dimensional constraints is
controlled by the LUPREC and AUPREC system variables.
Compare Dimensional Constraints with Dimension Objects
Dimensional constraints are different from dimension objects in the following
ways:
■ Dimensional constraints are used in the design phase of a drawing, but
dimensions are typically created in the documentation phase
■ Dimensional constraints drive the size or angle of objects, but dimensions
are driven by objects
Add Constraints to Geometry | 295
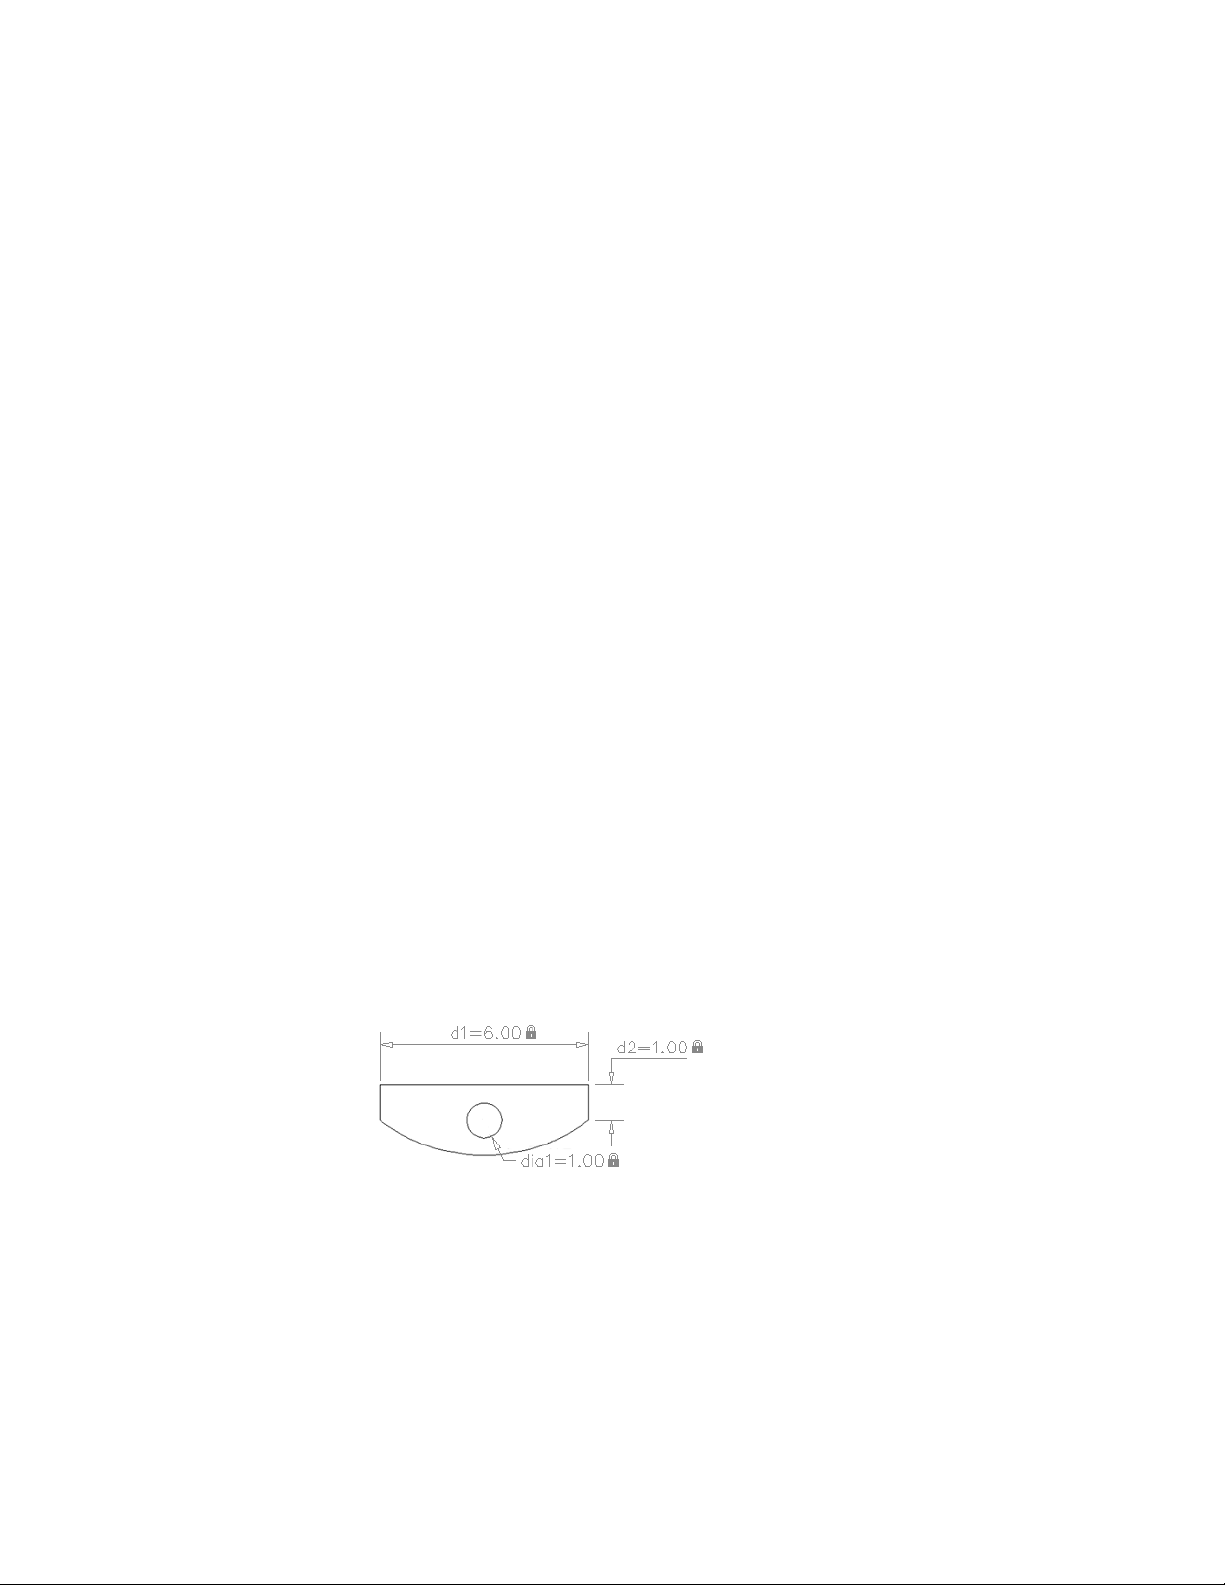
■ By default, dimensional constraints are not objects, display with only a
single dimension style, maintain the same size during zoom operations,
and are not outputted to a device
If you need to output a drawing with dimensional constraints or use dimension
styles, you can change the form of a dimensional constraint from dynamic
to annotational. See Apply Dimensional Constraints (page 296) for more detail.
Define Variables and Equations
The -PARAMETERS command allows you to define custom user variables that
you can reference from within dimensional constraints and other user variables.
The expressions that you define can include a variety of predefined functions
and constants.
For more information about using variables and equations with constraints,
see Constrain a Design with Formulas and Equations (page 301)
See also:
Overview of Geometric Constraints (page 284)
Apply Dimensional Constraints (page 296)
Constrain a Design with Formulas and Equations (page 301)
Apply Dimensional Constraints
Dimensional constraints maintain specified distances and angles between
geometric objects or points on objects.
For example, you can specify that the length of a line should always remain
at 6.00 units, that the vertical distance between two points be maintained at
1.00 unit, and that a circle should always remain at 1.00 unit in diameter.
When you apply a dimensional constraint to an object, a constraint variable
is automatically created for maintaining the constraint value. By default, these
296 | Chapter 6 Create and Modify Objects

are assigned names such as d1 or dia1, but you can rename them with the
-PARAMTERS.
Dimensional constraints can be created in one of the following forms:
■ Dynamic constraints
■ Annotational constraints
The forms have different purposes. In addition, any dynamic or annotational
constraint can be converted to a reference parameter.
Dynamic Constraints
By default, dimensional constraints are dynamic. They are ideal for normal
parametric drawing and design tasks.
Dynamic constraints have the following characteristics:
■ Maintain the same size when zooming in or out
■ Can easily be turned on or off globally in the drawing
■ Display using a fixed, predefined dimension style
■ Position the textual information automatically, and provide triangle grips
with which you can change the value of a dimensional constraint
■ Do not display when the drawing is plotted
If you need to control the dimension style of dynamic constraints, or if you
need to plot dimensional constraints, use the Properties Inspector to change
dynamic constraints to annotational constraints.
Annotational Constraints
Annotational constraints are useful when you want dimensional constraints
to have the following characteristics:
■ Change their size when zooming in or out
■ Display individually with layers
■ Display using the current dimension style
■ Provide grip capabilities that are similar to those on dimensions
■ Display when the drawing is plotted
NOTE To display the text used in annotational constraints in the same format as
used in dimensions, set the CONSTRAINTNAMEFORMAT system variable to 1.
Add Constraints to Geometry | 297
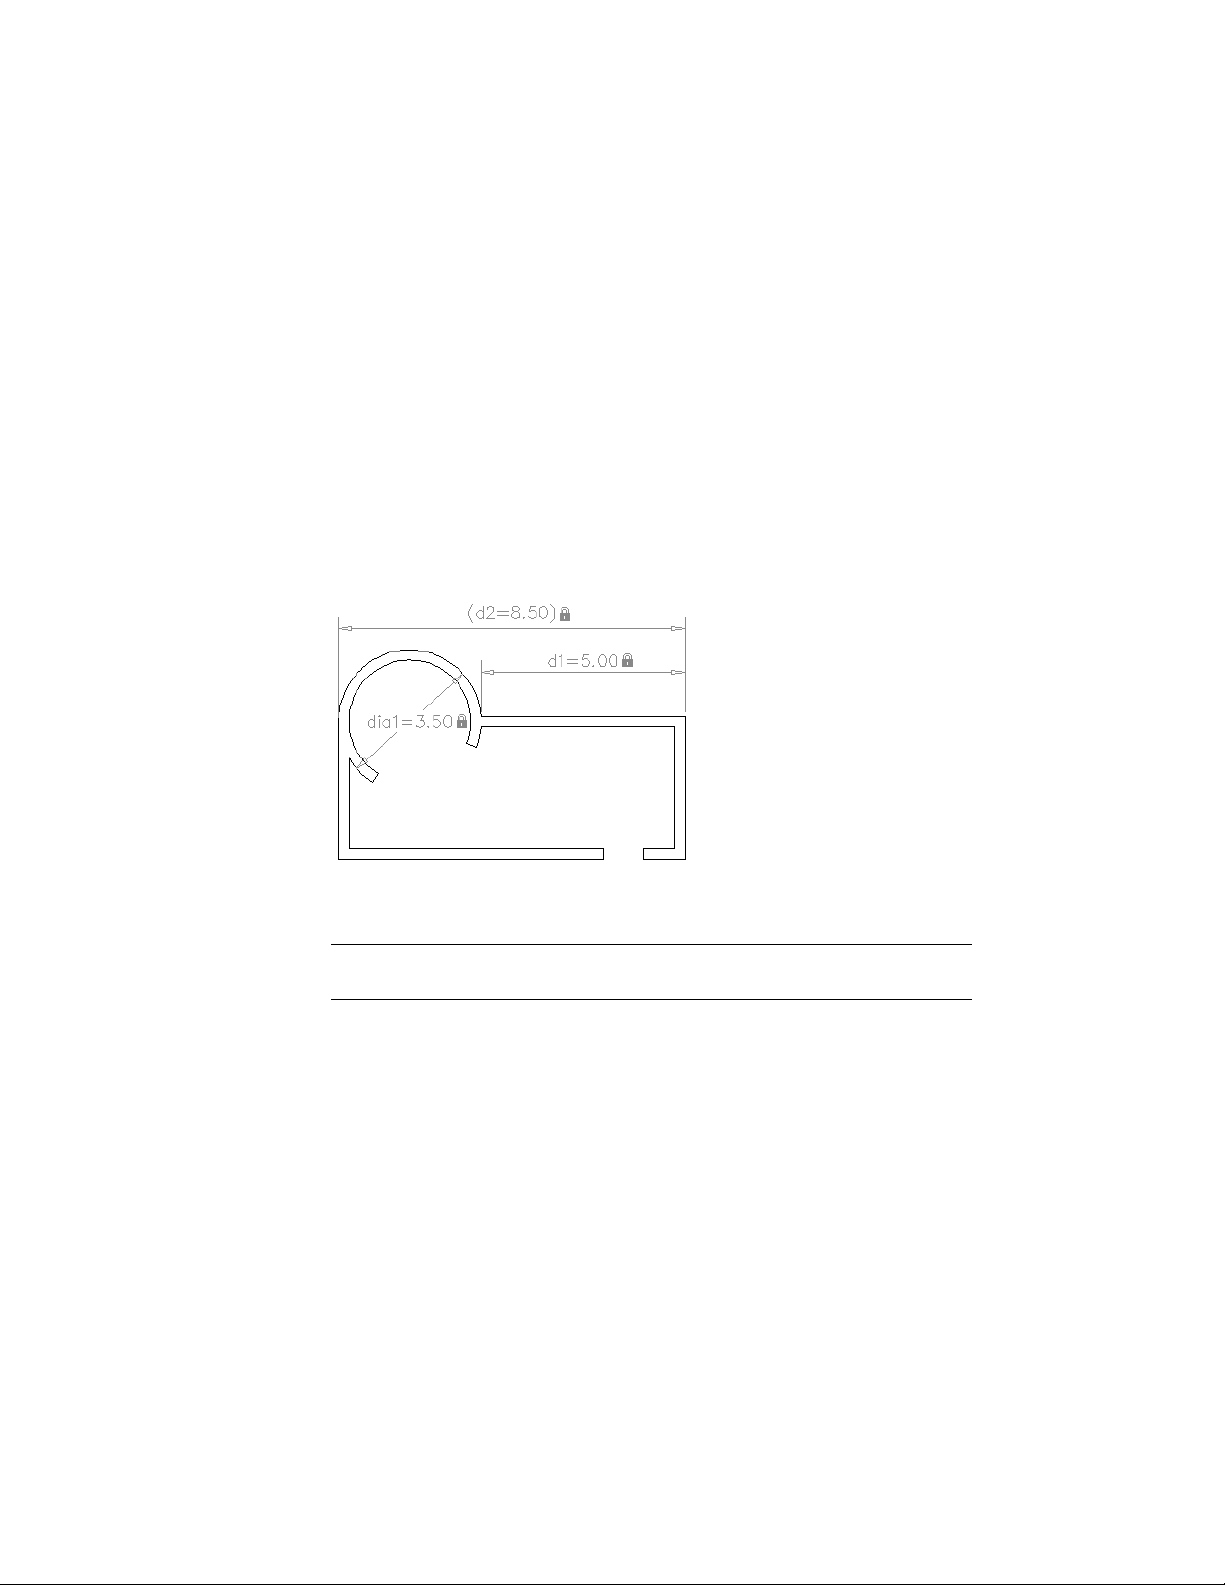
After plotting, you can use the Properties Inspector to convert annotational
constraints back to dynamic constraints.
Reference Parameters
A reference parameter is a driven dimensional constraint, either dynamic or
annotational. This means that it does not control the associated geometry,
but rather reports a measurement similar to a dimension object.
You use reference parameters as a convenient way to display measurements
that you would otherwise have to calculate. For example, the width in the
illustration is constrained by the diameter constraint, dia1, and the linear
constraint, d1. The reference parameter, d2, displays the total width but does
not constrain it. The textual information in reference parameters is always
displayed within parentheses.
You can set the Reference property in the Properties Inspector to convert a
dynamic or annotational constraint to a reference parameter.
NOTE You cannot change a reference parameter back to a dimensional constraint
if doing so would overconstrain the geometry.
Control the Display of Dimensional Constraints
You can display or hide dynamic and annotational constraints within a
drawing.
298 | Chapter 6 Create and Modify Objects

Display or Hide Dynamic Constraints
You can hide all dynamic constraints to reduce clutter when you want to work
with geometric constraints only, or when you need to continue other work
in the drawing. You can turn on their display when needed from the ribbon
or with the DCDISPLAY command.
By default, if you select an object associated with a hidden dynamic constraint,
all dynamic constraints associated with that object are temporarily displayed.
You can display or hide the dynamic constraints for all objects or for a selection
set.
Display or Hide Annotational Constraints
You control the display of annotational constraints as you would with
dimension objects—you assign them to a layer and turn the layer on or off as
needed. You can also specify object properties for annotational constraints
such as dimension style, color, and lineweight.
Modify Objects with Dimensional Constraints Applied
You can control lengths, distances, and angles of objects by changing
constraint values, by manipulating dimensional constraints using grips, or by
changing user variables or expressions associated with dimensional constraints.
Edit Dimensional Constraint Names, Values, and Expressions
You can edit the names, values, and expressions that are associated with
dimensional constraints using in-place editing:
■ Double-click the dimensional constraint, select the dimensional constraint
and use the shortcut menu, or the TEXTEDIT command
■ Open the Properties Inspector and select the dimensional constraint
You can reference other dimensional constraints by selecting them during an
in-place editing operation.
NOTE You cannot edit the Expression and Value properties for a reference
parameter.
Add Constraints to Geometry | 299
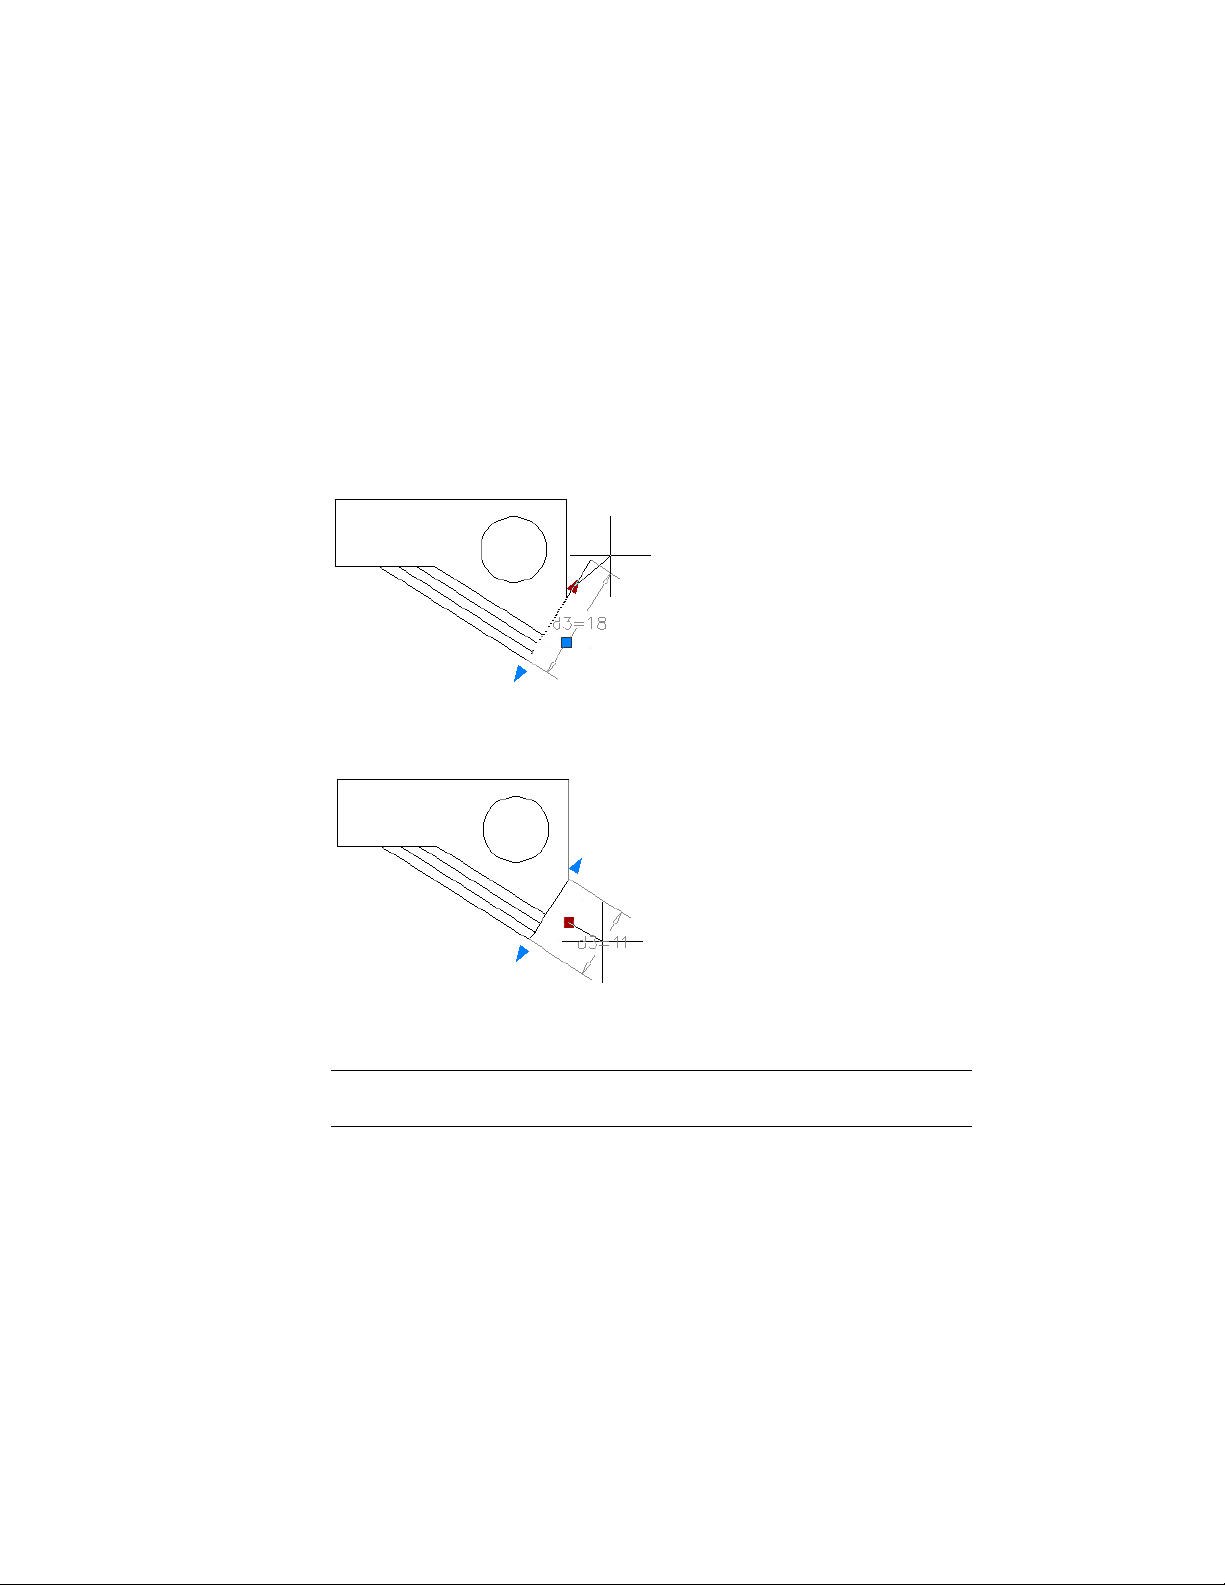
Modify Dimensional Constraints Using Their Grips
You can modify a constrained object either by using the triangular grips or
the square grips on the associated dimensional constraint.
The triangular grips on dimensional constraints provide a way of changing
the constraint value while maintaining the constraint.
For example, you can change the length of the diagonal line by using the
triangular grips on the Aligned dimensional constraint. The diagonal line
maintains its angle and the location of one of its endpoints.
The square grip on dimensional constraints provides a way of changing the
location of the text and other elements.
Dynamic dimensional constraints are more limited than annotational
dimensional constraints in where the text can be located.
NOTE Triangular grips are not available for dimensional constraints that reference
other constraint variables in expressions.
For information about temporarily relaxing constraints, see Overview of
Constraints (page 282).
300 | Chapter 6 Create and Modify Objects
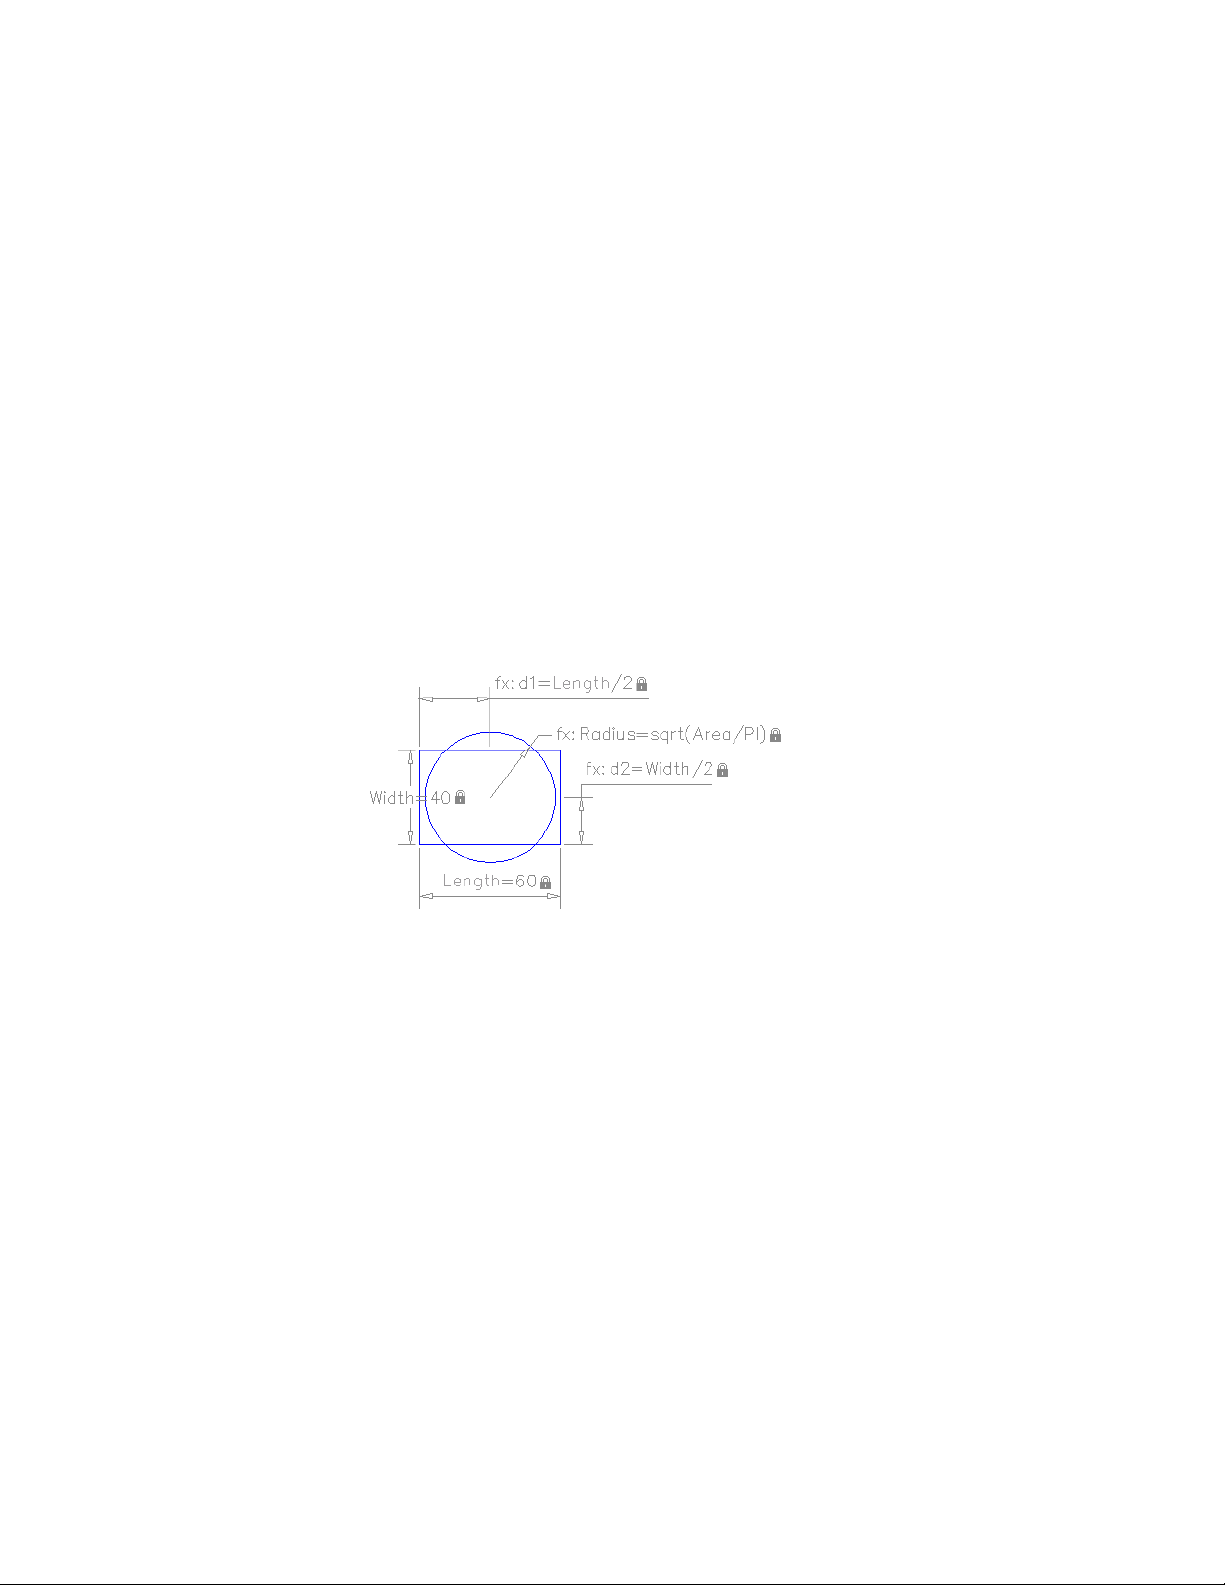
See also:
Overview of Constraints (page 282)
Constrain a Design with Formulas and Equations
You can control geometry using mathematical expressions that include the
names of dimensional constraints, user variables, and functions.
Overview of Formulas and Equations
Formulas and equations can be represented either as expressions within
dimensional constraint parameters or by defining user variables. For example,
the following illustration represents a design that constrains a circle to the
center of the rectangle with an area equal to that of the rectangle.
The Length and Width dimensional constraint parameters are set to constants.
The d1 and d2 constraints are simple expressions that reference the Length
and Width. The Radius dimensional constraint parameter is set to an expression
that includes the square root function, parentheses to determine the
precedence of operations, the Area user variable, the division operator, and
the constant, PI.
As you can see, part of the equation for determining the area of the circle is
included in the Radius dimensional constraint parameter and part was defined
as a user variable. Alternatively, the entire expression, sqrt (Length * Width /
PI), could have been assigned to the Radius dimensional constraint parameter,
defined in a user variable, or some other combination.
Add Constraints to Geometry | 301
Protect Expressions in Dynamic Constraints
When a dynamic dimensional constraint references one or more parameters, the
prefix fx: is added to the name of the constraint. This prefix is displayed only
in the drawing. Its purpose is to help you avoid accidentally overwriting
parameters and formulas when the dimension name format is set to Value or
Name, which suppresses the display of the parameters and formulas.
Control Geometry with Parameters
You can create and manage custom parameters that can be used with
dimensional constraints (dynamic and annotational).
The -PARAMETERS command allows you to do the following operations:
■ Create a new parameter
■ Edit the expression of a parameter
■ Rename a parameter
■ Delete a parameter from the drawing
■ List all the parameters in the current drawing
Use Operators in Expressions
Dimensional constraint parameters and user variables support the following
operators within expressions:
DescriptionOperator
Addition+
Subtraction or unary negation-
Floating point modulo%
Multiplication*
Division/
Exponentiation^
302 | Chapter 6 Create and Modify Objects
DescriptionOperator
Parenthesis, expression delimiter( )
Decimal separator.
NOTE With imperial units, the a minus or dash (-) symbol is treated as a unit
separator rather than a subtraction operation. To specify subtraction, include at
least one space before or after the minus sign. For example, to subtract 9" from
5', enter 5' -9" rather than 5'-9".
Understand Precedence in Expressions
Expressions are evaluated according to the following standard mathematical
rules of precedence:
1 Expressions in parentheses first, starting with the innermost set
2 Operators in standard order: (1) unary negation, (2) exponents, (3)
multiplication and division, and (4) addition and subtraction
3 Operators of equal precedence from left to right
Functions Supported in Expressions
The following functions are available for use in expressions:
SyntaxFunction
cos(expression)Cosine
sin(expression)Sine
tan(expression)Tangent
acos(expression)Arc cosine
asin(expression)Arc sine
atan(expression)Arc tangent
Add Constraints to Geometry | 303
SyntaxFunction
cosh(expression)Hyperbolic cosine
sinh(expression)Hyperbolic sine
tanh(expression)Hyperbolic tangent
acosh(expression)Arc hyperbolic cosine
asinh(expression)Arc hyperbolic sine
atanh(expression)Arc hyperbolic tangent
sqrt(expression)Square root
sign(expression)Signum function (-1,0,1)
round(expression)Round to nearest integer
trunc(expression)Truncate decimal
floor(expression)Round down
ceil(expression)Round up
abs(expression)Absolute value
max(expression1;expression2)Largest element in array
min(expression1;expression2)Smallest element in array
d2r(expression)Degrees to radians
r2d(expression)Radians to degrees
304 | Chapter 6 Create and Modify Objects
SyntaxFunction
ln(expression)Logarithm, base e
log(expression)Logarithm, base 10
exp(expression)Exponent, base e
exp10(expression)Exponent, base 10
pow(expression1;expression2)Power function
RandomRandom decimal, 0-1
In addition to these functions, the constants Pi and e are also available for use
in expressions.
Add Constraints to Geometry | 305

306

Define and Reference
Blocks
Work with Blocks
A block is one or more objects combined to create a single object. Blocks help
you reuse objects in the same drawing or in other drawings.
Overview of Blocks
A block can be composed of objects drawn on several layers with various
properties. You can use several methods to create blocks.
How Blocks Are Stored and Referenced
Every drawing file has a block definition table that stores all block definitions,
which consist of all information associated with the block. It is these block
definitions that are referenced when you insert blocks in your drawing.
Each rectangle below represents a separate drawing file and is divided into two
parts:
■ The block definition table
■ The objects in the drawing
7
307
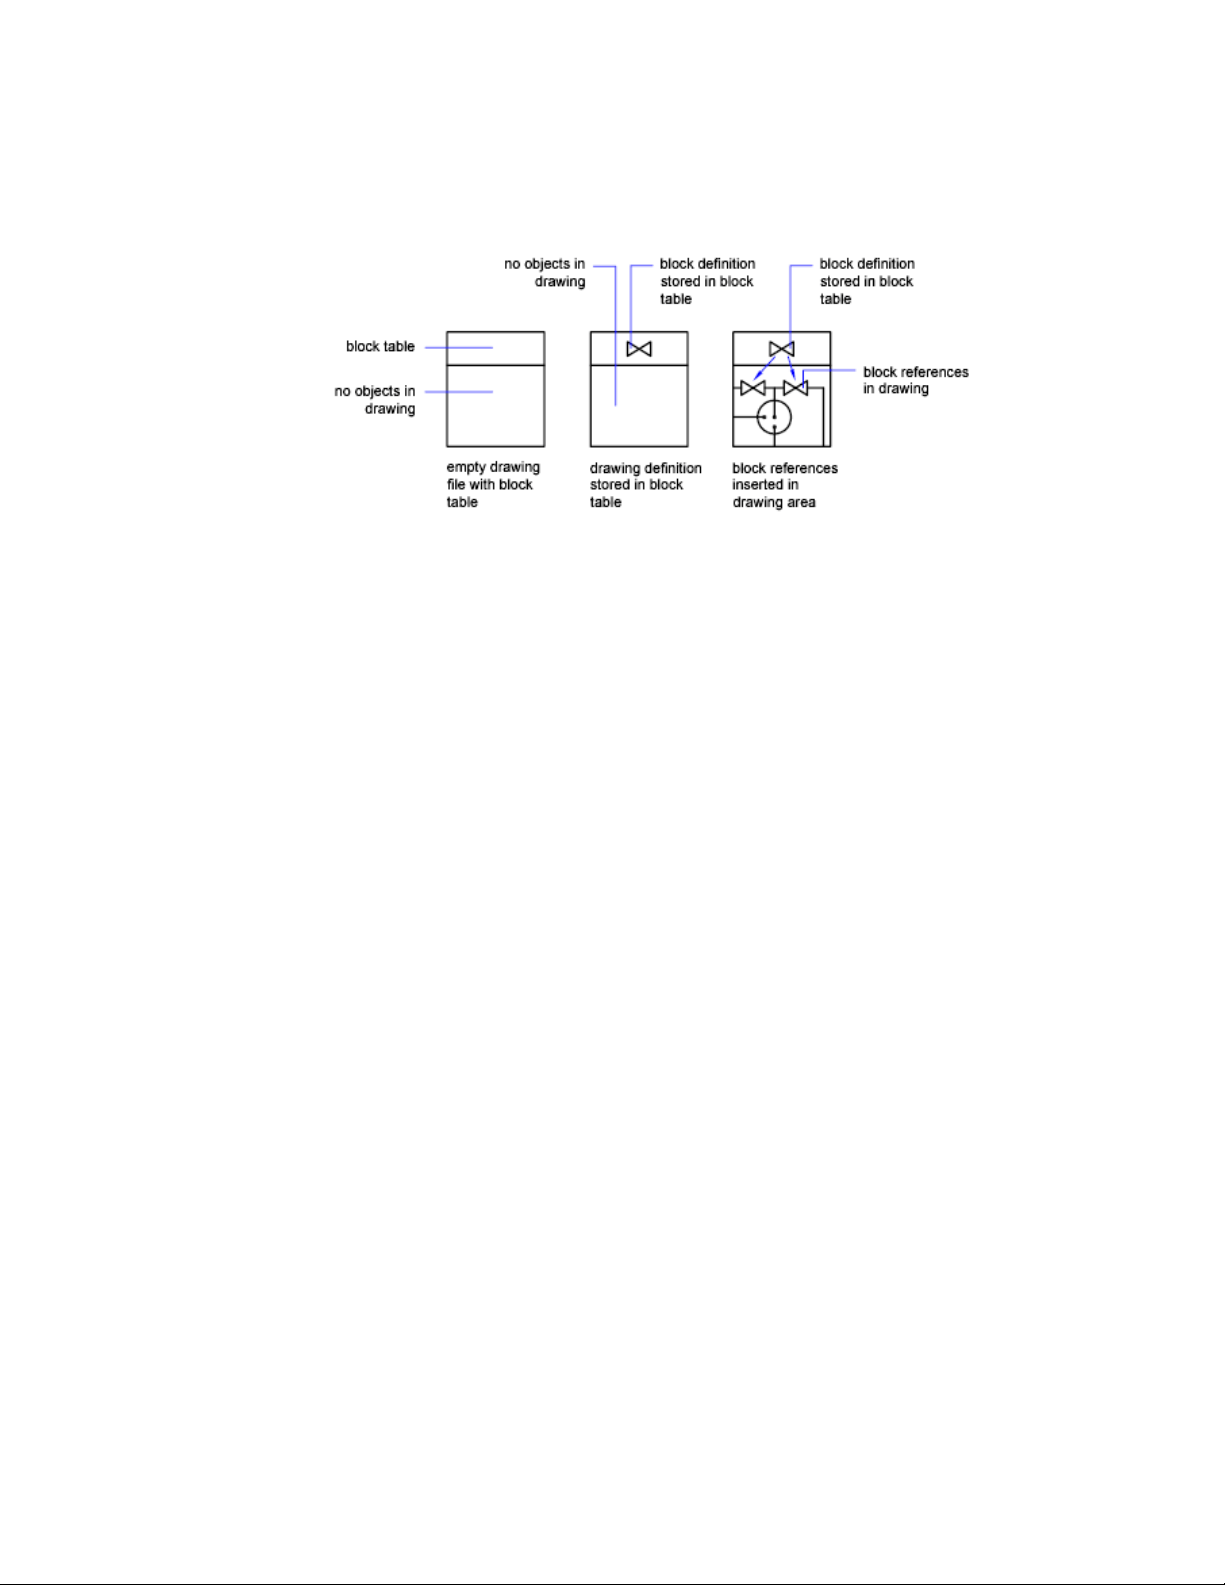
When you insert a block you are inserting a block reference. The information
is not copied from the block definition to the drawing area. Instead, a link is
established between the block reference and the block definition. Therefore,
if the block definition is changed, all references are updated automatically.
Use PURGE to remove unused block definitions from a drawing.
Blocks and Layers
A block can be composed of objects drawn on several layers with various
colors, linetypes, and lineweight properties. Although a block is always inserted
on the current layer, the block reference preserves information about the
original layer, color, and linetype properties of the objects that are contained
in the block. You can control whether objects in a block retain their original
properties or inherit their properties from the current layer, color, linetype,
or lineweight settings.
Annotative Blocks
You can also create annotative blocks. For more information about creating
and working with an annotative blocks, see Create Annotative Blocks and
Attributes (page 497).
See also:
Scale Annotations (page 490)
Create Annotative Blocks and Attributes (page 497)
308 | Chapter 7 Define and Reference Blocks
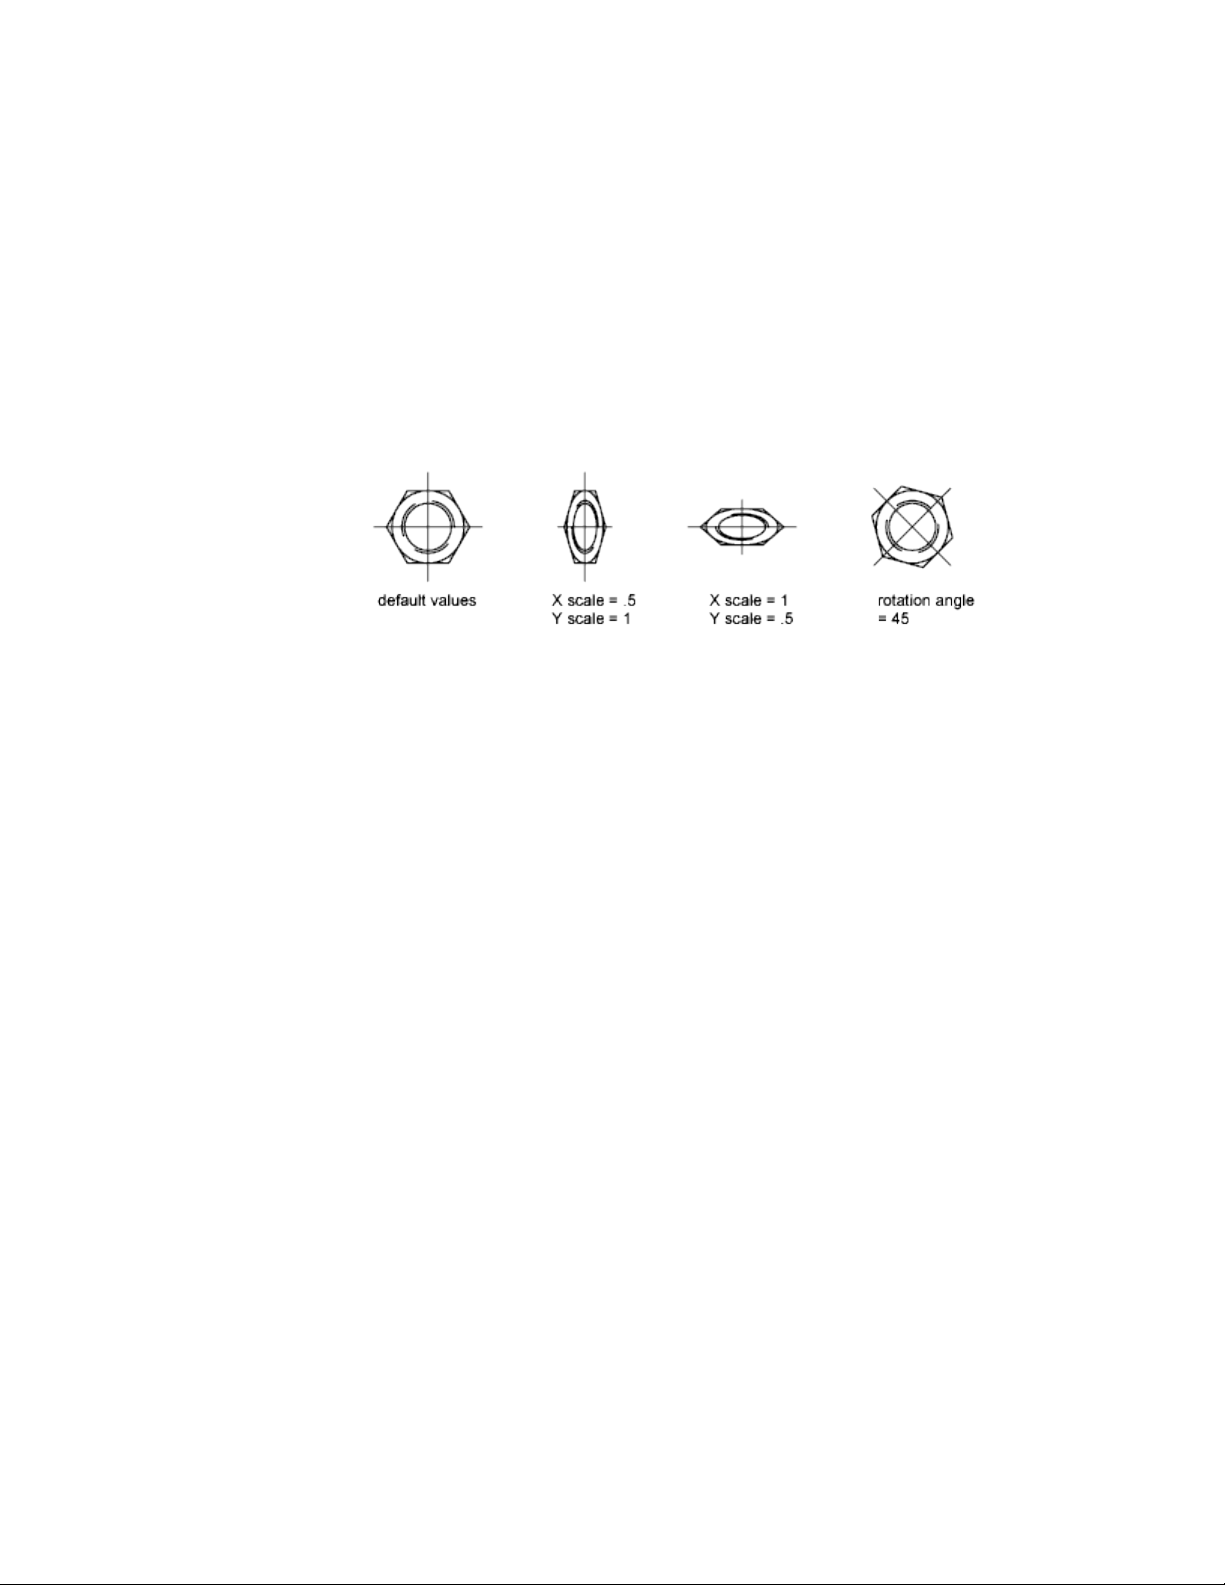
Insert Blocks
When you insert a block, you create a block reference and specify its location,
scale, and rotation.
Scale Block References
You can specify the scale of a block reference using different X, Y, and Z values.
A block that uses different drawing units than the units specified for the
drawing is automatically scaled by a factor equivalent to the ratio between
the two units.
Edit Attribute Values
If you insert a block reference that includes editable attributes, you can change
the values of these attributes in the Edit Attributes dialog box or at the
Command prompt while inserting the block or using the following ways after
a block is inserted:
■ Double-click a block and use the Enhanced Attribute Editor (EATTEDIT
command).
■ Use the Edit Attributes dialog box (ATTEDIT command).
■ Enter-ATTEDIT at the Command prompt.
■ Select a block and edit attribute values under Attributes in the Properties
Inspector.
Insert a Drawing File as a Block
When you insert an entire drawing file into another drawing, the drawing
information is copied into the block table of the current drawing as a block
definition. Subsequent insertions reference the block definition with different
position, scale, and rotation settings, as shown in the following illustration.
Work with Blocks | 309
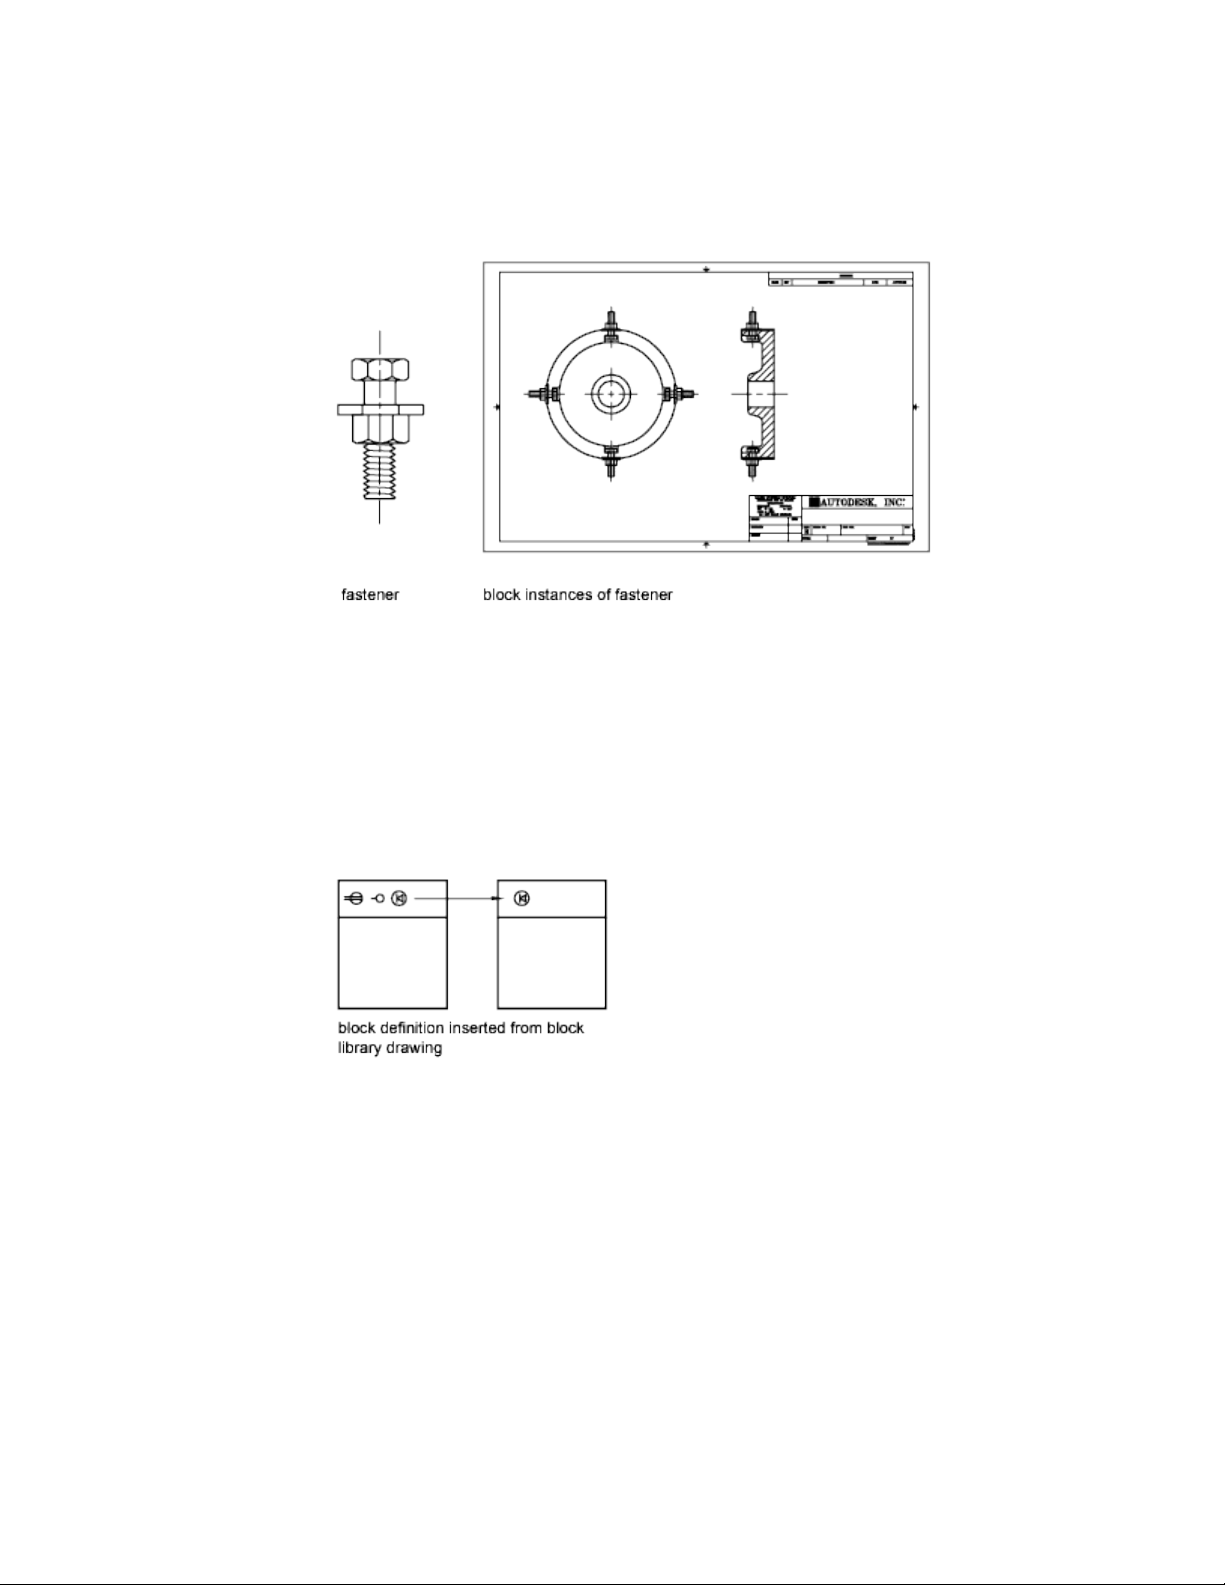
Xrefs contained in a drawing you insert may not be displayed properly unless
the xref was previously inserted or attached to the destination drawing.
Insert Blocks from Block Libraries
You can insert one or more block definitions from an existing drawing file
into your current drawing file. Choose this method when retrieving blocks
from block library drawings. A block library drawing contains block definitions
of symbols with similar functions. These block definitions are stored together
in a single drawing file for easy accessibility and management.
Insert Blocks with Content Palette
Use the Content palette to insert blocks from the current drawing or from a
library. Drag and drop, or double-click a block to insert it into the current
drawing.
310 | Chapter 7 Define and Reference Blocks

See also:
Create Drawing Files for Use as Blocks (page 318)
Overview of Blocks (page 307)
Add Text and Blocks to Tables (page 559)
Work with Dynamic Blocks in Drawings
A dynamic block reference can be changed in a drawing while you work.
Overview of Dynamic Blocks
Dynamic block references contain grips or custom properties that change the
way the reference is displayed in the drawing after it is inserted. For example,
a dynamic block reference of a door can change size after you insert the block
reference into your drawing. Dynamic blocks allow you to insert one block
that can change shape, size, or configuration, instead of inserting one of many
static block definitions.
NOTE Dynamic blocks can be inserted and manipulated in a drawing, but cannot
be created or edited in the Block Editor.
Work with Blocks | 311
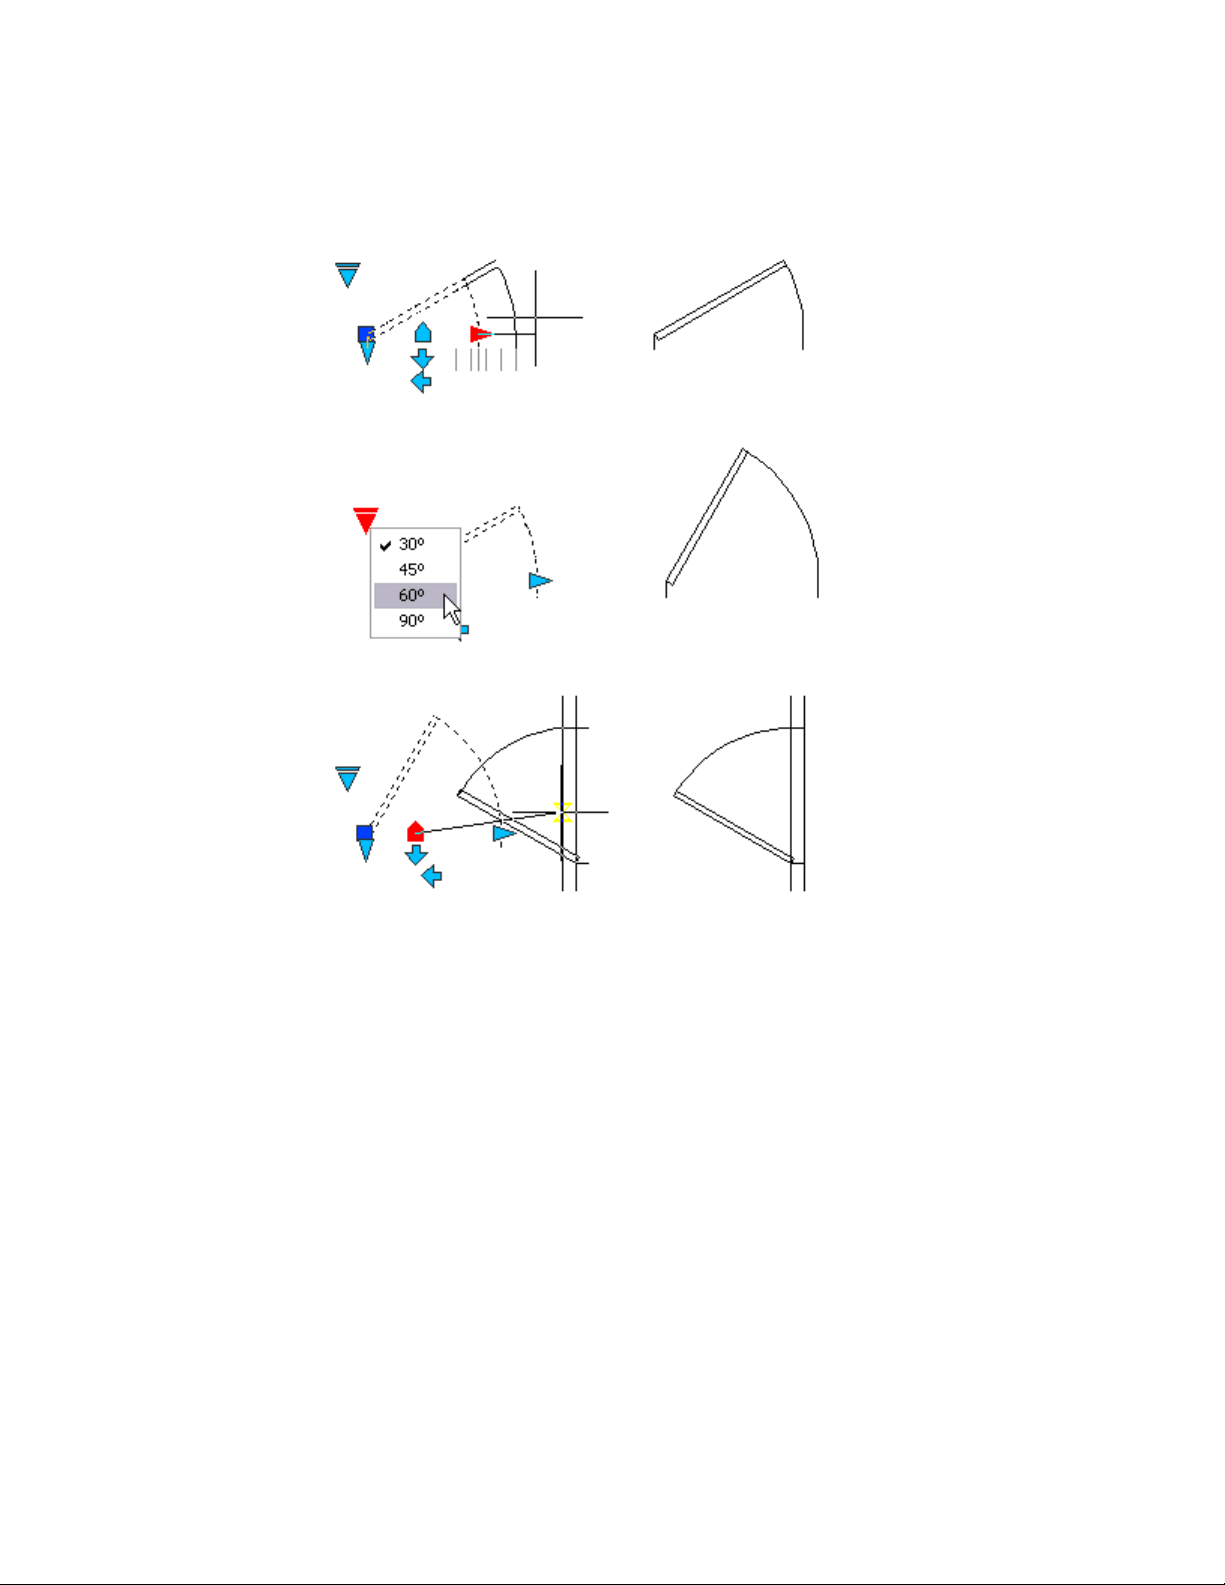
Work with Action Parameters
Dynamic blocks that contain action parameters display grips that are associated
with a point, object, or region in the block definition. When you edit the grip,
an associated action is triggered that changes the way the block reference is
displayed.
You can hover over a grip to display a tooltip or prompt that explains the
parameter related to the grip. The display of the tooltip is controlled by the
GRIPTIPS system variable.
Some dynamic blocks are defined so that geometry within the block can only
be edited to certain sizes specified in the block definition. When you use a
grip to edit the block reference, tick marks are displayed at the locations of
valid values for the block reference. If you change a block property value to
312 | Chapter 7 Define and Reference Blocks
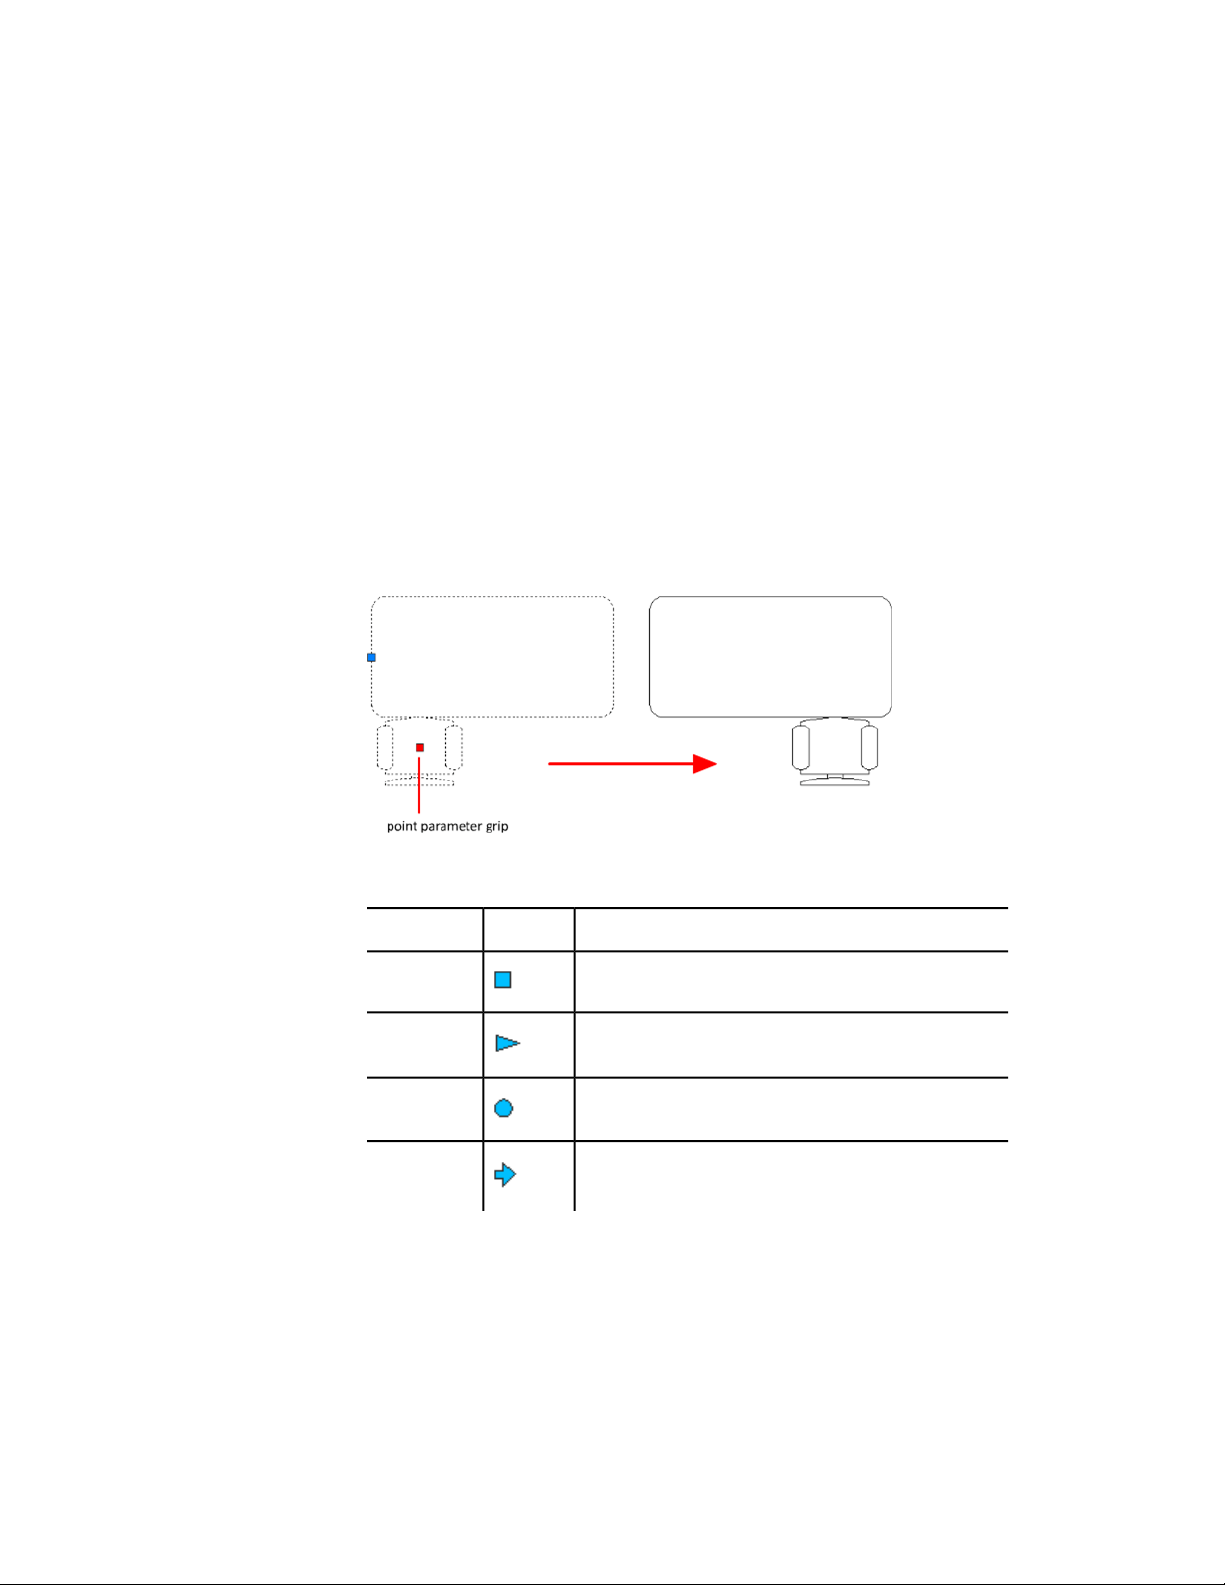
a value other than one specified in the definition, the parameter will adjust
to the closest valid value.
Work With Action Parameters in Blocks
Use grips or the Properties palette to manipulate a block reference that contains
action parameters.
Use Grips to Change Blocks Containing Action Parameters
You can manipulate a block that contains action parameters with custom
grips. For example, when you drag the grip on the chair in the block reference
below, the chair moves.
The following table shows the different types of custom grips that can be
included in a dynamic block.
How the Grip Can Be Manipulated in a DrawingGrip Type
Within a plane in any directionStandard
Back and forth in a defined direction or along an axisLinear
Around an axisRotation
Clicked to flip the dynamic block referenceFlip
Work with Blocks | 313
How the Grip Can Be Manipulated in a DrawingGrip Type
Within a plane in any direction; when moved over an object,
triggers the block reference to align with the object
Alignment
Clicked to display a list of itemsLookup
Work with Custom Properties
When you select a dynamic block reference, custom properties are listed in
the Properties Inspector under Custom. When you change the value of the
custom property, the block reference is updated accordingly.
Work With Lookup Grips
A block reference that contains a lookup grip allows you to specify a preset
value that changes the way the block reference is displayed. The new size is
displayed in the Properties Inspector under Custom.
Control Visibility of Block References
A block definition can contain a visibility state grip, which determines several
graphical representations of the same block reference.
314 | Chapter 7 Define and Reference Blocks
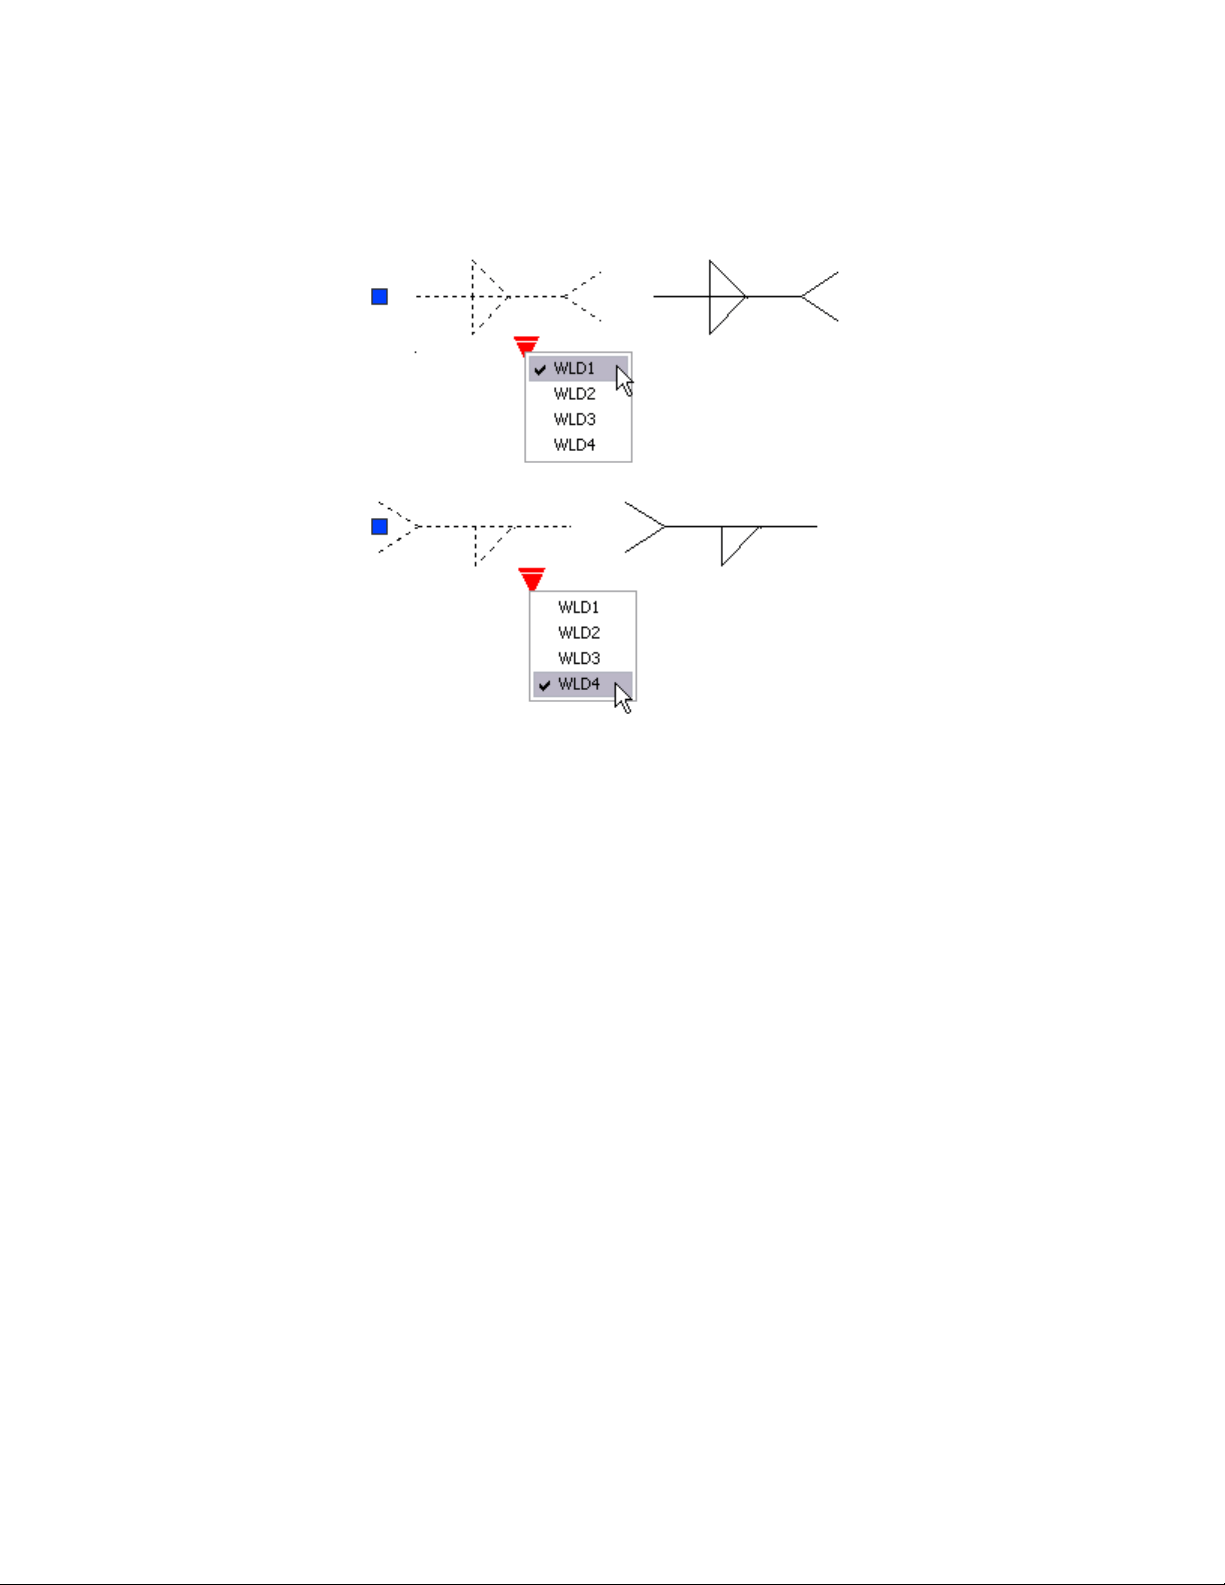
Reset a Block to Display Default Geometry
When you reset a block reference, the block changes back to the default
specified in the block definition. For example, you can make a block dynamic
again if you non-uniformly scale or explode a dynamic block reference.
Work With Constraint Parameters in Blocks
Parameters in a block reference can be manipulated in the Block Editor.
Constraint parameters are authored with mathematical expressions that affect
the geometry of the block reference. They display dynamic, editable custom
properties that can be manipulated outside of the Block Editor, similar to
action parameters.
Work with Blocks | 315
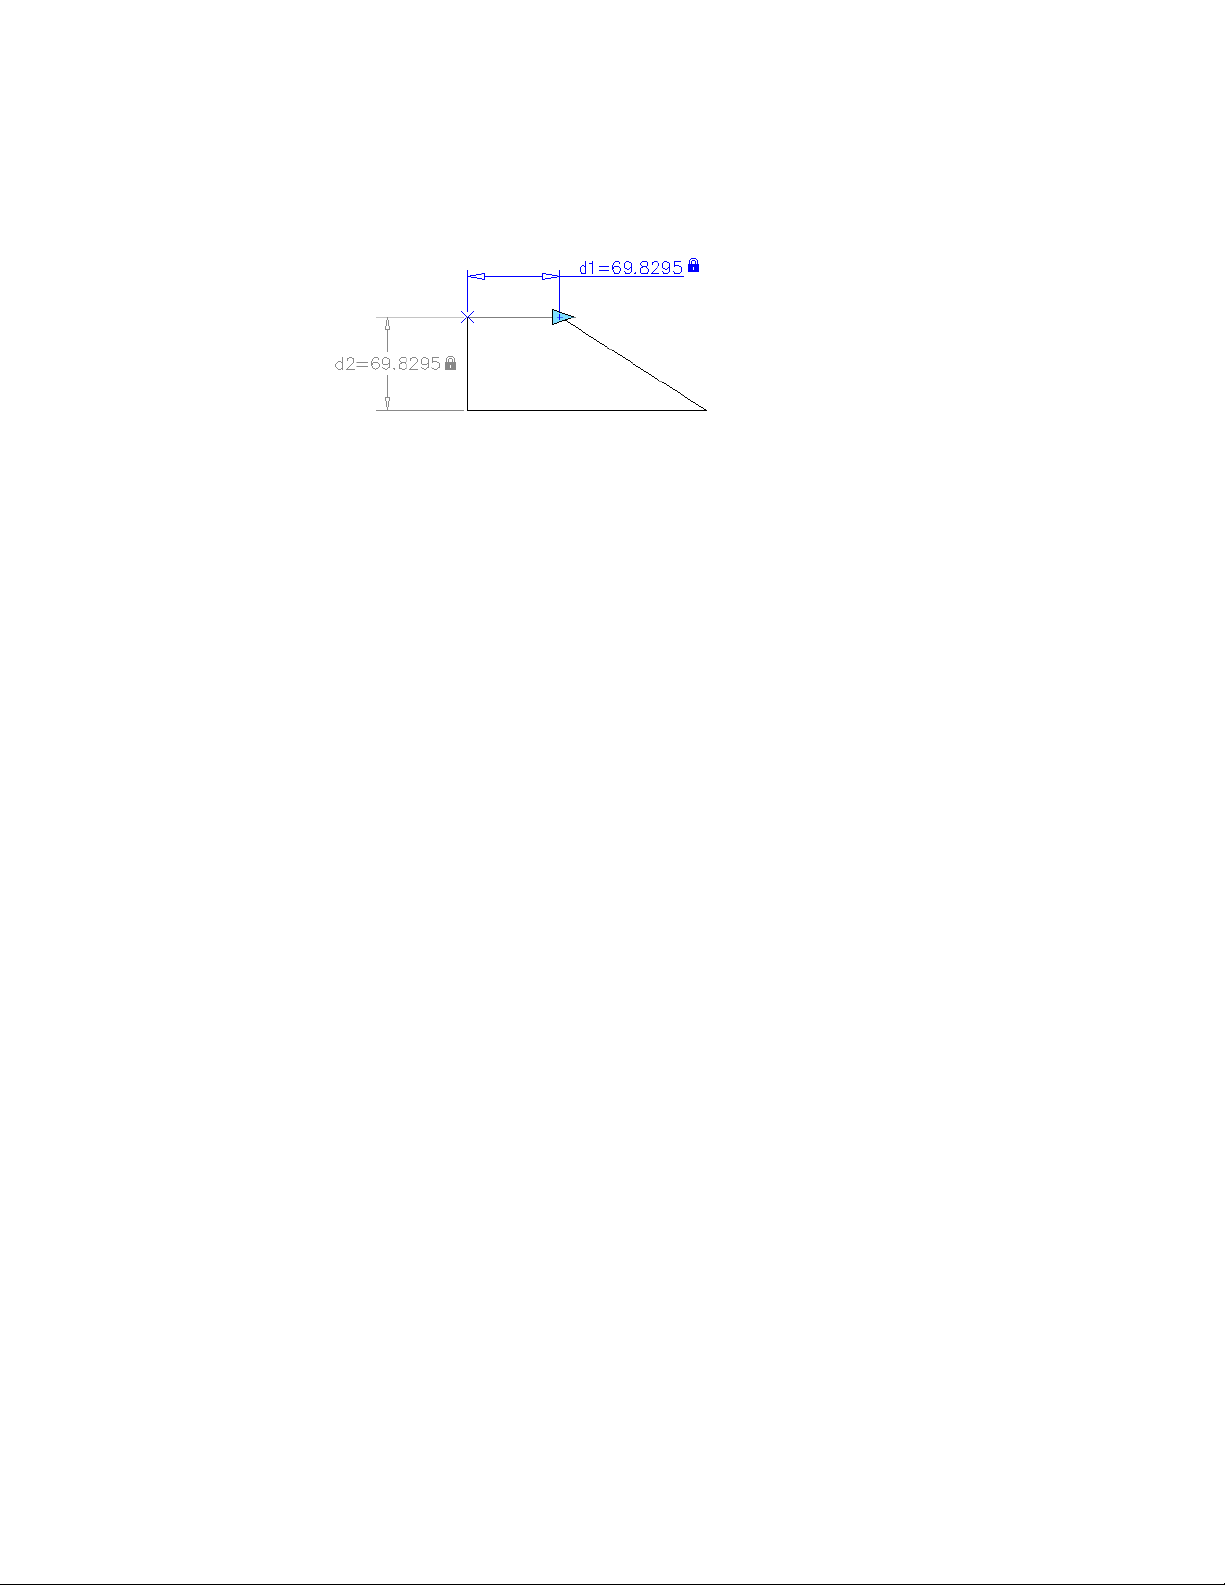
Block reference with constraint (gray) and constraint parameter (blue, with grip)
You can select a block reference and list its editable parameters with
-PARAMETERS. When you change the value of the parameter, the block
reference is updated accordingly.
Remove Block Definitions
To reduce the size of a drawing, you can remove unused block definitions.
You can remove a block reference from your drawing by erasing it; however,
the block definition remains in the drawing's block definition table.
To remove unused block definitions and decrease the drawing size, use PURGE
at any time in your drawing session.
All references to a block must be erased before you can purge the block
definition.
See also:
Overview of Blocks (page 307)
Create and Modify Blocks
A block definition is a set of objects that are grouped together as one named
object with a base point and unique properties.
Define Blocks
You create blocks by associating objects and giving them a name.
316 | Chapter 7 Define and Reference Blocks
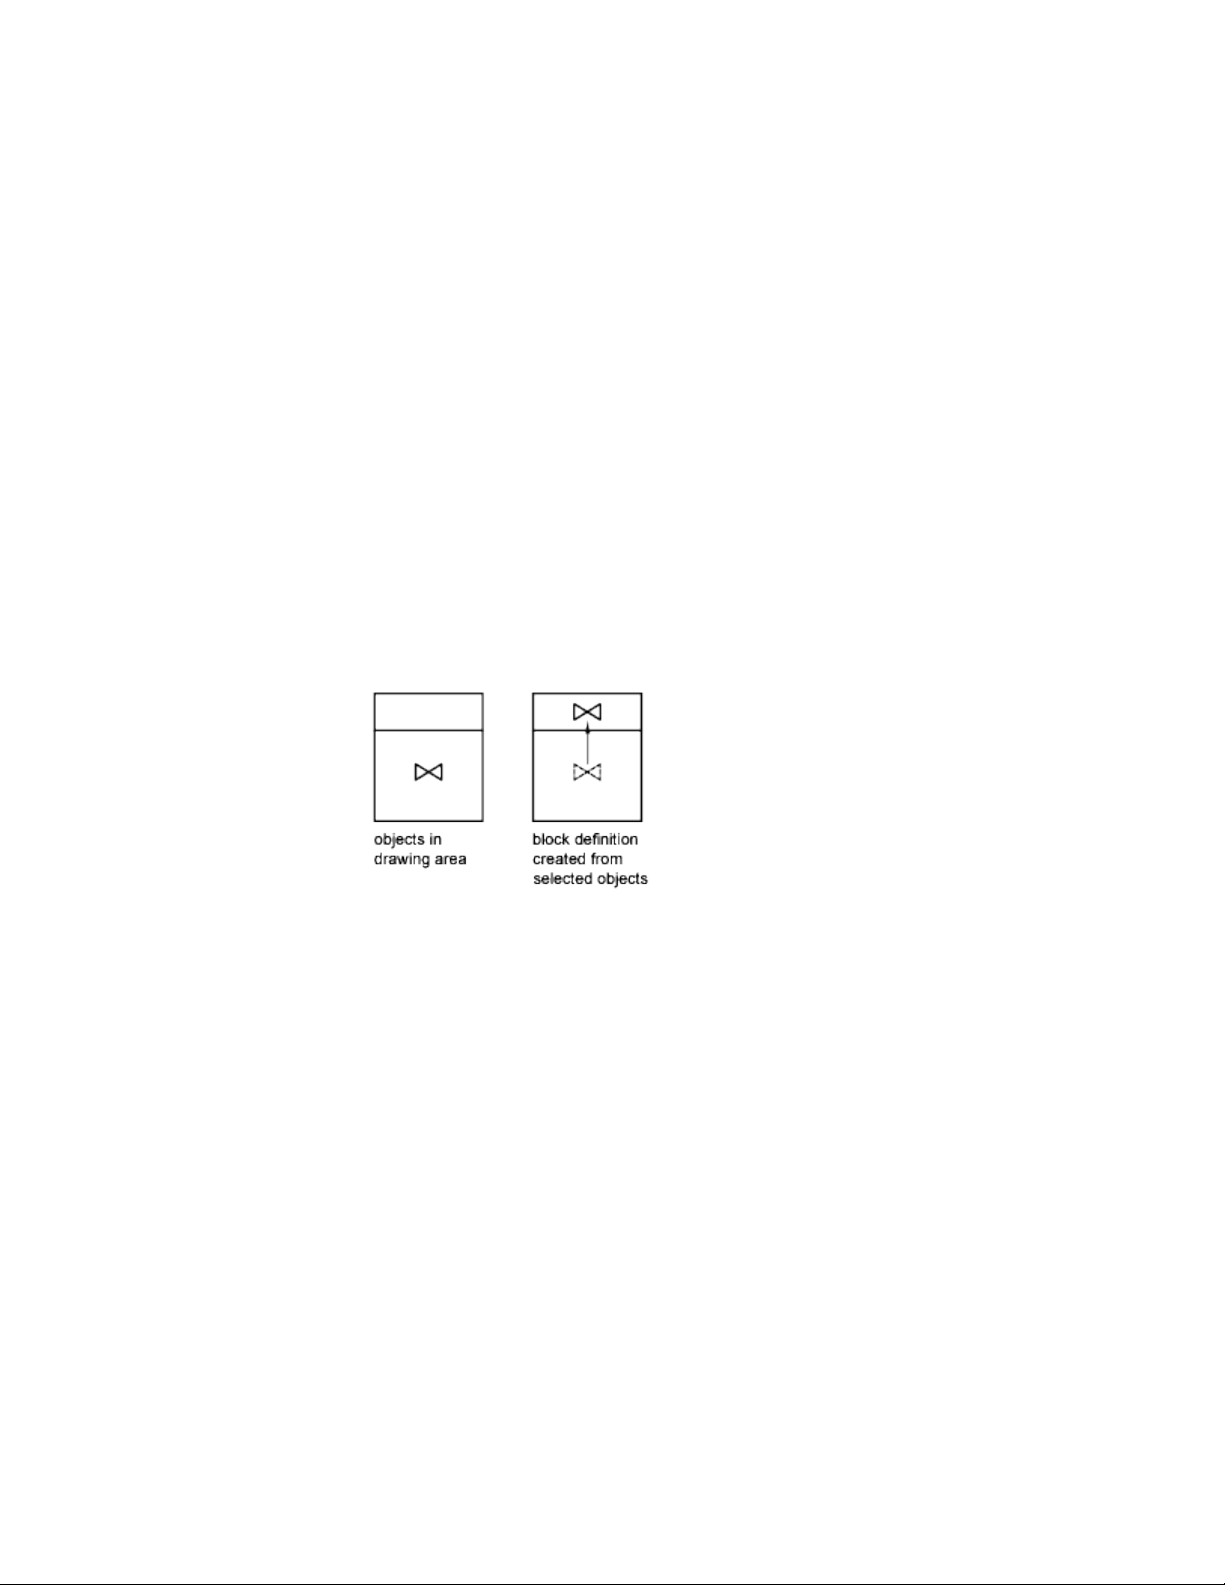
Create Blocks Within a Drawing
After you define a block in a drawing, you can insert a block reference in the
drawing as many times as necessary. Use this method to create blocks quickly.
Each block definition includes a block name, one or more objects, the
coordinate values of the base point to be used for inserting the block, and any
associated attribute data.
The base point is used as a reference for positioning the block when you insert
it. Suppose you specify that the base point is at the lower-left corner of an
object in the block. Later, when you insert the block, you are prompted for
an insertion point. The block base point is aligned at the insertion point you
specified.
The block definition in the illustration comprises a name, PLUG_VALVE, four
lines, and a base point at the intersection of the two diagonal lines. For an
explanation of the schematic representation shown, see Overview of Blocks
(page 307).
The illustration shows a typical sequence for creating a block definition within
a drawing.
Create and Modify Blocks | 317
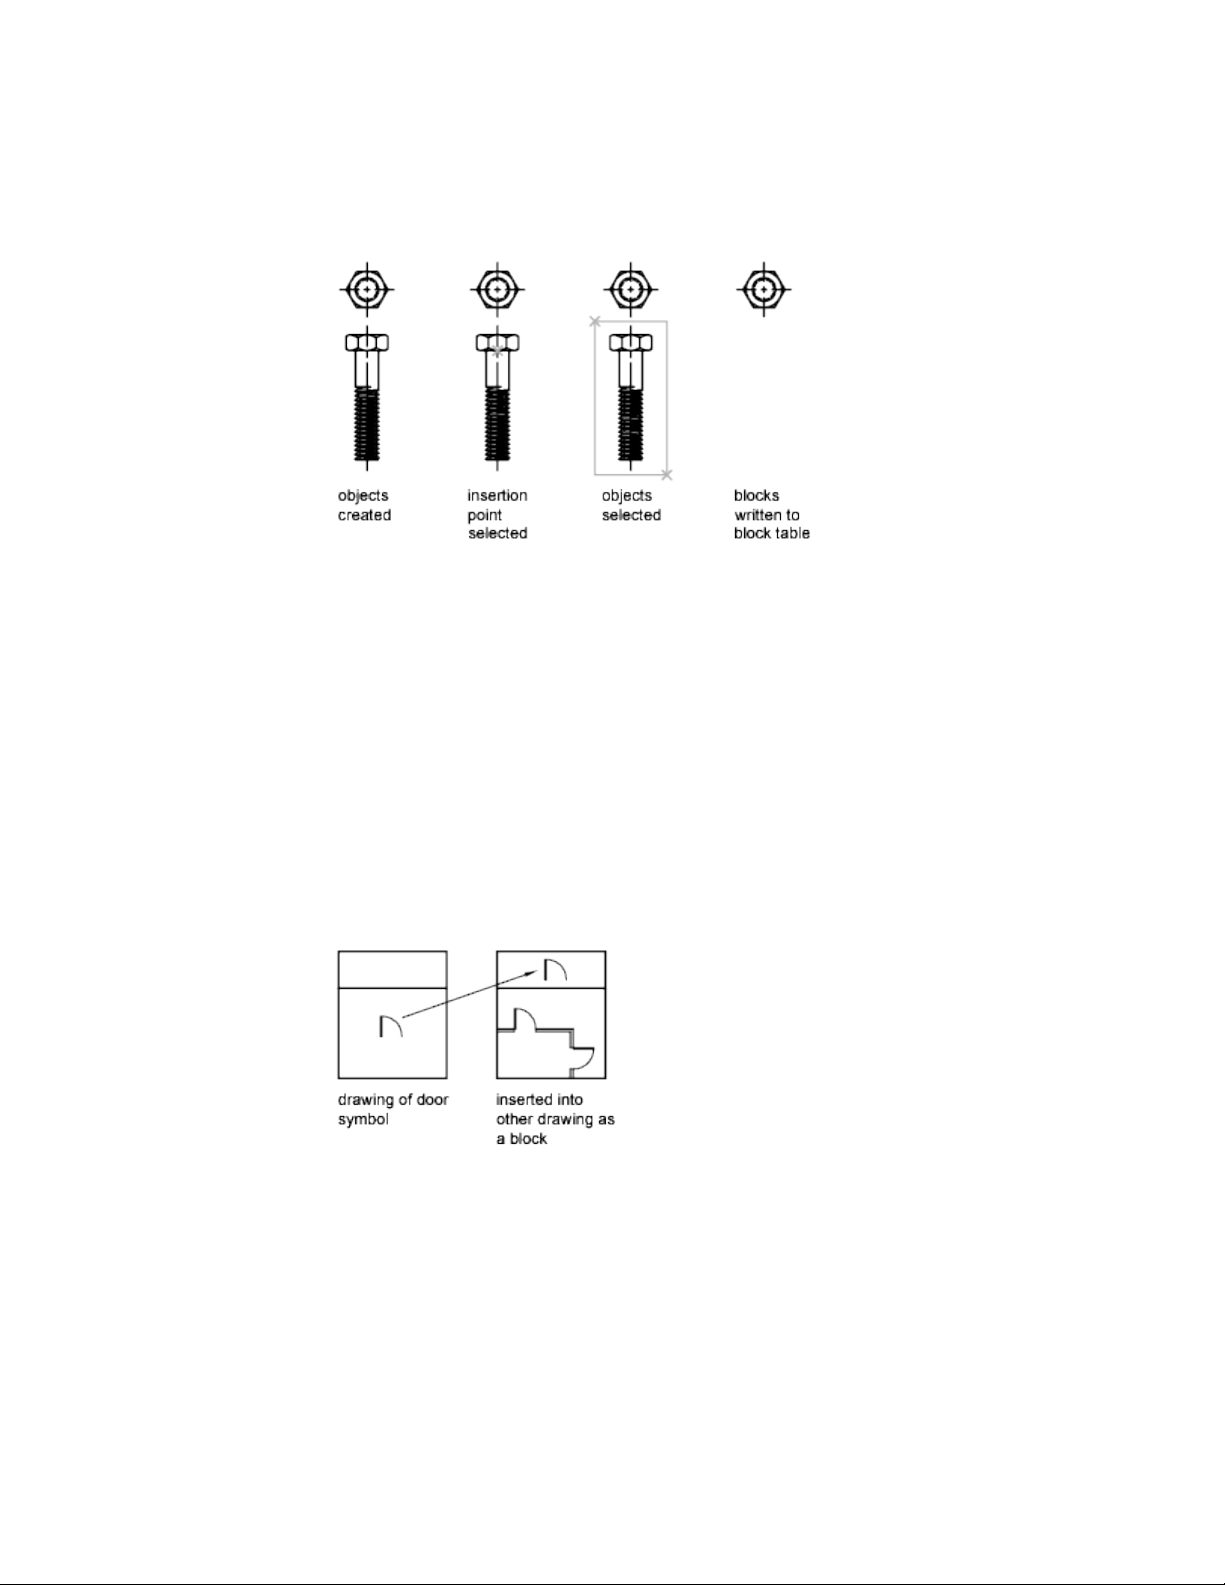
You can also use the Block Editor to create blocks that are saved within a
drawing.
See also:
Overview of Blocks (page 307)
Create Drawing Files for Use as Blocks
You can create individual drawing files for use as blocks.
You can create drawing files for the purpose of inserting them into other
drawings as blocks. Individual drawing files are easy to create and manage as
the source of block definitions. Collections of symbols can be stored as
individual drawing files and grouped in folders.
318 | Chapter 7 Define and Reference Blocks

Create a New Drawing File
You have two methods for creating drawing files:
■ Create and save a complete drawing file using SAVE or SAVEAS.
■ Create and save only selected objects from your current drawing to a new
drawing using EXPORT or WBLOCK.
With either method, you create an ordinary drawing file that can be inserted
as a block into any other drawing file. Using WBLOCK is recommended when
you need to create several versions of a symbol as separate drawing files, or
when you want to create a drawing file without leaving the current drawing.
Change the Base Point of Drawings to Be Used as Blocks
By default, the WCS (world coordinate system) origin (0,0,0) is used as the
base point for drawing files inserted as blocks. You can change the base point
by opening the original drawing and using BASE to specify a different base
point for insertion. The next time you insert the block, the new base point is
used.
Update Changes in the Original Drawing
If you change the original drawing after inserting it, the changes have no
effect on the current drawing. If you expect the original drawing to change,
and you want the changes to be reflected in the current drawing, you may
want to attach it as an external reference instead of inserting it as a block. For
more information about external references, see Reference Other Drawing
Files (page 643).
Use Paper Space Objects in Blocks
Objects in paper space are not included when you insert a drawing as a block.
To transfer paper space objects to another drawing, make the objects into a
block or save them in a separate drawing file, and then insert the block or
drawing file into the other drawing.
Control the Color and Linetype Properties in Blocks
The objects in an inserted block can retain their original properties, can inherit
properties from the layer on which they are inserted, or can inherit the
properties set as current in the drawing.
Create and Modify Blocks | 319
Assign Color and Linetype Properties
Generally when you insert a block, the color, linetype, and lineweight of
objects in the block retain their original settings regardless of the current
settings in the drawing. However, you can create blocks with objects that
inherit the current color, linetype, and lineweight settings. These objects have
floating properties.
You have three choices for how the color, linetype, and lineweight properties
of objects are treated when a block reference is inserted.
■ Objects in the block do not inherit color, linetype, and lineweight
properties from the current settings. The properties of objects in the block
do not change regardless of the current settings.
For this choice, it is recommended that you set the color, linetype, and
lineweight properties individually for each object in the block definition:
do not use BYBLOCK or BYLAYER color, linetype, and lineweight settings
when creating these objects.
■ Objects in the block inherit color, linetype, and lineweight properties from
the color, linetype, and lineweight assigned to the current layer only.
For this choice, before you create objects to be included in the block
definition, set the current layer to 0, and set the current color, linetype,
and lineweight to BYLAYER.
■ Objects inherit color, linetype, and lineweight properties from the current
color, linetype, and lineweight that you have set explicitly, that is, that
you have set to override the color, linetype, or lineweight assigned to the
current layer. If you have not explicitly set them, then these properties are
inherited from the color, linetype, and lineweight assigned to the current
layer.
For this choice, before you create objects to be included in the block
definition, set the current color or linetype to BYBLOCK.
Create objects with
these properties
Create objects on these
layers
If you want objects in a
block to
Any but BYBLOCK or
BYLAYER
Any but 0 (zero)Retain original properties
BYLAYER0 (zero)Inherit properties from the
current layer
320 | Chapter 7 Define and Reference Blocks
Create objects with
these properties
Create objects on these
layers
If you want objects in a
block to
BYBLOCKAnyInherit individual properties
first, then layer properties
Floating properties also apply to nested blocks when the nested block references
and the objects they contain use the settings required for floating properties.
Change the Color and Linetype in a Block
You can change the color and linetype of the objects within a block only if
the objects in that block were created with floating properties.
If a block was not created using objects with floating color and linetype
properties, the only way to change these properties is to redefine the block.
See also:
Control the Properties of Objects (page 117)
Nest Blocks
Block references that contain other blocks are known as nested blocks. Using
blocks within blocks can simplify the organization of a complex block
definition.
Create and Modify Blocks | 321
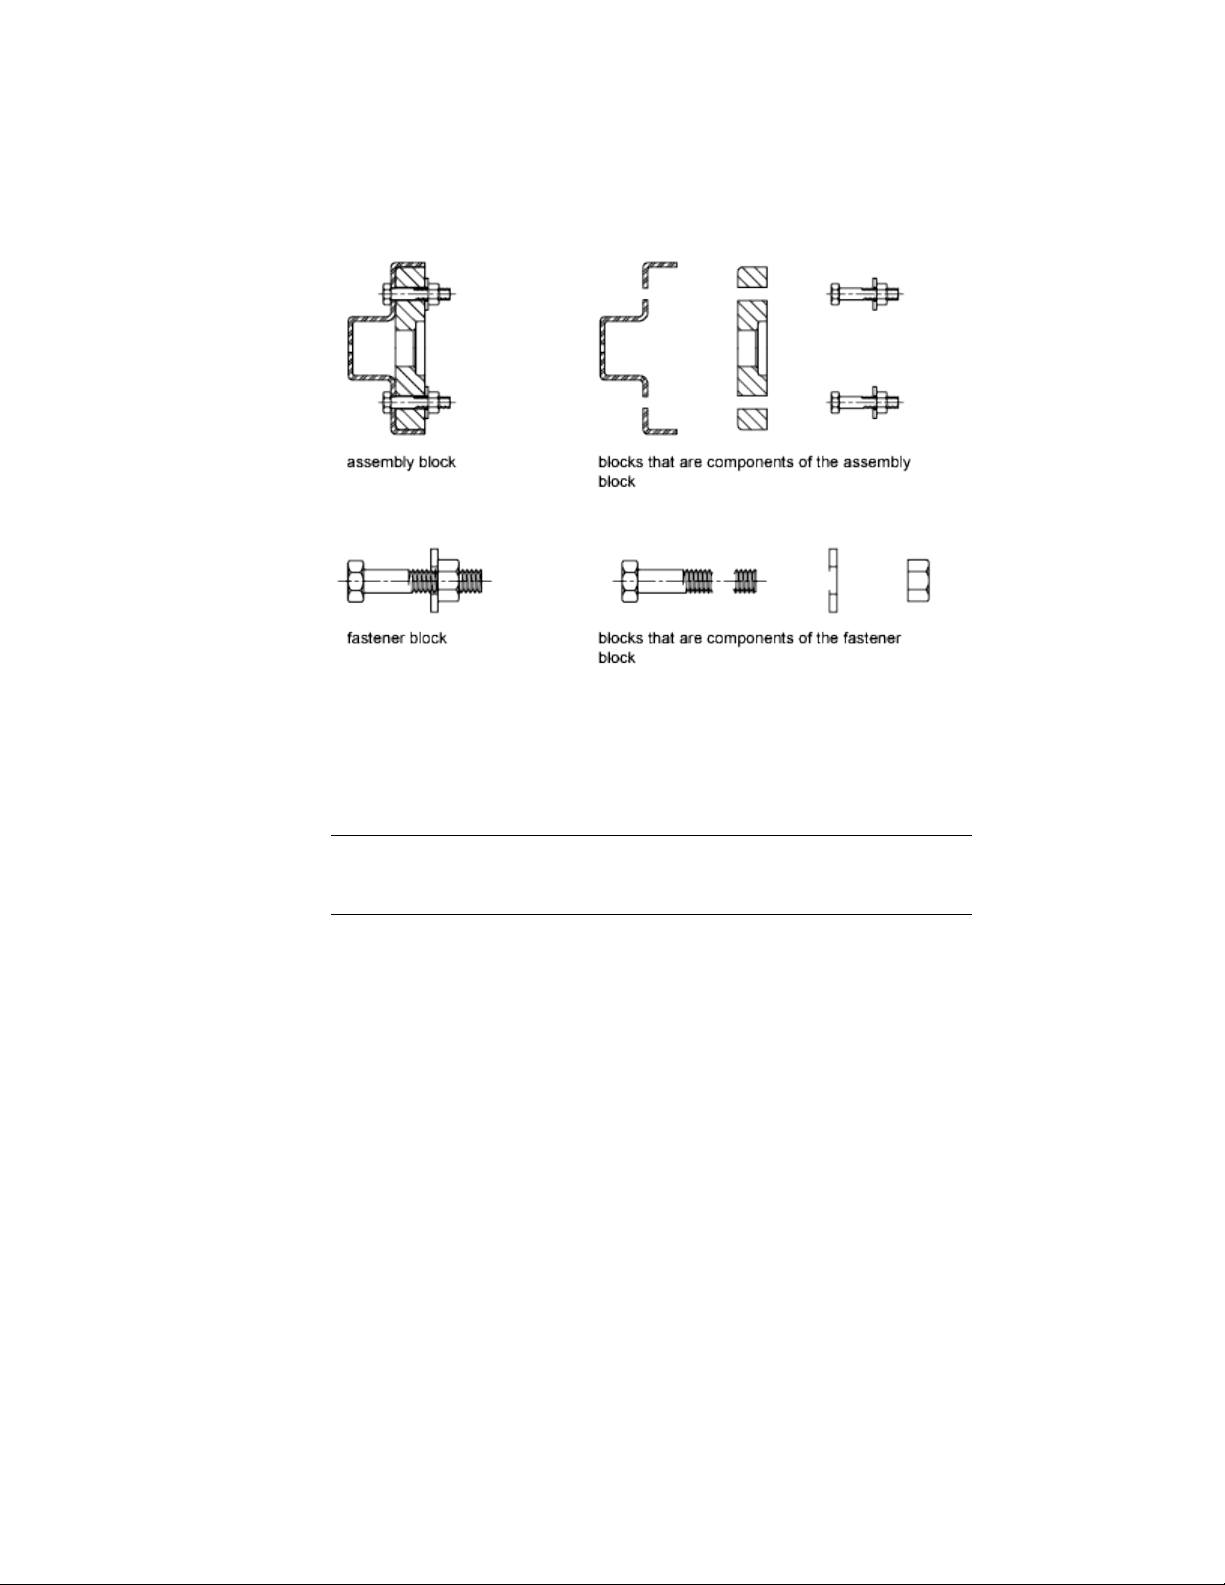
The only restriction on nested blocks is that you cannot insert blocks that
reference themselves.
You can apply geometric constraints and constraint parameters to nested
objects in blocks. AutoCAD detects the nested entity or valid constraint point
for the nested entity regardless of the nesting level of the object.
NOTE Constraints can only be applied between nested objects in the block and
objects in the drawing file, not between pairs of nested objects in the block
reference.
When a block definition is redefined, AutoCAD will re-evaluate the constraints
between geometry in the drawing and the nested geometry in the block
references. The drawing will then be updated appropriately. If a constraint
cannot be resolved as a result of the change to the block definition, then the
constraint is removed and an unresolved constraints message is displayed at
the command line.
See also:
Overview of Blocks (page 307)
322 | Chapter 7 Define and Reference Blocks
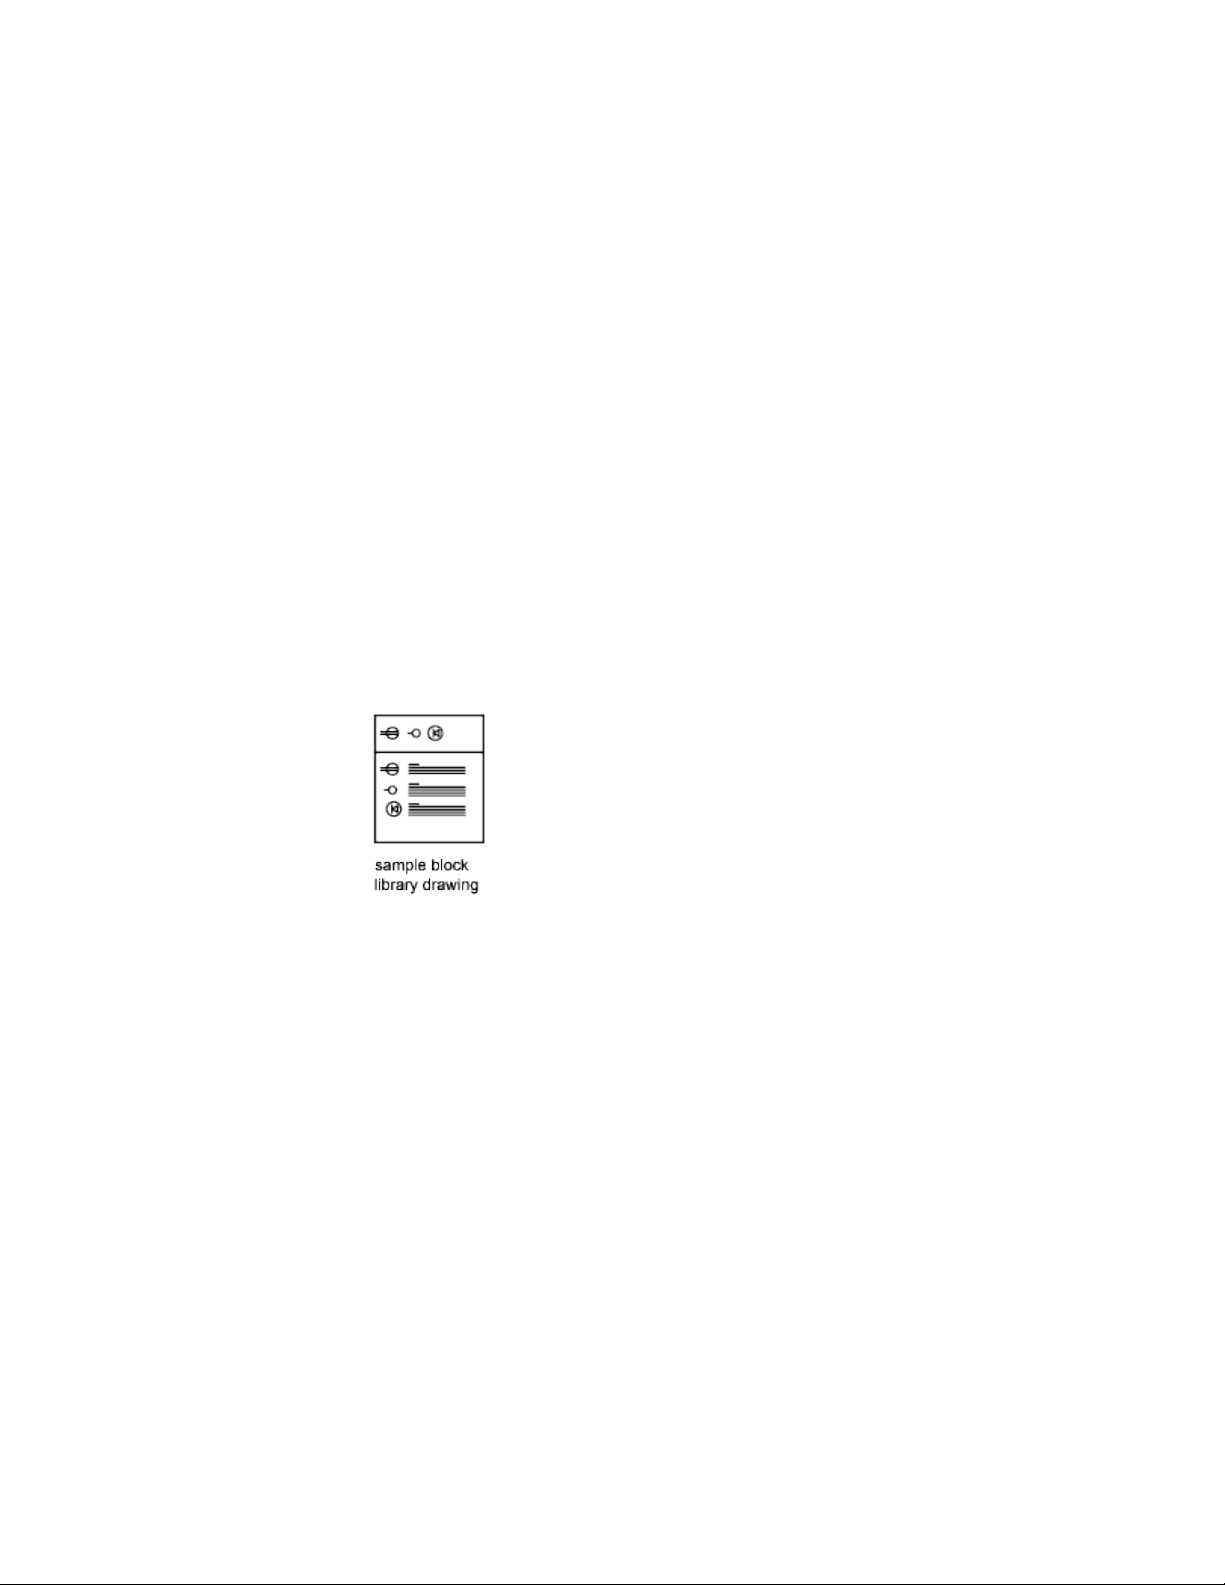
Create Block Libraries
A block library is a collection of block definitions stored in a single drawing
file. You can use block libraries supplied by Autodesk or other vendors or
create your own.
You can organize a set of related block definitions by creating the blocks in
the same drawing file. Drawing files used this way are called block, or symbol,
libraries. These block definitions can be inserted individually into any drawing
that you are working on. Block library drawings are not different from other
drawing files except in how they are used.
When you use BLOCK to define each block definition in the block library
drawing, you can include a short description of the block.
Optionally, you can also document each block definition by inserting it in
the drawing area of the library drawing. In addition to the block geometry,
you can include text that provides the block name, the date of creation, the
date of the last modification, and any special instructions or conventions.
This creates a visual index of the blocks in the block library drawing.
Use the Content palette to view and insert block definitions from the current
or an existing drawing. Insert a block from the Content palette does not
overwrite an existing block definition in a drawing with one that comes from
another drawing.
Attach Data to Blocks (Block Attributes)
You can attach information to blocks and later extract the information to
create a bill of materials or other report.
Create and Modify Blocks | 323
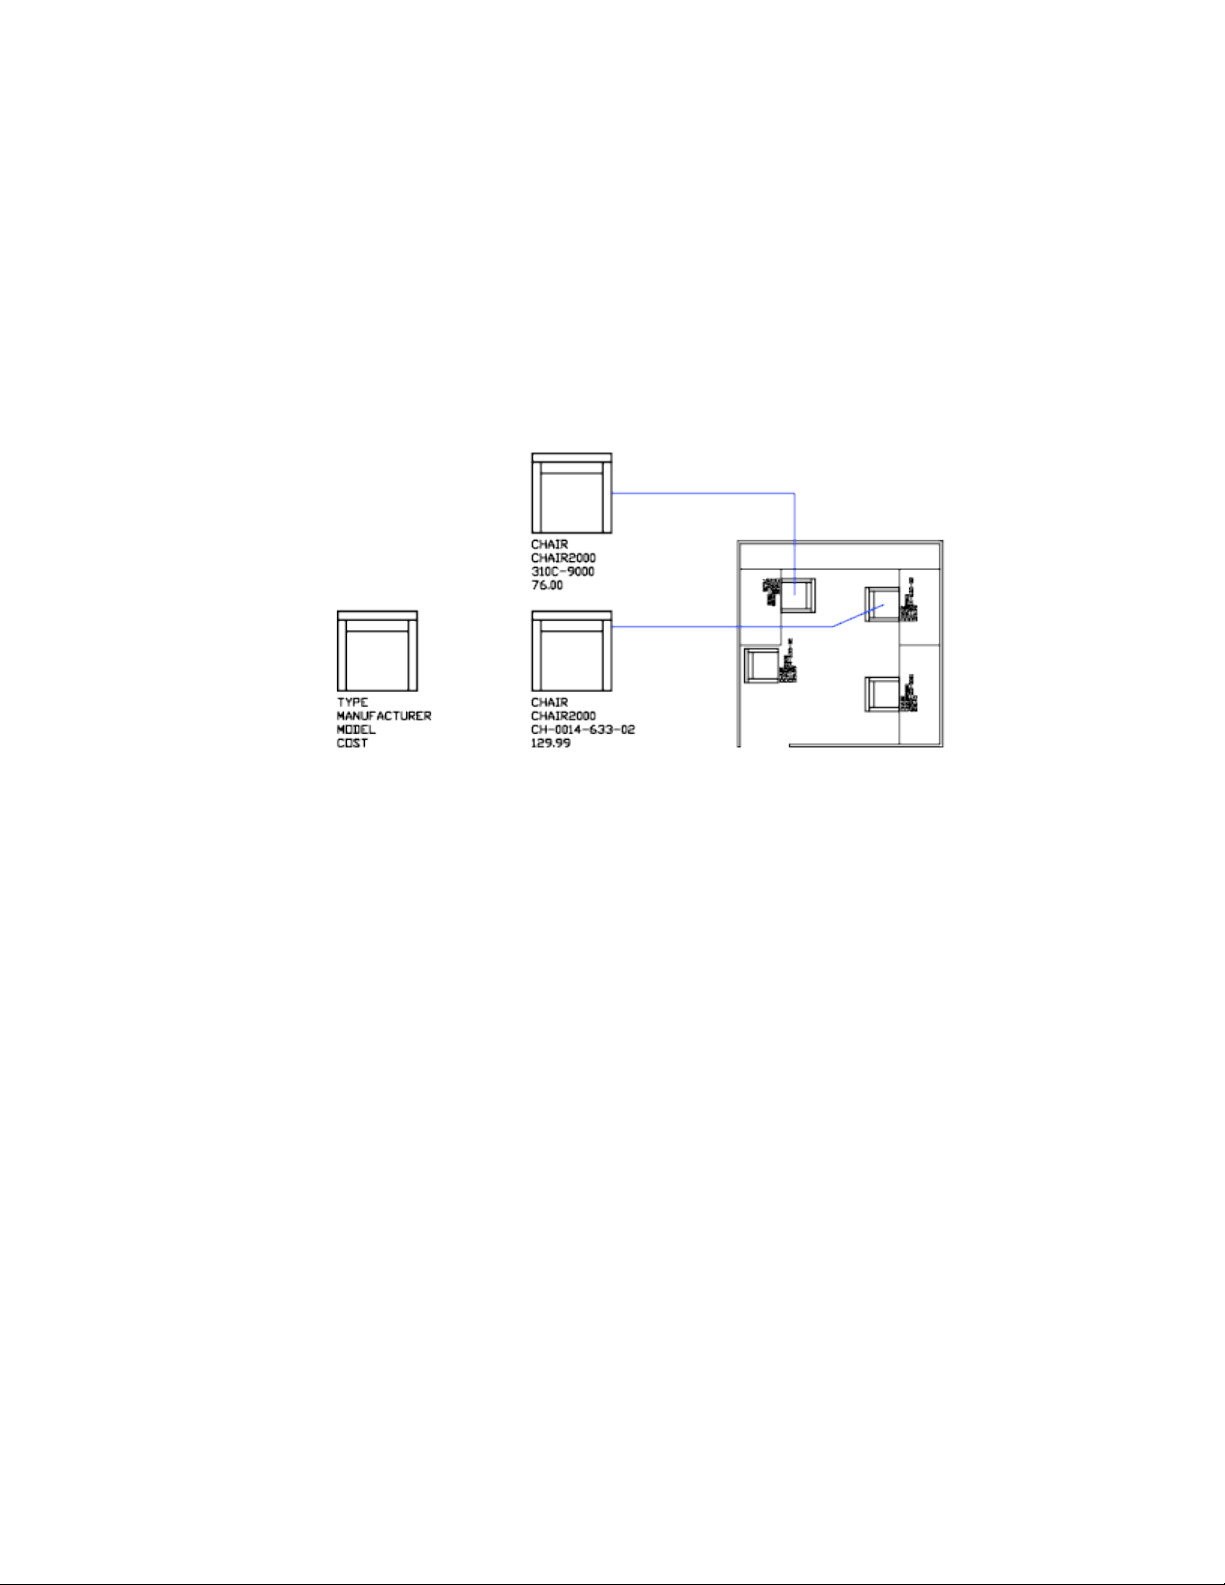
Overview of Block Attributes
An attribute is a label or tag that attaches data to a block. Examples of data
that might be contained in an attribute are part numbers, prices, comments,
and owners' names. The tag is equivalent to a column name in a database
table. The following illustration shows a block with four attributes: type,
manufacturer, model, and cost.
The attributes in the illustration are single-line attributes. You can also create
multiple-line attributes to store data such as addresses and descriptions.
Attribute information extracted from a drawing can be used in a spreadsheet
or database to produce a parts list or a bill of materials. You can associate more
than one attribute with a block, provided that each attribute has a different
tag.
Attributes also can be "invisible." An invisible attribute is not displayed or
plotted; however, the attribute information is stored in the drawing file and
can be written to an extraction file for use in a database program.
Whenever you insert a block that has a variable attribute, you are prompted
to enter data to be stored with the block. Blocks can also use constant
attributes, attributes whose values do not change. Constant attributes do not
prompt you for a value when you insert the block.
You can also create annotative attributes. For more information about creating
and working with an annotative attributes, see Create Annotative Blocks and
Attributes (page 497).
324 | Chapter 7 Define and Reference Blocks

See also:
Modify a Block Attribute Definition (page 335)
Modify the Data in Block Attributes (page 334)
Scale Annotations (page 490)
Define Block Attributes
To create an attribute, you first create an attribute definition, which stores
the characteristics of the attribute.
The characteristics include the tag, which is a name that identifies the attribute,
the prompt displayed when you insert the block, value information, text
formatting, location within the block, and any optional modes (Invisible,
Constant, Verify, Preset, Lock Position, and Multiple Lines).
If you plan to extract the attribute information for use in a parts list, you may
want to keep a list of the attribute tags you have created. You will need this
tag information later when you create the attribute template file.
Choose Attribute Modes
Attribute modes control the behavior of attributes in blocks. For example, you
can control
■ Whether an attribute is visible or invisible in the drawing
■ Whether an attribute has a constant value, such as a part number
■ Whether the attribute can be moved relative to the rest of the block
■ Whether the attribute is a single-line attribute or a multiple-line attribute
If an attribute has a constant value, you will not be prompted for its value
when you insert the block. If an attribute has a variable value, such as the
asset number of a computer, you will be prompted when you insert the block.
Understand Single-Line and Multiple-Line Attributes
There are several differences between single-line and multiple-line attributes.
■ Single-line attributes are limited to 255 characters from the user interface.
■ Multiple-line attributes provide more formatting options than single-line
attributes.
■ When editing single-line and multiple line attributes, different editors are
displayed.
Create and Modify Blocks | 325
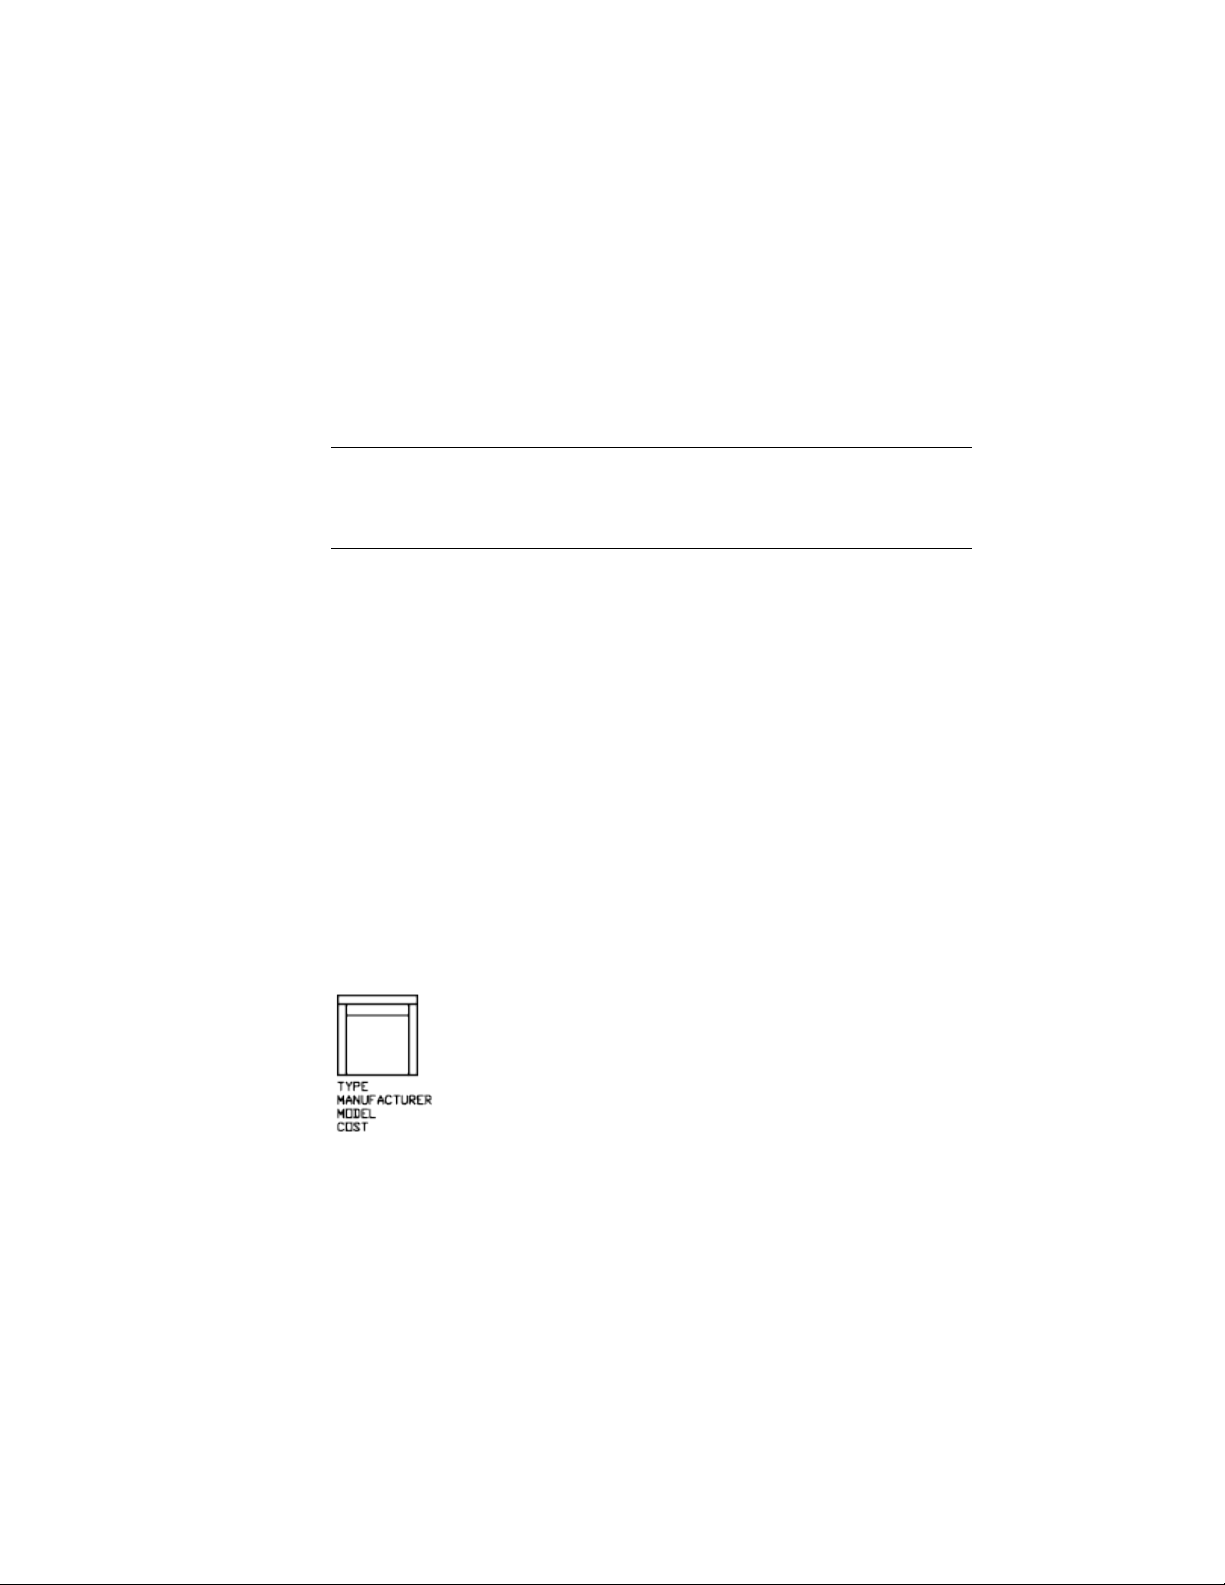
■ Multiple line attributes display four grips similar to MTEXT objects, while
single-line attributes display only one grip.
■ When a drawing is saved to AutoCAD 2007 or earlier, a multiple-line
attribute is converted to several single-line attributes, one for every line of
text in the original multiple-line attribute. If the drawing file is opened in
the current release, these single line attributes are automatically merged
back into a multiple-line attribute.
NOTE If a multiple-line attribute makes a round trip to an earlier release, the
differences between these two types of attributes might result in truncating very
long lines of text and loss of formatting. However, before any characters are
truncated, AutoCAD displays a message box that lets you cancel the operation.
Correct Mistakes in Block Attribute Definitions
If you make a mistake, you can use the Properties Inspector palette or DDEDIT
to make limited changes to an attribute definition before it is associated with
a block. If you need to make more extensive changes, delete the attribute
definition and create a new one.
Attach Attributes to Blocks
After you create one or more attribute definitions, you attach the attributes
to a block when you define or redefine that block. When you are prompted
to select the objects to include in the block definition, include in the selection
set any attributes you want to attach to the block.
To use several attributes together, define them and then include them in the
same block. For example, you can define attributes tagged "Type,"
"Manufacturer," “Model,” and “Cost,” and then include them in a block called
CHAIR.
Usually, the order of the attribute prompts is the same as the order in which
you selected the attributes when you created the block. However, if you used
crossing or window selection to select the attributes, the order of the prompts
is the reverse of the order in which you created attributes. You can use the
326 | Chapter 7 Define and Reference Blocks

Block Attribute Manager to change the order in which you are prompted for
attribute information when you insert the block reference.
When you open a block definition in the Block Editor, you can use the
Attribute Order dialog box (BATTORDER command) to change the order in
which you are prompted for attribute information when you insert the block
reference.
Use Attributes Without Attaching Them to Blocks
Stand-alone attributes can also be created. Once attributes have been defined,
and the drawing is saved, this drawing file can be inserted into another
drawing. When the drawing is inserted, you are prompted for the attribute
values.
Extract Data from Block Attributes
If you have attached attributes to blocks, you can then query the block attribute
information and use it to generate documentation about your drawing.
Extracting attribute information is an easy way to produce a schedule or bill
of materials directly from your drawing data. For example, a facilities drawing
might contain blocks representing office equipment. If each block has attributes
identifying the model and manufacturer of the equipment, you can generate
a report that estimates the cost of the equipment.
Output to a File
If you save the data to an external file, the comma-separated (CDF), space
delimited (SDF), and data extraction (DXX) formats are available. Your can
use the following commands to extract attribute information:
■ ATTEXT - Extracts attribute information using a template file that describes
which attribute values to extract.
■ EXPORT - Extracts attribute information from a drawing into a DXX file
format. DXX is a file format similar to DXF except it only contains attribute
information.
Create and Modify Blocks | 327

Extract Block Attribute Data (Advanced)
Using an attribute extraction template file, you can extract attribute
information from a drawing and create a separate text file for use with database
software.
You can extract attribute information from a drawing and create a separate
text file for use with database software. This feature is useful for creating parts
lists with information already entered in the drawing database. Extracting
attribute information does not affect the drawing.
To create a parts list
■ Create and edit an attribute definition
■ Enter values for the attributes as you insert the blocks
■ Create a template file and then extract attribute information to a text file
To extract attribute information, you first create an attribute template file
using any text processor, then generate the attribute extraction file using
AutoCAD, and, finally, open the attribute extraction file in a database
application. If you plan to extract the attribute information to a DXF (drawing
interchange format) file, it is not necessary to first create an attribute template
file.
NOTE Make sure that the attribute extraction file does not have the same name
as the attribute template file.
Create an Attribute Extraction Template File
Before you extract attribute information, you must create an ASCII template
file to define the structure of the file that will contain the extracted attribute
information. The template file contains information about the tag name, data
type, field length, and number of decimal places associated with the
information you want to extract.
Each field in the template file extracts information from the block references
in the drawing. Each line in the template file specifies one field to be written
to the attribute extraction file, including the name of the field, its character
width, and its numerical precision. Each record in the attribute extraction file
includes all the specified fields in the order given by the template file.
The following template file includes the 15 possible fields. N means numeric,
C means character, www means a 3 digit number for the total width of the
field, and ddd means a 3 digit number representing how many numeric decimal
places are to be displayed to the right of the decimal point.
328 | Chapter 7 Define and Reference Blocks
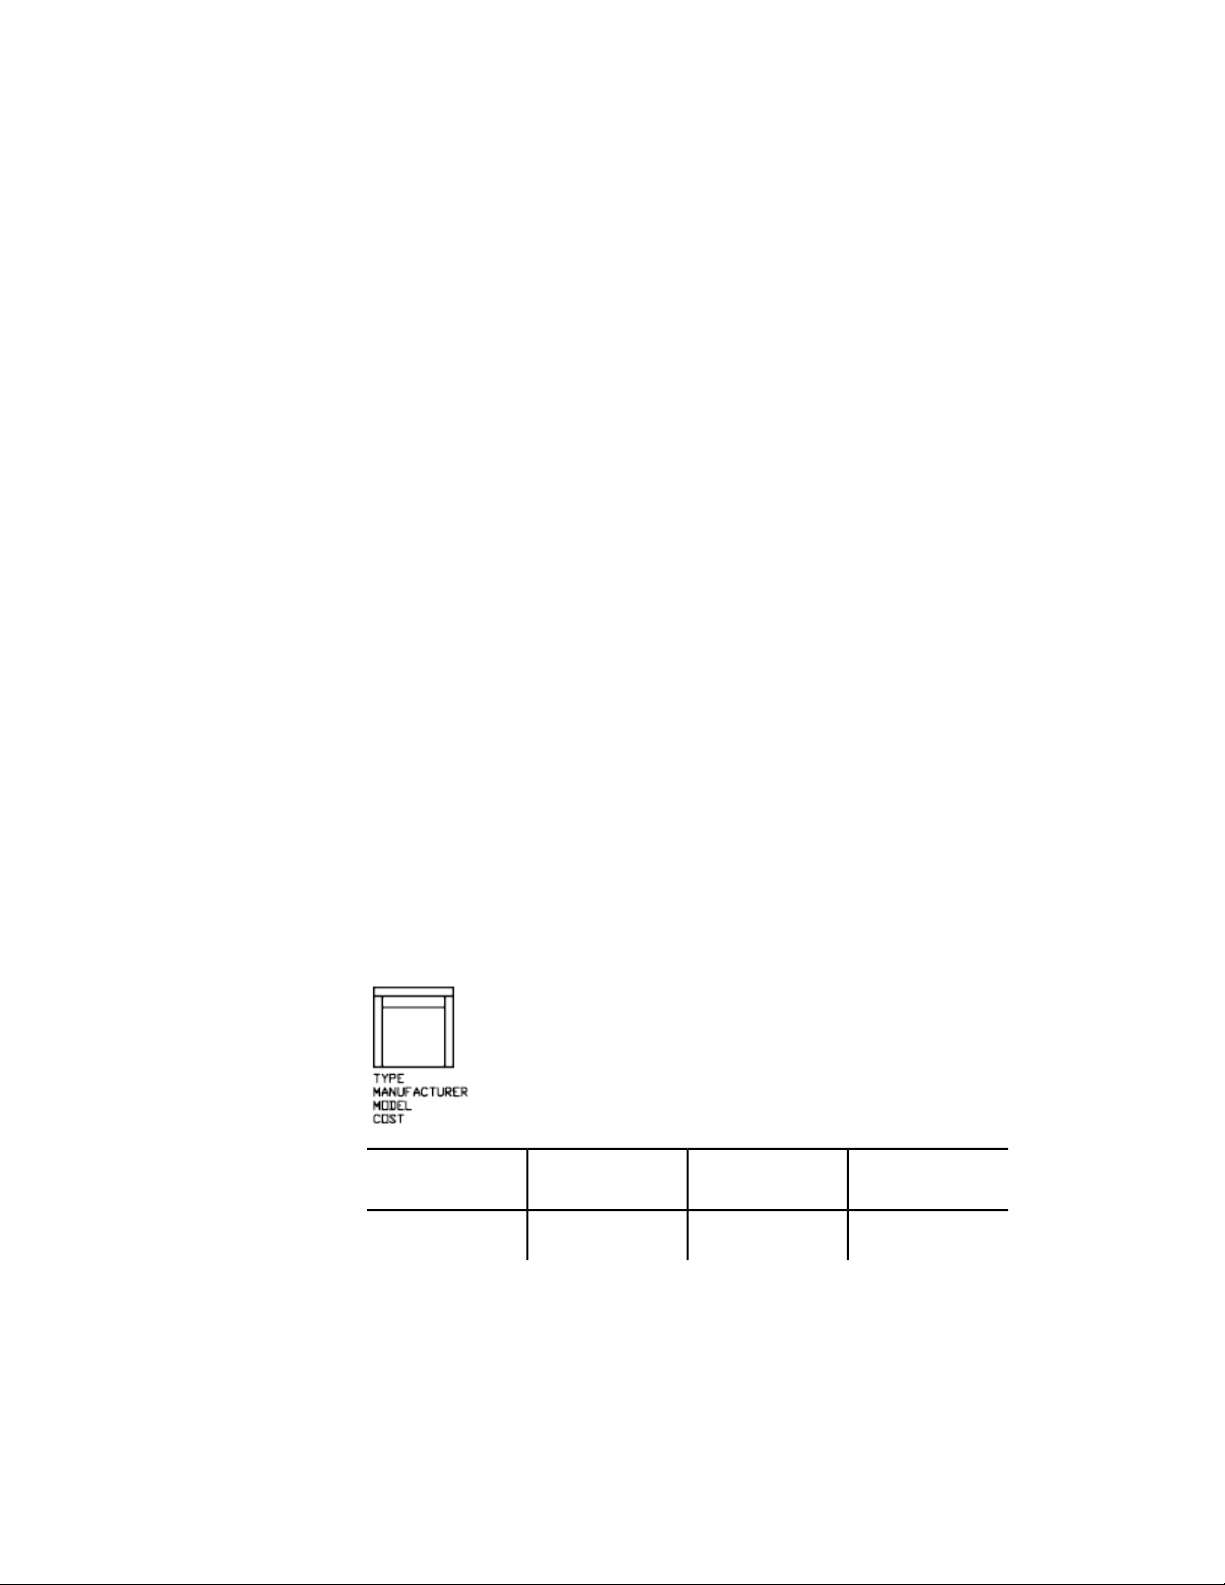
BL:NAME Cwww000 (Block name)
BL:LEVEL Nwww000 (Block nesting level)
BL:X Nwwwddd(X coordinate of block insertion point)
BL:Y Nwwwddd(Y coordinate of block insertion point)
BL:Z Nwwwddd(Z coordinate of block insertion point)
BL:NUMBER Nwww000 (Block counter; the same for MINSERT)
BL:HANDLE Cwww000 (Block handle; the same for MINSERT)
BL:LAYER Cwww000 (Block insertion layer name)
BL:ORIENT Nwwwddd(Block rotation angle)
BL:XSCALE Nwwwddd(X scale factor)
BL:YSCALE Nwwwddd(Y scale factor)
BL:ZSCALE Nwwwddd(Z scale factor)
BL:XEXTRUDE Nwwwddd(X component of block extrusion direction)
BL:YEXTRUDE Nwwwddd(Y component of block extrusion direction)
BL:ZEXTRUDE Nwwwddd(Z component of block extrusion direction)
numericNwwwddd (Numeric attribute tag)
characterCwww000 (Character attribute tag)
The template file can include any or all of the BL:xxxxxxx field names listed,
but must include at least one attribute tag field. The attribute tag fields
determine which attributes, hence which blocks, are included in the attribute
extraction file. If a block contains some, but not all, of the specified attributes,
the values for the absent ones are filled with blanks or zeros, depending on
whether the field is a character field or a numeric field.
Comments should not be included in an attribute template file.
The illustration and table show an example of the type of information you're
likely to extract, including block name, manufacturer, model number, and
cost.
Decimal placesMaximum field
length
(C)haracter or
(N)umeric data
Field
000040CBlock name
Create and Modify Blocks | 329
Decimal placesMaximum field
length
(C)haracter or
(N)umeric data
Field
000006CManufacturer
000015CModel
002006NCost
You can create any number of template files, depending on how you'll use
the data. Each line of a template file specifies one field to be written in the
attribute extraction file.
Follow these additional guidelines:
■ Be sure to place a space between the attribute tag and the character or
numeric data. Use Spacebar, not Tab, to enter the space.
■ Press Enter at the end of each line, including the last line.
■ Each attribute extraction template file must include at least one attribute
tag field, but the same field can appear only once in the file.
The following is a sample template file.
BL:NAME C008000 (Block name, 8 characters)
BL:X N007001 (X coordinate, format nnnnnn.d)
BL:Y N007001 (Y coordinate, format nnnnnn.d)
SUPPLIER C016000 (Manufacturer's name, 16 characters)
MODEL C009000 (Model number, 9 characters)
PRICE N009002 (Unit price, format nnnnnnnn.dd)
NOTE The format code for a numeric field includes the decimal point in the total
field width. For example, the minimum field width to accommodate the number
249.95 would be 6 and would be represented as N006002. Character fields do
not use the last three digits of the format code.
Create an Attribute Extraction File
After creating a template file, you can extract the attribute information using
one of the following formats:
■ Comma-delimited format (CDF)
330 | Chapter 7 Define and Reference Blocks

■ Space-delimited format (SDF)
■ Drawing interchange format (DXF)
The CDF format produces a file containing one record for each block reference
in a drawing. A comma separates the fields of each record, and single quotation
marks enclose the character fields. Some database applications can read this
format directly.
The SDF format also produces a file containing one record for each block
reference in a drawing. The fields of each record have a fixed width and employ
neither field separators nor character-string delimiters. The dBASE III Copy .
. . SDF operation also produces SDI-format files. The Append From... SDF
operation can read a file in dBASE IV format, which user programs written in
FORTRAN can easily process.
DXF produces a subset of the drawing interchange format containing only
block reference, attribute, and end-of-sequence objects. This option requires
no attribute extraction template. The file extension .dxx distinguishes an
extraction file in DXF format from normal DXF files.
Use the Attribute Extraction File
The attribute extraction file lists values and other information for the attribute
tags you specified in the template file.
If you specified a CDF format using the sample template, the output might
appear as follows:
'DESK', 120.0, 49.5, 'ACME INDUST.', '51-793W', 379.95
'CHAIR', 122.0, 47.0, 'ACME INDUST.', '34-902A', 199.95
'DESK', -77.2, 40.0, 'TOP DRAWER INC.', 'X-52-44',249.95
By default, character fields are enclosed with single quotes (apostrophes). The
default field delimiter is a comma. The following two template records can be
used to override these defaults:
C:QUOTE c (Character string delimiter)
C:DELIM c (Field delimiter)
The first nonblank character following the C:QUOTE or C:DELIM field name
becomes the respective delimiter character. For example, if you want to enclose
character strings with double quotes, include the following line in your
attribute extraction template file:
C:QUOTE "
The quote delimiter must not be set to a character that can appear in a
character field. Similarly, the field delimiter must not be set to a character
that can appear in a numeric field.
Create and Modify Blocks | 331
If you specified an SDF format using the sample template, the file might be
similar to the following example.
(PRICE)(MODEL)(SUPPLIER)(Y)(X)(NAME)
379.9551-793WACME IN-
DUST.
49.5120.0DESK
199.9534-902AACME IN-
DUST.
47.0122.0CHAIR
249.95X-52-44TOP DRAWER
INC.
40.0-77.2DESK
The order of the fields corresponds to the order of the fields in the template
files. You can use these files in other applications, such as spreadsheets, and
you can sort and manipulate the data as needed. See the documentation for
your spreadsheet program for information about how to use data from other
applications. If you open the file in a text editor or a word processor, you can
paste the information back into the drawing as text.
Nested Blocks
The line BL:LEVEL in a template file reports the nesting level of a block
reference. A block that is inserted in a drawing has a nesting level of 1. A block
reference that is part of (nested within) another block has a nesting level of
2, and so on.
For a nested block reference, the X,Y, Z coordinate values, scale factors,
extrusion direction, and rotation angle reflect the actual location, size,
orientation, and rotation of the nested block in the world coordinate system.
In some complex cases, nested block references cannot be correctly represented
with only two scale factors and a rotation angle, for example, if a nested block
reference is rotated in 3D. When this happens, the scale factors and rotation
angle in the extracted file record are set to zero.
Error Handling
If a field is not wide enough for the data that is to be placed in it, the data is
truncated and the following message is displayed:
** Field overflow in record <record number>
332 | Chapter 7 Define and Reference Blocks

This could happen, for example, if you have a BL:NAME field with a width of
8 characters and a block in your drawing has a name 10 characters long.
Modify Blocks
You can modify a block definition or a block reference already inserted in the
drawing.
Modify a Block Definition
When you redefine block definitions in your current drawing, both previous
and future insertions of the block in the drawing are affected.
You can redefine block definitions in your current drawing. Redefining a block
definition affects both previous and future insertions of the block in the current
drawing and any associated attributes.
There are two methods for redefining a block definition:
■ Modify the block definition in the current drawing.
■ Modify the block definition in the source drawing and reinsert it into the
current drawing.
The method you choose depends on whether you want to make changes in
the current drawing only or in a source drawing also.
Modify a Block Definition in the Current Drawing
To modify a block definition, follow the procedure to create a new block
definition, but enter the name of the existing block definition. This replaces
the existing block definition, and all the references to that block in the drawing
are immediately updated to reflect the new definition.
To save time, you can insert and explode an instance of the original block
and then use the resulting objects in creating the new block definition.
Update a Block Definition That Originated from a Drawing File
Block definitions created in your current drawing by inserting a drawing file
are not updated automatically when the original drawing is modified. You
can use INSERT to update a block definition from the drawing file.
Create and Modify Blocks | 333

Update a Block Definition That Originated from a Library Drawing
(Advanced)
Content palette (page 34) does not overwrite an existing block definition in
a drawing with one that comes from another drawing. To update a block
definition that came from a library drawing, use WBLOCK to create a separate
drawing file from the library drawing block. Then, use INSERT to overwrite
the block definition in the drawing that uses the block.
NOTE Block descriptions are stripped off when using INSERT. Use the Clipboard
to copy and paste a block description displayed in the Define Block dialog box
from one block definition to another.
Redefine Block Attributes
You can attach attributes to a block when you define or redefine that block.
When you are prompted to select the objects to include in the block definition,
include the desired attributes in the selection set. Redefining the attributes in
the block definition has the following effects on block references that were
previously inserted:
■ Constant attributes, which have a fixed value, are lost and replaced by any
new constant attributes.
■ Variable attributes remain unchanged, even if the new block definition
has no attributes.
■ New attributes do not appear in the existing block references.
See also:
Attach Data to Blocks (Block Attributes) (page 323)
Modify the Data in Block Attributes
You can edit the values of attributes that are attached to a block and inserted
in a drawing.
You can use any of the following methods to edit the values of attributes
attached to a block:
■ Double-click the block to display the Enhanced Attributes Editor
■ Press Ctrl and double-click the attribute to display the in-place editor
■ Open the Properties Inspector palette and select the block
334 | Chapter 7 Define and Reference Blocks

You can also change the location of attributes in a block using grips. With
multiple-line attributes, you can also move grips to resize the width of the
text.
See also:
Modify a Block Definition (page 333)
Modify a Block Attribute Definition
You can edit the values and other properties of all attributes that are already
attached to a block and inserted in a drawing.
You can modify attributes in block definitions with the Block Attribute
Manager. For example, you can modify the following:
■ Properties that define how values are assigned to an attribute and whether
or not the assigned value is visible in the drawing area
■ Properties that define how attribute text is displayed in the drawing
■ Properties that define the layer that the attribute is on and the attribute
line's color, weight, and type
By default, attribute changes you make are applied to all existing block
references in the current drawing.
Changing the attribute properties of existing block references does not affect
the values assigned to those blocks. For example, in a block containing an
attribute whose tag is Cost and value is 19.99, the 19.99 value is unaffected
if you change the tag from Cost to Unit Cost.
Updating attributes with duplicate tag names can lead to unpredictable results.
Use the Block Attribute Manager to find duplicate tags and change tag names.
If constant attributes or nested attributed blocks are affected by your changes,
use REGEN to update the display of those blocks in the drawing area.
Change the Prompt Order for Attribute Values
When you define a block, the order in which you select the attributes
determines the order in which you are prompted for attribute information
when you insert the block. You can use the Block Attribute Manager to change
the order of prompts that request attribute values.
Create and Modify Blocks | 335

Remove Block Attributes
You can remove attributes from block definitions and from all existing block
references in the current drawing. Attributes removed from existing block
references do not disappear in the drawing area until you regenerate the
drawing using REGEN.
You cannot remove all attributes from a block; at least one attribute must
remain. If you need to remove all attributes, redefine the block.
Update Block References
You can update attributes in all block references in the current drawing with
changes you made to the block definition. For example, you may have used
the Block Attribute Manager to modify attribute properties in several block
definitions in your drawing but elected not to automatically update existing
block references when you made the changes. Now that you are satisfied with
the attribute changes you made, you can apply those changes to all blocks in
the current drawing.
You can also use ATTSYNC to update attribute properties in block references
to match their block definition, or to update a block instance after you redefine
a block attribute using BLOCK, -BLOCK, or BEDIT.
Updating attribute properties in block references does not affect any values
that have been assigned to those attributes.
Edit Attributes in a Block Reference
You can select an attribute in a block reference and use the Properties Inspector
palette to change its properties, or you can use the Enhanced Attribute Editor
to modify all the attributes in a selected block reference.
See also:
Define Block Attributes (page 325)
Modify a Block Definition (page 333)
Disassemble a Block Reference (Explode)
If you need to modify one or more objects within a block separately, you can
disassemble, or explode, the block reference into its component objects.
336 | Chapter 7 Define and Reference Blocks

After making the changes, you can
■ Create a new block definition
■ Redefine the existing block definition
■ Leave the component objects uncombined for other uses
When you explode a block reference, the block reference is disassembled into
its component objects; however, the block definition still exists in the drawing
for insertion later.
You can automatically explode block references as you insert them by selecting
the Explode option in the Insert Block dialog box.
Create and Modify Blocks | 337

338

Work with 3D Models
Create 3D Models
Use 3D models to help you visualize and test your designs.
Overview of 3D Modeling
AutoCAD 3D modeling allows you to create drawings using solid, surface, and
mesh objects.
Solid, surface, and mesh objects offer different functionality, that, when used
together, offer a powerful suite of 3D modeling tools. For example, you can
convert a primitive solid to a mesh to take advantage of mesh creasing and
smoothing. You can then convert the model to a surface to take advantage of
associativity and NURBS modeling.
Solid Modeling
A solid model is an enclosed 3D body that has properties such as mass, volume,
center of gravity, and moments of inertia.
8
339
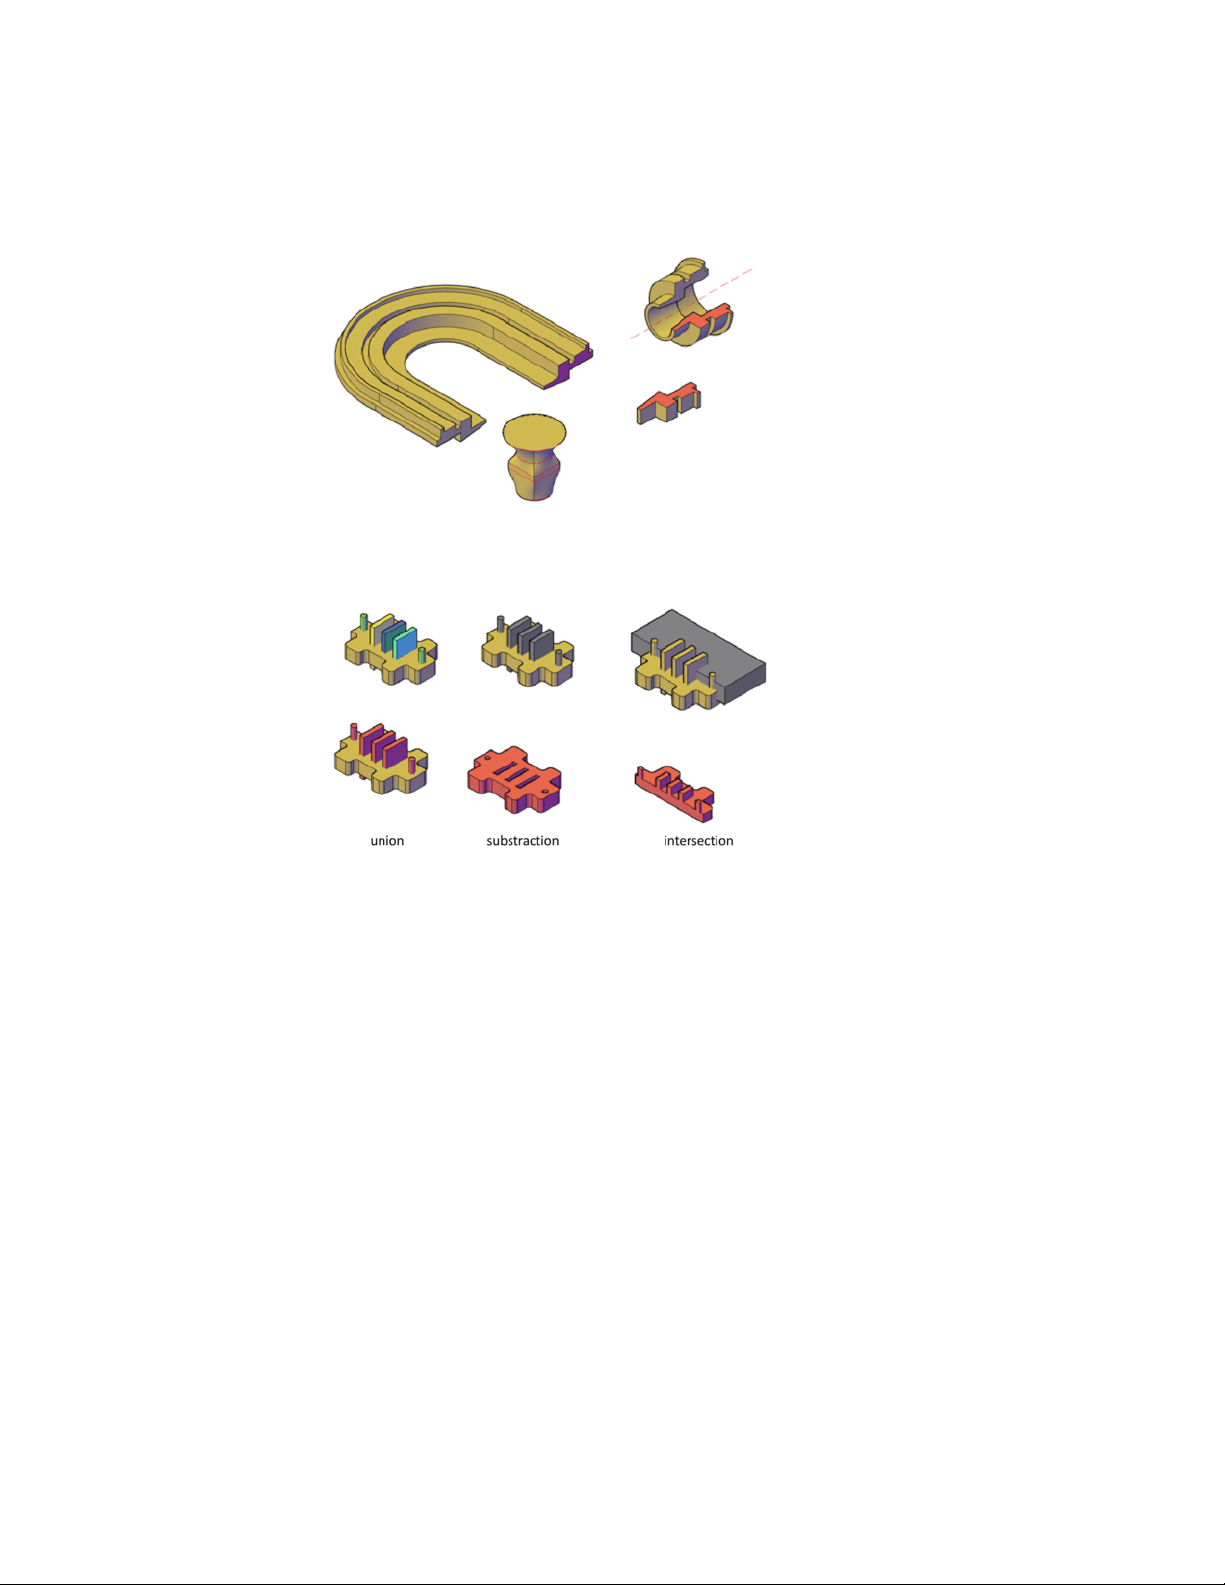
Start with primitive solids such as cones, boxes, cylinders, and pyramids and
modify and recombine them to create new shapes. Or draw a custom extrusion
and use various sweeping operations to create solids from 2D curves and lines.
Surface Modeling
A surface model is a thin shell that does not have mass or volume. AutoCAD
offers two types of surfaces: procedural and NURBS. Use prodecural surfaces
to take advantage of associative modling, and use NURBS surfaces to take
advantage of sculpting with control vertices.
A typical modeling workflow is to create a basic model using mesh, solids,
and procedural surfaces, and then convert them to NURBS surfaces. This allows
you to utilize not only the unique tools and primitive shapes offered by solids
and meshes, but also the shaping capabilities provided by surfaces - associative
modeling and NURBS modeling.
340 | Chapter 8 Work with 3D Models
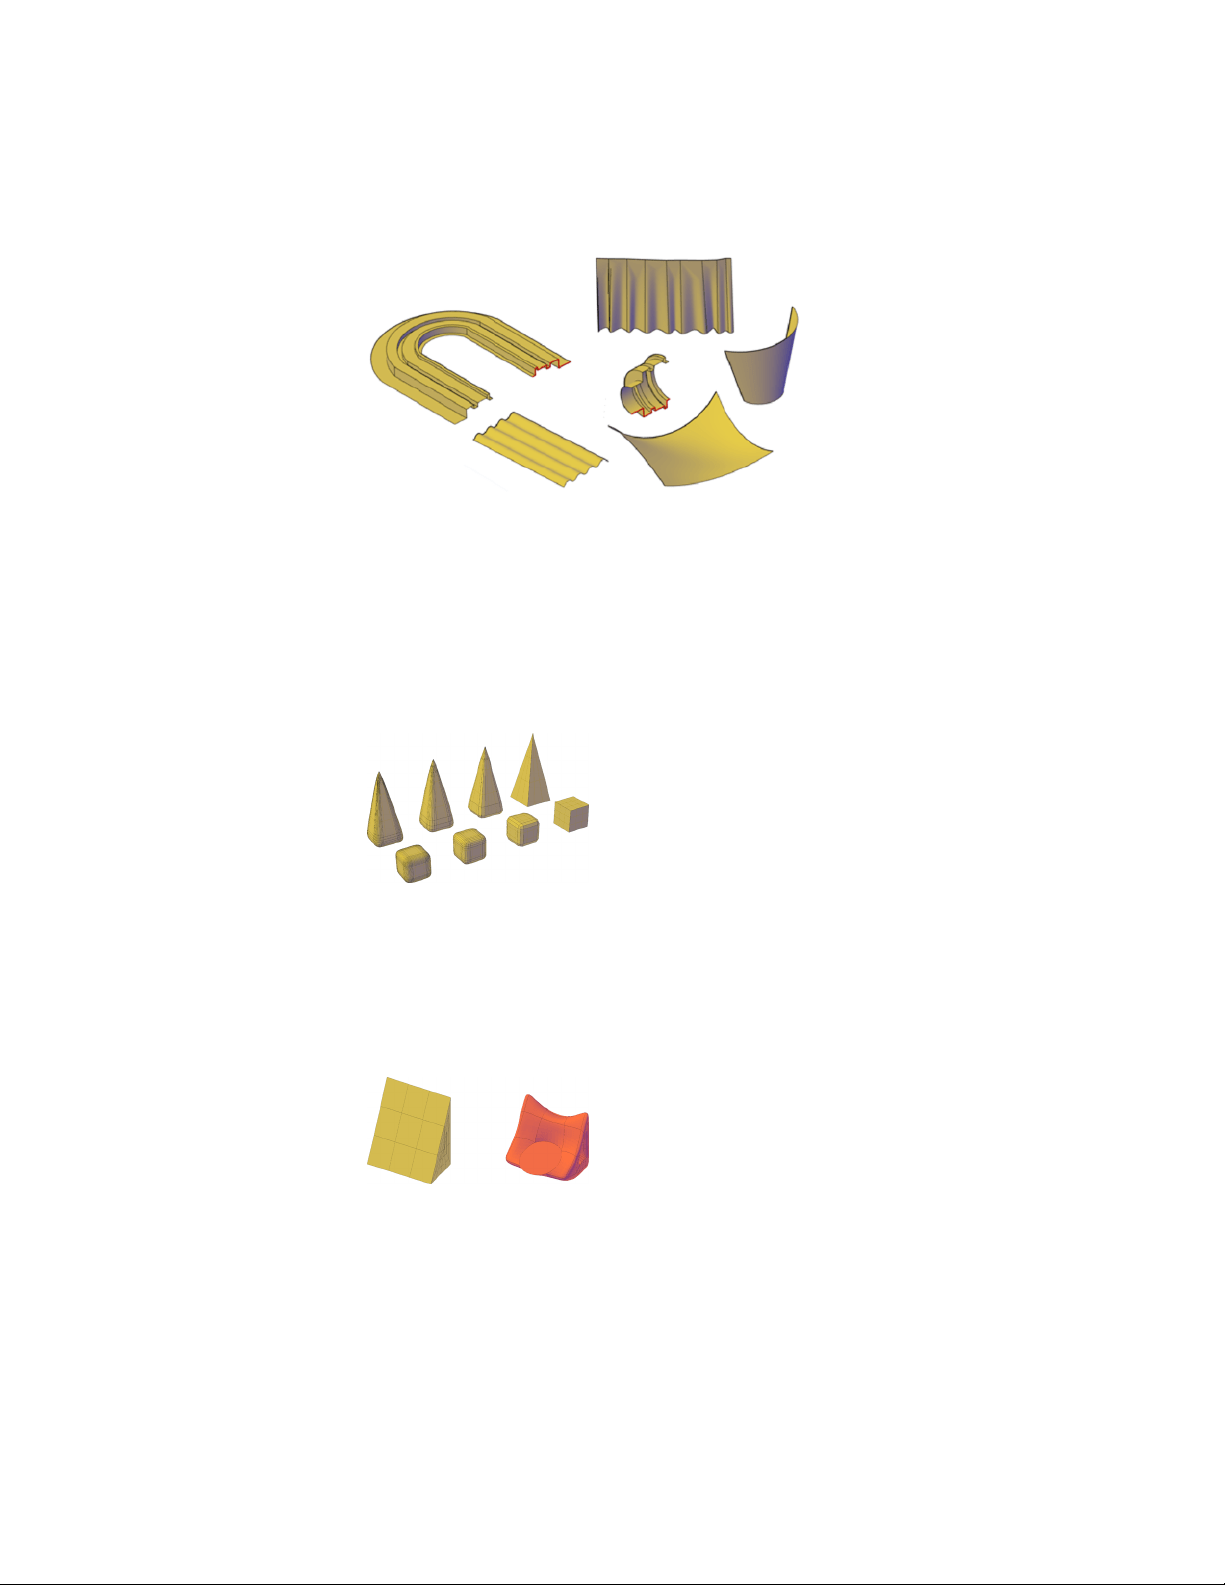
You create surface models using some of the same tools that you use for solid
models: sweeping, lofting, extruding, and revolving. You can also create
surfaces by blending, patching, offsetting, filleting, and extending other
surfaces.
Mesh Modeling
A mesh model consists of vertices, edges, and faces that use polygonal
representation (including triangles and quads) to define a 3D shape.
Unlike solid models, mesh has no mass properties. However, as with 3D solids,
you can create primitive mesh forms such as boxes, cones, and pyramids,
starting in AutoCAD 2010. You can modify mesh models in ways that are not
available for 3D solids or surfaces. For example you can apply creases, splits,
and increasing levels of smoothness. You can drag mesh subobjects (faces,
edges, and vertices) to deform the object. To achieve more granular results,
you can refine the mesh in specific areas before modifying it.
Create 3D Models | 341

Use mesh models to provide the hiding, shading, and rendering capabilities
of a solid model without the physical properties such as mass, moments of
inertia, and so on.
Advantages of 3D Modeling
Modeling in 3D has several advantages. You can
■ View the model from any vantage point
■ Generate reliable standard and auxiliary 2D views automatically
■ Create sections and 2D drawings
■ Remove hidden lines and do realistic shading
■ Check interferences and perform engineering analysis
■ Add lighting and create realistic rendering
■ Navigate through the model
■ Use the model to create an animation
■ Extract manufacturing data
See also:
Enter 3D Coordinates (page 161)
Control the User Coordinate System (UCS) (page 150)
Use the Dynamic UCS with Solid Models (page 152)
Create Solids and Surfaces from Lines and
Curves
Use lines and curves to extrude, sweep, loft, and revolve 3D solids, surfaces,
and NURBS surfaces.
Overview of Creating Solids and Surfaces
Understand the differences between creating solids and surfaces with the
EXTRUDE, SWEEP, LOFT, and REVOLVE commands.
342 | Chapter 8 Work with 3D Models
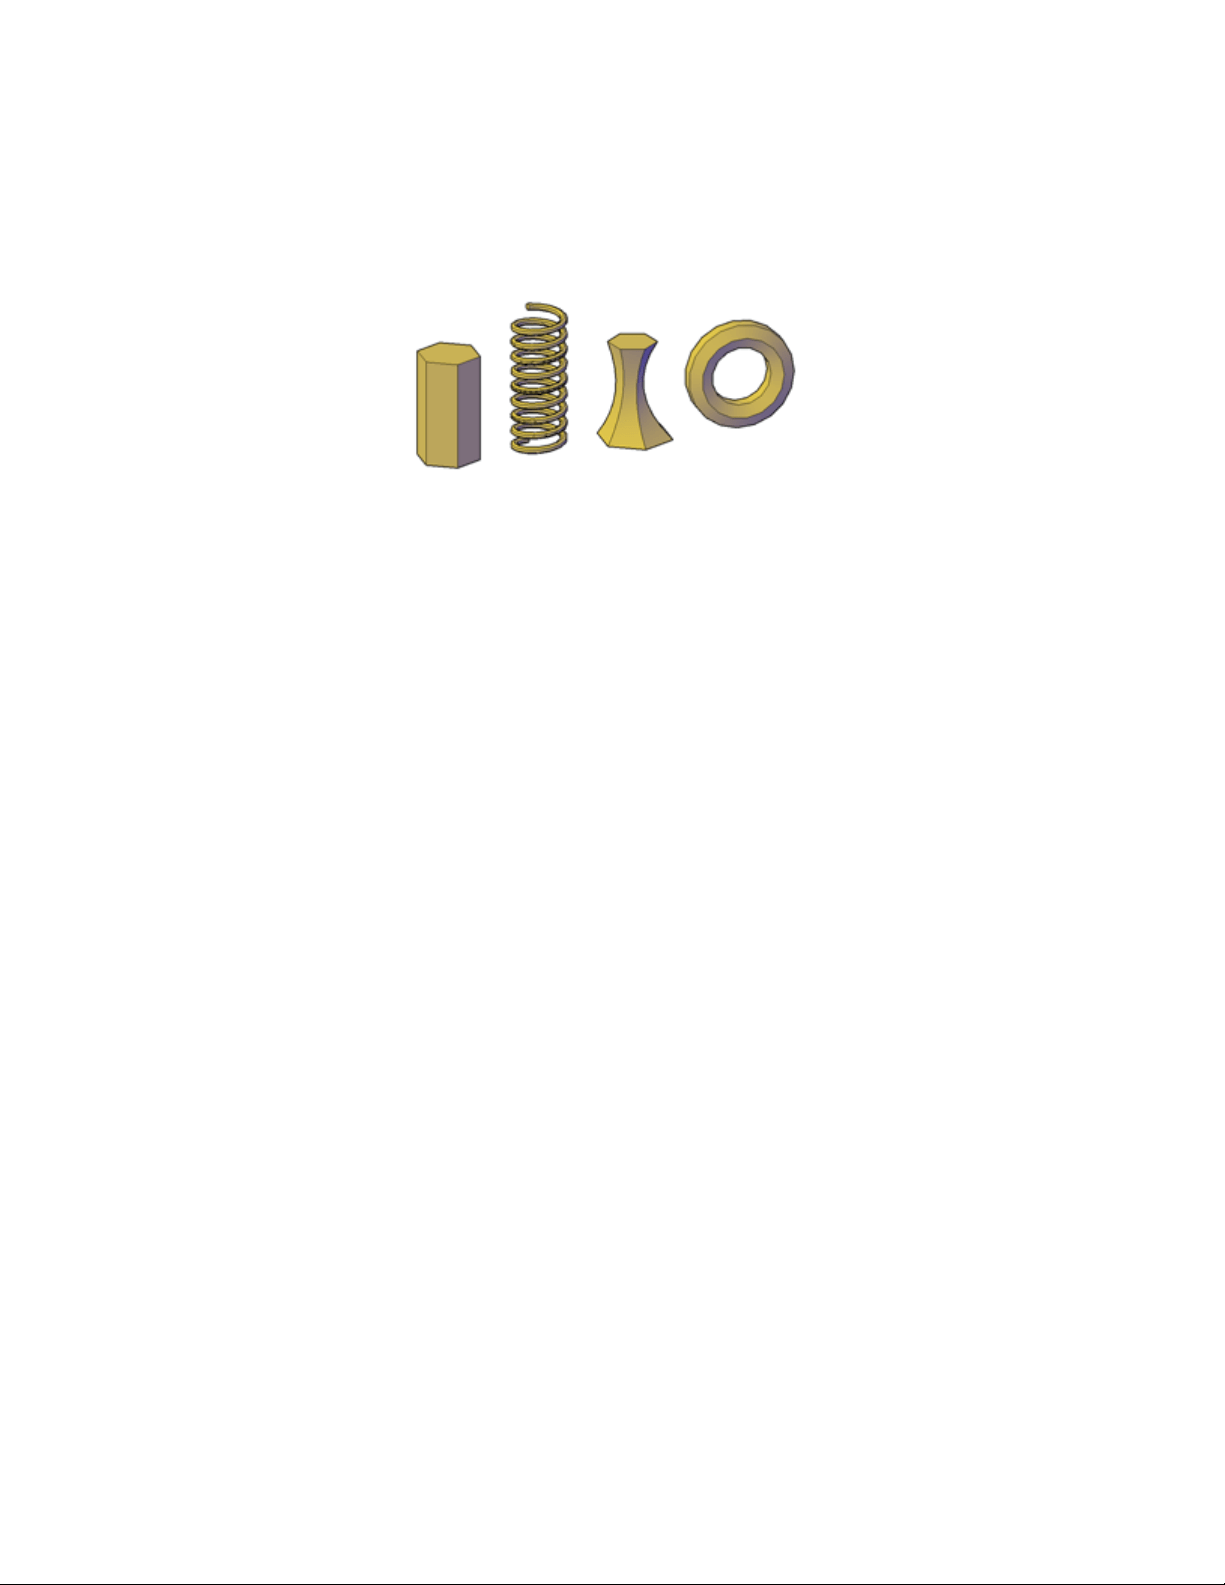
Create Surfaces or Solids With the Same Commands
When you extrude, sweep, loft, and revolve curves, you can create both solids
and surfaces. Open curves always create surfaces, but closed curves can create
either solids or surfaces depending on the situation.
If you select a closed curve and click EXTRUDE, SWEEP, LOFT, and REVOLVE
on the ribbon, you create:
■ A solid if the Mode option is set to Solid.
■ A surface if the Mode option is set to Surface.
■ A procedural surface if the SURFACEMODELINGMODE system
variable is set to 0.
■ A NURBS surface if the SURFACEMODELINGMODE system variable
is set to 1.
■ An associative surface if the SURFACEASSOCIATIVITY system variable
is on.
In this illustration, the same profile creates a solid (left), a procedural surface
(middle), and a NURBS surface (right).
Create 3D Models | 343
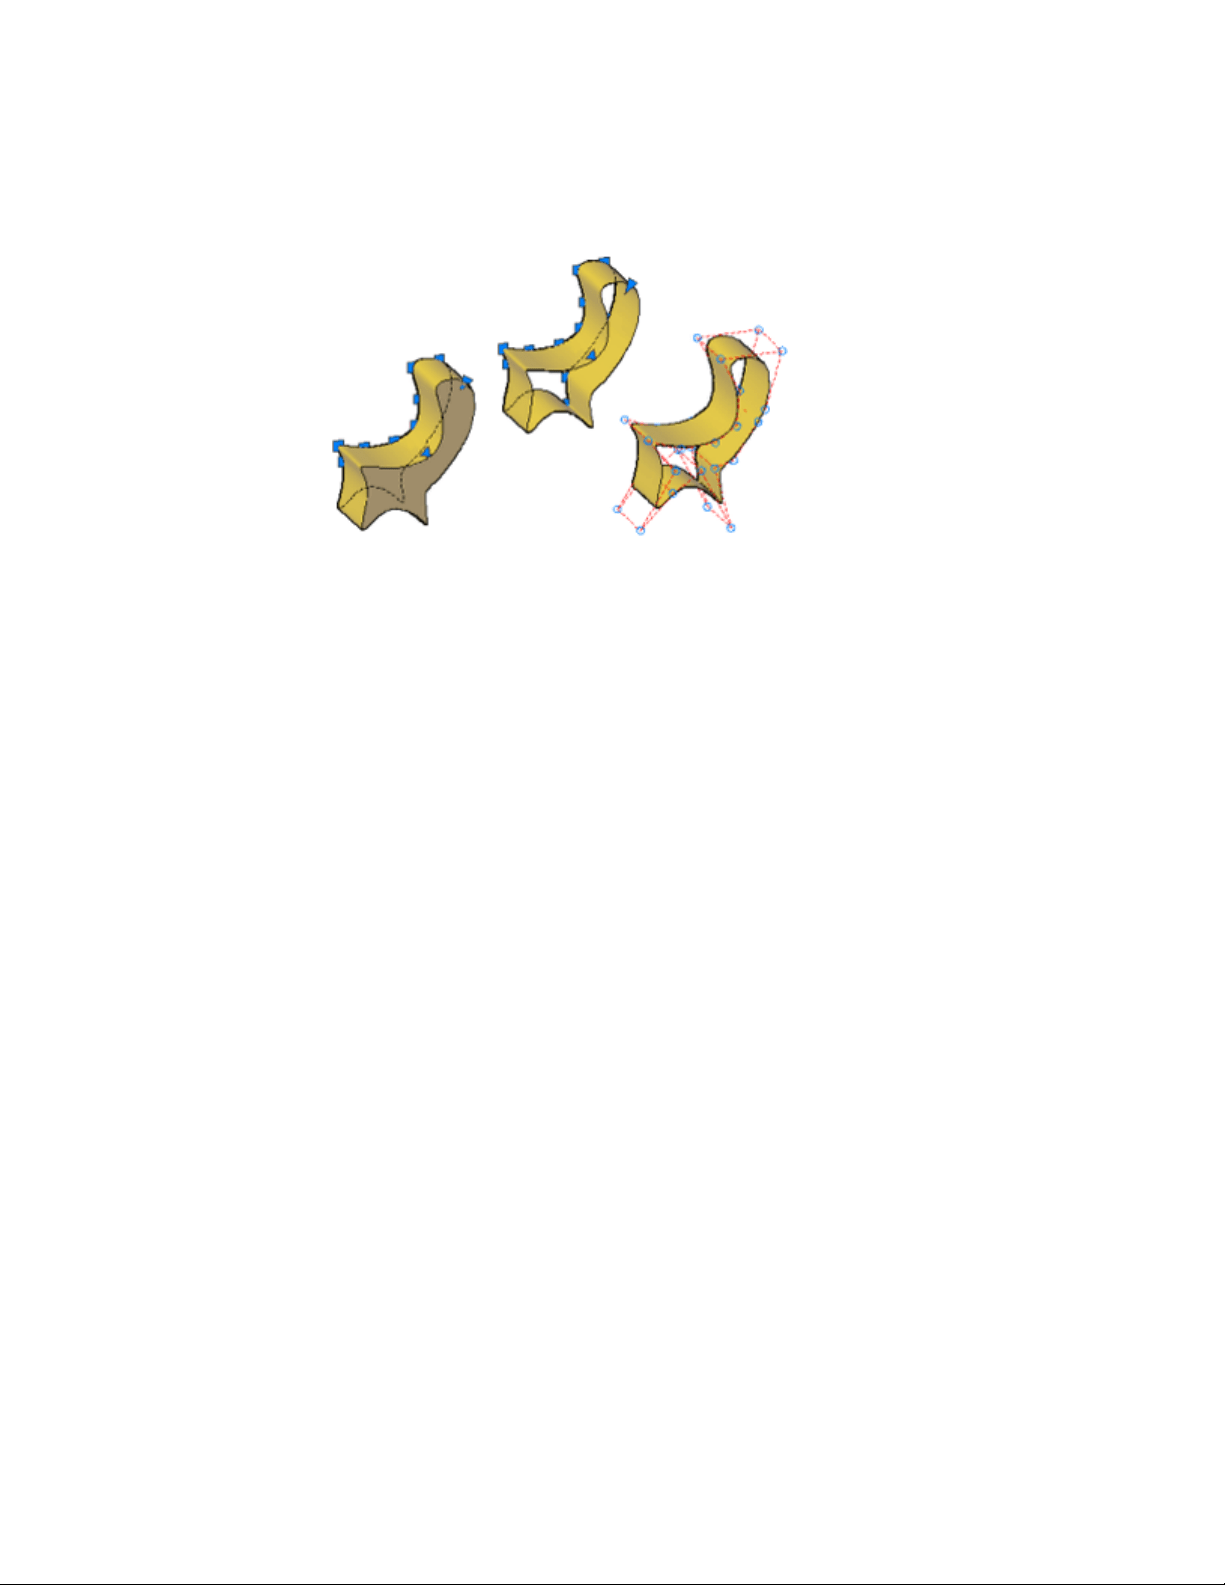
Geometry That Can Be Used As Profiles and Guide Curves
The curves that you use as profile and guide curves when you extrude, sweep,
loft, and revolve can be:
■ Open or closed
■ Planar or non-planar
■ Solid and surface edge subobjects
■ A single object (to extrude multiple lines, convert them to a single object
with the JOIN command)
■ A single region (to extrude multiple regions, convert them to a single object
with the REGION command)
Example: Use Splines to Create 3D NURBS Surfaces
Splines are one of the many 2D object types that can be lofted, extruded,
swept, and revolved to create NURBS surfaces. Other 2D objects that can be
used include lines, polylines, arcs, and circles. Splines, however, are the only
2D object customized to create NURBS surfaces. Because they allow you to
adjust tolerance, degree, and tangency, they are better suited than other types
of 2D profiles (line, plines, circles) for surface modeling.
344 | Chapter 8 Work with 3D Models
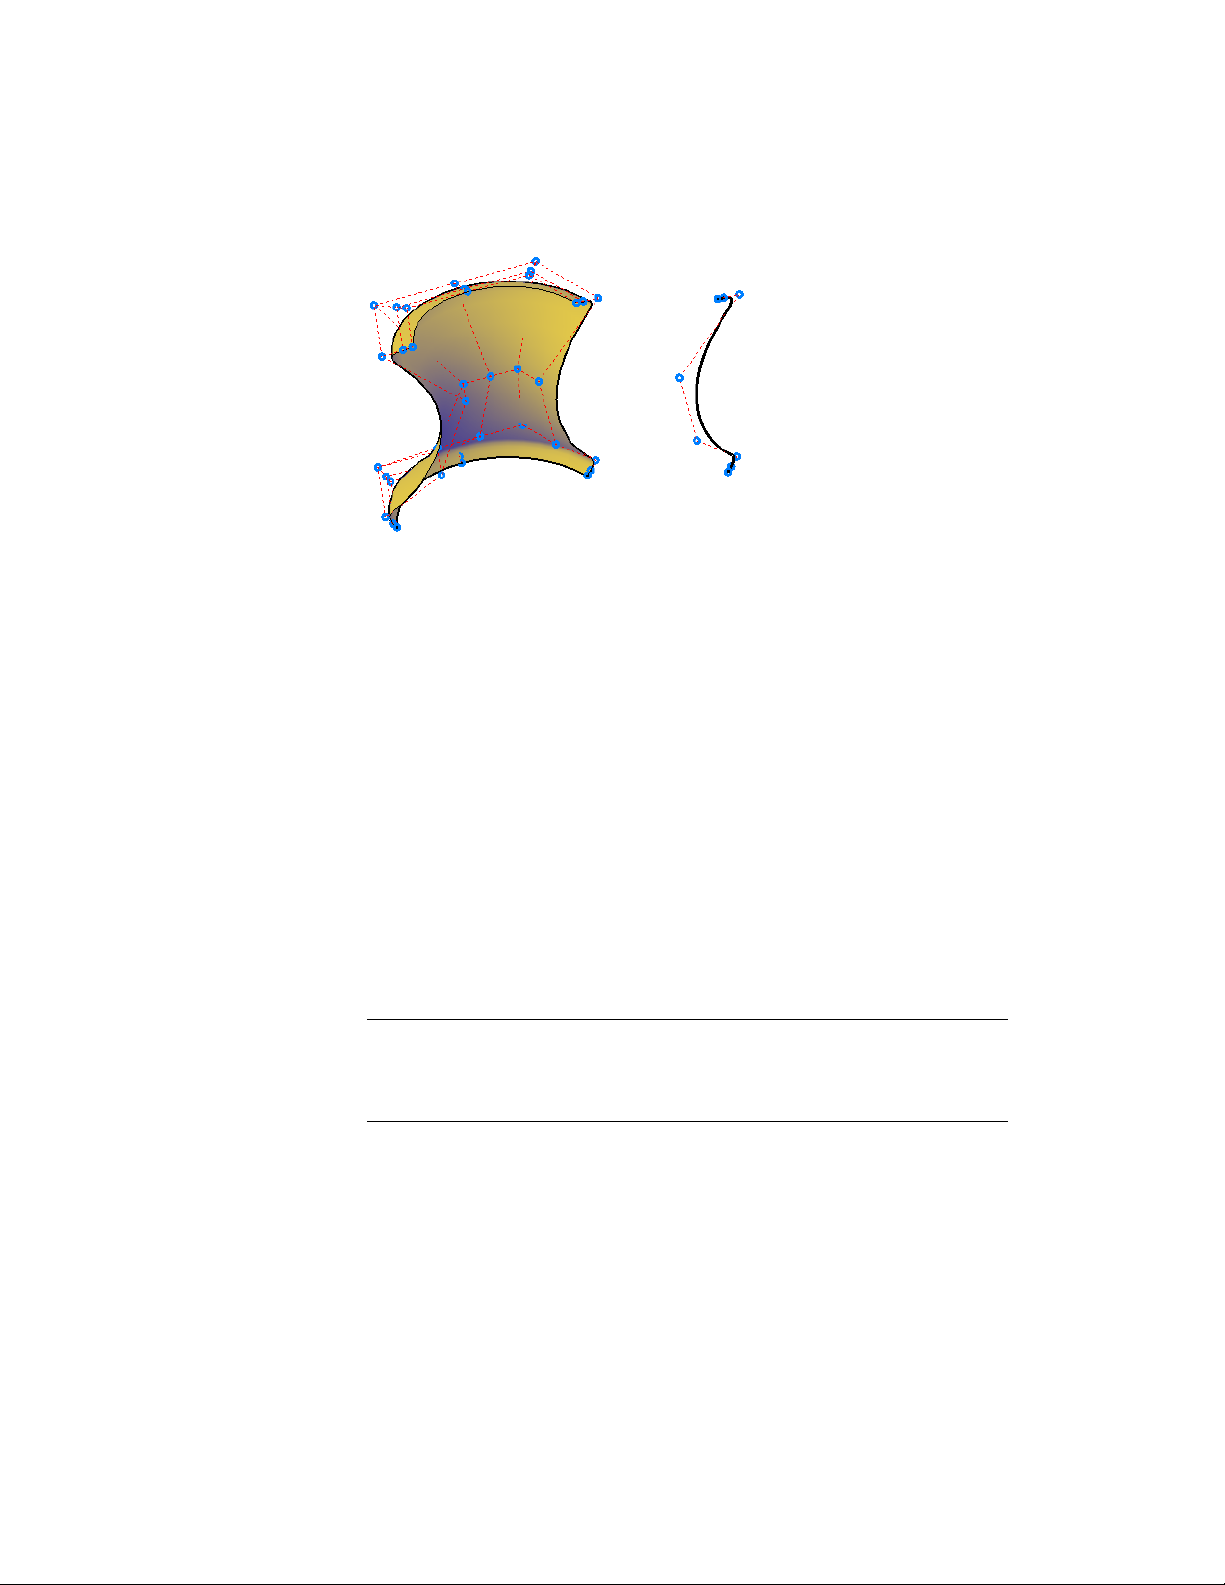
Many of the same commands used with NURBS surfaces, can also be used
with CV splines. These include:
■ CVADD
■ CVREMOVE
■ CVREBUILD
■ CVSHOW
■ CVHIDE
For more information, see Create Solids and Surfaces from Lines and Curves
(page 342).
Create Associative Surfaces
Surfaces can be associative while solids cannot. If surface associativity is on
when a surface is created, it maintains a relationship with the curve from
which it is was generated (even if the curve is the subobject of another solid
or surface). If the curve is reshaped, the surface profile automatically updates.
See Create Associative Surfaces (page 380).
NOTE To modify a surface that is associative, you must modify the generating
curve and not the surface itself. If you reshape the surface, its link to the generating
curve will be broken and the surface will lose associativity and become a generic
surface.
Deleting the Curves that Generate the Solid or Surface
The DELOBJ system variable controls whether the curves that generate an
object are automatically deleted after the solid or surface is created. However,
Create 3D Models | 345
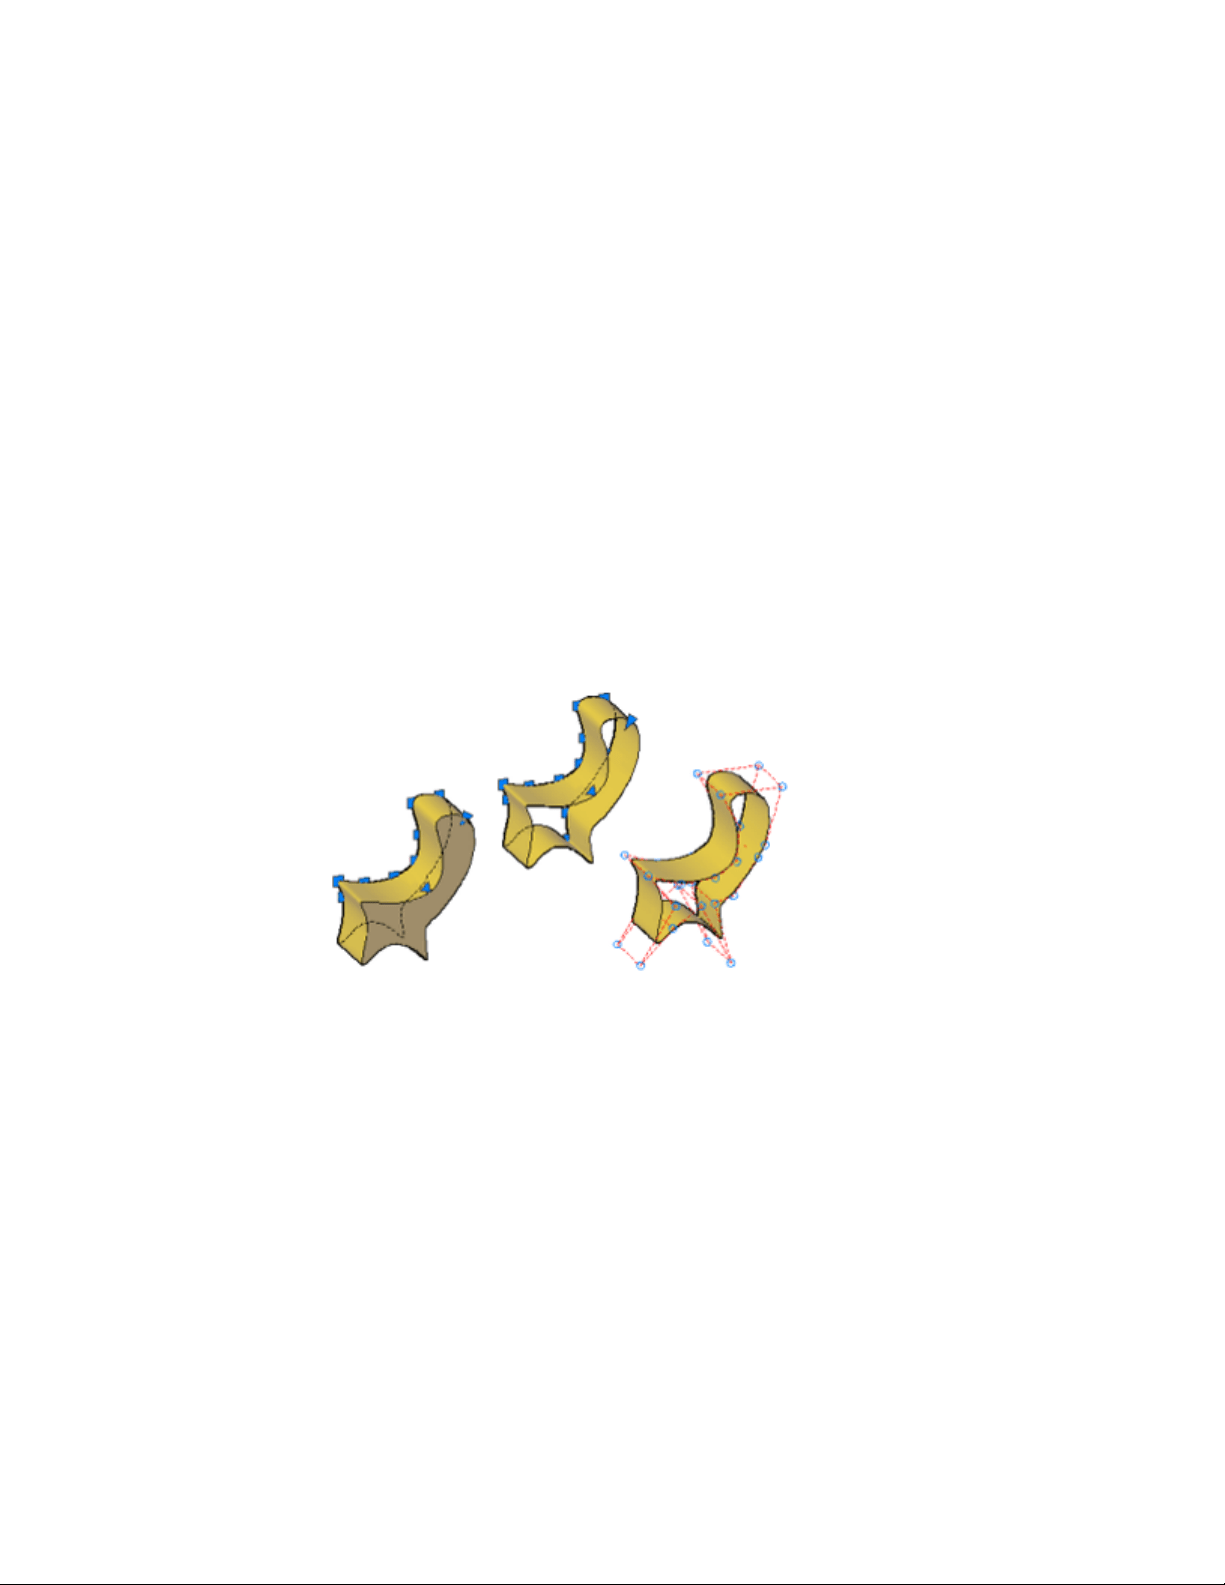
if surface associativity is on, the DELOBJ setting is ignored and the generating
curves are not deleted.
See also:
Create a Solid or Surface by Extruding (page 346)
Create a Solid or Surface by Sweeping (page 348)
Create a Solid or Surface by Lofting (page 350)
Create a Solid or Surface by Revolving (page 352)
Create a Solid or Surface by Extruding
Create a 3D solid or surface by stretching curves into 3D space.
The EXTRUDE command creates a solid or surface that extends the shape of
a curve. Open curves create surfaces and closed curves create solids or surfaces.
See Overview of Creating Solids and Surfaces (page 342).
Options for Extrusion
When you extrude objects, you can specify any of the following options:
■ Mode. Sets whether the extrude creates a surface or a solid.
■ Specify a path for extrusion. With the Path option, create a solid or
surface by specifying an object to be the path for the profile, or shape, of
the extrusion. The extruded object starts from the plane of the profile and
ends on a plane perpendicular to the path at the endpoint of the path. For
best results, use object snaps to make sure that the path is on or within
the boundary of the object being extruded.
346 | Chapter 8 Work with 3D Models
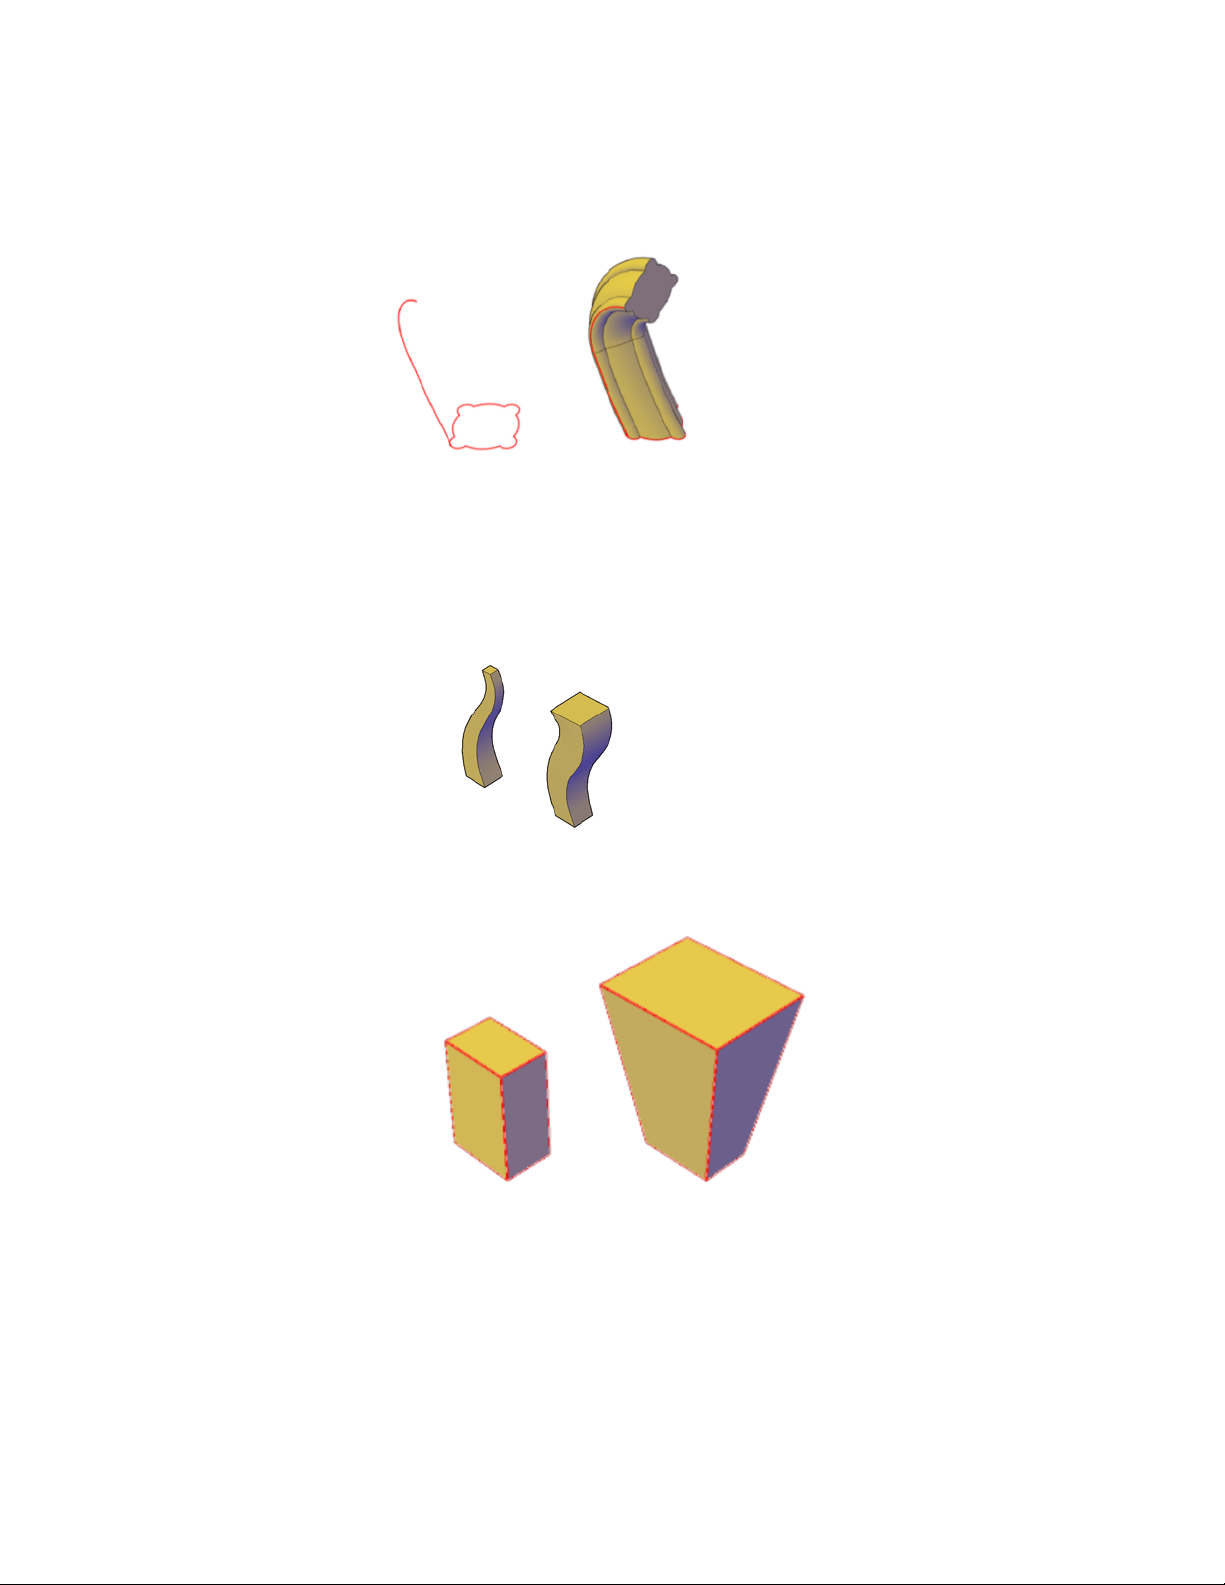
Extruding is different from sweeping. When you extrude a profile along a
path, the profile follows the shape of the path, even if the path does not
intersect the profile. Sweeping usually provides greater control and better
results.
■ Taper angle. Tapering the extrusion is useful for defining part that require
a specific taper angle, such as a mold used to create metal products in a
foundry.
■ Direction. With the Direction option, you can specify two points to set
the length and direction of the extrusion.
Create 3D Models | 347
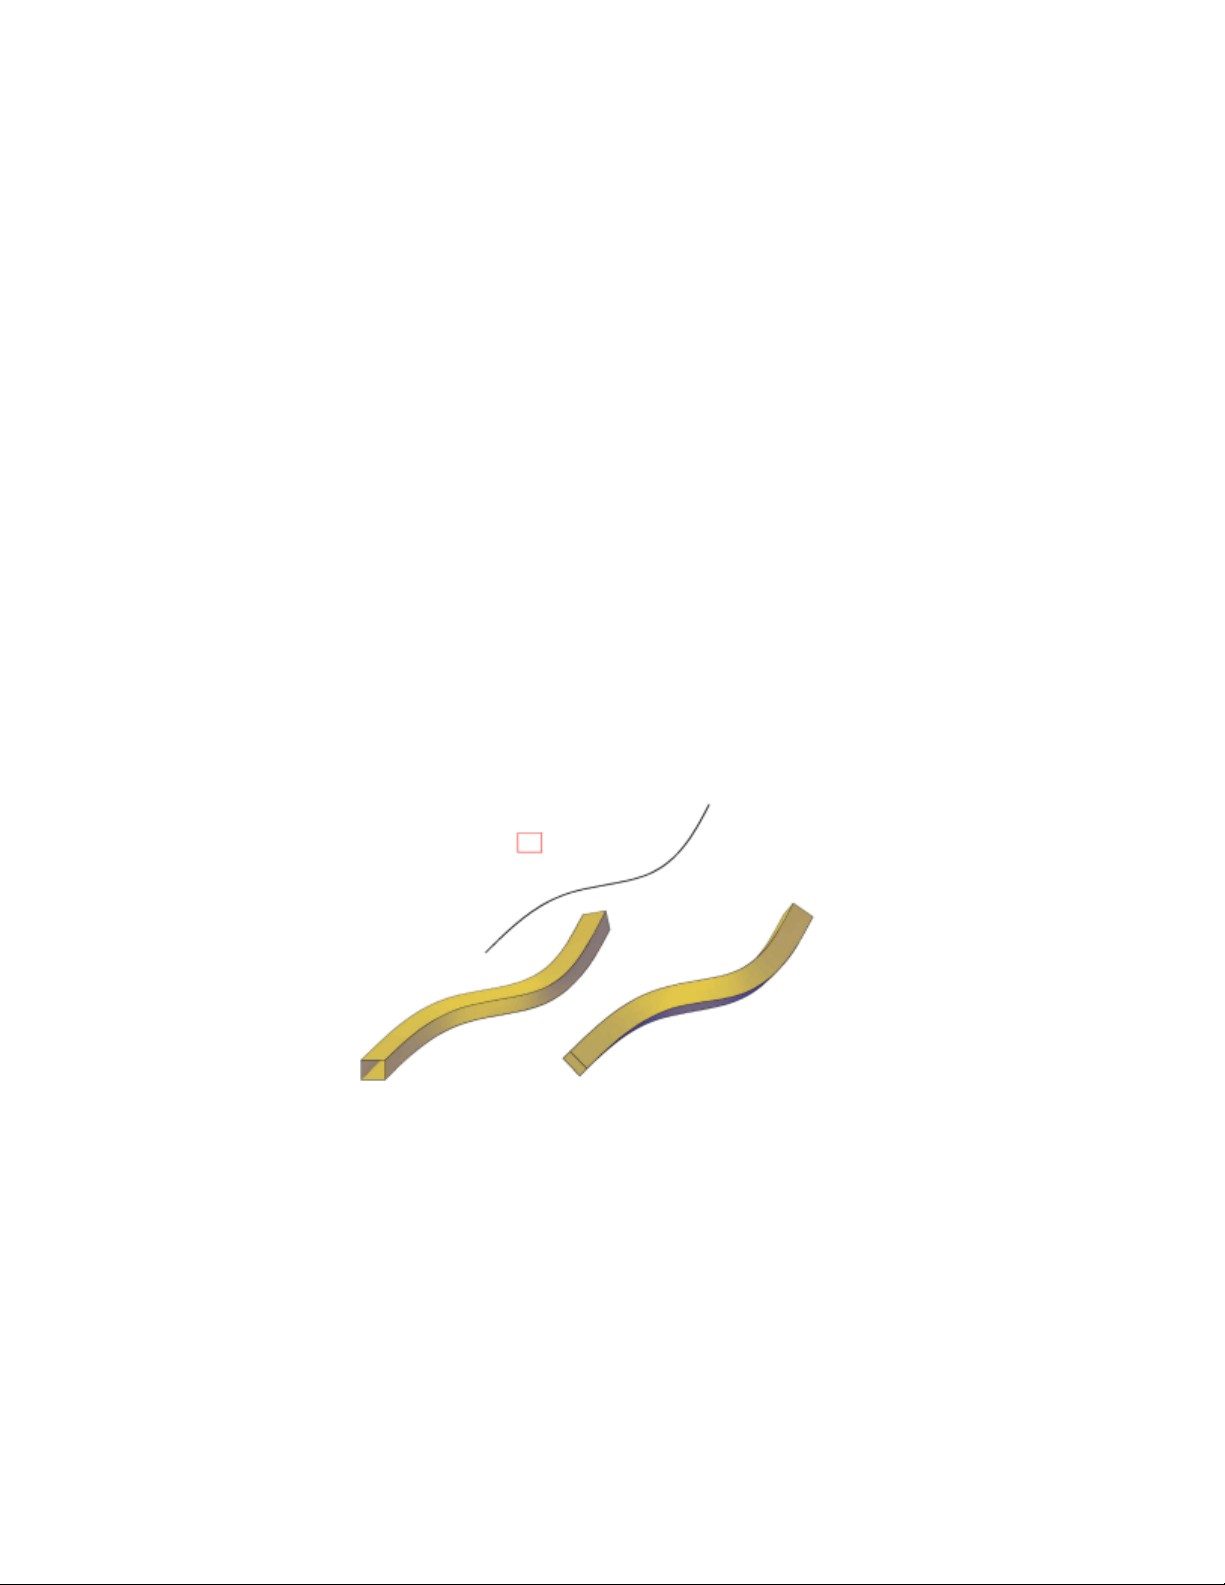
■ Expression. Enter a mathematical expression to constrain the height of
the extrusion. See Create Geometric Relationships between Associative
Surfaces (page 381).
Create a Solid or Surface by Sweeping
Create a 3D solid or surface by sweeping a profile along a path.
The SWEEP command creates a solid or surface by extending a profile shape
(the object that is swept) along a specified path. When you sweep a profile
along a path, the profile is moved and aligned normal (perpendicular) to the
path. Open profiles create surfaces and closed curves create solids or surfaces.
See Overview of Creating Solids and Surfaces (page 342).
You can sweep more than one profile object along a path.
Options for Sweeping
When you extrude objects, you can specify any of the following options:
■ Mode. Sets whether the sweep creates a surface or a solid.
■ Alignment. If the profile is not on the same plane as the sweep path,
specify how the profile aligns with the sweep path.
■ Base Point. Specify a base point on the profile to sweep along the profile.
■ Scale. Specify a value that will change the size of the object from the
beginning of the sweep to the end. Enter a mathematical expression to
constrain the object scaling. See Create Geometric Relationships between
Associative Surfaces (page 381).
348 | Chapter 8 Work with 3D Models
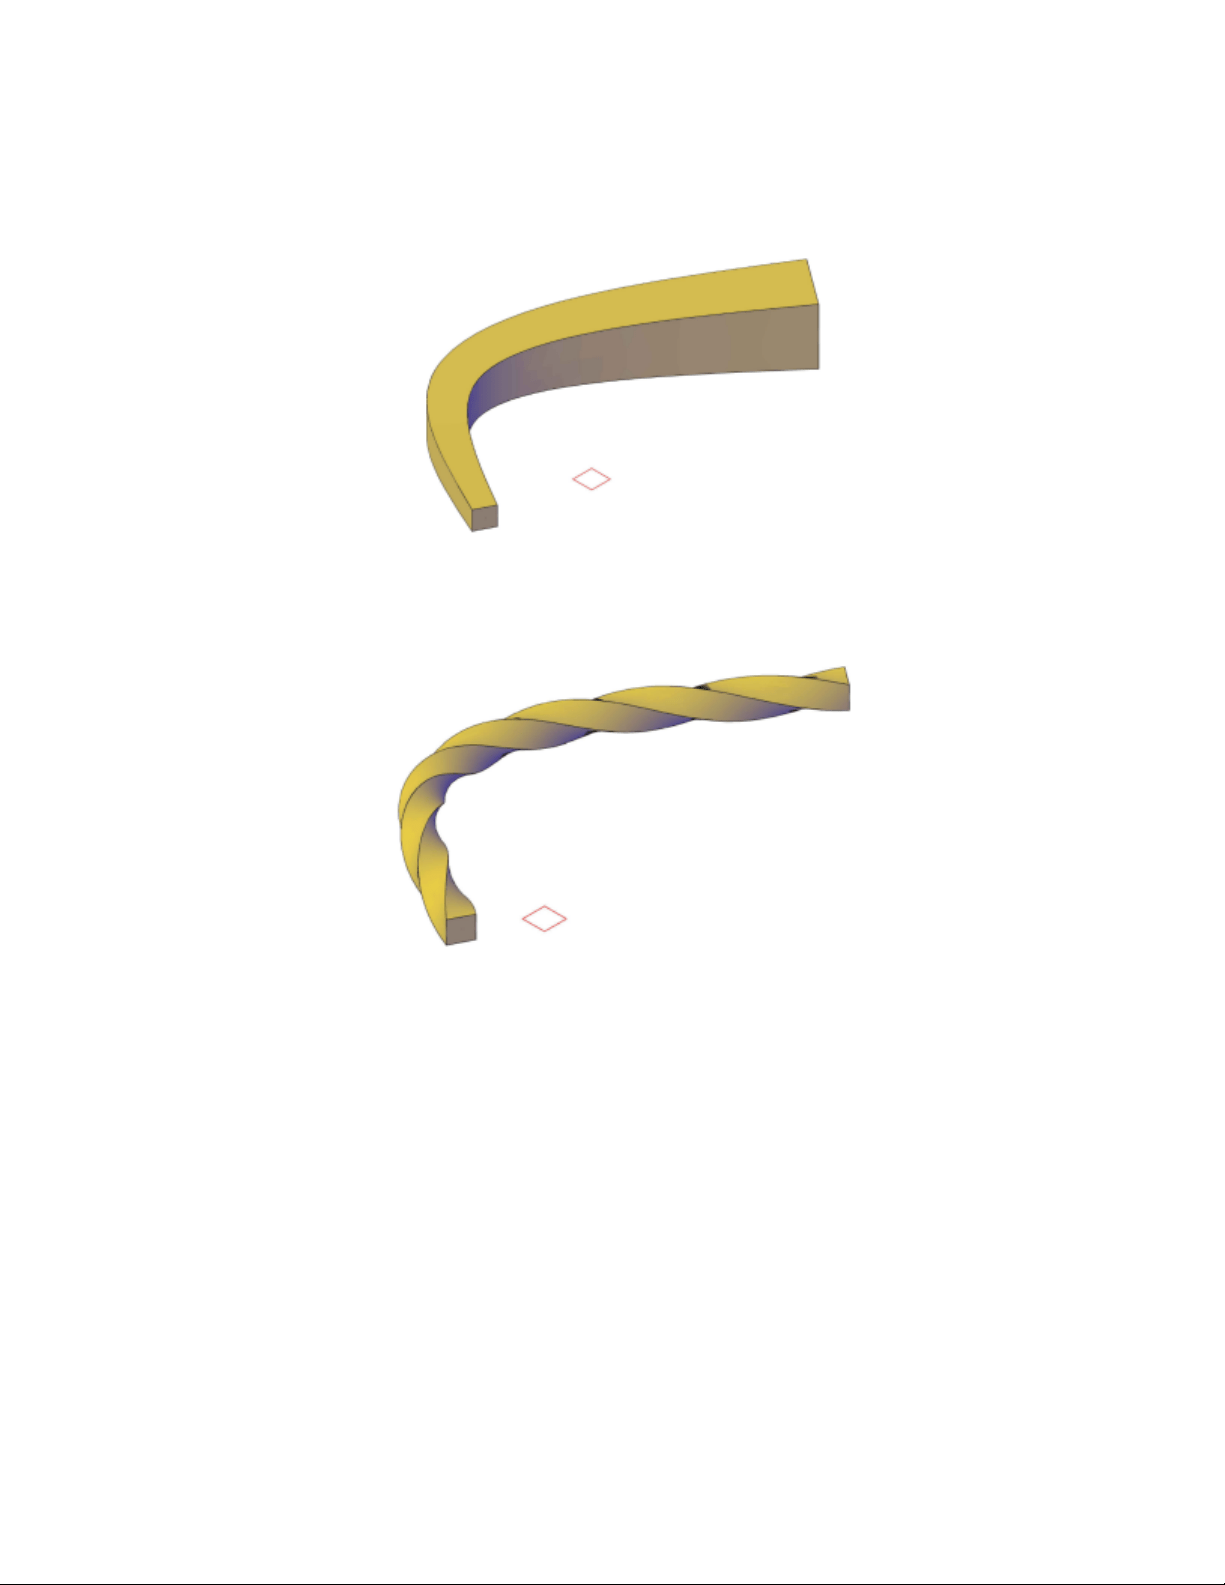
■ Twist. By entering a twist angle, the object rotates along the length of
the profile. Enter a mathematical expression to constrain the object ‘s twist
angle. See Create Geometric Relationships between Associative Surfaces
(page 381).
See also:
Create Associative Surfaces (page 380)
Create Geometric Relationships between Associative Surfaces (page 381)
Draw Splines (page 210)
Modify Splines (page 274)
Create 3D Models | 349
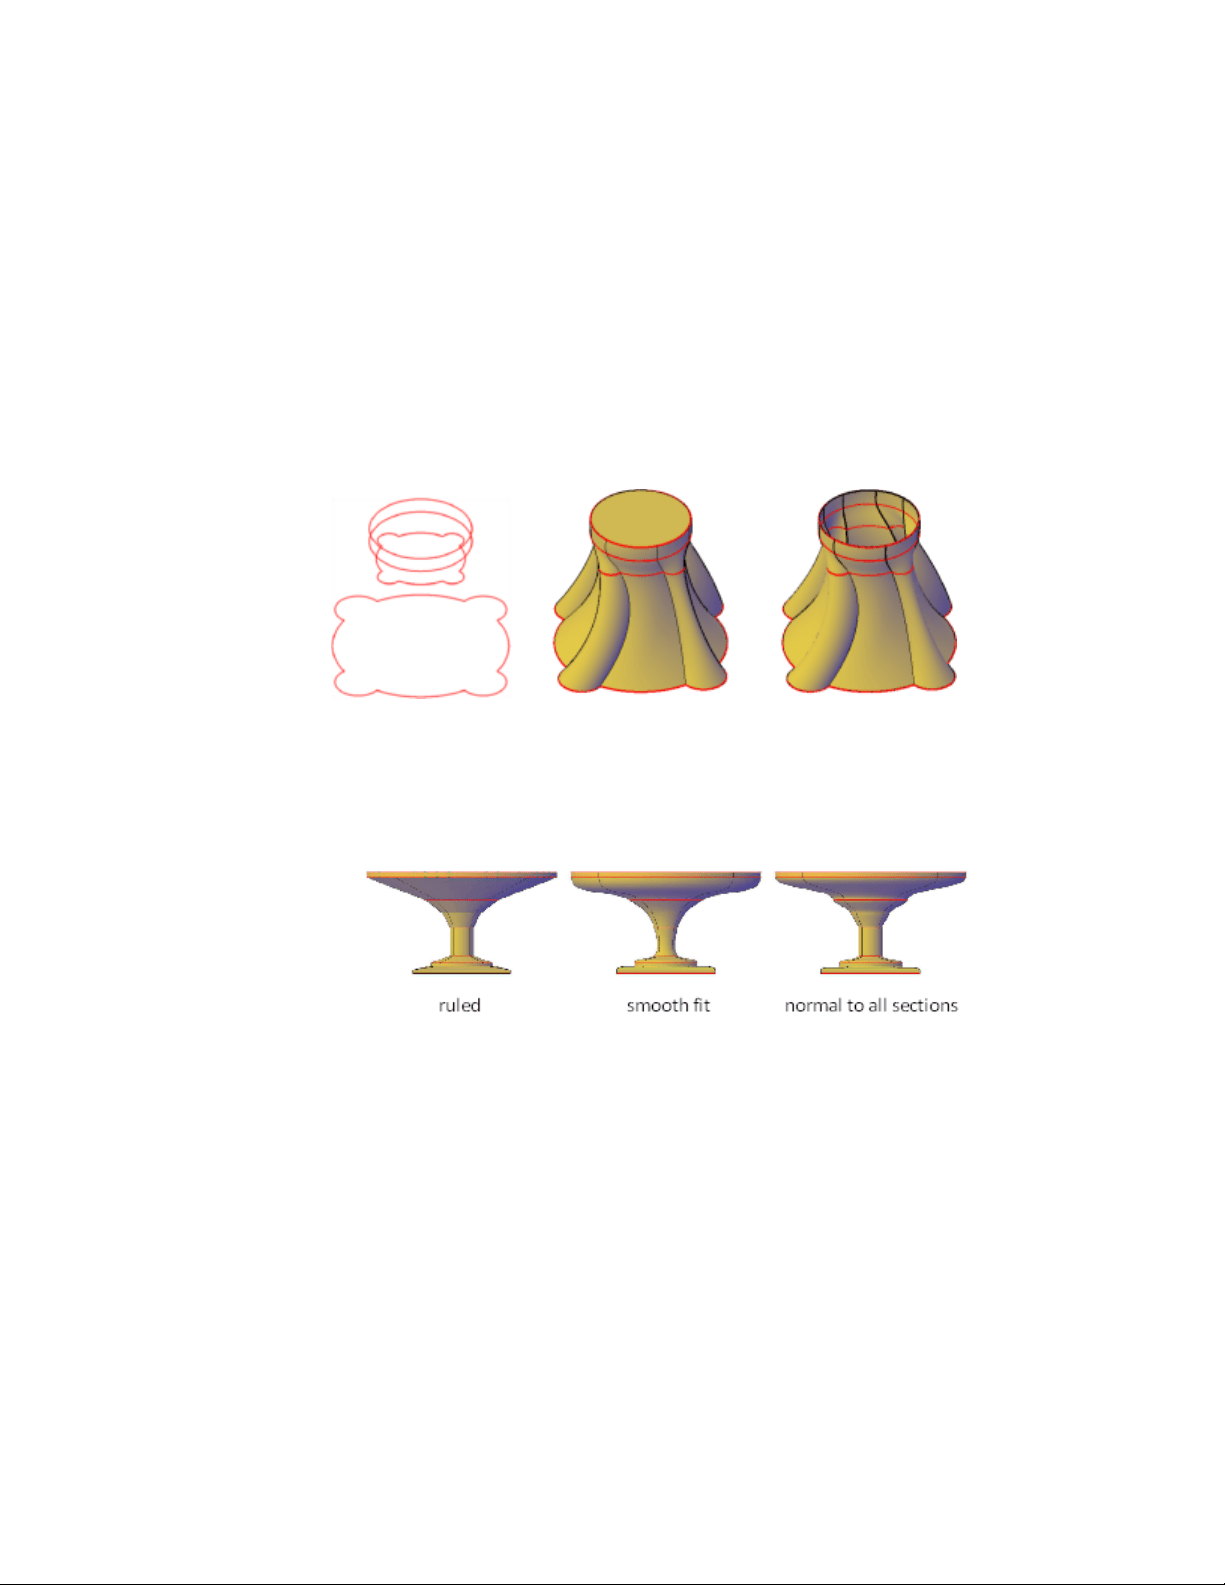
Create a Solid or Surface by Lofting
Create a 3D solid or surface by lofting a profile through a set of two or more
cross-section profiles.
The cross-section profiles define the shape of the resulting solid object.
Cross-section profiles can be open or closed curves. Open curves create surfaces
and closed curves create solids or surfaces. See Overview of Creating Solids
and Surfaces (page 342).
Options for Lofting
■ Mode. Sets whether the loft creates a surface or a solid.
■ Cross-section profiles. Select a series of cross-section profiles to define
the shape of the new 3D object.
lofted objects with different cross-section settings
As you create a lofted object, you can adjust its shape by specifying how
the profile passes through the cross sections (for example, a sharp or smooth
curve). You can also modify the settings later in the Properties Inspector.
For more information, see Modify Properties of 3D Solid, Surface, and Mesh
(page 441).
■ Paths. Specify a path for the loft operation to obtain more control over
the shape of the lofted object. For best results, start the path curve on the
350 | Chapter 8 Work with 3D Models
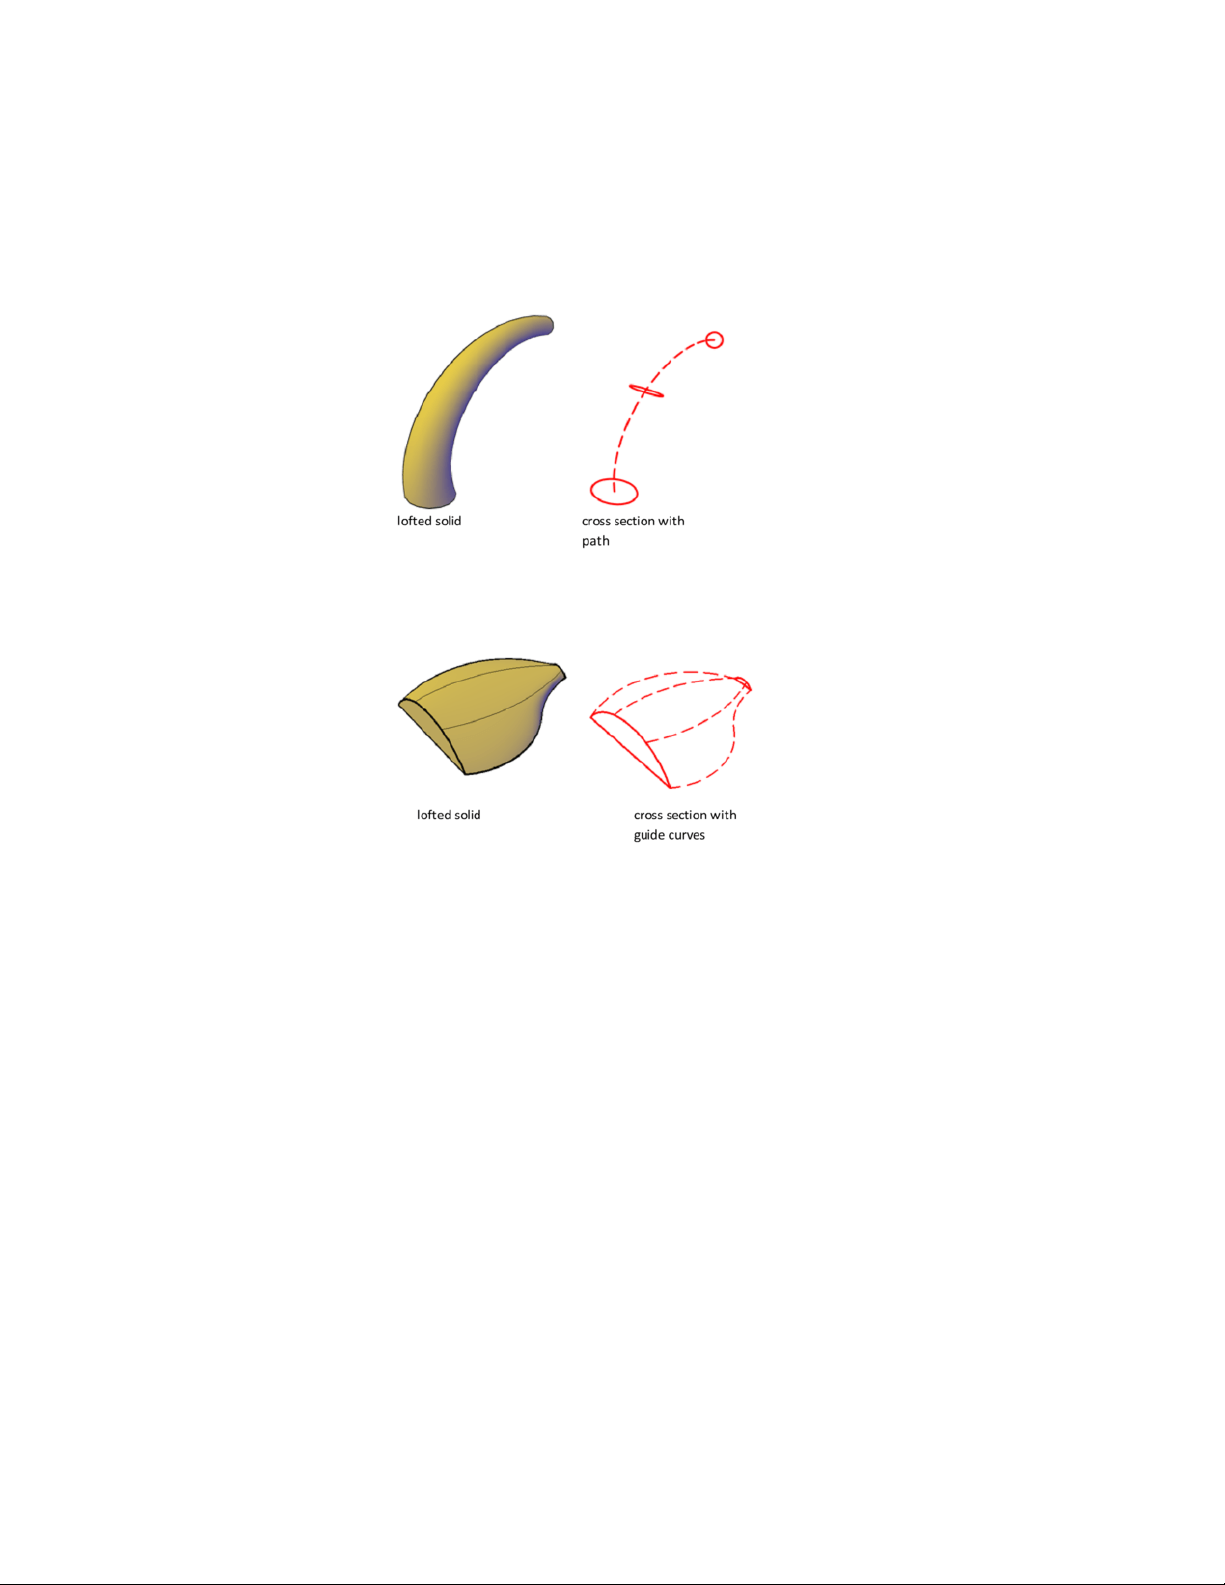
plane of the first cross section and end it on the plane of the last cross
section.
■ Guide curves. Specify guide curves to match points on corresponding
cross sections. This method prevents undesired results, such as wrinkles
in the resulting 3D object.
Each guide curve must meet the following criteria:
■ Intersects each cross section
■ Starts on the first cross section
■ Ends on the last cross section
See also:
Create Associative Surfaces (page 380)
Create Geometric Relationships between Associative Surfaces (page 381)
Draw Splines (page 210)
Modify Splines (page 274)
Create 3D Models | 351

Create a Solid or Surface by Revolving
Create a 3D object by revolving curves about an axis.
When the Mode option is set to Surface, you will create a surface and if Mode
is set to Solid you will create a solid regardless of whether the curve is open
or closed. See Overview of Creating Solids and Surfaces (page 342) for more
information. When revolving a solid, you can only use a revolve angle of 360
degrees.
Options for Revolving
■ Mode. Sets whether the revolve creates a surface or a solid.
■ Start Angle. Specifies an offset for the revolution from the plane of the
object being revolved.
■ Reverse. Changes the direction of the revolve.
■ Expression. Enter a formula or equation to specify the revolve angle.
This option is only available if you are creating associative surfaces. See
Create Geometric Relationships between Associative Surfaces (page 381).
See also:
Create Associative Surfaces (page 380)
Draw Splines (page 210)
Modify Splines (page 274)
Create Solids
Create 3D solids from primitives or by combining or extending existing objects.
Overview of Creating 3D Solids
3D solid objects often start as one of several basic shapes, or primitives, that
you can then modify and recombine. A 3D solid can also be the result of
extruding a 2D shape to follow a specified path in 3D space.
352 | Chapter 8 Work with 3D Models
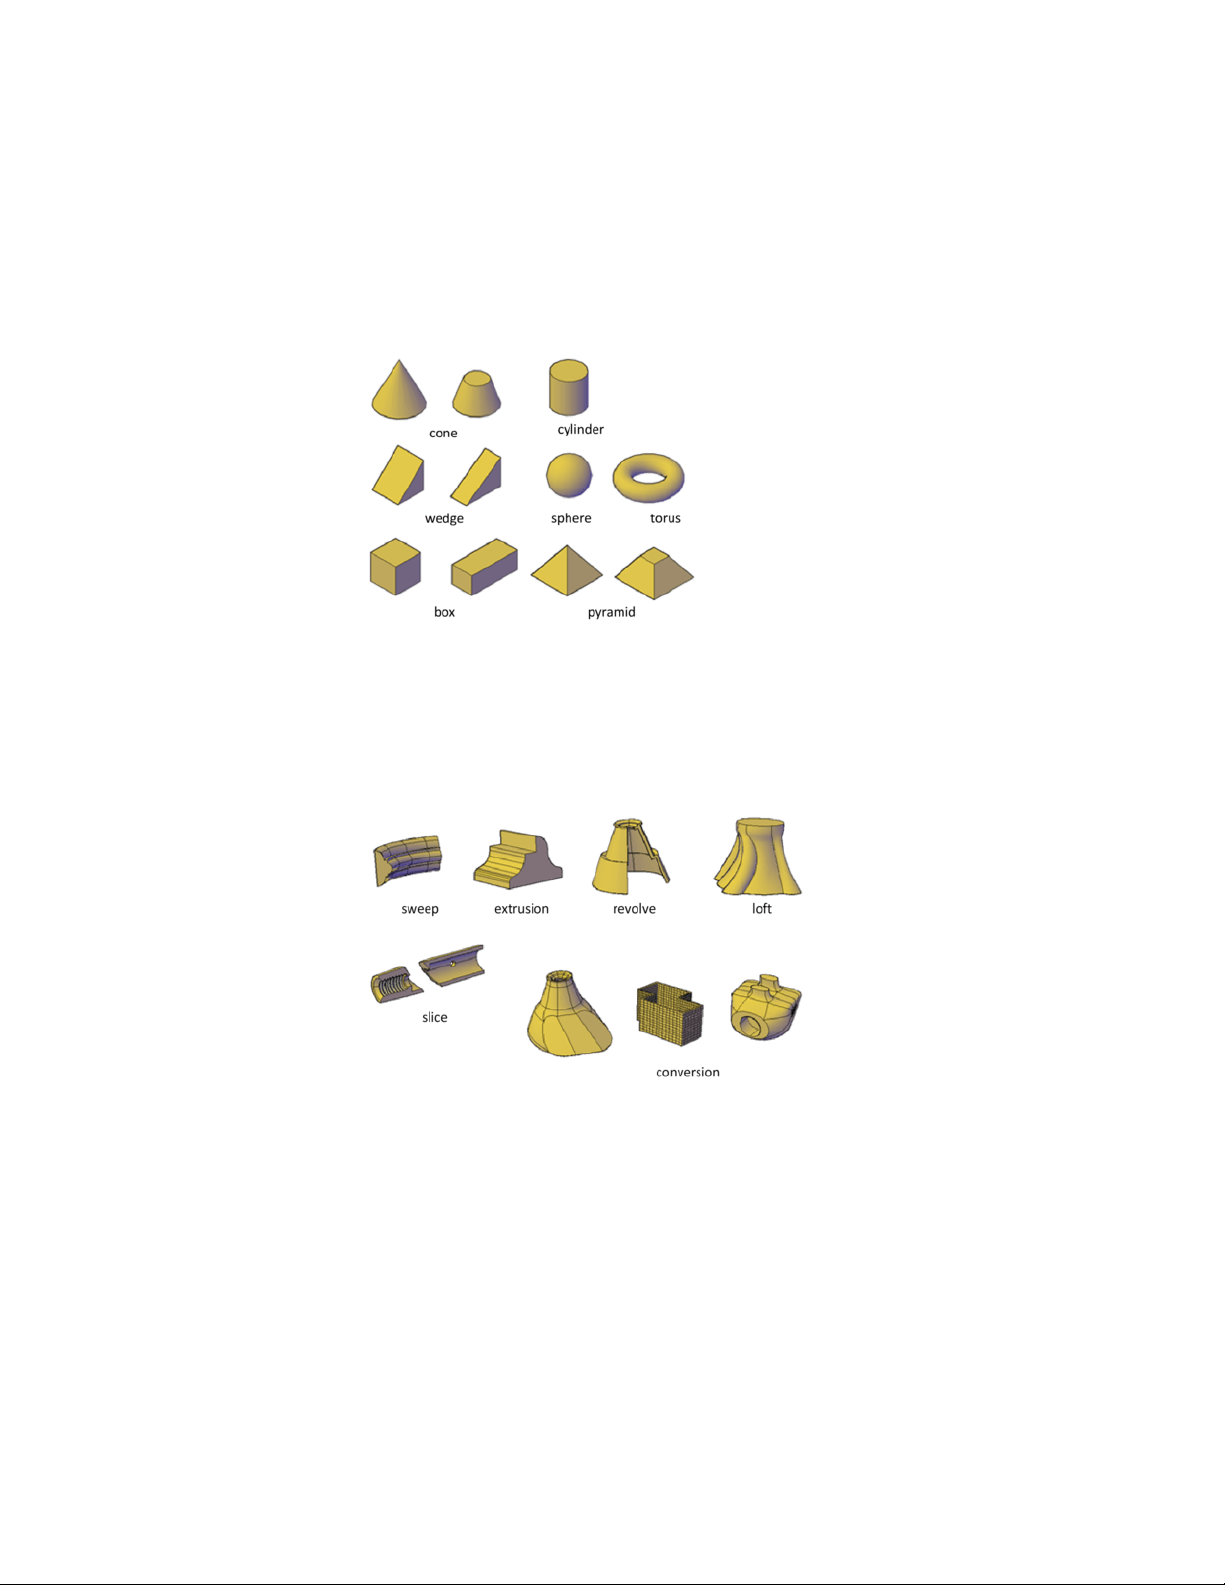
About Solid Primitives
You can create several basic 3D shapes, known as solid primitives: boxes, cones,
cylinders, spheres, wedges, pyramids, and tori.
By combining primitive shapes, you can create more complex solids. For
example, you can join two solids, subtract one from the other, or create a
shape based on the intersection of their volumes.
About Solids Based on Other Objects
You can also create 3D solids from 2D geometry or other 3D objects.
The following methods are available:
■ Sweep. Extends a 2D object along a path.
■ Extrusion. Extends the shape of a 2D object in a perpendicular direction
into 3D space.
■ Revolve. Sweeps a 2D object around an axis.
Create 3D Models | 353
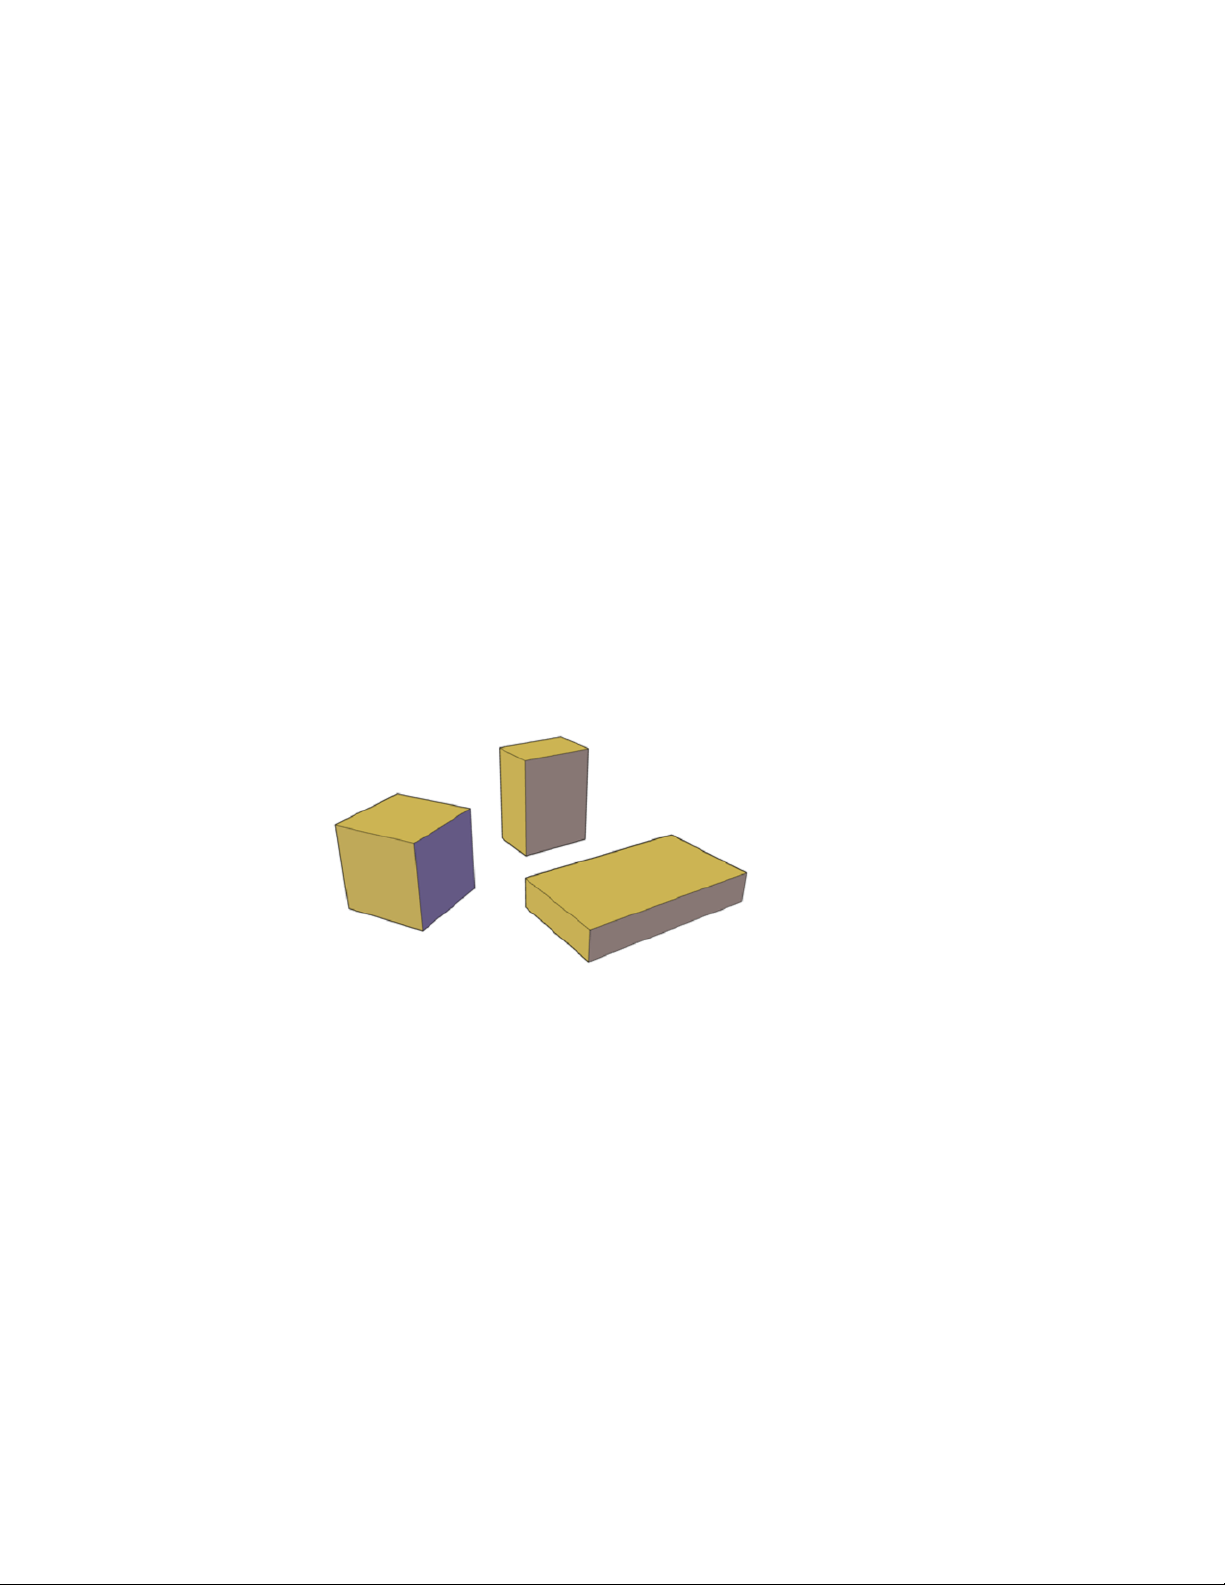
■ Loft. Extends the contours of a shape between one or more open or closed
objects.
■ Slice. Divides a solid object into two separate 3D objects.
■ Sculpting Surfaces. Converts and trims a group of surfaces that enclose
a watertight area into a solid.
■ Conversion. Converts mesh objects and planar objects with thickness
into solids and surfaces.
Create 3D Solid Primitives
Start with standard shapes known as solid primitives to create boxes, cones,
cylinders, spheres, tori, wedges, and pyramids.
Create a Solid Box
Create a rectangular or cubical solid box.
The base of the box is always drawn parallel to the XY plane of the current
UCS (work plane).
Box Creation Options
Use the following options to control the size and rotation of the boxes you
create:
■ Create a cube. Use the Cube option of the BOX command to create a
box with sides of equal length.
■ Specify rotation. Use the Cube or Length option if you want to set the
rotation of the box in the XY plane.
354 | Chapter 8 Work with 3D Models
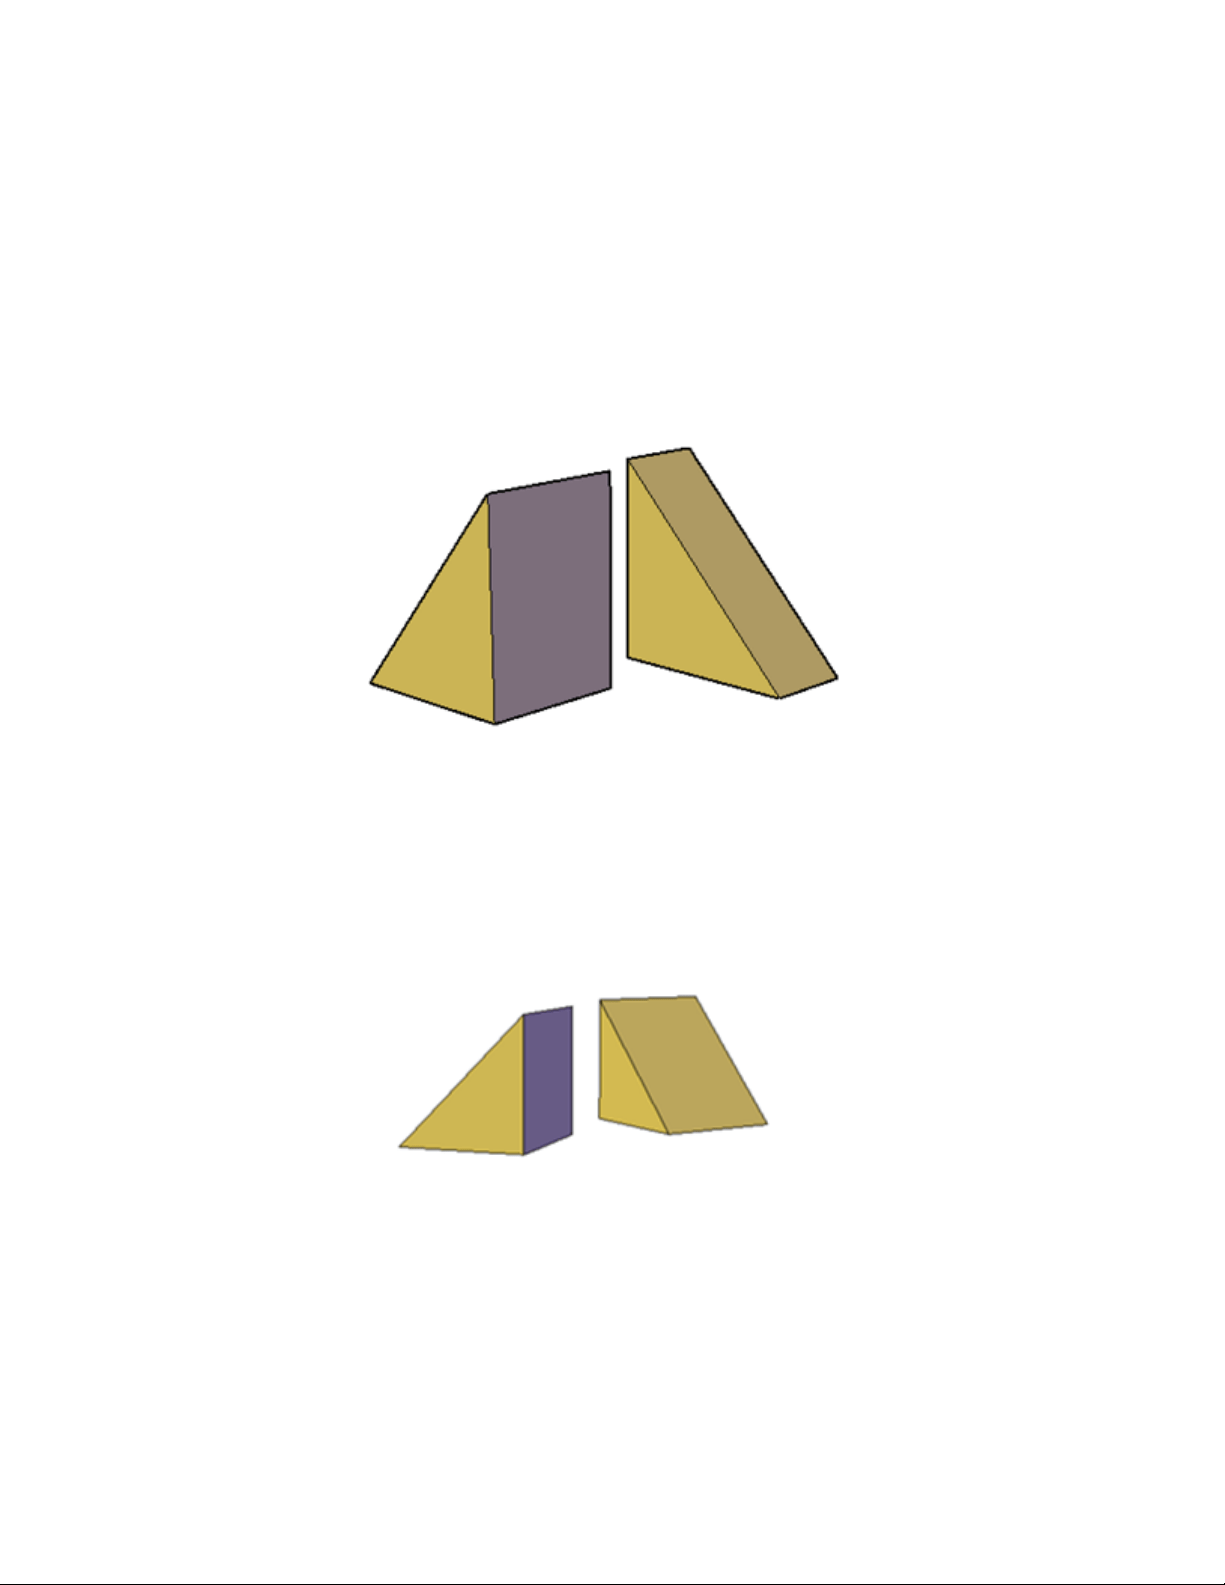
■ Start from the center point. Use the Center Point option to create a
box using a specified center point.
Create a Solid Wedge
Create a solid wedge with rectangular or cubical faces.
The base of the wedge is drawn parallel to the XY plane of the current UCS
with the sloped face opposite the first corner. The height of the wedge is
parallel to the Z axis.
Wedge Creation Options
Use the following options to control the size and rotation of the wedges you
create:
■ Create a wedge with sides of equal length. Use the Cube option of
the WEDGE command.
■ Specify rotation. Use the Cube or Length option if you want to set the
rotation of the wedge in the XY plane.
Create 3D Models | 355
■ Start from the center point. Use the Center Point option to create a
wedge using a specified center point.
Create a Solid Cone
Create a pointed or frustum of a cone with a circular or elliptical base.
By default, the base of the cone lies on the XY plane of the current UCS. The
height of the cone is parallel to the Z axis.
Cone Creation Options
Use the following options to control the size and rotation of the cones you
create:
■ Set the height and orientation. Use the Axis Endpoint option of the
CONE command. Use the Top Radius option to specify the axis endpoint
as the point of the cone or the center of the top face. The axis endpoint
can be located anywhere in 3D space.
■ Create a frustum of a cone. Use the Top Radius option of the CONE
command to create a frustum, which tapers to an elliptical or planar face.
The Frustum tool is also available from the Modeling tab of the tool palette.
You can also use grips to modify the tip of a cone and convert it to a flat
face.
356 | Chapter 8 Work with 3D Models
■ Specify circumference and base plane. The 3P (Three Points) option
of the CONE command defines the size and plane of the base of the cone
anywhere in 3D space.
■ Define the angle of the taper. To create a conical solid that requires
a specific angle to define its sides, draw a 2D circle. Then use EXTRUDE
and the Taper Angle option to taper the circle at an angle along the Z axis.
This method, however, creates an extruded solid, not a true solid cone
primitive.
See also:
Use Grips to Edit 3D Solids and Surfaces (page 420)
Create a Solid Cylinder
Create a solid cylinder with a circular or elliptical base.
By default, the base of the cylinder lies on the XY plane of the current UCS.
The height of the cylinder is parallel to the Z axis.
Cylinder Creation Options
Use the following options to control the size and rotation of the cylinders you
create:
■ Set rotation. Use the Axis Endpoint option of the CYLINDER command
to set the height and rotation of the cylinder. The center point of the top
plane of the cylinder is the axis endpoint, which can be located anywhere
in 3D space.
Create 3D Models | 357
■ Use three points to define the base. Use the 3P (Three Points) option
to define the base of the cylinder. You can set three points anywhere in
3D space.
■ Construct a cylindrical form with special detail, such as grooves.
Create a closed polyline (PLINE to represent a 2D profile of the base. Use
EXTRUDE to define the height along the Z axis. The resulting extruded
solid is not a true solid cylinder primitive.
Create a Solid Sphere
Create a solid sphere using one of several methods.
When you start with the center point, the central axis of the sphere parallels
the Z axis of the current user coordinate system (UCS).
Sphere Creation Options
Use the following options to draw a sphere with the SPHERE command:
■ Specify three points to set the size and plane of the
circumference or radius. Use the 3P (Three Points) option to define
the size of the sphere anywhere in 3D space. The three points also define
the plane of the circumference.
■ Specify two points to set the circumference or radius. Use the 2P
(Two Points) option to define the size of the sphere anywhere in 3D space.
The plane of the circumference matches the Z value of the first point.
■ Set the size and location of the sphere based on other objects.
Use the Ttr (Tangent, Tangent, Radius) option to define a sphere that is
tangent to two circles, arcs, lines, and some 3D objects. The tangency
points are projected onto the current UCS.
358 | Chapter 8 Work with 3D Models
Create a Solid Pyramid
Create a solid pyramid with up to 32 sides.
You can create a pyramid that tapers to a point, or create a frustum of a
pyramid, which tapers to a planar face.
Pyramid Creation Options
Use the following options to control the size, shape, and rotation of the
pyramids you create:
■ Set the number of sides. Use the Sides option of the PYRAMID
command to set the number of sides for the pyramid.
■ Set the length of the edges. Use the Edges option to specify the
dimension of the sides at the base.
■ Create a frustum of a pyramid. Use the Top Radius option to create
a frustum, which tapers to a planar face. The frustum face is parallel to,
and has the same number of sides as, the base.
Create 3D Models | 359
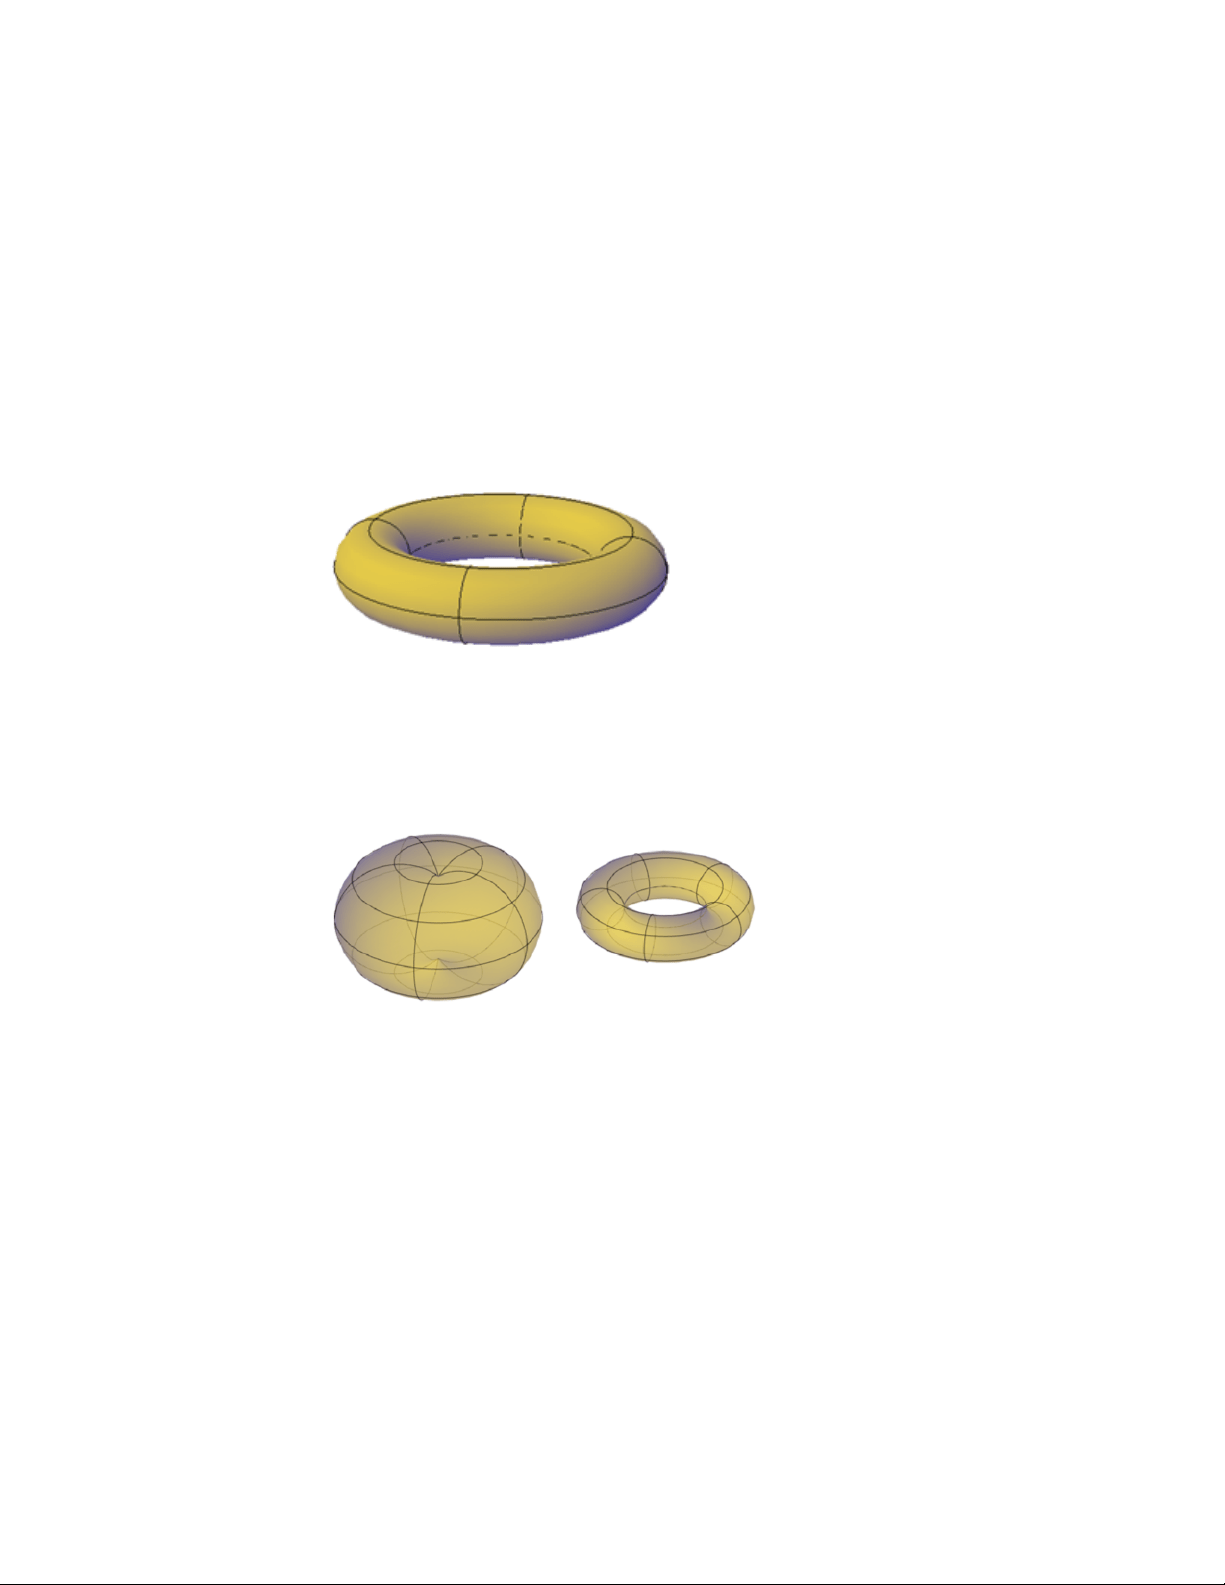
■ Set the height and rotation of the pyramid. Use the Axis Endpoint
option of the PYRAMID command to specify the height and rotation of
the pyramid. This endpoint, or top of the pyramid, can be located anywhere
in 3D space.
Create a Solid Torus
Create a ring-shaped solid that resembles the inner tube of a tire.
A torus has two radius values. One value defines the tube. The other value
defines the distance from the center of the torus to the center of the tube. By
default, a torus is drawn parallel to and is bisected by the XY plane of the
current UCS.
A torus can be self-intersecting. A self-intersecting torus has no center hole
because the radius of the tube is greater than the radius of the torus.
Torus Creation Options
Use the following options to control the size and rotation of the tori you
create.
■ Set the size and plane of the circumference or radius. Use the 3P
(Three Points) option to define the size of the torus anywhere in 3D space.
The three points also define the plane of the circumference. Use this option
to rotate the torus as you create it.
360 | Chapter 8 Work with 3D Models
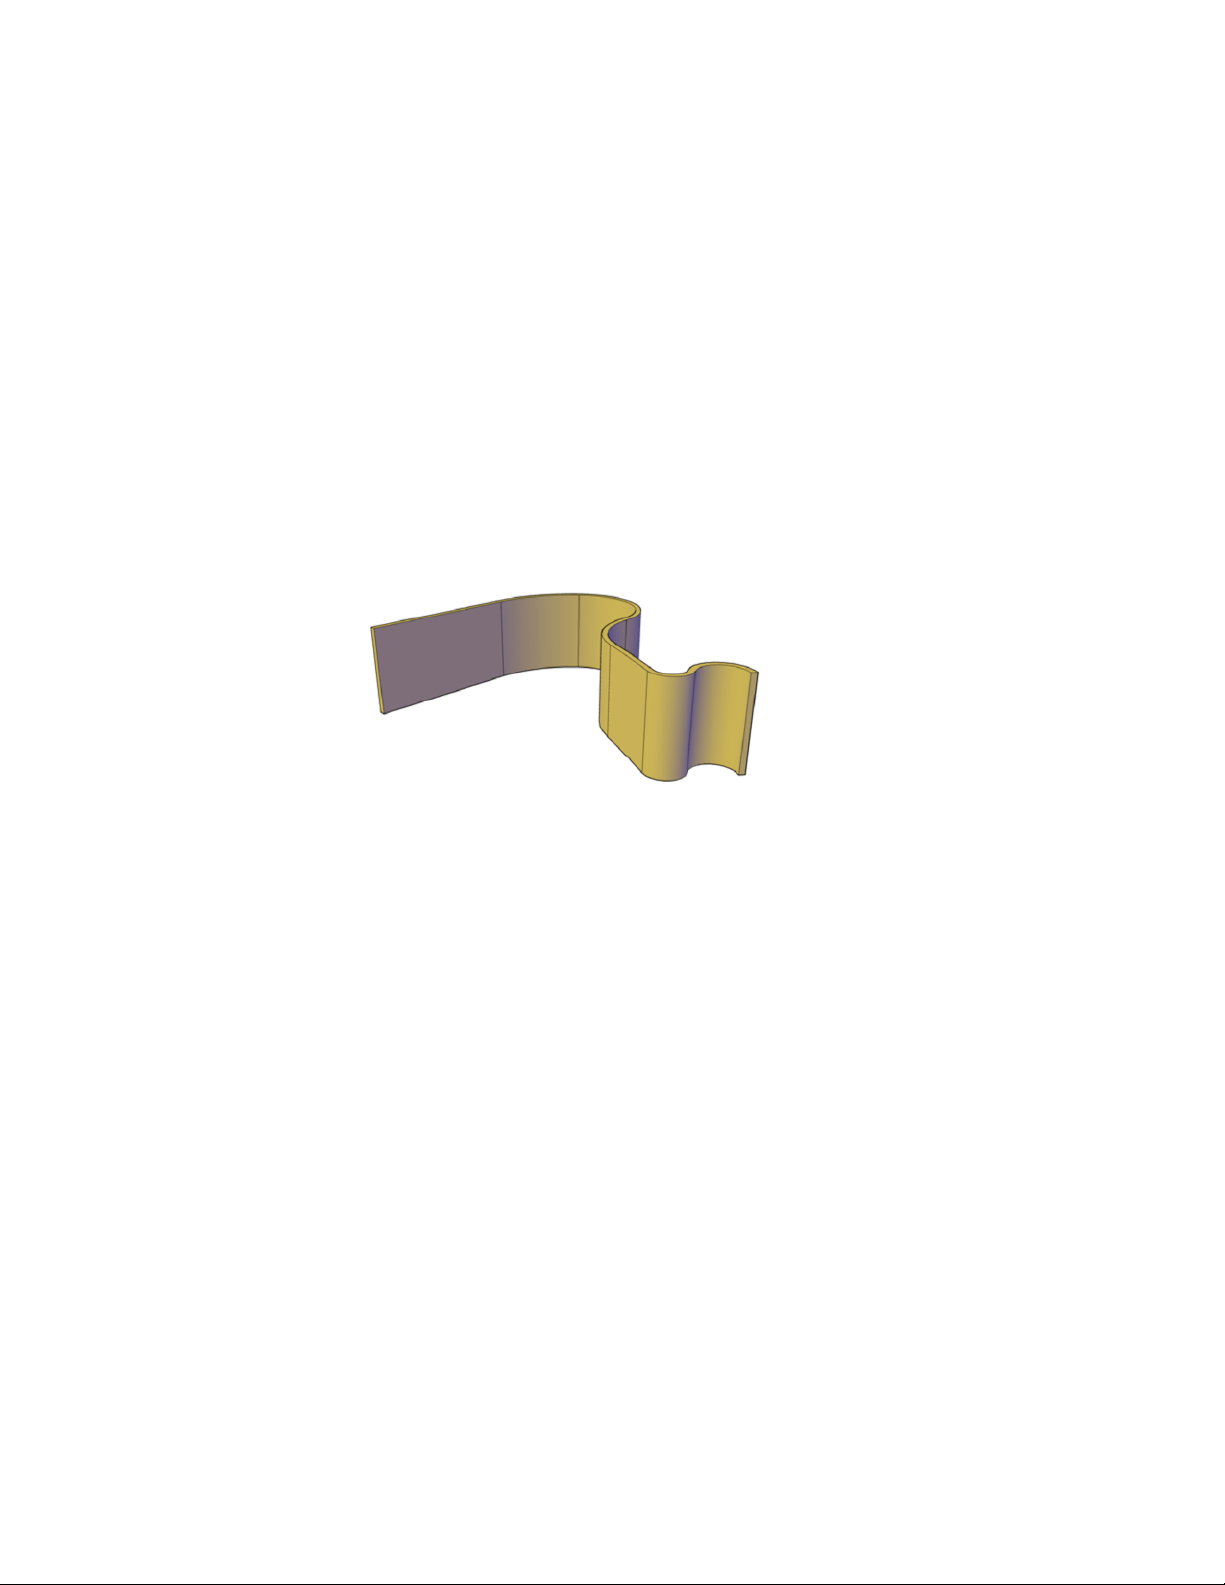
■ Set the circumference or radius. Use the 2P (Two Points) option to
define the size of the torus anywhere in 3D space. The plane of the
circumference matches the Z value of the first point.
■ Set the size and location of the torus based on other objects. Use
the Ttr (Tangent, Tangent, Radius) option to define a torus that is tangent
to two circles, arcs, lines, and some 3D objects. The tangency points are
projected onto the current UCS.
Create a Polysolid
Use the same techniques you use to create polylines to create a polysolid
object.
The POLYSOLID command provides a quick way to draw 3D walls. A polysolid
is like an extruded, wide polyline. In fact, you can draw polysolids the same
way that you draw a polyline, using both straight and curved segments. Unlike
extruded polylines, which lose any width properties upon extrusion, polysolids
retain the width of their line segments.
You can also convert objects such as a line, 2D polyline, arc, or circle to a
polysolid.
Polysolids are displayed as swept solids in the Properties Inspector.
Polysolid Creation Options
Use the following options to control the size and shape of the polysolids you
create:
■ Create arced segments. Use the Arc option to add curved segments to
the polysolid. The profile of a polysolid with curved segments remains
perpendicular to the path.
Create 3D Models | 361
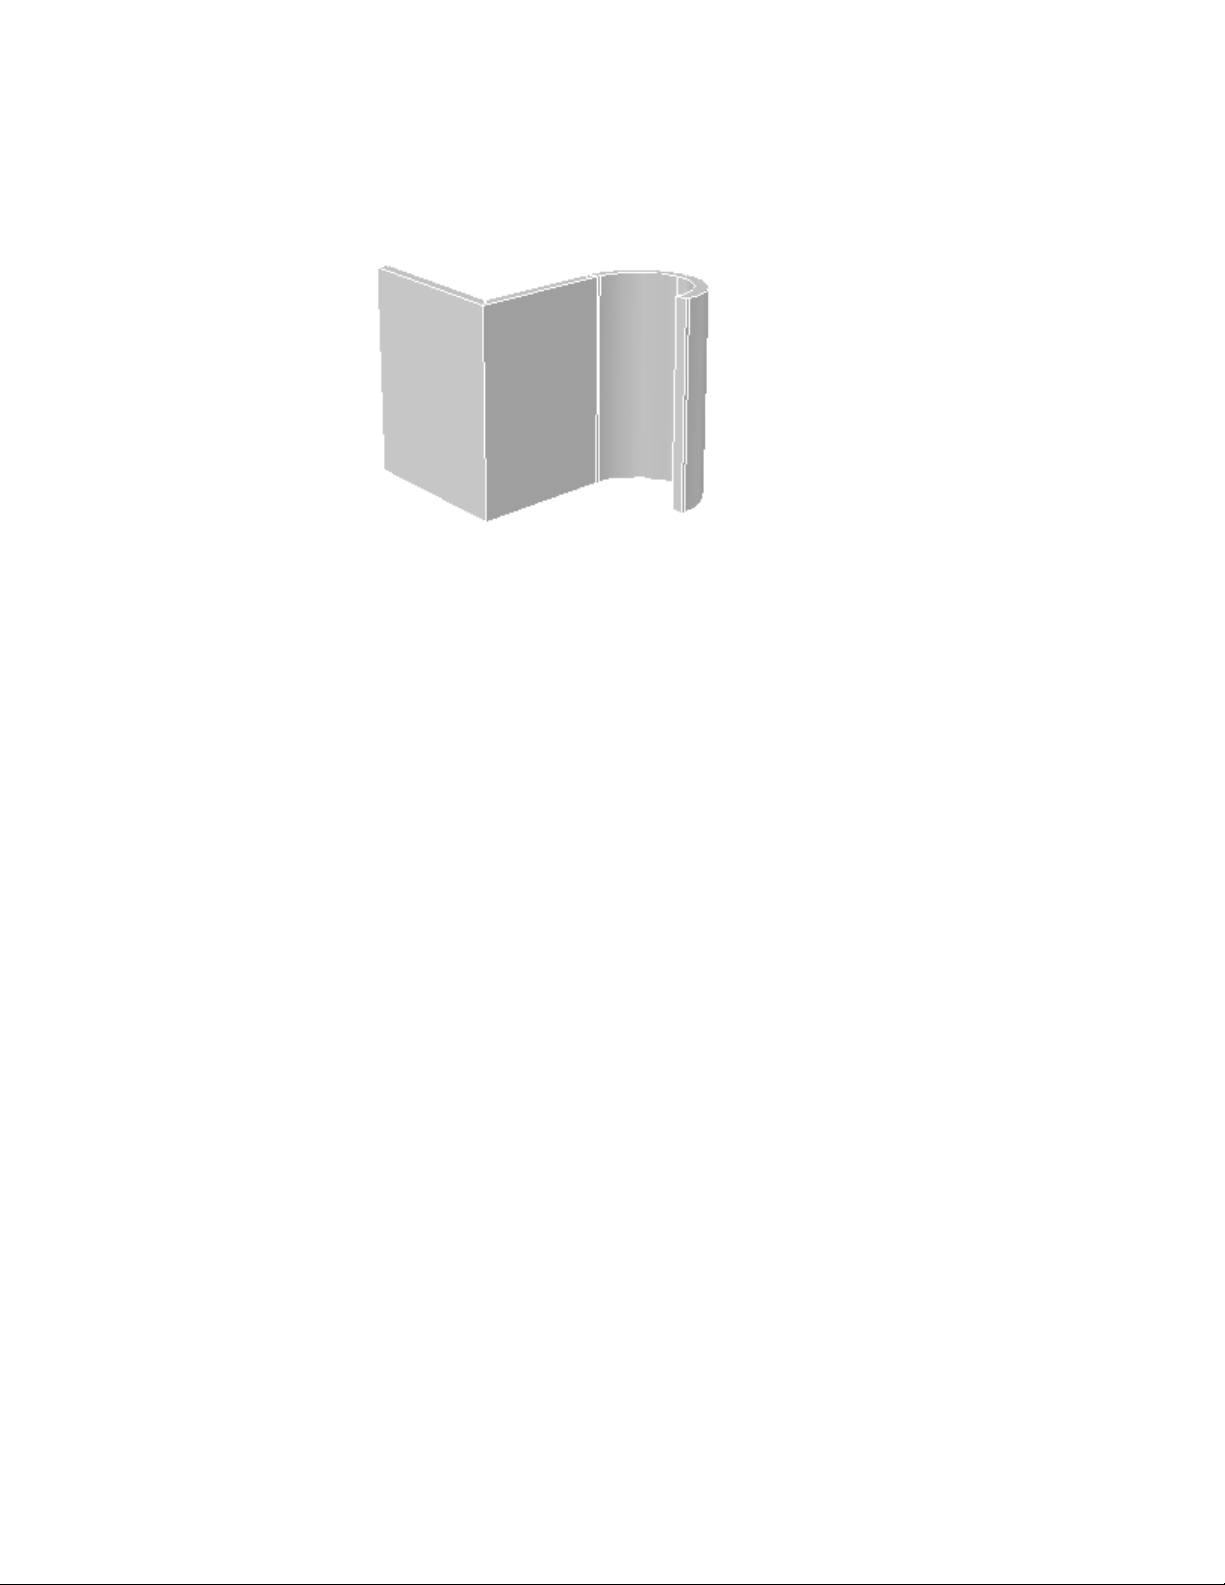
■ Create a polysolid from a 2D object. Use the Object option to convert
an object such as a polyline, circle, line, or arc to a polysolid. The DELOBJ
system variable controls whether the path (a 2D object) is automatically
deleted when you create a polysolid.
■ Close the gap between the first and last points. Use the Close option
to create a connecting segment.
■ Set the height and width. Use the Height and Width options for the
POLYSOLID command. The values you set are stored in the PSOLWIDTH
and PSOLHEIGHT system variables.
■ Set where the object is drawn in relation to the specified points.
Use the Justification option to place the path of the polysolid to the right,
to the left, or down the center of the points you specify.
Create 3D Solids from Objects
Convert existing objects to 3D solids.
You can use several methods to convert objects in your drawing to 3D solids:
■ Convert surfaces and objects with Thickness to 3D Solids
■ Convert a group of surfaces to a 3D solid
■ Convert mesh to 3D solids
■ Thicken surfaces to convert them to 3D solids
362 | Chapter 8 Work with 3D Models
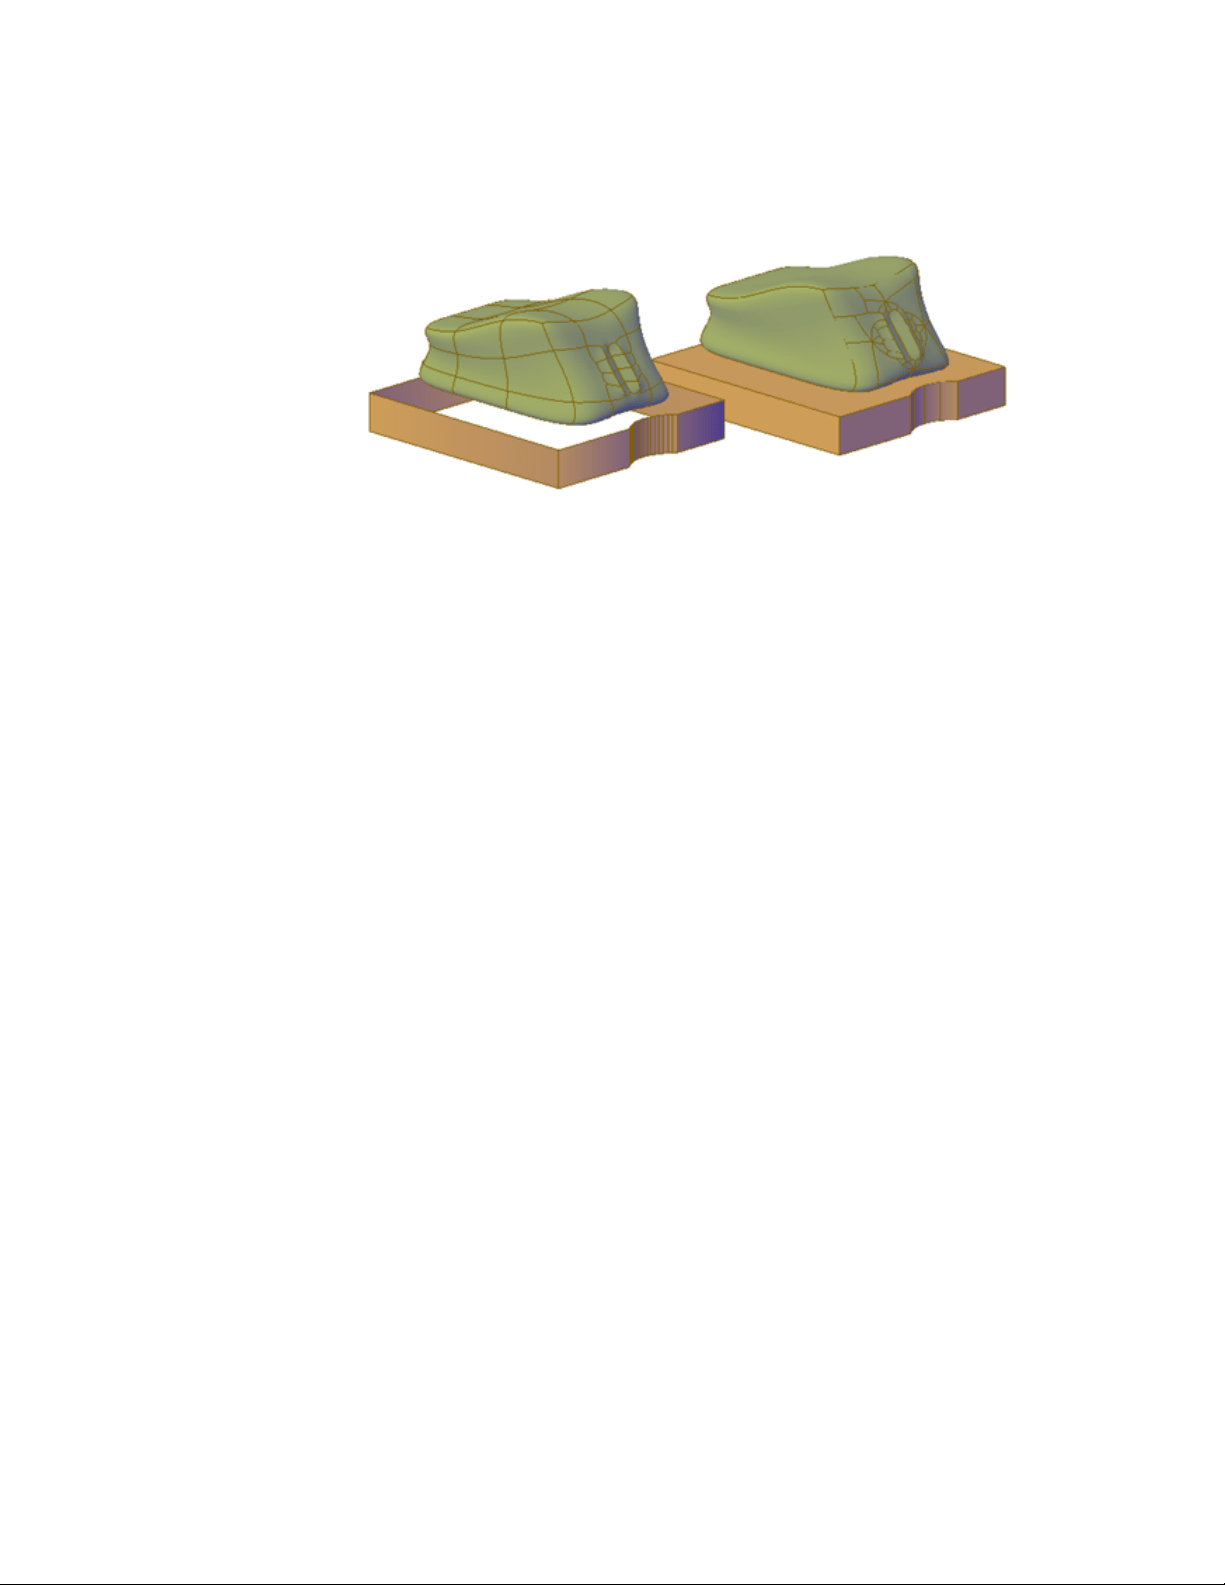
mesh and polyline with thickness converted to optimized 3D solids
The DELOBJ system variable controls whether the objects you select are
automatically deleted when the 3D object is created.
Convert Surfaces and Objects with Thickness to 3D Solids
You can convert different types of objects into extruded 3D solids with the
CONVTOSOLID command. These objects include closed polylines and circles
with thickness, as well as watertight meshes and surfaces. For a complete list
of objects that can be converted using this method, see CONVTOSOLID.
Convert a Group of Surfaces to a 3D Solid
Use the SURFSCULPT command to convert a group of surfaces that enclose a
watertight region to a 3D solid.
Convert Mesh to 3D Solids
When you convert mesh objects to 3D solids, the shape of the new solid object
approximates, but does not exactly duplicate, the original mesh object. You
can control the differentiation somewhat by specifying whether the result is
smooth or faceted (SMOOTHMESHCONVERT). You can also specify whether
the resulting faces are merged (optimized).
For example, if you convert a mesh box to a solid object, following options
are available:
■ Smoothed and optimized. Coplanar faces are merged into a single face.
The overall shape of some faces can change. Edges of faces that are not
coplanar are rounded. (SMOOTHMESHCONVERT = 0)
Create 3D Models | 363
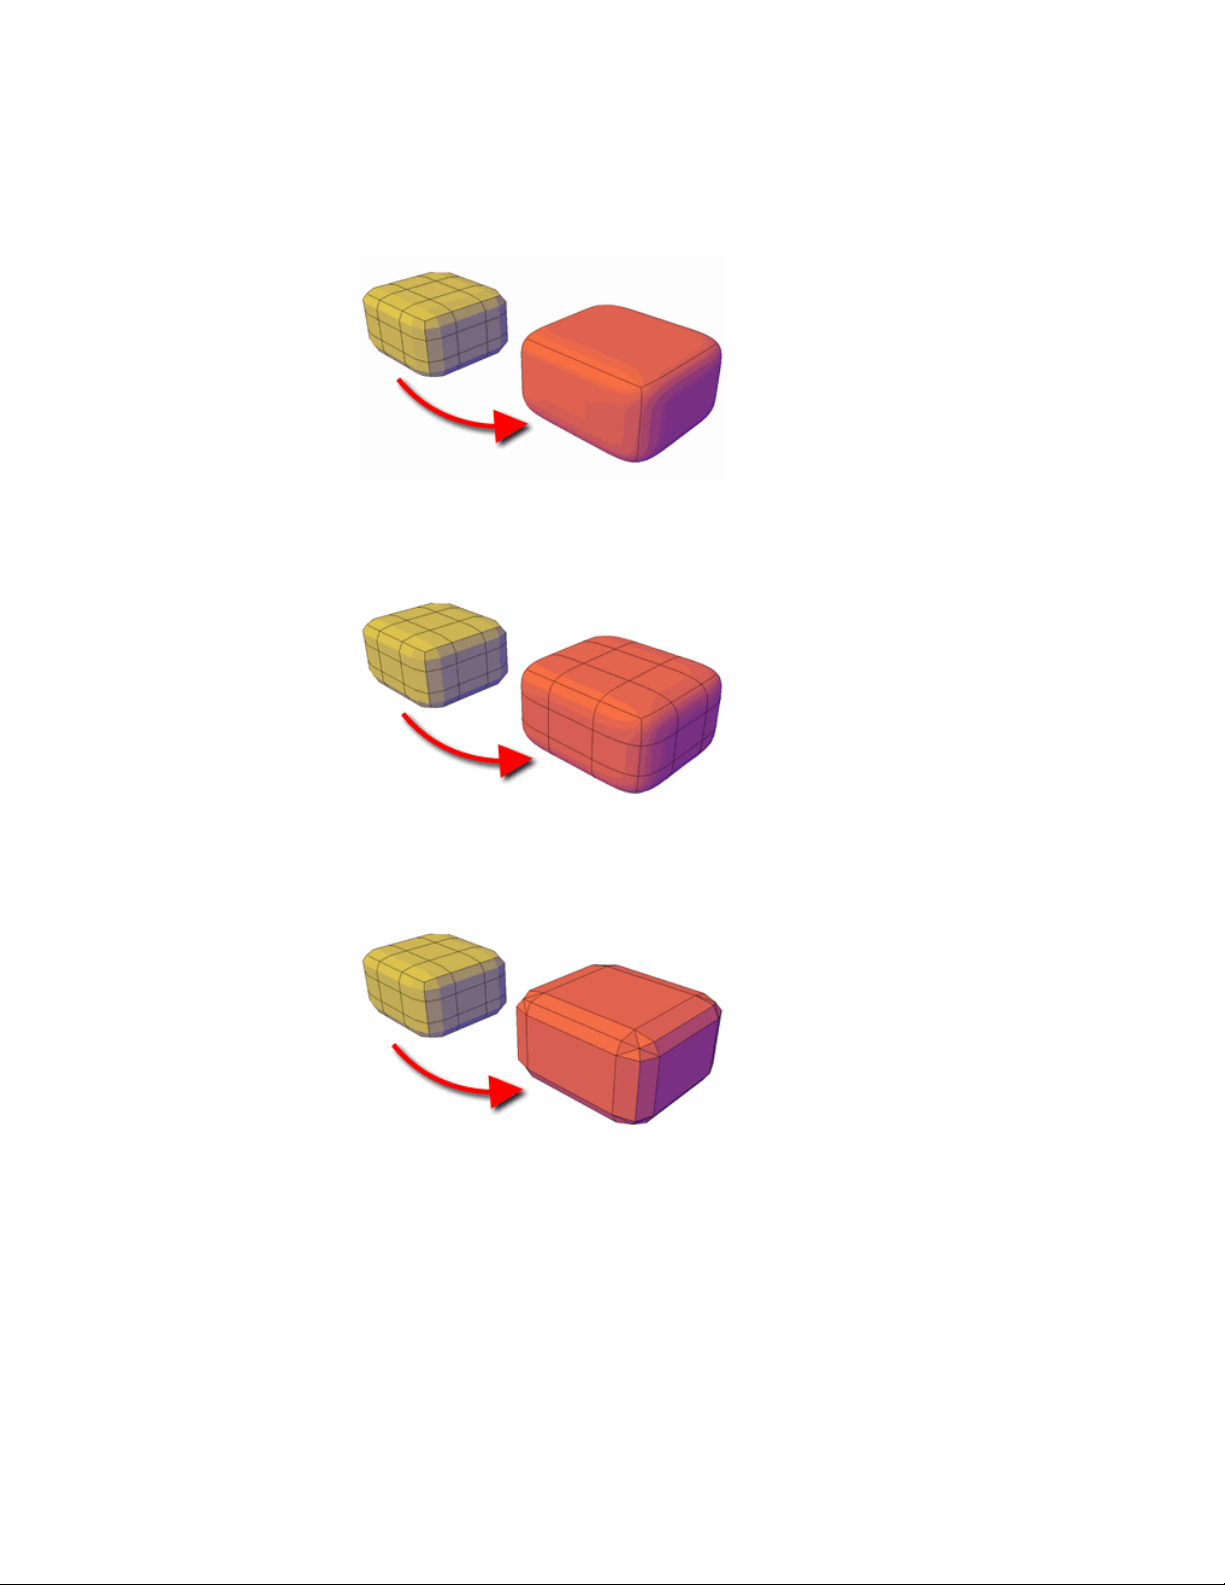
■ Smoothed and not optimized. Each original mesh face is retained in
the converted object. Edges of faces that are not coplanar are rounded.
(SMOOTHMESHCONVERT = 1)
■ Faceted and optimized. Coplanar faces are merged into a single, flat
face. The overall shape of some faces can change. Edges of faces that are
not coplanar are creased, or angular. (SMOOTHMESHCONVERT = 2)
■ Faceted and not optimized. Each original mesh face is converted to a
flat face. Edges of faces that are not coplanar are creased, or angular.
(SMOOTHMESHCONVERT = 3)
364 | Chapter 8 Work with 3D Models
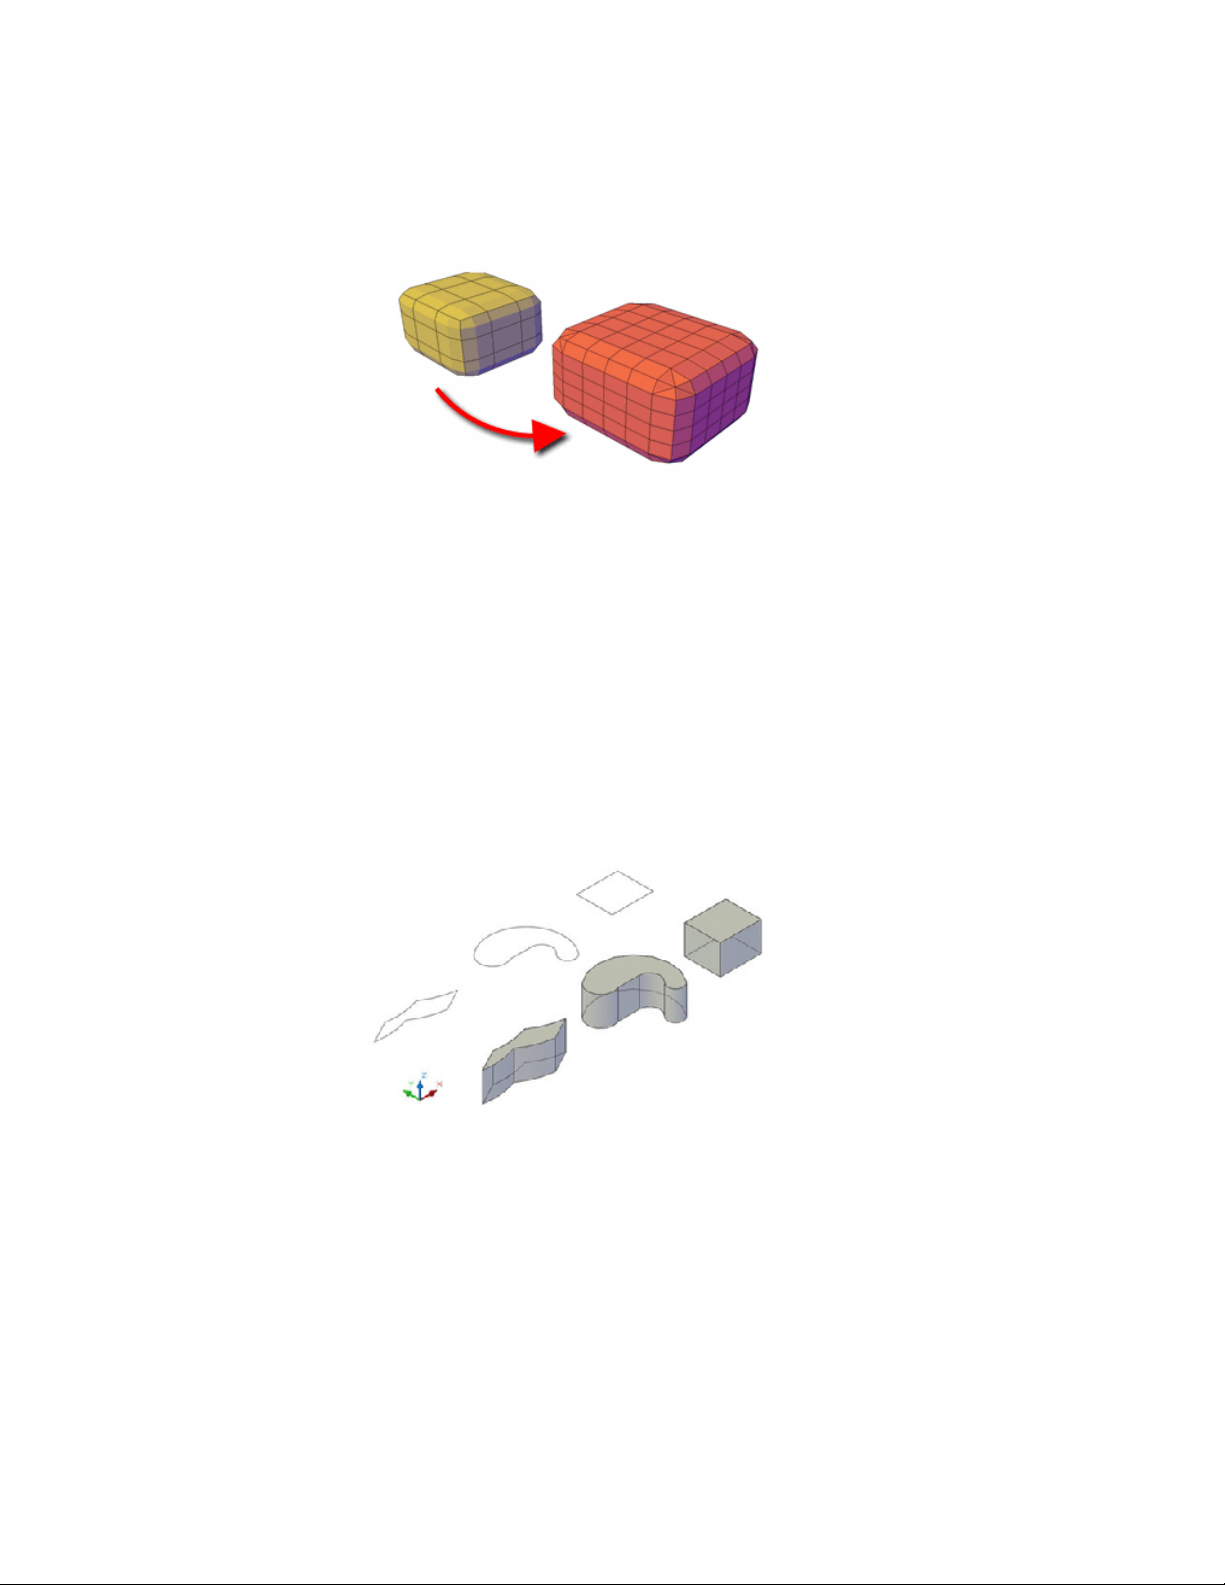
You cannot convert the following types of mesh objects to a 3D solid:
■ Mesh with gaps between faces. Gizmo editing can sometimes result
in gaps, or holes between the faces. In some cases, you can close the gaps
by smoothing the mesh object.
■ Mesh that has self-intersecting boundaries. If you have modified a
mesh object so that one or more faces intersect faces in the same object,
you cannot convert it to a 3D solid.
In some cases, mesh that is not eligible to be converted to a solid object can
be converted to a surface.
Thicken Surfaces to Convert Them to 3D Solids
You can convert 3D surface objects to 3D solids with the THICKEN command.
Grip editing is limited for objects that are created using this method.
Create 3D Models | 365
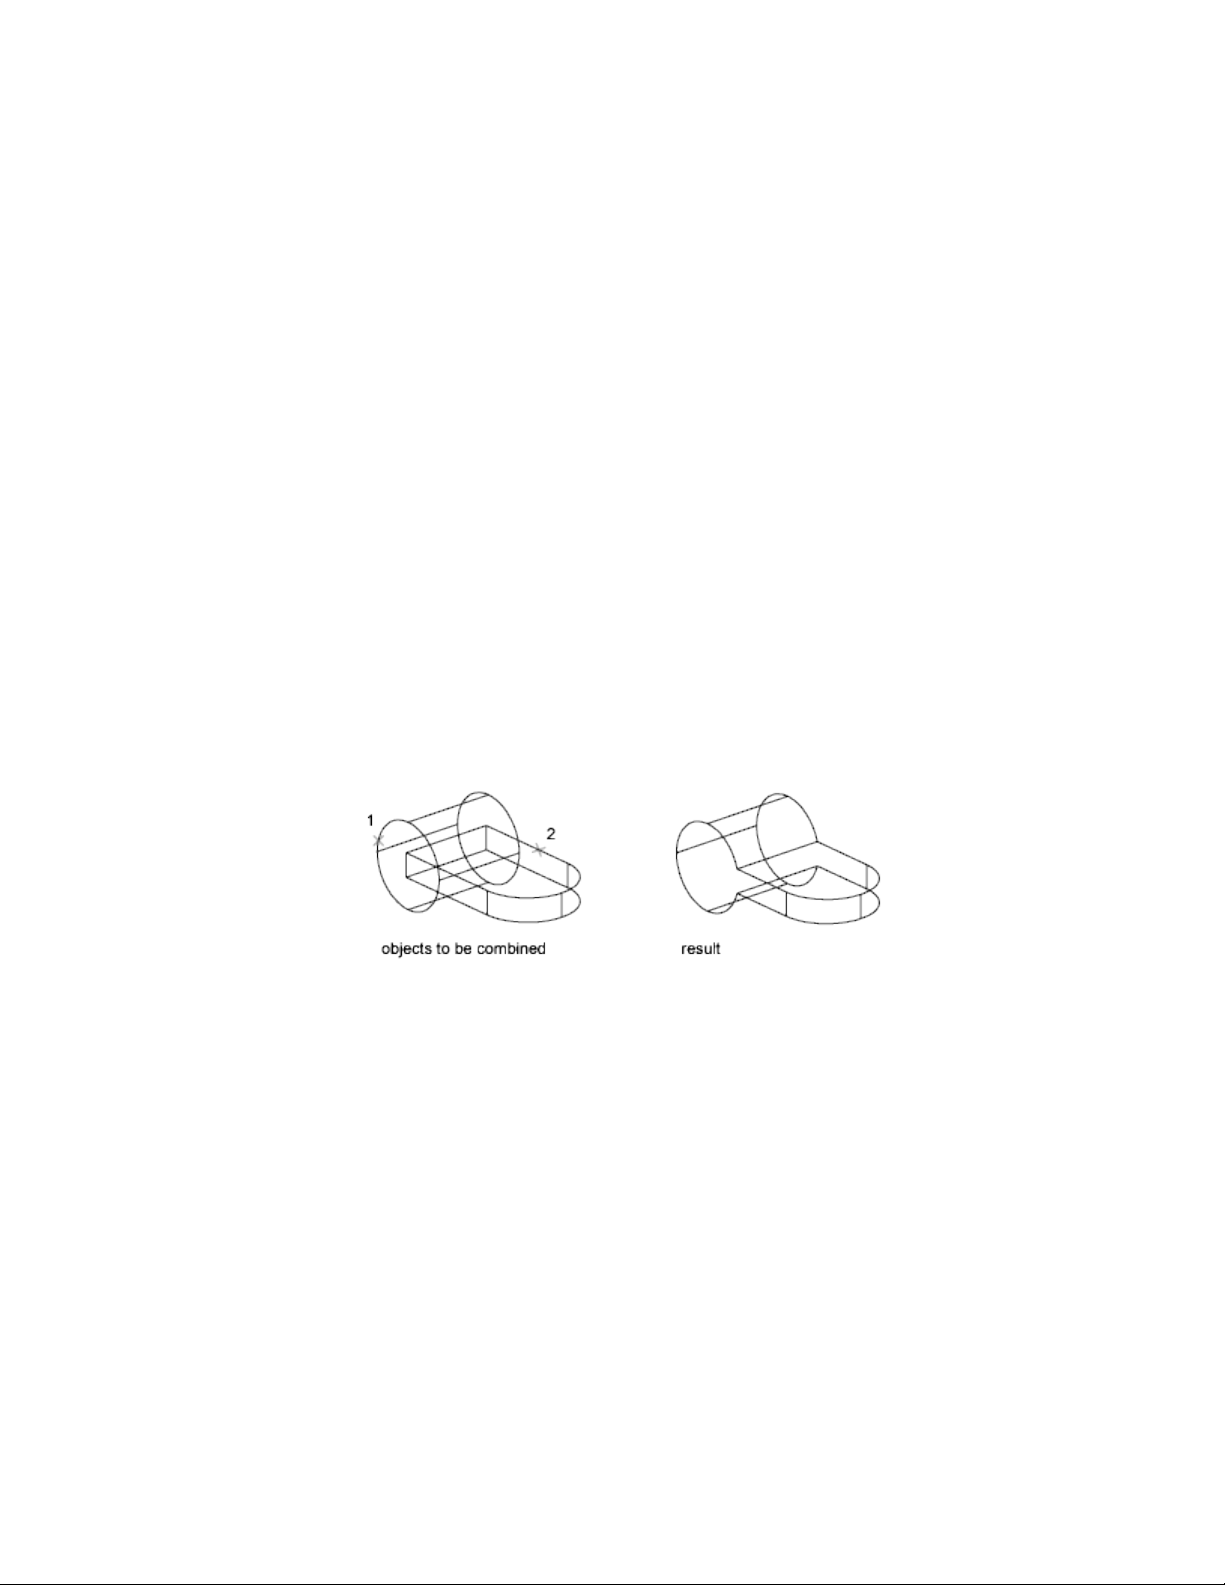
Combine or Slice 3D Objects
Create new composite 3D objects or slice objects to divide them.
Create Composite Objects
Create composite 3D objects by combining, subtracting, or finding the
intersecting mass of two or more 3D solids, surfaces, or regions.
Composite solids are created from two or more solids, surfaces, or regions
through any of the following commands: UNION, SUBTRACT, and INTERSECT.
3D solids record a history of how they were created. This history allows you
to see the original forms that make up composite solids. For more information,
see Display Original Forms of Composite Solids (page 434).
Methods for Creating Composite Objects
Three methods are available for creating composite solids, surfaces, or regions:
■ Combine two or more objects.
With UNION, you can combine the total volume of two or more objects.
■ Subtract one set of solids from another.
With SUBTRACT, you can remove the common area of one set of solids
from another. For example, you can use SUBTRACT to add holes to a
mechanical part by subtracting cylinders from the object.
366 | Chapter 8 Work with 3D Models
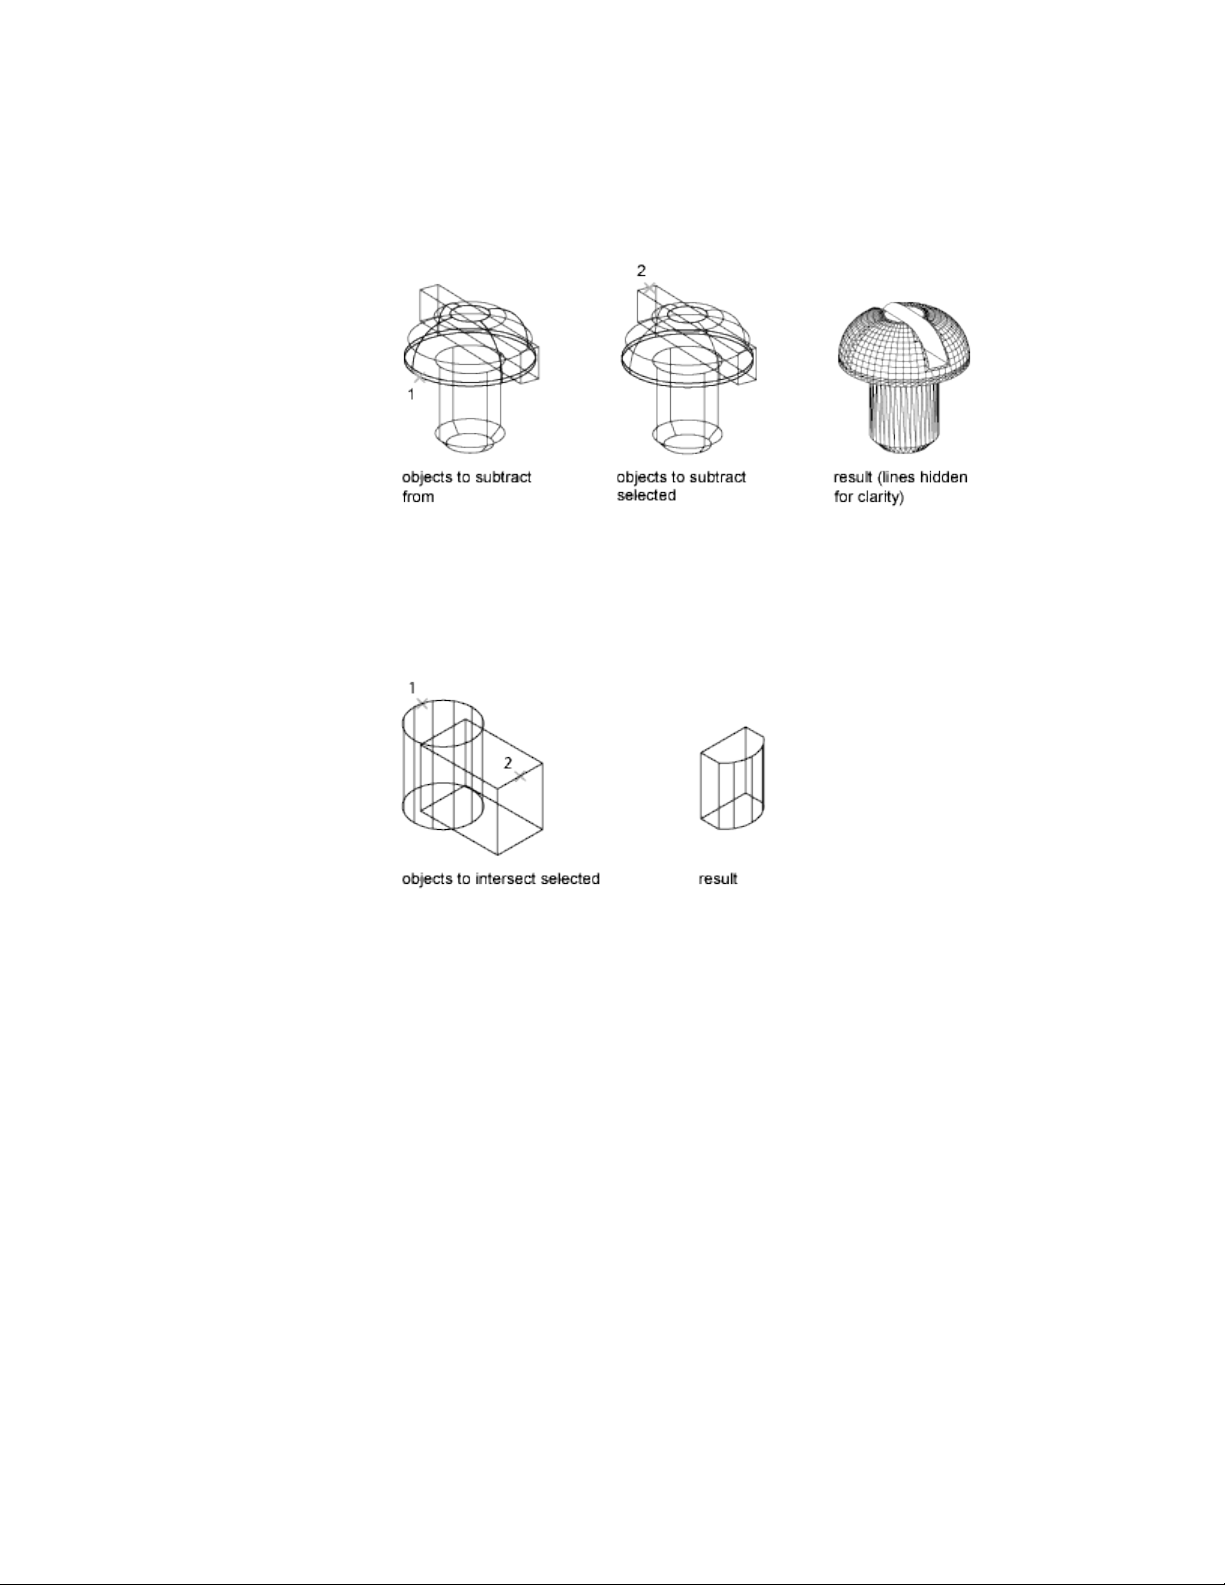
■ Find the common volume.
With INTERSECT, you can create a composite solid from the common
volume of two or more overlapping solids. INTERSECT removes the portions
that do not overlap and creates a composite solid from the common
volume.
Create Composites from Mixed Object Types
In addition to creating composite objects from the same object types, you can
also create composites from mixed surfaces and solids.
■ Mixed intersections. Combining a solid and a surface through
intersection results in a surface.
■ Mixed subtractions. Subtracting a 3D solid from a surface results in a
surface. However, you cannot subtract a surface from a 3D solid object.
■ Mixed unions. You cannot create a union between 3D solid and surface
objects.
You cannot combine solids with mesh objects. However, you can convert
them to 3D solids in order to combine them with solids.
Create 3D Models | 367
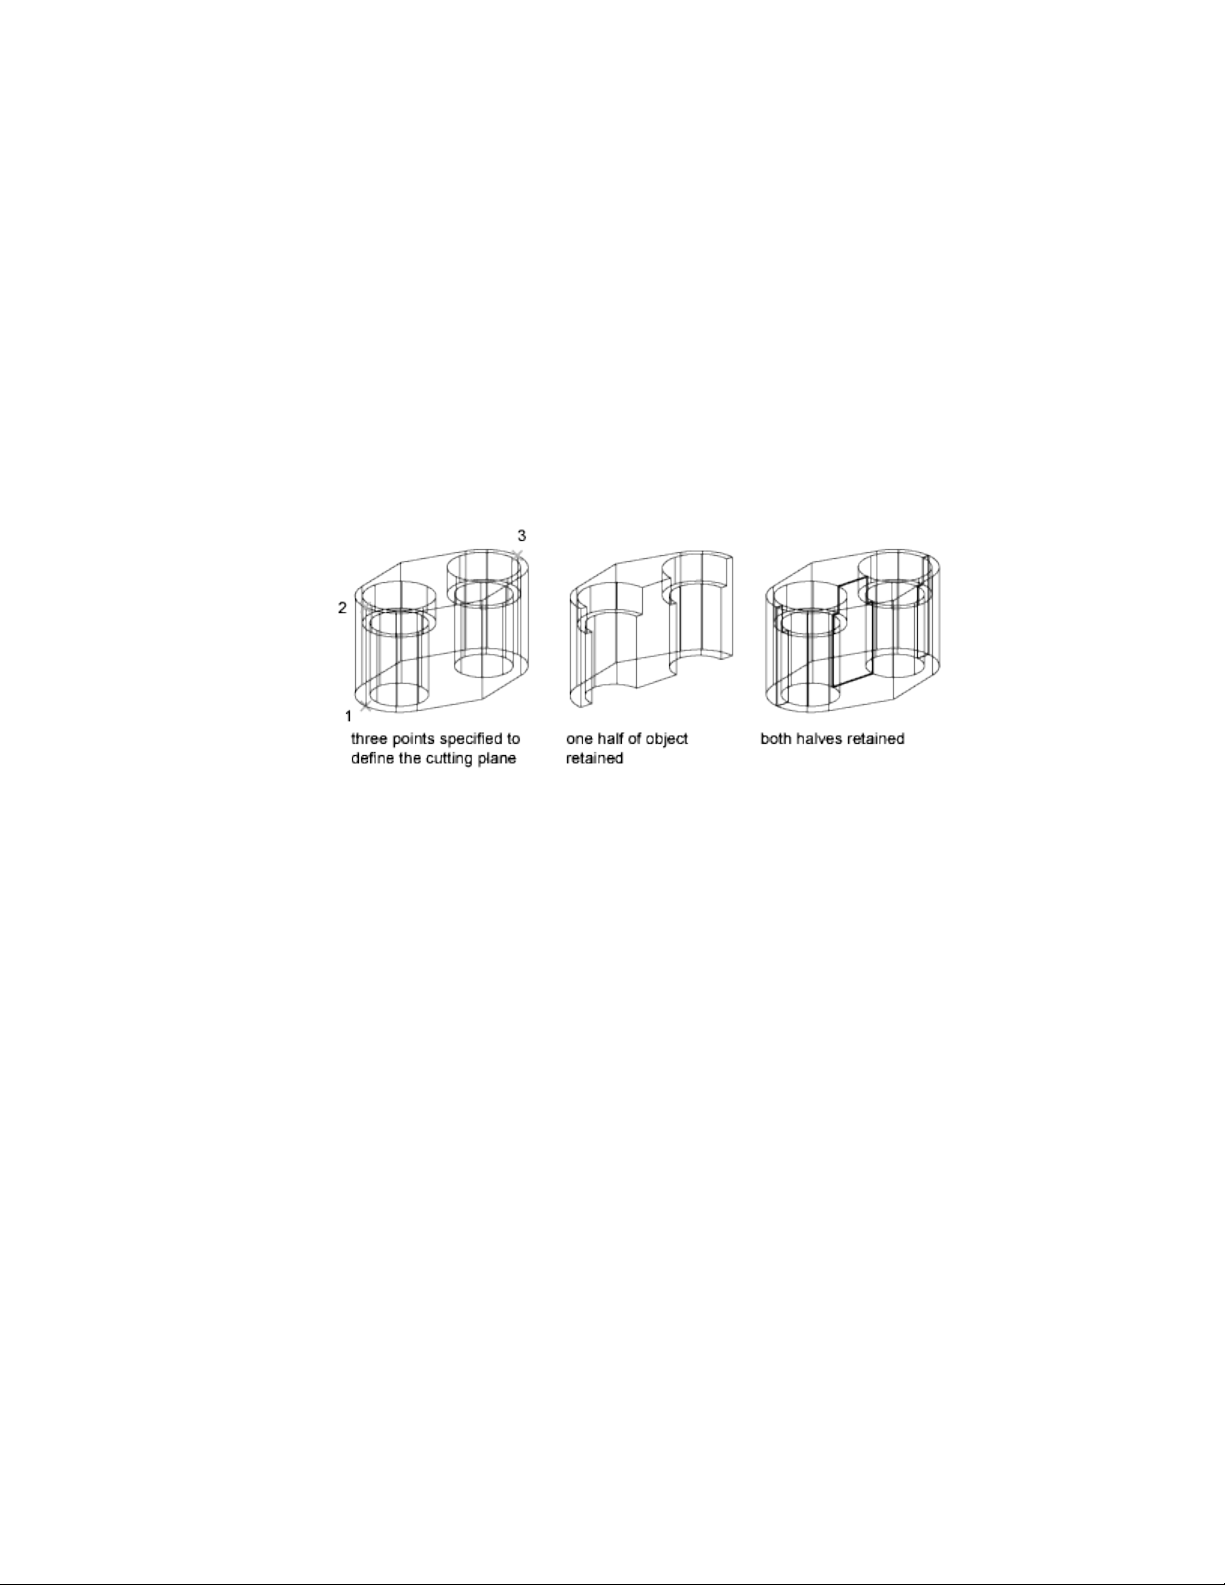
If a selection set of mixed objects contains regions, the regions are ignored.
Create 3D Solids by Slicing
Create new 3D solids by slicing, or dividing, existing objects.
When you use the SLICE command to slice a 3D solid, you can define the
cutting plane in several ways. For example, you can specify three points, an
axis, a surface, or a planar object to act as a cutting plane. You can retain one
or both halves of the sliced object.
Sliced 3D solids do not retain a history of the original forms that created them.
However, they do retain the layer and color properties of the original objects.
For a complete list of objects that can be used for a slice operation, see SLICE.
See also:
Create Sections and Drawings from 3D Models (page 474)
Check 3D Models for Interferences
Find areas where 3D solids or surfaces intersect or overlap.
Use the INTERFERE command to check for areas of interference within a set
of 3D solid or surface models. You can compare two sets of objects or check
all 3D solids and surfaces in a drawing.
Interference checking creates temporary solid or surface objects and highlights
where the models intersect.
368 | Chapter 8 Work with 3D Models
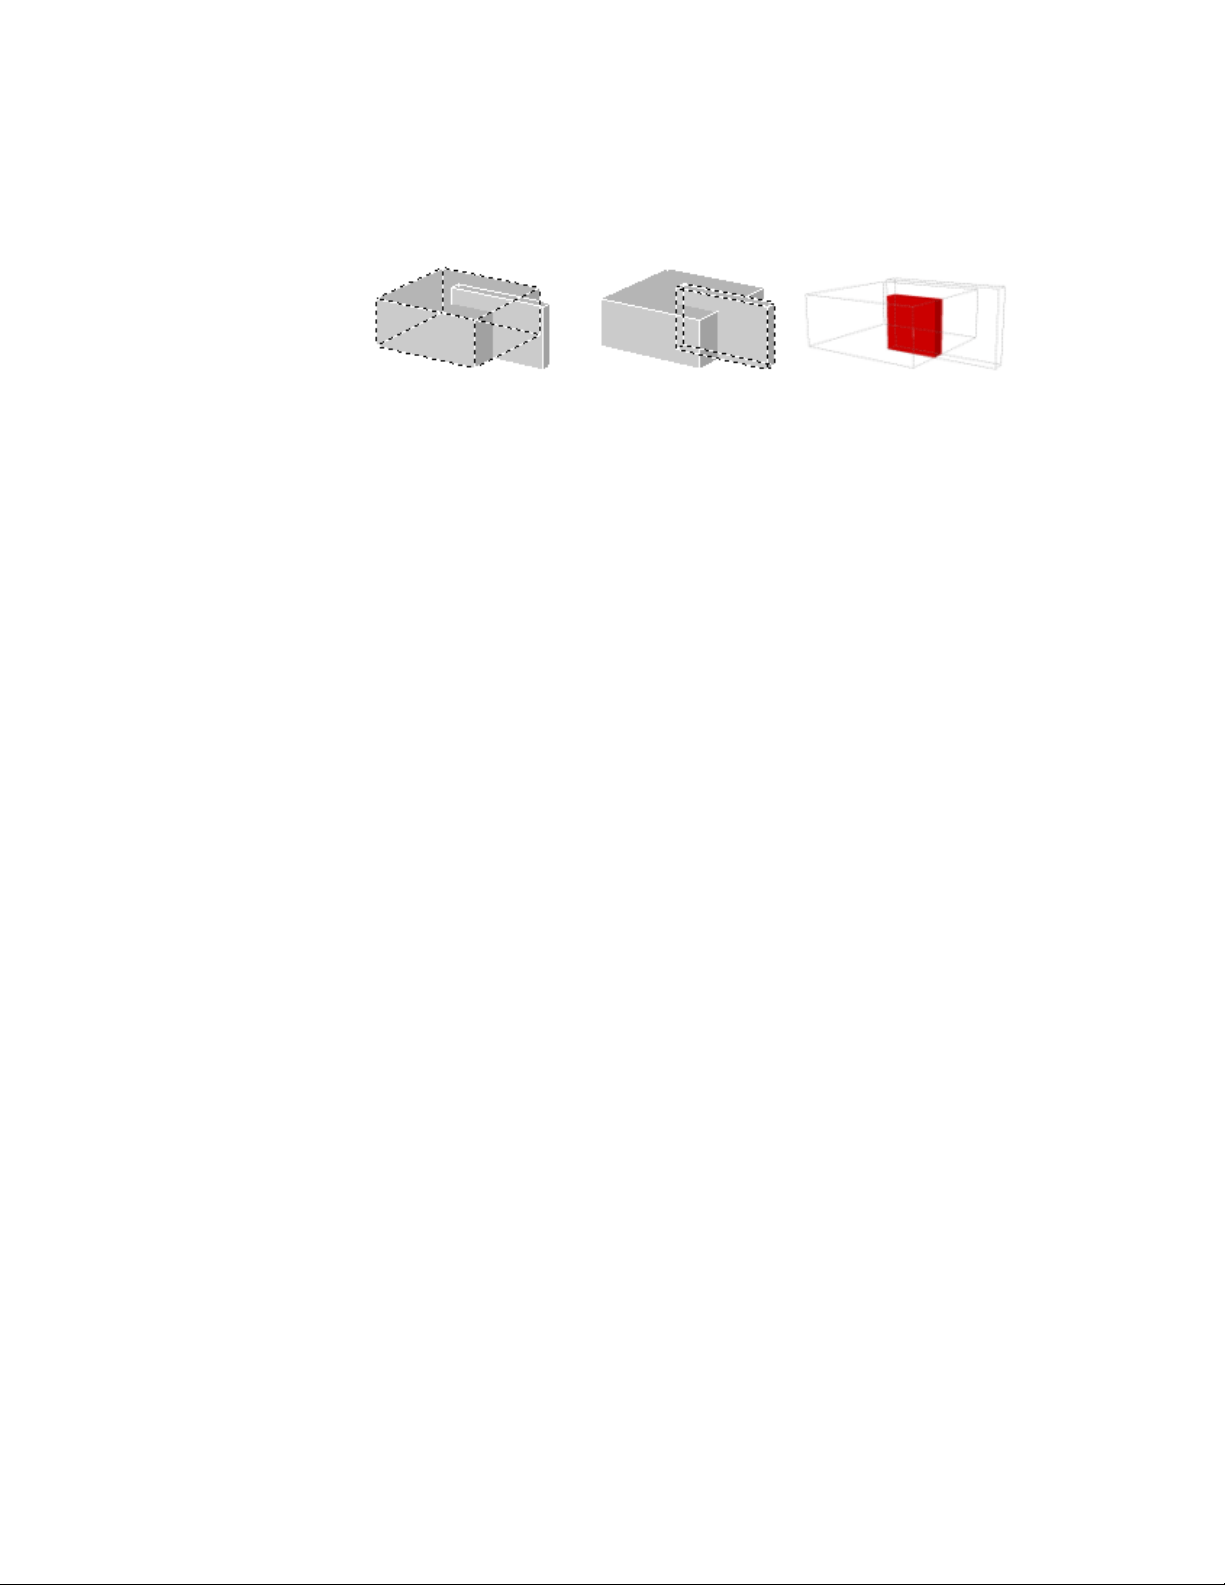
If the selection set contains both 3D solids and surfaces, the resulting
interference object is a surface.
You cannot check interference for mesh objects. However, if you select mesh
objects, you can choose to convert them to a solid or surface object and
continue the operation.
During the checking operation, you can use the Interference Checking dialog
box to cycle through and zoom to interference objects. You can also specify
whether to delete the temporary objects that are created during interference
checking.
Methods for Checking Interference
You can check interference using the following methods:
■ Define one selection set. Check the interference of all the 3D solids
and surfaces in a single selection set.
■ Define two selection sets. Check the interference of the objects in the
first set of objects against the objects in the second selection set.
■ Individually specify solids that are nested within blocks or xrefs.
Individually select 3D solid or surface objects that are nested in blocks and
external references (xrefs) and compare them against other objects in the
selection set.
Create Surfaces
Create procedural surfaces and NURBS surfaces from curves or by combining
or extending existing surfaces.
Overview of Creating Surfaces
Surface modeling provides the ability to edit multiple surfaces as an associative
group or in a more free-form way.
Create 3D Models | 369
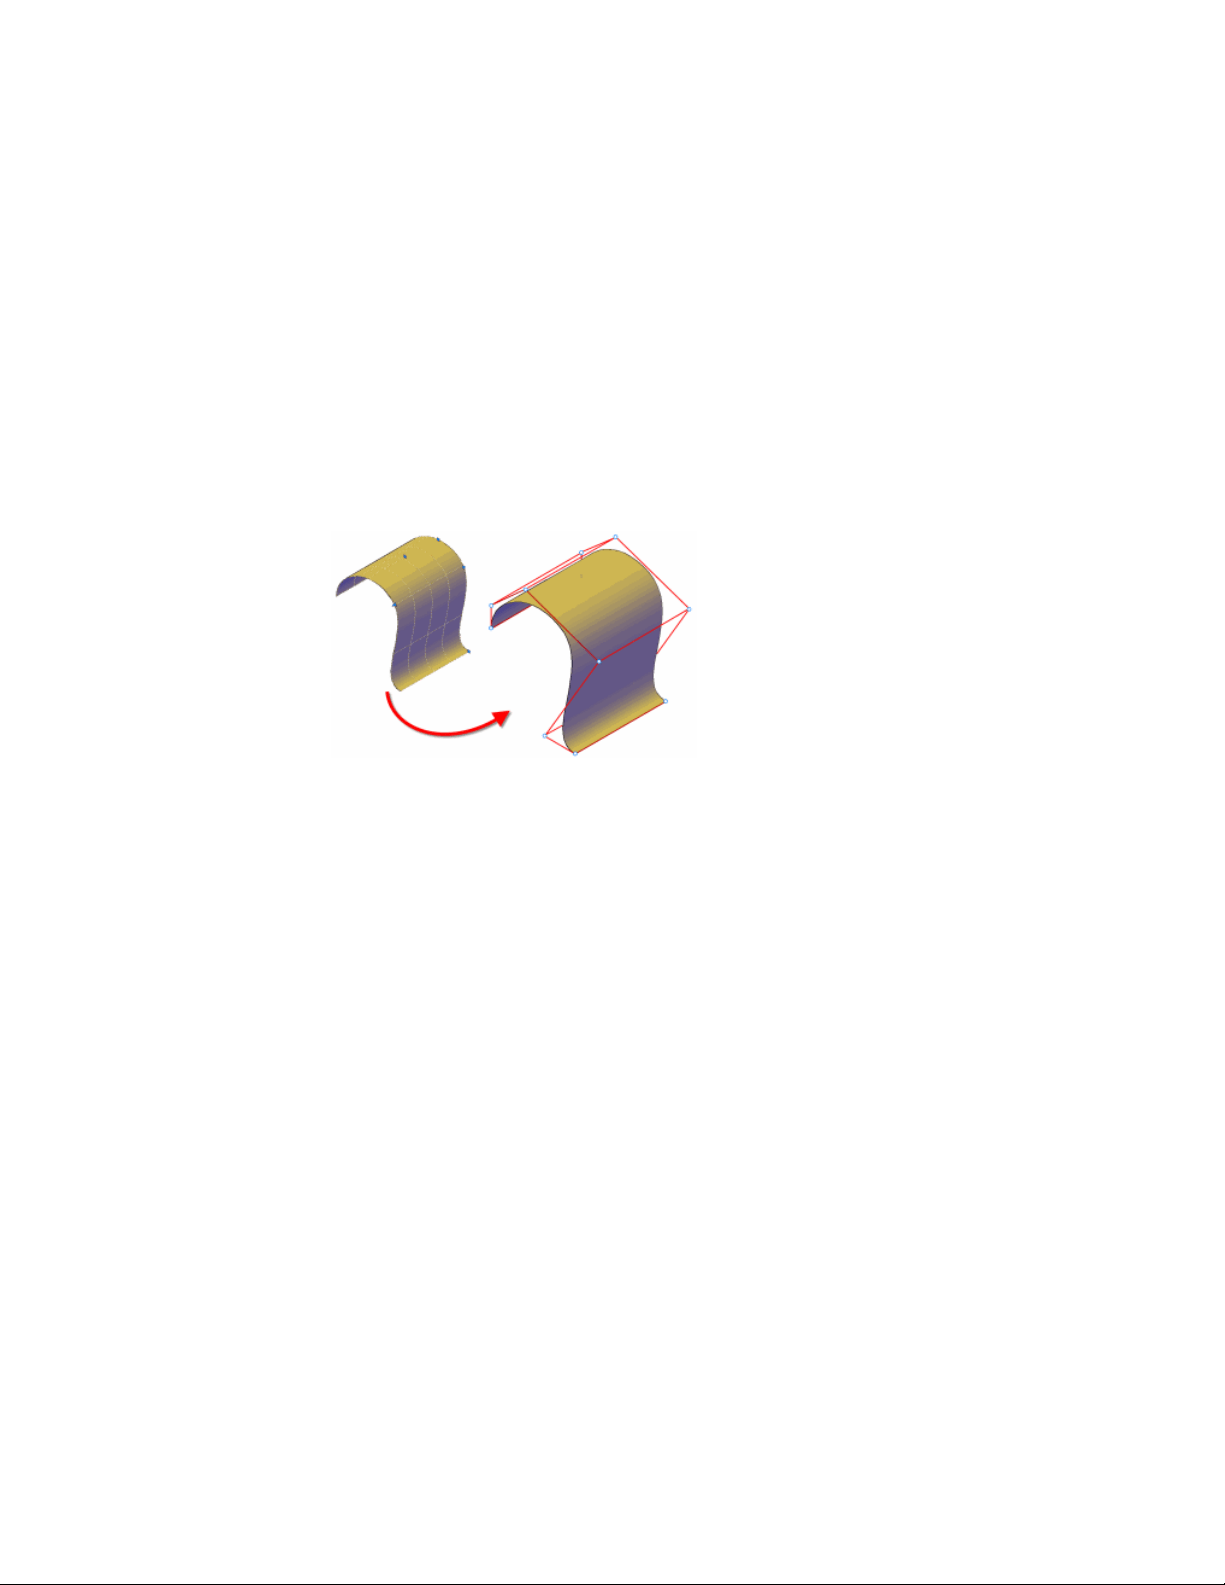
In addition to 3D solid and mesh objects, AutoCAD offer two type of surfaces:
procedural and NURBS.
■ Procedural Surfaces can be associative, maintaining relationships with
other objects so that they can be manipulated as a group.
■ NURBS Surfaces are not associative. Instead, they have control vertices
that allow you to sculpt shapes in a more natural way.
Use procedural surfaces to take advantage of associative modeling, and use
NURBS surfaces to take advantage of sculpting with control vertices. The
illustration below shows a procedural surface on the left, and a NURBS surface
on the right.
Choose a Surface Creation Method
Create procedural and NURBS surfaces using the following methods:
■ Create surfaces from profiles (page 342). Create surfaces from profile
shapes composed of lines and curves with EXTRUDE, LOFT, PLANESURF,
REVOLVE, SURFNETWORK, and SWEEP.
■ Create surfaces from other surfaces (page 374). Blend, patch, extend,
fillet, and offset surfaces to create new surfaces (SURFBLEND, SURFPATCH,
SURFEXTEND, SURFFILLET and SURFOFFSET).
■ Convert objects into procedural surfaces (page 377). Convert existing
solids (including composite objects), surfaces, and meshes into procedural
surfaces (CONVTOSURFACE command).
■ Convert procedural surfaces into NURBS surfaces (page 378). Some
objects cannot be converted directly to NURBS (for example, mesh objects).
In that case, convert the object to a procedural surface and then convert
it to a NURBS surface. (CONVTONURBS command).
370 | Chapter 8 Work with 3D Models
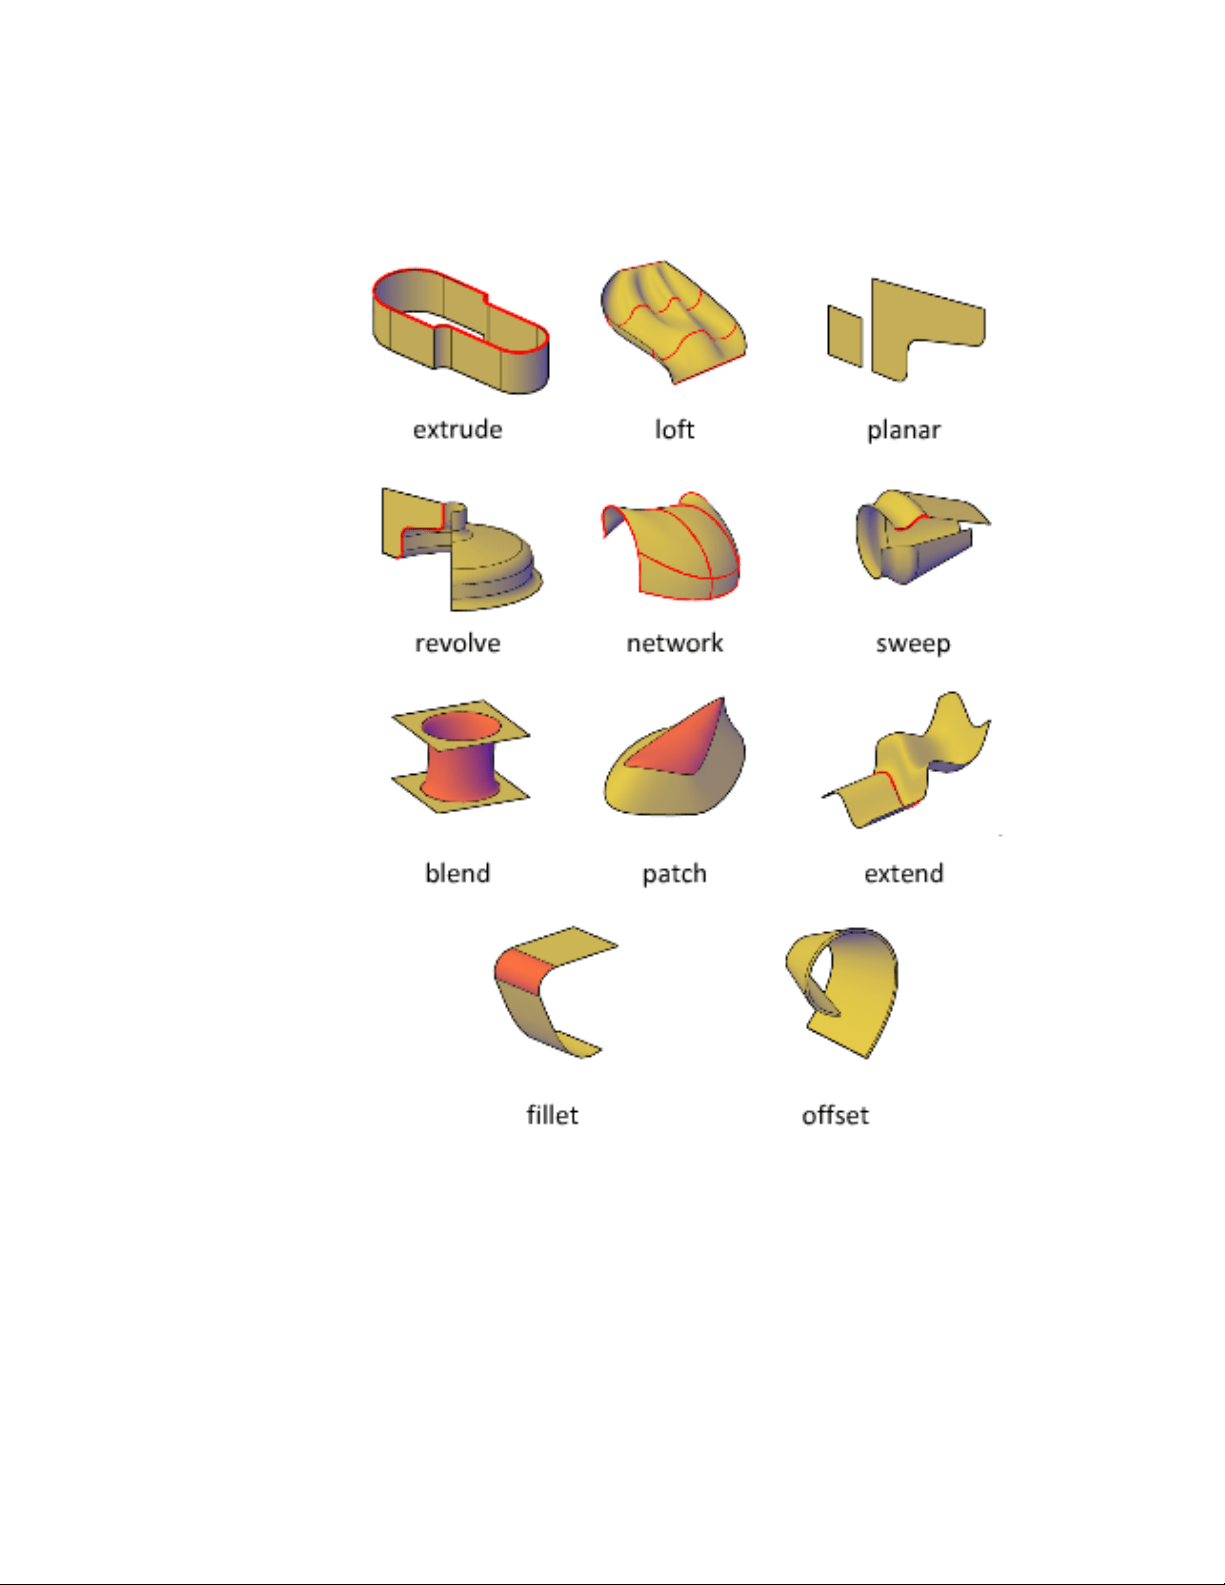
Create 3D Models | 371
Understand Surface Continuity and Bulge Magnitude
Surface continuity and bulge magnitude are properties that are frequently
used when creating surfaces. When you create a new surface, you can specify
the continuity and bulge magnitude with special grips.
Continuity is a measure of how smoothly two curves or surfaces flow into
each other. The type of continuity can be important if you need to export
your surfaces to other applications.
Continuity types include the following:
■ G0 (Position).Measures location only. If the edge of each surface is
collinear, the surfaces are positionally continuous (G0) at the edge curves.
Note that two surfaces can meet at any angle and still have positional
continuity.
■ G1 (Tangency). Includes both positional and tangential continuity (G0
+ G1). With tangentially continuous surfaces, the end tangents match at
the common edges. The two surfaces appear to be traveling in the same
direction at the join, but they may have very different apparent “speeds”
(or rates of change in direction, also called curvature).
372 | Chapter 8 Work with 3D Models
■ G2 (Curvature).Includes positional, tangential, and curvature continuity
(G0 + G1+G2). The two surfaces share the same curvature.
Bulge magnitude is a measure of how much surface curves or “bulges” as it
flows into another surface. Magnitude can be between 0 and 1 where 0 is flat
and 1 curves the most.
Set Surface Properties Before and After Creation
Set defaults that control a variety of surface properties before and after you
create the surface objects.
■ Surface Modeling System Variables. There are a number of system variables
that are frequently used and changed during surface creation:
SURFACEMODELINGMODE, SURFACEASSOCIATIVITY,
SURFACEASSOCIATIVITYDRAG, SURFACEAUTOTRIM, and
SUBOBJSELECTIONMODE.
Create 3D Models | 373

■ Properties Inspector. Modifies properties for both the surface objects and
their subobjects after they are created. For example, you can change the
number of isolines in the U and V directions.
Create Procedural Surfaces
Create procedural surfaces by blending, patching, and offsetting existing
surfaces or by converting 3D solids, meshes and other planar geometry.
Create Surfaces from Other Surfaces
There are many ways to create procedural surfaces from existing surfaces.
These include blending, patching, and offsetting or creating network and
planar surfaces.
When you create procedural surfaces, use SURFACEASSOCIATIVITY to work
with the surfaces as a group. Just as you can modify the face of a solid and
have the entire solid update, when you modify a group of surfaces that are
associative, all of the surfaces update accordingly.
Create Planar Surfaces
Create planar surfaces in the space between edge subobjects, splines and other
2D and 3D curves.
Create planar surfaces with the PLANESURF command Planar surfaces can be
created from multiple closed objects and the curves can be surface or solid
edge subobjects. During creation, specify the tangency and bulge magnitude.
See also:
Overview of Creating Surfaces (page 369)
Create Network Surfaces
Create non-planar surfaces in the space between edge subobjects, splines and
other 2D and 3D curves.
374 | Chapter 8 Work with 3D Models

Create non-planar, network surfaces with the SURFNETWORK command.
Network surfaces are similar to lofted surfaces in that they are created in the
space between several curves in the U and V directions. The curves can be
surface or solid edge subobjects. When you create the surface you can specify
the tangency and bulge magnitude of the surface edges.
See also:
Overview of Creating Surfaces (page 369)
Blend a Surface
Create a transition surface between two existing surfaces.
Use SURFBLEND to create a new surface between existing surfaces and solids.
When you blend surfaces together, specify the surface continuity and bulge
magnitude for the start and end edges.
See also:
Overview of Creating Surfaces (page 369)
Patch a Surface
Create a surface by patching a closed surface or curve.
Use SURFPATCH to create a surface inside a closed curve (such as a closed
spline) that is another surface’s edge. You can also draw a guide curve to
constrain the shape of the patch surface with the constrain geometry option.
When you patch surfaces, specify the continuity and bulge magnitude.
See also:
Overview of Creating Surfaces (page 369)
Offset a Surface
Create a parallel surface a specified distance from the original surface.
With SURFOFFSET specify the offset distance and whether or not the offset
surface maintains associativity with the original surface. You can also specify
Create 3D Models | 375
the offset distance with a mathematical expression. See Constrain a Design
with Formulas and Equations (page 301).
Surface Offset Options
When you offset a surface, you can do the following:
■ Change the offset direction with the Flip option
■ Offset in both directions to create two new surfaces
■ Create a solid between the offset surfaces
■ If you are offsetting more than one surface, you can specify whether the
offset surfaces remain connected.
376 | Chapter 8 Work with 3D Models
■ Enter an expression that will constrain the distance of the offset surface
to the original surface. This option only appears if associativity is on. See
Constrain a Design with Formulas and Equations (page 301).
See also:
Overview of Creating Surfaces (page 369)
Convert Objects to Procedural Surfaces
Convert 3D solids, meshes, and 2D geometry to procedural surfaces.
Use CONVTOSURFACE to convert any of the following objects into surfaces:
■ 2D solids
■ Meshes
■ Regions
■ Open, zero-width polylines with thickness
■ Lines with thickness
■ Arcs with thickness
■ Planar 3D faces
Create 3D Models | 377
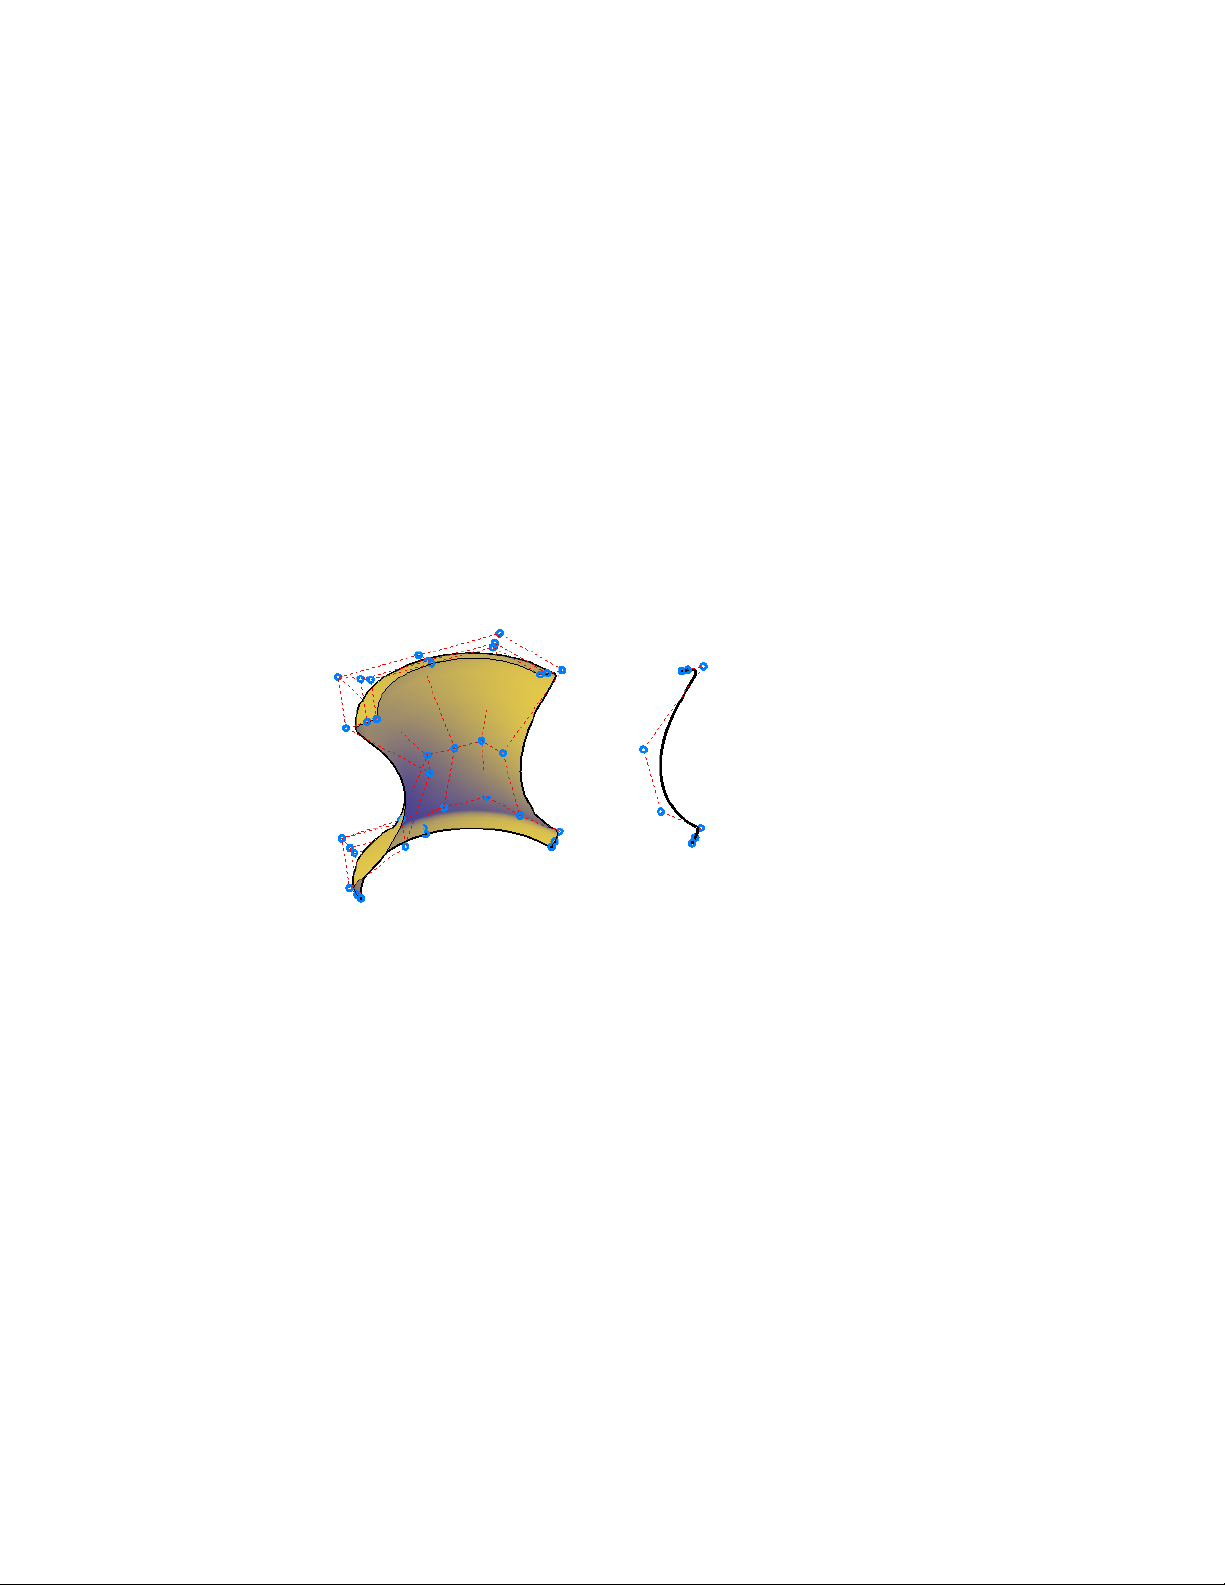
Create NURBS Surfaces
Create NURBS surfaces by enabling NURBS creation and using many of the
same commands used to create procedural surfaces. You can also convert
existing procedural surfaces into NURBS surfaces.
NURBS (Non-Uniform Rational B-Splines) surfaces are part of the suite of 3D
modeling objects that AutoCAD offers (in addition to 3D solids, procedural
surfaces, and meshes).
NURBS surfaces are based on Bezier curves or splines. Therefore, settings such
as degree, fit points, control vertices, weights, and knot parameterization are
important in defining a NURBS surface or curve. AutoCAD splines are
optimized to create NURBS surfaces allowing you to control many of these
options (see SPLINE and SPLINEDIT). The illustration below shows the control
vertices that display when you select a NURBS surface or spline.
Two Methods for Creating NURBS Surfaces
There are two ways to create NURBS surfaces:
■ SURFACEMODELINGMODE system variable - Use any of the surface
creation commands while this system variable is set to 1.
■ CONVTONURBS command - Convert any existing surfaces with this
command.
It is important to plan ahead with NURBS modeling, since NURBS surfaces
cannot be converted back into procedural surfaces.
See also:
Create Solids and Surfaces from Lines and Curves (page 342)
378 | Chapter 8 Work with 3D Models

Create Surfaces from Other Surfaces (page 374)
Edit NURBS Surfaces (page 448)
Rebuild NURBS Surfaces and Curves (page 449)
Draw Splines (page 210)
Modify Splines (page 274)
Using the Spline tool to create NURBS Surfaces and
Splines
The spline tool is optimized to work with NURBS modeling
NURBS surfaces can be created from a number of 2D objects, including edge
subobjects, polylines, and arcs. But the spline tool is the only object that has
options that are compatible with creating NURBS surface. Not only do splines
consists of Bezier arcs, but they also can be defined with both control vertices
and fit points. The fit points and control vertices offer different editing options
such as knot parameterization and degree options.
Moving Fit Points vs. Moving Control Vertices
NURBS curves have both fit points and control vertices. The fit points lie on
the line, and the control vertices lay outside the line. Use fit points to make
a change to one small part of a curve; use control vertices to make changes
that will affect the shape of the curve as a whole.
Clamp Surfaces and Curves with Open and Closed Geometry
NURBS surfaces and curves can have a clamp, closed, or open form. The form
affects how the object deforms.
■ Open Curves and surfaces - have their start and end CVs in different
positions - it doesn’t form a loop. If you snap the start and end CVs of an
open curve to the same position, it’s still an open curve, because you can
still drag these points away from one another.
■ Closed Curves and Surfaces - a loop with coinciding start and end CVs.
Where they meet is called a seam. If you move one CV, the other moves
with it.
■ Clamp Curve - is a closed loop with a seam that creates extra, unseen
CVs. These unseen CVs can cause the shape to wrinkle and crease when
it is reshaped.
Create 3D Models | 379

See also:
Draw Splines (page 210)
Modify Splines (page 274)
Create Associative Surfaces
Associative surfaces automatically adjust to changes made to other, related
objects.
When surface associativity is on, surfaces are created with a relationship to
the surface or profiles that created them.
Associativity allows you to:
■ Reshape the generating profiles to automatically reshape the surface.
■ Work with a group of surfaces as if they were one object. Just as reshaping
one face of a solid box adjusts the entire primitive, reshaping one surface
or edge in a group of associated surfaces adjusts the entire group.
■ Use geometric constraints on the 2D profiles of a surface.
■ Assign mathematical expressions to derive properties of surfaces, such as
height and radius. For example, specify that the height of an extruded
surface be equal to one half the length of another object.
As you add more objects and edit them, all these objects become related and
create a chain of dependency. Editing one object can ripple through and affect
all associated objects.
It is important to understand the chain of associativity because moving or
deleting one of the links in the chain can break the relationship between all
the objects.
NOTE To modify the shape of a surface that is generated from a curve or spline,
you must select and modify the generating curve or spline, not the surface itself.
If you modify the surface itself, you will lose associativity.
When associativity is on, the DELOBJ system variable is ignored. If Surface
Associativity and NURBS Creation are both on, surface are created as NURBS
surfaces, not associative surfaces.
Save time by planning your model ahead; you cannot go back and add
associativity after the model has been created. Also, be careful not to
accidentally break associativity by dragging objects away from the group.
380 | Chapter 8 Work with 3D Models
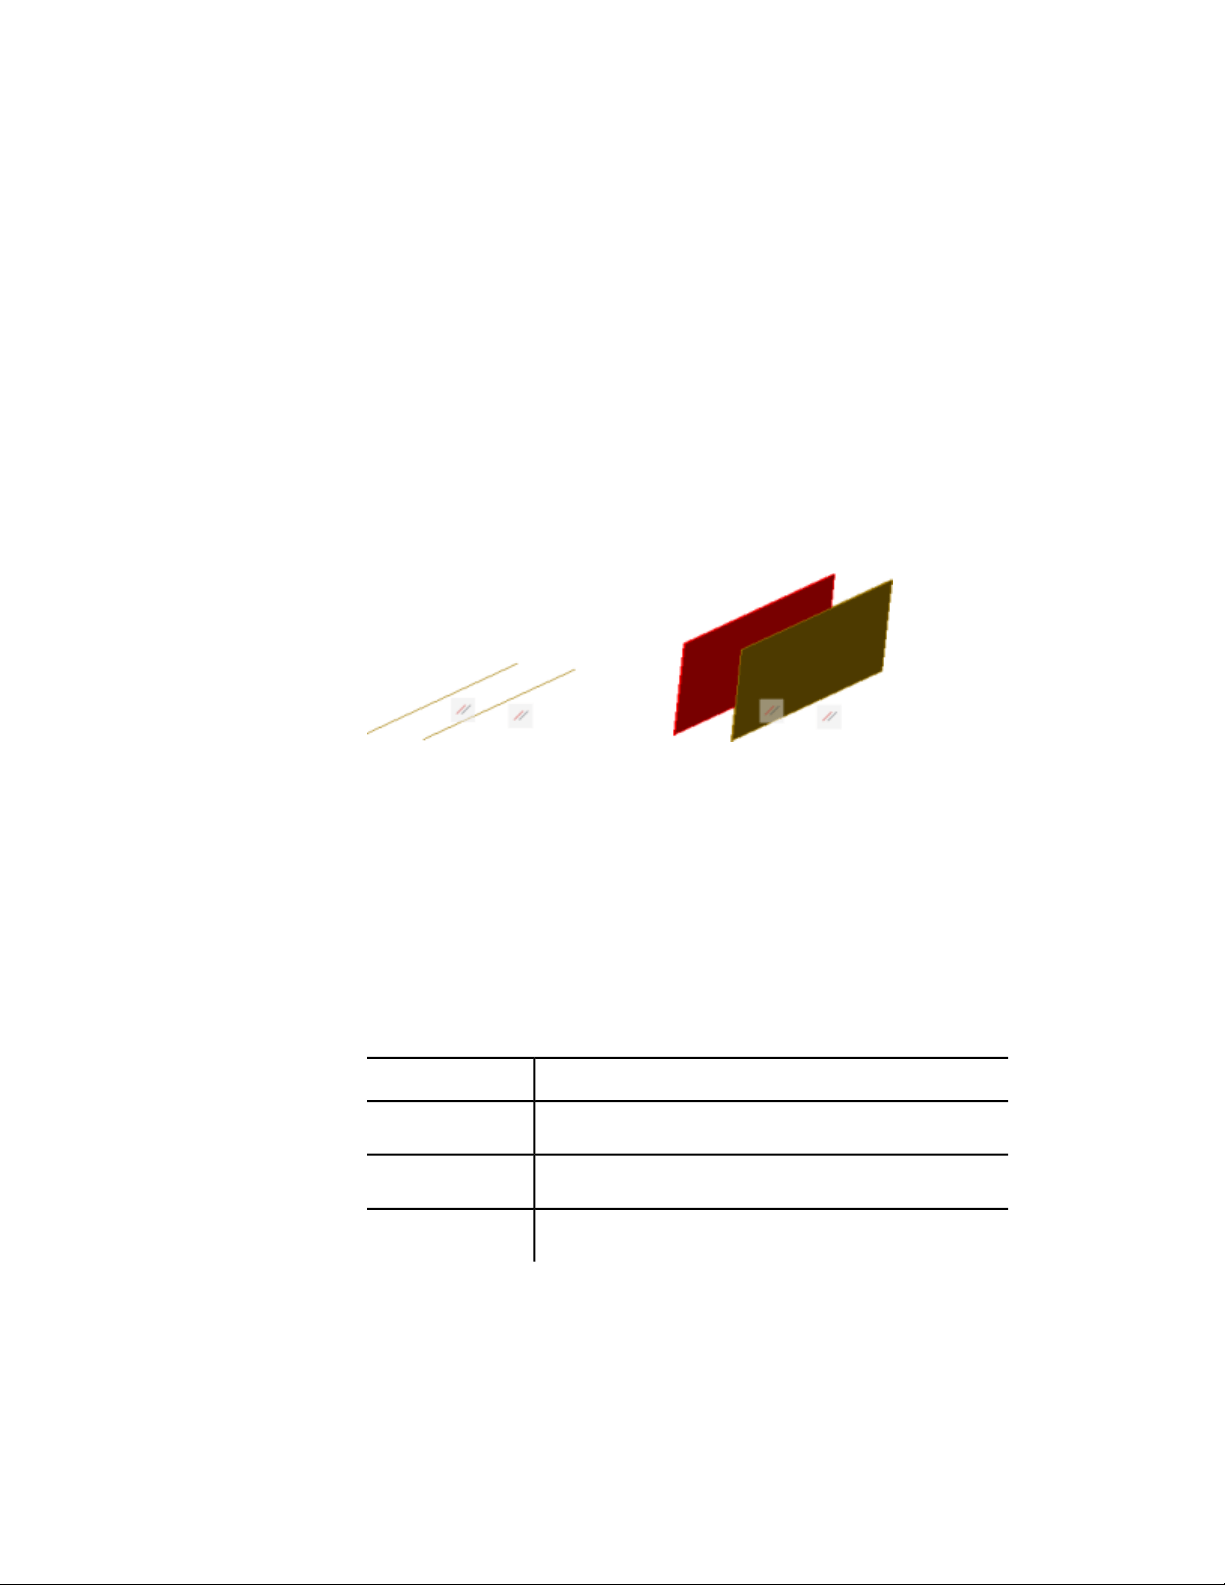
Create Geometric Relationships between Associative
Surfaces
Use geometric constraints to constrain and restrict surfaces. And use
mathematical expressions to derive surface properties.
Use Geometric Constraints with Surface Profiles
Just as with 2D drafting, geometric constraints can be used to restrict the
movement of 3D surfaces. For example, you can specify that a surface remain
fixed in a perpendicular or parallel location to another object. In the example
below, an offset surface is locked in a parallel position to its original surface.
Constraints are applied to the 2D profile object used to create the surface, not
the surface itself. Use selection cycling to be sure that you are selecting the
profile curve and not the surface or the edge subobject. See Apply or Remove
Geometric Constraints (page 285).
Use Mathematical Expressions to Derive Surface Properties
Dimensional constraints are user-defined expressions that are applied in the
Properties Inspector for that surface.
For a complete list of operators and functions allowed in expressions, see
Control Geometry with Parameters (page 302). The following table lists the
surface types and their properties that accept expressions
Surface properties that can be constrained.Type of Surface
Bulge MagnitudeBlend Surface
Extension DistanceExtend Surface
Extruded Surface
■ Height
Create 3D Models | 381
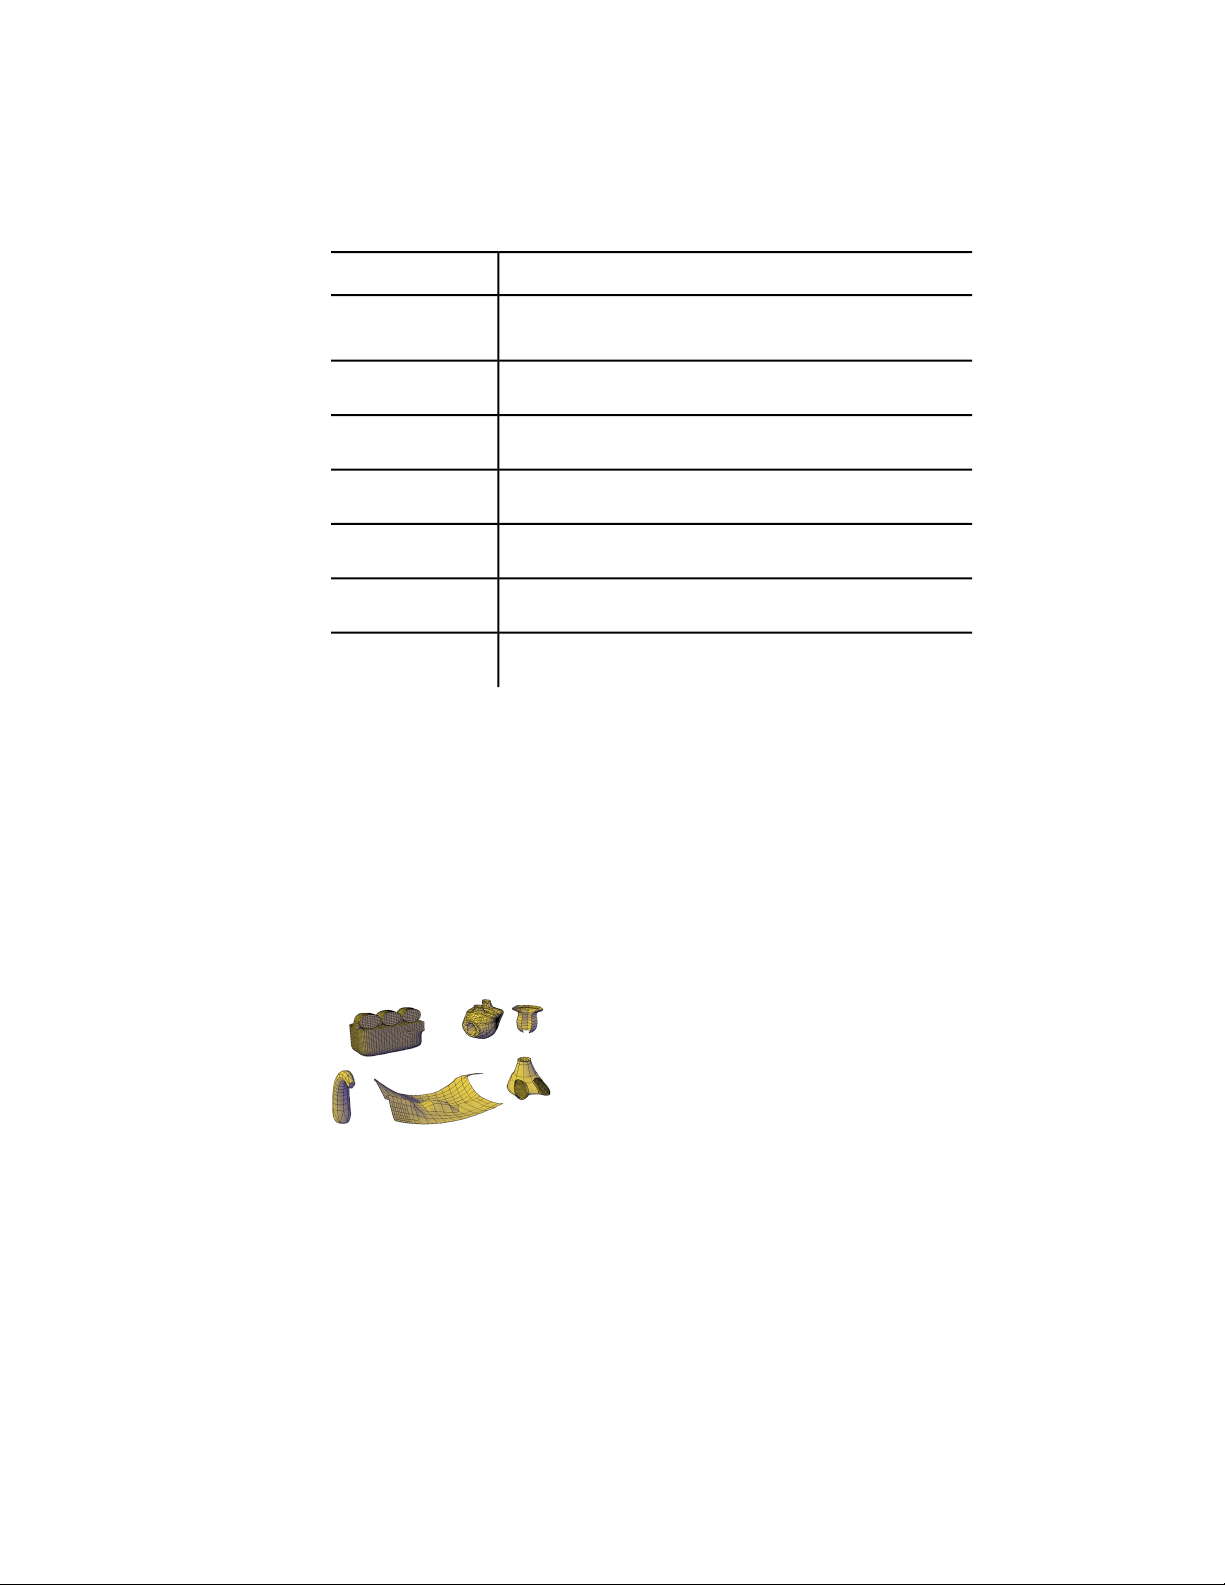
Surface properties that can be constrained.Type of Surface
■ Taper
Fillet RadiusFillet Surface
Bulge MagnitudeLoft Surface
Bulge MagnitudeNetwork Surface
Offset DistanceOffset Surface
Bulge MagnitudePatch Surface
Revolve AngleRevolve Surface
Create Meshes
Create meshes from primitive forms or by filling between points on other
objects.
Overview of Creating Meshes
Mesh tessellation provides enhanced capabilities for modeling object shapes
in a more detailed way.
Starting with AutoCAD 2010, the default mesh object type can be smoothed,
creased, split, and refined. Although you can continue to create the legacy
polyface and polygon mesh types, you can obtain more predictable results by
converting to the newer mesh object type.
382 | Chapter 8 Work with 3D Models

Methods for Creating Mesh
You can create mesh objects using the following methods:
■ Create mesh primitives. Create standard shapes, such as boxes, cones,
cylinders, pyramids, spheres, wedges, and tori (MESH).
■ Create mesh from other objects. Create ruled, tabulated, revolved, or
edge-defined mesh objects, whose boundaries are interpolated from other
objects or points (RULESURF, TABSURF, REVSURF, EDGESURF).
■ Convert from other object types. Convert existing solid or surface
models, including composite models, to mesh objects (MESHSMOOTH).
You can also convert the legacy style of mesh to the new mesh object type.
■ Create custom meshes (legacy). Use 3DMESH to create polygon meshes,
usually scripted with AutoLISP routines, to create open-ended mesh. Use
PFACE to create mesh with multiple vertices defined by coordinates that
you specify. Although you can continue to create legacy polygonal and
polyface meshes, it is recommended that you convert to the enhanced
mesh object type to obtain enhanced editing capabilities.
About Tessellation
Tessellation is a collection of planar shapes that tile a mesh object. The
tessellation divisions, visible in unselected mesh objects, mark the edges of
the editable mesh faces. (To see these divisions in the Hidden or Conceptual
visual styles, VSEDGES must be set to 1.)
When you smooth and refine mesh objects, you increase the density of the
tessellation (the number of subdivisions).
■ Smoothing.Increases how closely the mesh surface adheres to a rounded
form. You can increase mesh smoothness levels for selected objects in
increments or by changing the smoothness level in the Properties Inspector.
Smoothness level 0 (zero) applies the lowest level of smoothing to a mesh
object. Smoothness level 4 applies a high degree of smoothness.
Create 3D Models | 383
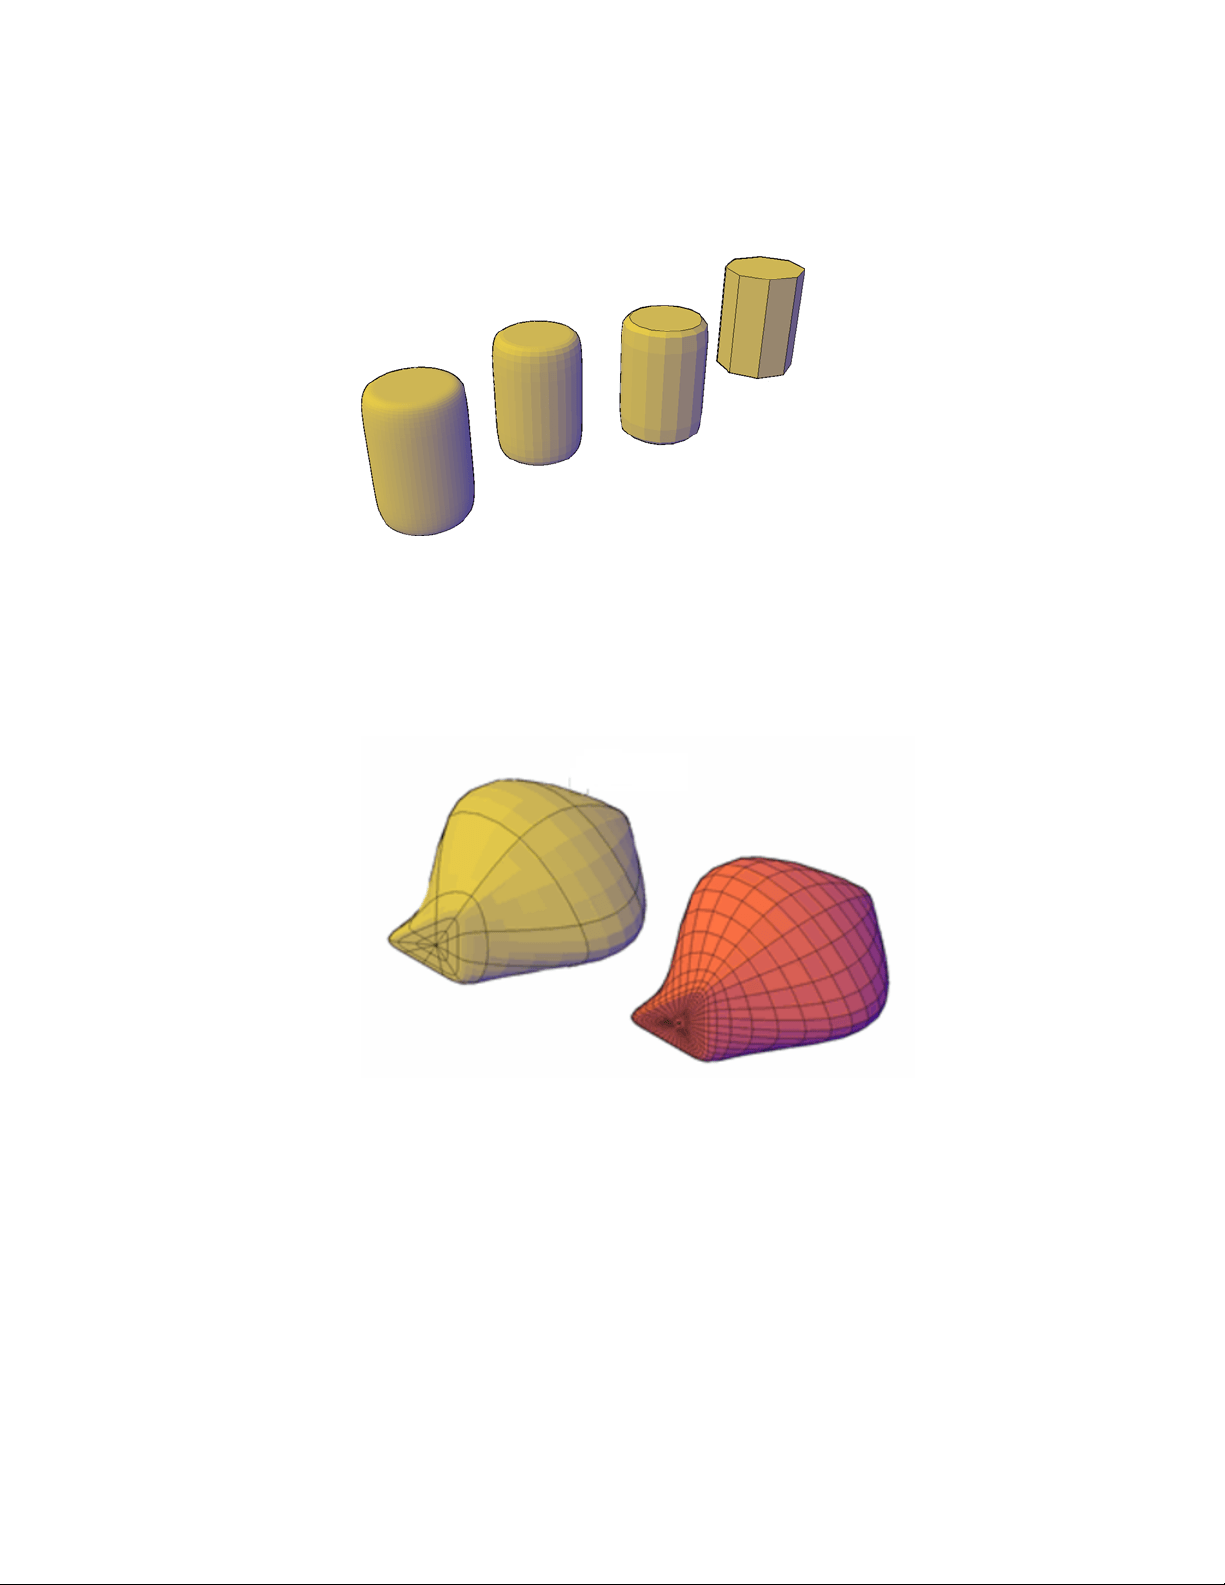
■ Refinement.Quadruples the number of subdivisions in a selected mesh
object or in a selected subobject, such as a face. Refinement also resets the
current smoothness level to 0, so that the object can no longer be sharpened
beyond that level. Because refinement greatly increases the density of a
mesh, you might want to restrict this option to areas that require finely
detailed modification. Refinement also helps you mold smaller sections
with less effect on the overall shape of the model.
While highly refined mesh gives you the ability to make detailed modifications,
it also comes at a cost: it can decrease program performance. By maintaining
maximum smoothness, face, and grid levels, you can help ensure that you do
not create meshes that are too dense to modify effectively. (Use
SMOOTHMESHMAXLEV, SMOOTHMESHMAXFACE, and
SMOOTHMESHGRID.)
384 | Chapter 8 Work with 3D Models
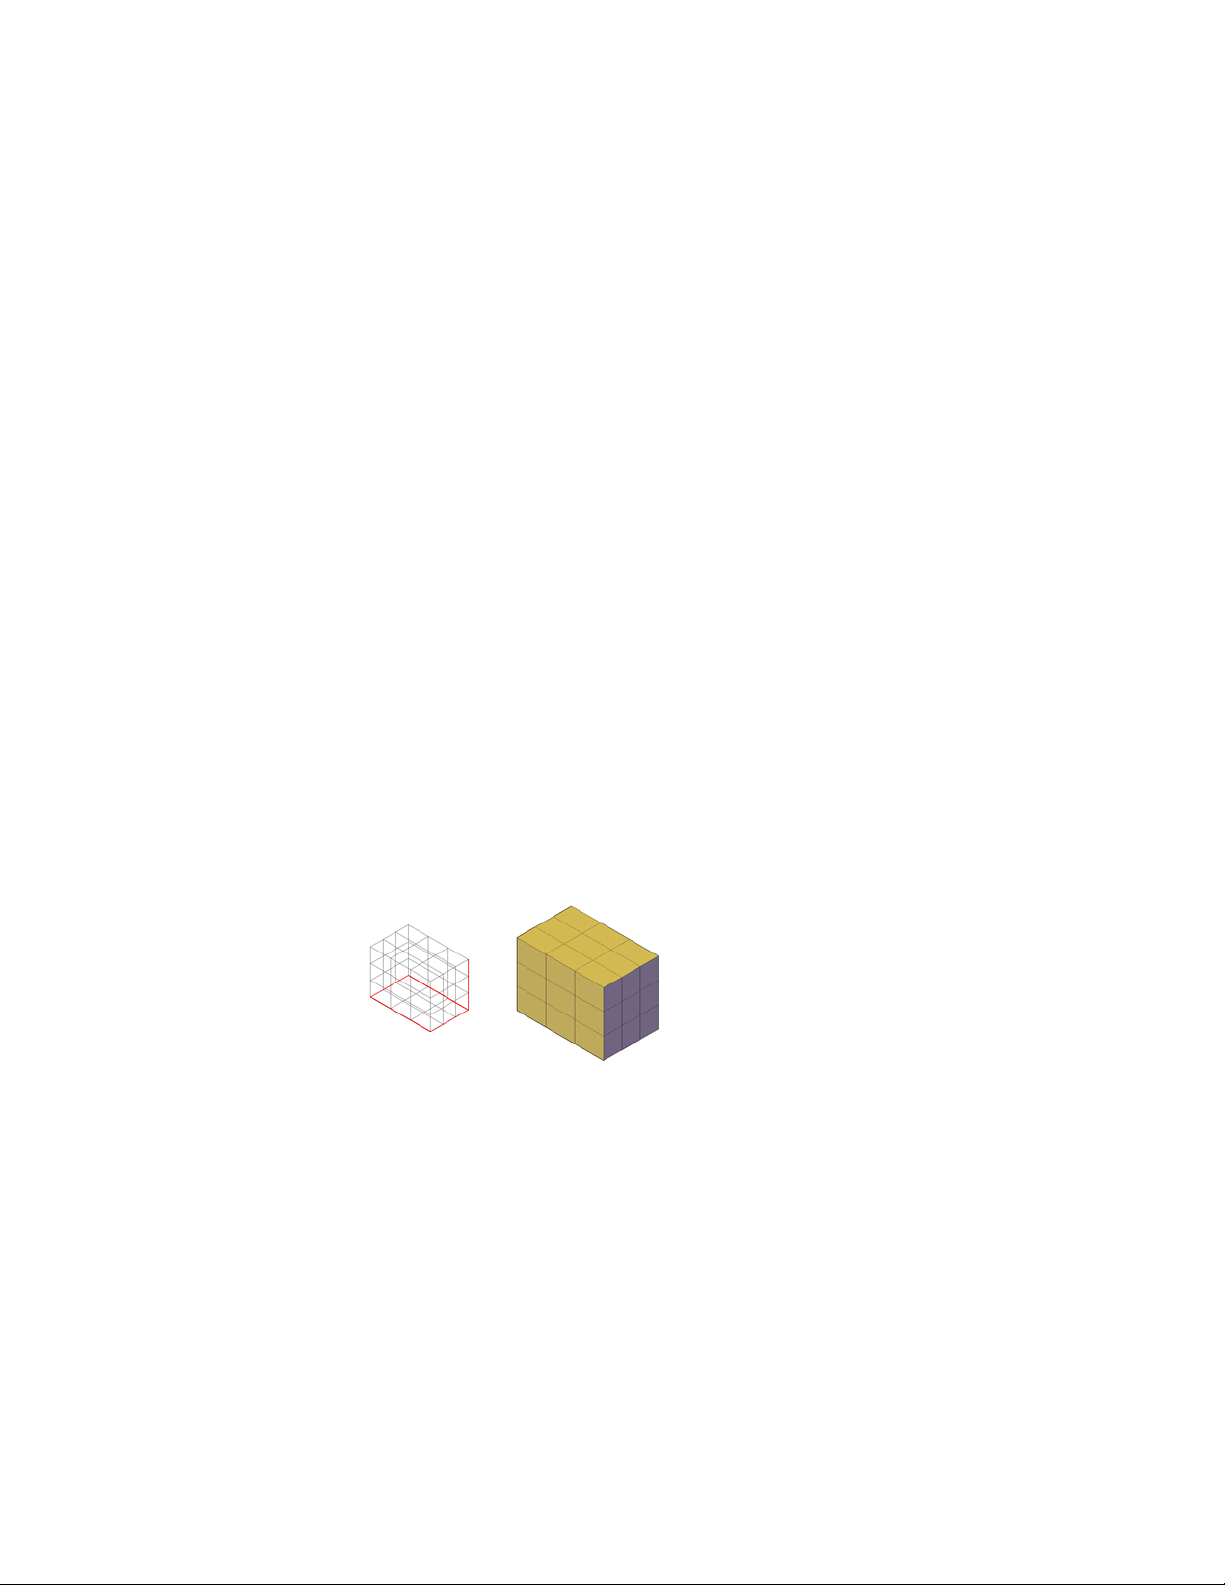
Set Mesh Properties Before and After Creation
You can set defaults that control a variety of mesh properties before and after
you create the mesh objects.
■ Properties Inspector. Modifies properties for both the mesh object and
its subobjects after they are created. For a selected mesh object, you can
modify the level of smoothness. For faces and edges, you can apply or
remove creasing, and modify crease retention levels.
■ Level of smoothness. By default, the mesh primitive objects that you
create have no smoothness. You can change this default with the Settings
option of the MESH command. The modified smoothness value is
maintained only during the current drawing session.
See also:
Modify Mesh Objects (page 454)
Create 3D Mesh Primitives
Create mesh boxes, cones, cylinders, pyramids, spheres, wedges, and tori.
Create a Mesh Box
Create a rectangular or cubical mesh box.
The base of the mesh box is drawn parallel to the XY plane of the current UCS
(work plane).
The following system variables are used to control the number of divisions
for each dimension of a new mesh box:
■ DIVMESHBOXHEIGHT
■ DIVMESHBOXLENGTH
Create 3D Models | 385
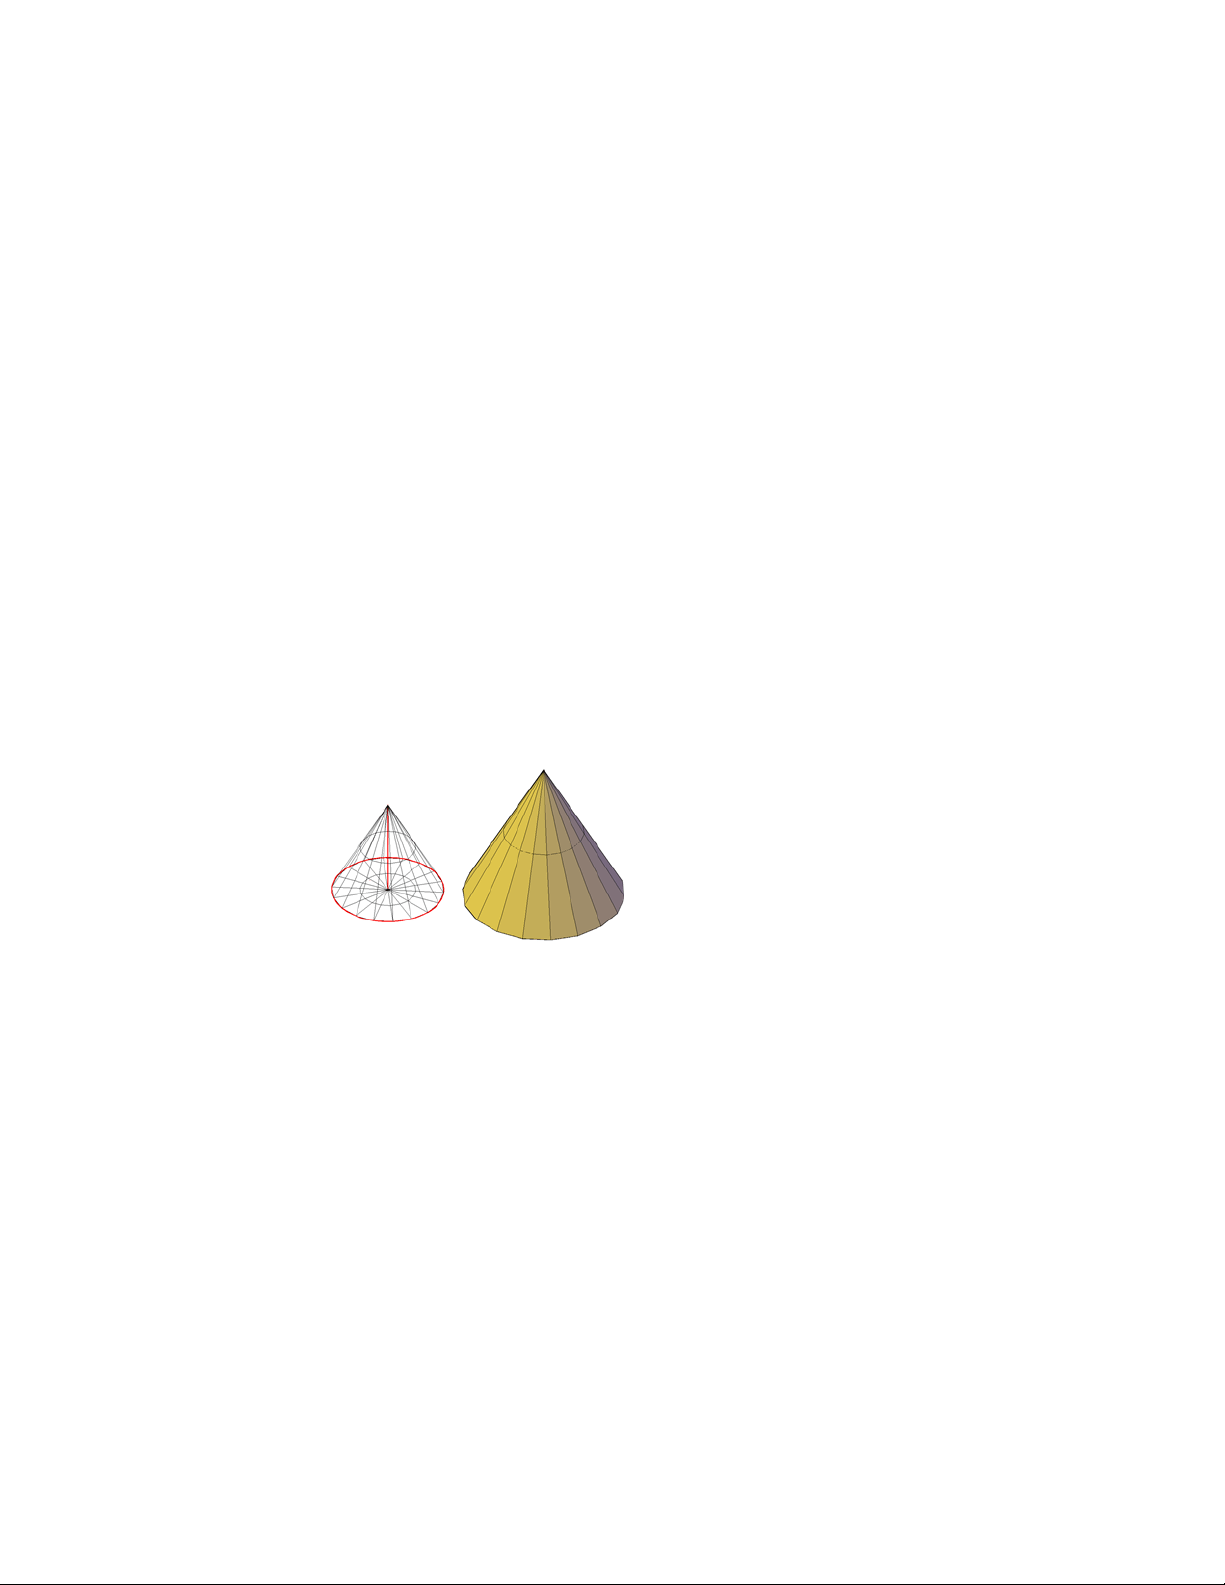
■ DIVMESHBOXWIDTH
After a mesh primitive is created, the current level of smoothness for the object
can be modified.
Mesh Box Creation Options
The Box option of the MESH command provides several methods for
determining the size and rotation of the mesh boxes you create.
■ Create a cube. Use the Cube option to create a mesh box with sides of
equal length.
■ Specify rotation. Use the Cube or Length option if you want to set the
rotation of the box in the XY plane.
■ Start from the center point. Use the Center option to create a box
using a specified center point.
Create a Mesh Cone
Create a pointed or frustum mesh cone with a circular or elliptical base.
By default, the base of the mesh cone lies on the XY plane of the current UCS
and the height of the cone is parallel to the Z axis.
The following system variables are used to control the number of divisions
for each dimension of a new mesh cone:
■ DIVMESHCONEAXIS
■ DIVMESHCONEBASE
■ DIVMESHCONEHEIGHT
After a mesh primitive is created, the current level of smoothness for the object
can be modified.
386 | Chapter 8 Work with 3D Models
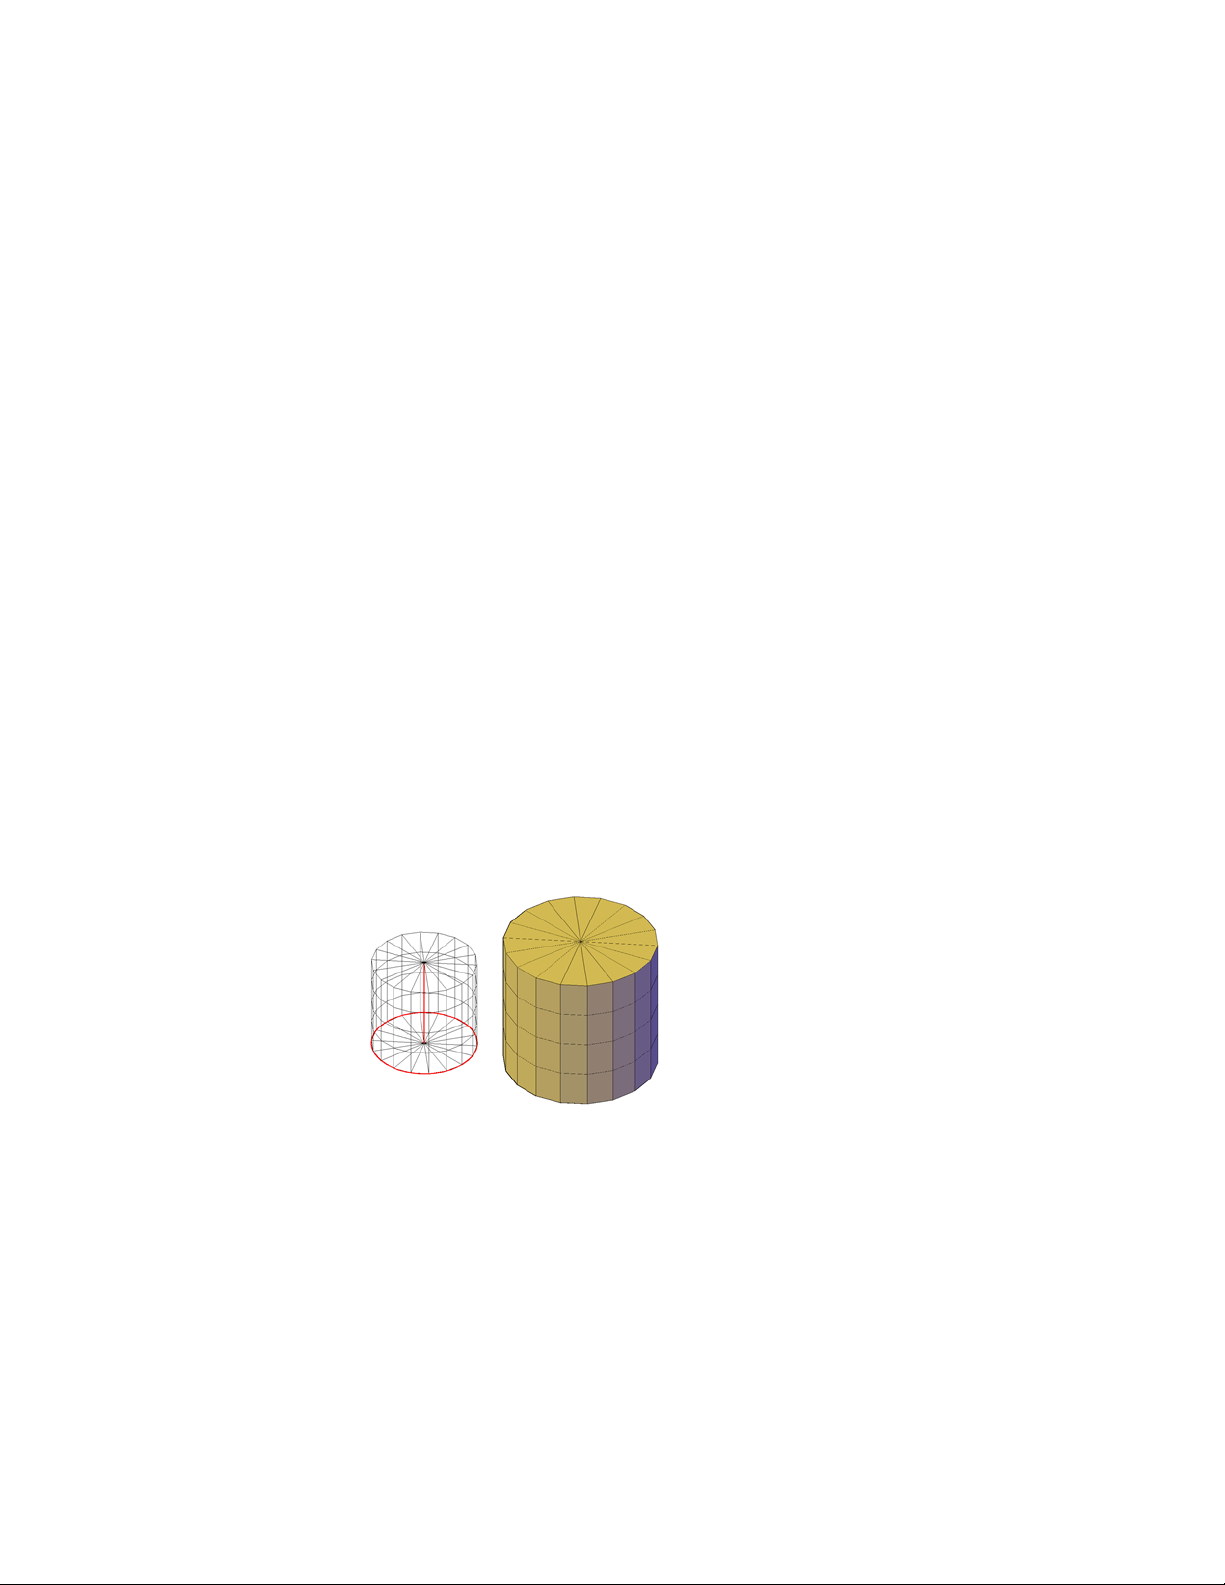
Mesh Cone Creation Options
The Cone option of the MESH command provides several methods for
determining the size and rotation of the mesh cones you create.
■ Set the height and orientation. Use the Axis Endpoint option when
you want to reorient the cone by placing the tip or axis endpoint anywhere
in 3D space.
■ Create a frustum of a cone. Use the Top Radius option to create a
frustum of a cone, which tapers to an elliptical or planar face.
■ Specify circumference and base plane. The 3P (Three Points) option
defines the size and plane of the base of the cone anywhere in 3D space.
■ Create an elliptical base. Use the Elliptical option to create a cone base
whose axes are different lengths.
■ Set the location to be tangent to two objects. Use the Ttr (Tangent,
Tangent, Radius) option to define points on two objects. Depending on
the radius distance, the new cone is located as near as possible to the
tangent points you specify. You can set up tangency with circles, arcs,
lines, and some 3D objects. The tangency points are projected onto the
current UCS. The appearance of tangency is affected by the current level
of smoothness.
Create a Mesh Cylinder
Create a mesh cylinder with a circular or elliptical base.
By default, the base of the mesh cylinder lies on the XY plane of the current
UCS. The height of the cylinder is parallel to the Z axis.
The following system variables are used to control the number of divisions
for each dimension of a new mesh cylinder:
■ DIVMESHCYLAXIS
Create 3D Models | 387

■ DIVMESHCYLBASE
■ DIVMESHCYLHEIGHT
After a mesh primitive is created, the current level of smoothness for the object
can be modified.
Mesh Cylinder Creation Options
The Cylinder option of the MESH command provides several methods for
determining the size and rotation of the mesh cylinders you create.
■ Set rotation. Use the Axis Endpoint option to set the height and rotation
of the cylinder. The center point of the top plane of the cylinder is the
axis endpoint, which can be located anywhere in 3D space.
■ Use three points to define the base. Use the 3P (Three Points) option
to define the base of the cylinder. You can set three points anywhere in
3D space.
■ Create an elliptical base. Use the Elliptical option to create a cylinder
base whose axes are different lengths.
■ Set the location to be tangent to two objects. Use the Ttr (Tangent,
Tangent, Radius) option to define points on two objects. Depending on
the radius distance, the new cylinder is located as near as possible to the
tangent points you specify. You can set up tangency with circles, arcs,
lines, and some 3D objects. The tangency points are projected onto the
current UCS. The appearance of tangency is affected by the current level
of smoothness.
Create a Mesh Pyramid
Create a mesh pyramid with up to 32 sides.
Create a pyramid that tapers to a point, or create a frustum of a pyramid,
which tapers to a planar face.
The following system variables are used to control the number of divisions
for each dimension of a new mesh pyramid:
■ DIVMESHPYRBASE
388 | Chapter 8 Work with 3D Models

■ DIVMESHPYRHEIGHT
■ DIVMESHPYRLENGTH
After a mesh primitive is created, the current level of smoothness for the object
can be modified.
Mesh Pyramid Creation Options
The Pyramid option of the MESH command provides several methods for
determining the size and rotation of the mesh pyramids you create.
■ Set the number of sides. Use the Sides option to set the number of
sides for the mesh pyramid.
■ Set the length of the edges. Use the Edges option to specify the
dimension of the sides at the base.
■ Create a frustum of a pyramid. Use the Top Radius option to create
a frustum, which tapers to a planar face. The frustum face is parallel to,
and has the same number of sides as, the base.
■ Set the height and rotation of the pyramid. Use the Axis Endpoint
option to specify the height and rotation of the pyramid. This endpoint
is the top of the pyramid. The axis endpoint can be located anywhere in
3D space.
■ Set the perimeter to be inscribed or circumscribed. Specify whether
the pyramid base is drawn inside or outside of the radius.
Create 3D Models | 389
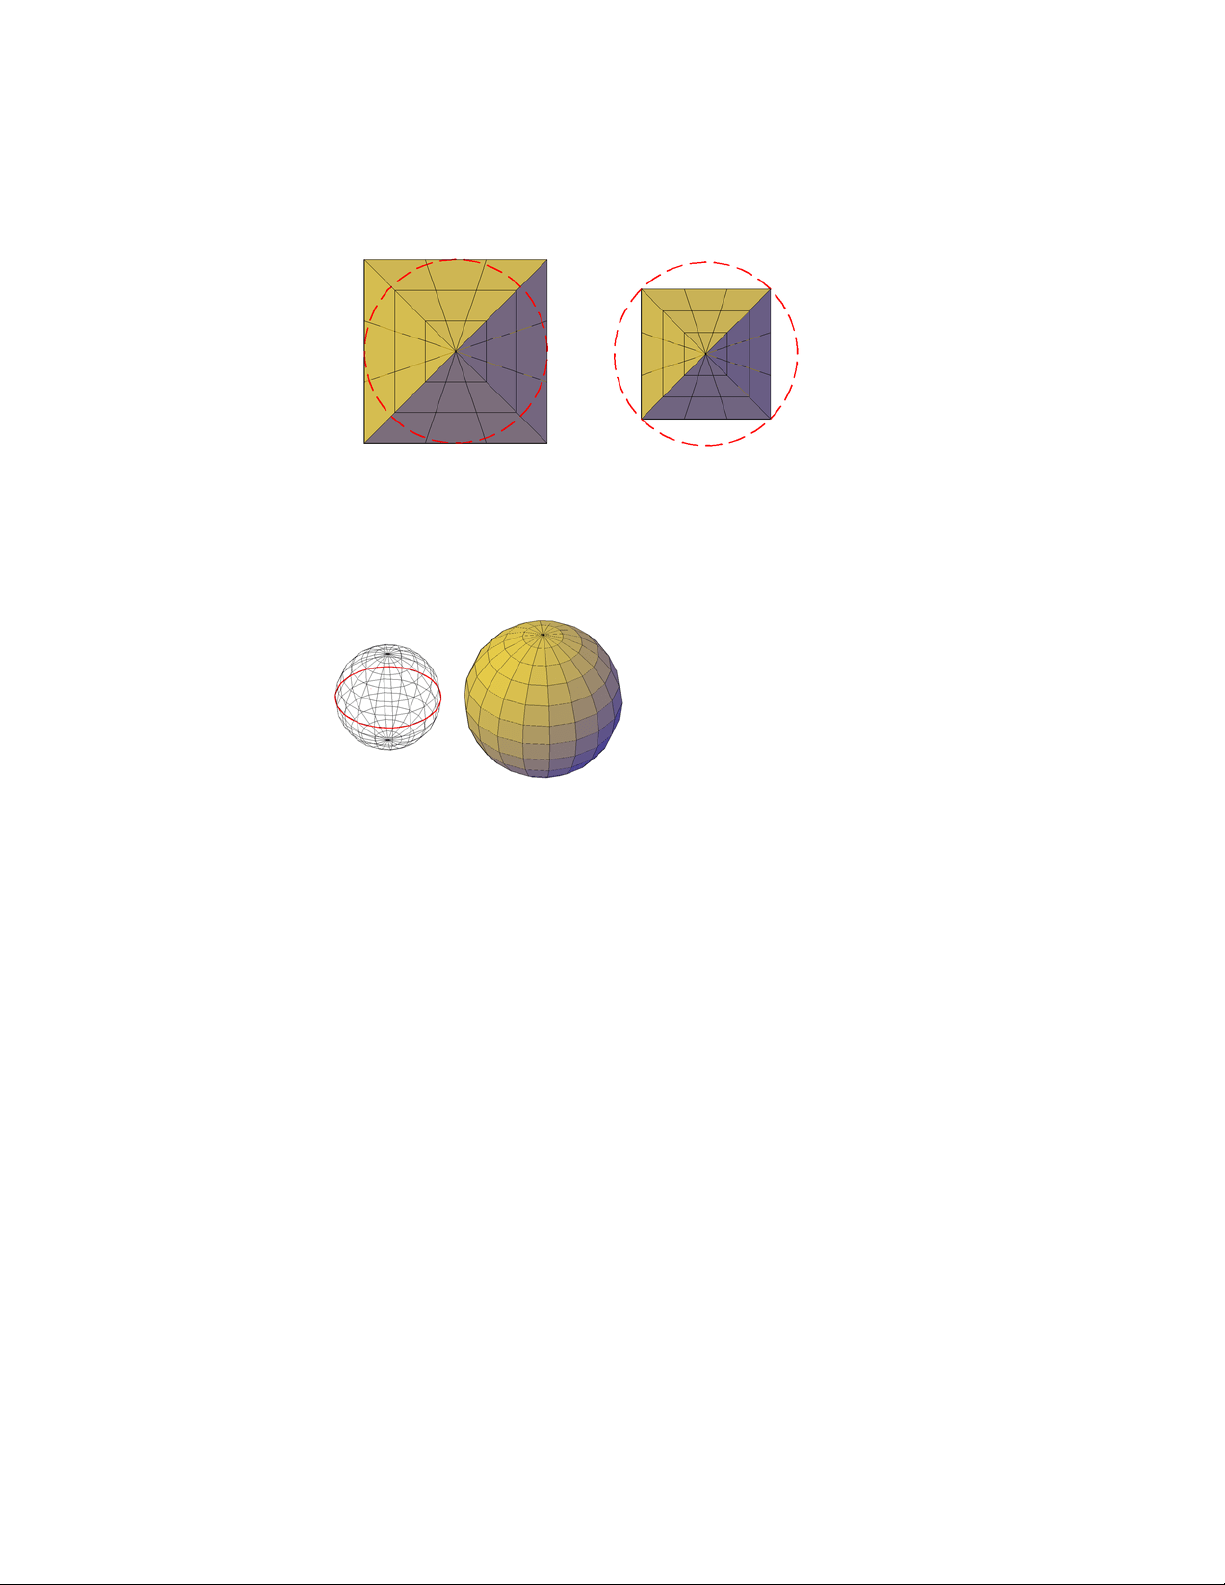
Create a Mesh Sphere
Create a mesh sphere using one of several methods.
When you start with the center point, the central axis of the mesh sphere
parallels the Z axis of the current user coordinate system (UCS).
The following system variables are used to control the number of divisions
for each dimension of a new mesh sphere:
■ DIVMESHSPHEREAXIS
■ DIVMESHSPHEREHEIGHT
After a mesh primitive is created, the current level of smoothness for the object
can be modified.
Mesh Sphere Creation Options
The Sphere option of the MESH command provides several methods for
determining the size and rotation of the mesh spheres you create.
■ Specify three points to set the size and plane of the
circumference or radius. Use the 3P (Three Points) option to define
the size of the sphere anywhere in 3D space. The three points also define
the plane of the circumference.
390 | Chapter 8 Work with 3D Models

■ Specify two points to set the circumference or radius. Use the 2P
(Two Points) option to define the size of the sphere anywhere in 3D space.
The plane of the circumference matches the Z value of the first point.
■ Set the location to be tangent to two objects. Use the Ttr (Tangent,
Tangent, Radius) option to define points on two objects. Depending on
the radius distance, the sphere is located as near as possible to the tangent
points you specify. You can set up tangency with circles, arcs, lines, and
some 3D objects. The tangency points are projected onto the current UCS.
The appearance of tangency is affected by the current level of smoothness.
Create a Mesh Wedge
Create a mesh wedge with rectangular or cubical faces.
The base of the wedge is drawn parallel to the XY plane of the current UCS
with the sloped face opposite the first corner. The height of the wedge is
parallel to the Z axis.
The following system variables are used to control the number of divisions
for each dimension of a new mesh wedge:
■ DIVMESHWEDGEBASE
■ DIVMESHWEDGEHEIGHT
■ DIVMESHWEDGELENGTH
■ DIVMESHWEDGESLOPE
■ DIVMESHWEDGEWIDTH
After a mesh primitive is created, the current level of smoothness for the object
can be modified.
Mesh Wedge Creation Options
The Wedge option of the MESH command provides several methods for
determining the size and rotation of the mesh wedges you create.
■ Create a wedge with sides of equal length. Use the Cube option.
Create 3D Models | 391
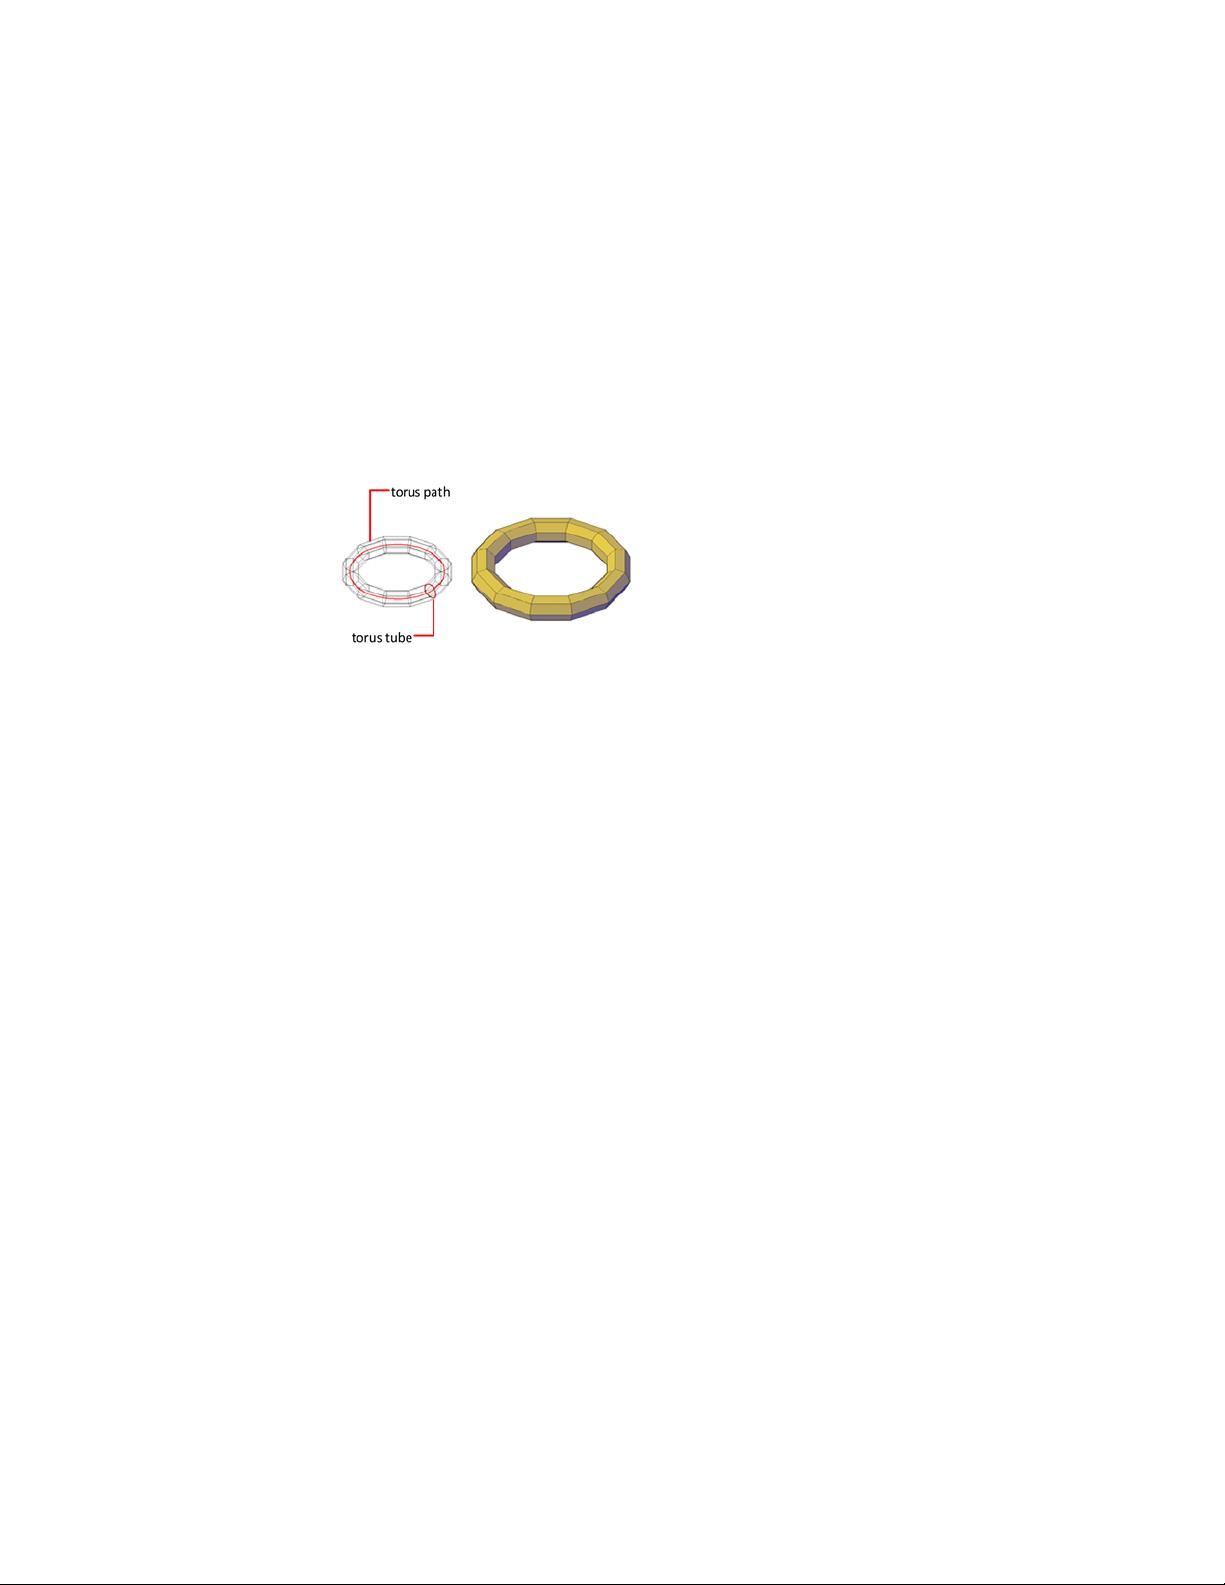
■ Specify rotation. Use the Cube or Length option if you want to set the
rotation of the mesh wedge in the XY plane.
■ Start from the center point. Use the Center Point option.
Create a Mesh Torus
Create a ring-shaped solid that resembles the inner tube of a tire.
A mesh torus has two radius values. One value defines the tube. The other
value defines the path, which is equivalent to the distance from the center of
the torus to the center of the tube. By default, a torus is drawn parallel to and
is bisected by the XY plane of the current UCS.
A mesh torus can be self-intersecting. A self-intersecting mesh torus has no
center hole because the radius of the tube is greater than the radius of the
torus.
The following system variables are used to control the number of divisions
for each dimension of a new mesh torus:
■ DIVMESHTORUSPATH
■ DIVMESHTORUSSECTION
After a mesh primitive is created, the current level of smoothness for the object
can be modified.
Torus Creation Options
The Torus option of the MESH command provides several methods for
determining the size and rotation of the mesh tori you create.
■ Set the size and plane of the circumference or radius. Use the 3P
(Three Points) option to define the size of the mesh torus anywhere in 3D
space. The three points also define the plane of the circumference. Use
this option to rotate the mesh torus as you create it.
392 | Chapter 8 Work with 3D Models

■ Set the circumference or radius. Use the 2P (Two Points) option to
define the size of the mesh torus anywhere in 3D space. The plane of the
circumference matches the Z value of the first point.
■ Set the location to be tangent to two objects. Use the Ttr (Tangent,
Tangent, Radius) option to define points on two objects. Depending on
the specified radius distance, the path of the torus is located as near as
possible to the tangent points you specify. You can set up tangency with
circles, arcs, lines, and some 3D objects. The tangency points are projected
onto the current UCS. The appearance of tangency is affected by the current
level of smoothness.
Construct Meshes from Other Objects
Create mesh forms by filling the space between other objects such as lines
and arcs.
You can use a variety of methods to create mesh objects whose edges are
defined by other objects. The MESHTYPE system variable controls whether
the new objects are valid mesh objects, or whether they are created using
legacy polyface or polygon geometry.
You can control whether the mesh is displayed as a wireframe, hidden, or
conceptual image by changing the visual style (-VISUALSTYLES).
Types of Meshes Created from Other Objects
You can create several types of meshes that are based on existing objects.
■ Ruled mesh.RULESURF creates a mesh that represents the ruled surface
between two lines or curves.
■ Tabulated mesh.TABSURF creates a mesh that represents a general
tabulated surface. The surface is defined by the extrusion of a line or curve
Create 3D Models | 393
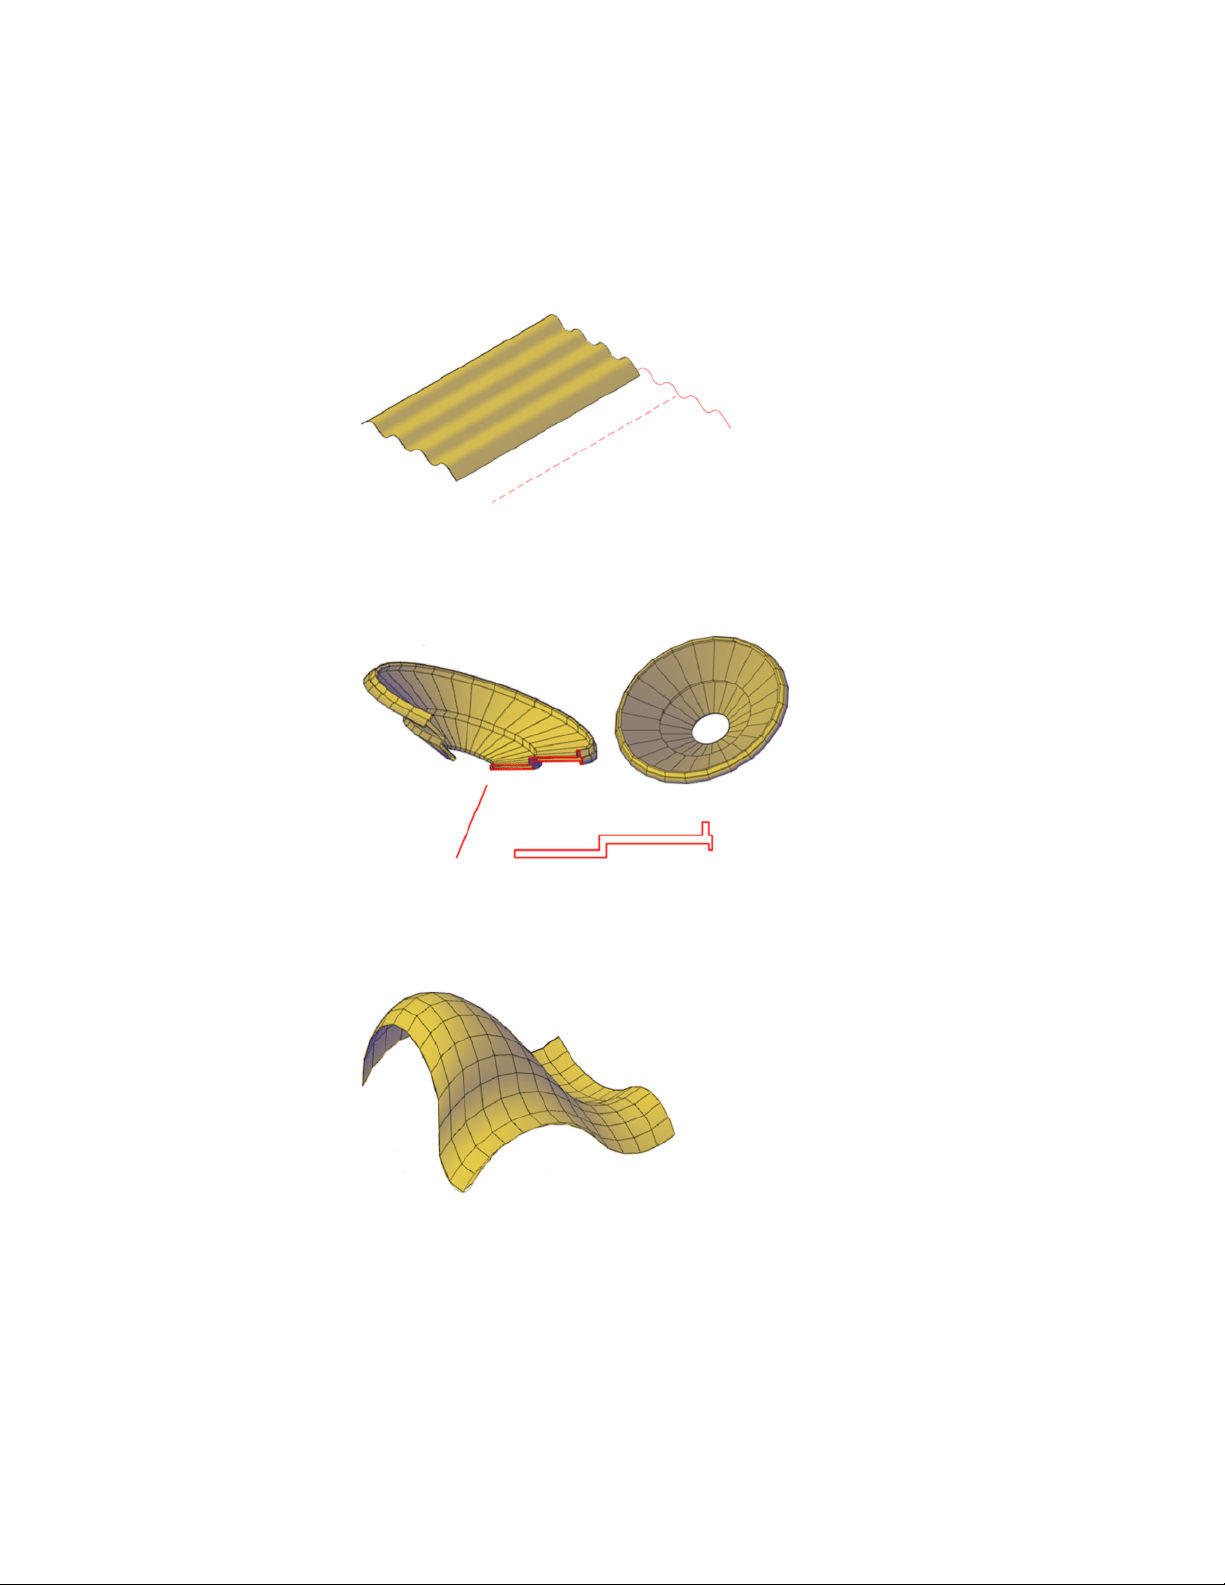
(called a path curve) in a specified direction and distance (called a direction
vector or path).
■ Revolved mesh.REVSURF creates a mesh that approximates a surface of
revolution by rotating a profile about a specified axis. A profile can consist
of lines, circles, arcs, ellipses, elliptical arcs, polylines, splines, closed
polylines, polygons, closed splines, and donuts.
■ Edge-defined mesh.EDGESURF creates a mesh approximating a Coons
surface patch mesh from four adjoining edges. A Coons surface patch mesh
is a bicubic surface that is interpolated between four adjoining edges (which
can be general space curves).
394 | Chapter 8 Work with 3D Models
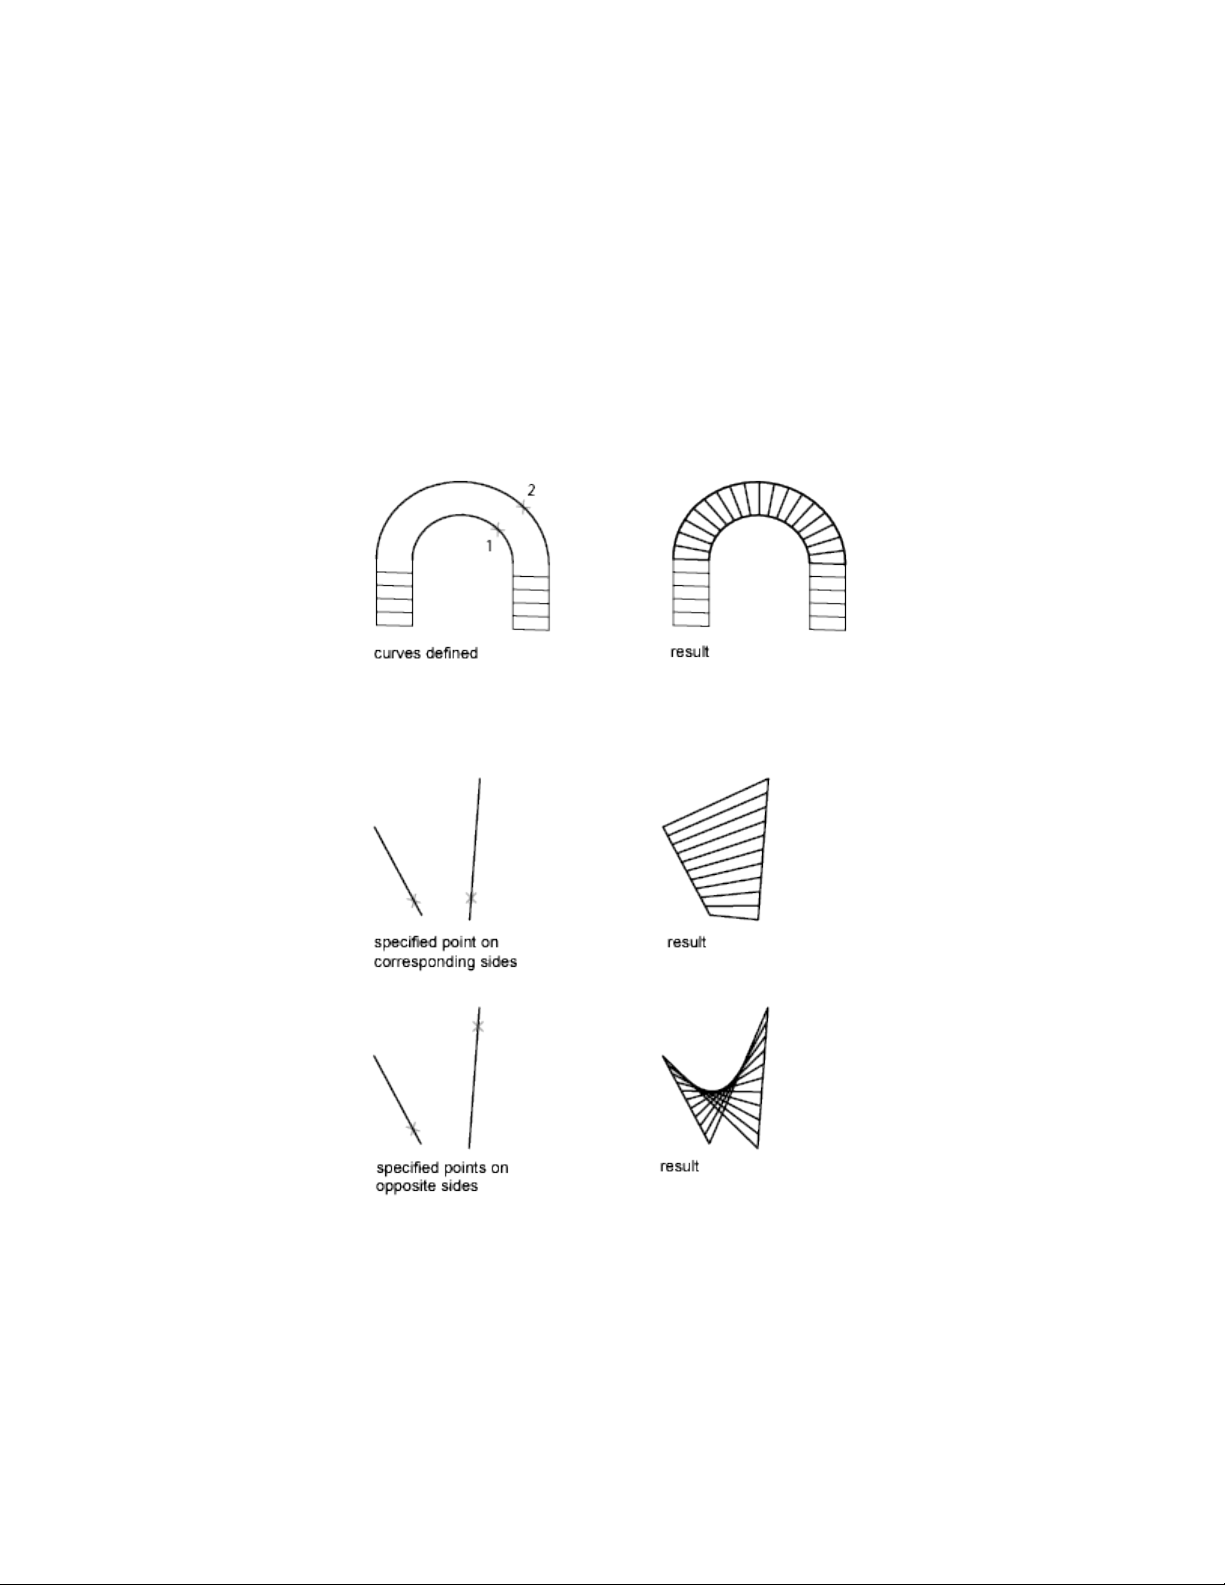
Create a Ruled Mesh
There are several methods for creating meshes.
With RULESURF, you create a mesh between two lines or curves. Use two
different objects to define the edges of the ruled mesh: lines, points, arcs,
circles, ellipses, elliptical arcs, 2D polylines, 3D polylines, or splines.
Both objects that are used as the “rails” of a ruled mesh must be either open
or closed. You can pair a point object with either an open or a closed object.
You can specify any two points on closed curves to complete the operation.
For open curves, construction of the ruled mesh is based on the locations of
the specified points on the curves.
Create 3D Models | 395
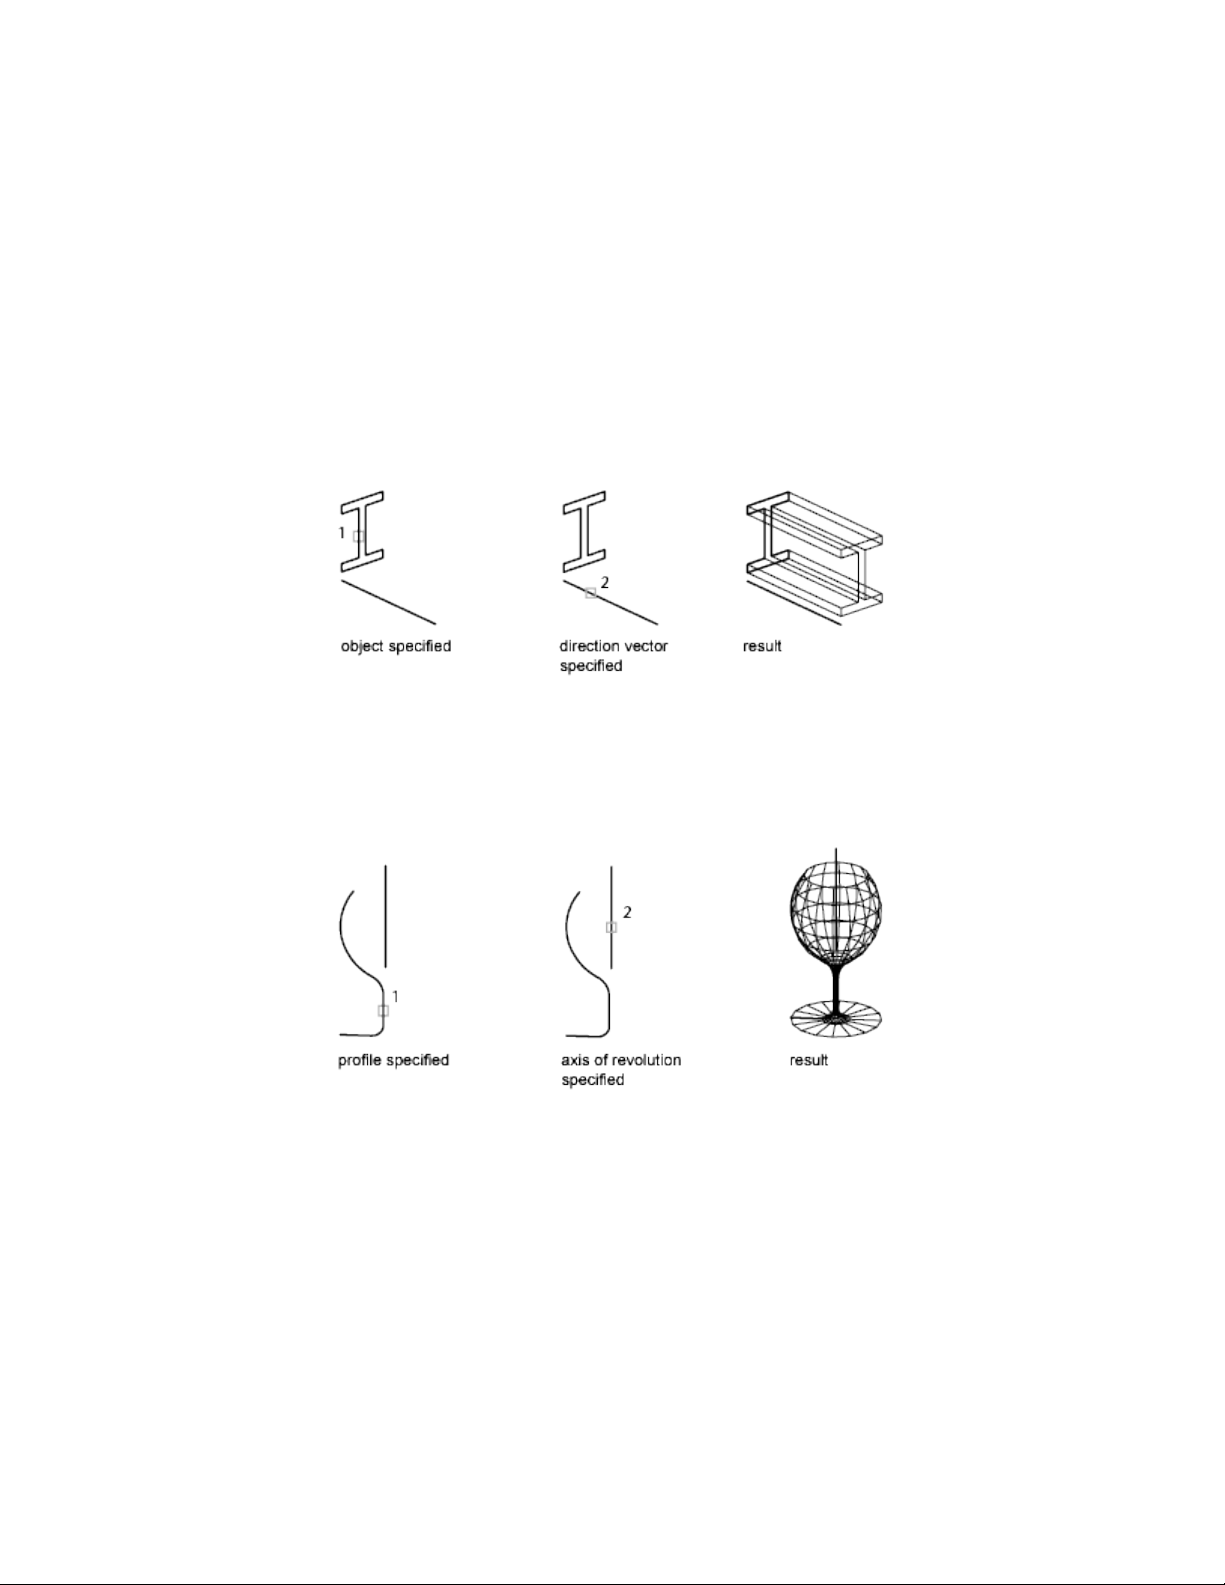
Create a Tabulated Mesh
With the TABSURF command, you can create a mesh that represents a general
tabulated surface defined by a path curve and a direction vector. The path
curve can be a line, arc, circle, ellipse, elliptical arc, 2D polyline, 3D polyline,
or spline. The direction vector can be a line or an open 2D or 3D polyline.
TABSURF creates the mesh as a series of parallel polygons running along a
specified path. The original object and the direction vector must already be
drawn, as shown in the following illustrations.
Create a Revolved Mesh
Use the REVSURF command to create a revolved mesh by rotating a profile
of the object about an axis. REVSURF is useful for mesh forms with rotational
symmetry.
The profile is called a path curve. It can consist of any combination of lines,
circles, arcs, ellipses, elliptical arcs, polylines, splines, closed polylines,
polygons, closed splines, or donuts.
396 | Chapter 8 Work with 3D Models
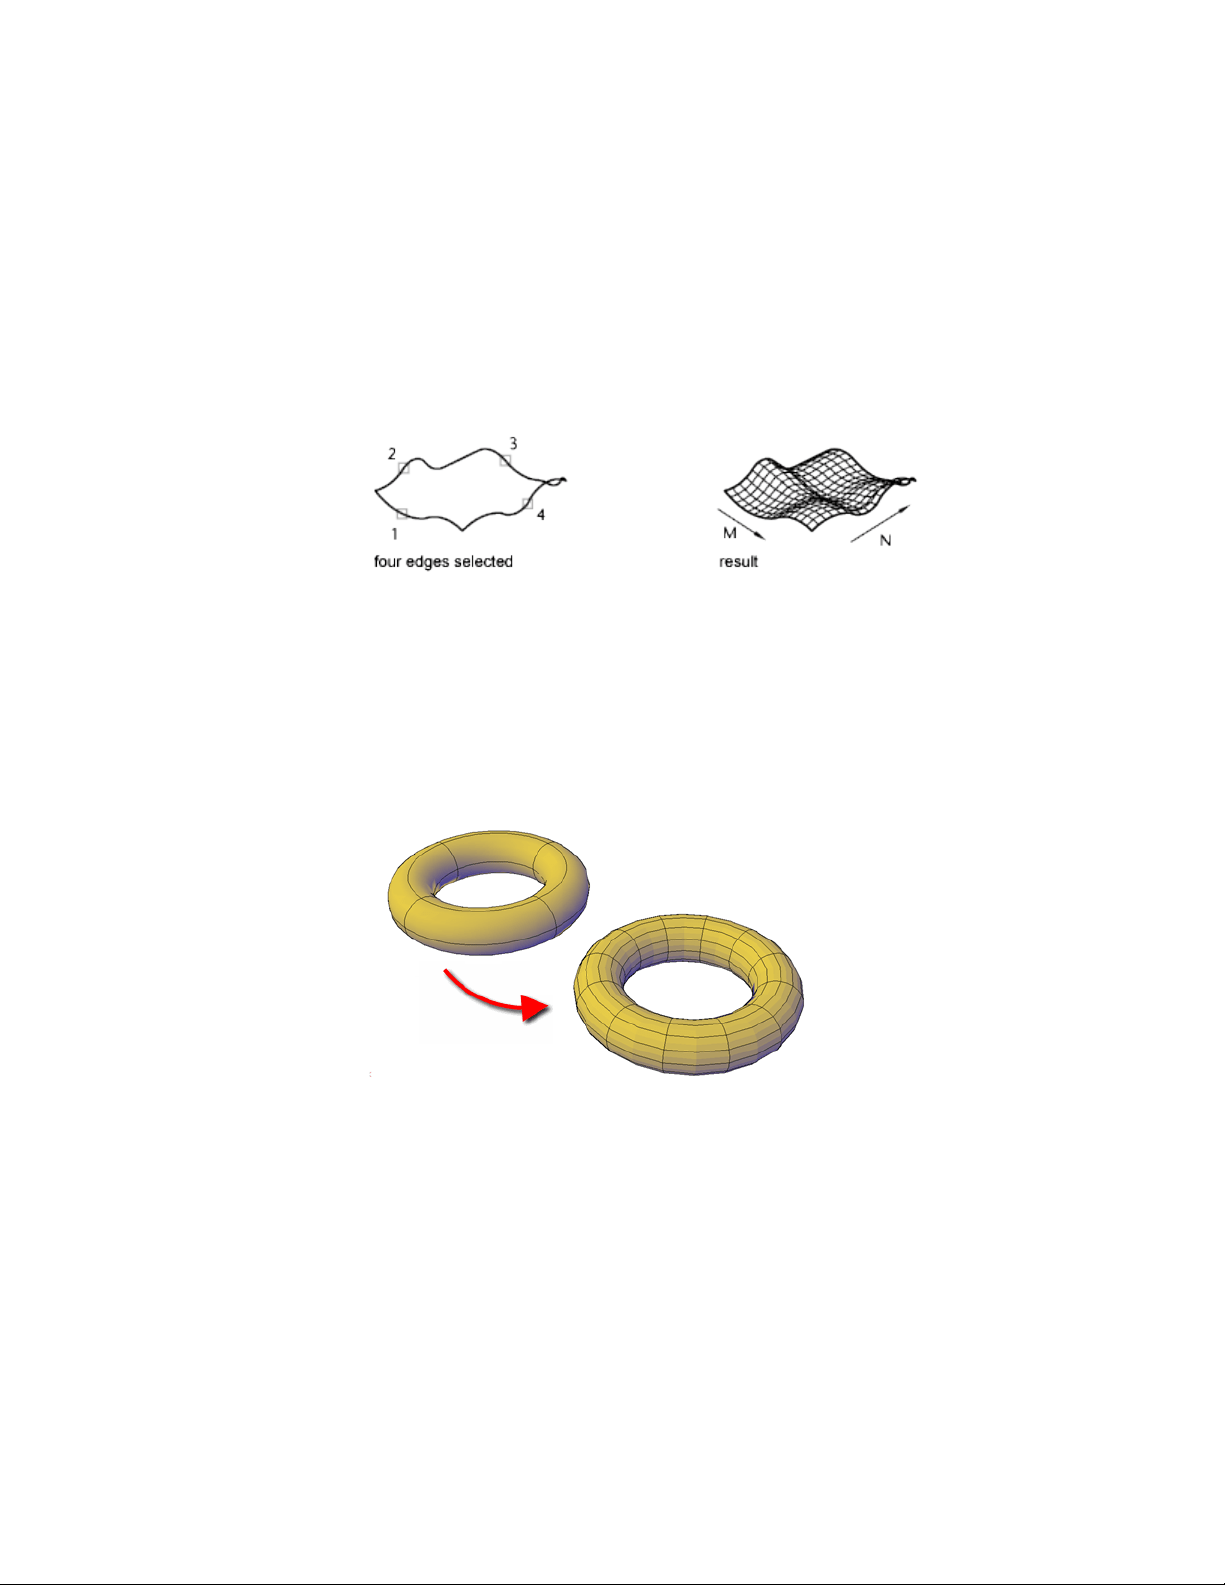
Create an Edge-Defined Mesh
With the EDGESURF command, you can create a Coons surface patch mesh, as
shown in the following illustration, from four objects called edges. Edges can
be arcs, lines, polylines, splines, or elliptical arcs that form a closed loop and
share endpoints. A Coons patch is a bicubic surface (one curve in the M
direction and another in the N direction) interpolated between the four edges.
Create Meshes by Conversion
Convert solids, surfaces, and legacy mesh types to mesh objects.
You can use the MESHSMOOTH command to convert certain objects to mesh.
Convert 3D solids, surfaces, and legacy mesh objects to the enhanced mesh
object in order to take advantage of capabilities such as smoothing, refinement,
creasing, and splitting.
Object Types That Can Be Converted
You obtain the most predictable results when you convert primitive solid
objects to mesh. That is, the resulting mesh adheres closely to the shape of
the original solid model.
Create 3D Models | 397

You can also convert other types of objects, although the conversion results
may differ from what you expect. These objects include swept surfaces and
solids, legacy polygon and polyface mesh objects, regions, closed polylines,
and objects created with 3DFACE. For these objects, you can often improve
results by adjusting the conversion settings.
Adjust Mesh Conversion Settings
If the conversion does not work as expected, try changing the following system
variables:
■ FACETERDEVNORMAL
■ FACETERDEVSURFACE
■ FACETERGRIDRATIO
■ FACETERMAXEDGELENGTH
■ FACETERMAXGRID
■ FACETERMESHTYPE
■ FACETERMINUGRID
■ FACETERMINVGRID
■ FACETERSMOOTHLEV
For example, if the smooth mesh optimized mesh type (FACETERMESHTYPE
system variable) results in incorrect conversions, you can set the tessellation
shape to be Triangle or Mostly Quads.
You also can control the adherence to the original shape by setting the
maximum distance offset, angles, aspect ratios, and edge lengths for new faces.
The following example shows a 3D solid helix that has been converted to
mesh using different tessellation settings. The optimized mesh version has
been smoothed, but the other two conversions have no smoothness. Notice,
however, that the mostly quads conversion with the lower tessellation values
creates a mesh object that adheres most closely to the original version.
Smoothing this object improves its appearance even more.
398 | Chapter 8 Work with 3D Models
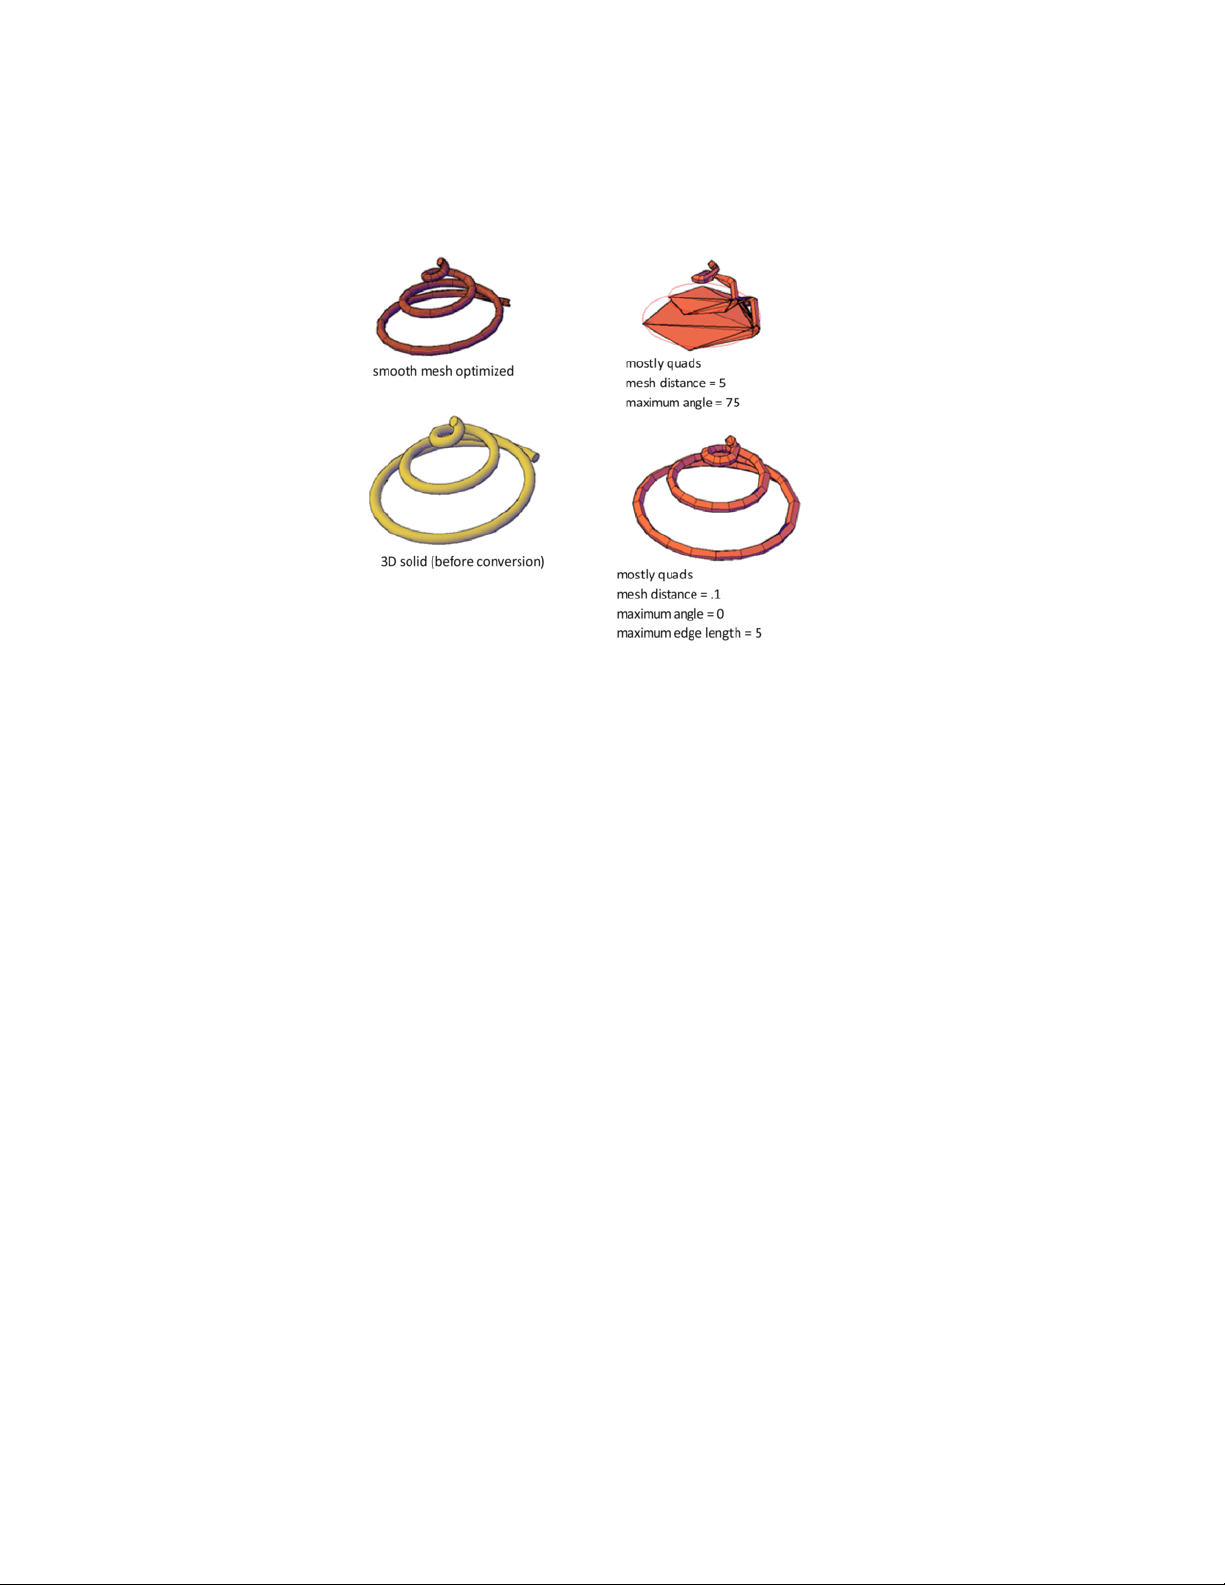
Similarly, if you notice that a converted mesh object has a number of long,
slivered faces (which can sometimes cause gaps), try decreasing the maximum
edge length for new faces value (FACETERMAXEDGELENGTH system variable).
If you are converting primitive solid objects, this dialog box also offers the
option of using the same default settings used to create primitive mesh objects.
When you select conversion candidates directly from this dialog box, you can
preview the results before you accept them.
Create Custom Mesh (Legacy)
Create custom polygon or polyface mesh by specifying vertices.
Specify individual vertices when you create mesh using the 3DMESH, PFACE,
and 3DFACE commands.
Understand Legacy Mesh Construction
The mesh density controls the number of facets in legacy polygonal and
polyface meshes. Density is defined in terms of a matrix of M and N vertices,
like a grid consisting of columns and rows. M and N specify the column and
row position, respectively, of any given vertex.
Create 3D Models | 399
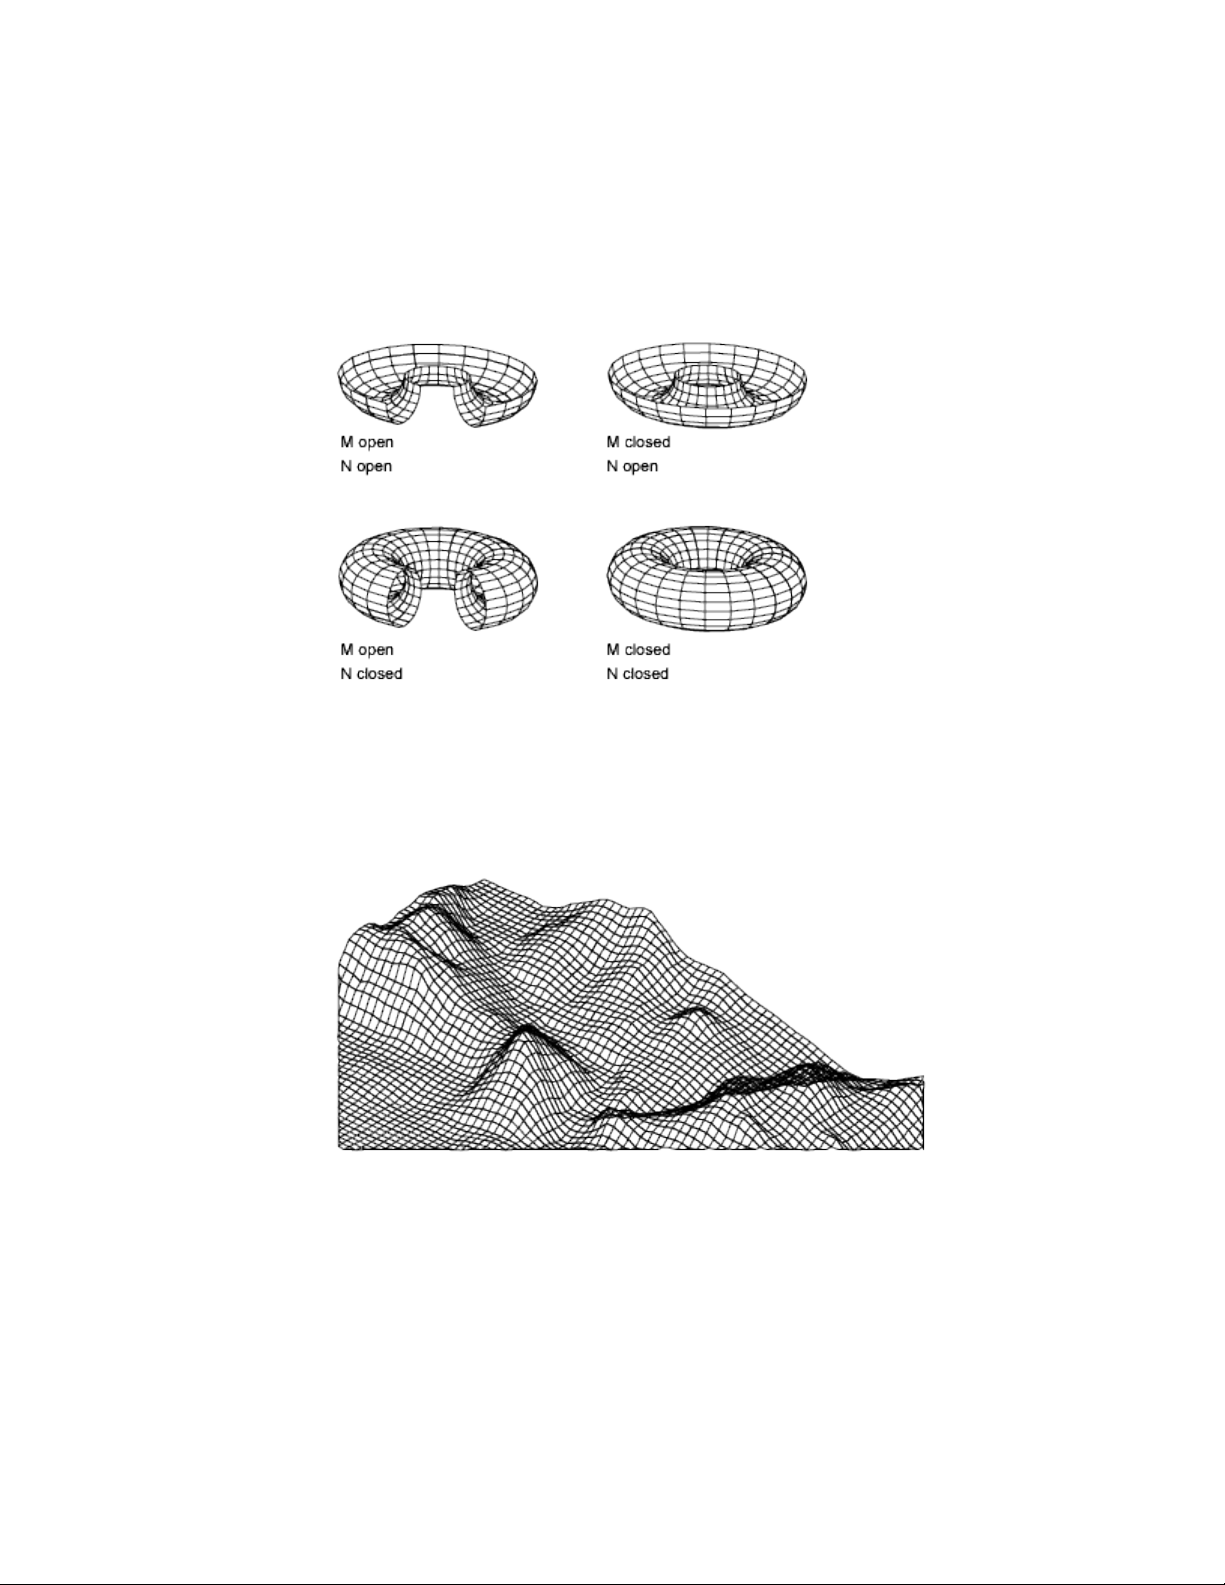
A mesh can be open or closed. If the start and end edges of the mesh do not
touch, a mesh is open in a given direction, as shown in the following
illustrations.
Create a Rectangular Mesh
With the 3DMESH command, you can create polygon meshes that are open
in both the M and N directions (like the X and Y axes of an XY plane). In most
cases, you can use 3DMESH in conjunction with scripts or AutoLISP routines
when you know the mesh points.
As you create the mesh, you specify the size of the mesh in the M and N
directions. The total number of vertices you specify for the mesh is equal to
the M value times the N value.
400 | Chapter 8 Work with 3D Models
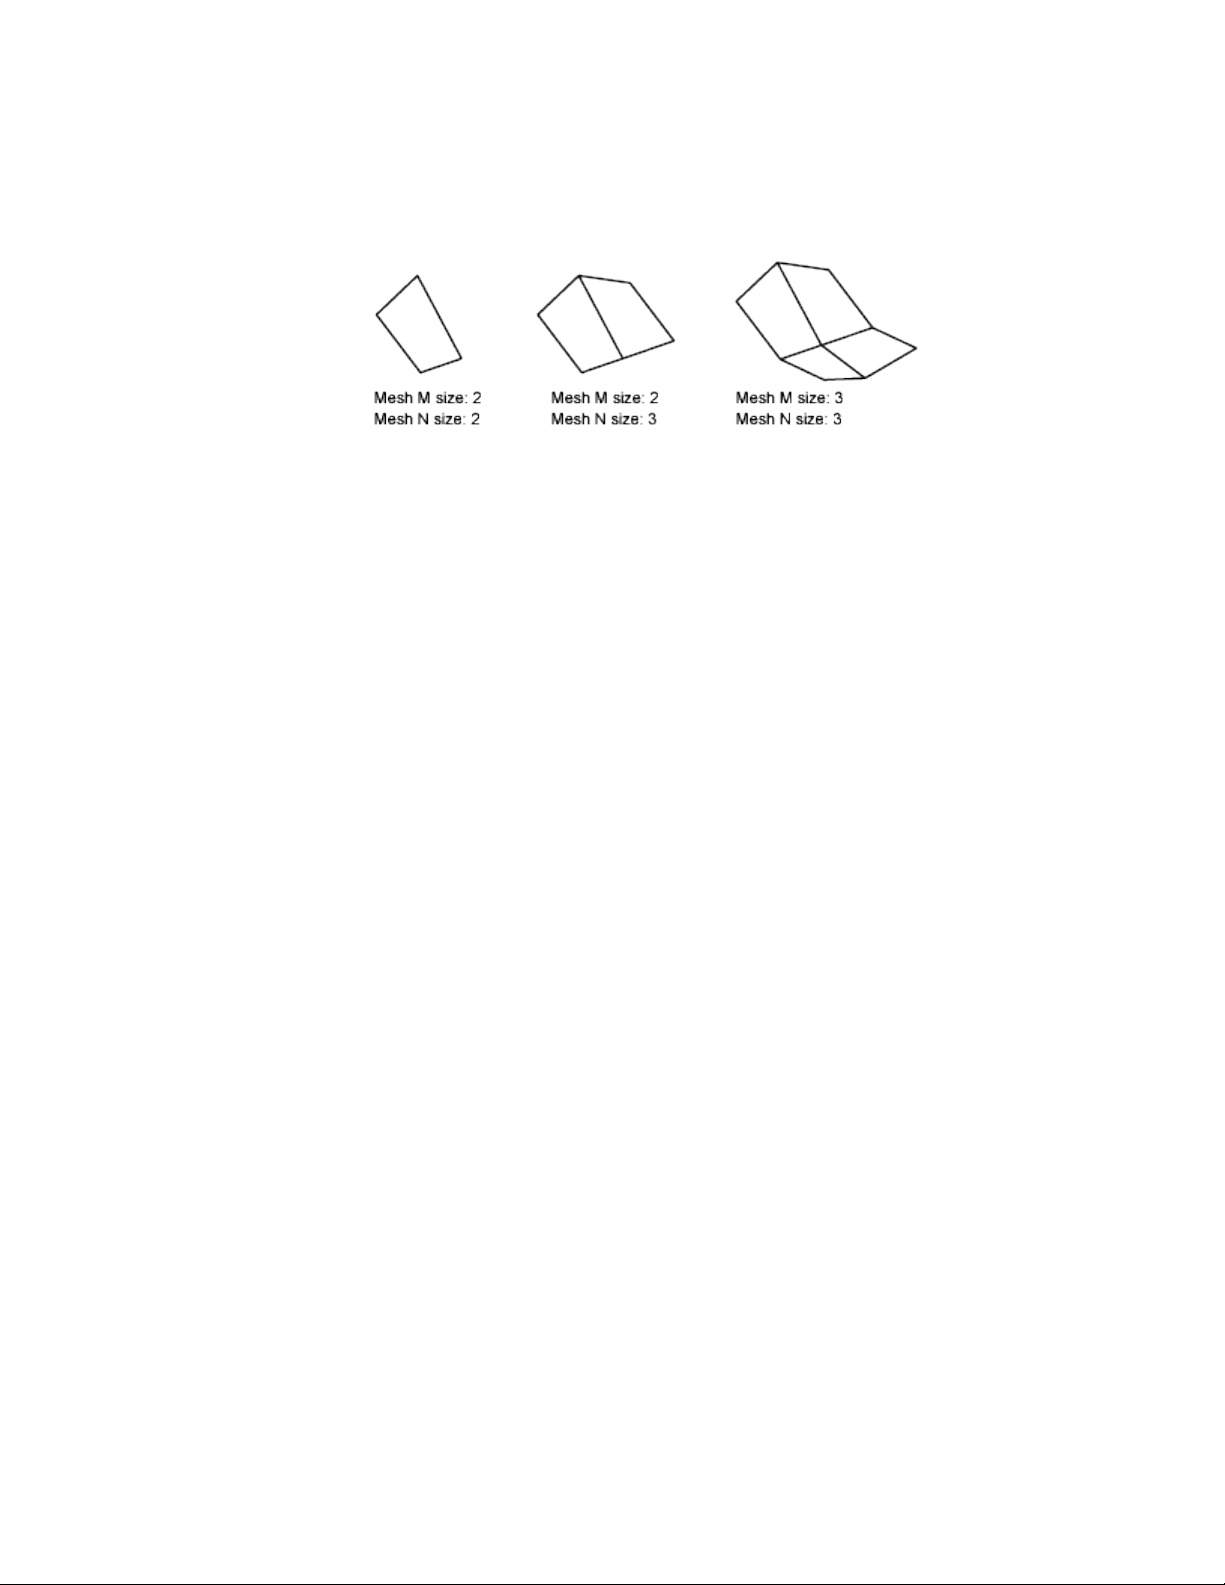
You can close the meshes with PEDIT. You can use 3DMESH to construct
irregular meshes.
Example:
In the following example of text at the Command prompt, you enter the
coordinate values for each vertex to create the mesh in the illustration.
Command: 3dmesh
Mesh M size: 4
Mesh N size: 3
Vertex (0, 0): 10,1, 3
Vertex (0, 1): 10, 5, 5
Vertex (0, 2): 10,10, 3
Vertex (1, 0): 15,1, 0
Vertex (1, 1): 15, 5, 0
Vertex (1, 2): 15,10, 0
Vertex (2, 0): 20,1, 0
Vertex (2, 1): 20, 5, -1
Vertex (2, 2): 20,10 ,0
Vertex (3, 0): 25,1, 0
Vertex (3, 1): 25, 5, 0
Vertex (3, 2): 25,10, 0
Create 3D Models | 401
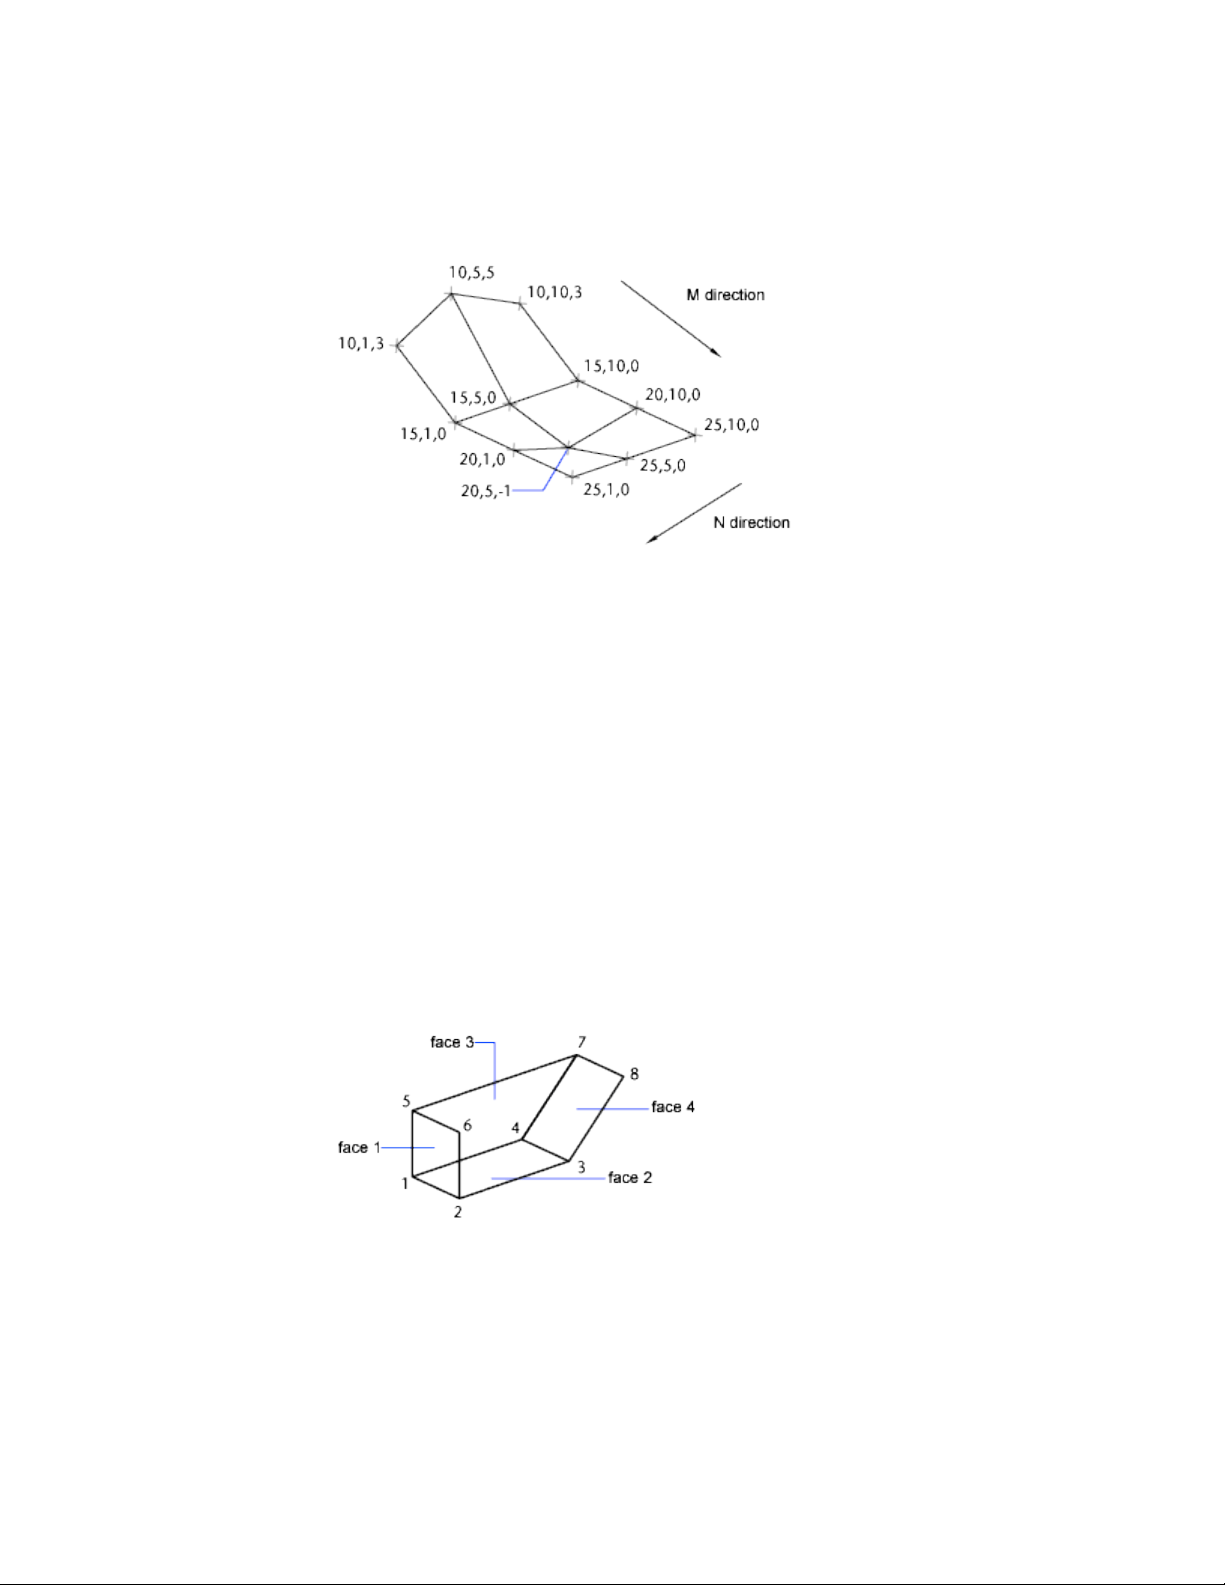
Create a Polyface Mesh
The PFACE command produces a polyface (polygon) mesh, with each face
capable of having numerous vertices. PFACE is typically used by applications
rather than by direct user input.
Creating a polyface mesh is like creating a rectangular mesh. To create a
polyface mesh, you specify coordinates for its vertices. You then define each
face by entering vertex numbers for all the vertices of that face. As you create
the polyface mesh, you can set specific edges to be invisible, assign them to
layers, or give them colors.
To make the edge invisible, enter the vertex number as a negative value. For
instance, to make the edge between vertices 5 and 7 invisible in the following
illustration, you enter the following:
Face 3, vertex 3: -7
In the illustration, face 1 is defined by vertices 1, 5, 6, and 2. Face 2 is defined
by vertices 1, 4, 3, and 2. Face 3 is defined by vertices 1, 4, 7, and 5, and face
4 is defined by vertices 3, 4, 7, and 8.
402 | Chapter 8 Work with 3D Models
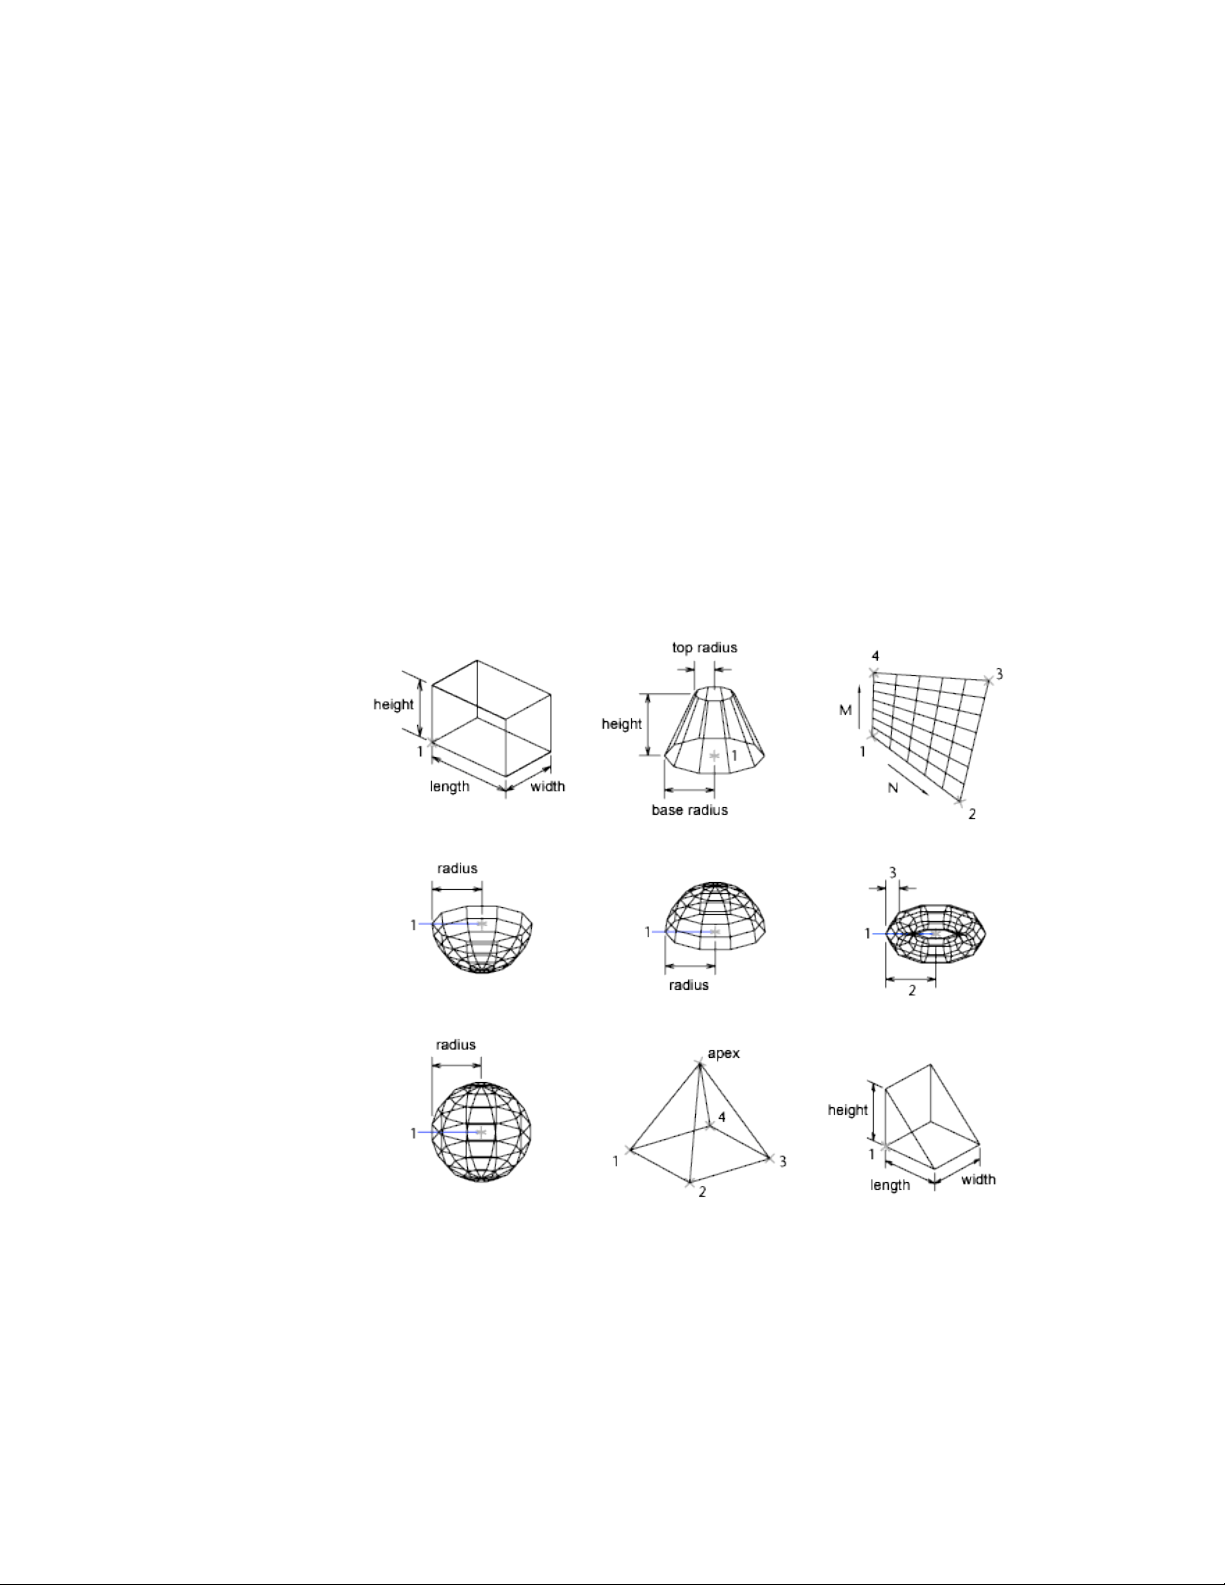
Create Polyface Mesh Vertex by Vertex
With the 3DFACE command, you can create three-dimensional polyface mesh
by specifying each vertex. You can control visibility of each mesh edge
segment.
If you select a 3DFACE object during some mesh smoothing operations (such
as with MESHSMOOTHMORE), you are prompted to convert 3DFACE objects
to mesh objects.
Create a Predefined 3D Mesh
The 3D command creates the following 3D shapes: boxes, cones, dishes, domes,
meshes, pyramids, spheres, tori (donuts), and wedges.
In the following illustrations, the numbers indicate points you specify to create
the mesh.
Create 3D Models | 403
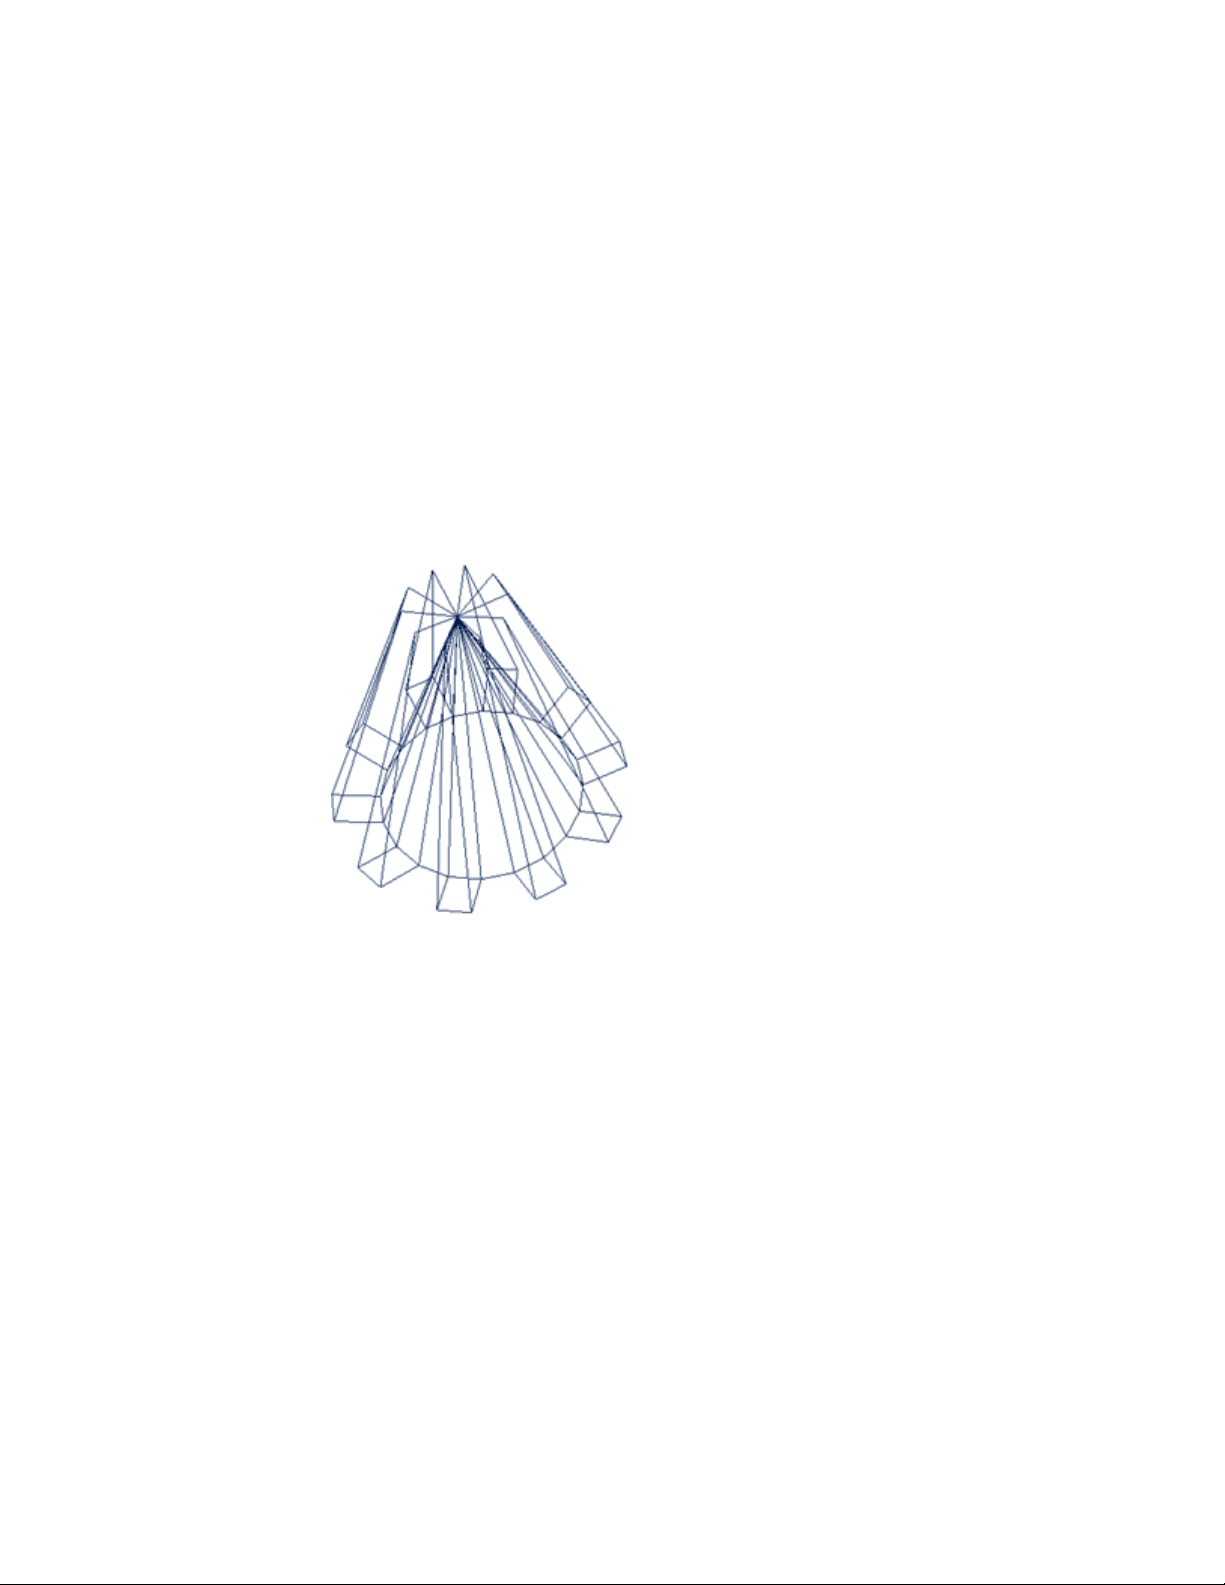
To view the objects you are creating with the 3D command more clearly, set
a viewing direction with 3DORBIT, DVIEW, or VPOINT.
Create Wireframe Models
A wireframe model is an edge or skeletal representation of a real-world 3D
object using lines and curves.
You can specify a wireframe visual style to help you see the overall structure
of 3D objects such as solids, surfaces, and meshes. In older drawings, you
might also encounter wireframe models that were created using legacy
methods.
Wireframe models consist only of points, lines, and curves that describe the
edges of the object. Because each object that makes up a wireframe model
must be independently drawn and positioned, this type of modeling can be
the most time-consuming.
You can use a wireframe model to
■ View the model from any vantage point
■ Generate standard orthographic and auxiliary views automatically
■ Generate exploded and perspective views easily
■ Analyze spatial relationships, including the shortest distance between
corners and edges, and checking for interferences
■ Reduce the number of prototypes required
404 | Chapter 8 Work with 3D Models

The ISOLINES system variable controls the number of tessellation lines used
to visualize curved portions of the wireframe. The FACETRES system variable
adjusts the smoothness of shaded and hidden-line objects.
Methods for Creating Wireframe Models
You can create wireframe models by positioning any 2D planar object anywhere
in 3D space, using the following methods:
■ Use the XEDGES command to create wireframe geometry from regions,
3D solids, surfaces, and meshes. XEDGES extracts all the edges on the
selected objects or subobjects. The extracted edges form a duplicate
wireframe composed of 2D objects such as lines, circles, and 3D polylines.
■ Enter 3D coordinates that define the X, Y, and Z location of the object.
■ Set the default work plane (the XY plane of the UCS) on which to draw
the object.
■ Move or copy the object to its proper 3D location after you create it.
Wireframe modeling is a skill that requires practice and experience. The best
way to learn how to create wireframe models is to begin with simple models
before attempting models that are more complex.
Extract Curves from Surfaces, Solids, and Faces
When working with surfaces you may want to create non-mesh wireframes
displaying the contours of a surface to experiment with and regenerate
variations. The SURFEXTRACTCURVE command allows you to create lines,
plines, splines, arcs, or circles, depending on the surface, solid, or face selected.
Use the Chain option to preview and extract adjacent curves. After modifying
extracted curves, use the LOFT command to regenerate a surface that passes
through the extracted objects.
NOTE Adjacent faces, for solids and surfaces, must be parameterized in the same
direction.
The direction option allows you to extract curves in the other direction. Isoline
curves are extracted in the U direction, by default.
Choose the spline points option to extract a spline that passes through all
specified points on the surface.
Create 3D Models | 405
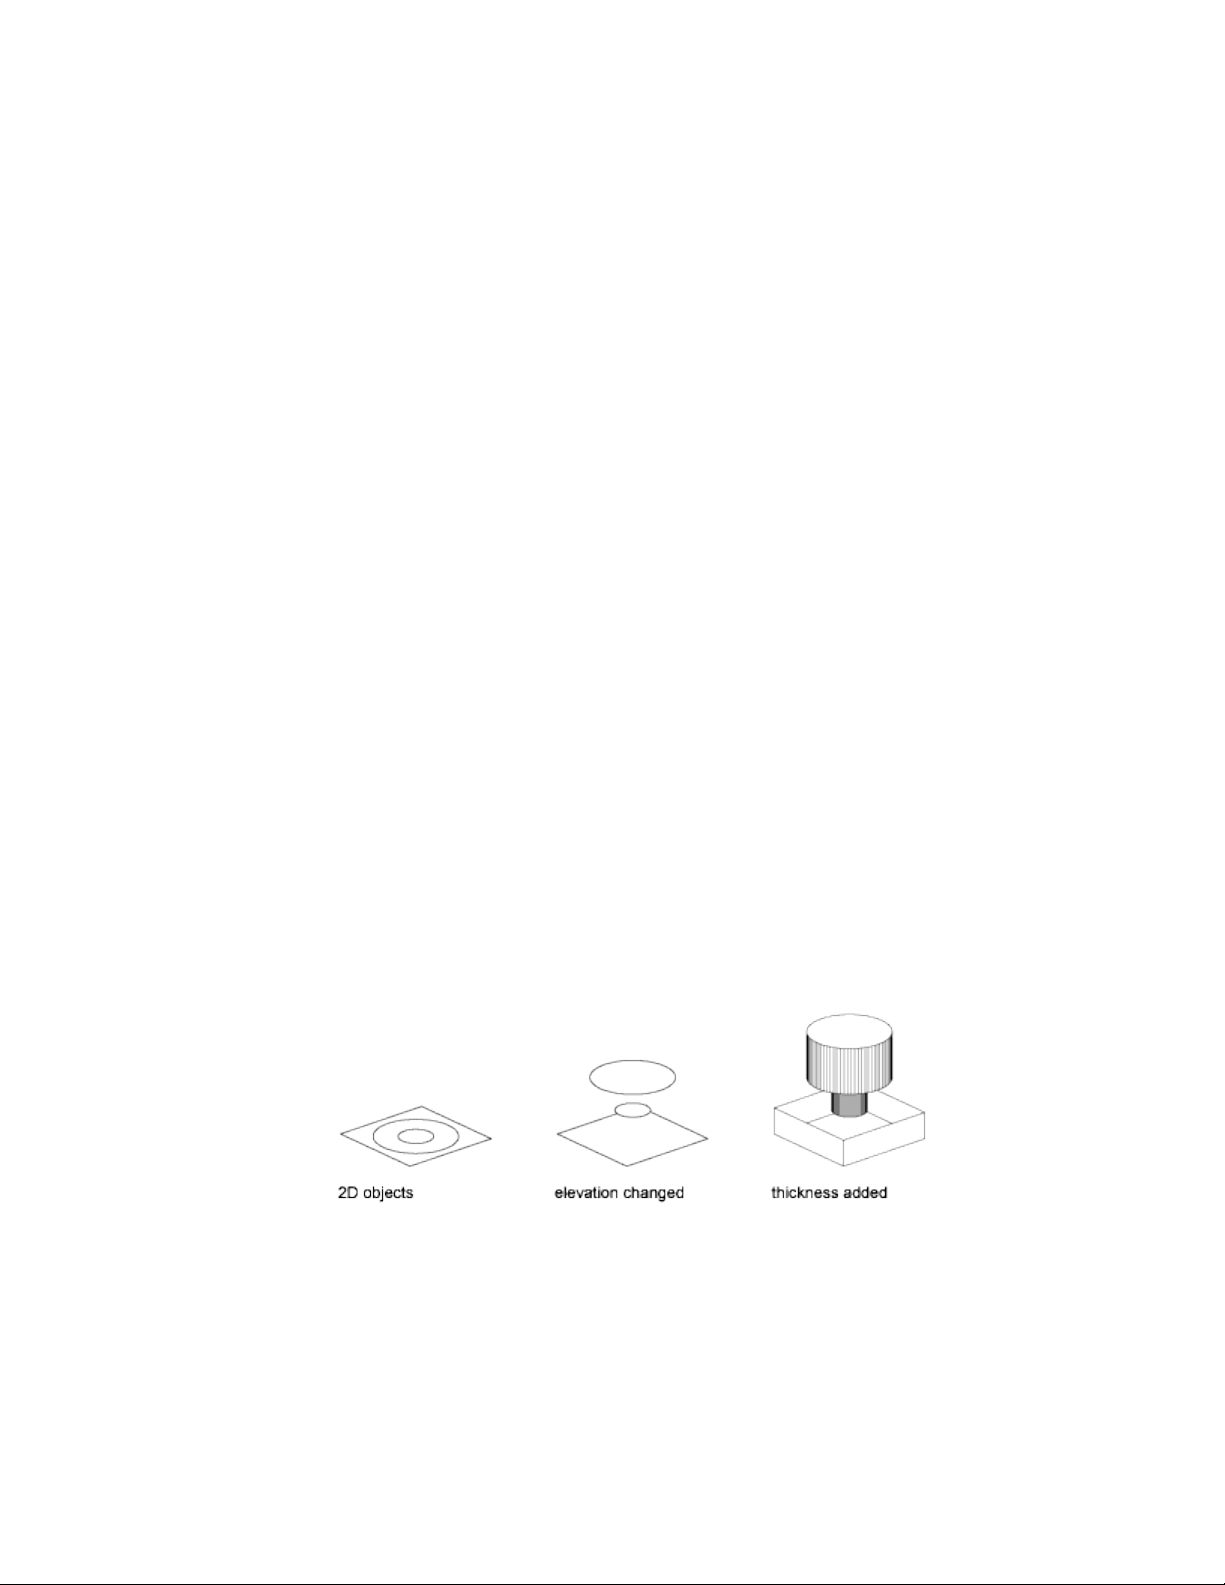
Tips for Working with Wireframe Models
Creating 3D wireframe models can be more difficult and time-consuming
than creating their 2D views. Here are some tips that will help you work more
effectively:
■ Plan and organize your model so that you can turn off layers to reduce the
visual complexity of the model. Color can help you differentiate between
objects in various views.
■ Create construction geometry to define the basic envelope of the model.
■ Use multiple views, especially isometric views, to make visualizing the
model and selecting objects easier.
■ Become adept at manipulating the UCS in 3D. The XY plane of the current
UCS operates as a work plane to orient planar objects such as circles and
arcs. The UCS also determines the plane of operation for trimming and
extending, offsetting, and rotating objects.
■ Use object snaps and grid snap carefully to ensure the precision of your
model.
■ Use coordinate filters to drop perpendiculars and easily locate points in
3D based on the location of points on other objects.
Add 3D Thickness to Objects
Use the thickness property to give objects a 3D appearance.
The 3D thickness of an object is the distance that object is extended, or
thickened, above or below its location in space. Positive thickness extrudes
upward in the positive Z direction; negative thickness extrudes downward
(negative Z). Zero (0) thickness means that there is no 3D thickening of the
object.
406 | Chapter 8 Work with 3D Models

The orientation of the UCS when the object was created determines the Z
direction. Objects with a non-zero thickness can be shaded and can hide other
objects behind them.
The thickness property changes the appearance of the following types of
objects:
■ 2D solids
■ Arcs
■ Circles
■ Lines
■ Polylines (including spline-fit polylines, rectangles, polygons, boundaries,
and donuts)
■ Text (only if created as a single-line text object using an SHX font)
■ Points
Modifying the thickness property of other types of objects does not affect
their appearance.
You can set the default thickness property for new objects you create by setting
the THICKNESS system variable. For existing objects, change the thickness
property on the Properties Inspector palette.
The 3D thickness is applied uniformly to an object; a single object cannot
have different thicknesses.
You might need to change the 3D viewpoint to see the effect of thickness on
an object.
NOTE Although the THICKNESS variable sets an extruded thickness for new 2D
objects, those objects continue to be 2D objects. The THICKEN command adds
volume to a surface object, converting it to a 3D solid.
See also:
Create Solids and Surfaces from Lines and Curves (page 342)
Modify 3D Models
Change a 3D solid, surface or mesh with grips and gizmos, editing commands,
properties, and by modifying its component subojects.
Modify 3D Models | 407
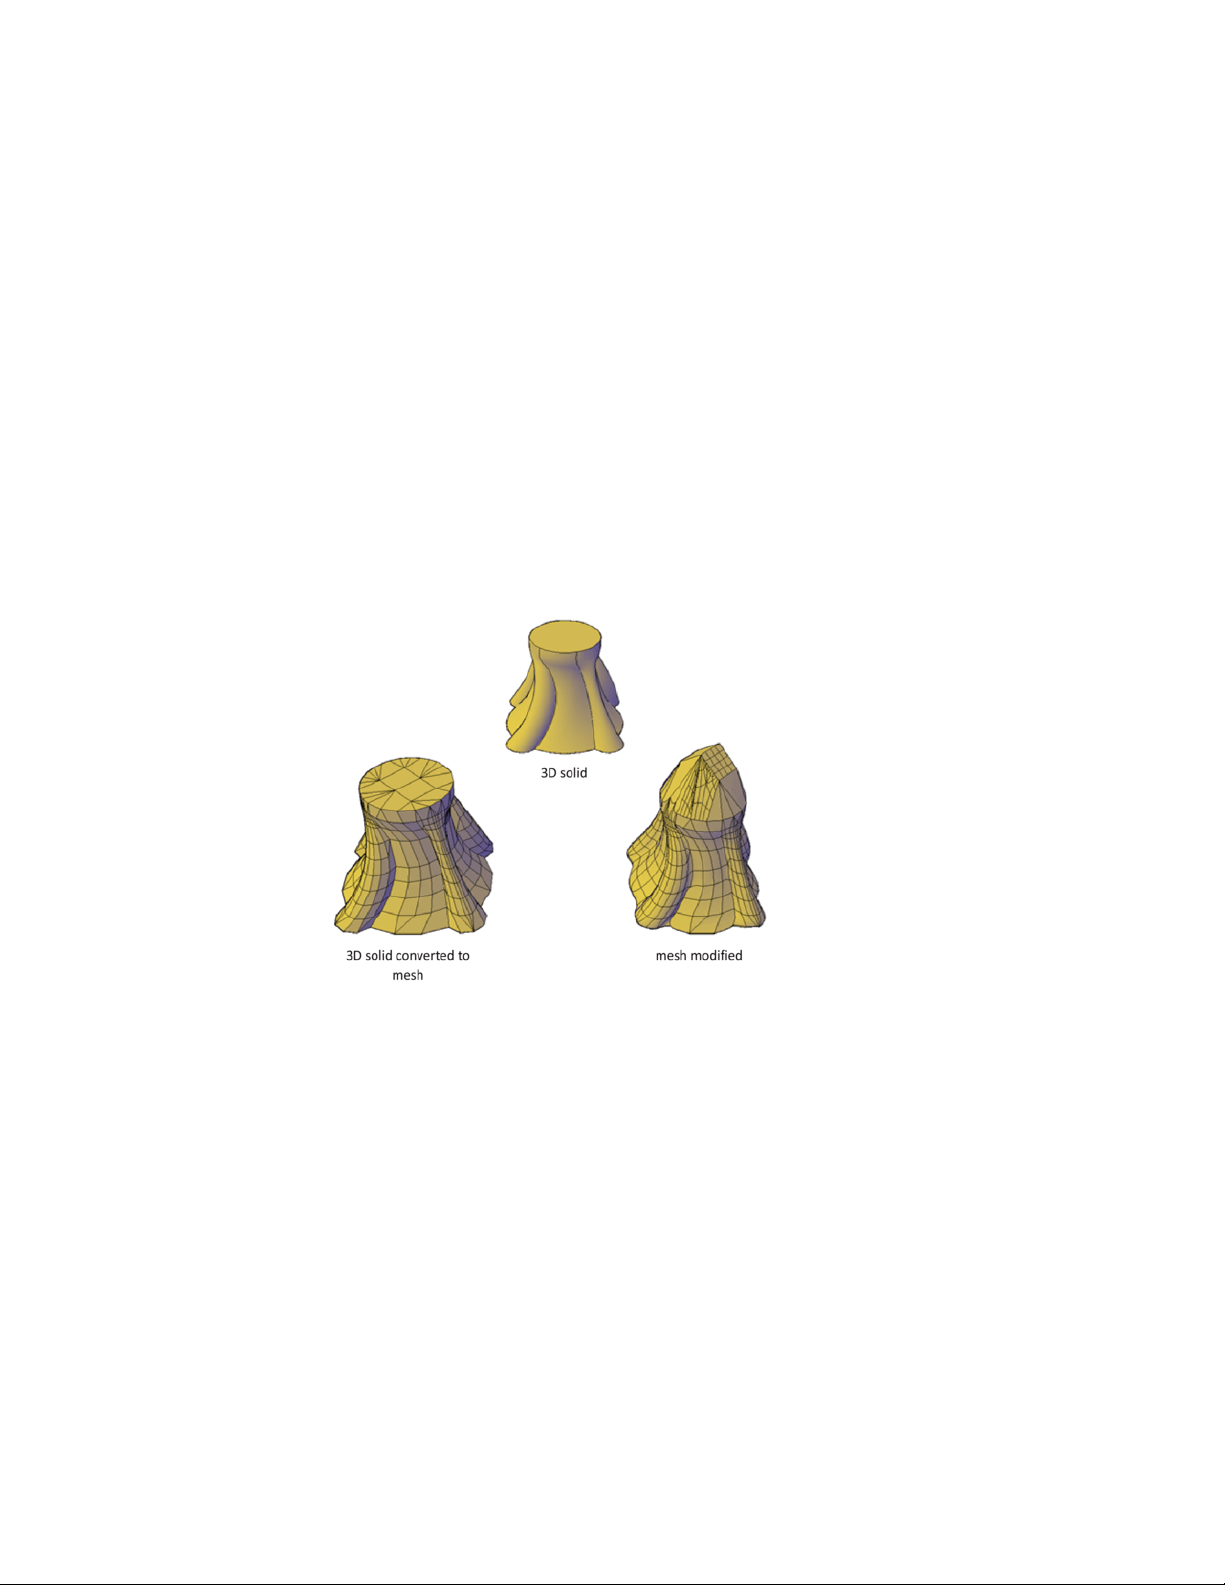
Overview of Modifying 3D Objects
3D modeling tools range from entering precise measurements in the Properties
Inspector, to more free-form methods such as grip and gizmo editing. Some
methods are specific to 3D solids, surfaces or meshes. Other methods are
shared.
Convert to Other Object Types
In many cases, you can convert from one object type to another to take
advantage of specific editing capabilities.
For example you can convert selected surfaces, solids, and legacy mesh types
to mesh objects so that you can take advantage of smoothing and modeling
capabilities.
Similarly, you can convert mesh to 3D solids and surfaces to accomplish some
composite object modeling tasks that are available only for those objects.
Conversion is often offered as a choice when you start activities that are
available only for solids and surfaces.
408 | Chapter 8 Work with 3D Models
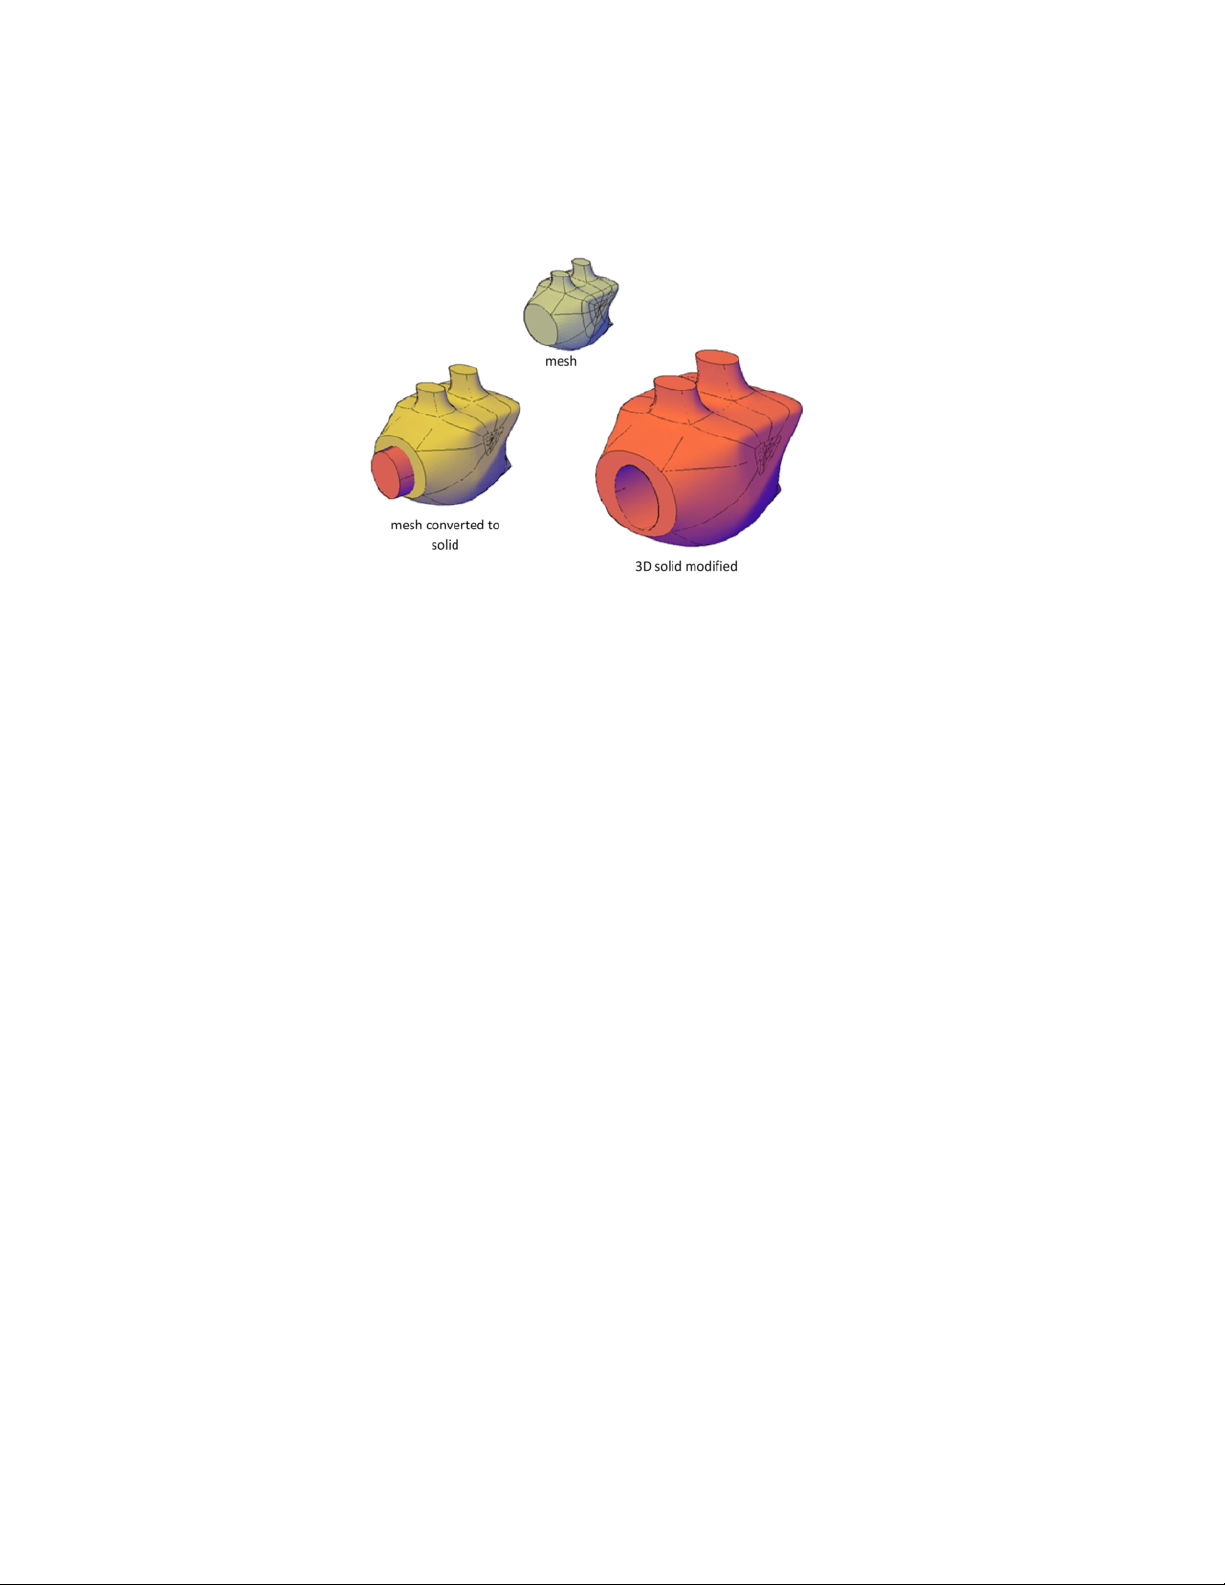
View Your Model from All Angles
When you work with any 3D object, you can easily make changes that are
not accurately reflected in the current view. To ensure that your modifications
conform to your expectations, make sure you understand and use the
following:
■ Manipulate the 3D workplane (UCS). To understand how your model
is projected in 3D space, learn how to use the X, Y, and Z axes. For more
information, see Overview of Coordinate Entry.
■ Rotate the view to display the model from different viewpoints.
Several navigation tools, including 3D Orbit and the ViewCube tool, are
available to help you rotate around your workspace. For more information,
see Use Viewing Tools (page 72).
■ Display multiple viewports. Set up two or more viewports with
different viewing angles and visual styles. When you make a change in
one viewport, you can see its impact from several viewpoints at the same
time. For more information, see Display Multiple Views in Model Space
(page 81).
See also:
Control the User Coordinate System (UCS) (page 150)
Use Viewing Tools (page 72)
Display Multiple Views in Model Space (page 81)
Modify 3D Models | 409
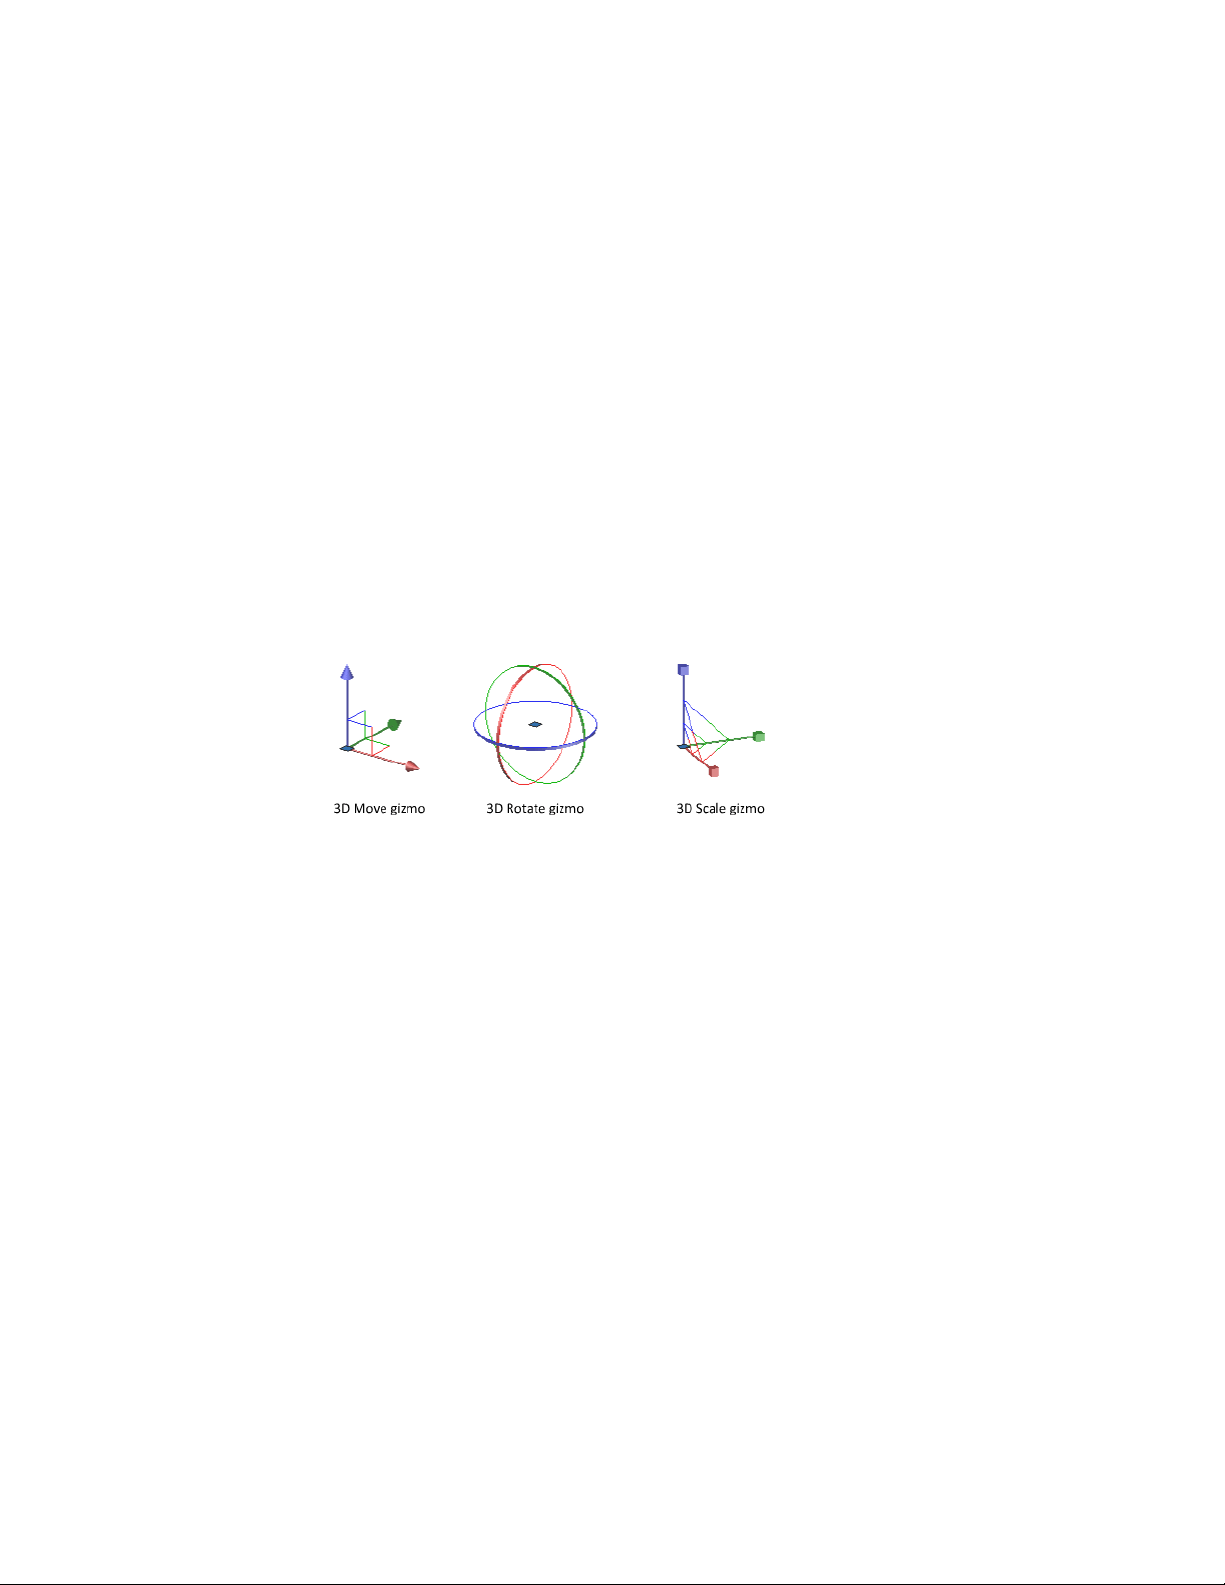
Use Gizmos to Modify Objects
Use gizmos to move, rotate, or scale objects and subobjects in a 3D view.
Overview of Using Gizmos
Gizmos help you move, rotate, or scale a set of objects along a 3D axis or
plane.
There are three types of gizmos:
■ 3D Move gizmo. Relocates selected objects along an axis or plane.
■ 3D Rotate gizmo. Rotates selected objects about a specified axis.
■ 3D Scale gizmo. Scales selected objects along a specified plane or axis,
or uniformly along all 3 axes.
By default, gizmos are displayed automatically when you select an object or
subobject in a view that has a 3D visual style. Because they constrain
modifications along specific planes or axes, gizmos help ensure more
predictable results.
You can specify which gizmos are displayed when an object is selected, or you
can suppress their display.
Use the Gizmos
Gizmos help move, rotate, and scale 3D objects and subobjects.
Display the Gizmos
Gizmos are available only in 3D views that are set to use a 3D visual style such
as Hidden. You can set the gizmo to be displayed automatically when you
410 | Chapter 8 Work with 3D Models
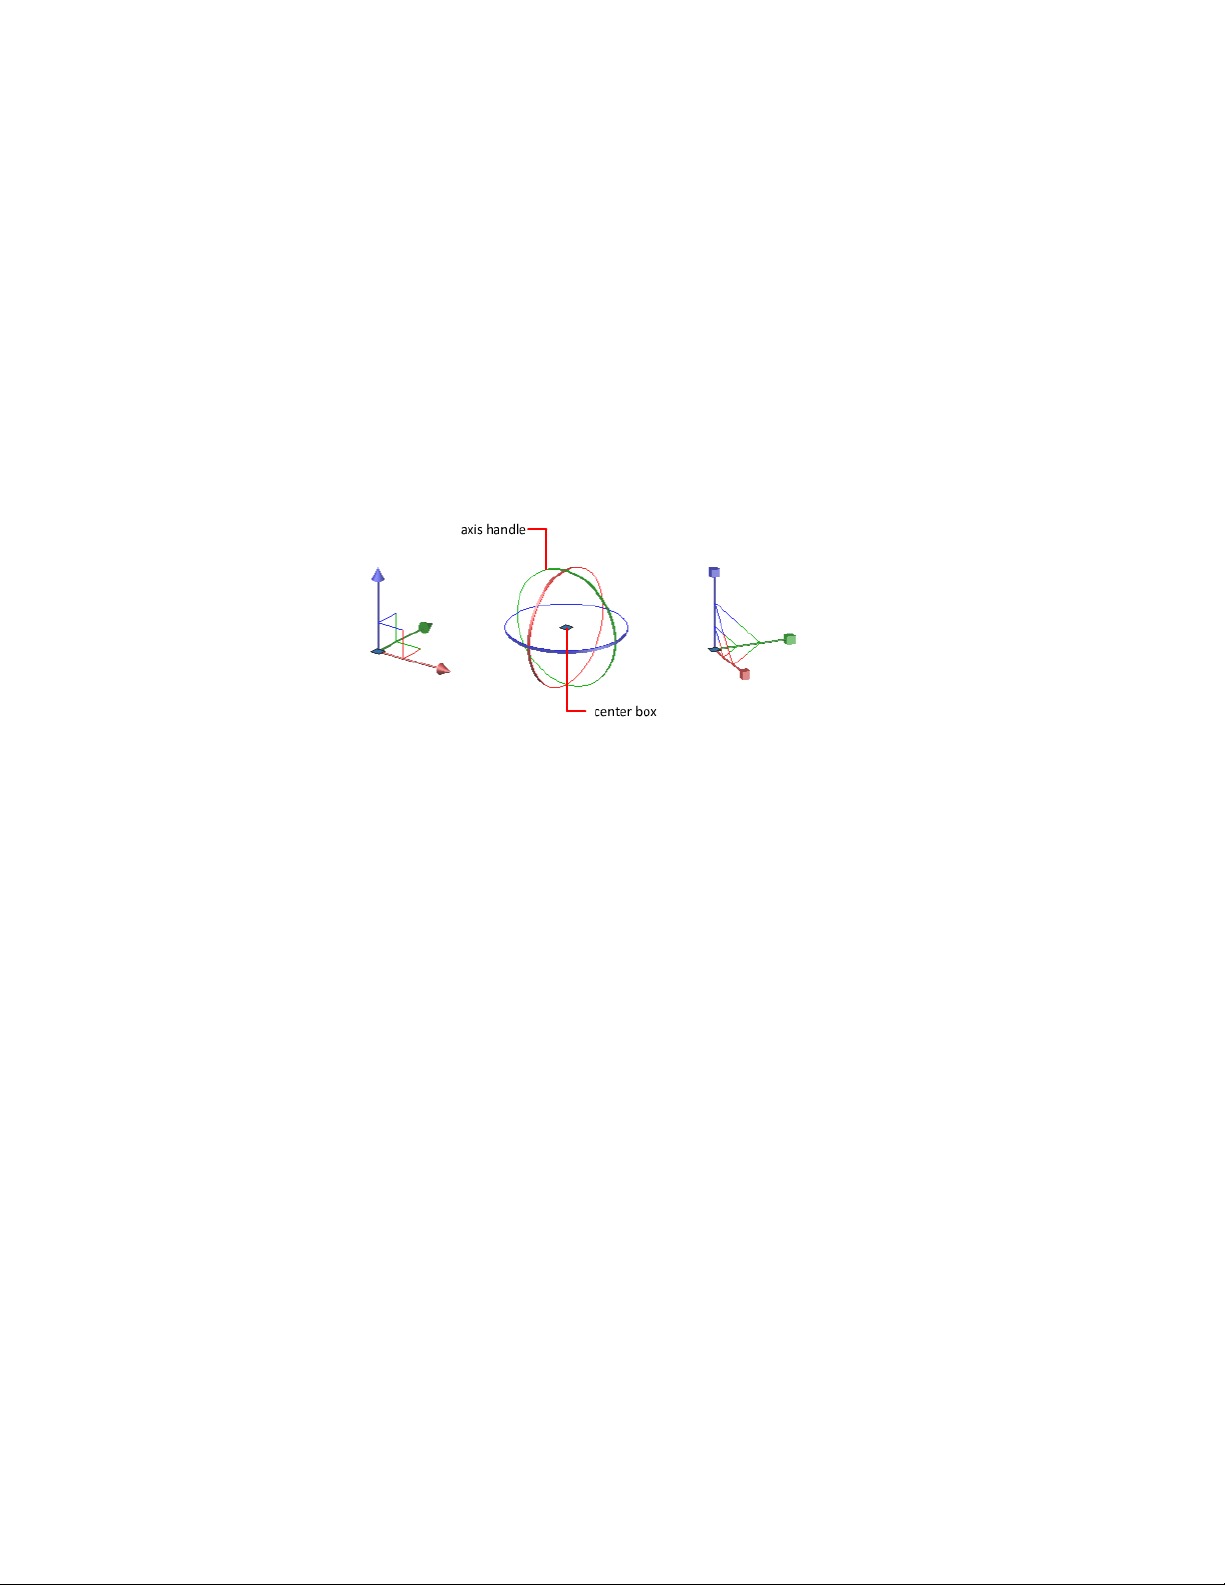
select a 3D object or subobject. Gizmos are also displayed during the 3DMOVE,
3DROTATE, and 3DSCALE commands.
If the visual style is set to 2D Wireframe, entering 3DMOVE, 3DROTATE, or
3DSCALE automatically converts the visual style to 3D Wireframe.
By default, the gizmo is initially placed in the center of the selection set.
However, you can relocate it anywhere in 3D space. The center box (or base
grip) of the gizmo sets the base point for the modification. This behavior is
equivalent to temporarily changing the position of the UCS as you move or
rotate the selected objects. The axis handles on the gizmo constrain the
movement or rotation to an axis or plane.
For best results, use object snaps to locate the grip center box.
Switch Between the Gizmos
Whenever you select an object in a 3D view, the default gizmo is displayed.
You can select a different default on the status bar, or change the value of the
DEFAULTGIZMO system variable. You can also suppress the display of gizmos
when objects are selected.
After the gizmo is active, you can also switch to a different type of gizmo. The
switching behavior differs, depending on when you select the objects:
■ Select objects first. If a gizmo operation is in progress, you can press
the Spacebar repeatedly to cycle through the other gizmo types. When
you switch gizmos this way, the gizmo activity is constrained to the
originally selected axis or plane.
During a gizmo operation, you can also select a different gizmo type on
the shortcut menu.
■ Run the command first. When you start the 3D Move, 3D Rotate, or
3D Scale operation before selecting objects, the gizmo is placed at the
center of the selection set. Use the Relocate Gizmo option on the shortcut
menu to relocate the gizmo anywhere in 3D space. You can also choose a
different type of gizmo on the shortcut menu.
Modify 3D Models | 411

Change the Gizmo Settings
The following settings affect the display of gizmos:
■ Default gizmo. The DEFAULTGIZMO system variable specifies which
gizmo is displayed by default when an object is selected in a view with a
3D visual style. You can turn off display of the gizmo. This setting is also
available on the status bar.
■ Default location. The GTLOCATION system variable sets the default
location of the gizmo. The gizmo can be displayed at the center of the
selection set (default), or it can be positioned at the 0,0,0 coordinates of
the current UCS.
■ Automatic display. The GTAUTO system variable sets whether gizmos
are displayed automatically whenever you select objects in a 3D view that
is set to a 3D visual style (default). If you turn off this system variable, the
grips are not displayed until the gizmos are active.
■ Conversion of move, rotate, and scale operations from 2D to 3D.
Turn on the GTDEFAULT system variable to start the 3DMOVE, 3DROTATE,
or 3DSCALE command automatically when the MOVE, ROTATE, or SCALE
command is started in a 3D view. This system variable is turned off by
default.
■ Active status of subobject grips. If you select a subobject, the
GRIPSUBOBJMODE system variable sets whether the subobject grips are
active immediately. Setting subobject grips to be active upon selection
helps you modify groups of mesh subobjects without selecting them again.
Move 3D Objects
Move a selection set of objects and subobjects freely or constrain the movement
to an axis or plane.
To move 3D objects and subobjects, click and drag the gizmo anywhere in 3D
space. This location (indicated by the center box [or base grip] of the gizmo)
sets the base point for the movement and temporarily changes the position
of the UCS while you move the selected objects.
412 | Chapter 8 Work with 3D Models
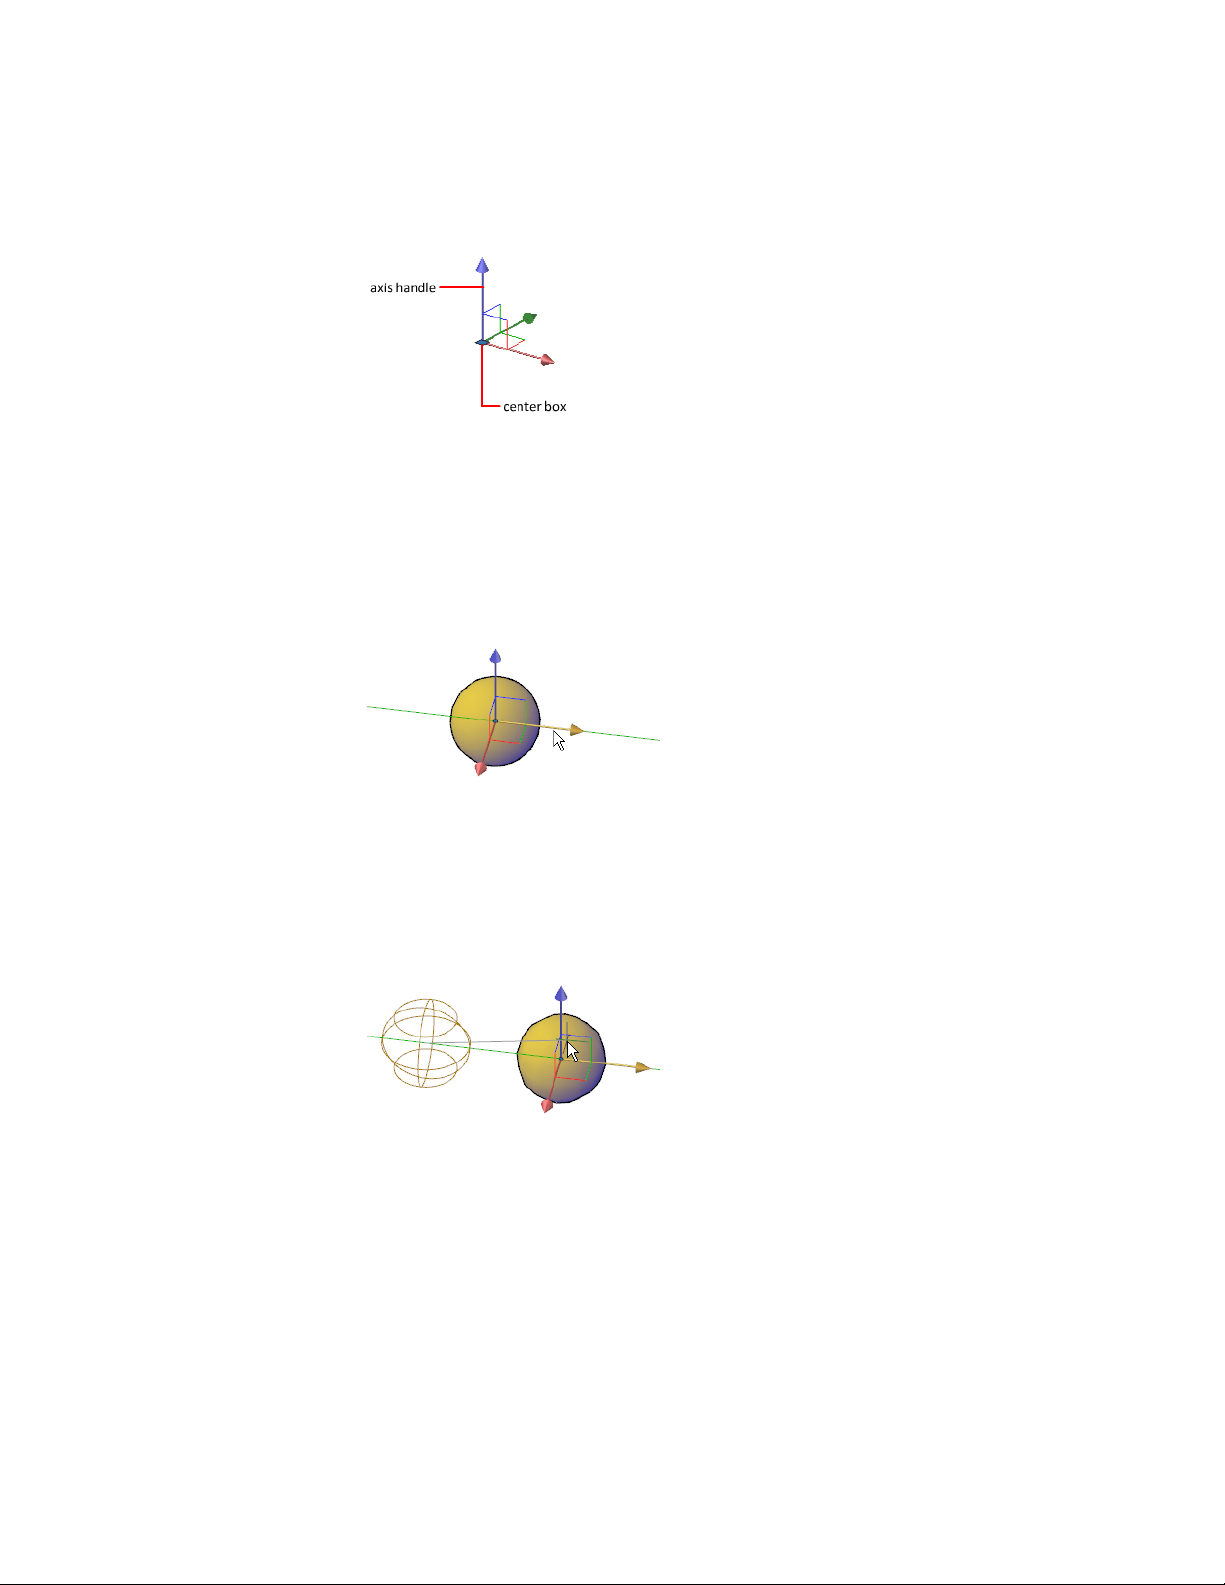
To move the objects freely, drag outside the gizmo or specify the axis or plane
to which you will constrain the movement.
Constrain the Movement to an Axis
You can use the Move gizmo to constrain the movement to an axis. As the
cursor hovers over an axis handle on the gizmo, a vector aligned with the axis
is displayed, and the specified axis turns yellow. Click the axis handle.
As you drag the cursor, movement of the selected objects and subobjects is
constrained to the highlighted axis. You can click or enter a value to specify
the distance of the move from the base point. If you enter a value, the
movement direction of the object follows the initial direction of the cursor
movement.
Modify 3D Models | 413
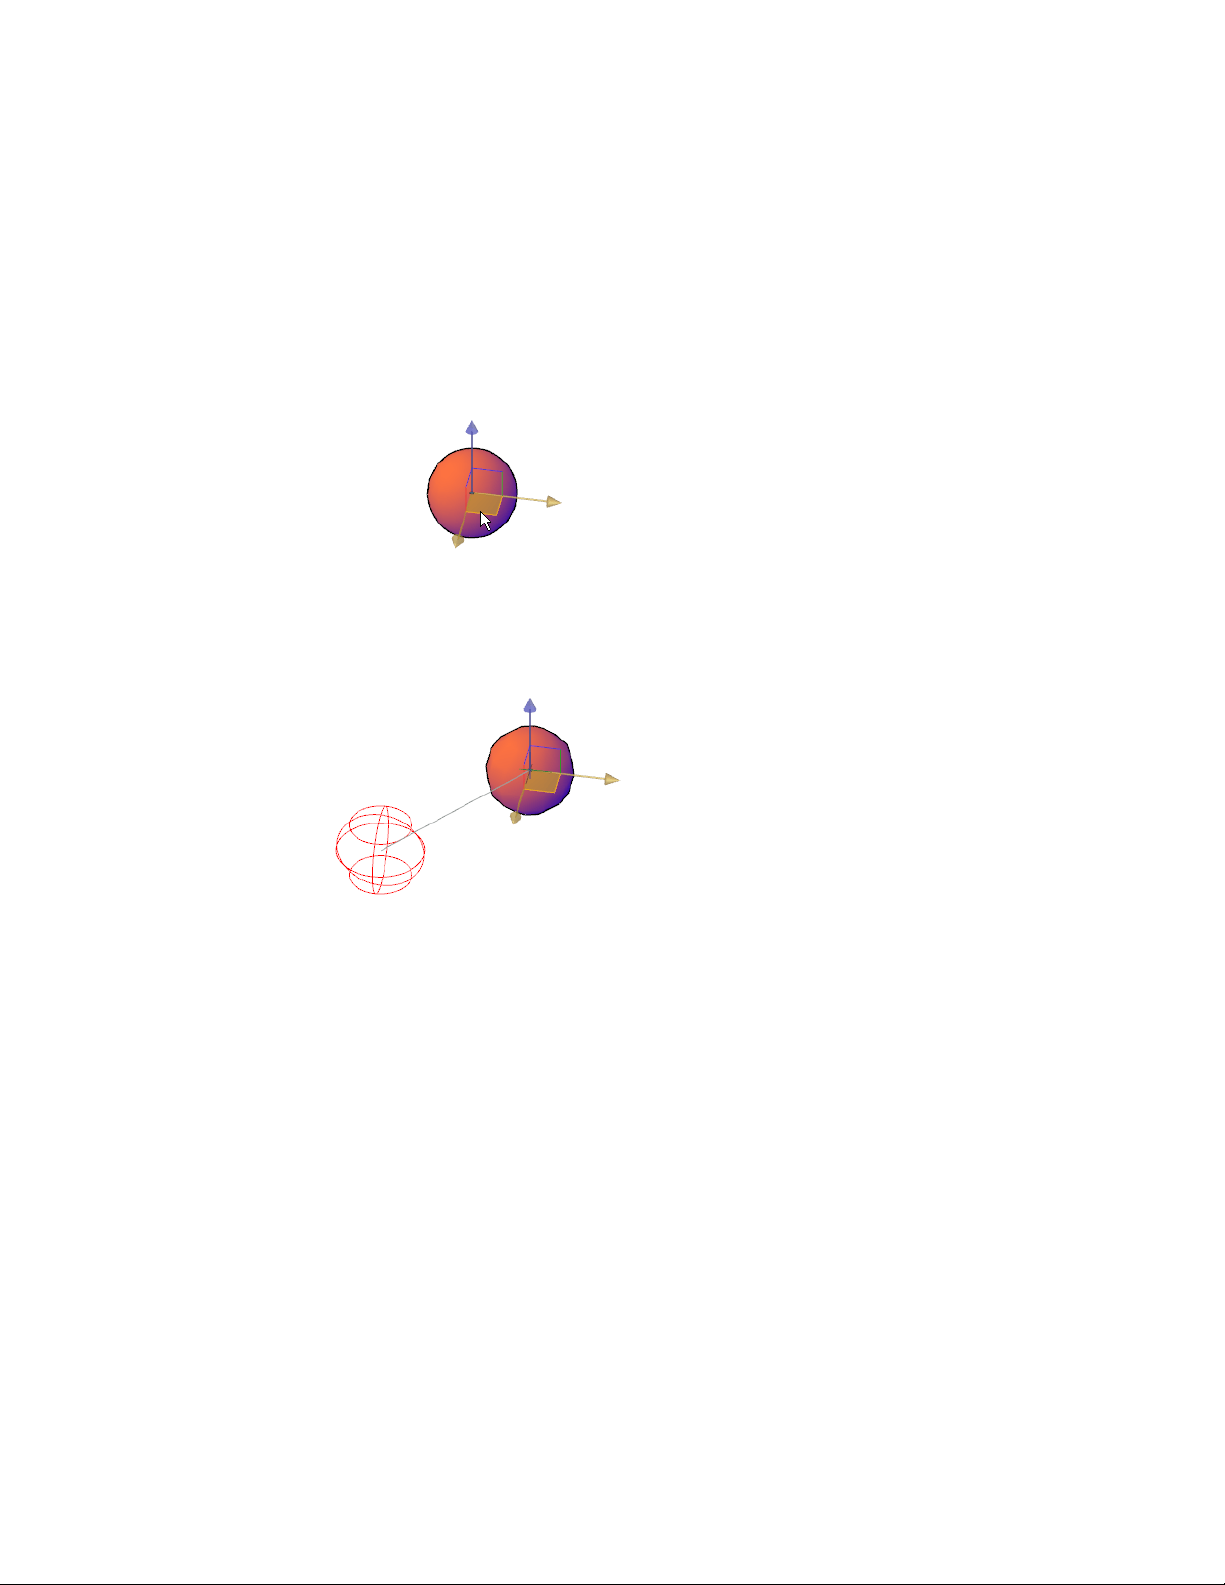
Constrain the Movement to a Plane
You can use the Move gizmo to constrain the movement to a plane. Each
plane is identified by a rectangle that extends from the respective axis handles.
You can specify the plane of movement by moving the cursor over the
rectangle. When the rectangle turns yellow, click it.
As you drag the cursor, the selected objects and subobjects move only along
the highlighted plane. Click or enter a value to specify the distance of the
move from the base point.
Rotate 3D Objects
Constrain the rotation of 3D objects and subobjects to an axis.
After you select the objects and subobjects that you want to rotate, the gizmo
is located at the center of the selection set. This location is indicated by the
center box (or base grip) of the gizmo. It sets the base point for the movement
and temporarily changes the position of the UCS while you rotate the selected
objects.
414 | Chapter 8 Work with 3D Models
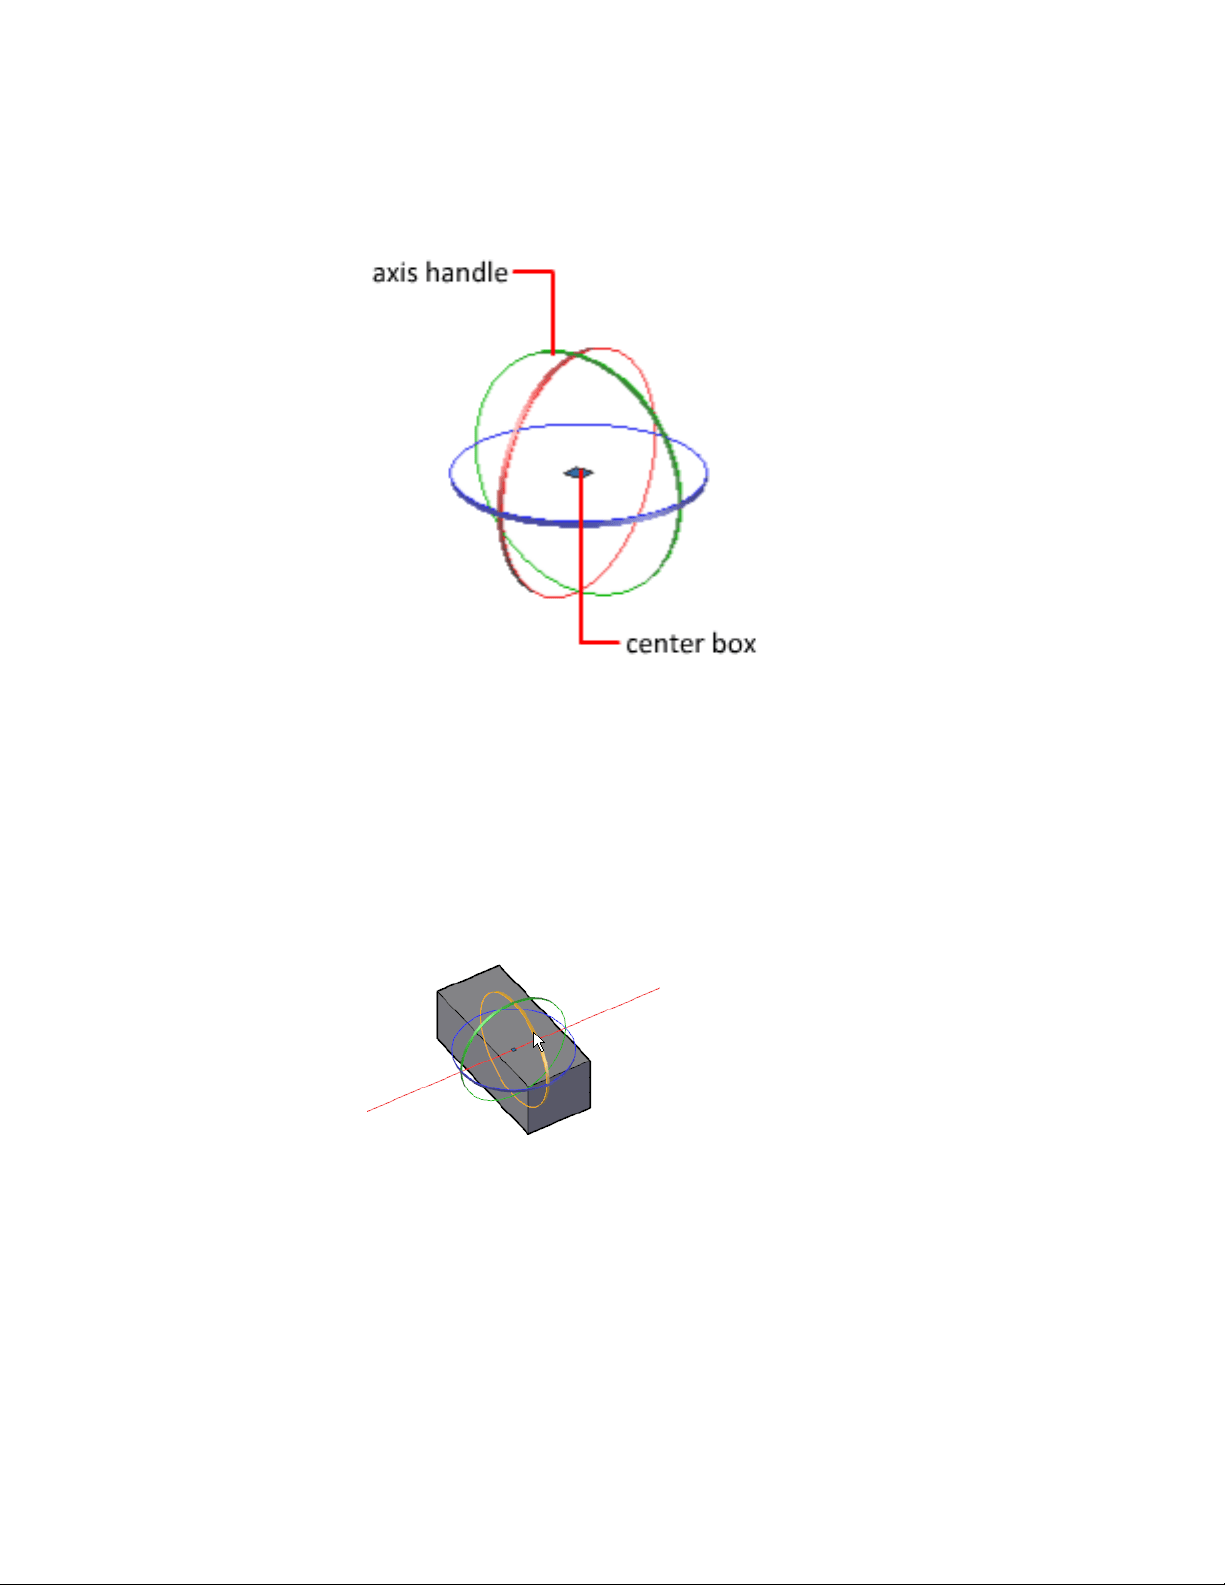
You then rotate the objects freely by dragging outside the gizmo. You can also
specify an axis about which to constrain the rotation.
If you want to realign the center of rotation, you can relocate the gizmo by
using the Relocate Gizmo option on the shortcut menu.
Constrain the Rotation to an Axis
You can constrain the rotation to a specified axis. As you move the cursor
over the rotation paths on the 3D rotate gizmo, a vector line representing the
axis of rotation is displayed. Specify an axis of rotation by clicking the rotation
path when it turns yellow.
When you drag the cursor, the selected objects and subobjects rotate about
the base point along the specified axis. The gizmo displays the degree of
rotation from the original position of the object as the object moves. You can
click or enter a value to specify the angle of the rotation.
Modify 3D Models | 415
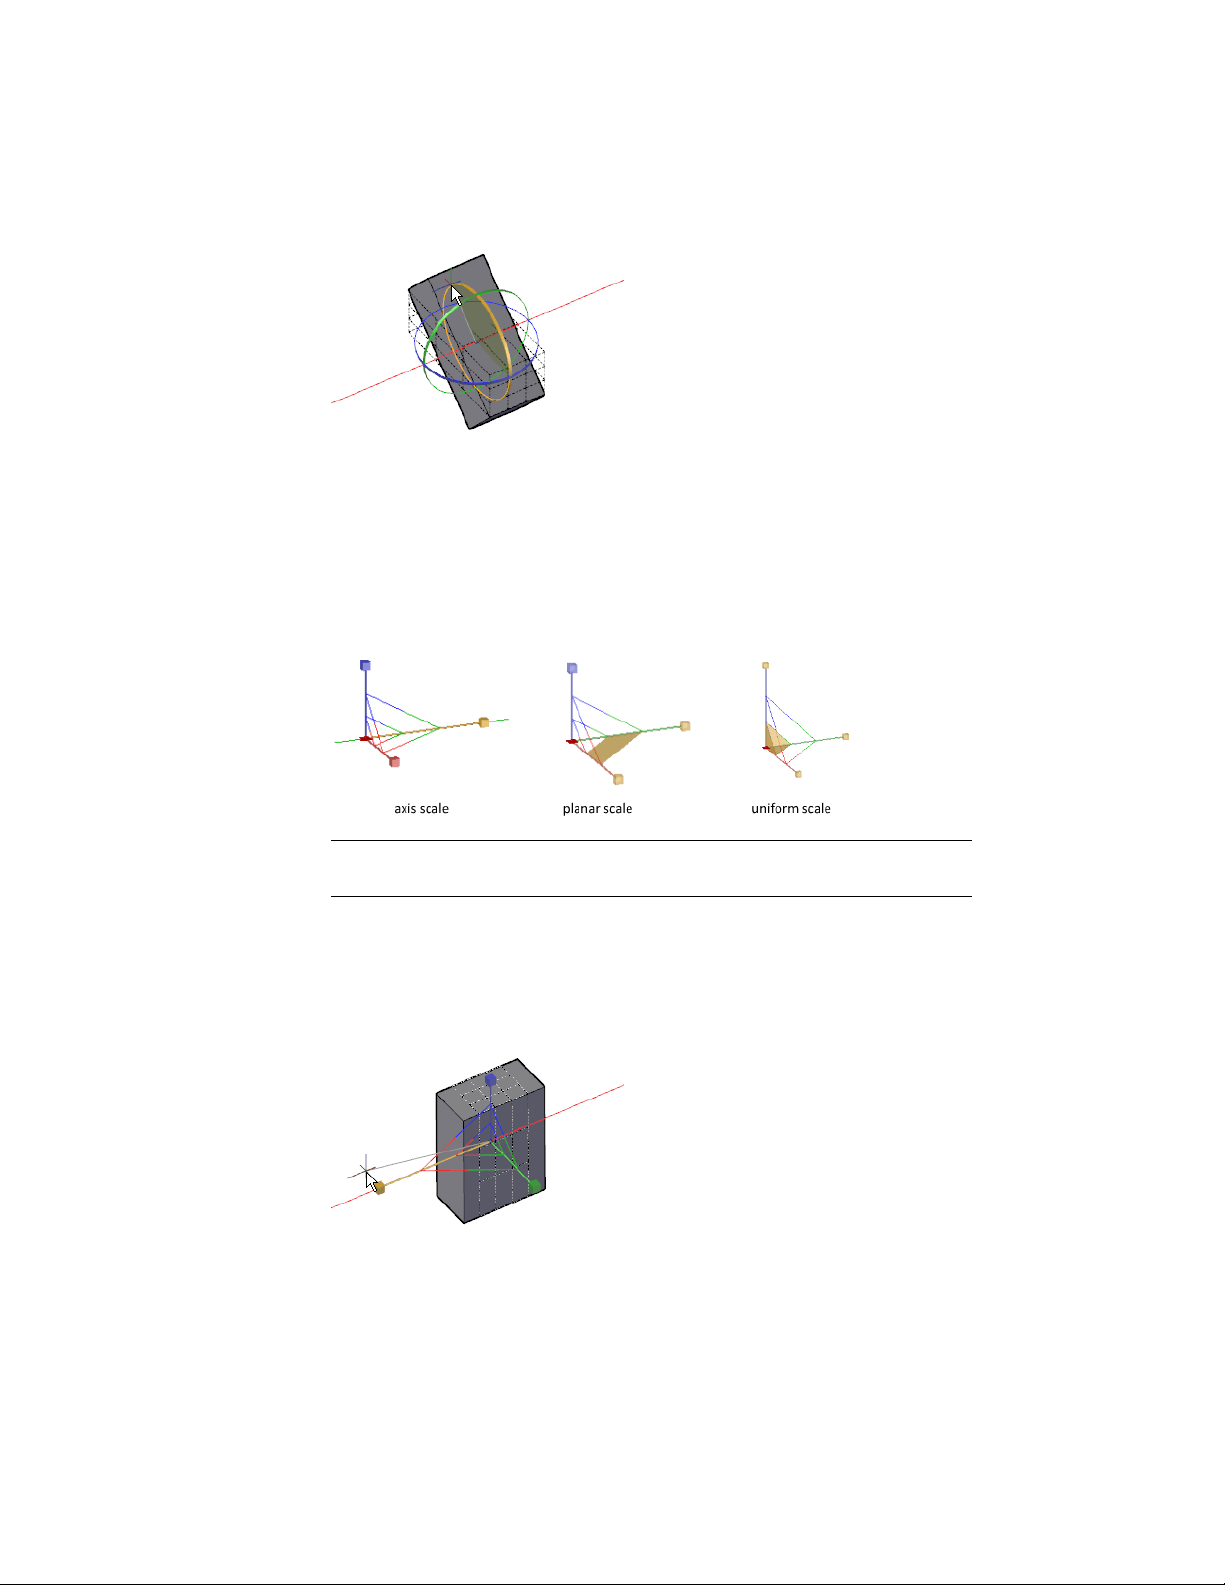
Scale 3D Objects
Change the size of 3D objects uniformly or along a specified axis or plane.
After you select the objects and subobjects to scale, constrain the object scaling
by clicking the gizmo axis, plane, or the portion of the gizmo between all
three axes.
NOTE Non-uniform scaling (along an axis or a plane) is only available for meshes,
it is not available for solids and surfaces.
Scale a 3D Object Along an Axis
Constrain mesh object scaling to a specified axis. As you move the cursor over
the axes on the 3D Scale gizmo, a vector line representing the axis of scale is
displayed. Specify an axis of scale by clicking the axis when it turns yellow.
416 | Chapter 8 Work with 3D Models
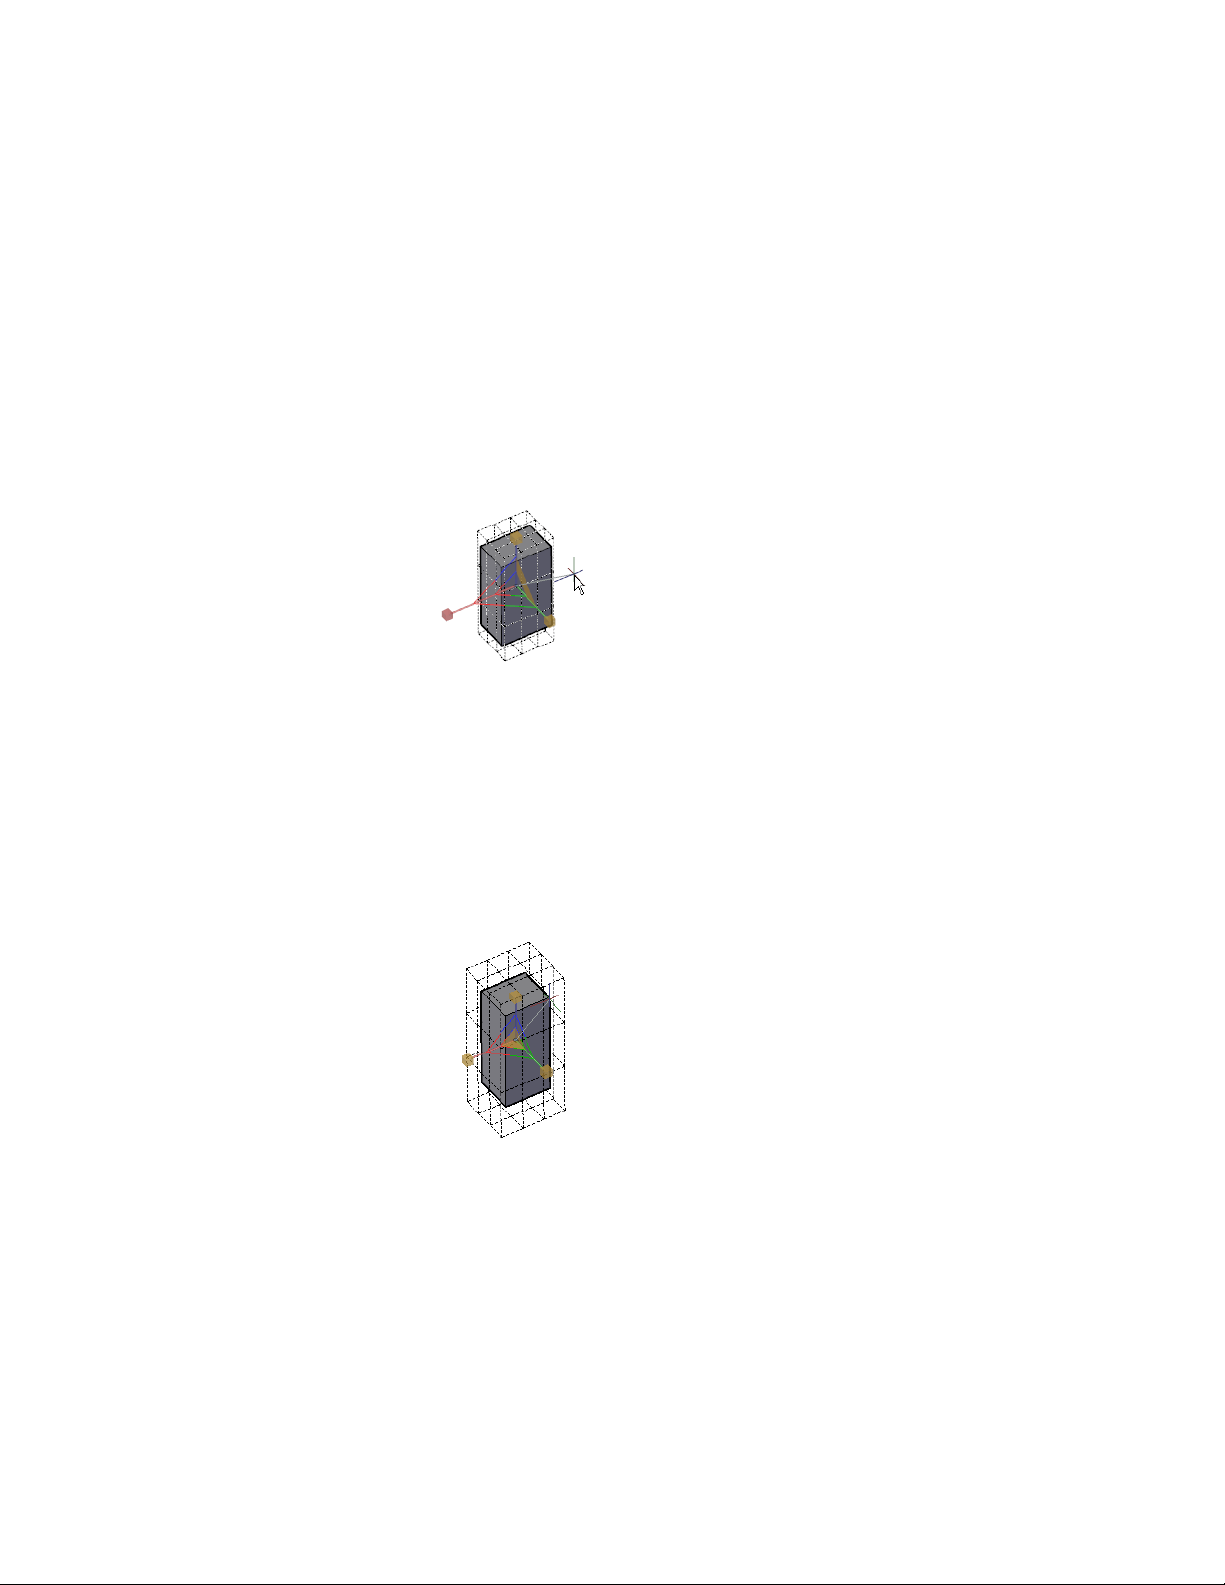
When you drag the cursor, the selected objects and subobjects are resized
along the specified axis. Click or enter a value to specify the scale from the
selected base point.
Scale a 3D Object Along a Plane
Constrain the mesh object scaling to a specified plane. Each plane is identified
by a bar that extends from the outer ends of the respective axis handles. Specify
the plane of scale by moving the cursor over one of the bars. When the bar
turns yellow, click it.
As you drag the cursor, the selected objects and subobjects are scaled only
along the highlighted plane. Click or enter a value to specify the scale from
the selected base point.
Scale a 3D Object Uniformly
Scale solid, surface, and mesh objects uniformly along all axes. As you move
the cursor toward the center point of the gizmo, a highlighted triangular area
indicates that you can click to scale the selected objects and subobjects along
all three axes.
As you drag the cursor, the selected objects and subobjects are scaled uniformly.
Click or enter a value to specify the scale from the selected base point.
Modify 3D Models | 417
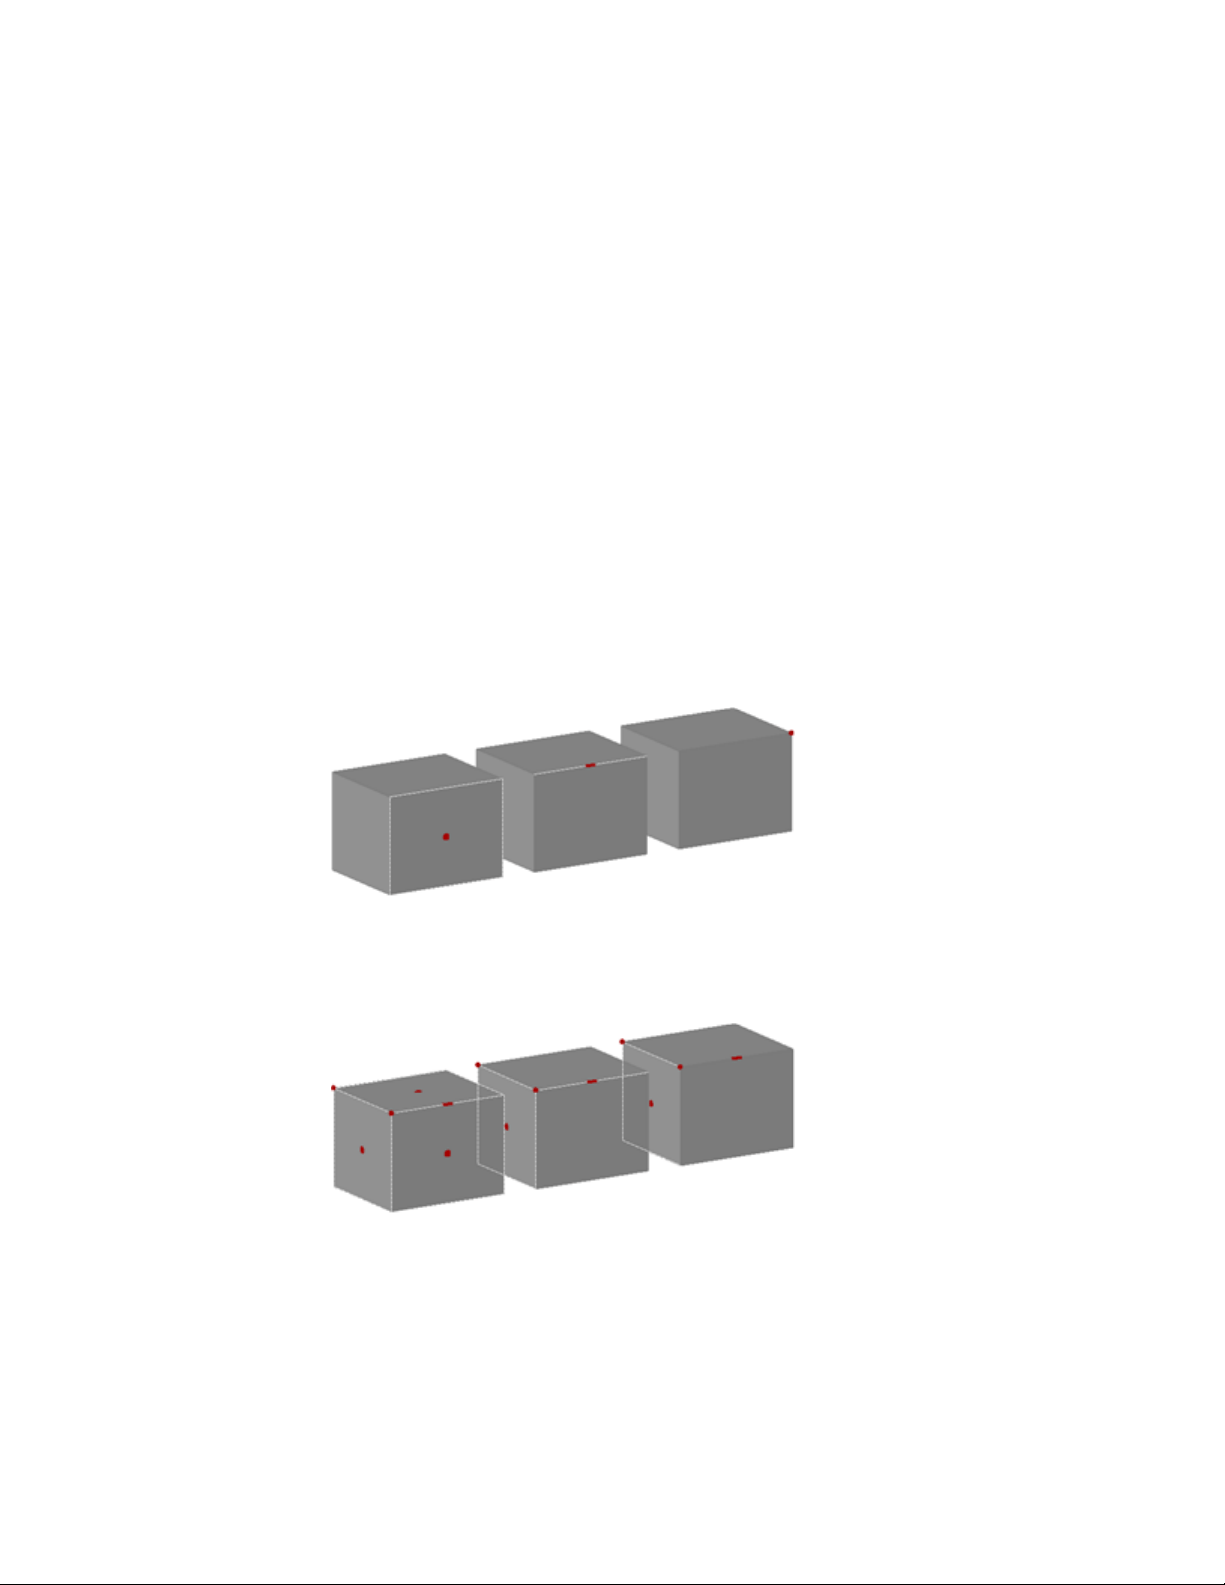
Use Grips to Modify Solids and Surfaces
Use grips to change the shape and size of solids and surfaces.
Use 3D Subobject Grips
Select faces, edges, and vertices on 3D objects.
A subobject is a face, edge or vertex of a solid, surface, or mesh object.
Select Subobjects
To select a face, edge, or vertex of a 3D object, press and hold Ctrl as you select
the object. (If you have set a subobject filter, you do not need to hold Ctrl
first.)
Selected subobjects display different types of grips, depending on the subobject
type.
You can select one or more subobjects on any number of 3D objects. The
selection set can include more than one type of subobject. Press and hold Ctrl
to select subobjects at the selection prompts of the MOVE, ROTATE, SCALE,
and ERASE commands.
418 | Chapter 8 Work with 3D Models
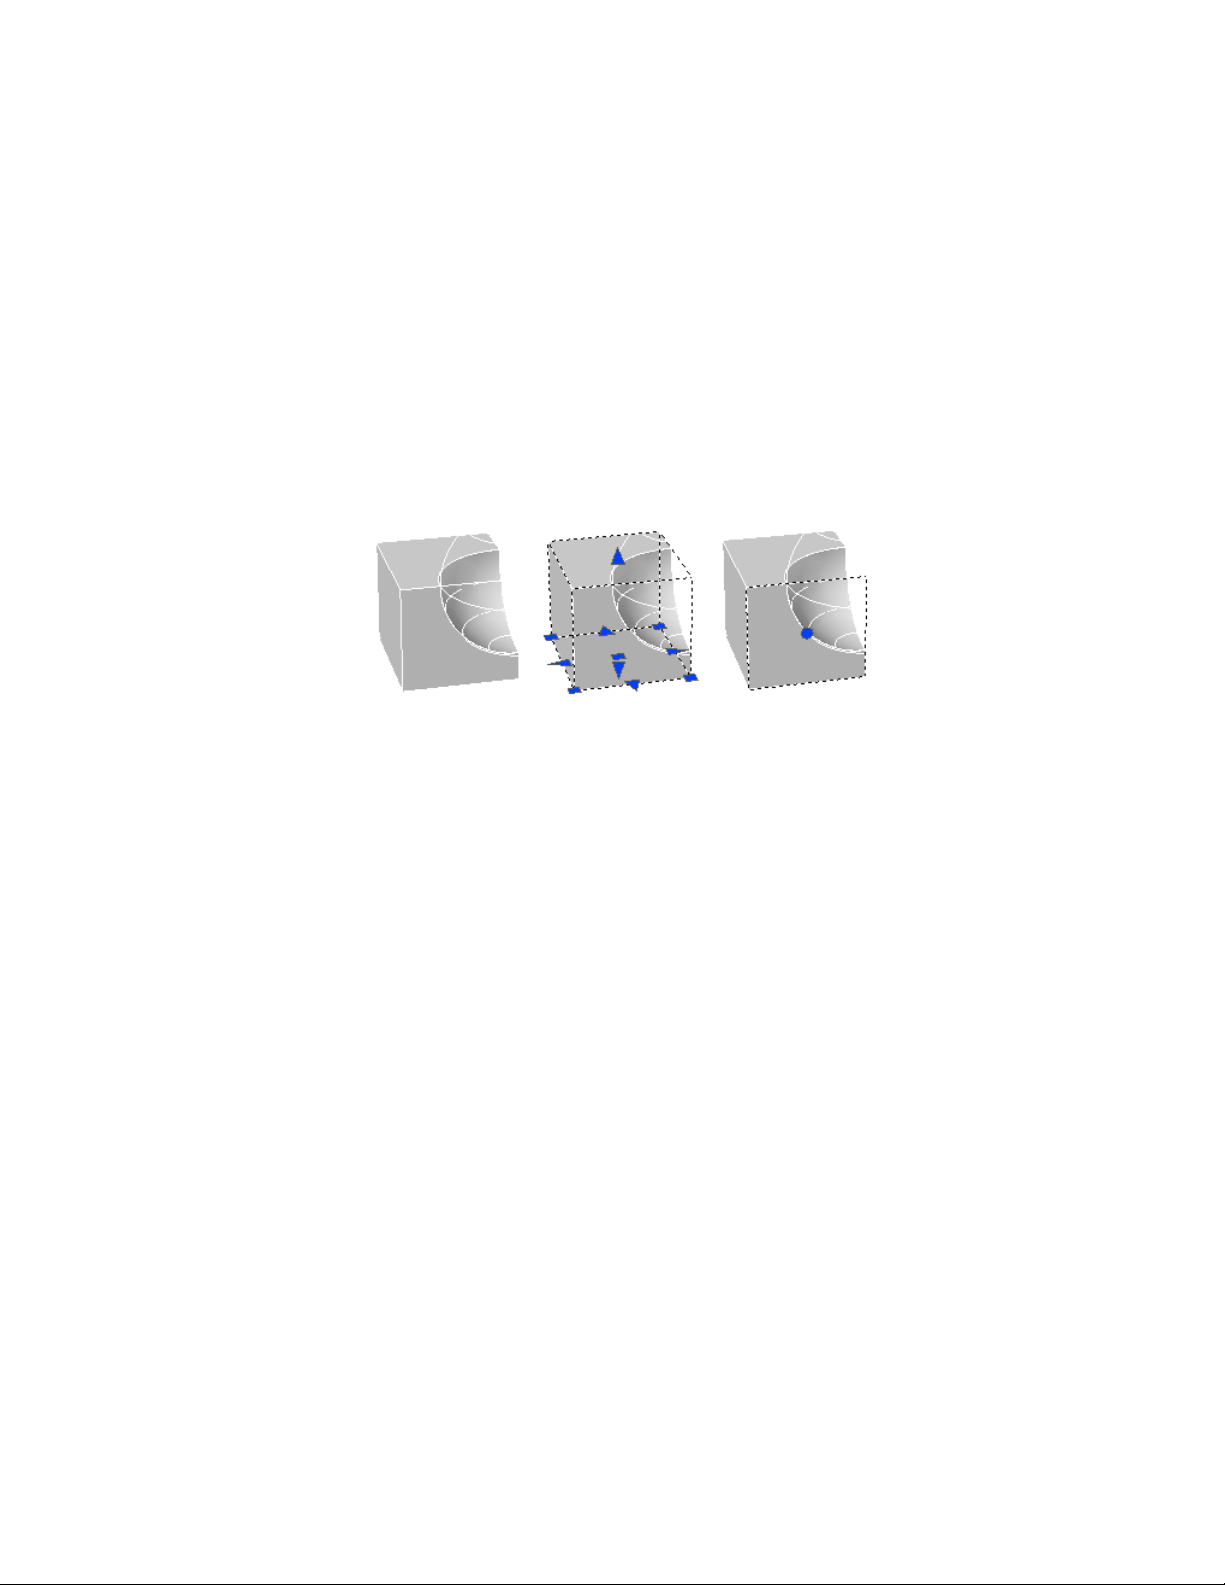
You can remove an item from the selection set by pressing and holding Shift
and selecting it again.
Select Subobjects on Composite 3D Solids
Press and hold Ctrl to select faces, edges, and vertices on composite solids. If
the History property of the composite solid is set to Record (On), the first
“pick” might select the history subobject. (The history subobject is the portion
of the original object that was removed during the union, subtract, or intersect
operation.) Continue to hold Ctrl and pick again to select a face, edge, or
vertex on the original form.
If you set a subobject selection filter (page 419), you can select the face, edge,
or vertex by clicking it once.
Cycle Through and Filter Subobjects
Filter and select faces, edges, and vertices on 3D objects.
A subobject is a face, edge or vertex of a solid, surface, or mesh object.
Cycle Through Multiple Subobjects
In 3D views, some objects or subobjects might be hidden behind others. You
can press Ctrl+Spacebar to cycle through the hidden subobjects until the object
you want to select is highlighted.
For example, when you select faces on a box, the face in the foreground is
detected first. To select a hidden face, press the Spacebar (with Ctrl still
pressed). Release the Spacebar and click to select the face.
Modify 3D Models | 419
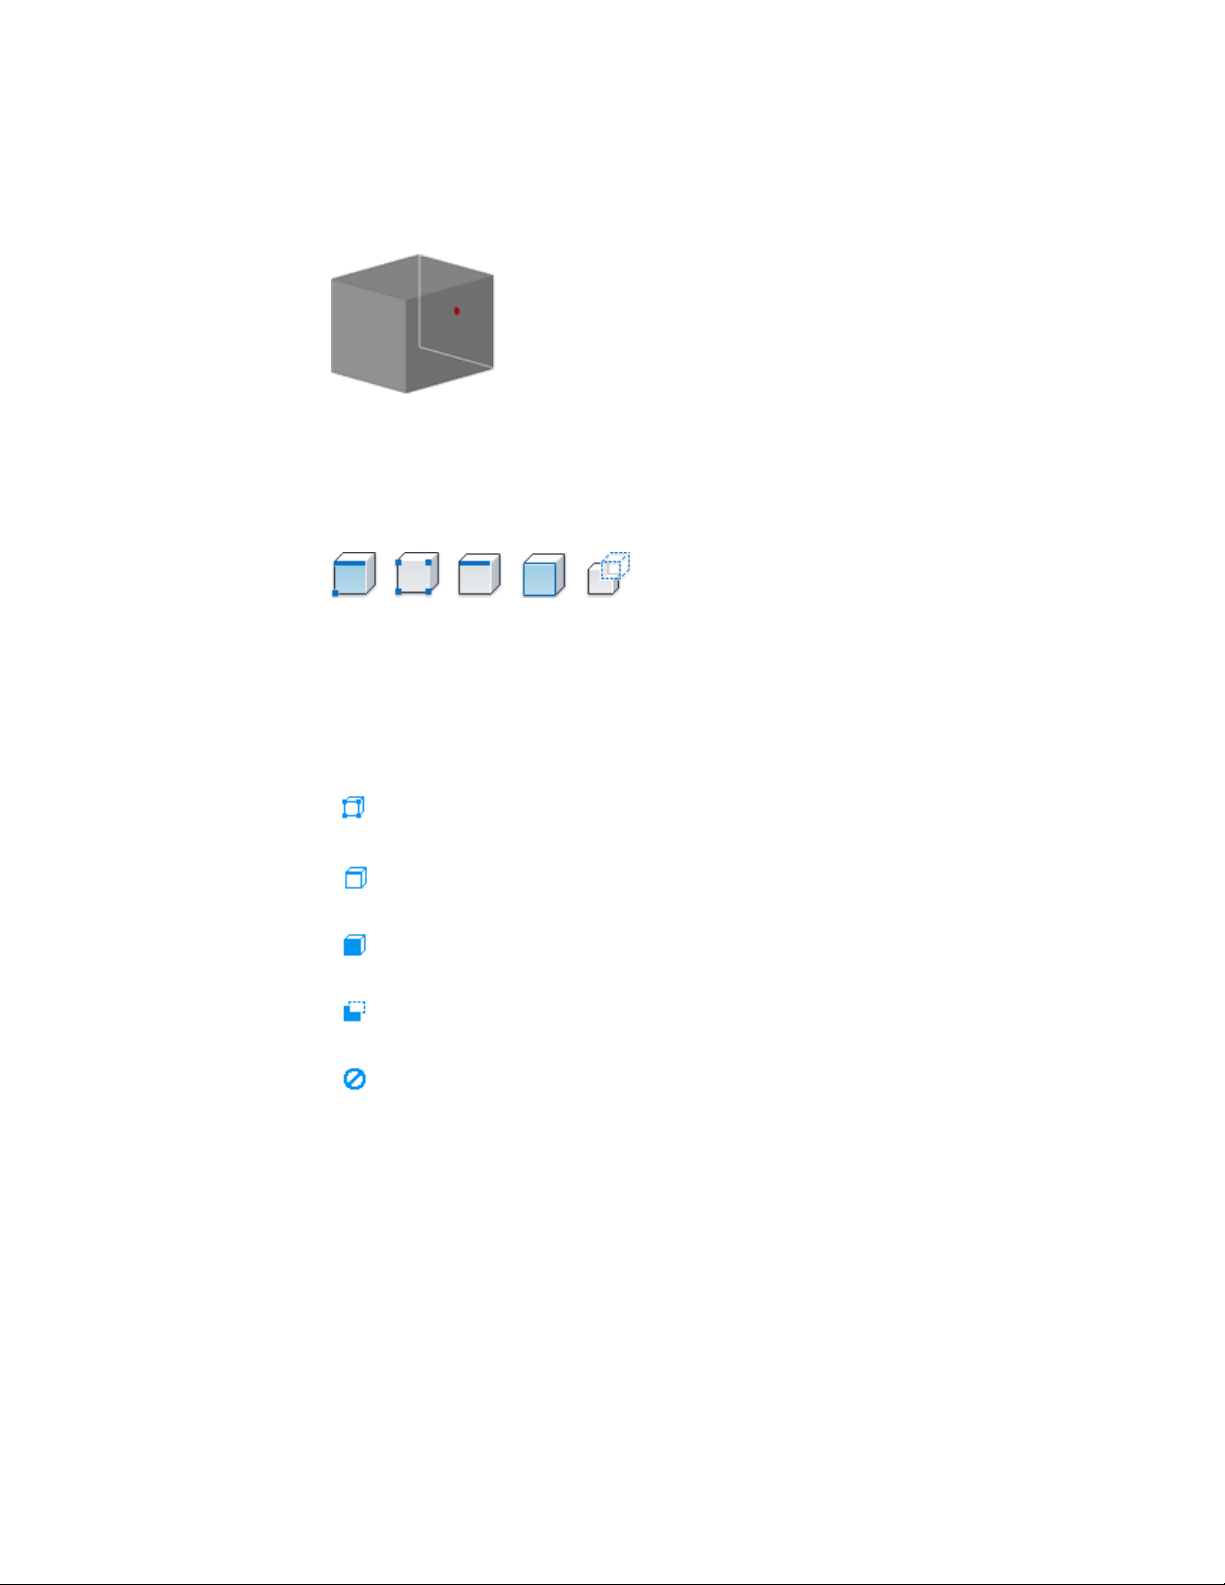
Turn on the Subobject Selection Filter
Selecting a specific type of subobject can be difficult on complex objects, such
as meshes. You can limit the selection to a face, edge, vertex, or history
subobject by setting a subobject selection filter.
When a subobject selection filter is on, you do not need to press and hold
Ctrl to select the face, edge, or vertex of a 3D model. However, you need to
turn off the filter to select the entire object. The current subobject filter setting
is stored in the SUBOBJSELECTIONMODE system variable.
When a subobject filter is turned on, the following icons are displayed near
the cursor:
Vertex filtering is on
Edge filtering is on
Face filtering is on
History subobject filtering is on
Subobject filtering is off
Use Grips to Edit 3D Solids and Surfaces
Use grips to change the size and shape of some individual solids and surfaces.
420 | Chapter 8 Work with 3D Models
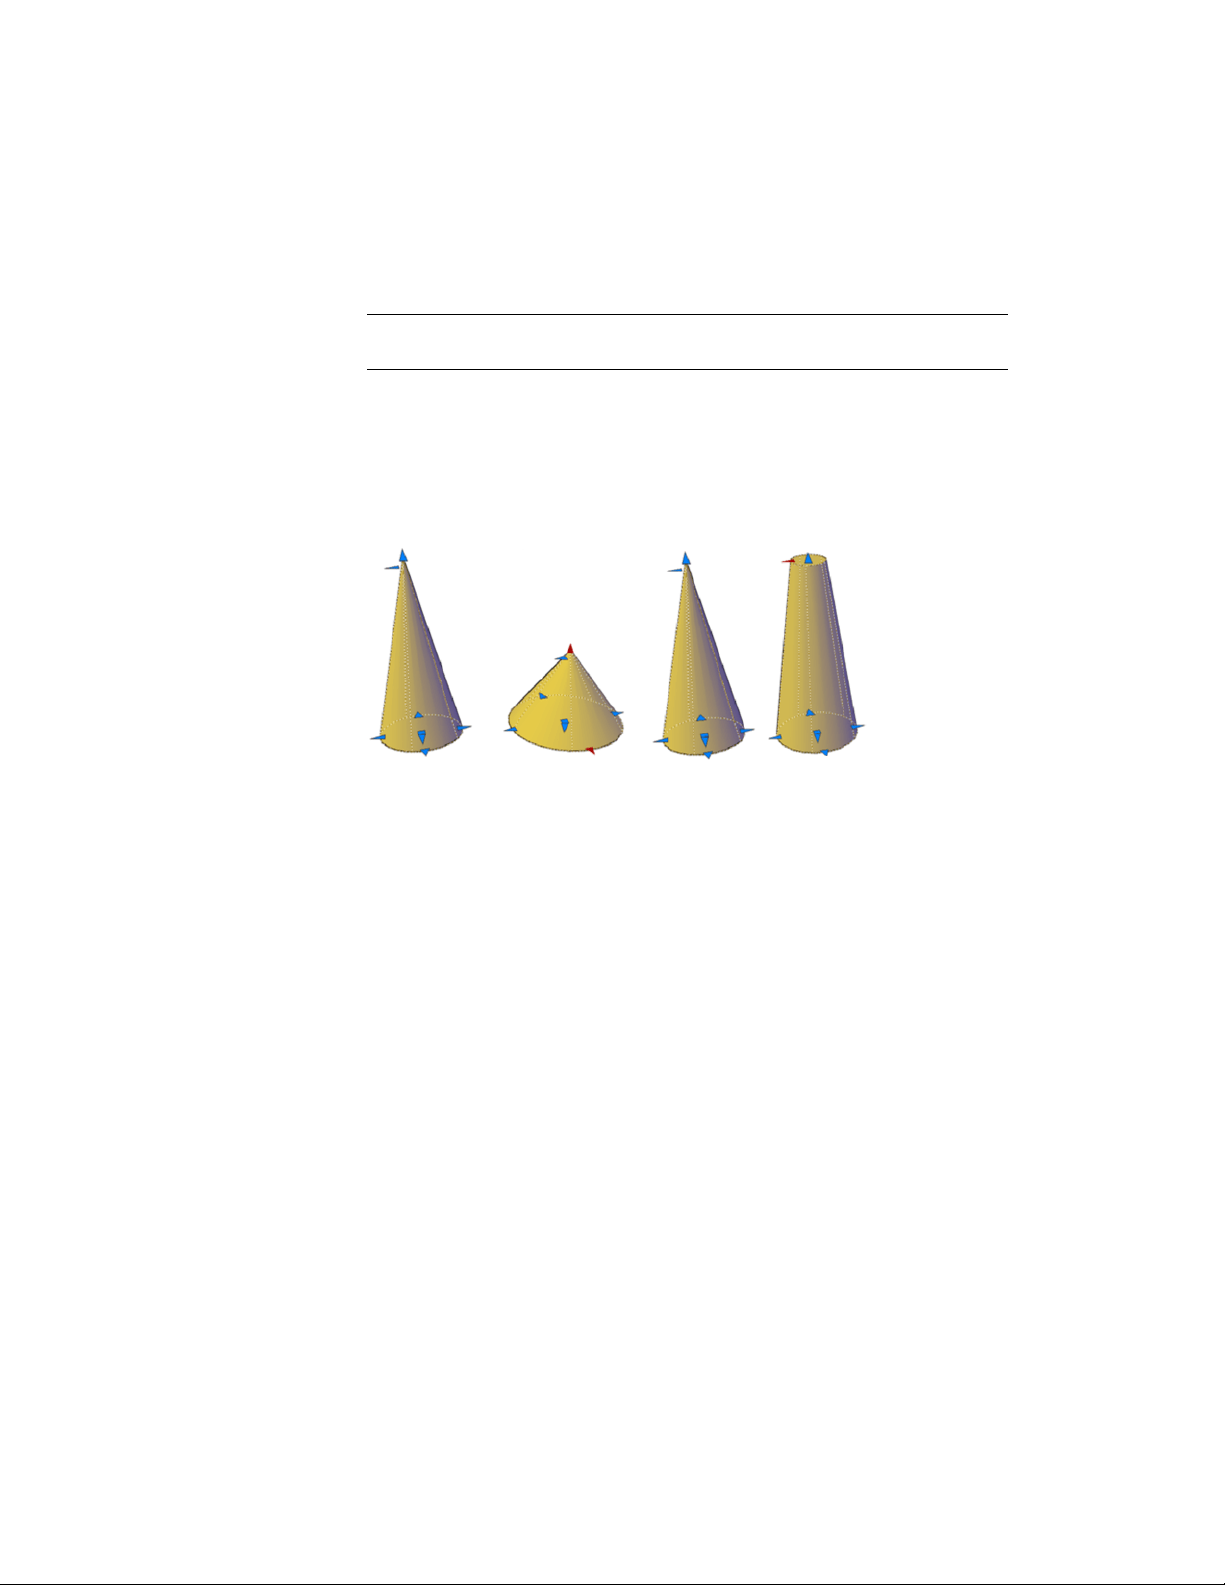
The method you use to manipulate the 3D solid or surface depends on the
type of object and the method used to create it.
NOTE For mesh objects, only the center grip is displayed. However you can edit
mesh objects with the 3D Move, Rotate, or Scale gizmos.
Primitive Solid Forms and Polysolids
You can drag grips to change the shape and size of primitive solids and
polysolids. For example, you can change the height and base radius of a cone
without losing the overall cone shape. Drag the top radius grips to transform
the cone to a flat-topped, frustum cone.
Extruded Solids and Surfaces
You can convert 2D objects to solids and surfaces with the EXTRUDE
command. When selected, extruded solids and surfaces display grips on their
profiles. A profile is the original outline that defines the shape of the extruded
solid or surface. Drag profile grips to modify the overall shape of the object.
If the extrusion was created along a sweep path, the path can be manipulated
with grips. If a path was not used, you can modify the height of the object
using a grip at the top of the extruded solid or surface.
Swept Solids and Surfaces
Swept solids and surfaces display grips on the swept profile as well as on the
sweep path. You can drag these grips to modify the solid or surface.
Modify 3D Models | 421
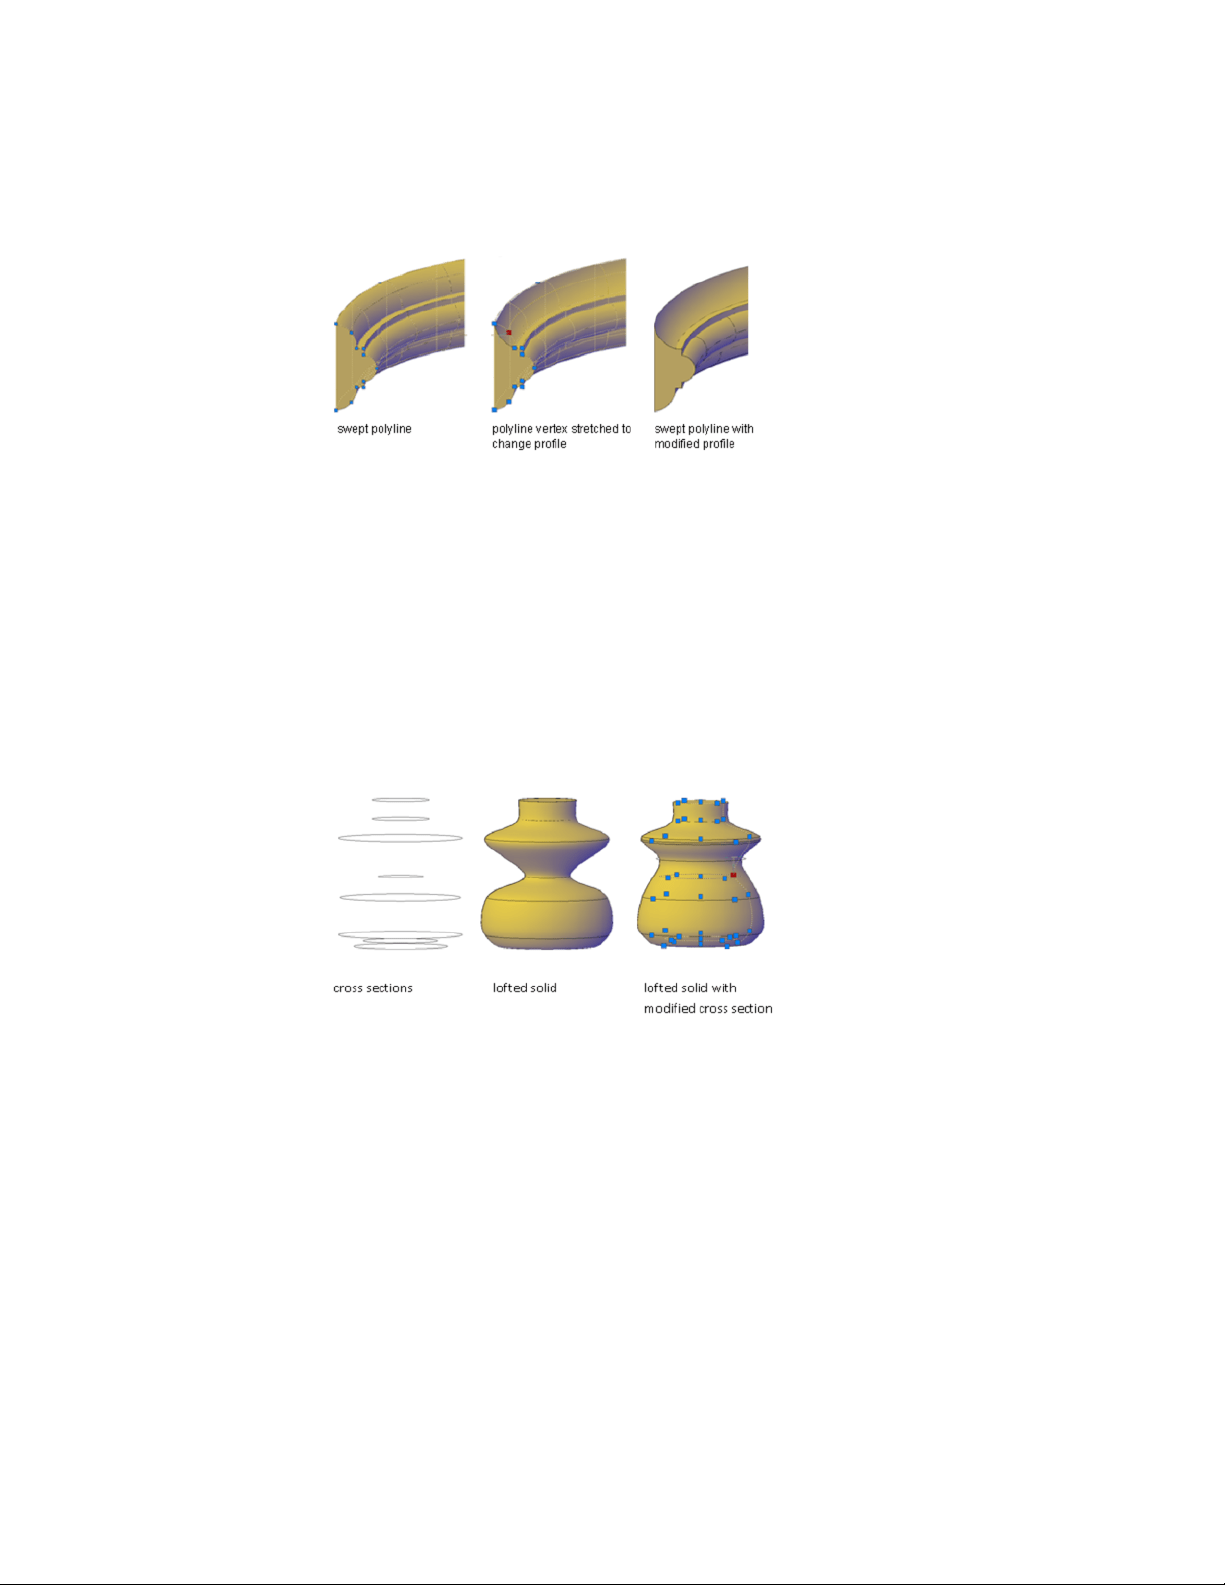
When you click and drag a grip on the profile, the changes are constrained
to the plane of the profile curve.
Lofted Solids and Surfaces
Depending on how a lofted solid or surface was created, the solid or surface
displays grips on the following, defining lines or curves:
■ Cross section
■ Path
Drag grips on any of the defining lines or curves to modify the shape. If the
lofted object contains a path, you can only edit the portion of the path that
is between the first and last cross sections.
You cannot use grips to modify lofted solids or surfaces that are created with
guide curves.
Revolved Solids and Surfaces
Revolved solids and surfaces display grips on the revolved profile at the start
of the revolved solid or surface. You can use these grips to modify the profile
of the solid of surface.
422 | Chapter 8 Work with 3D Models
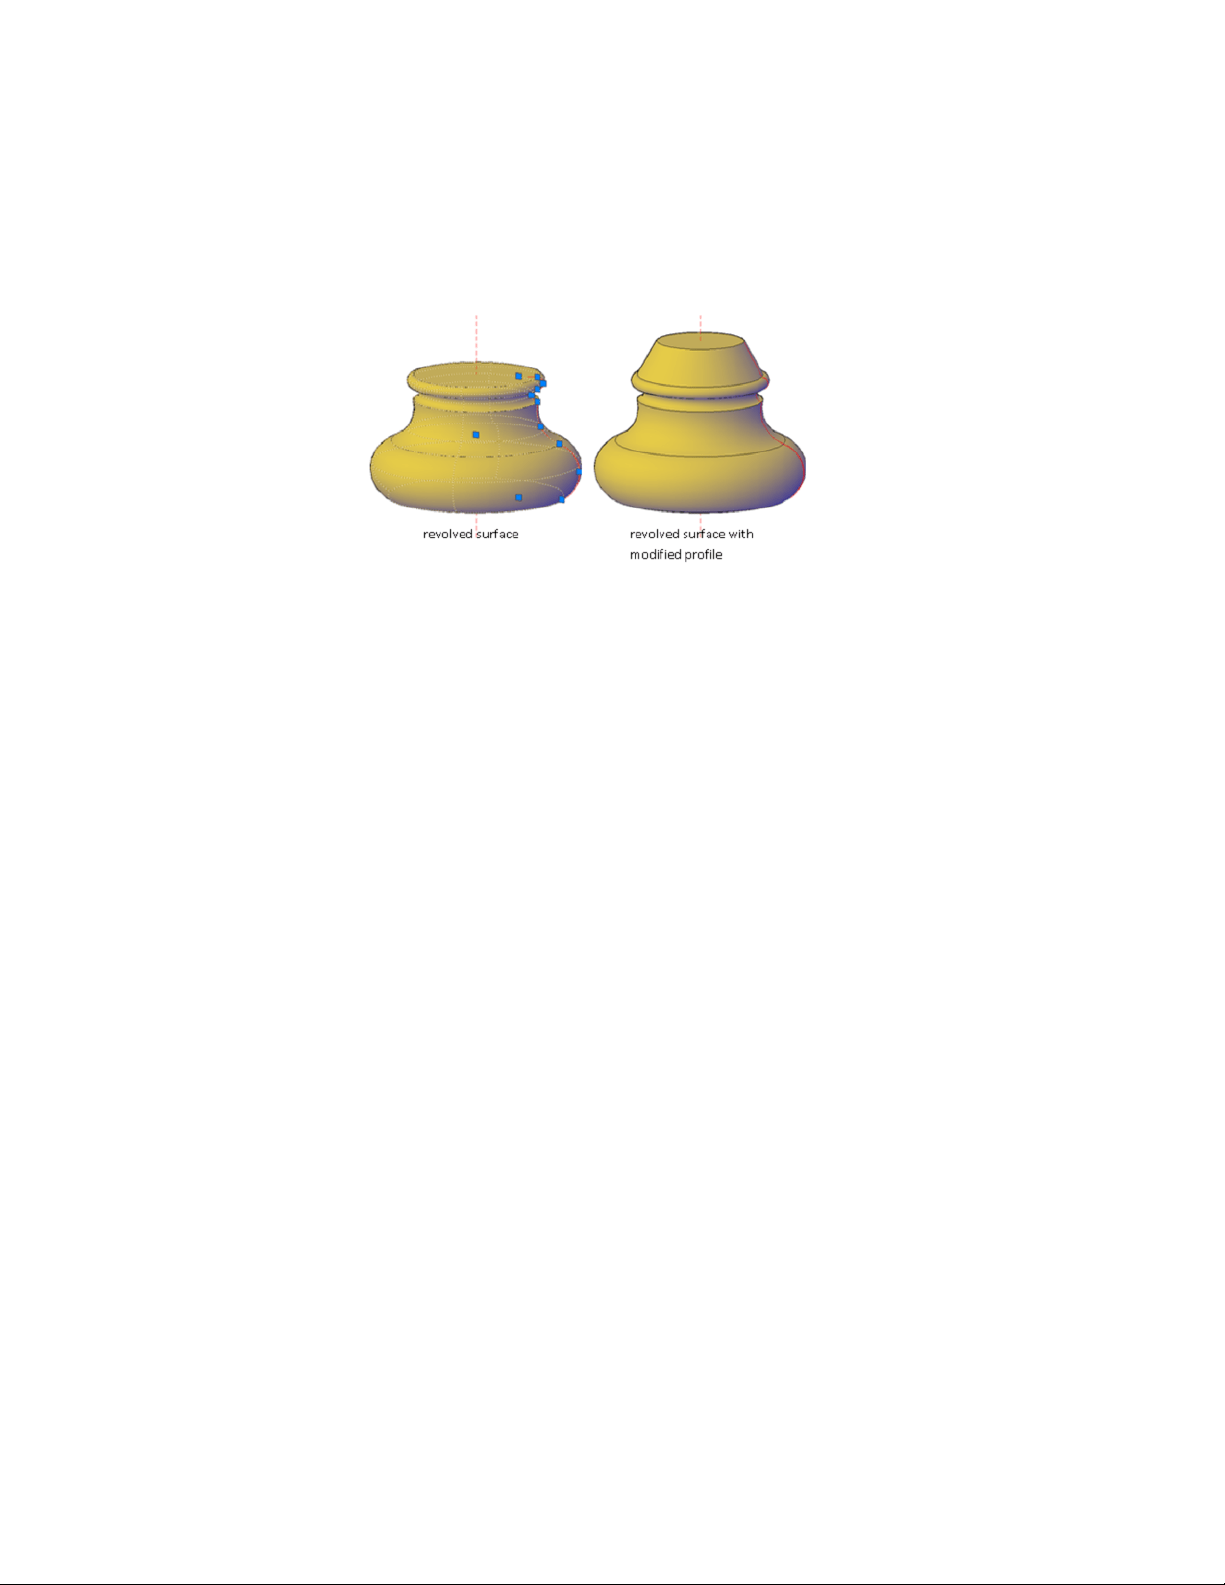
A grip is also displayed at the axis of revolution endpoint. You can relocate
the axis of revolution by dragging the grip to another location.
See also:
Create Solids (page 352)
Create a Solid Cone (page 356)
Modify 3D Subobjects
Modify the shape of a 3D solid or surface by editing its subobjects (faces, edges,
and vertices).
Move, Rotate, and Scale 3D Subobjects
Move, rotate, and scale individual subobjects on 3D solids and surfaces.
Use the same methods to modify a face, edge, or vertex that you use to modify
the entire object:
■ Drag grips
■ Use gizmos (3DMOVE, 3DROTATE, and 3DSCALE)
■ Enter object editing commands (MOVE, ROTATE, and SCALE)
About Modifying Subobjects
When you move, rotate, or scale a subobject, the subobject is modified in a
way that maintains the integrity of the 3D solid or surface. For example, when
Modify 3D Models | 423
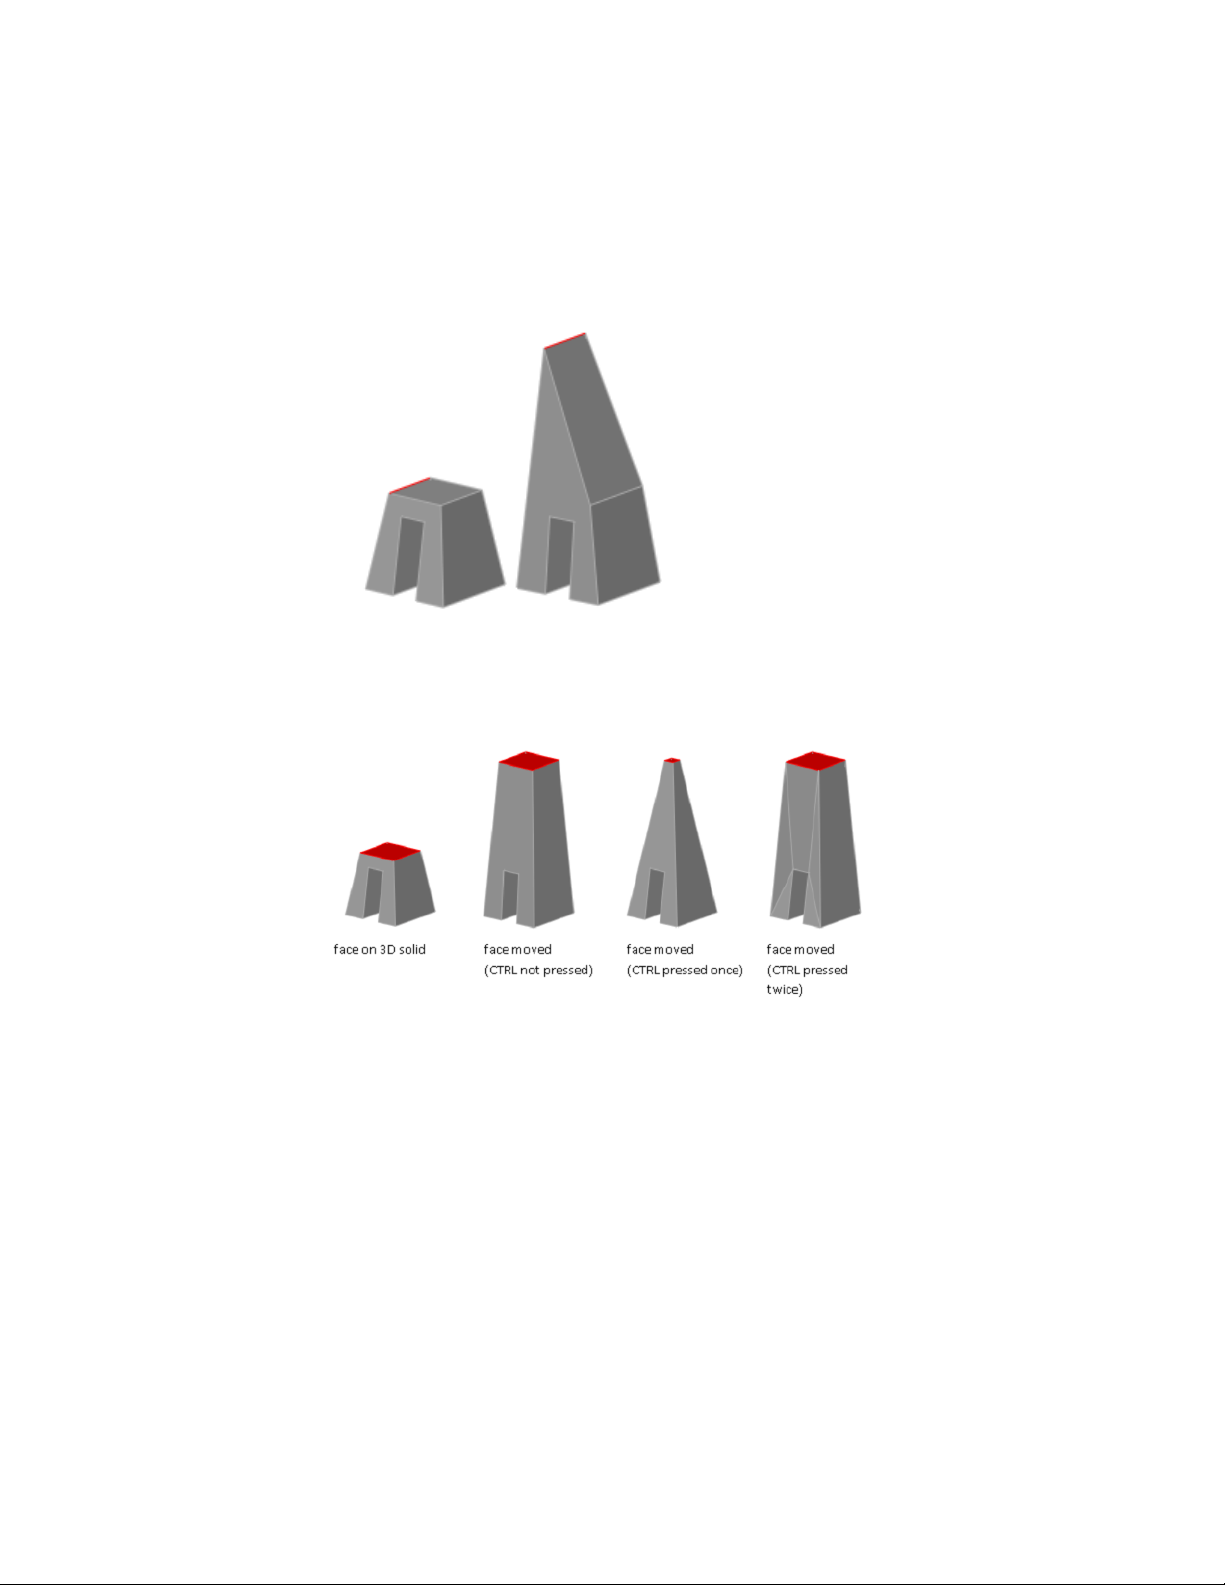
you drag an edge to move it, the adjacent faces are adjusted so that they remain
adjacent to the edge.
Several results are possible when you modify a solid or surface. When you
move, rotate, or scale subobjects, you can press Ctrl one or more times as you
drag to cycle through modification options.
The following illustration shows the modification options for moving a face.
Move, Rotate, and Scale Subobjects on Composite Solids
When you modify composite solids, the effect of the edits depends on the
current setting of the History property.
■ To modify subobjects of each history component separately, the History
property must be set to Record (On).
■ To modify subobjects of the combined composite solid as a whole, the
History property must be set to None (Off).
424 | Chapter 8 Work with 3D Models

Rules and Limitations When Moving, Rotating, and Scaling Subobjects
You can only move, rotate, and scale subobjects on 3D solids if the operation
maintains the integrity of the solid. The following rules and limitations apply
to moving, rotating, and scaling subobjects:
■ When you use grips to modify subobjects, grips are not displayed on the
subobjects that cannot be moved, rotated, or scaled.
■ In most cases, you can move, rotate, and scale both planar and non-planar
faces.
■ You can only modify an edge that is a straight line and that has at least
one planar adjacent face. The planes of the adjacent planar faces are
adjusted to contain the modified edge.
■ You cannot move, rotate, or scale edges (or their vertices) that are imprinted
inside faces.
■ You can only modify a vertex if it has at least one planar adjacent face.
The planes of the adjacent planar faces are adjusted to contain the modified
vertex.
■ When you drag a subobject, the final result might be different than the
preview displayed during the modification. This result occurs when the
solid geometry is adjusted in order to maintain its topology. In some cases,
the modification is not possible because it changes the topology of the
solid too severely.
■ If the modification causes spline surfaces to be extended, the operation is
often unsuccessful.
■ You cannot move, rotate, or scale non-manifold edges (edges that are
shared by more than two faces) or non-manifold vertices. Also, if some
non-manifold edges or vertices are present near faces, edges, and vertices
that you modify, the operation might not be possible.
See also:
Modify Mesh Objects (page 454)
Modify Faces on 3D Objects
Modify individual faces on 3D objects using a variety of methods.
Modify 3D Models | 425
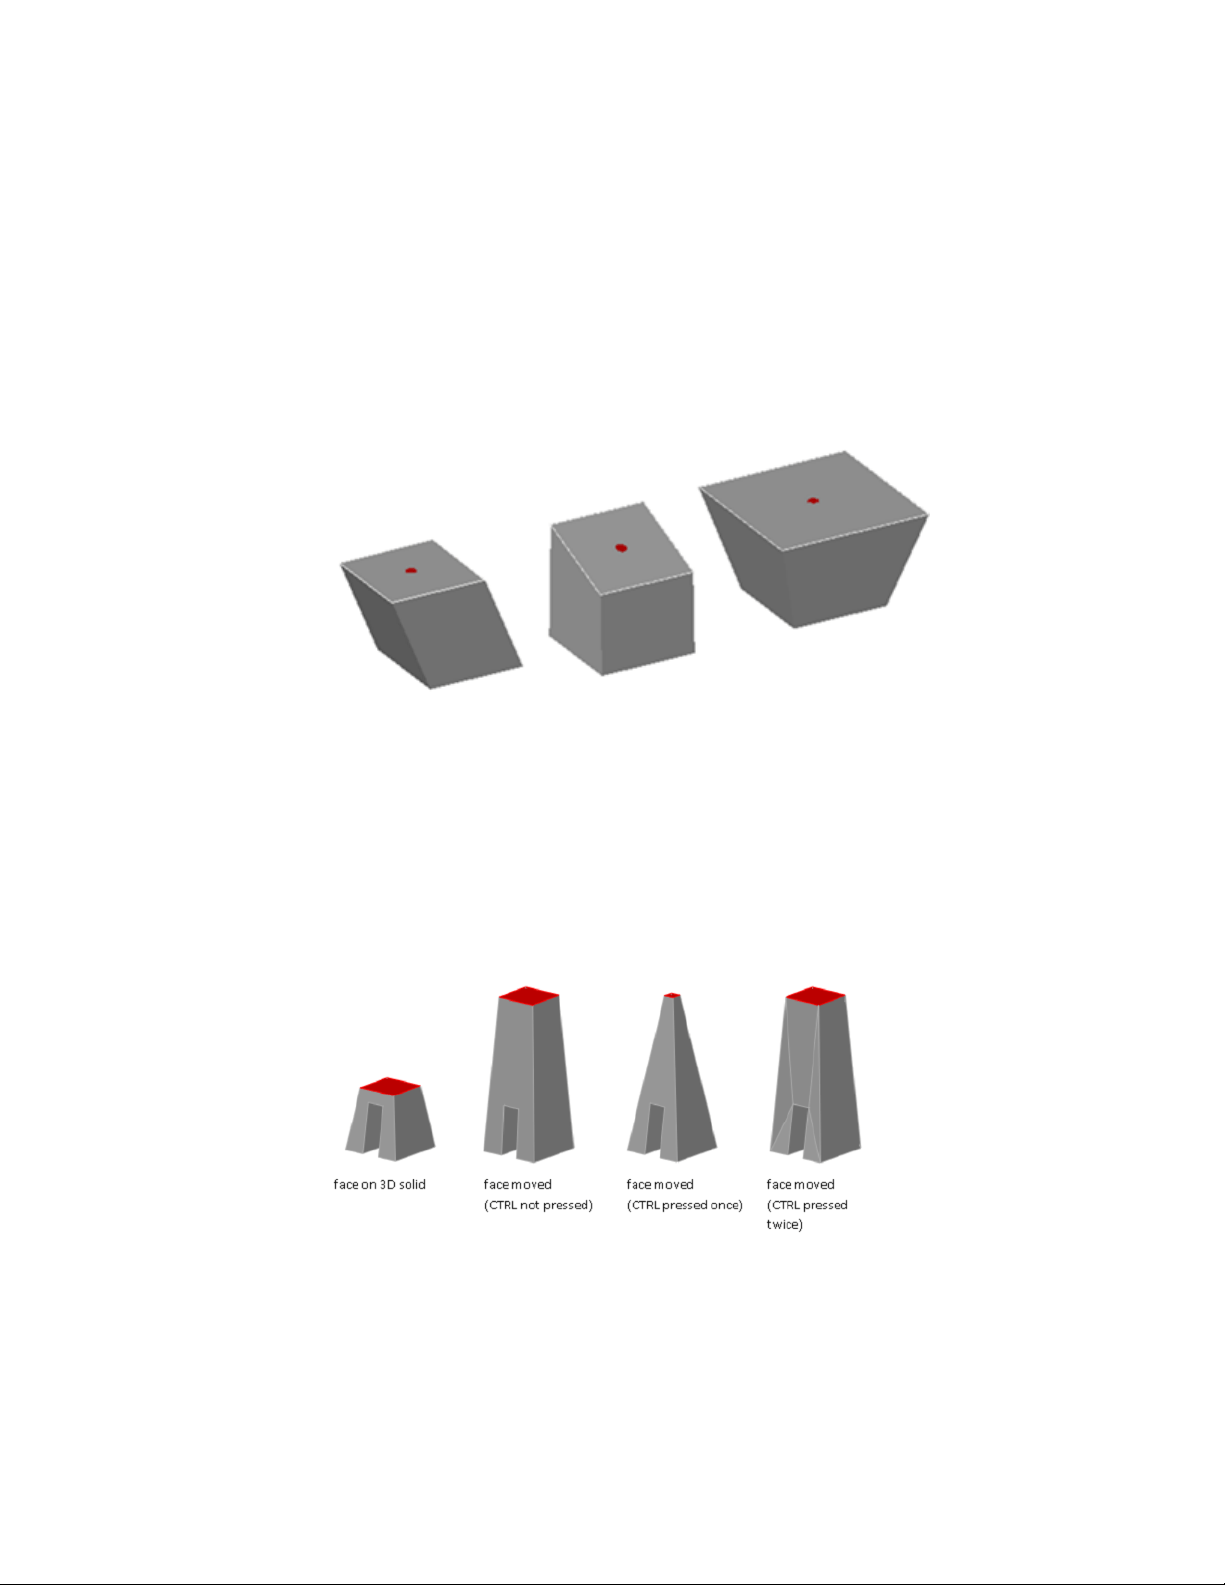
Move, Rotate, and Scale Faces on 3D Solids and Sur-
faces
You can select and modify faces of 3D solids and surfaces.
Modify the location, rotation, and size of faces on a 3D solids and surfaces.
cube with top face moved, rotated, and scaled
Use the MOVE, ROTATE, and SCALE commands to modify faces just as you
would with any other object. Press and hold Ctrl while you select a face on a
solid.
If you move, rotate, or scale a face on a 3D solid primitive, the solid primitive’ s
history is removed. The solid is no longer a true primitive and cannot be
manipulated using grips or the Properties Inspector.
Face Modification Options
As you drag a face, press Ctrl to cycle through modification options.
426 | Chapter 8 Work with 3D Models
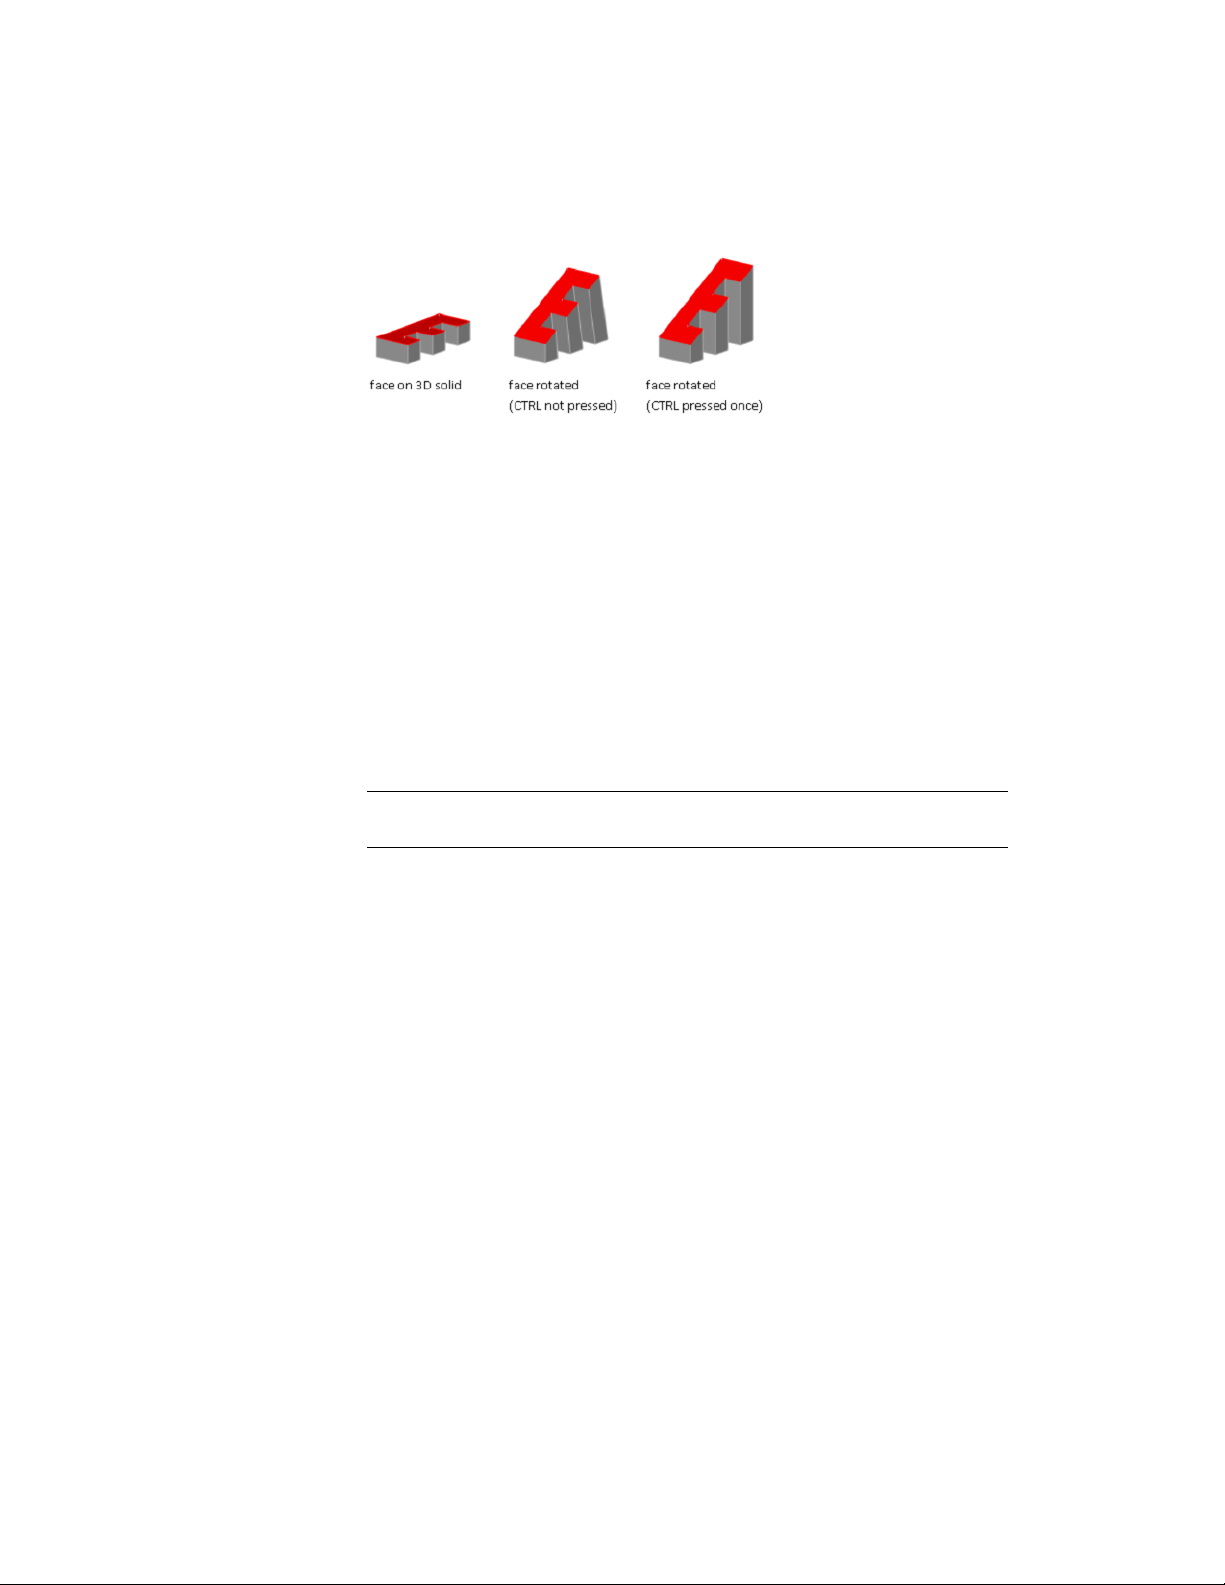
■ Extend Adjacent Faces. When you move or rotate a face without
pressing Ctrl, the shape and size of the face is maintained. However, the
planes of adjacent faces might change.
■ Move Face. When you move a face and press and release Ctrl once while
dragging, the position of the face is modified within the boundary, or
footprint, of the adjacent faces.
■ Allow Triangulation. When you move or rotate a face and press and
release Ctrl twice while dragging, the size and shape of the face is
maintained. (This behavior is the same as if you had not pressed Ctrl).
However, the adjacent planar faces are triangulated (divided into two or
more planar triangular faces), if necessary.
If you press and release Ctrl a third time, the modification returns to the first
option, as if you had not pressed Ctrl.
TIP Rather than pressing Ctrl to cycle through face modification options, hover
over a face grip to display the grip multi-functional menu.
Copy, Delete, and Color Faces on 3D Solids
Copy, remove, or change the color of faces on 3D solid objects.
Copy a Face
You can duplicate the face of a 3D solid object using the copy option of the
SOLIDEDIT command. The selected faces are copied as regions or bodies.
Modify 3D Models | 427
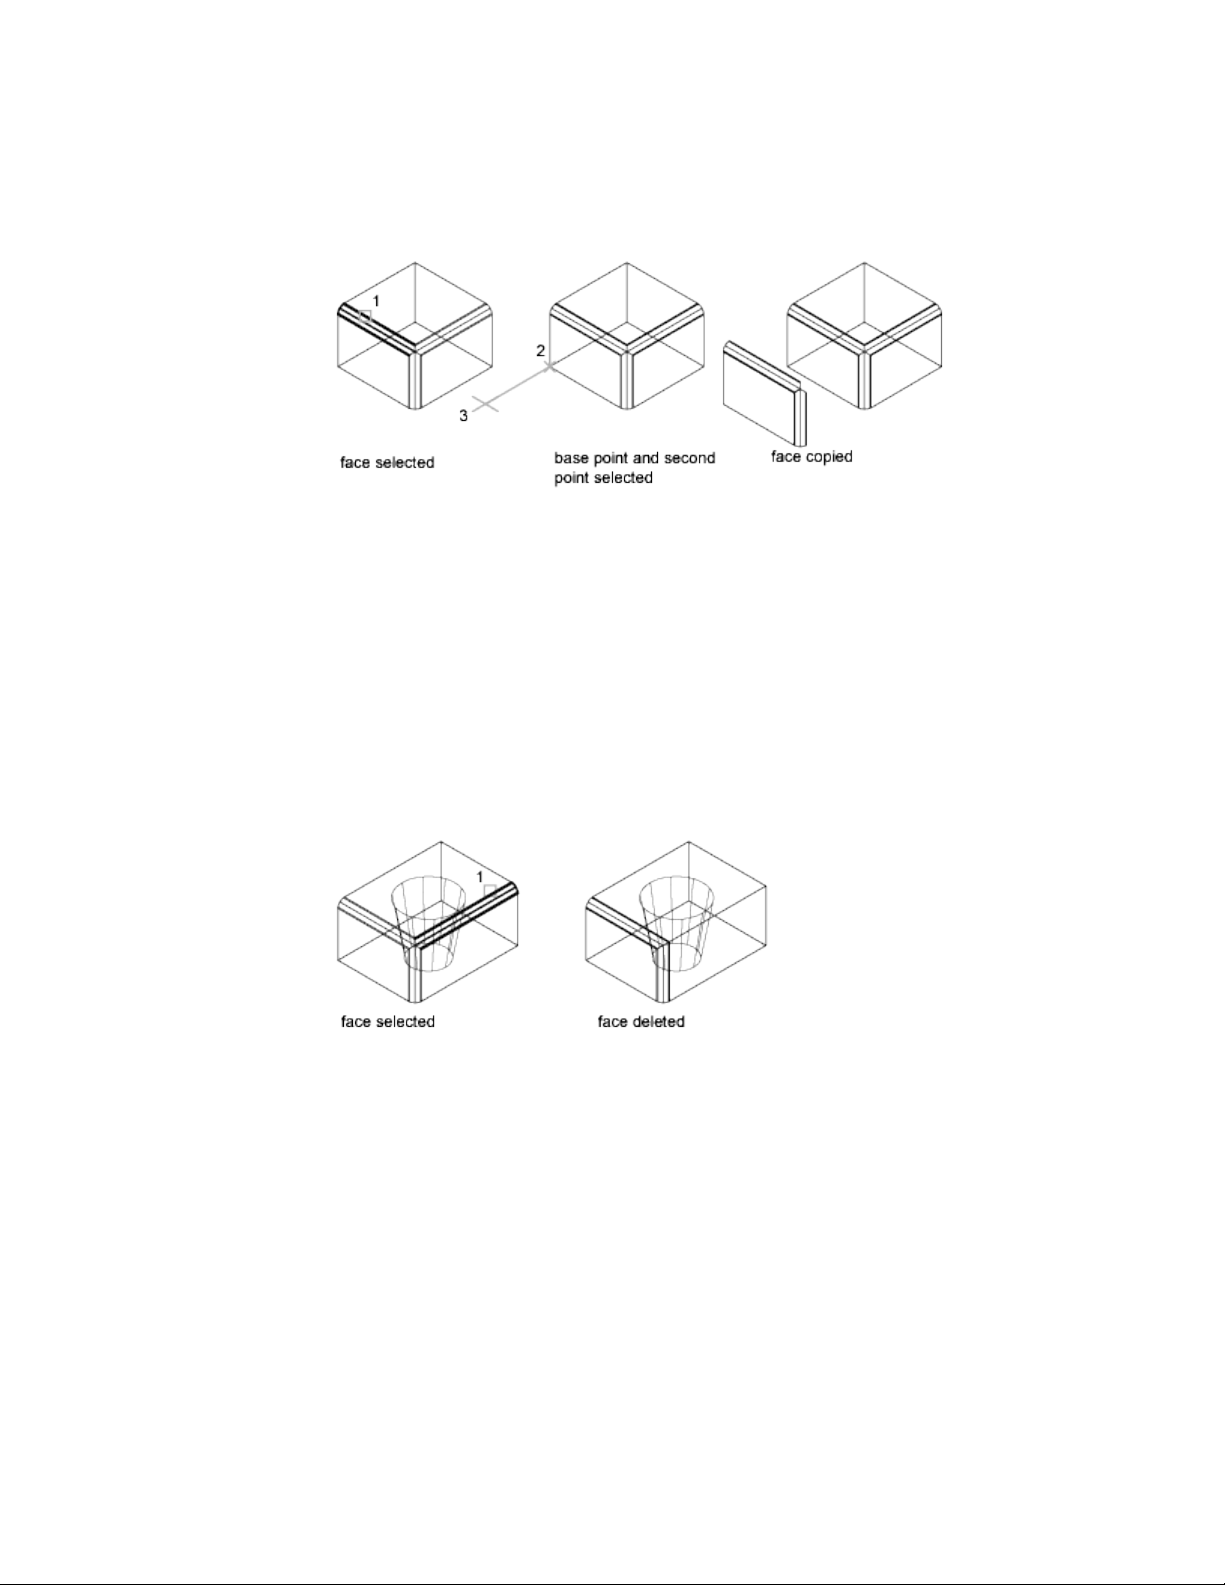
Delete a Face
If you specify two points, the first point is used as a base point and a single
copy is placed relative to the base point. If you specify a single point and press
Enter, the original selection point is used as a base point. The next point is
the point of displacement.
If a face is surrounded by coplanar faces, you can delete it using the following
methods:
■ Select the face and press Delete.
■ Select the face and enter erase.
■ Use the Delete option of the SOLIDEDIT command.
Color a Faces
You can modify the color of a face on a 3D solid by selecting the face and
then changing the Color property in the Properties Inspector.
See also:
Modify Mesh Faces (page 463)
428 | Chapter 8 Work with 3D Models
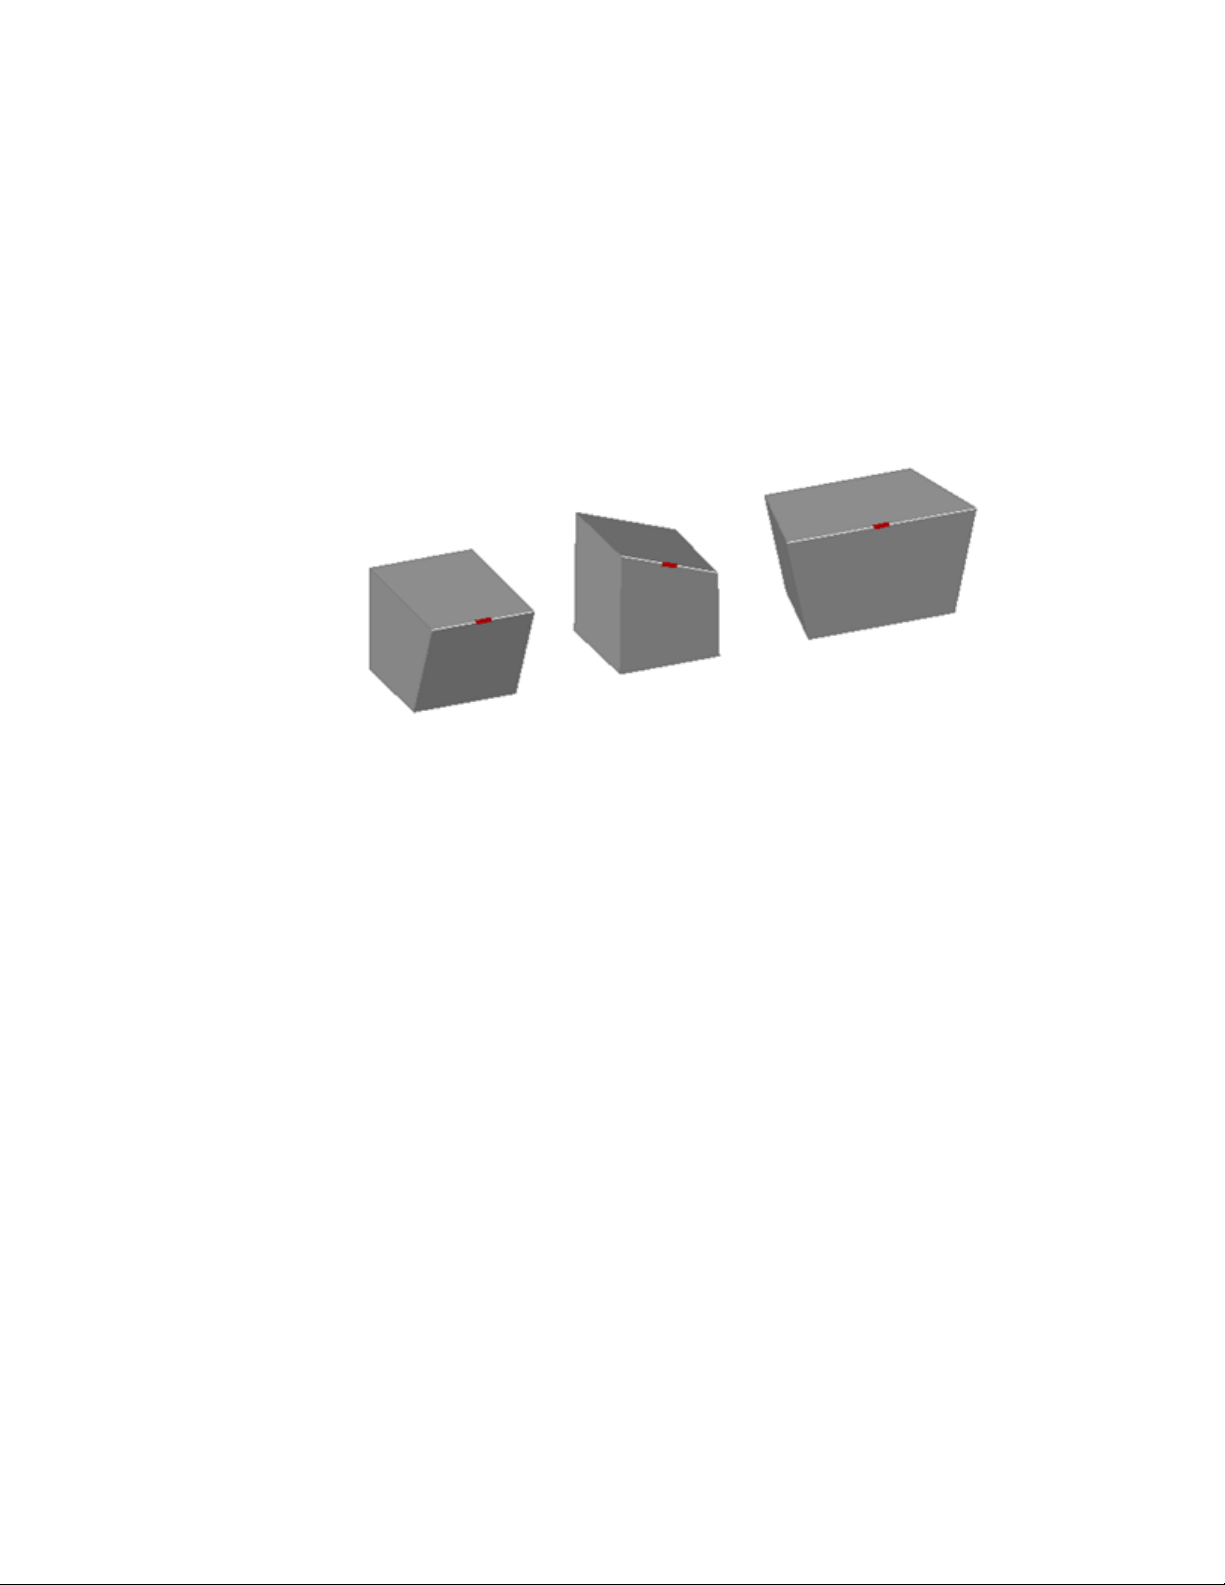
Modify Edges on 3D Objects
You can select and modify edges on a 3D solid or surface.
Move, Rotate, and Scale Edges
Move, rotate, and scale the edges on 3D solids and surfaces using grips, gizmos,
and commands.
cubes with edges moved, rotated, and scaled
You can use MOVE, ROTATE, and SCALE to modify edges on 3D solids and
surfaces just as you can for any other object. Press and hold Ctrl to select the
edge.
If you move, rotate, or scale an edge on a 3D solid primitive, the history of
the solid primitive is removed. The solid is no longer a true primitive and
cannot be manipulated using grips and the Properties Inspector.
Edges on regions can be selected, but do not display grips. These edges can
also be moved, rotated, and scaled.
Edge Modification Options
As you drag an edge, press Ctrl to cycle through modification options.
Modify 3D Models | 429
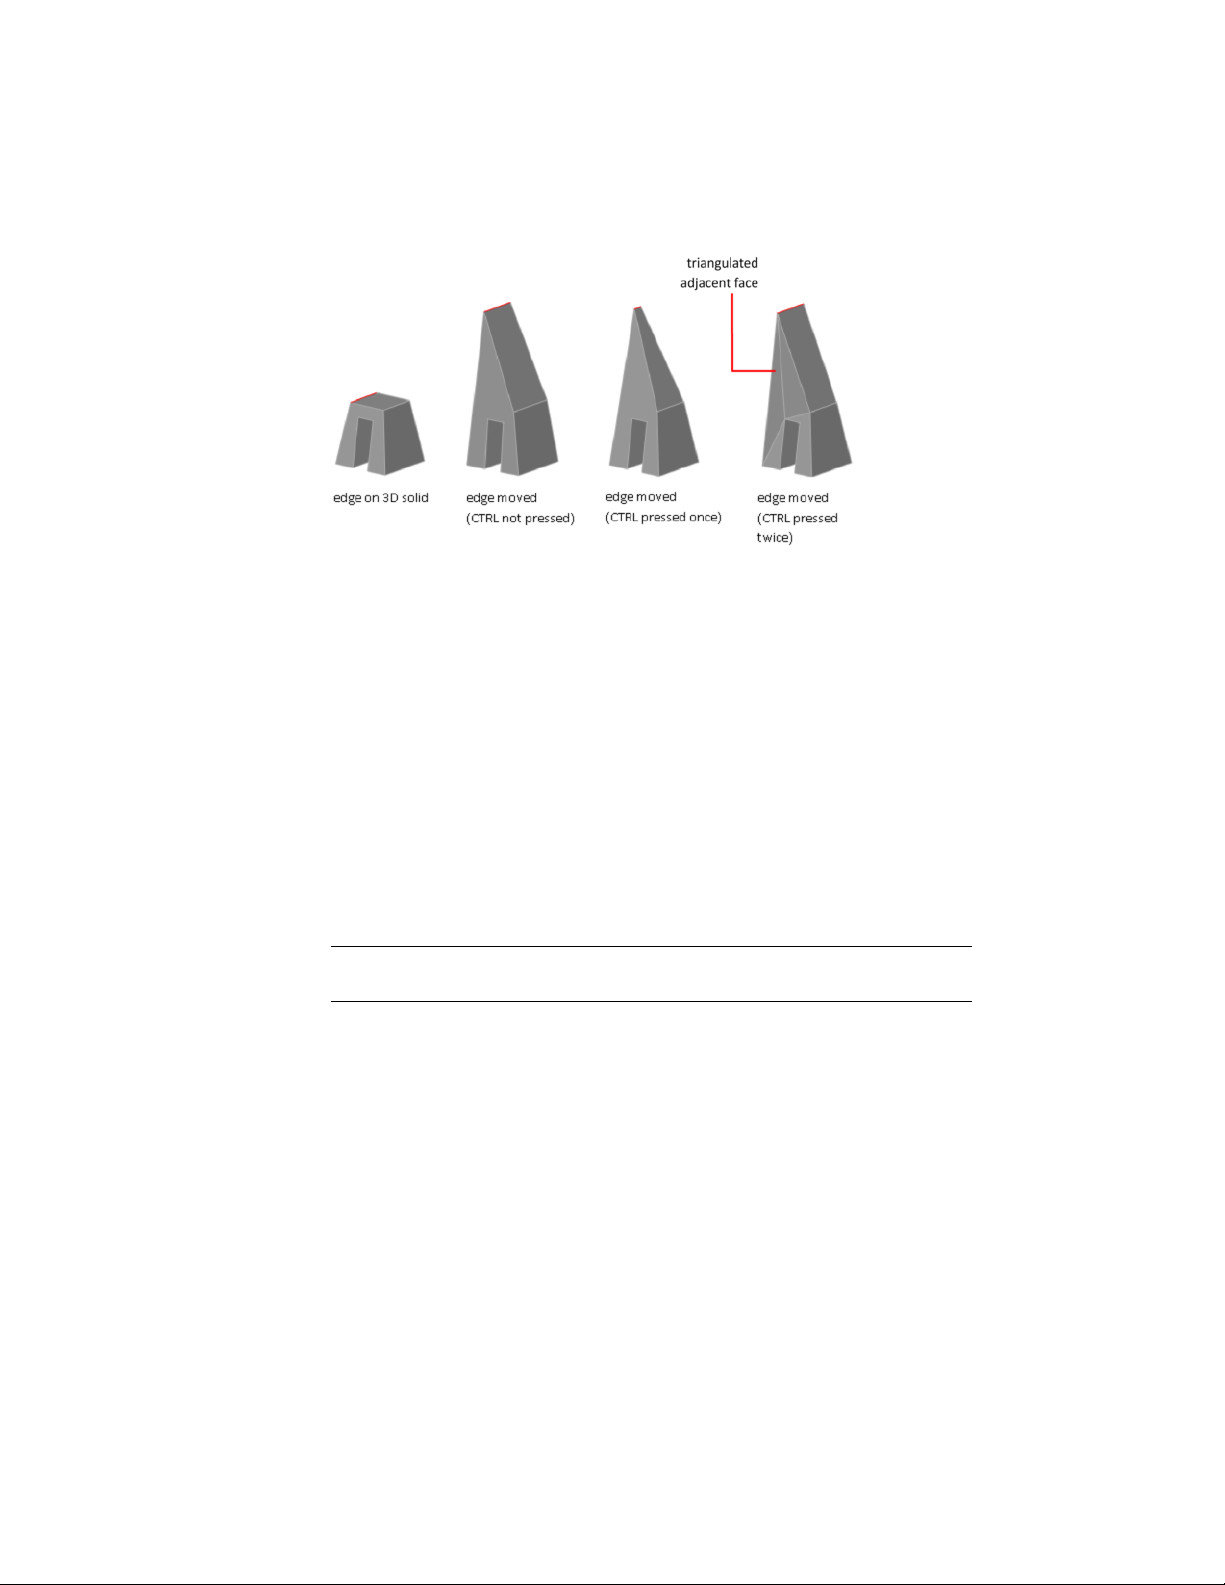
■ Extend Adjacent Faces. When you move, rotate, or scale an edge without
pressing Ctrl, the shared length of the edge and its vertices is maintained.
However, the planes of the adjacent faces adjacent might be changed.
■ Move Edge. When you move, rotate, or scale an edge and press and release
Ctrl once while dragging, the edge is modified without its vertices. The
surfaces of the adjacent faces are maintained, but the length of the modified
edge might change.
■ Allow Triangulation. When you move, rotate, or scale an edge and
press and release Ctrl twice while dragging, the edge and its vertices are
modified. (This behavior is the same as if you had not pressed Ctrl).
However, if the adjacent faces are no longer planar, they are triangulated
(divided into two or more planar triangular faces).
If you press and release Ctrl a third time, the modification returns to the first
option, as if you had not pressed Ctrl.
TIP Rather than pressing Ctrl to cycle through edge modification options, hover
over an edge grip to display the grip multi-functional menu.
Delete Edges
You can also delete edges that completely divide two coplanar faces using one
of the following methods:
■ Select the edge and press Delete.
■ Select the edge and enter the ERASE command.
430 | Chapter 8 Work with 3D Models
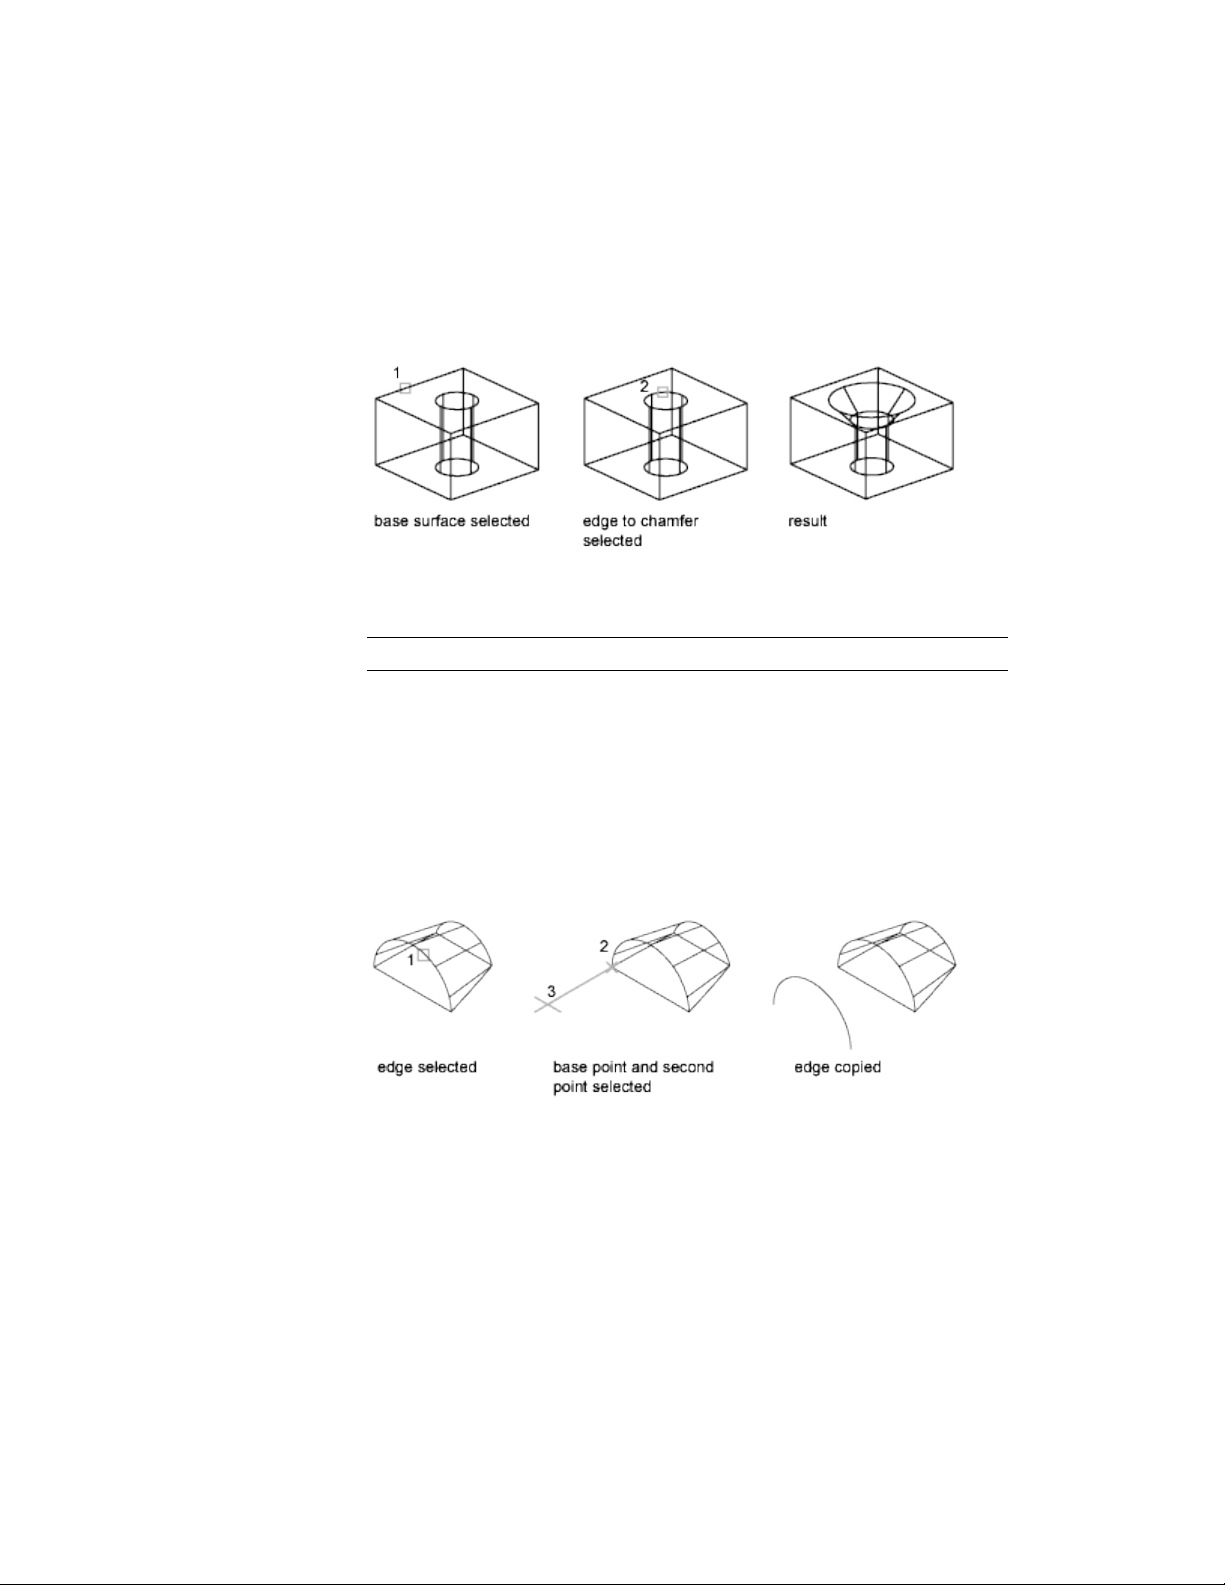
Fillet and Chamfer 3D Solids
Round, fillet, or bevel the edges of 3D solids using FILLETEDGE and
CHAMFEREDGE.
Use the fillet and chamfer grips to modify the fillet radius or the chamfer
distance. The default fillet radius is set by the FILLETRAD3D system variable.
TIP Use the Chain option of FILLETEDGE to limit selection to tangent edges.
Color Edges
You can modify the color of an edge on a 3D object by selecting the edge and
changing the Color property in the Properties Inspector.
Copy Edges
You can copy individual edges on a 3D solid object. Edges are copied as lines,
arcs, circles, ellipses, or splines.
If you specify two points, the first point is used as a base point and a single
copy is placed relative to the base point. If you specify a single point, and then
press Enter, the original selection point is used as a base point. The next point
is used as a point of displacement.
Modify 3D Models | 431
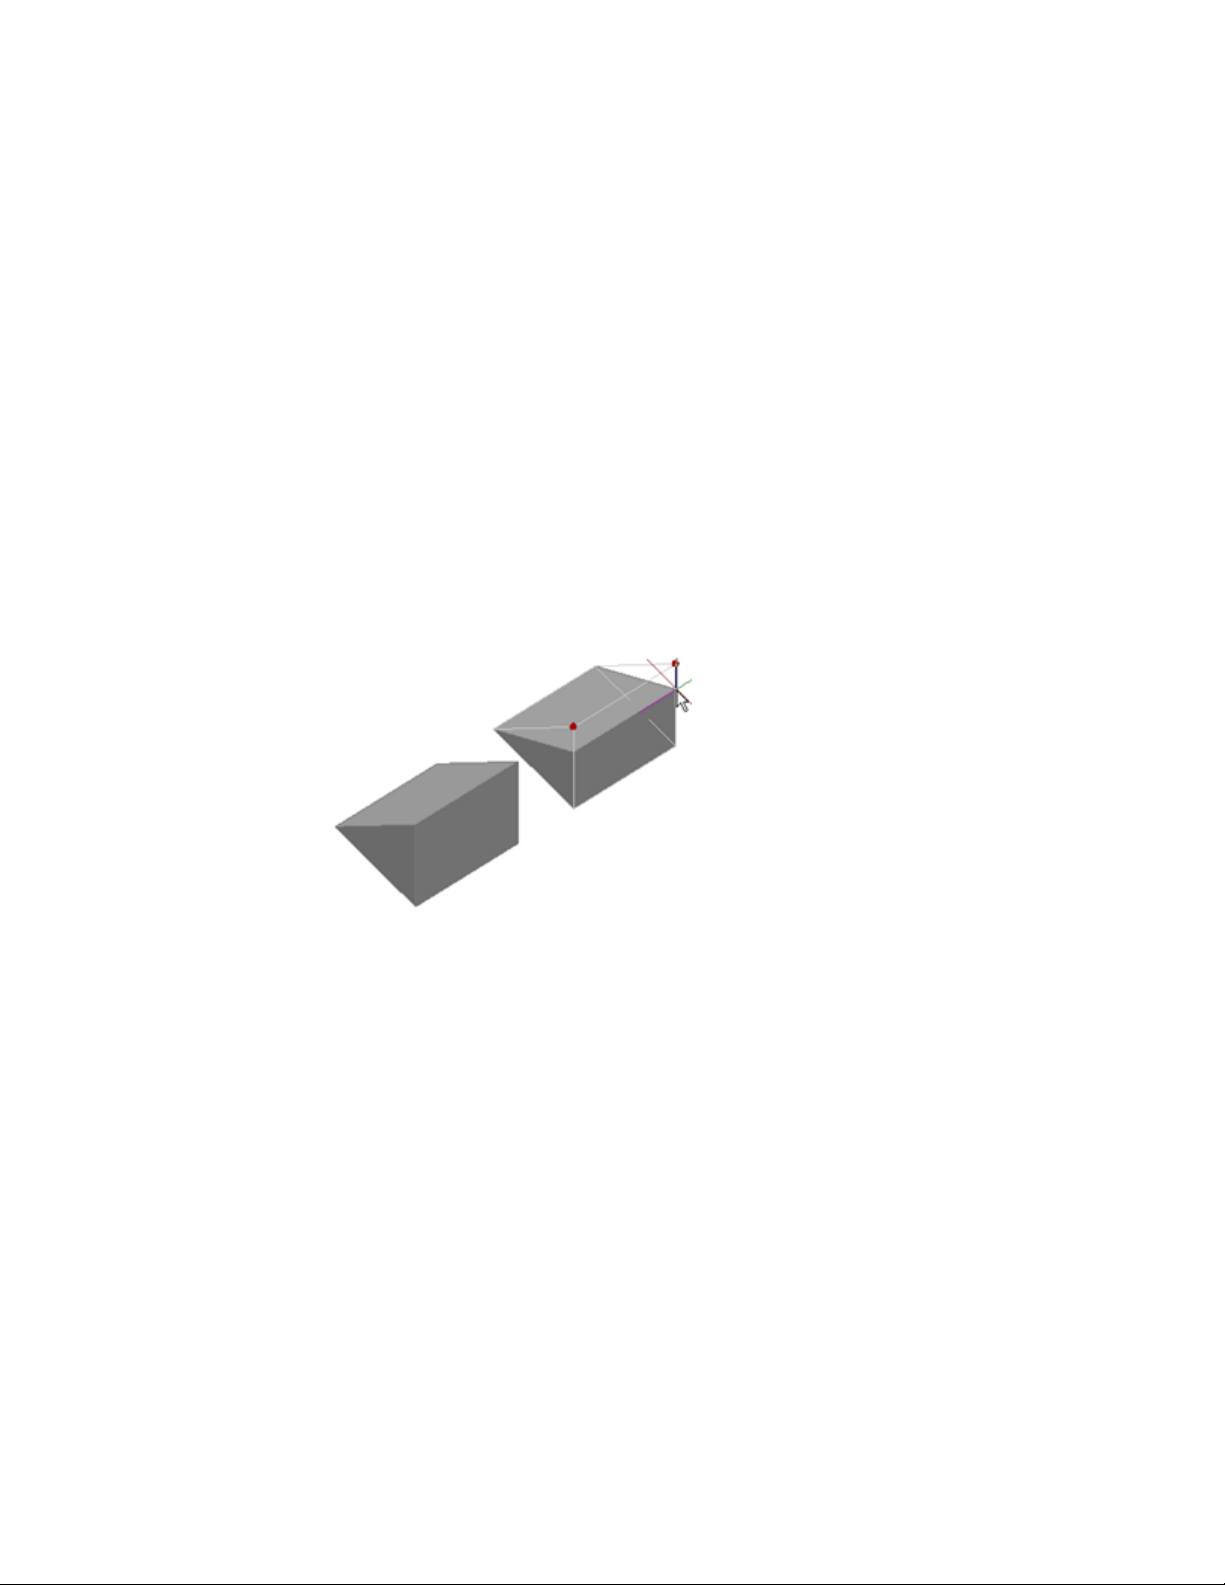
See also:
Move, Rotate, and Scale 3D Subobjects (page 423)
Use Gizmos to Modify Objects (page 410)
Modify Objects (page 232)
Move or Rotate Objects (page 238)
Resize or Reshape Objects (page 260)
Overview of Modifying Meshes (page 454)
Modify Vertices on 3D Objects
You can select and modify 3D object vertices.
Move, rotate, scale, or drag the vertices of 3D solids and surfaces.
wedge with two vertices moved
You can modify the form of a 3D solid or surface by modifying one or more
vertices. Use grips and gizmos, or run the MOVE, ROTATE, or SCALE command.
When you scale or rotate vertices, you must select two or more vertices to see
a change in the object. Clicking and dragging a vertex “stretches” the 3D
object.
If you move, rotate, or scale one or more vertices on a 3D solid primitive, the
solid primitive history is removed. The solid is no longer a true primitive and
cannot be modified using grips and Properties Inspector.
Vertex Modification Options
As you drag a vertex, press Ctrl to cycle through modification options.
432 | Chapter 8 Work with 3D Models
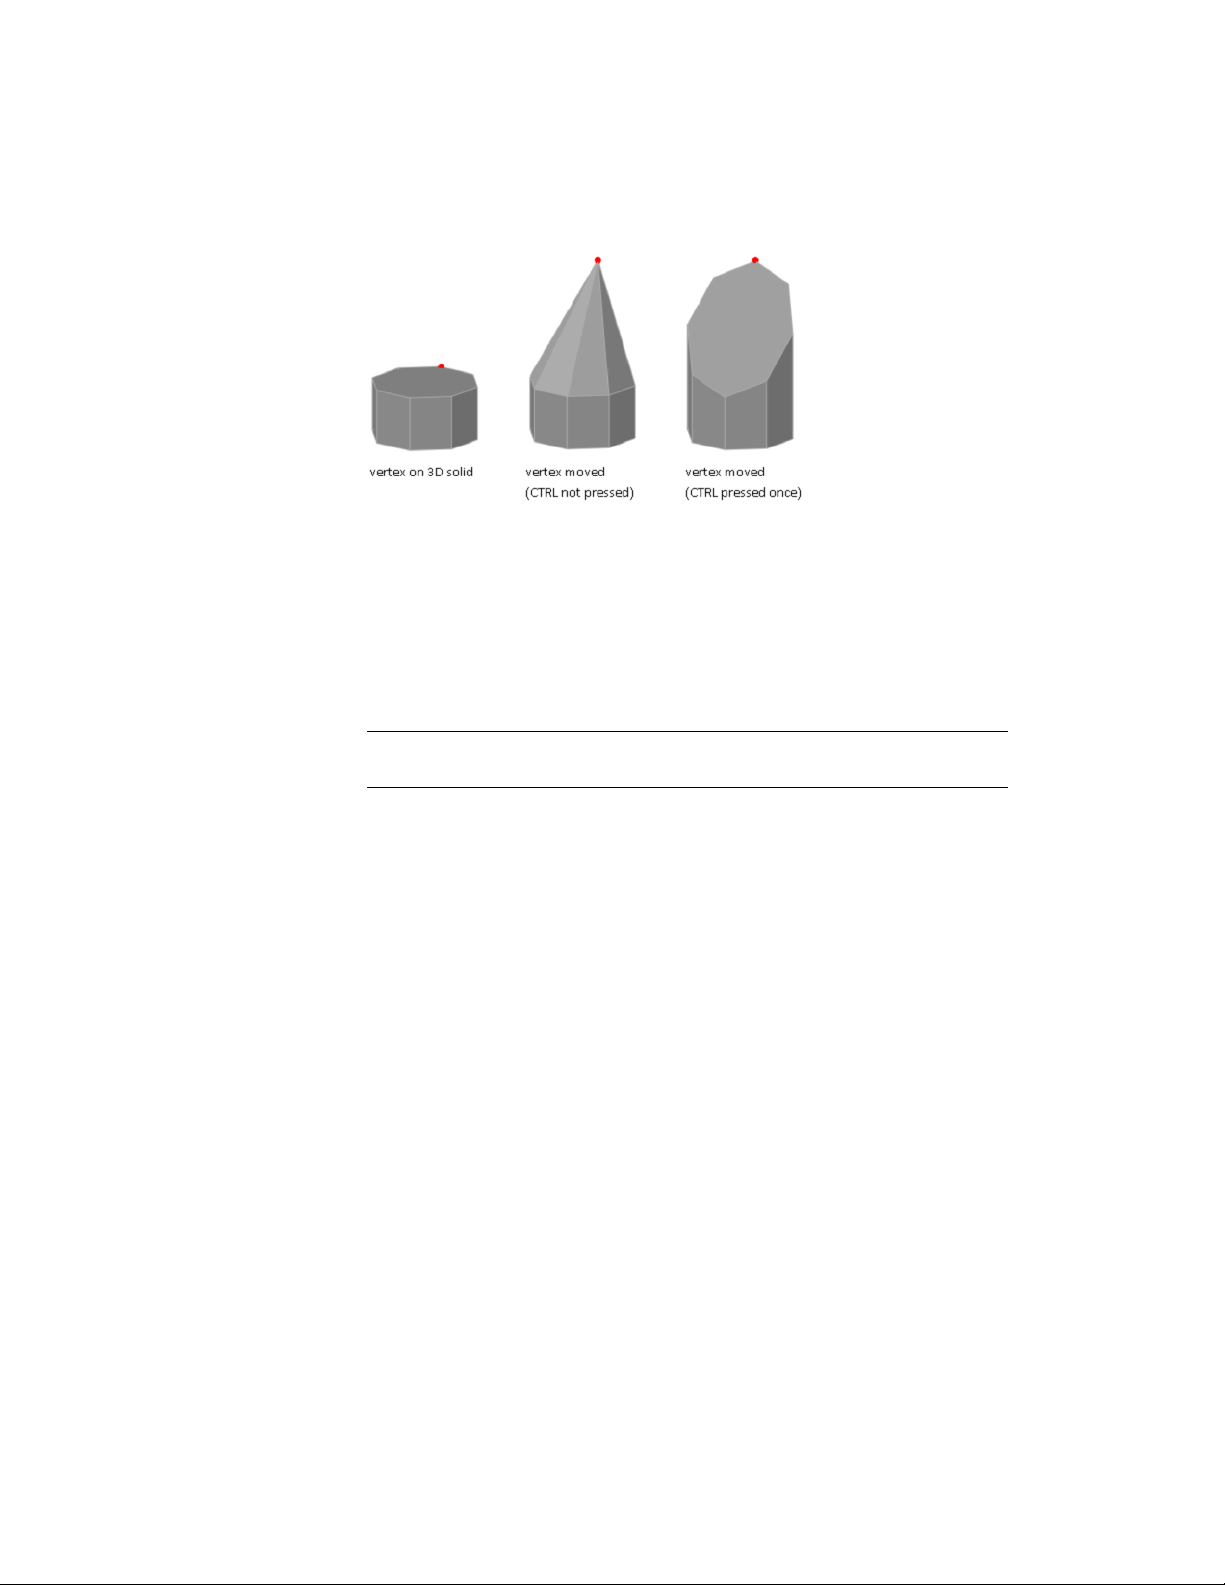
■ Move Vertex. When you move a vertex and press and release Ctrl once,
adjacent planar faces might be adjusted.
■ Allow Triangulation. When you move a vertex without pressing Ctrl,
some adjacent planar faces may be triangulated (divided into two or more
planar triangular faces).
If you press and release Ctrl a second time, the modification returns to the
first option, as if you had not pressed Ctrl.
TIP Rather than pressing Ctrl to cycle through vertex modification options, hover
over a vertex grip to display the grip multi-functional menu.
Delete a Vertex
You can delete a vertex that connects two parallel edges that are collinear and
do not intersect on any other edges.
See also:
Move, Rotate, and Scale 3D Subobjects (page 423)
Use Gizmos to Modify Objects (page 410)
Modify Objects (page 232)
Overview of Modifying Meshes (page 454)
Work with Complex 3D Solids and Surfaces
Modify composite solids that are created by a union, subtract, intersect, fillet,
or chamfer process.
Modify 3D Models | 433
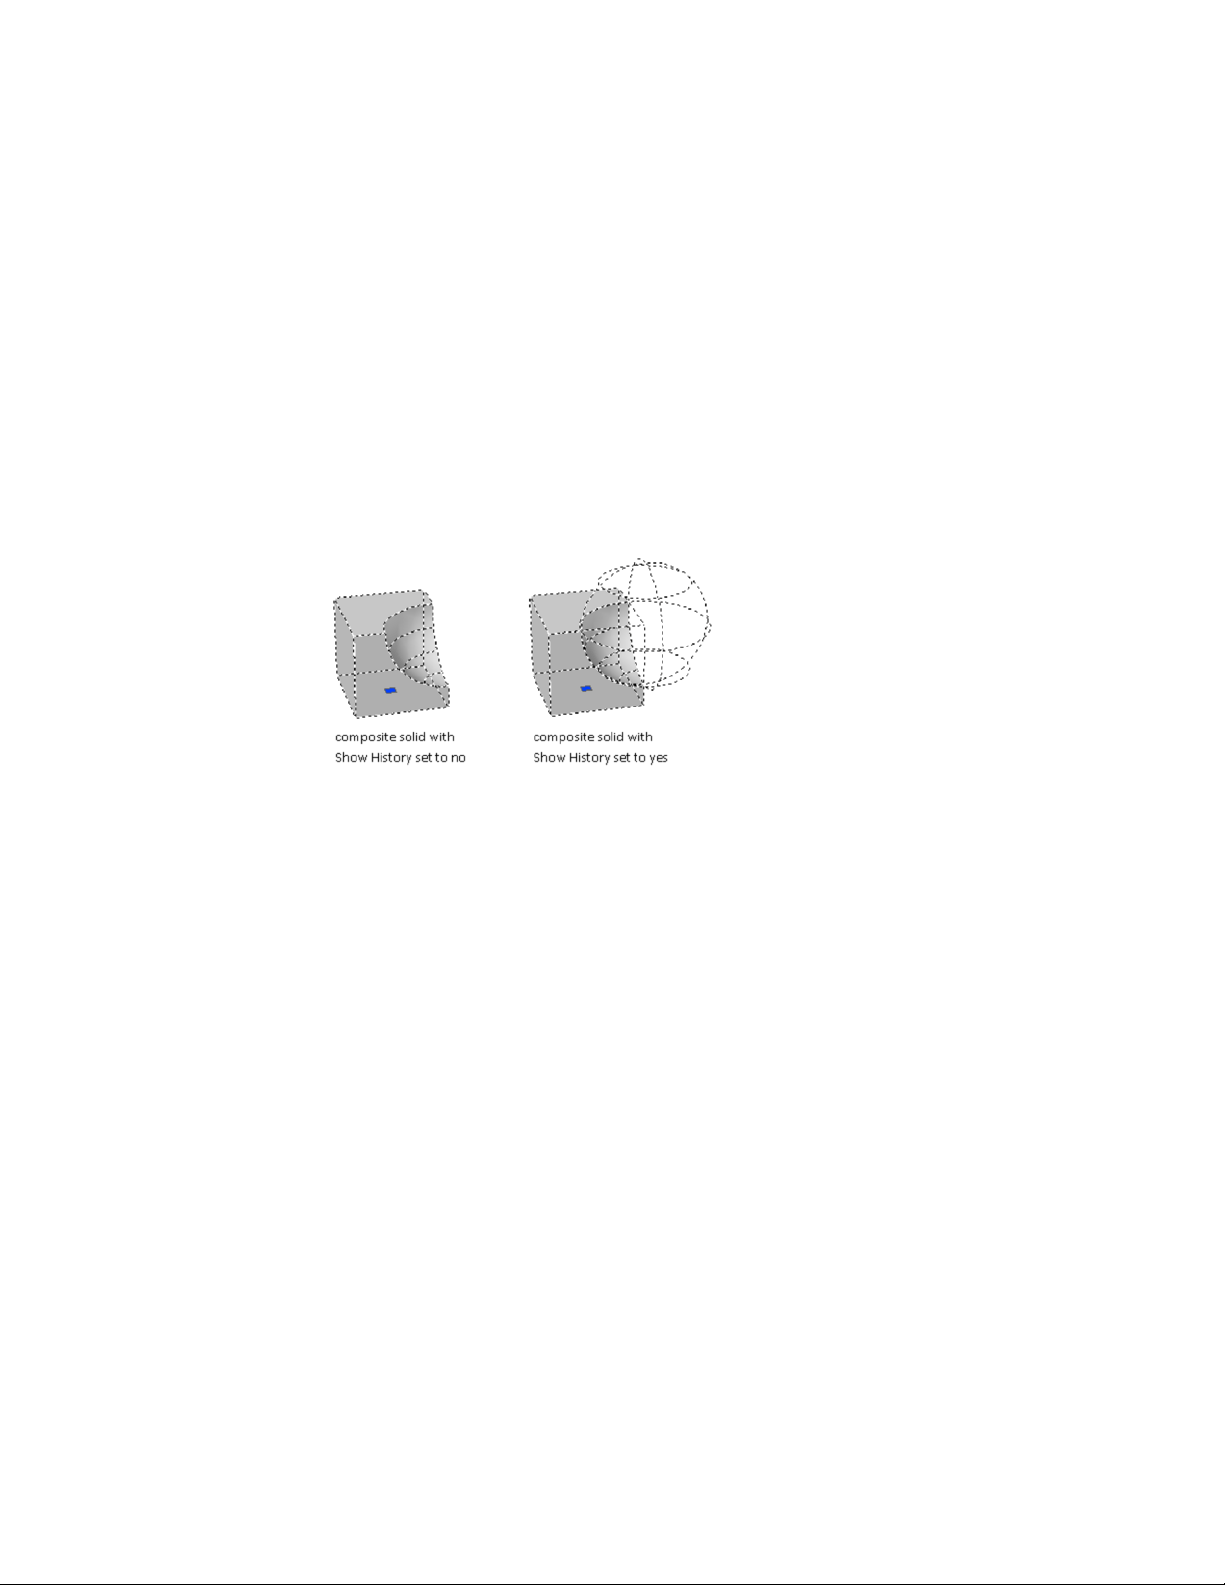
Display Original Forms of Composite Solids
By default, 3D composite objects retain a history that displays an editable
image of their original component forms.
Retain the History of the Composite Components
After you create a composite object, you can modify the shape of the new
object by modifying a highlighted wireframe image of its original components.
If the Show History property is Yes (On), wireframes of the original
forms—including forms that have been removed—are displayed in a dimmed
state. (The SHOWHIST system variable also controls this setting.)
To retain a history of the original parts of composite solids, the History
property must be set to Record (On) in the Properties Inspector when the
composite operation occurs. You can also use the SOLIDHIST system variable
to set this property.
Display and Remove the History to Modify the Composite
When you modify the composite object, you can display the history. Then
use the grips on the history subobject to modify the object. For more
information about using grips with composite solids, see Modify Composite
Solids and Surfaces (page 435).
You can remove the history of a selected composite object by changing its
History setting to None, or by entering the BREP command. After a history
has been removed, you can no longer select and modify the original, removed,
components of the solid. You can restart history retention for the solid by
changing its History setting back to Record.
434 | Chapter 8 Work with 3D Models
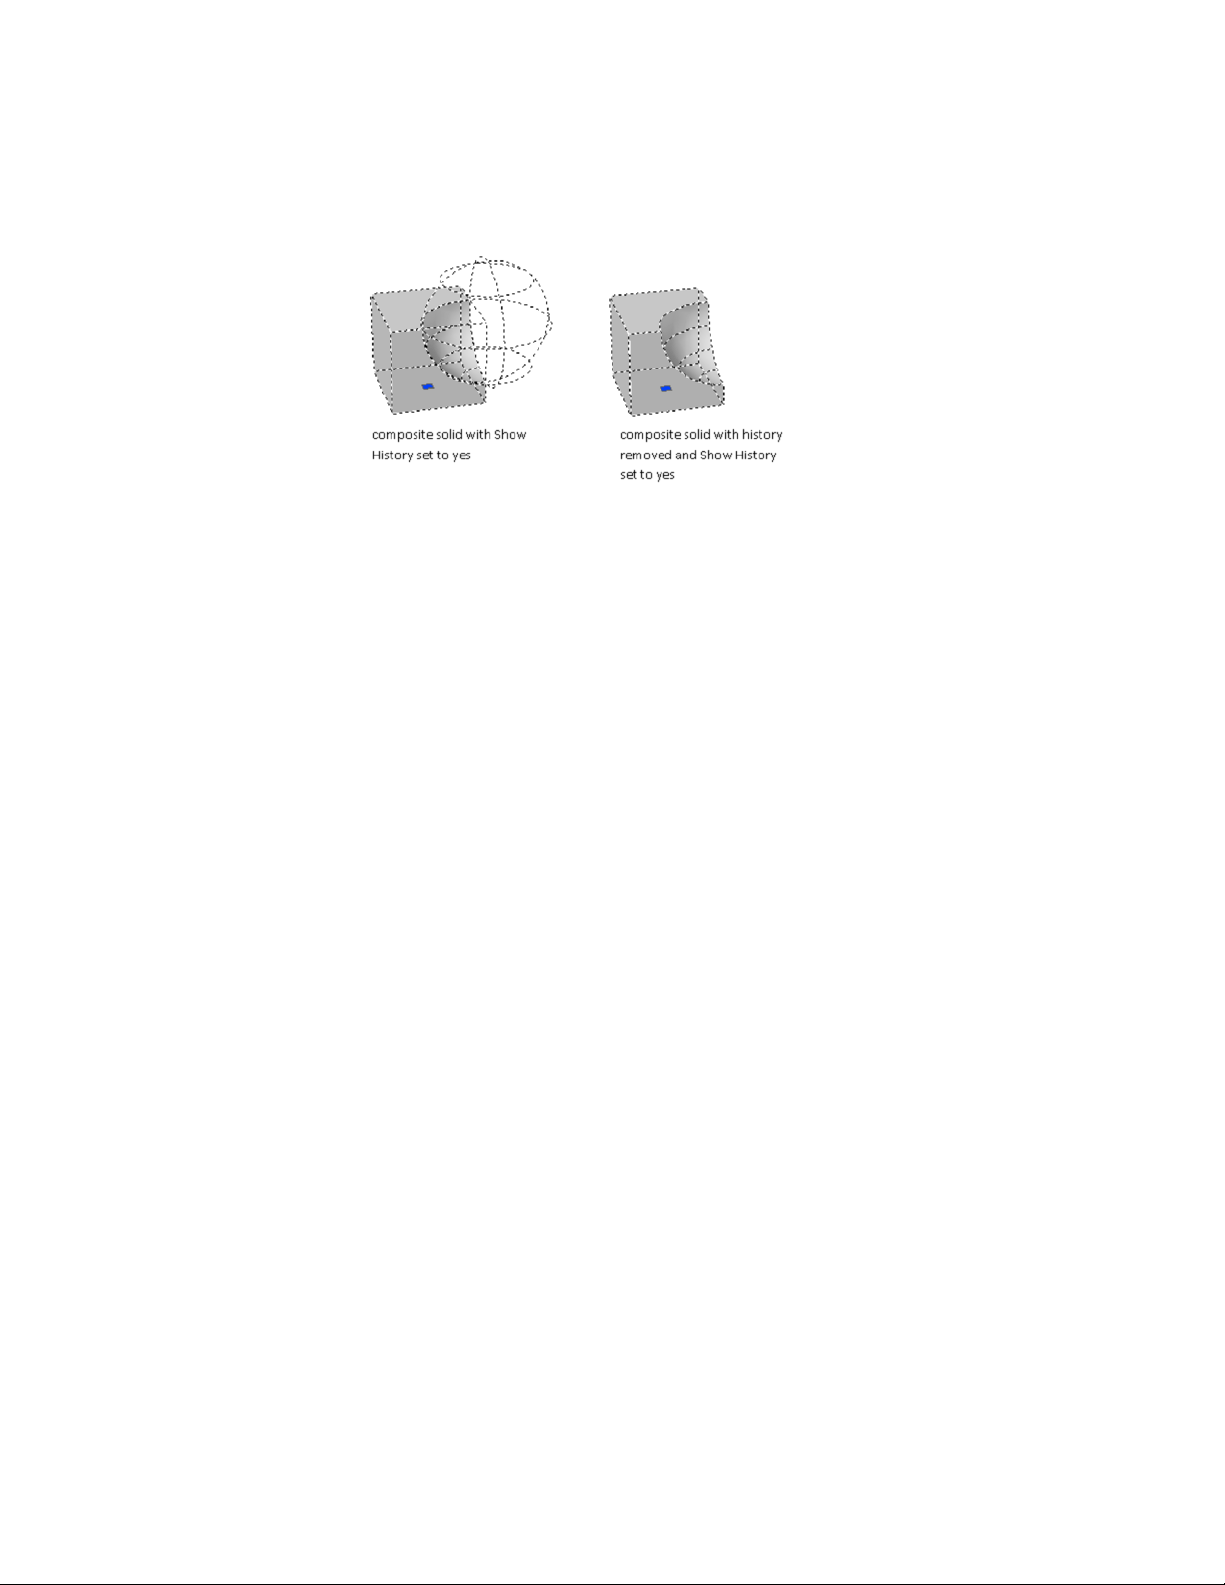
Removing a composite history is useful when you work with complex
composite solids. After you create the initial complex form, set History to
None (Off) to remove the history. Then reset the value to Record (On). With
this process, you can create a complex composite object, and then reset it to
serve as a base form for additional composite operations.
See also:
Modify Composite Solids and Surfaces (page 435)
Modify Composite Solids and Surfaces
Modify the entire form of a composite 3D object or the original forms that
make up the composite.
You can move, scale, or rotate a selected composite object using grips or
gizmos.
Modify Original Components of Composites
When the History property is set to Record (On), press the Ctrl key to display
any original forms that were removed during a union, subtract, or intersect
operation. If the original, removed form was a solid primitive, you can drag
the displayed grips to change its shape and size. As a result, the composite
object is modified.
Modify 3D Models | 435
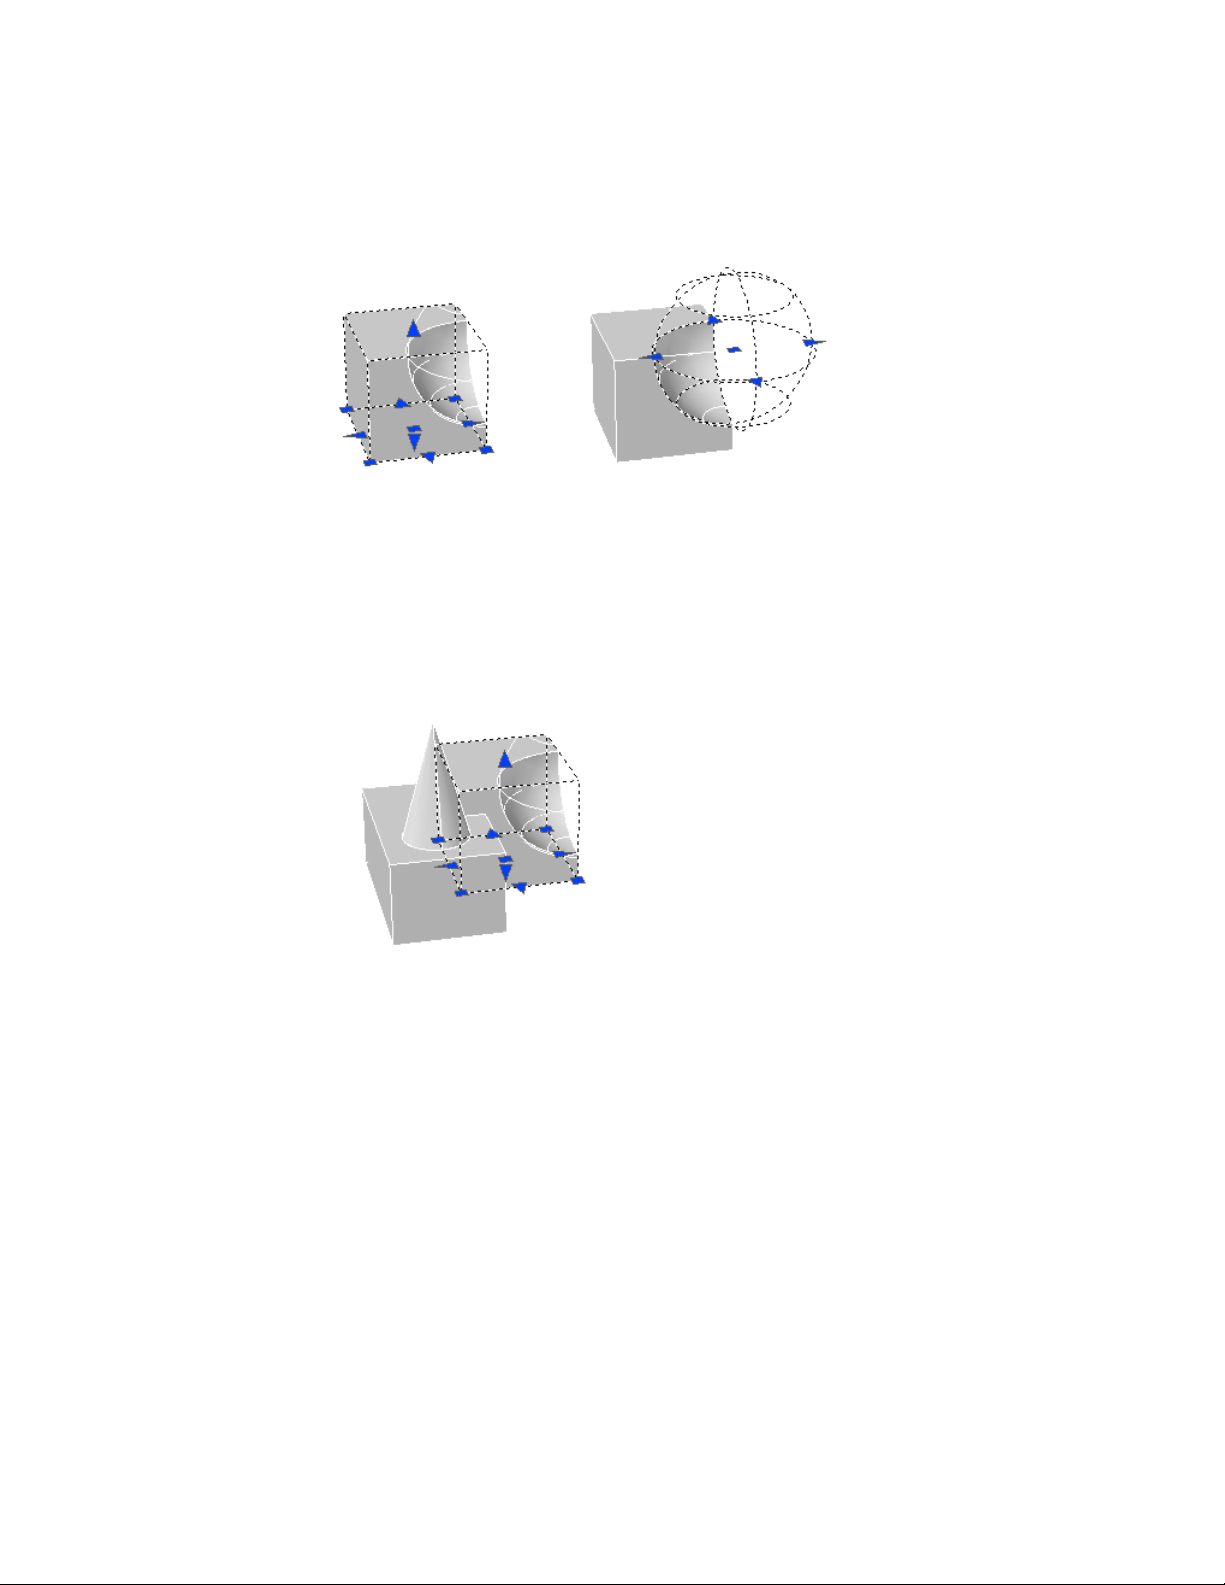
If the selected individual form does not contain its history, you can move,
rotate, scale, or delete the form.
Modify Complex Composites
A composite object might be made up of other composite objects. You can
select the history images of composite objects by holding down the Ctrl key
as you click the forms. (For best results, set the subobject selection filter to
Solid History.)
You can also change the size and shape of composite objects by clicking and
dragging grips on individual faces, edges, and vertices. For more information,
see Modify 3D Subobjects (page 423).
Separate Discrete Objects Combined with a Union
If you have combined discrete 3D solids or surfaces using a union operation,
you can separate them into their original components. (Use the Separate
option of the SOLIDEDIT command.) Composite objects cannot overlap or
share a common area or volume to be separated.
436 | Chapter 8 Work with 3D Models
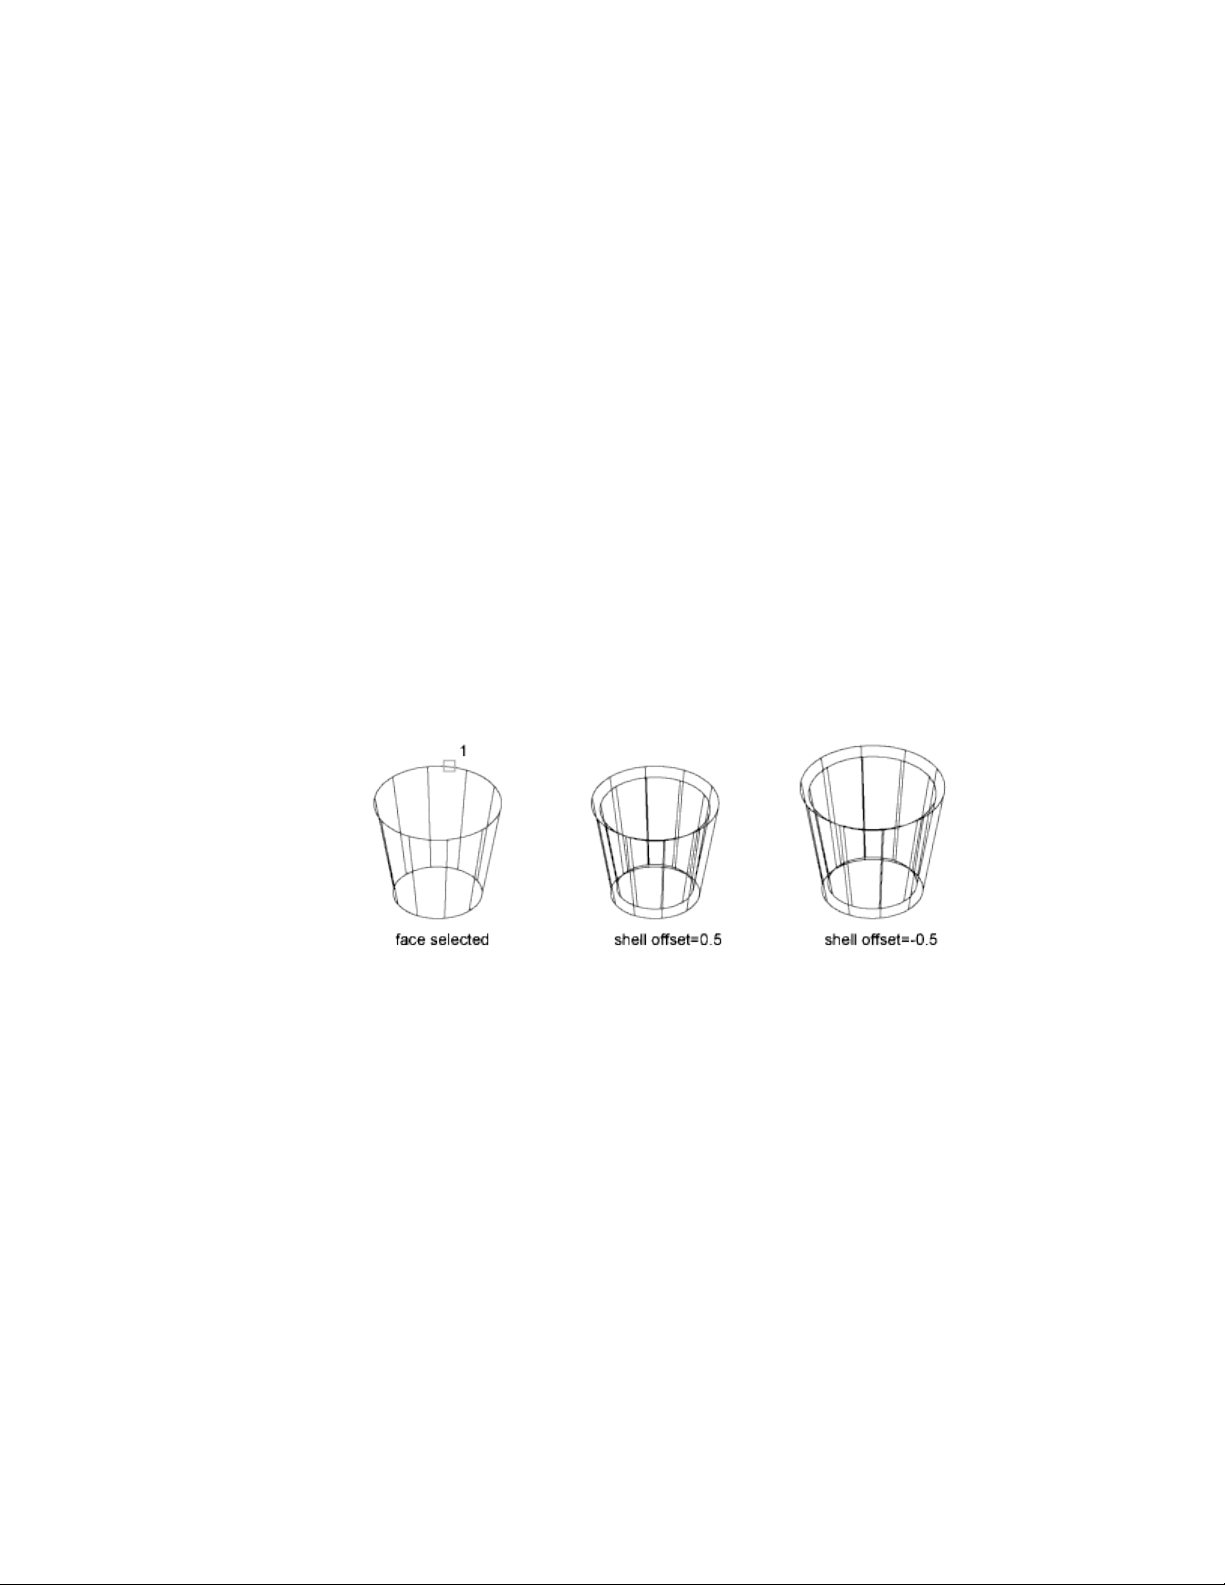
After separation, the individual solids retain their original layers and colors.
All nested 3D solid objects are restored to their simplest forms.
See also:
Modify Objects Using Grips (page 233)
Overview of Modifying Meshes (page 454)
Shell and Remove Redundancies in 3D Objects
Convert 3D solids to shells and remove redundant lines and edges.
Shell 3D Solids
Convert a 3D solid to a hollow wall, or shell.
When you can convert a solid object to a shell, new faces are created by
offsetting existing faces inside or outside their original positions.
Continuously tangent faces are treated as a single face when they are offset.
Clean and Check 3D Solids
Remove redundant faces, edges, and vertices from a 3D solid, and verify
whether the 3D solid is valid.
You can remove redundant edges or vertices that share the same surface or
vertex definition. This operation merges adjacent faces and deletes all
redundant edges, including imprinted and unused edges.
Modify 3D Models | 437
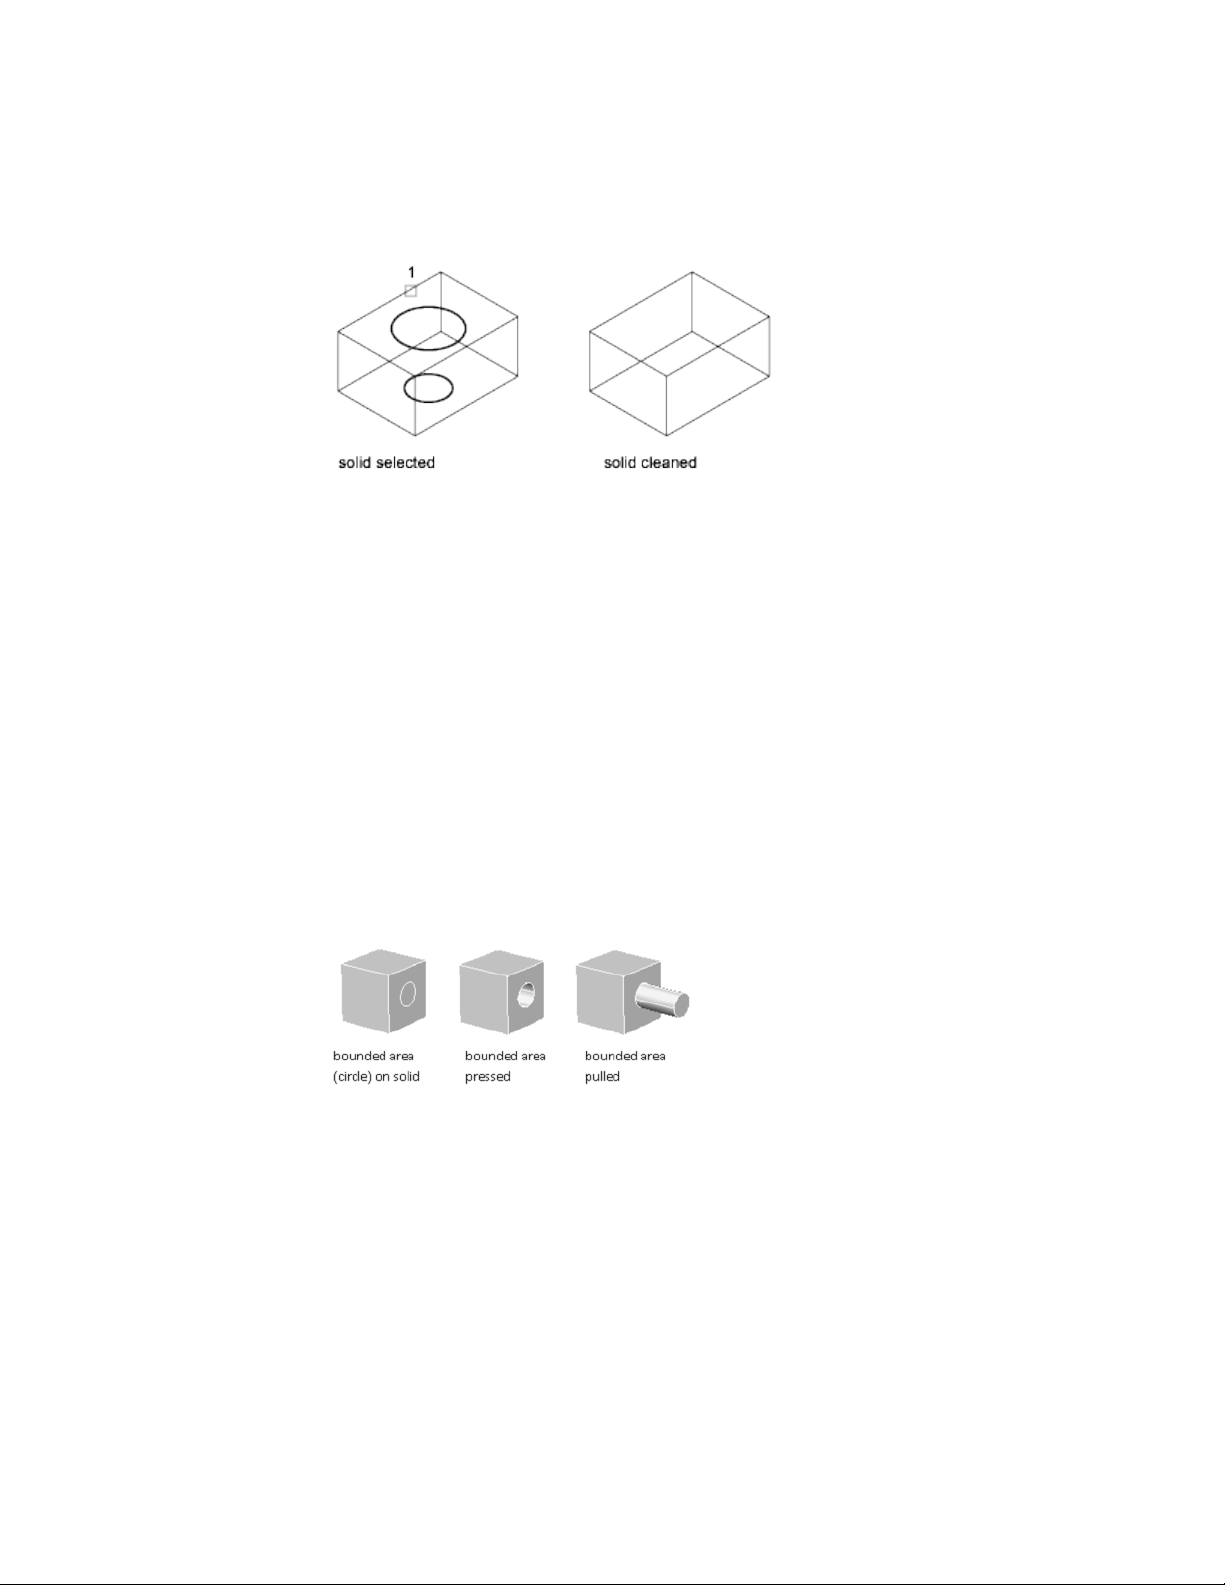
True 3D solid objects have properties, volume, and mass, that are not shared
by objects created with thickness or closed surfaces. You can check whether
an object is a valid 3D solid by verifying whether it is listed as “3D Solid” on
the Properties Inspector. You can also use SOLIDEDIT to verify whether a solid
object is a valid 3D solid object.
Pressing or Pulling Areas and Faces
Get visual feedback as you extrude objects and offset 3D solid faces.
The program responds differently, depending on the type of object you select
to press or pull.
Press and Pull to Create Holes and Solid Extrusions
Press in or pull out bounded, or closed, areas or objects to create holes and
3D solid extrusions. You can select within a closed object, an area, or a face
that is imprinted on a solid object.
In combination with imprinted faces, you can form complex shapes using
press or pull operations to create extrusions and notches. The following object
was formed using press and pull operations on an imprinted pyramid.
438 | Chapter 8 Work with 3D Models
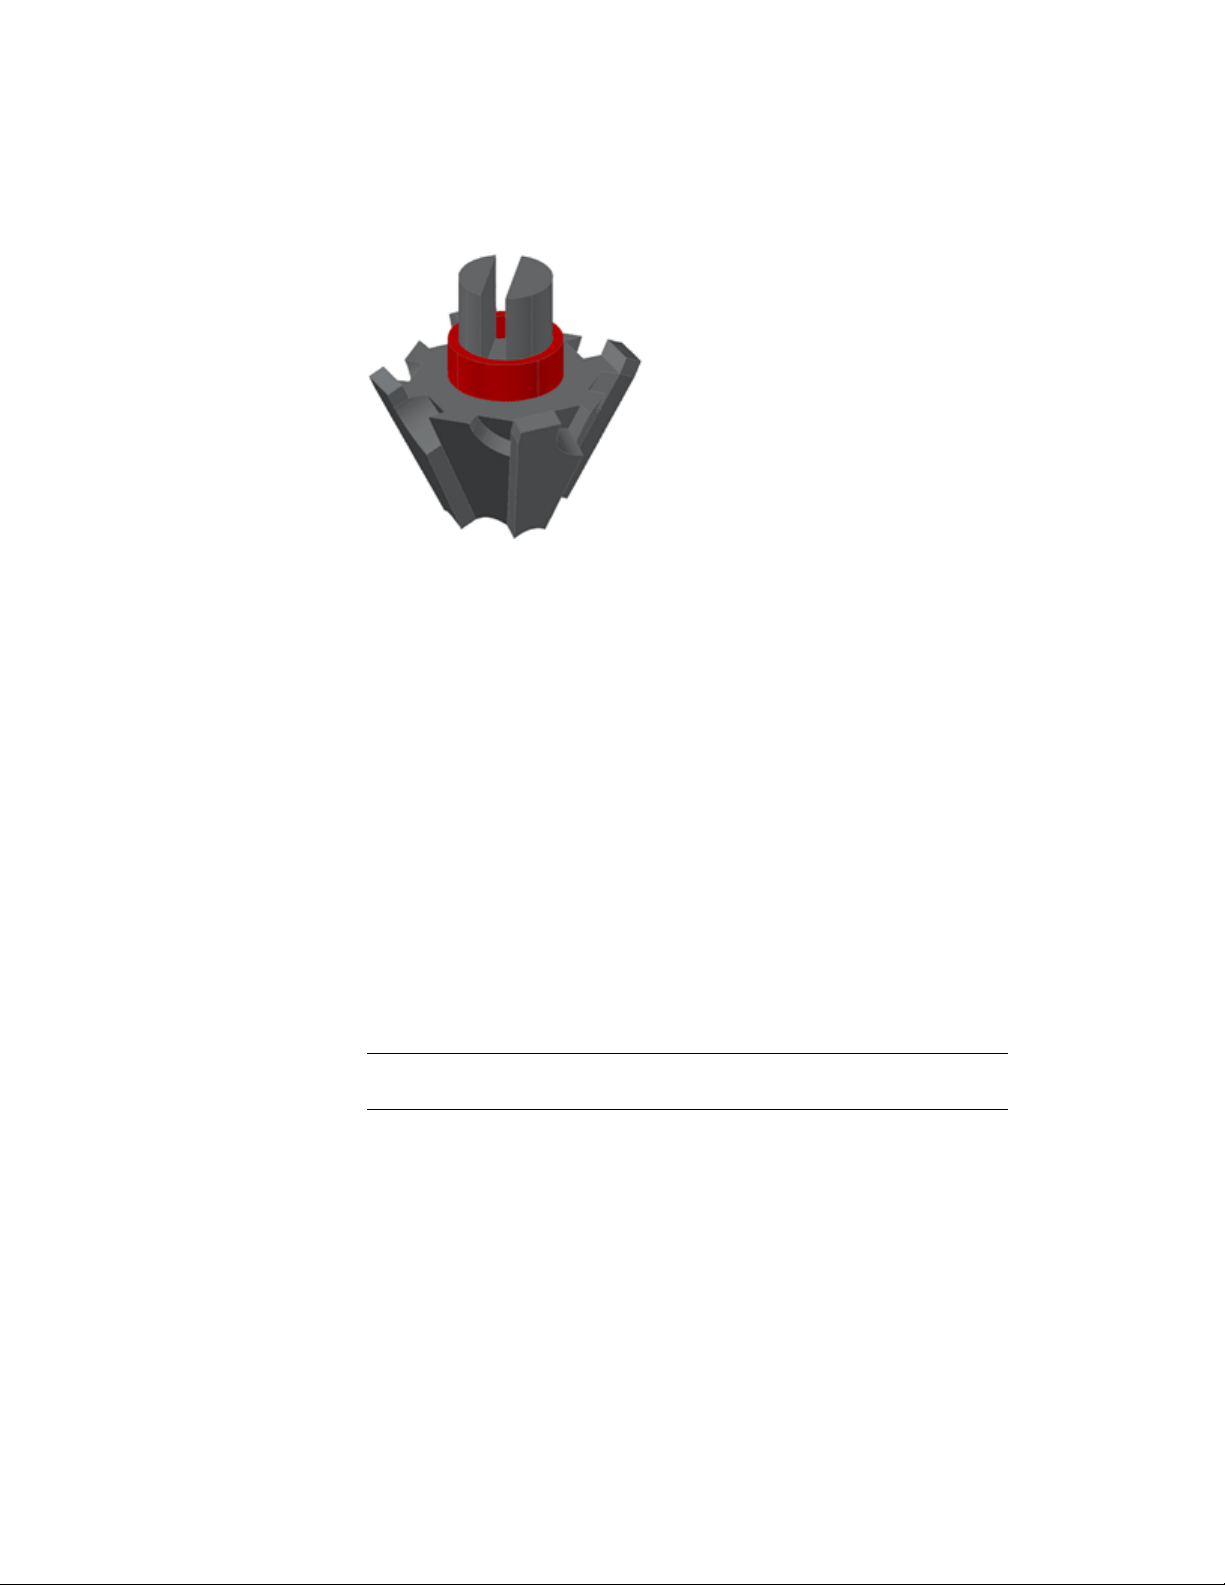
In combination with imprinted faces, you can form complex shapes using
press or pull operations to create extrusions and notches.
Press or Pull to Create Surfaces
Selecting an open object, such as a line, spline, or arc creates a surface.
Press or Pull to Offset a 3D Solid Face
If you select the face of a 3D solid object, the press or pull operation modifies
the size of the solid object based on the offset distance you specify. You can
select more than one face on the object. By pressing Ctrl as you drag the face,
you can preserve the angle of the adjacent faces.
Methods for Press and Pull Modifications
You can also press Ctrl-Shift-E to initiate a press or pull operation. To limit
the type of objects that can act as boundaries, turn off the IMPLIEDFACE
system variable. When the variable is off, only 3D faces and 3D solid faces
can be extruded using Ctrl+Shift+E. (This variable does not affect the
PRESSPULL command.)
NOTE If you alternatively use EXTRUDE to extend an existing face on a 3D solid,
a separate extruded object is created.
Add Facets to Faces on Solids and Surfaces
Subdivide faces into additional facets on 3D solids and surfaces by imprinting
other objects, such as arcs and circles on them.
Modify 3D Models | 439
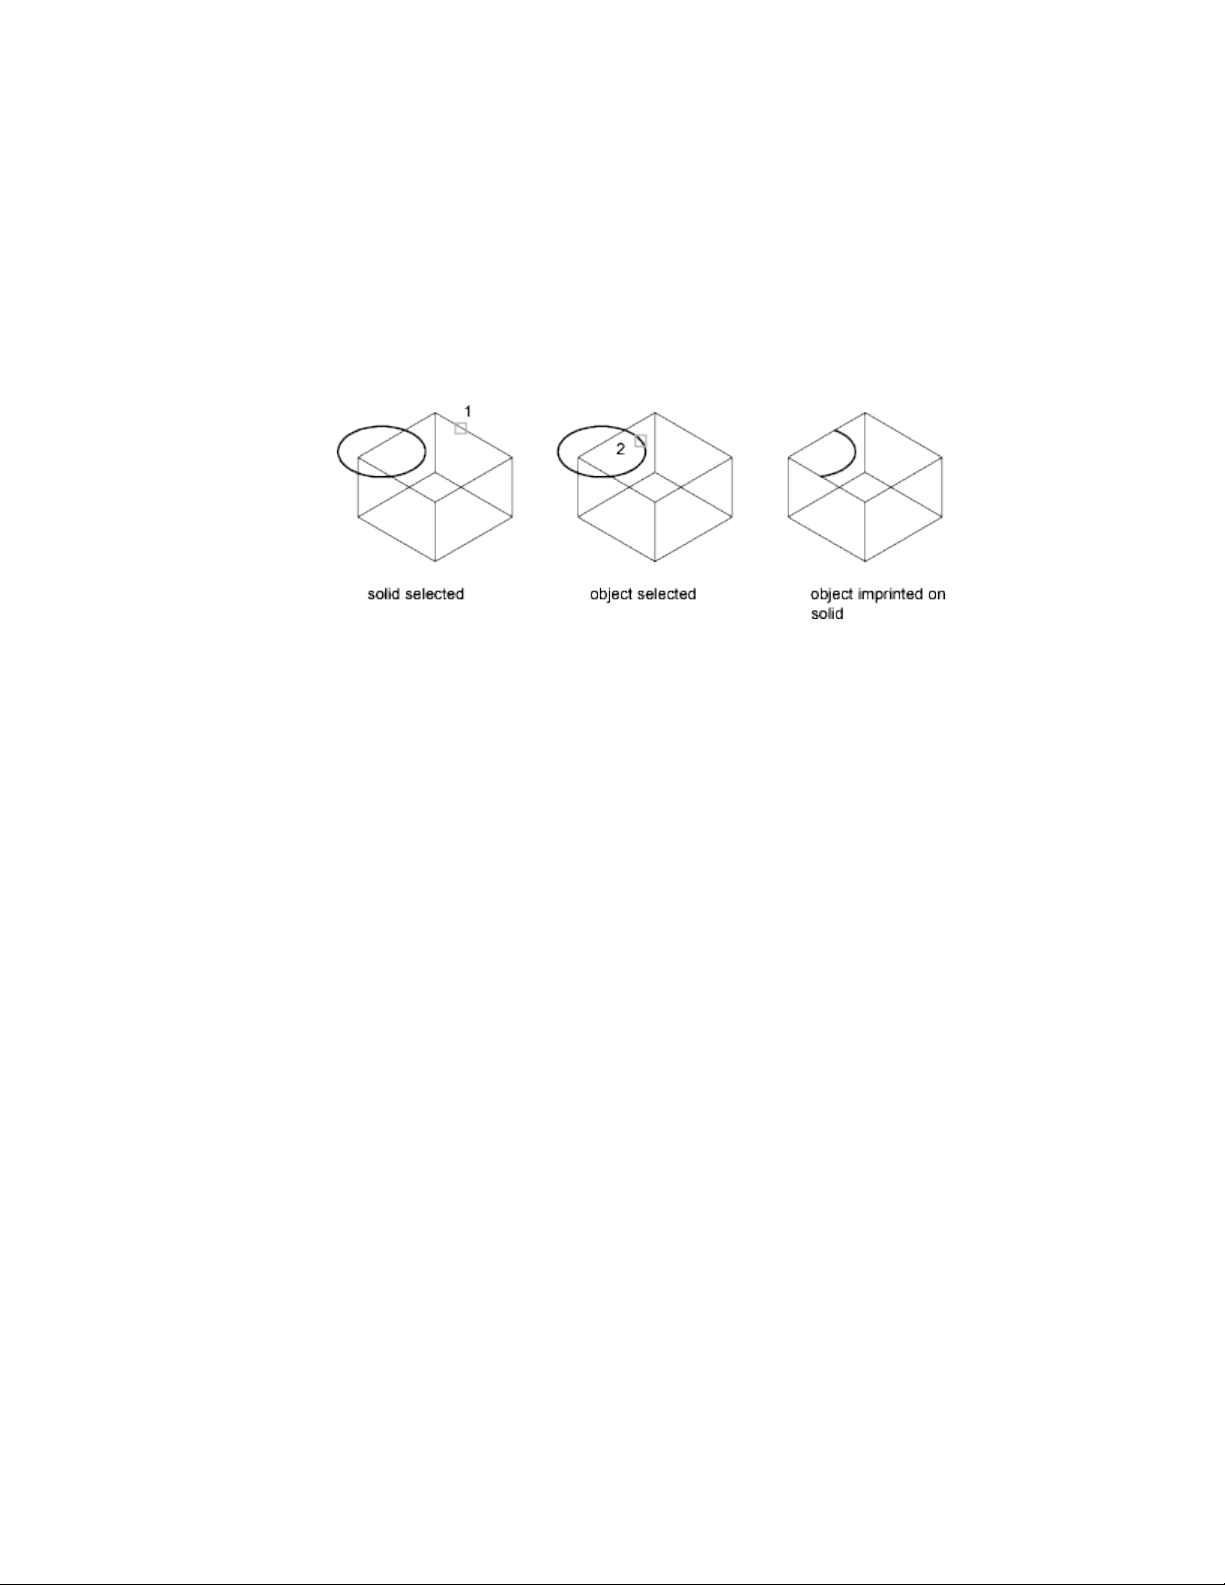
With the IMPRINT command, you can add a new facet to a 3D solid by
imprinting a coplanar object that overlaps a face. Imprinting provides
additional edges that you can use to reshape the 3D object.
For example, if a circle overlaps the face of a box, you can imprint it on the
solid.
You can delete or retain the original object when you imprint it.
Objects that can be imprinted on 3D solids include arcs, circles, lines, 2D and
3D polylines, ellipses, splines, regions, bodies, and other 3D solids.
Edit Imprinted Objects
You can edit imprinted objects and subobjects in many of the same ways that
you can edit other faces. For example, you can Ctrl+click to select a new edge
and drag it to a new location, or you can use PRESSPULL on the facet.
The following limitations exist for imprinted objects:
■ You can move the edges of the imprinted face only within the plane of a
face.
■ You might be unable to move, rotate, or scale some subobjects.
■ Imprinted edges and faces might be lost when some subobjects are moved,
rotated, or scaled.
Subobjects with editing limitations include
■ faces with imprinted edges or faces.
■ edges or vertices with adjacent faces that contain imprinted edges or faces.
440 | Chapter 8 Work with 3D Models
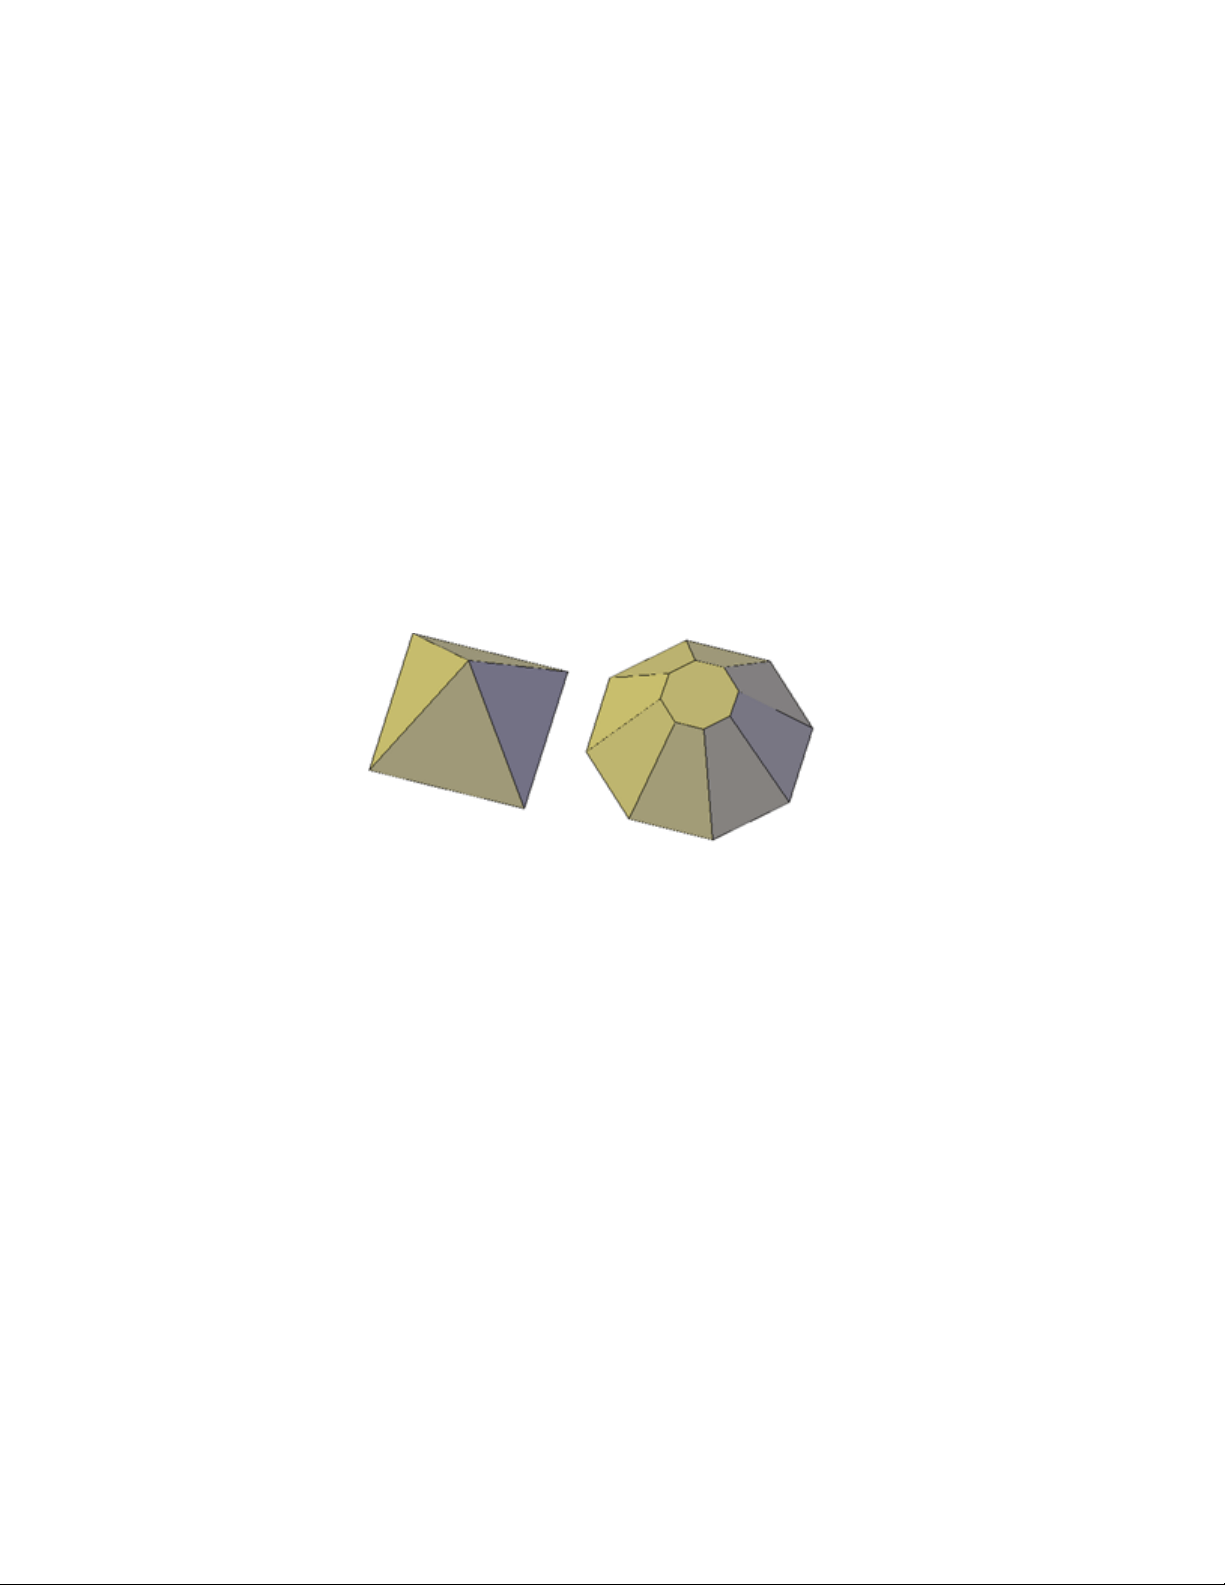
Modify the Properties of 3D Solids, Surfaces,
and Meshes
Modify 3D objects by changing their settings in the Properties Inspector.
3D solids, surfaces, and meshes, and their subobjects can be modified in the
Properties Inspector.
Modify Solid Objects by Changing Properties
By changing settings in the Properties Inspector, you can modify basic size,
height, and shape characteristics of primitive solids. For example, to change
a four-sided pyramid that ends in a point to an eight-sided pyramid that ends
in a planar surface (pyramid frustum), update the Top Radius and Sides
properties.
Set Whether to Retain Compound Object History
With 3D solids that have been recombined to form compound objects, you
can choose to retain the history subobject, which represents components that
have been removed. The Properties Inspector controls the availability and
display of these histories. For more information, see Work with Complex 3D
Solids and Surfaces (page 433).
Modify 3D Models | 441
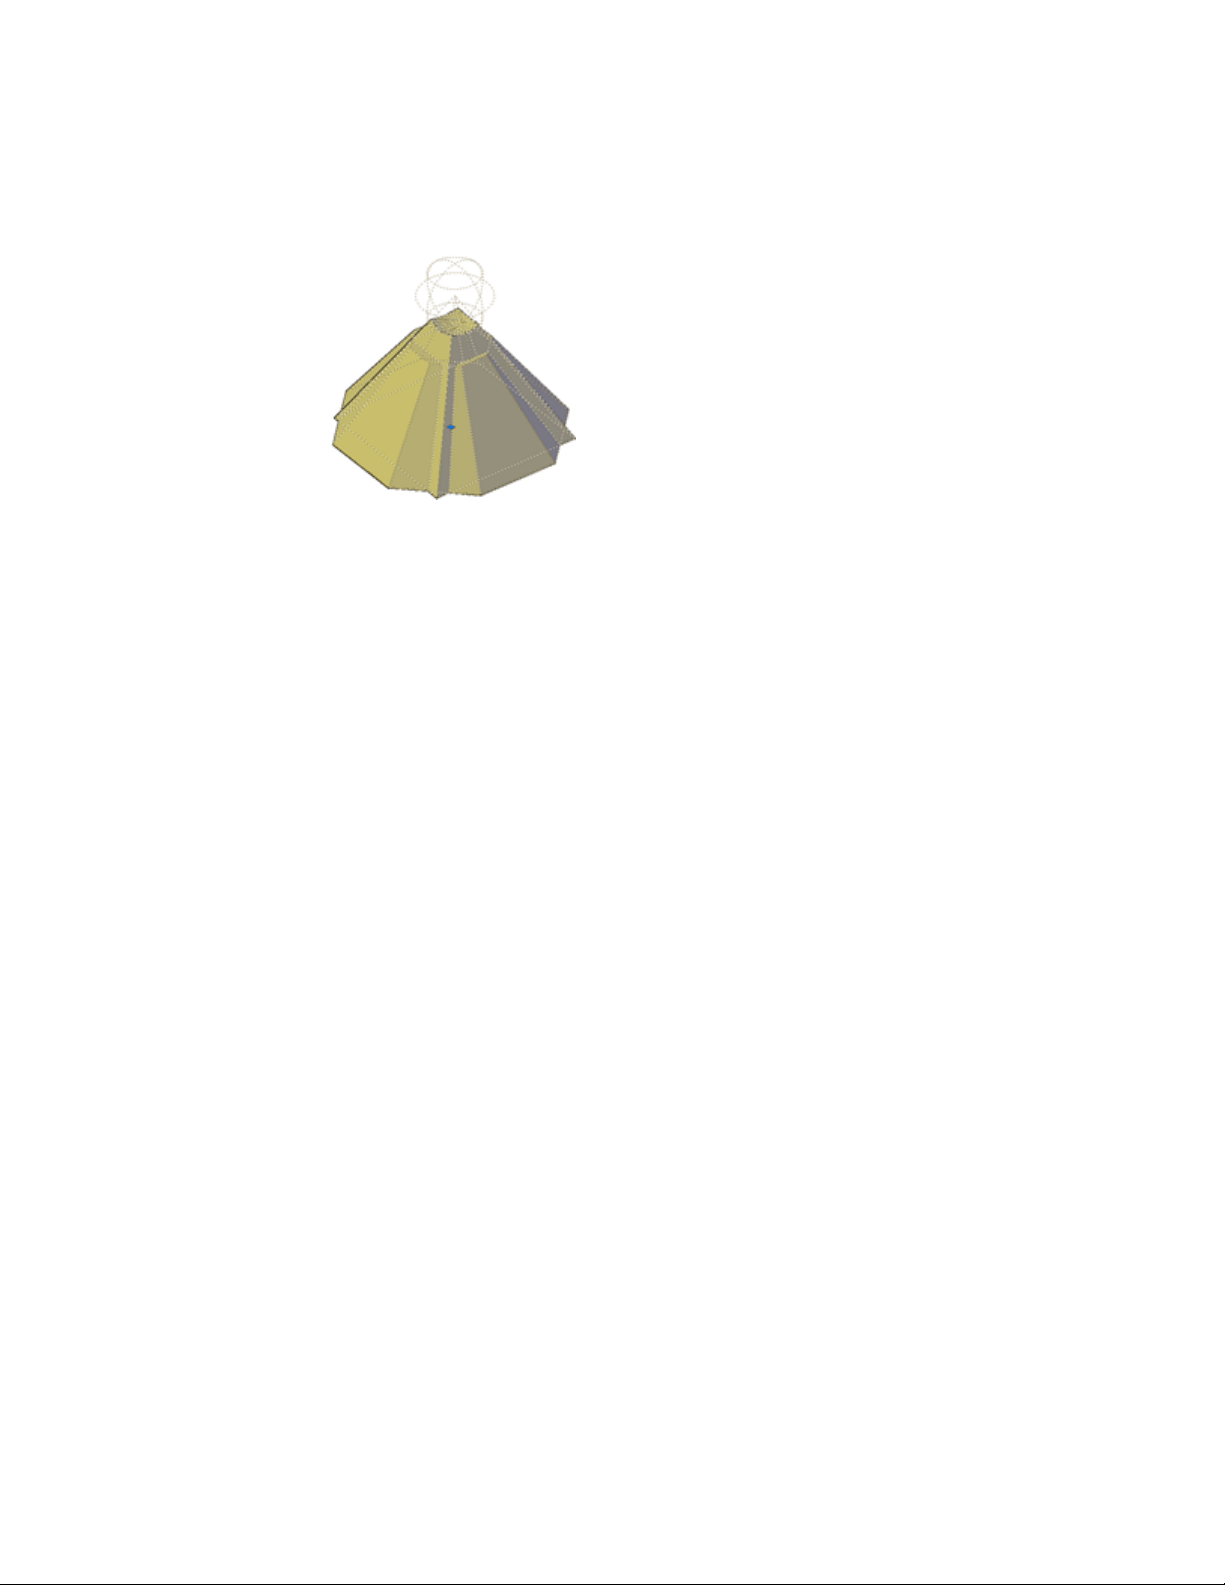
Modify Surface Objects by Changing Properties
Surface objects have additional properties that are not found in 3D solid or
mesh objects. The properties differ depending on the type of surface (NURBS,
blend, patch, network, offset, fillet, chamfer, extend, loft, extrude, sweep,
planar, or revolve).
Surfaces include the following information in the Properties inspector:
■ Basic geometric information - Contains information such as radius
for fillet surfaces, offset distance for offset surfaces, and taper angle for
extruded surfaces. You can also enter mathematical expressions to control
some of these properties.
■ Maintain Associativity - Displays whether surface is associative or not.
Use this property to turn associativity off.
■ Show Associativity - Turns dependency highlighting on and off if the
surface is associated with other surfaces.
■ Edge Continuity and Bulge Magnitude - Displays for surfaces that
join other surfaces.
■ Wireframe Display and U/V Isolines - Turns the wireframe and U/V
Isoline display on and off (for non-NURBS surfaces).
■ CV Hull Display and U/V Isoparms - Turns the CV Hull and U/V
Isoparm display on and off (for NURBS surfaces).
■ Trims - Reports whether the surface has any trimmed areas and on which
edges.
442 | Chapter 8 Work with 3D Models
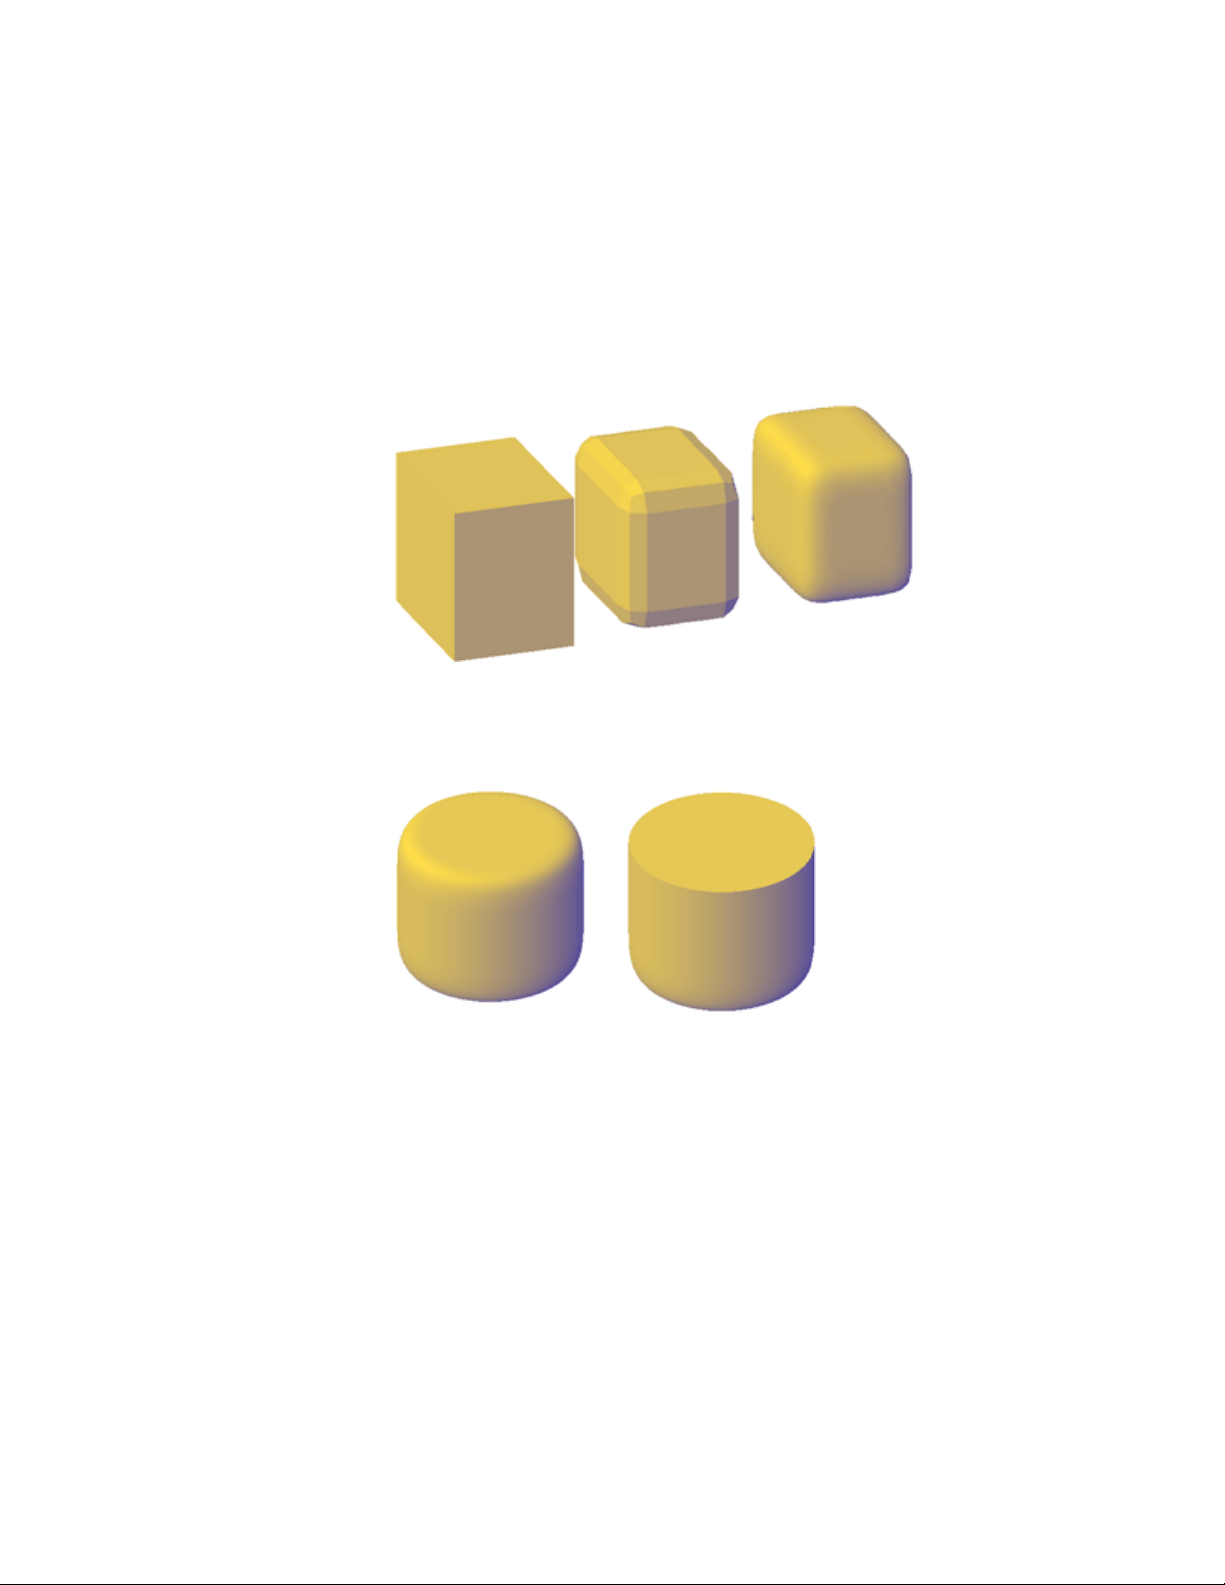
Modify Mesh Objects by Changing Properties
Mesh objects have additional properties that control the level of smoothness
and creases. Crease properties of face, edge, and vertex subobjects are also
reflected in the Properties Inspector.
■ Level of Smoothness. Smooths or sharpens the edges of a mesh object.
■ Crease Type. Specifies the presence of a crease (or sharpened edge) and
the effect of smoothing. Smoothing does not affect a crease with a value
of Always. A crease set to By Level retains its sharpness until the mesh
object is smoothed to the specified crease level.
■ Crease Level. When a crease is set to By Level, indicates the smoothing
level at which the crease starts to lose its sharpness.
Modify 3D Models | 443
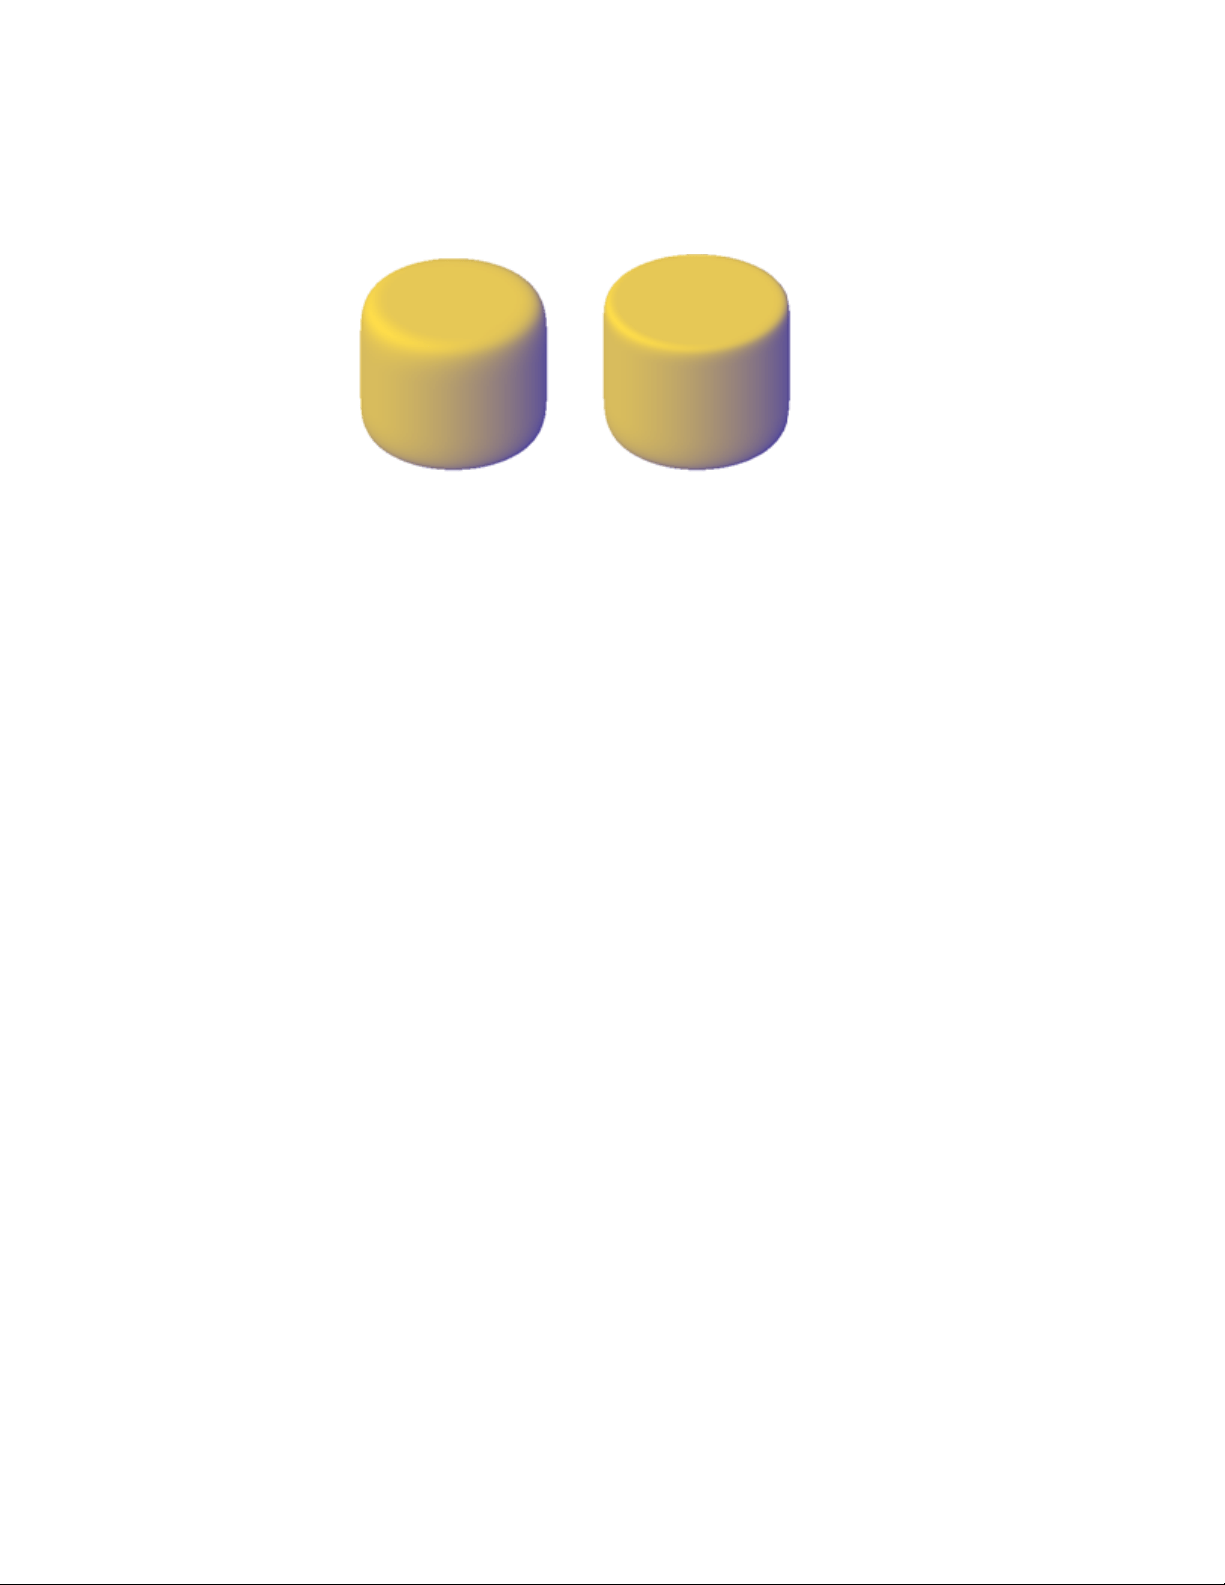
Modify 3D Subobject Properties
In addition to solids, surfaces, and meshes, you can also use the Properties
Inspector to modify the properties of individual subobjects, such as faces,
edges, and vertices. Different properties are available for different types of
subobjects.
In some cases, the application of properties can differ depending on the object
type. For example, you can modify the properties of mesh faces, including
their color. However, the color appearance of a mesh face might differ from
the equivalent color on a 3D solid face. This difference occurs because changing
the color of a face modifies the diffuse color of the face, but not the ambient
color (which is derived from the mesh material property).
To obtain a closer match between the color of 3D solid and mesh faces, you
can add lights and turn off the default lighting (which disables ambient
lighting). You can also try assigning a material that has the same ambient and
diffuse color.
See also:
Work with Complex 3D Solids and Surfaces (page 433)
Modify Surfaces
Reshape surfaces, and then analyze and rebuild the model if necessary to
ensure quality and smoothness.
444 | Chapter 8 Work with 3D Models
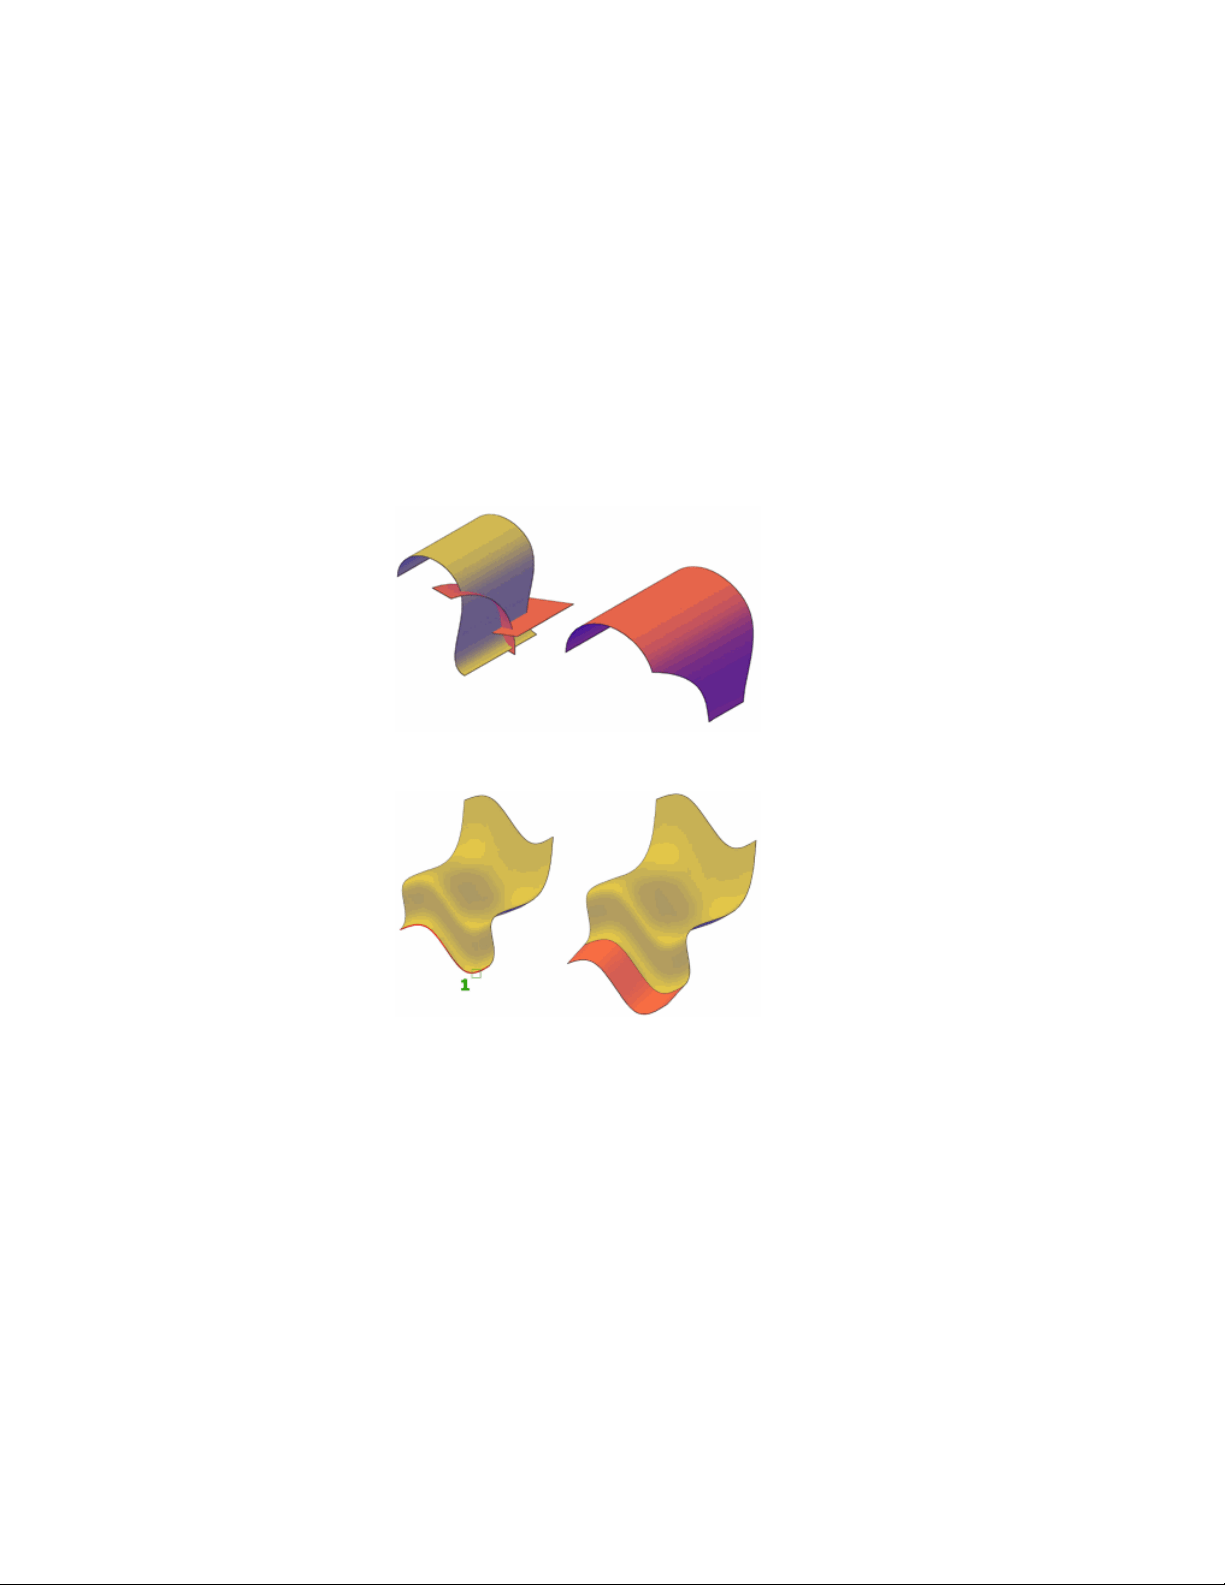
Overview of Modifying Surfaces
Fillet, extend, and trim surfaces or modify NURBS surfaces with control vertices.
Procedural and NURBS surfaces can be edited with basic editing tools such as
trimming, extending and filleting. NURBS surfaces can be modified with these
tools as well, but they can also be reshaped by stretching control vertices.
When your surface design is complete, use the surface analysis tools to ensure
the quality of your model and to rebuild it if necessary.
■ Trim and Untrim Surfaces
■ Extend Surfaces
■ Fillet Surfaces
Modify 3D Models | 445
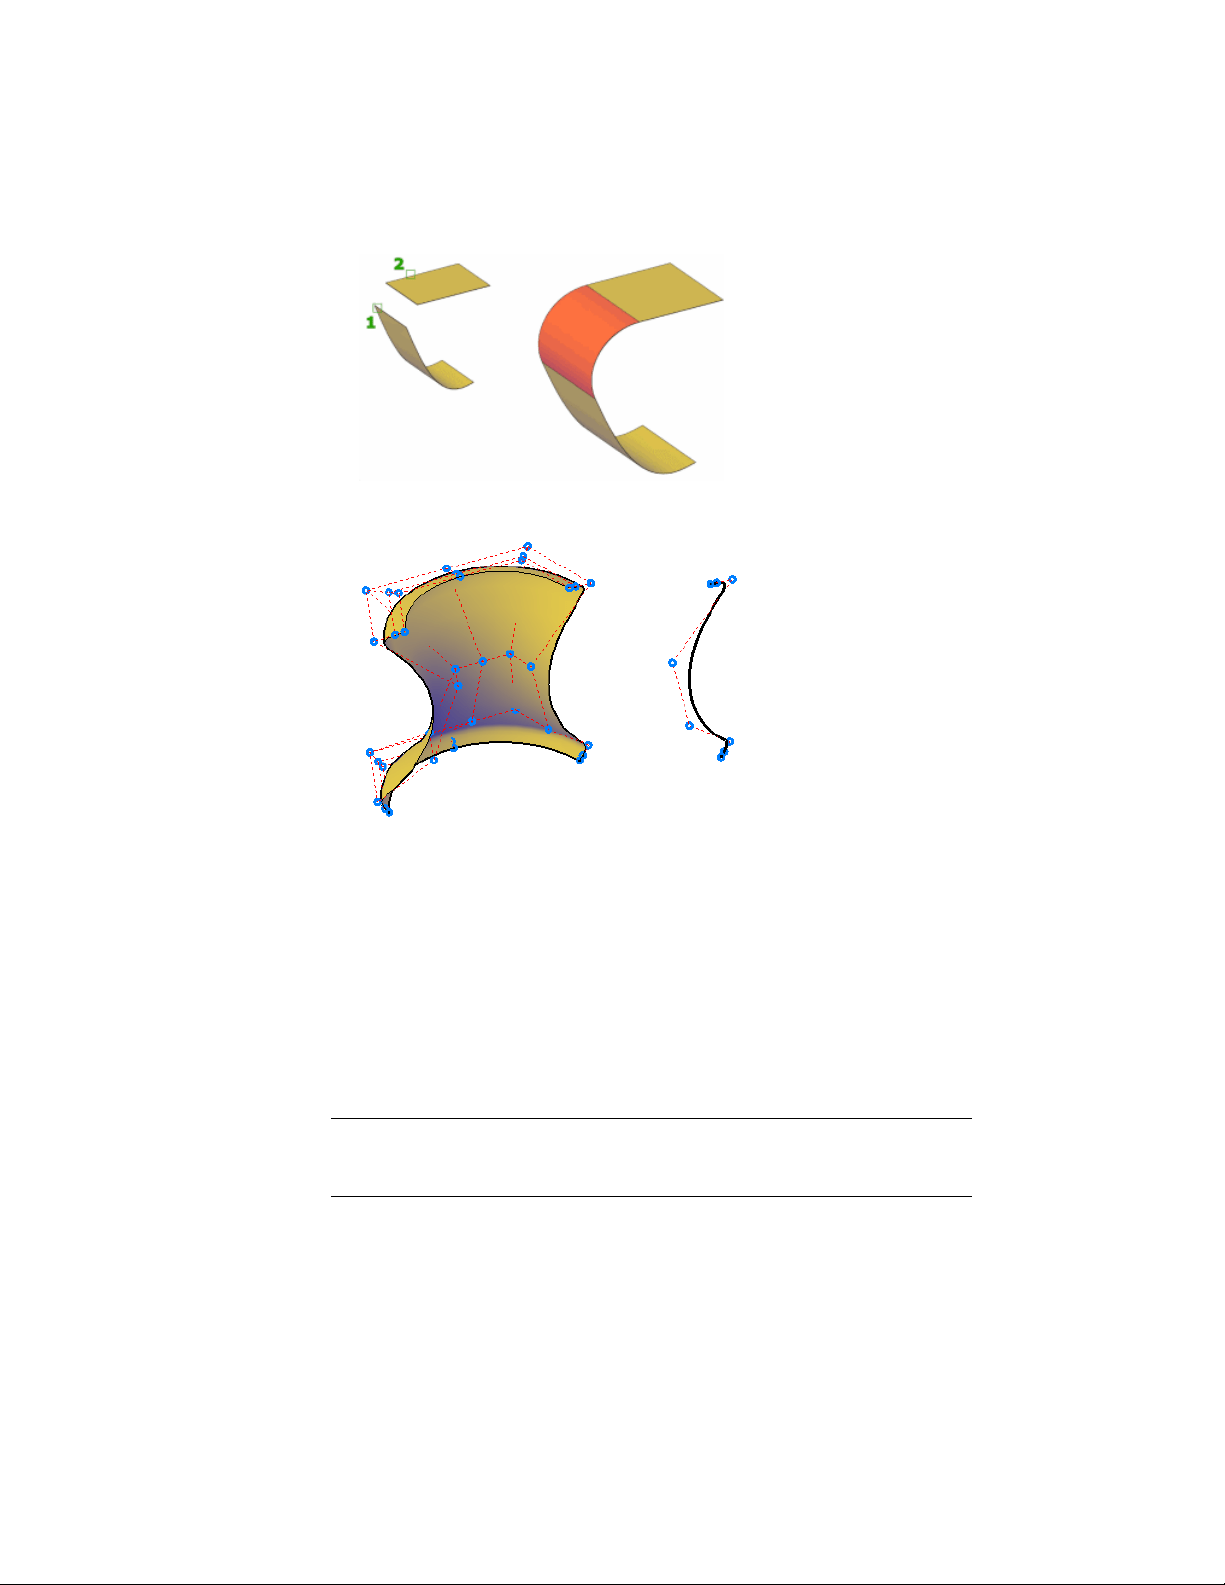
■ Edit NURBS Surfaces
Trim and Untrim Surfaces
Trim and untrim surfaces to meet the edges of other objects.
An important step in the surface modeling workflow is trimming surfaces.
You can trim a surface where it meets an intersecting object or you can project
geometry onto a surface as a trimming edge.
When a surface is trimmed, the removed surface areas can be replaced with
SURFUNTRIM.
NOTE SURFUNTRIM does not restore areas removed by the SURFAUTOTRIM
system variable and PROJECTGEOMETRY. It only restores areas trimmed with
SURFTRIM.
The Properties Inspector indicates if the surface contains any trimmed edges.
446 | Chapter 8 Work with 3D Models

Projecting Geometry onto Surfaces, Solids, and Regions
Similar to projecting a movie onto a screen, you can project geometry onto
3D solids, surfaces, and regions from different directions to create trimming
edges. The PROJECTGEOMETRY command creates a duplicate curve on the
object that you can move and edit. You can also trim against 2D curves that
do not actually touch the surface, but that appear to intersect the object in
the current view.
Use the SURFACEAUTOTRIM system variable to automatically trim a surface
when you project geometry onto it.
Options for Projecting Geometry
Project geometry from 3 different angles: the Z axis of the current UCS, the
current view, or a path between two points.
■ Project to UCS - Projects the geometry along the positive or negative Z
axis of the current UCS.
■ Project to View - Projects the geometry based on the current view.
■ Project to Two Points - Projects the geometry along a path between
two points.
Extend a Surface
Create a new surface by extending it to meet the edge of another object or by
specifying an extension length.
There are two types of extend surfaces: merge and append. The merge surface
is a continuation of the surface with no seam. The append surface extends the
surface by adding a second surface with a seam. Because it creates a seam,
append surfaces have continuity and bulge magnitude (page 372) properties.
For both surface types, use the Properties Inspector to change the length or
to derive the length from a mathematical expression.
Modify 3D Models | 447
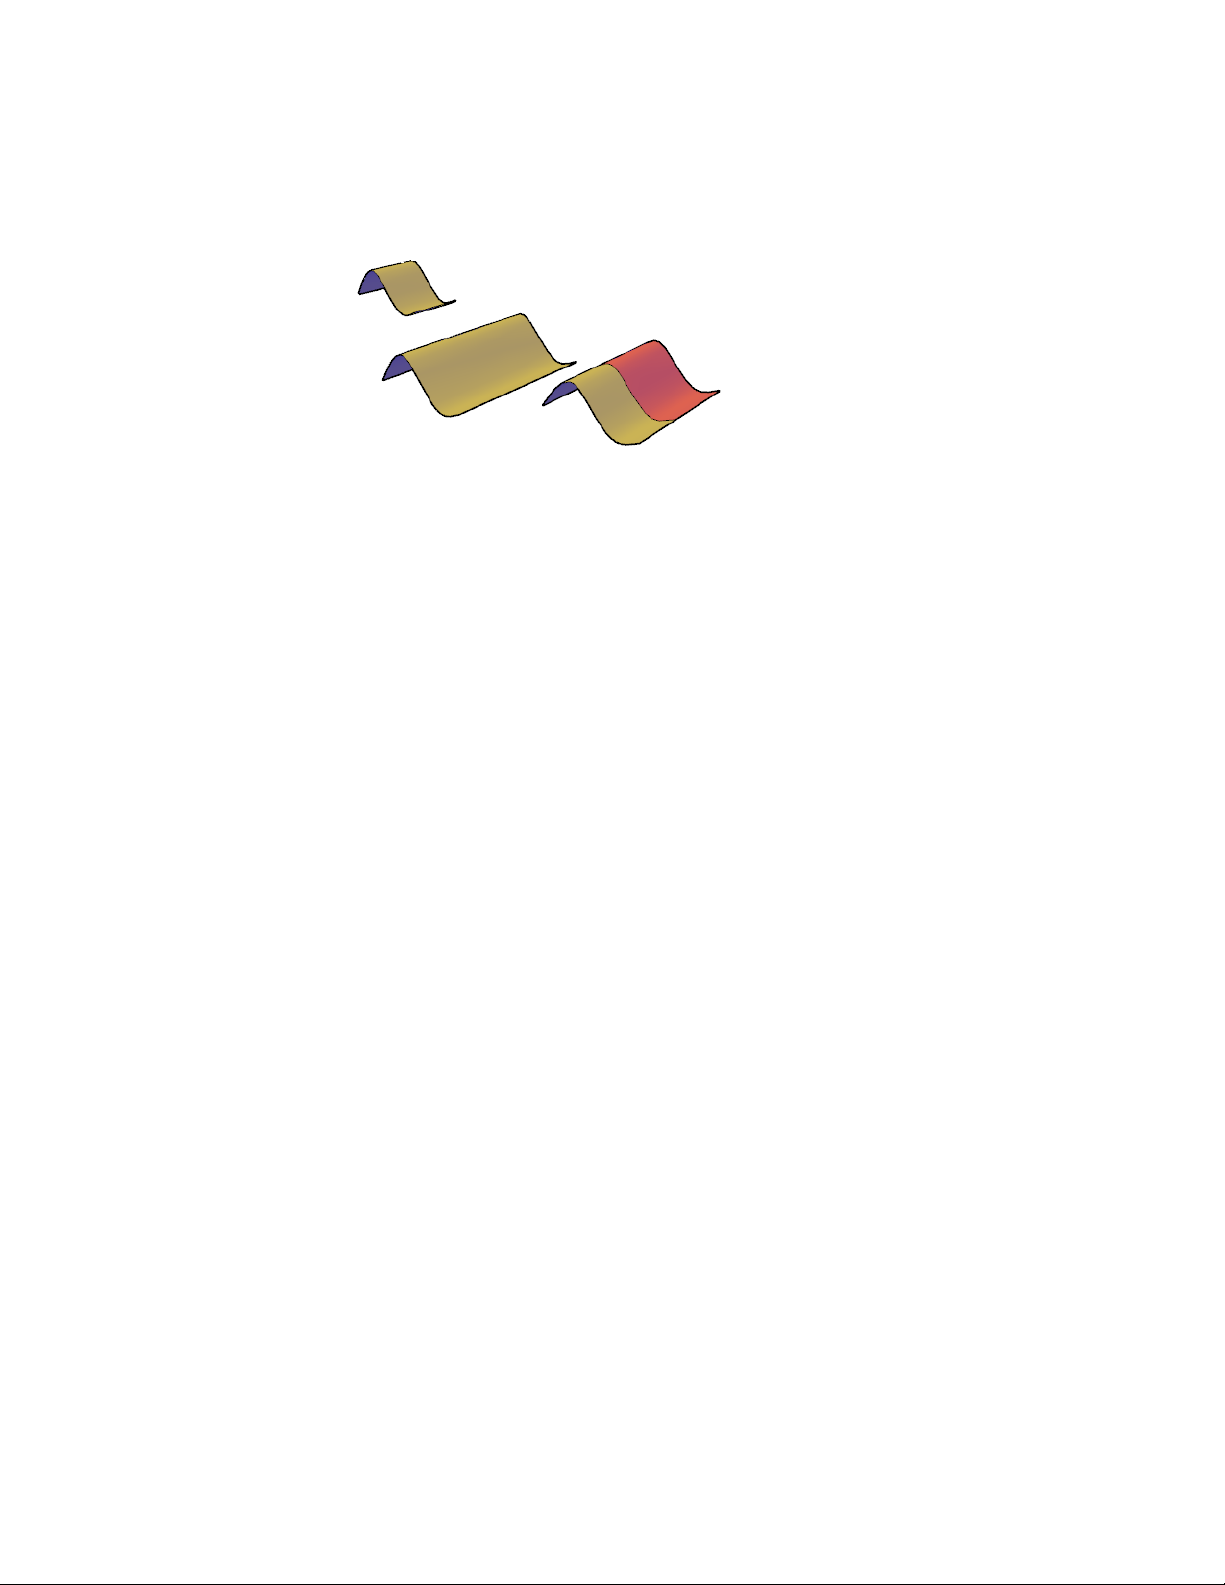
Fillet a Surface
Create a new transition surface that fillets an area between two existing surfaces
or regions.
Create a tangent surface between two surfaces or regions with a constant radius
profile. The original surfaces will trim to meet the fillet surface.
By default, the fillet surface uses the radius value set in the FILLETRAD3D
system variable. Change the radius while you are creating the surface with
the radius option or by dragging the fillet grip. Use the Properties Inspector
to change the fillet radius or to derive the radius using a mathematical
expression.
Edit NURBS Surfaces
Change the shape of NURBS surfaces and curves by using the 3D Edit Bar or
by editing control vertices.
Use the Control Vertices Edit Bar (3DEDITBAR) to drag and reshape surfaces.
A second way to edit NURBS surfaces is to drag and edit the control vertices
directly. Press and hold Shift to select multiple control vertices.
448 | Chapter 8 Work with 3D Models
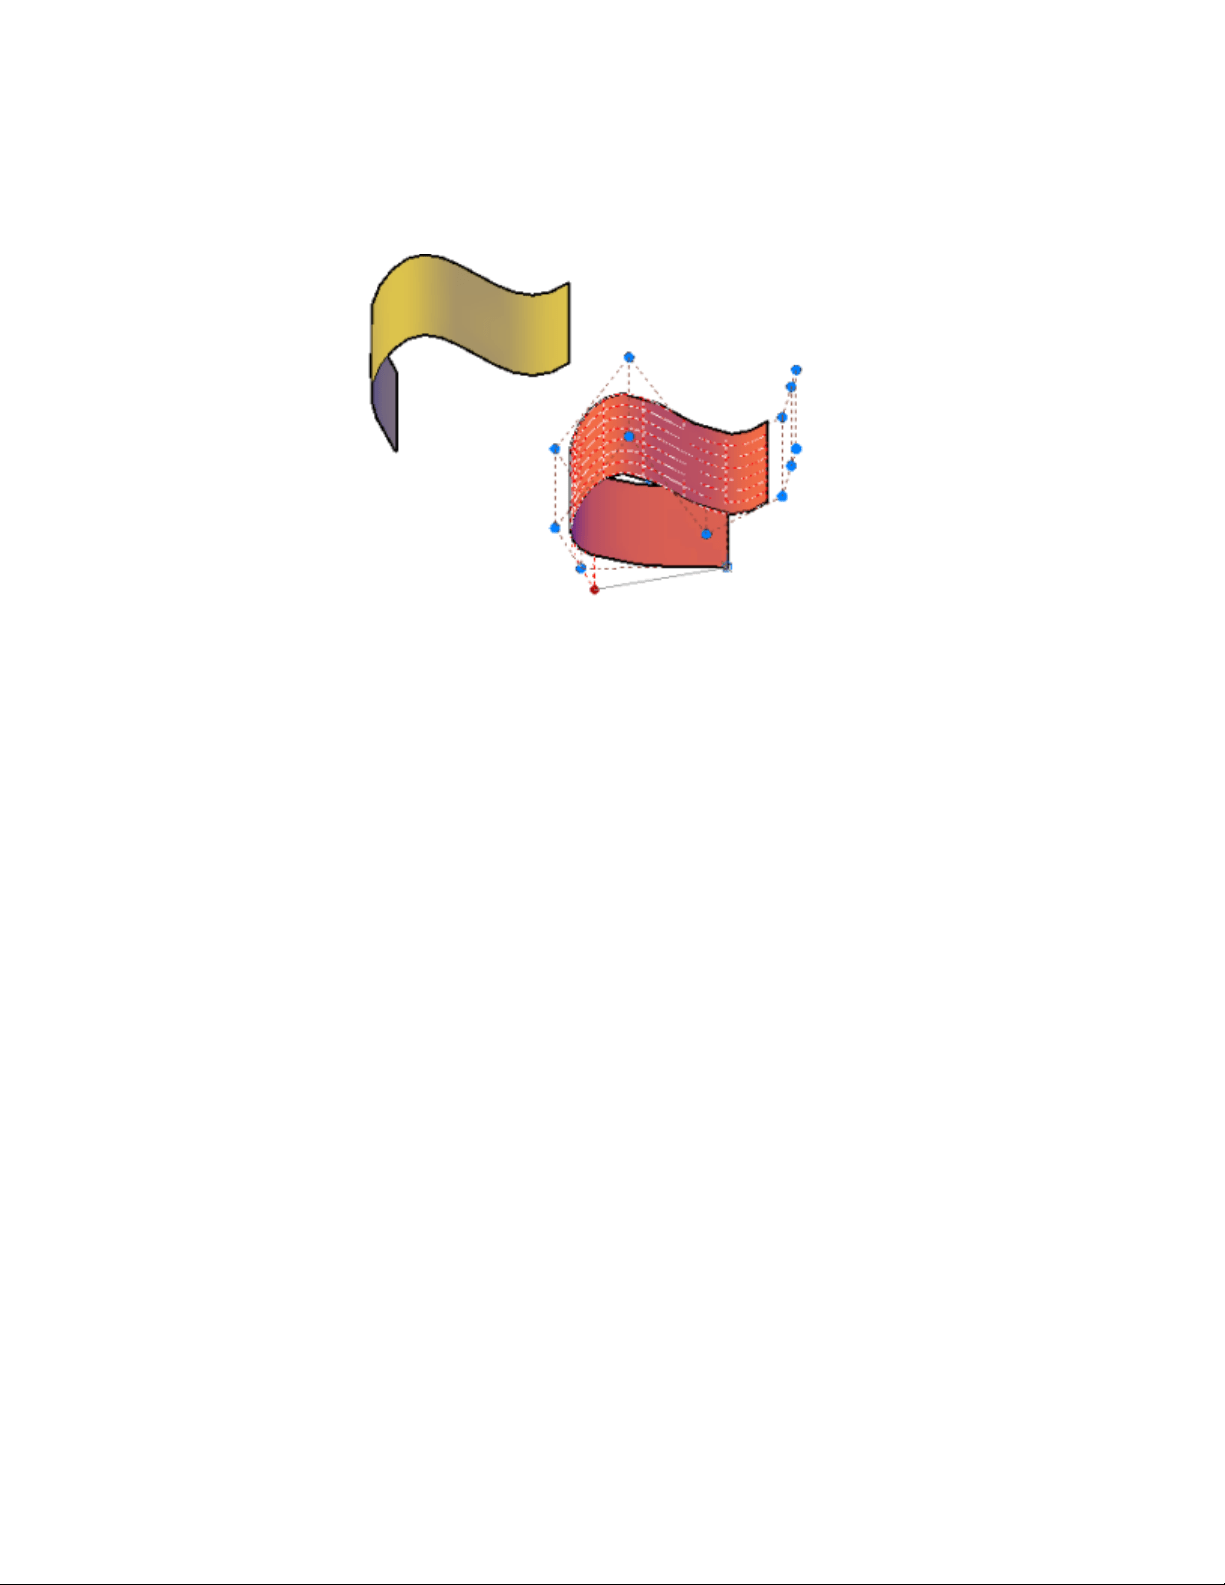
Use CVSHOW to display the control vertices for both NURBS surfaces and
curves.
Drag the control vertices to reshape the curve or surface; you can also add or
delete control vertices in both the U and V directions.
The typical surface modeling workflow is to:
■ Create a model that combines 3D solids, surfaces, and mesh objects.
■ Convert the model to procedural surfaces to take advantage of associative
modeling.
■ Convert the procedural surfaces to NURBS surfaces with CONVTONURBS
to take advantage of NURBS editing.
■ Check for imperfections and wrinkles with the surface analysis tools.
■ If necessary, rebuild the surfaces to restore smoothness with CVREBUILD.
Rebuild NURBS Surfaces and Curves
Reconstruct NURBS surfaces and curves to a specified degree and number of
control vertices.
Editing a NURBS surface or curve can create discontinuity and wrinkles.
Reconstruct the surface or curve by changing the degree and the number of
control vertices. Rebuilding also allows you to delete the original geometry,
and, for surfaces only, to replace trimmed areas.
Modify 3D Models | 449
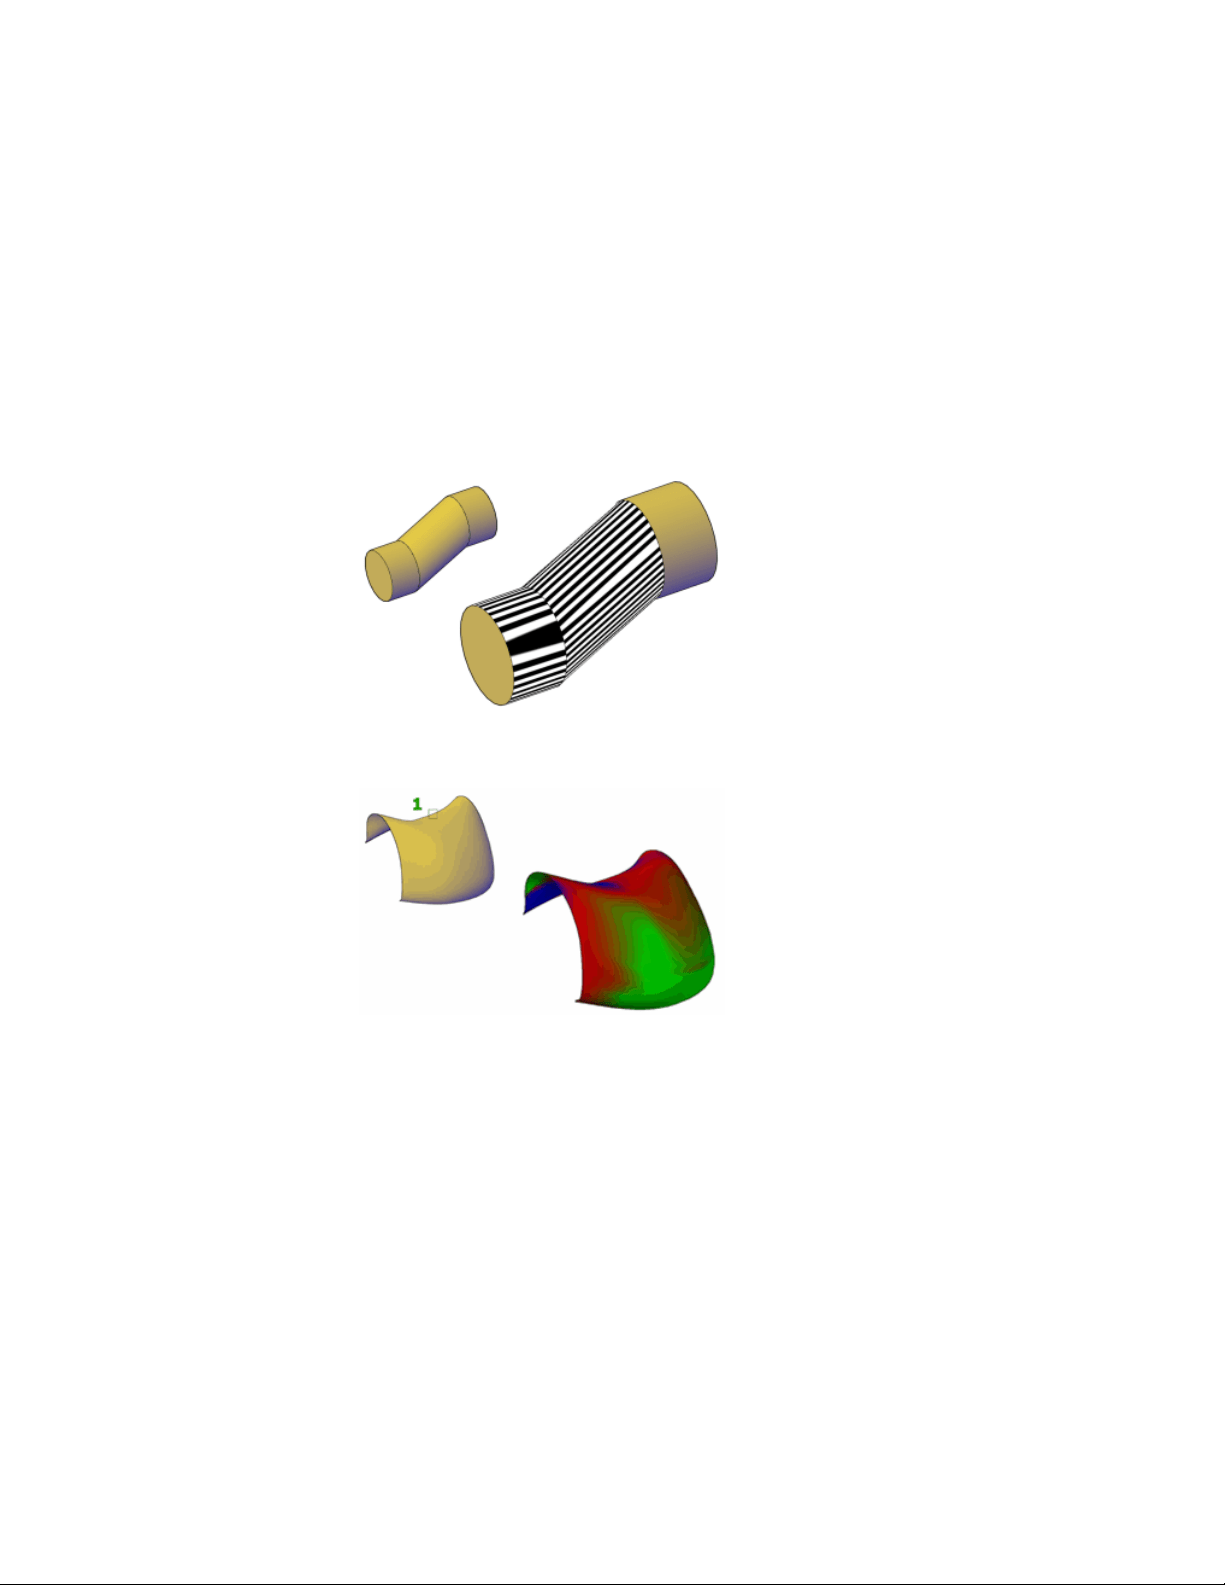
Analyze Surfaces
Surface analysis tools check the continuity, curvature and draft angles of
surfaces.
Use the surface analysis tools to validate surfaces and curves before
manufacturing. Analysis tools include:
■ Zebra Analysis (page 451) - Analyzes surface continuity by projecting parallel
lines onto the model.
■ Curvature Analysis (page 453) - Evaluates areas of high and low surface
curvature by displaying a color gradient.
■ Draft Analysis (page 453) - Evaluates whether a model has adequate draft
between a part and its mold.
450 | Chapter 8 Work with 3D Models
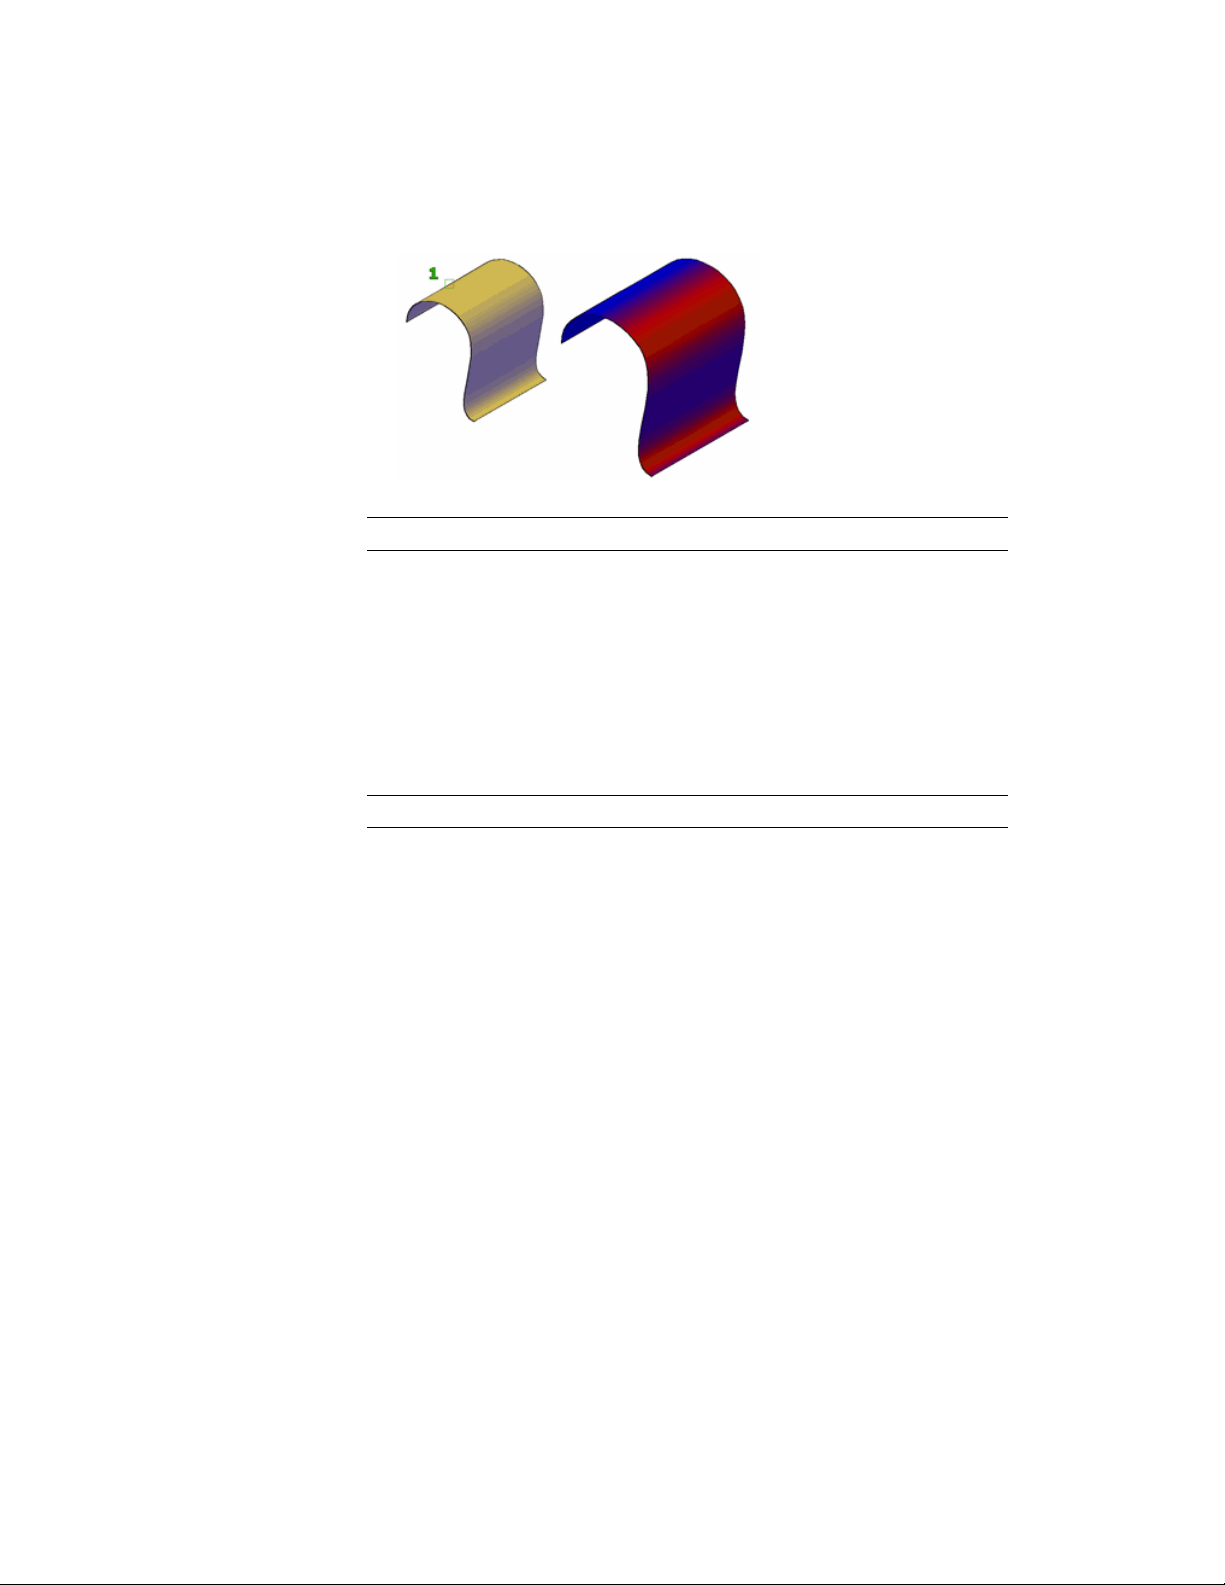
NOTE Analysis tools only work in the 3D visual styles; they will not work in 2D.
Analyze Surface Continuity with Zebra Analysis
The zebra analysis tool projects stripes onto a surface so that you can inspect
the continuity between surfaces.
Surface continuity is a measure of how smoothly two surfaces flow into each
other. A car hood, for example, can be composed of multiple small surfaces
that appear to be one because of the smoothness of the surface continuity.
NOTE Analysis tools only work in the 3D visual styles; they will not work in 2D.
How to Interpret the Zebra Stripes
In the seam where two surfaces meet, the way that the zebra stripes align and
curve tells you a lot about the smoothness of the join.
■ G0 Position. The position of the surface edges is collocated; they touch.
But the tangency and curvature do not match. The zebra stripes do not
line up.
Modify 3D Models | 451
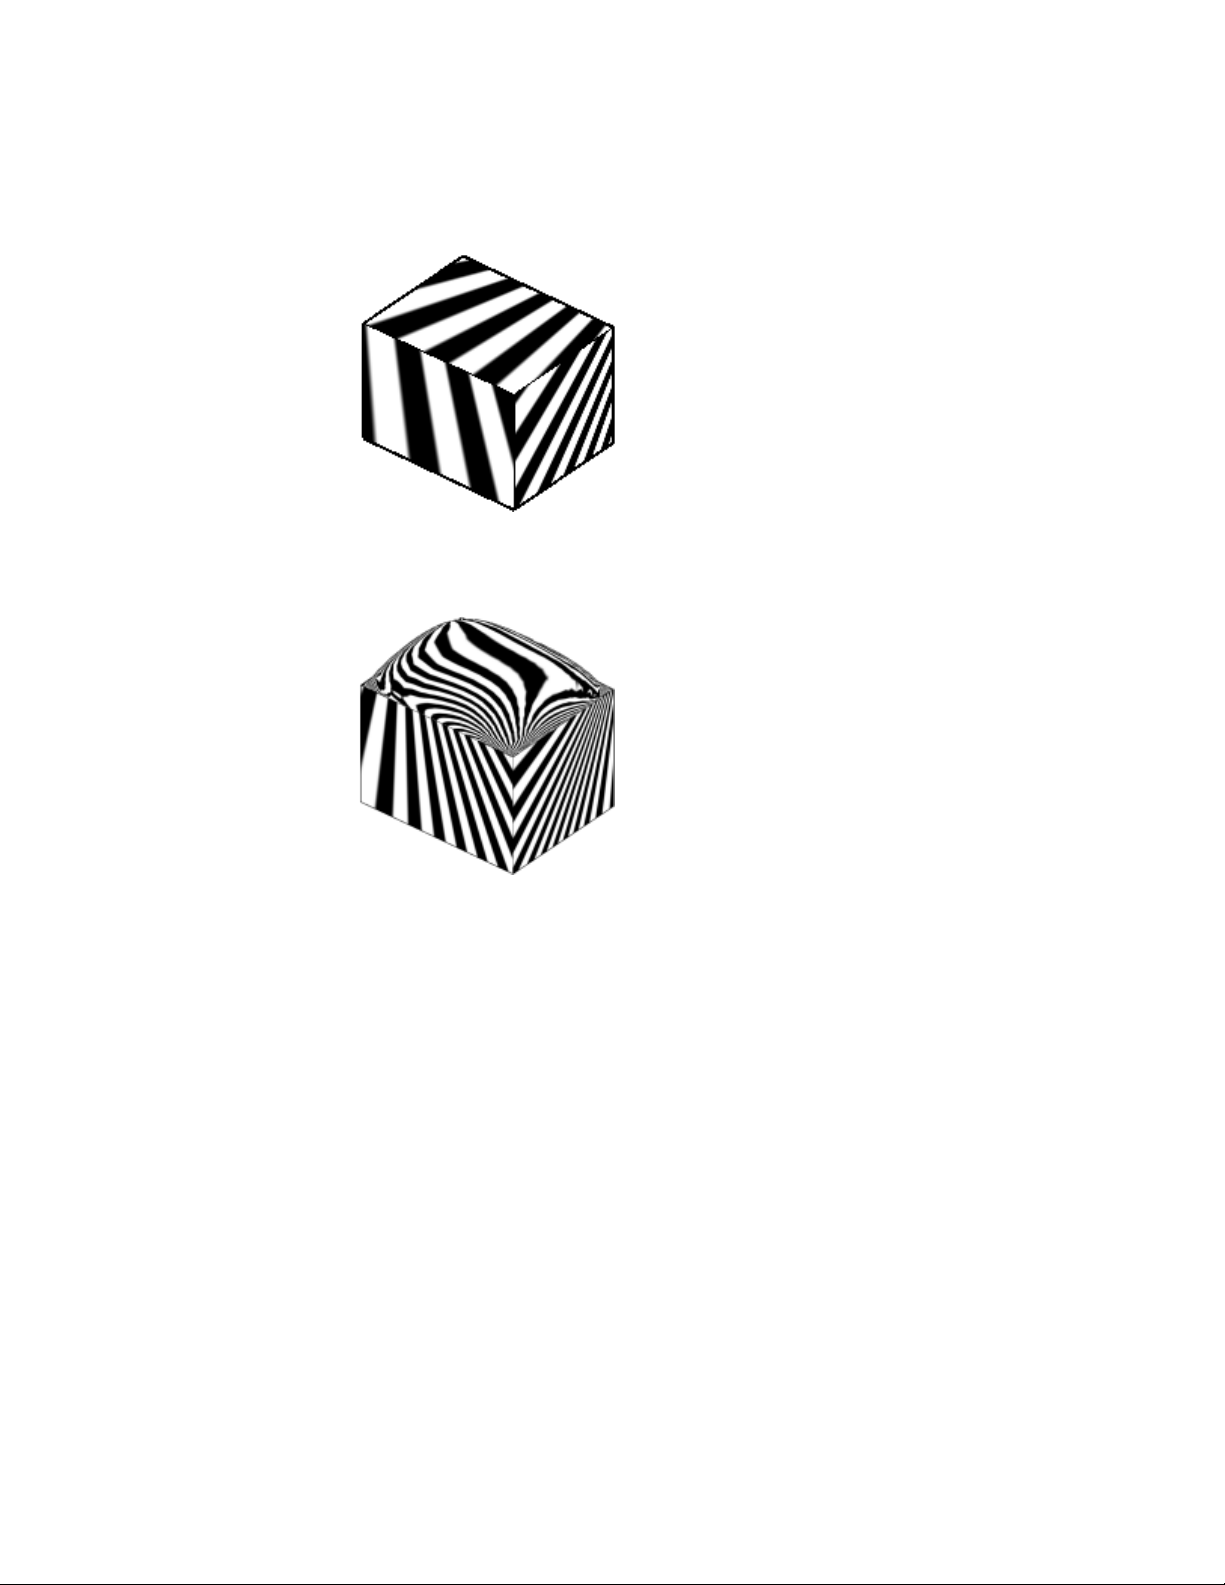
■ G1 Tangency. The position and tangency of surfaces is the same. This
indicates G1 (G0 + G1 or position + tangency). The zebra stripes line up,
but they veer away from one another at sharp curves.
■ G2 Curvature. The position, tangency, and curvature of the surface edges
is the same. This indicates G2 (G0 + G1 + G2 or position + tangency +
curvature).
The stripes line up, but they do not veer away from each other at sharp
curves (because they share the same curvature). This distinction is subtle
and a little harder to discern from G1 continuity.
452 | Chapter 8 Work with 3D Models
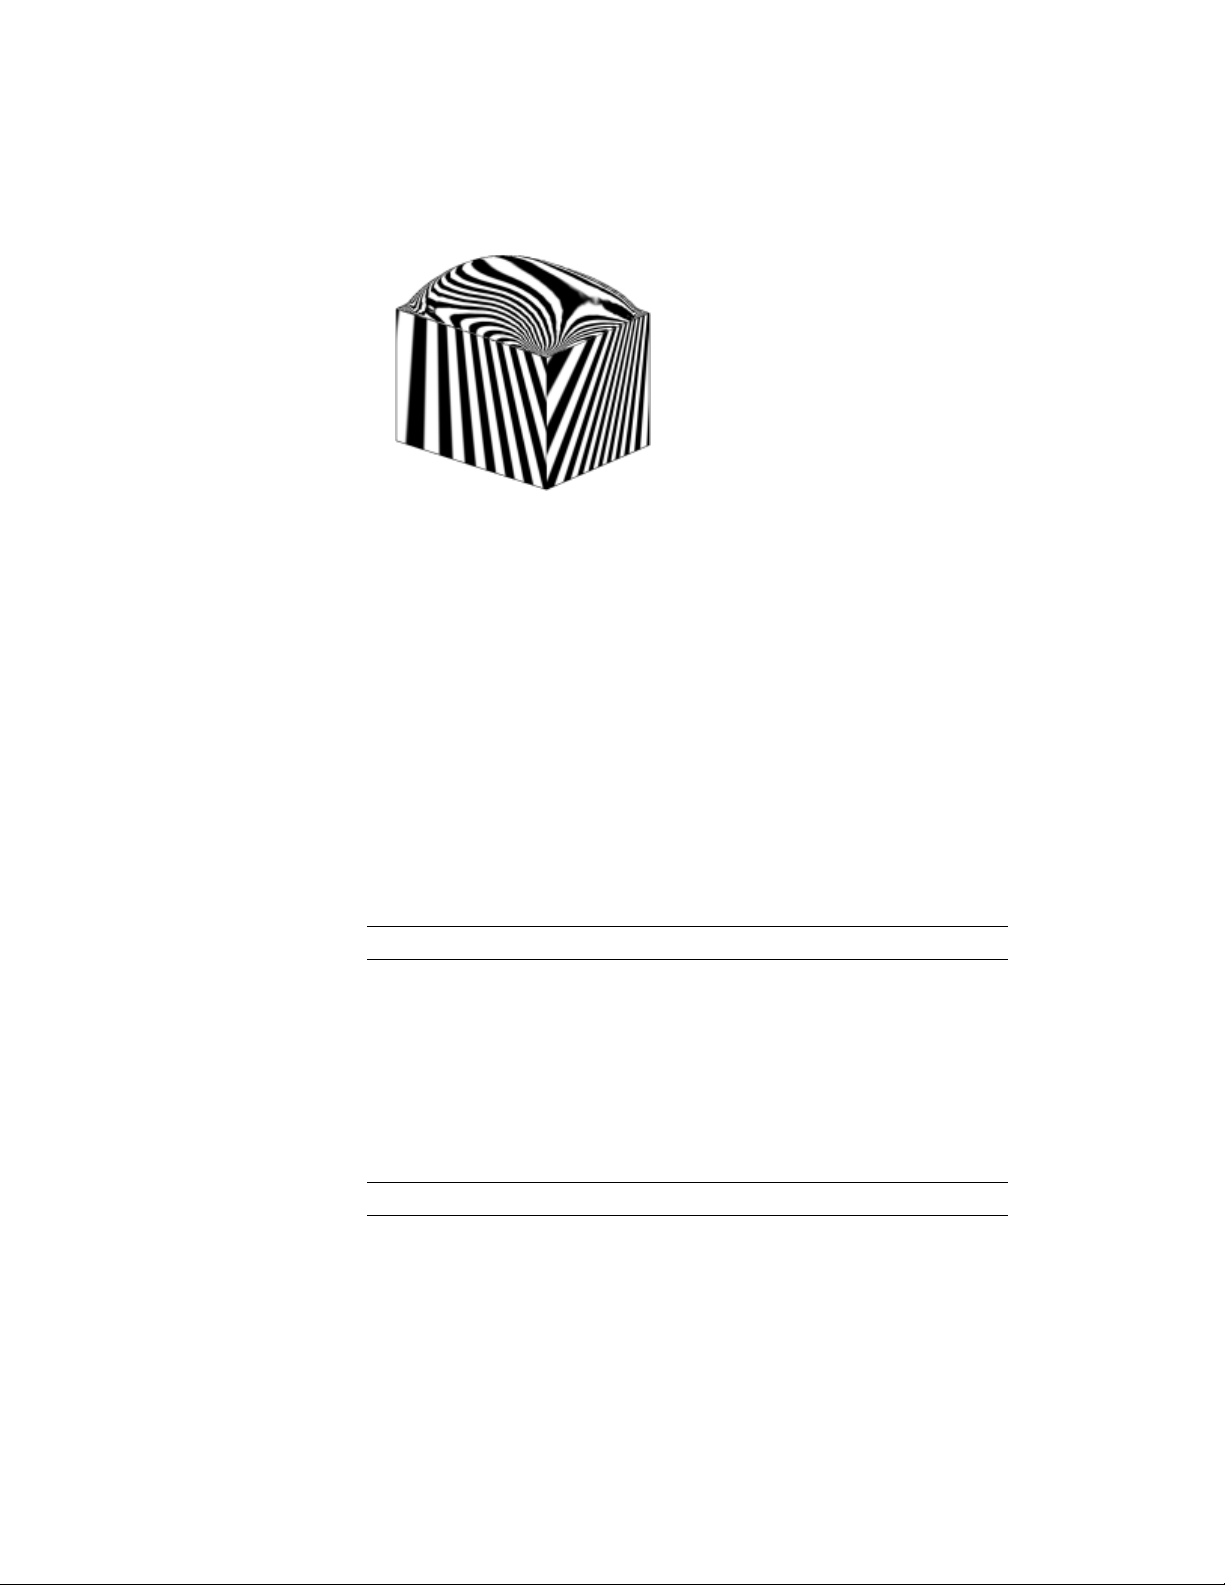
Analyze the Curvature of a NURBS Surface
Displays a color gradient onto surfaces to evaluate areas of high, low and
Gaussian curvature.
The color gradient allows you to visualize Gaussian, minimum, maximum,
and mean U and V surface curvature. Maximum curvature and a positive
Gaussian value display as red, and minimum curvature and a negative Gaussian
value display as blue. Positive Gaussian curvature means the surface is shaped
like a bowl. Negative Gaussian curvature means the surface is shaped like a
saddle as shown in this illustration. Mean curvature and a zero Gaussian value
means the surface is flat in at least one direction (planes, cylinders, and cones
have zero Gaussian curvature).
The curvature analysis tool ensures that your model stays within a specified
range. You can analyze the following on a point on a surface or curve:
NOTE Analysis tools only work in the 3D visual styles; they will not work in 2D.
Use the Draft Analysis Tool
Evaluates if a model has adequate space between a part and its mold.
If you are creating shapes or parts that need to be molded, the draft analysis
tool evaluates if their is adequate draft between a part and its mold (based on
the pull direction).
NOTE Analysis tools only work in the 3D visual styles; they will not work in 2D.
Modify 3D Models | 453
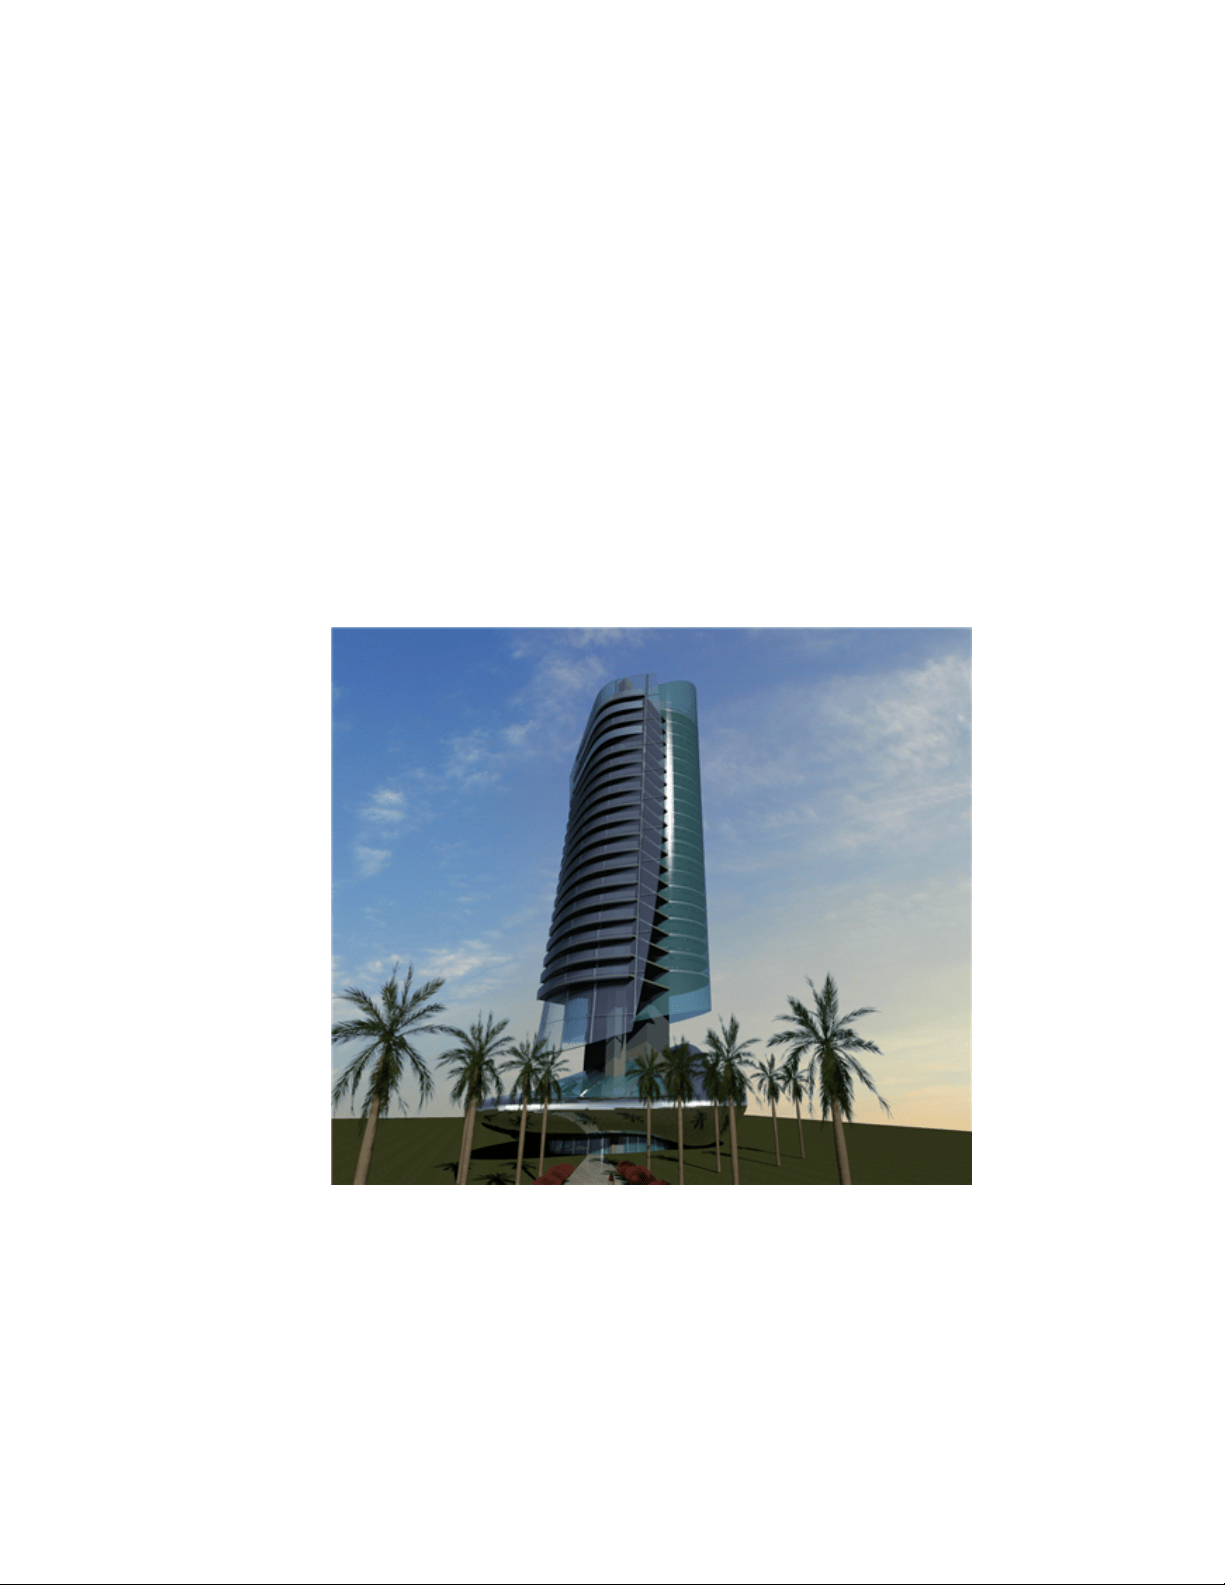
Modify Mesh Objects
Model mesh objects by changing smoothing levels, refining specific areas, or
adding creases.
Overview of Modifying Meshes
Modeling mesh objects differs from modeling 3D solids and surfaces in some
important ways.
Mesh objects do not have the mass and volume properties of 3D solids.
However, they do offer unique capabilities that enable you to design less
angular, more rounded models. Mesh objects are easier to mold and reshape
than their solid and surface counterparts.
454 | Chapter 8 Work with 3D Models
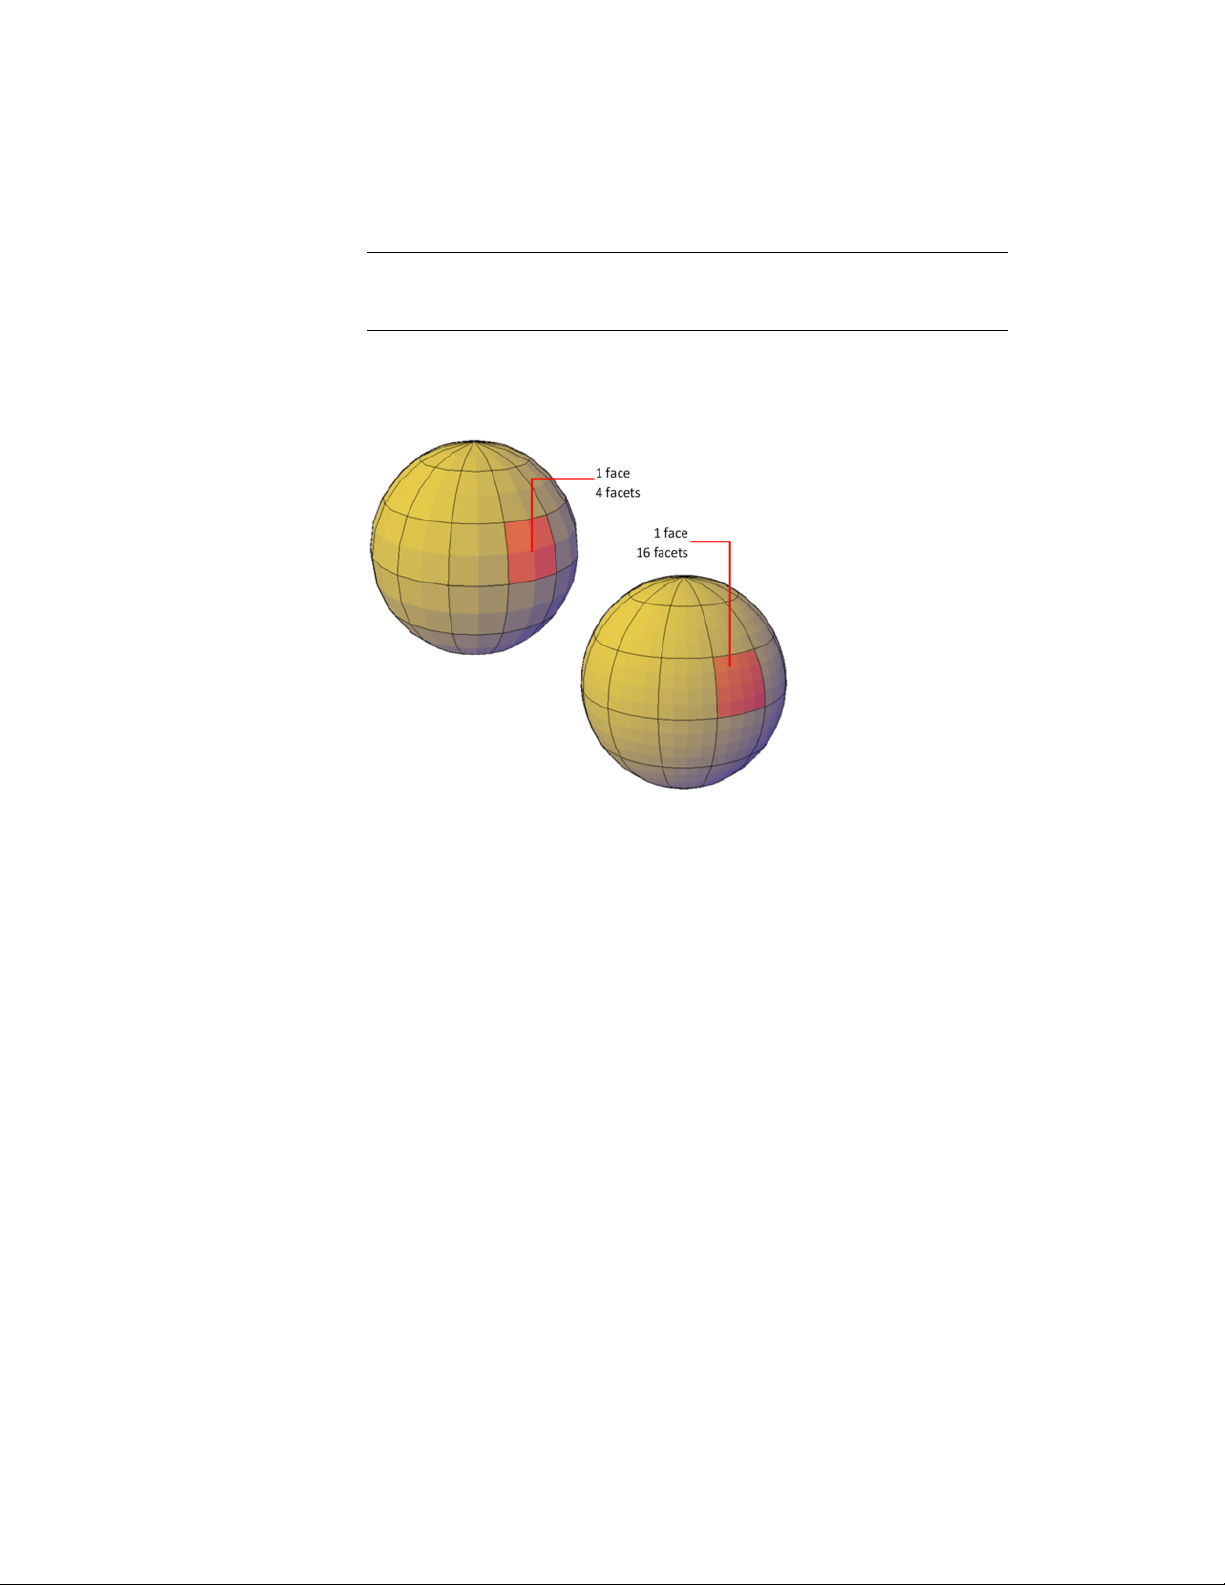
NOTE The capabilities described in this section apply only to mesh objects created
in AutoCAD 2010 and later. They cannot be used with legacy polyface or polygon
mesh.
About Mesh Faces
Mesh objects are composed of faces and facets.
Faces are non-overlapping units that—along with their edges and
vertices—form the basic editable units of a mesh object. When you move,
rotate, and scale individual mesh faces, surrounding faces are stretched and
deformed in order to avoid introducing gaps. When gaps occur, you can often
close them by smoothing the object or refining individual faces.
About Mesh Facets
Mesh faces have underlying structures, known as facets. The density of the
facet grid corresponds to the smoothness of the mesh. As the smoothness
level is increased, the density of the underlying facet grid also increases. When
you want to confine detailed mesh editing to a smaller area, you can convert
facets to editable faces by using refinement.
Unlike faces, facets cannot be individually modified. However, you can make
them more visible by modifying the VSLIGHTINGQUALITY system variable.
Modify 3D Models | 455

About Mesh Modeling
You can work with mesh objects in the following ways:
■ Add smoothness. Increase or decrease smoothness levels to round the
overall shape of the model. The underlying density of the mesh facet grid
increases as the mesh object smoothness level increases
(MESHSMOOTHMORE and MESHSMOOTHLESS).
■ Refine the object to reset the baseline smoothness level. Refine a
mesh object to convert the underlying facet grid to editable faces.
Refinement also resets the lowest level of smoothness that can be applied
to the object (MESHREFINE).
■ Refine a face. Restrict the refinement to a specific mesh face. This method
avoids resetting the smoothness baseline.
■ Crease an edge. Remove the smoothness from specified edges. You can
also remove an existing crease (MESHCREASE).
■ Split or merge faces.Divide an existing face into separate components
along a specified path. Merge two or more faces to create a single face
(MESHSPLIT and MESHMERGE).
■ Collapse vertices. Alter the mesh model by collapsing the vertices of
adjacent faces to a single point (MESHCOLLAPSE).
■ Spin edges.Spin the shared edge of adjacent triangular faces to alter the
shapes and orientation of the faces (MESHSPIN).
■ Extrude a face.Extend a specified face by extruding it into 3D space.
Unlike 3D solid extrusion, a mesh extrusion does not create a separate
object (MESHEXTRUDE).
■ Repair holes.Close a gap between faces by selecting the surrounding
edges. Holes in mesh objects can prevent you from converting a mesh
object to a solid object (MESHCAP).
Use Grip Editing with Mesh
Grips, as described in Use Grips to Edit 3D Solids and Surfaces (page 420), are
not available with meshes. However, you can manipulate the entire mesh
model or individual subobjects using the following methods:
■ Subobject selection and editing. Select faces, edges, and vertices the
same way you select 3D solid subobjects. Press and hold Ctrl while selecting
a subobject. The subobject highlighting indicates what is selected. Press
and hold Shift and click again to remove the selection from a subobject.
By turning on the Subobject Selection Filter, you can restrict selection to
456 | Chapter 8 Work with 3D Models

a specific subobject, which you can select without pressing and holding
Ctrl. See Use 3D Subobject Grips (page 418).
■ Gizmo editing.When you select a mesh object or subobject, the 3D Move,
Rotate, or Scale gizmo is displayed automatically. (You can set which gizmo
is displayed by default.) Use these gizmos to modify the selection uniformly,
or along a specified plane or axis. Form more information, see Use Gizmos
to Modify Objects (page 410).
Because dense meshes can be difficult to work with, you can change settings
to improve the display and behavior of grips.
■ Set the subobject selection filter to select only faces, edges, or
vertices: Set the DEFAULTGIZMO system variable or use the shortcut
menu.
■ Set whether a grip on a face, edge, or vertex is active
immediately when you select the subobject: Set the
GRIPSUBOBJMODE system variable.
See also:
Use Grips to Edit 3D Solids and Surfaces (page 420)
Use Gizmos to Modify Objects (page 410)
Change Mesh Smoothness Levels
Increase the roundness of mesh objects by increasing the smoothness levels.
Mesh objects are made up of multiple subdivisions, or tessellations, which
define the editable faces. Each face consists of underlying facets. When you
increase smoothness, you increase the number of facets to provide a smoother,
more rounded look.
Modify 3D Models | 457
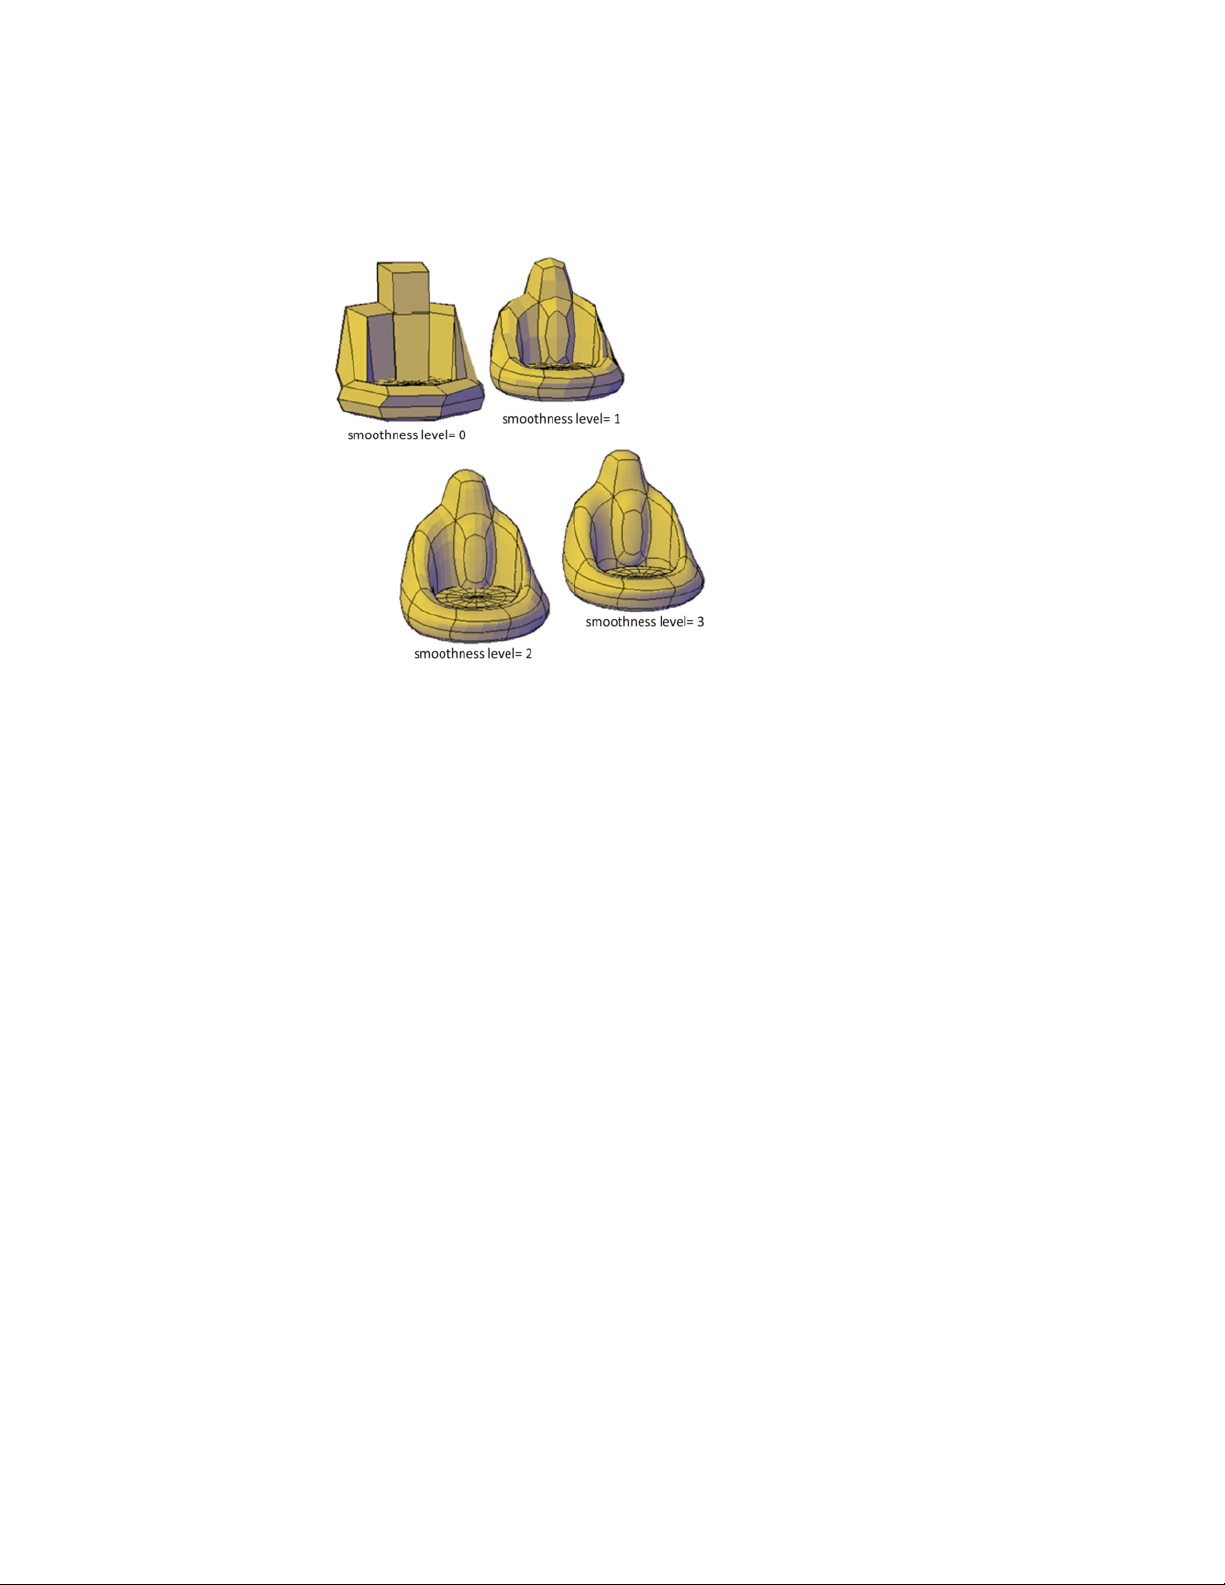
Increase or Decrease Smoothness
As you work, you can increase and decrease the level of smoothness. The
differences are apparent both in the wireframe and conceptual visual styles
and in the rendered output.
458 | Chapter 8 Work with 3D Models
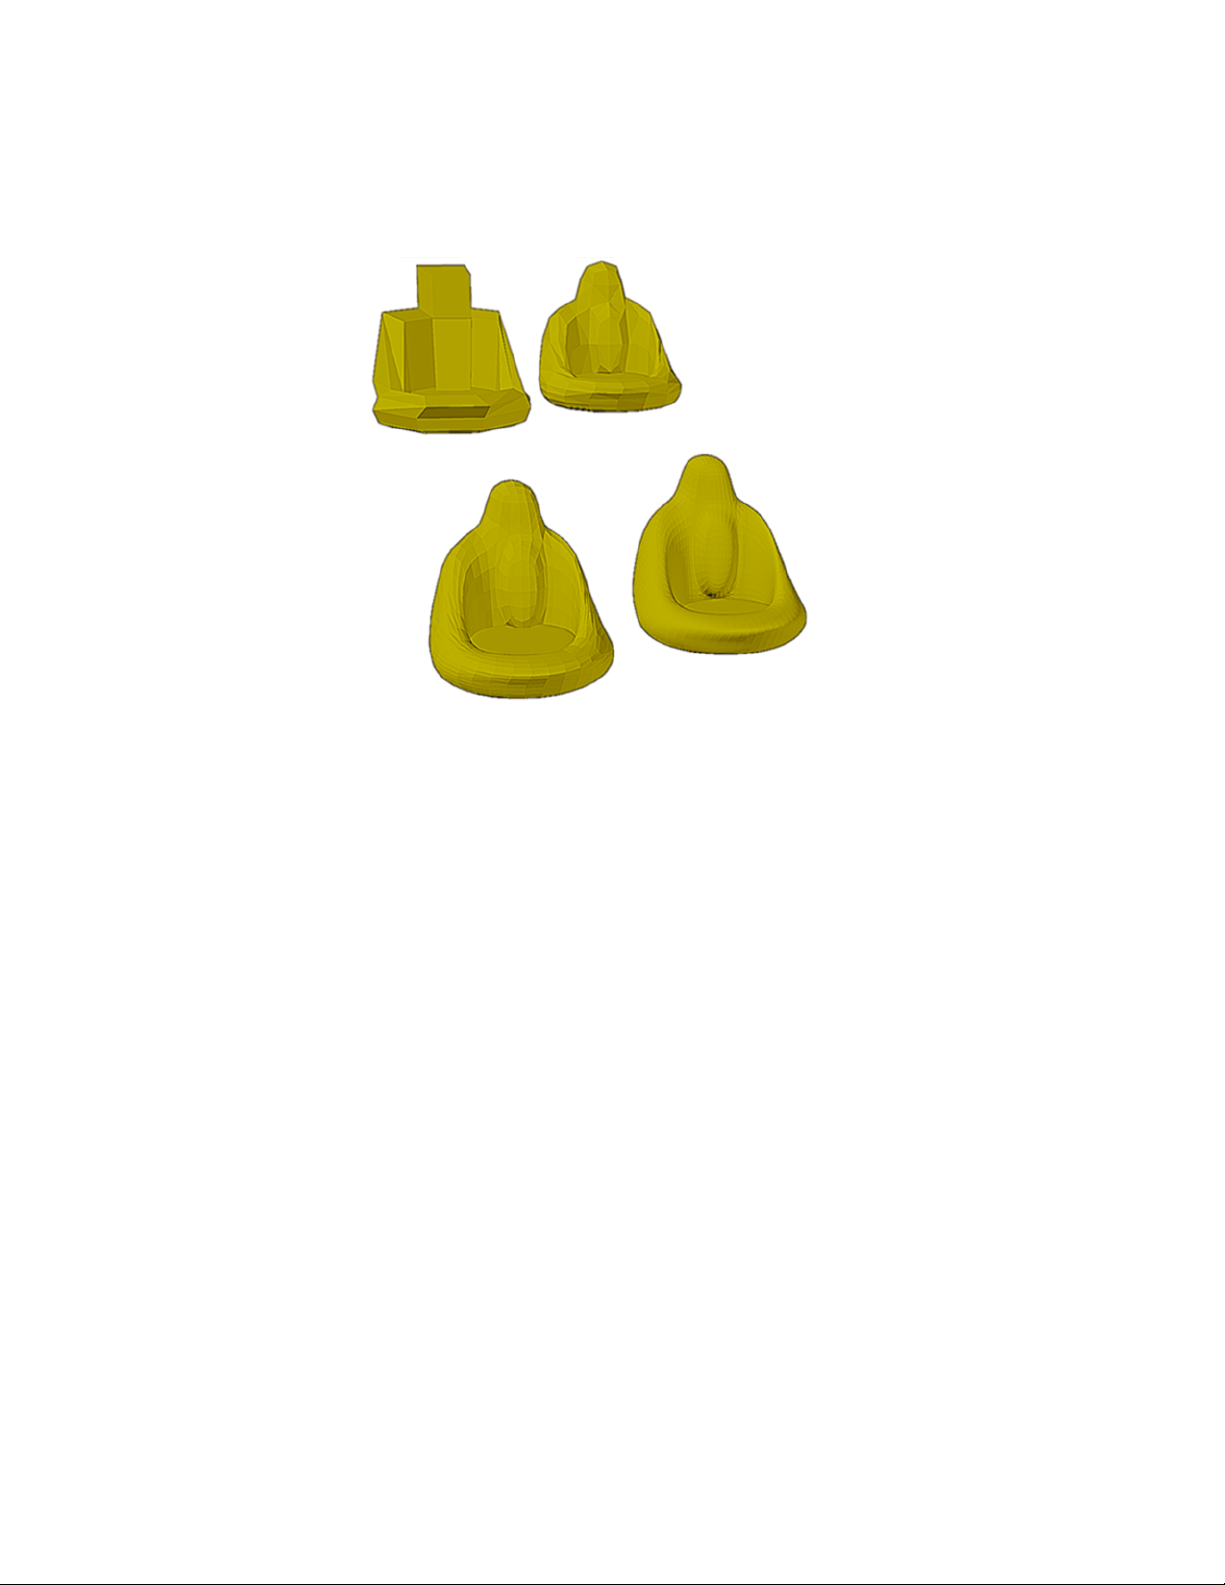
The lowest level of smoothness, or baseline, is 0. By default, Level 0 has no
smoothness. You can increase the smoothness of any mesh object up to the
current limits. However, you cannot decrease the smoothness of a mesh object
whose level of smoothness is zero.
If you have added creases to a mesh object, the effect of smoothing differs,
depending on the crease setting. The effect of creases added to mesh that has
no smoothness (Level 0) is not apparent until the mesh is smoothed.
As you edit an object using gizmos or grips, you might create gaps in the mesh
object. One way to close the gap is to smooth the object or refine individual
subobjects.
Limit Mesh Density
Mesh is created at the level of smoothness that you specify. The smoothness
can range from None (0), to the default maximum (6), or to a level that you
specify. As an object is smoothed, the density of the mesh facet grid also
increases. For best results, model mesh objects at lower smoothness levels and
increase the smoothness only after modeling is complete.
Modify 3D Models | 459

Dense meshes can result in subobjects that are difficult to select and edit. They
can also affect performance. Therefore you might want to set limits that
prevent the mesh from becoming too dense.
■ Maximum level of smoothness at which a grid is displayed
(SMOOTHMESHGRID). Displays the effects of modeling without the
complexity of the underlying facet grid. The default smoothness level is
3. The tessellation display becomes increasingly dense until the maximum
level is exceeded. Beyond that level, the display reverts to the most basic
level, even though the smoothing level can continue to increase.
■ Maximum number of faces in a drawing (SMOOTHMESHMAXFACE).
Sets the maximum number of mesh faces that are permitted per mesh
object.
■ Maximum level of smoothness (SMOOTHMESHMAXLEV). Sets the
maximum smoothness level permitted for mesh objects.
Refine Mesh Objects or Subobjects
Refine a mesh object or subobject to convert underlying facets to editable
faces.
You can refine any mesh that has a level of smoothness of 1 or higher.
Refine a Mesh Object and Reset the Baseline
Refining an object increases the number of editable faces by converting the
underlying facets to faces. The number of resulting faces depends on the
current level of smoothness. Higher smoothness levels result in a higher
number of faces after refinement.
460 | Chapter 8 Work with 3D Models
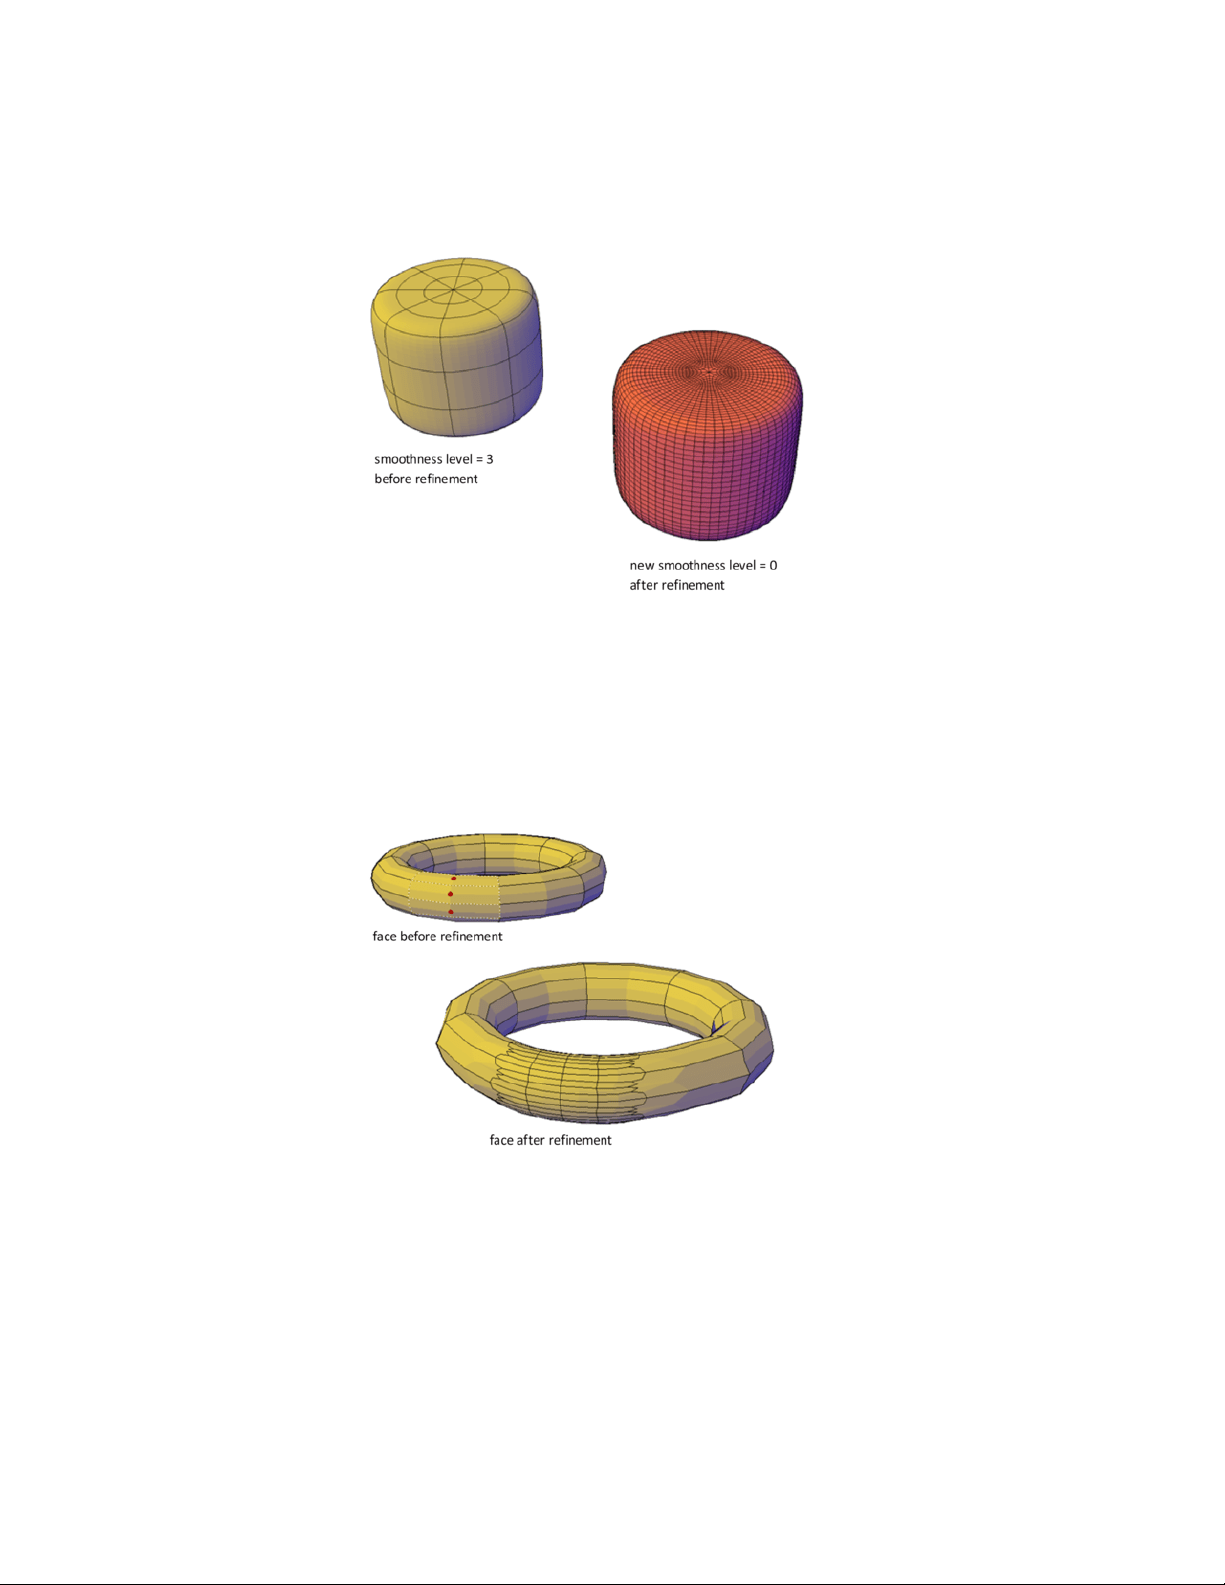
In addition to increasing the number of faces, refining a mesh object resets
its level of smoothness back to the baseline. Therefore, an object might appear
to be smoothed, but its smoothness level can still equal 0 (zero).
Refine a Mesh Face
You can refine an entire mesh object as shown in the previous illustration, or
select a specific face to refine. A refined face is subdivided into four faces and
the surrounding faces are deformed slightly to accommodate the change.
Refining a mesh face does not affect the overall smoothing level of the mesh
object. Unlike a refined mesh object, refined faces can be refined again
immediately. With mesh face refinement, you can target smaller areas for
detailed modeling.
Modify 3D Models | 461
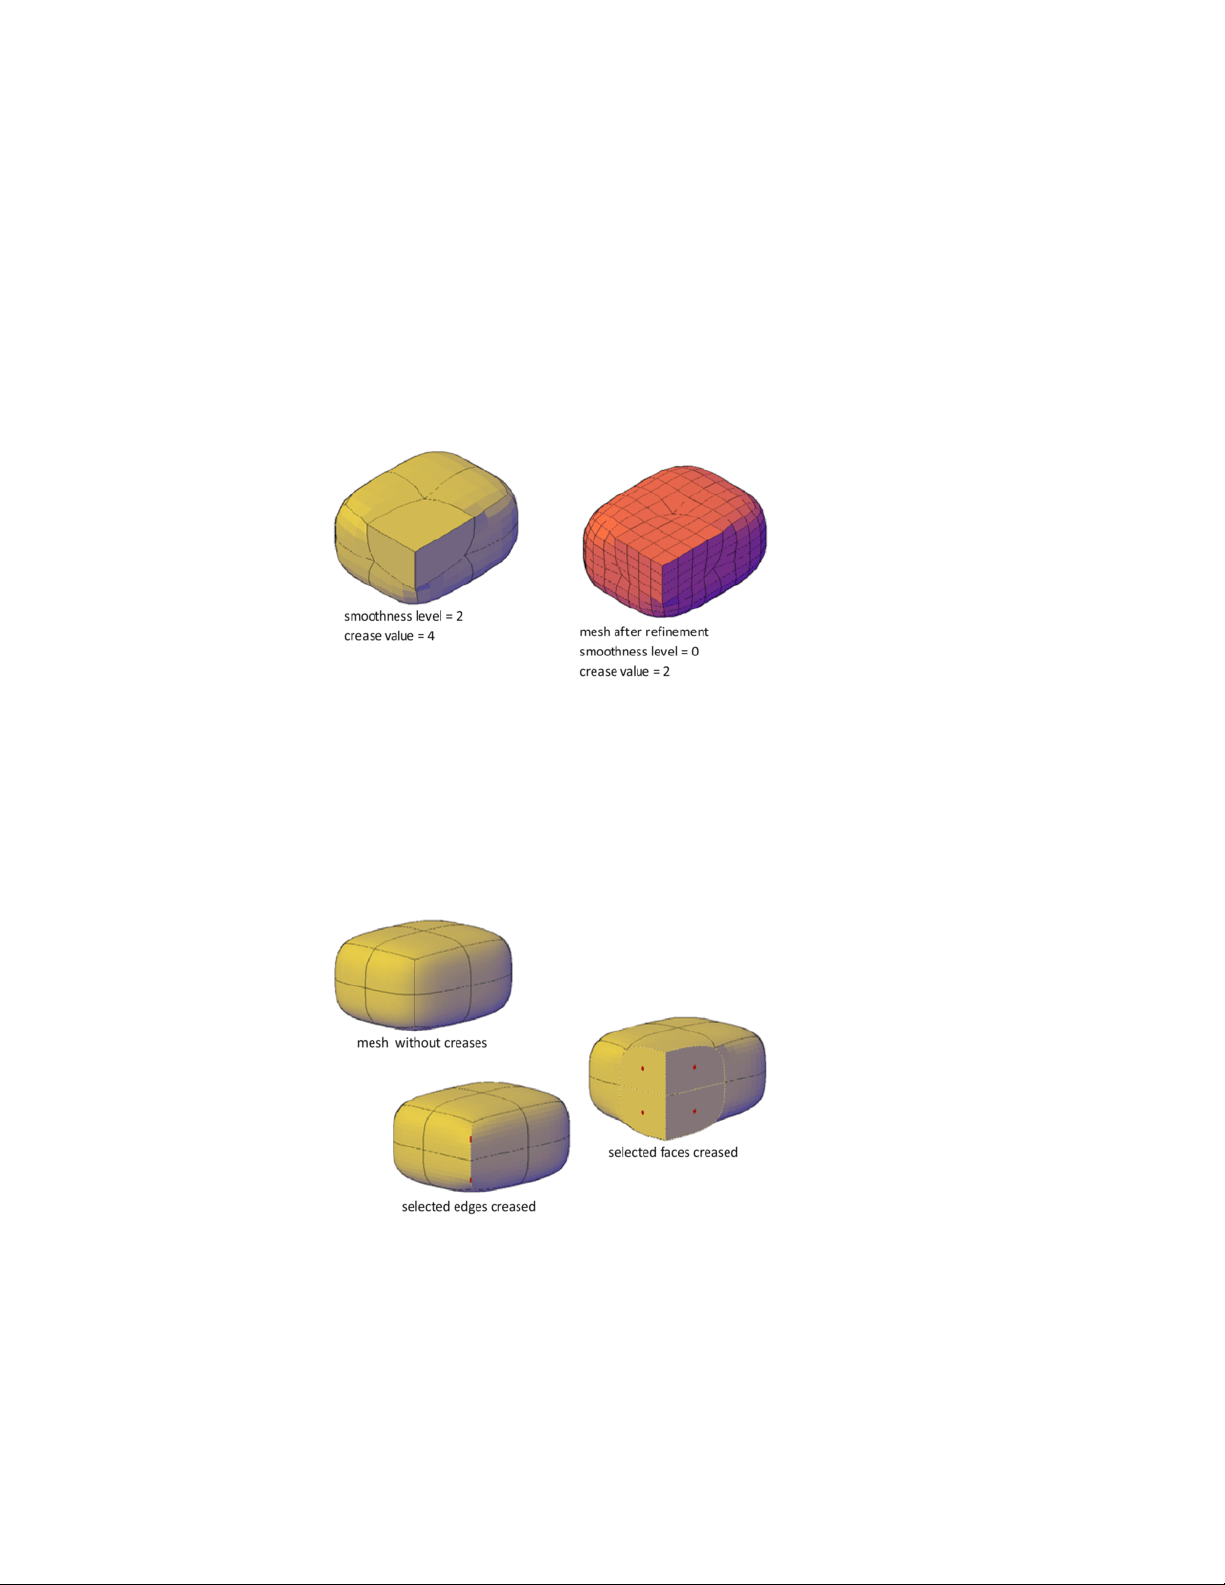
How Refinement Affects Creases
A crease that is set to Always retains its sharpness no matter how much you
smooth or refine the object. However, the behavior is different when you
assign a crease value. If you refine an object or edge that has a crease value,
the assigned crease value is lowered by the value of the original level of
smoothing. Suppose that you add a crease with a crease value of 4 and then
refine a mesh whose level of smoothness is 2. The new crease value is 2.
If a crease is applied before an object is smoothed or refined, the effect is not
apparent until after the object is smoothed or refined.
Add Creases to Mesh
Add creases to sharpen mesh edges.
You can add creases to mesh objects that have a smoothing level of 1 or higher.
462 | Chapter 8 Work with 3D Models

Add Creases to Different Subobjects
The result of creasing differs, depending on what type of subobject you select.
■ Edge. The selected edge is sharpened. The adjacent faces are deformed to
accommodate the new crease angle.
■ Face. The selected face is flattened and all edges that bound that face are
sharpened. Adjacent faces are deformed to accommodate the new shape
of the face.
■ Vertex. The point of the vertex and all intersecting edges are sharpened.
Adjacent faces are deformed to accommodate the new vertex angle.
Assign a Crease Value to the Edge
As you apply a crease, you set a crease value that determines how the crease
is affected by smoothing. A value of Always ensures that the crease is always
retained, even when the mesh is repeatedly smoothed. Higher crease values
ensure that the crease is retained through several smoothing processes. (During
smoothing, the assigned crease value is decreased by the value of the original
level of smoothing.)
You can add a crease to mesh that has not been smoothed. However, the effect
is not visible unless you smooth the object.
Remove a Crease
You can restore a crease to a smoothed state that corresponds to the smoothing
level for the object. If you remove a crease that is adjacent to other creased
subobjects, their contours are adjusted.
Modify Mesh Faces
Split, extrude, merge, collapse, or spin mesh faces to modify their shapes.
Split a Mesh Face
You can split a mesh face to make custom subdivisions. Use this method to
prevent deforming a larger area for small modifications.
Modify 3D Models | 463
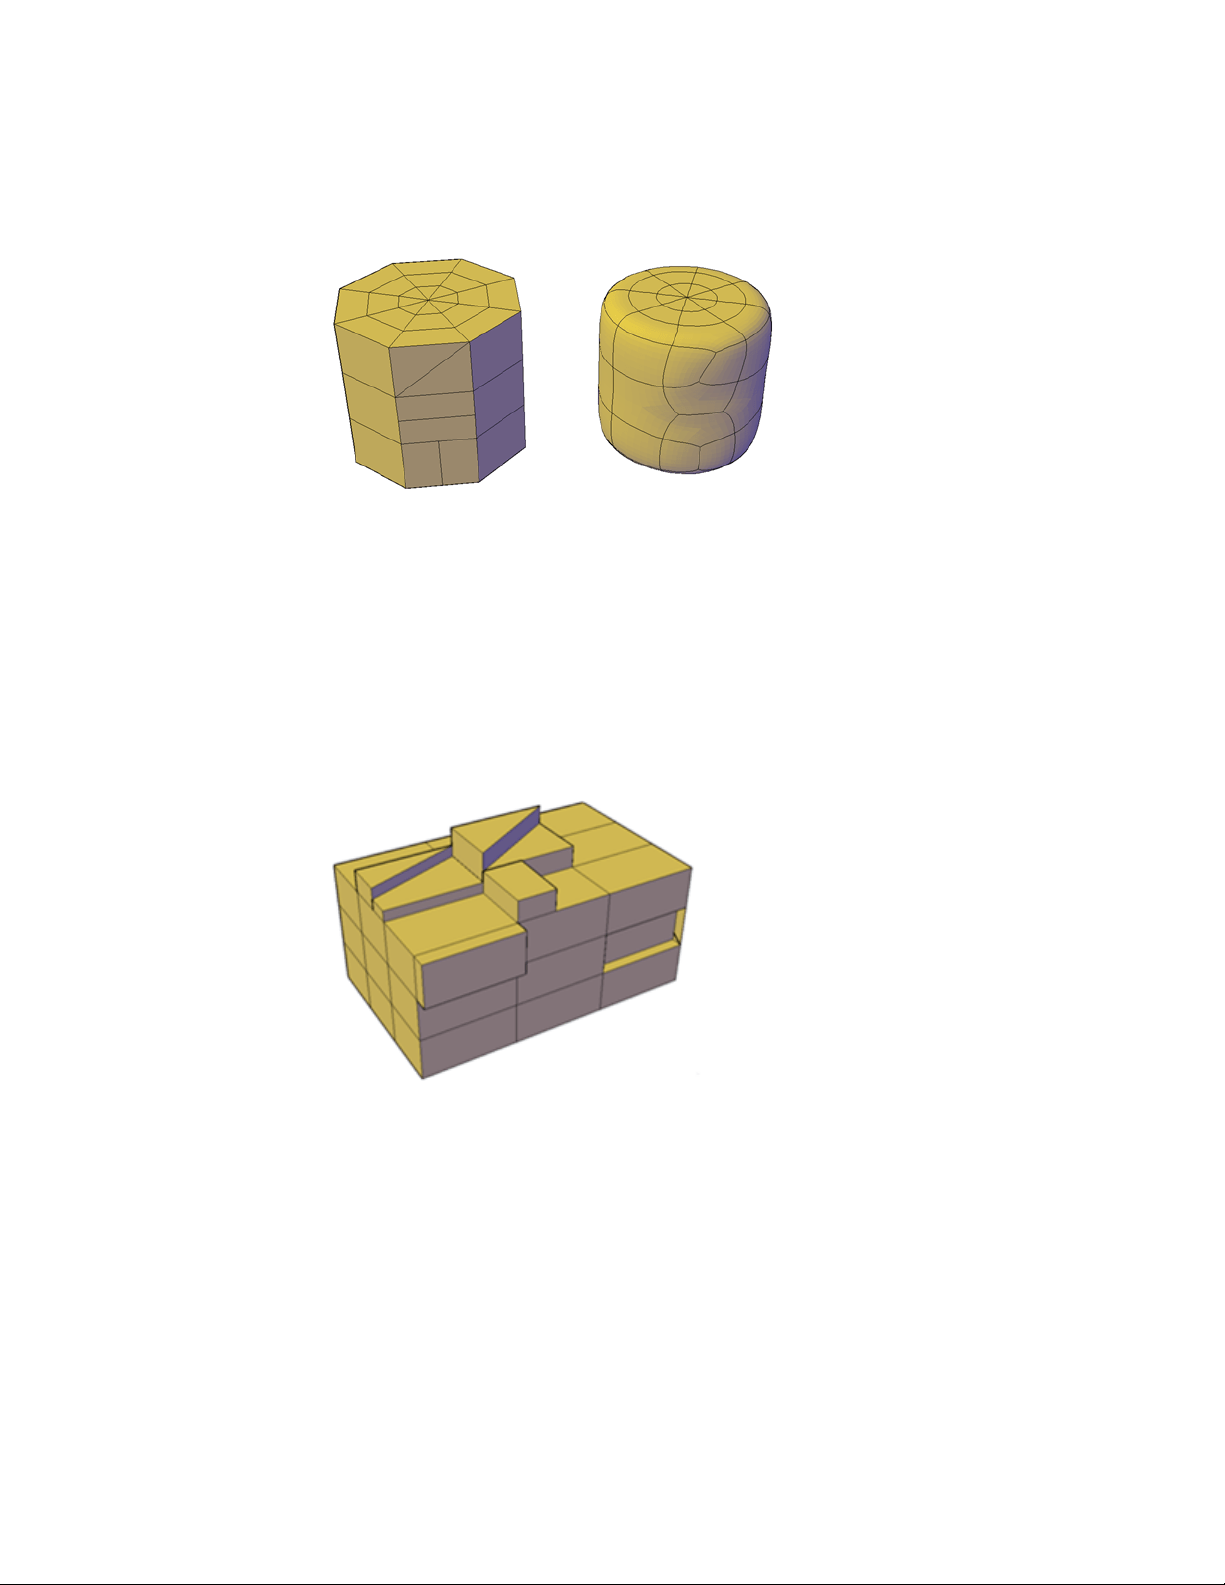
Because you specify the start point and end point of the split, this method
also gives you control over the shape of the two new faces. Use the Vertex
option to snap automatically to the vertices of the face. If you plan to split a
face to create—and then spin the edge of—two triangular faces (MESHSPIN),
use the Vertex option to ensure precision.
Extrude Mesh Faces
You can add definition to a 3D object by extruding a mesh face. Extruding
other types of objects creates a separate 3D solid object. However extruding
a mesh face extends, or deforms, the existing object and subdivides the
extruded face.
You can use the same methods for extrusion of the faces of 3D solids and
meshes as you use for other types of objects. For example, you can specify an
extrusion direction, a path, or a taper angle. However, when you extrude mesh
faces, the MESHEXTRUDE command provides an option that sets whether
adjacent faces are extruded individually or whether their shared edges remained
joined.
464 | Chapter 8 Work with 3D Models
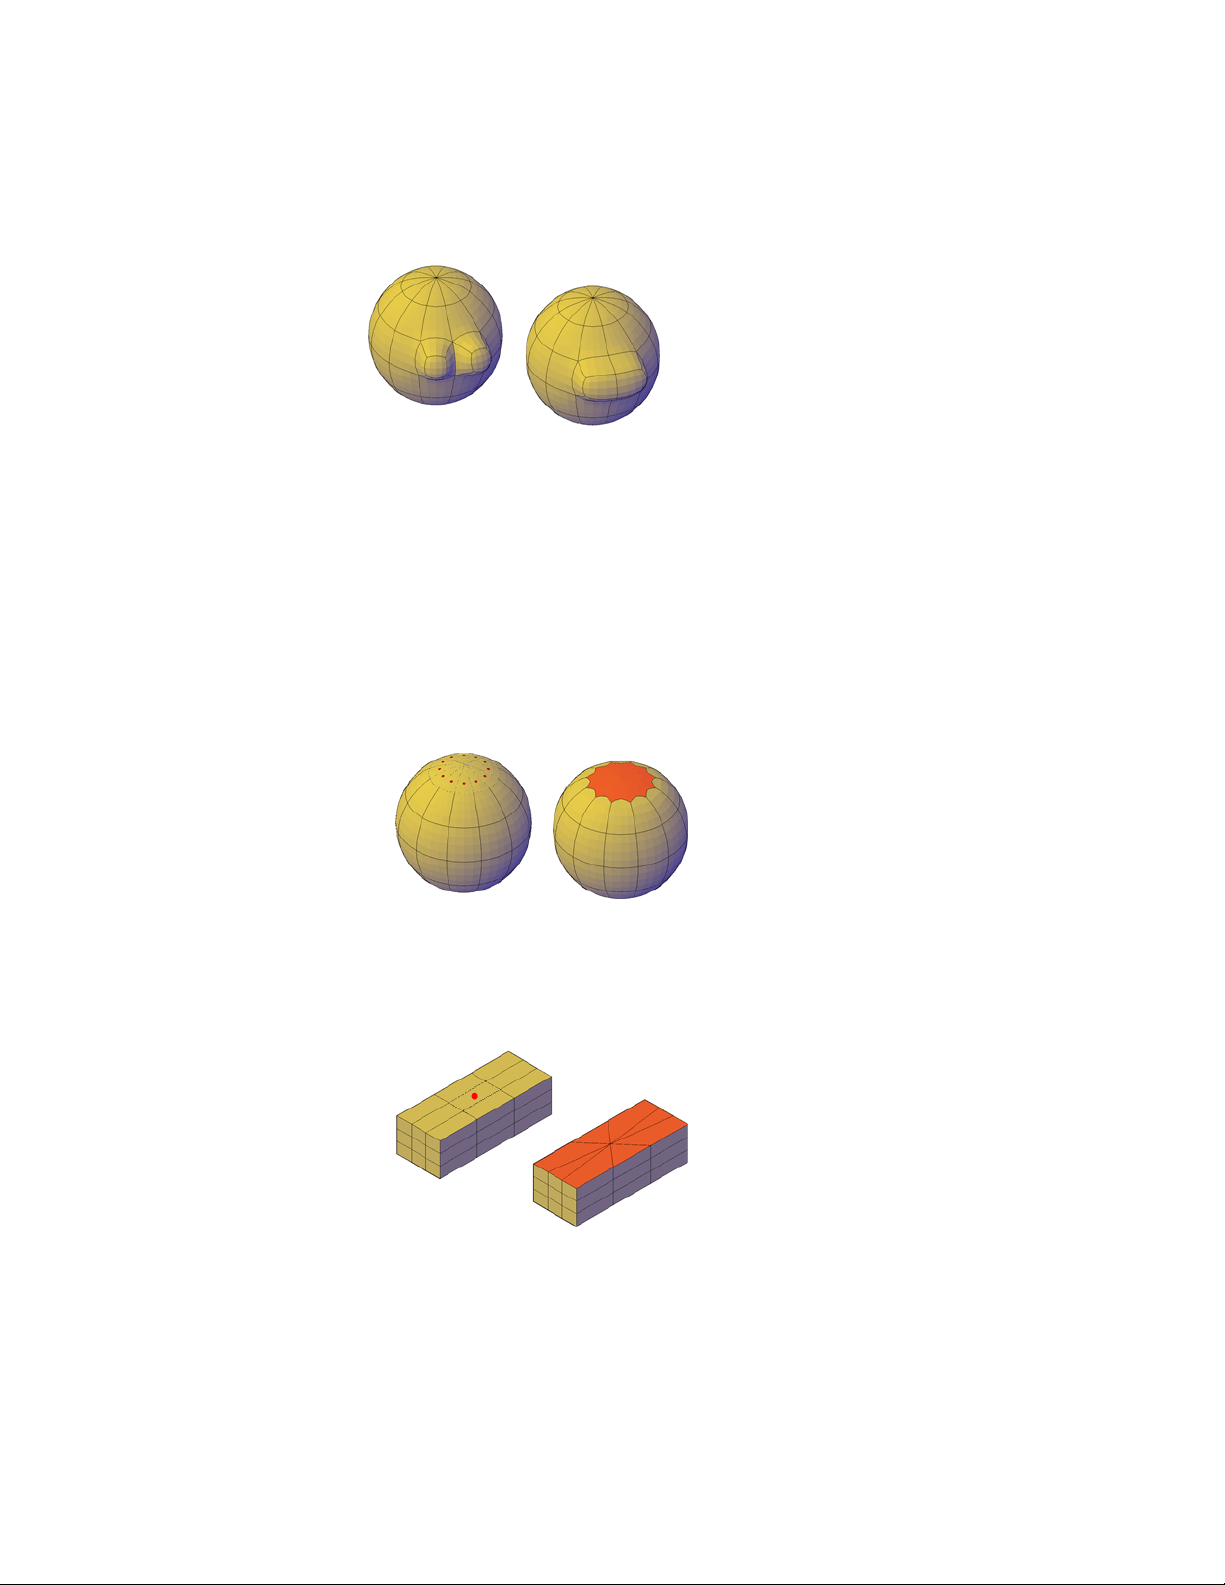
You cannot create joined extrusions for mesh faces in which only the vertices
are shared.
For more information about extrusion, see Create a Solid or Surface by Extrud-
ing (page 346).
Reconfigure Adjacent Mesh Faces
You can extend your editing options by reconfiguring adjacent faces. Several
options are available:
■ Merge adjacent faces. Combine adjacent faces to form a single face.
Merging works best with faces that are on the same plane.
Although you can merge faces that wrap a corner, additional modifications
to the resulting mesh object can have unexpected results.
■ Collapse the mesh vertices. Merge adjacent vertices of surrounding
faces form a single point. The selected face is removed.
Modify 3D Models | 465
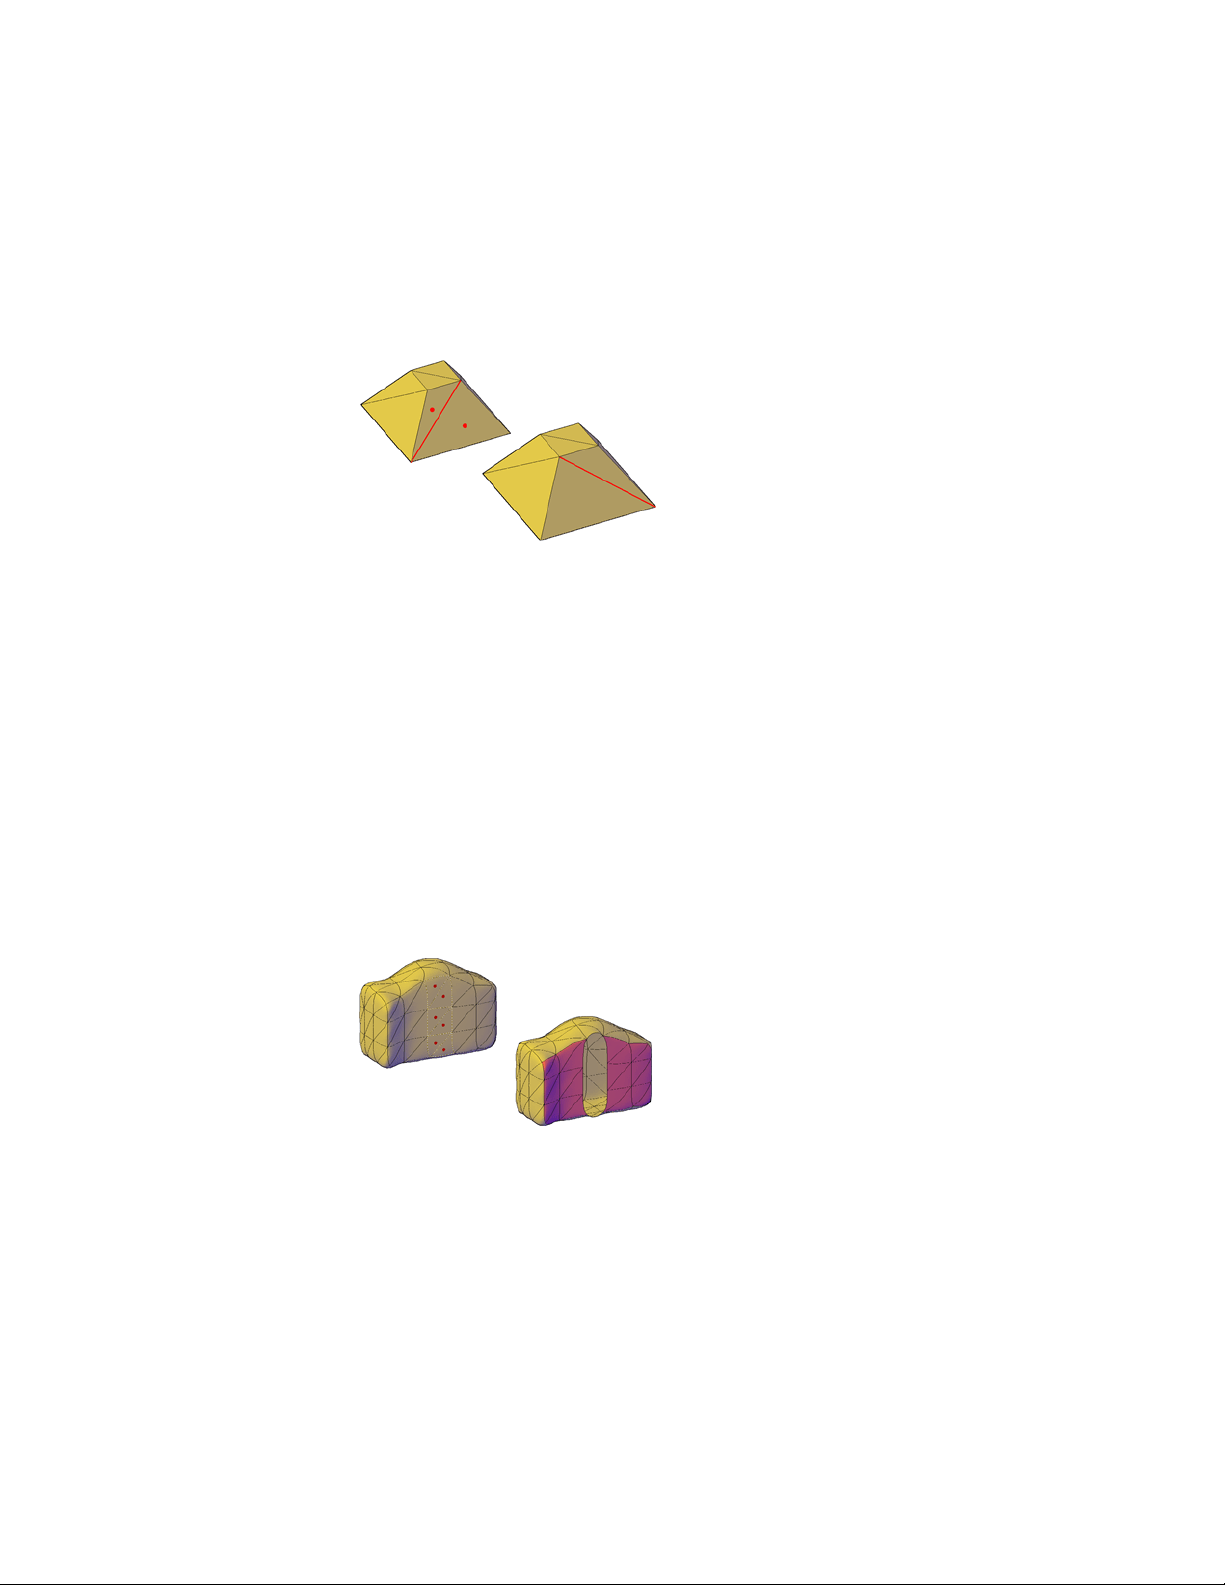
■ Spin edges of triangular faces. Rotate an edge that is shared by two
triangular faces. The shared edge spins to extend from the opposite vertices.
This activity works best when the adjoined triangles form a rectangular,
not a triangular, shape.
See also:
Tips for Working with Mesh (page 468)
Create a Solid or Surface by Extruding (page 346)
Create and Close Mesh Gaps
Delete mesh faces or close gaps in mesh objects.
Remove Mesh Faces
You can press Delete or use the ERASE command to remove mesh faces. The
removal leaves a gap in the mesh.
■ Deleting a face removes only the face.
■ Deleting an edge removes each adjacent face.
466 | Chapter 8 Work with 3D Models
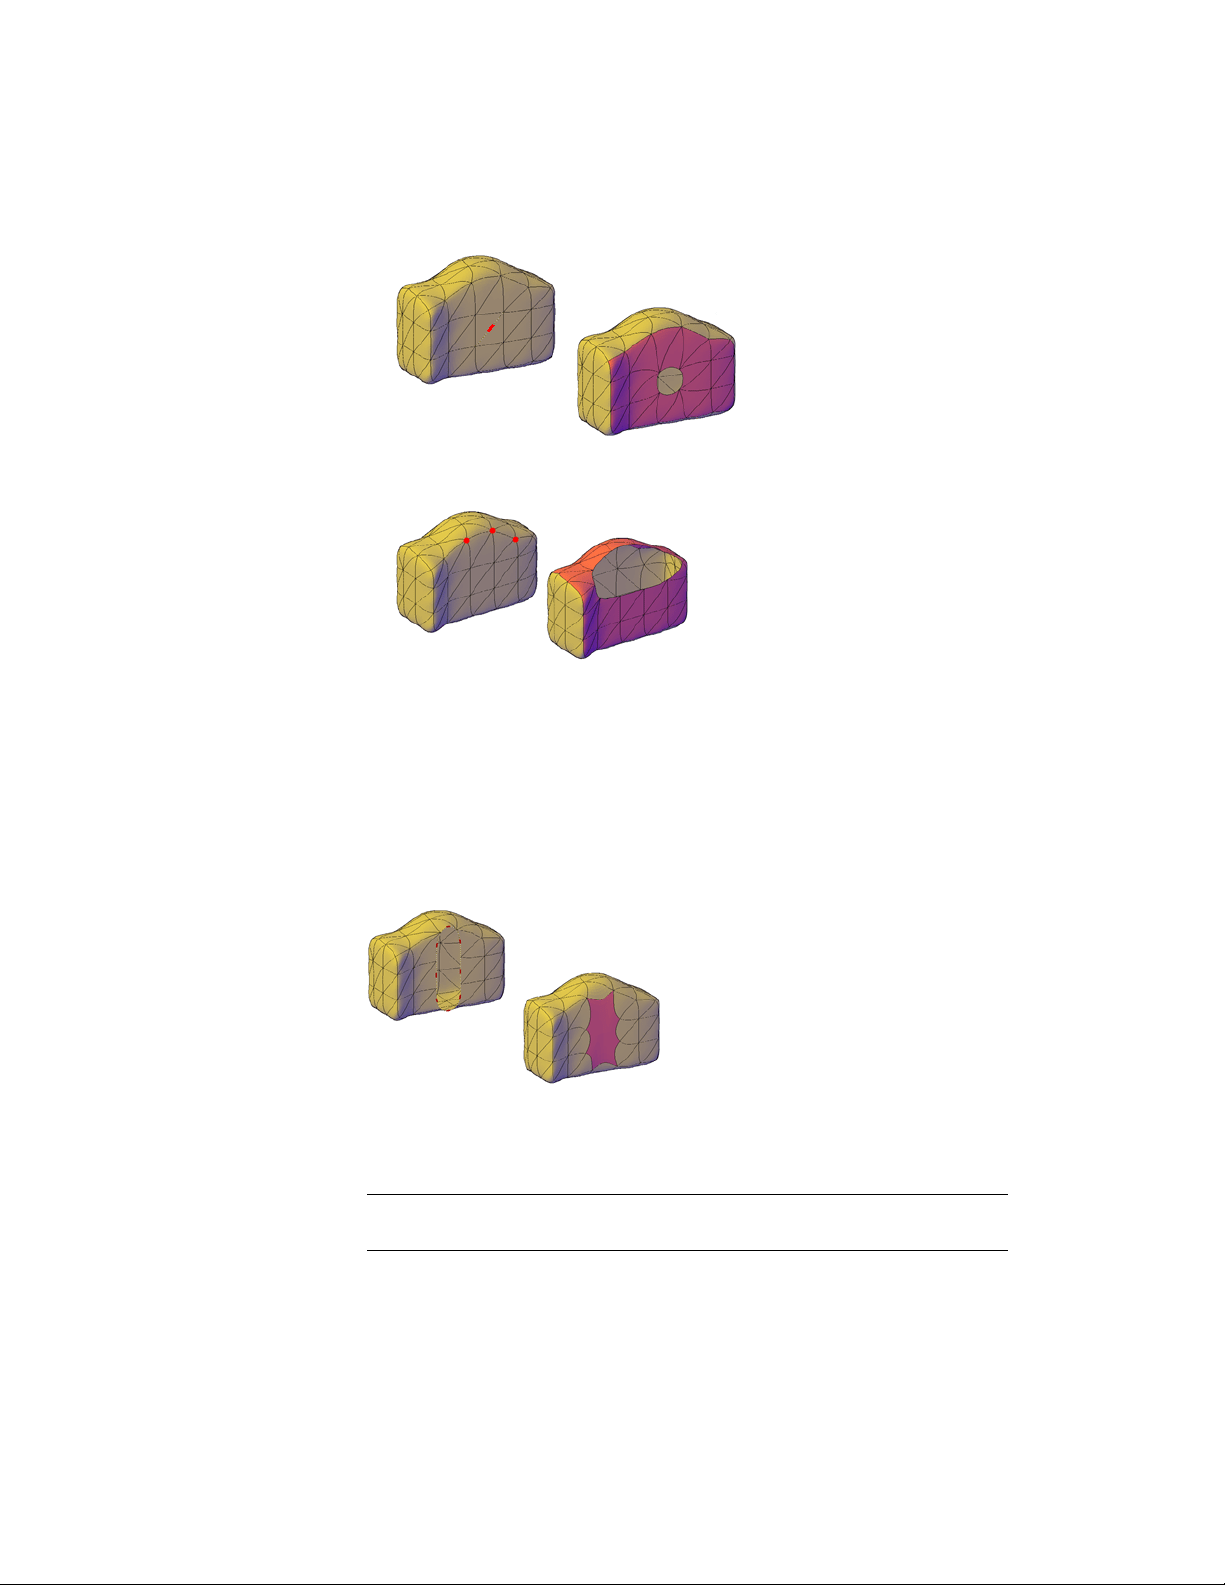
■ Deleting a vertex removes all faces that are shared by the vertex.
If removal of a mesh face creates a gap, the mesh object is not “watertight.”
It can be converted to a surface object, but not to a 3D solid object.
Close Gaps in Mesh Objects
If a mesh object is not watertight due to gaps, or holes, in the mesh, you can
make it watertight by closing the holes. The cap, or new face, spans the
boundary formed by the mesh edges that you specify (MESHCAP).
This process works best when all edges are on the same plane. The edges you
select as boundaries cannot be shared by two faces. For example, you cannot
close the center hole in a mesh torus.
NOTE You can sometimes close gaps in mesh by smoothing the object, by using
MESHCOLLAPSE, or by splitting adjacent faces (MESHSPLIT).
Modify 3D Models | 467
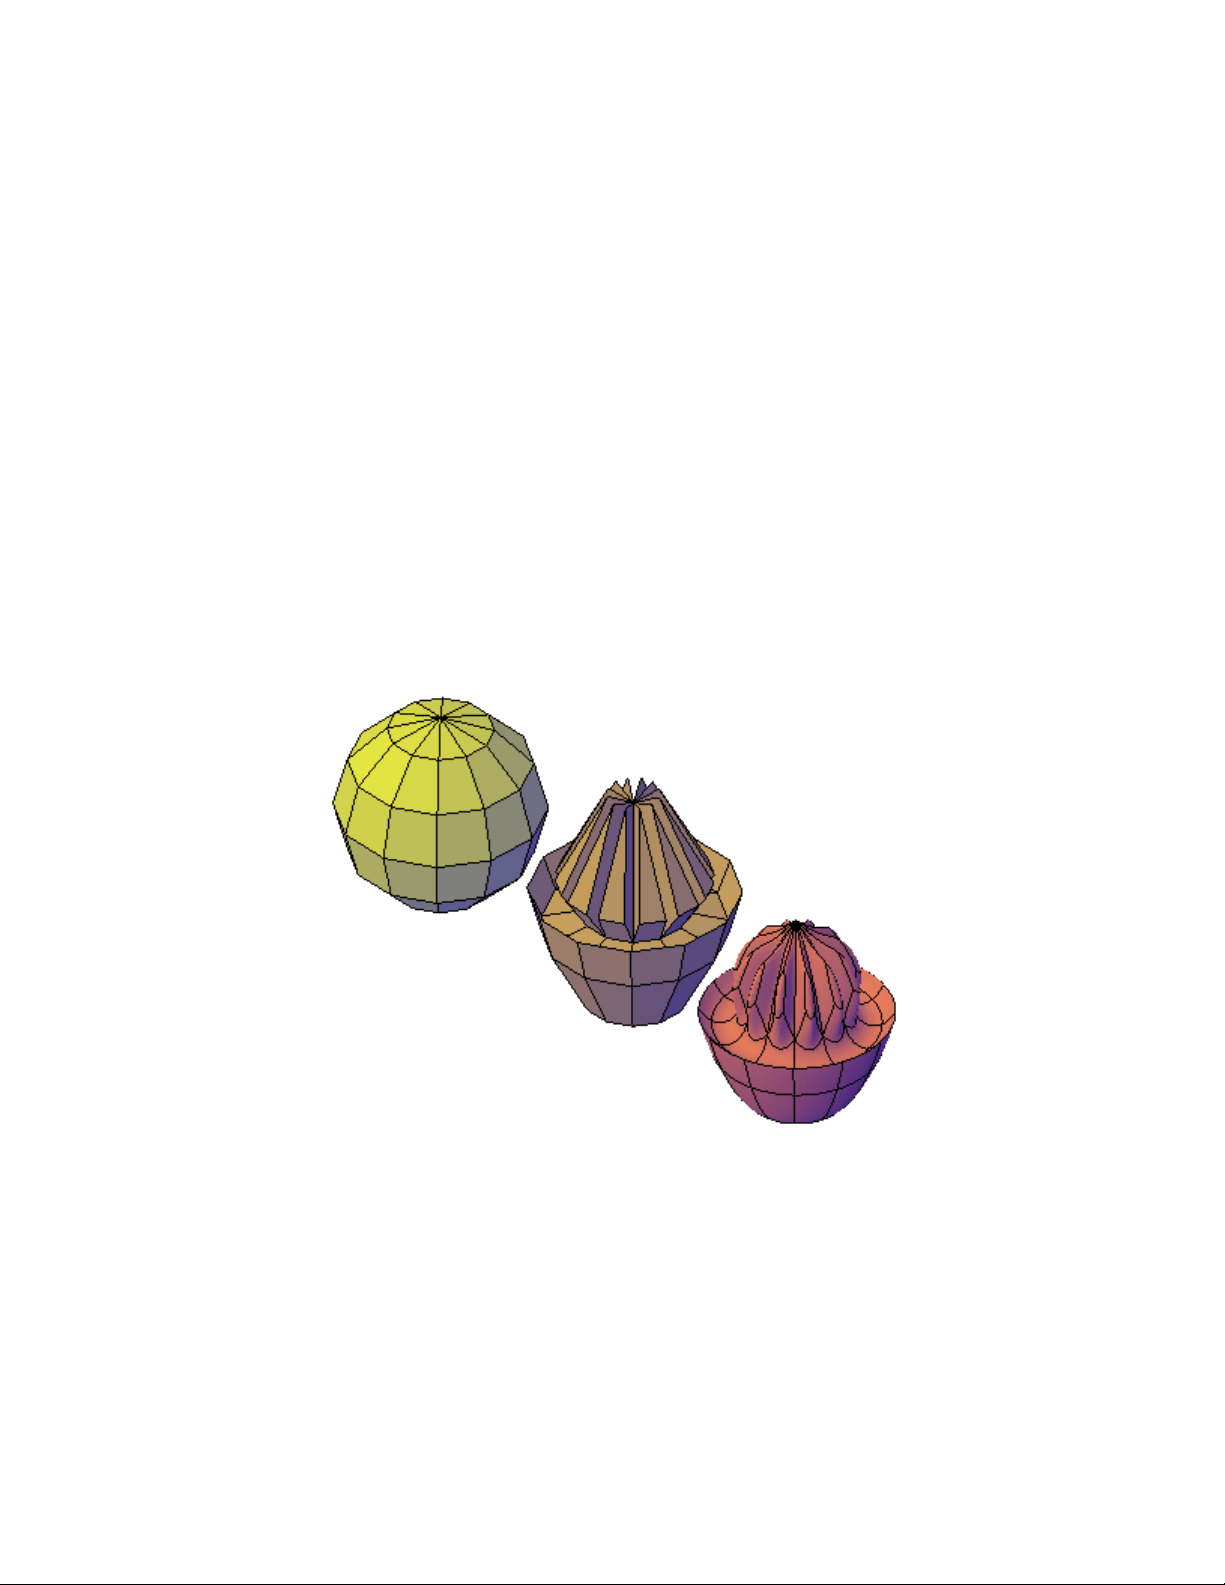
See also:
Tips for Working with Mesh (page 468)
Tips for Working with Mesh
Learn some best practices for working with mesh models.
Mesh, with its enhanced modeling capabilities, offers a way to create more
fluid, free-form designs. Keep these tips in mind as you work.
Mesh smoothing
Mesh modeling is a powerful way to design, but higher levels of smoothness
increase complexity and can affect performance. You can work more efficiently
if you complete editing operations such as gizmo editing, extrusion, and face
splitting, on mesh objects that have not been smoothed. (That is, their level
of smoothness is 0.)
Mesh sphere modeled by grip editing and extrusion, then smoothed.
You can quickly switch between the levels of smoothness in the Properties
Inspector to get a preview of how your activities affect the smoothed object.
468 | Chapter 8 Work with 3D Models
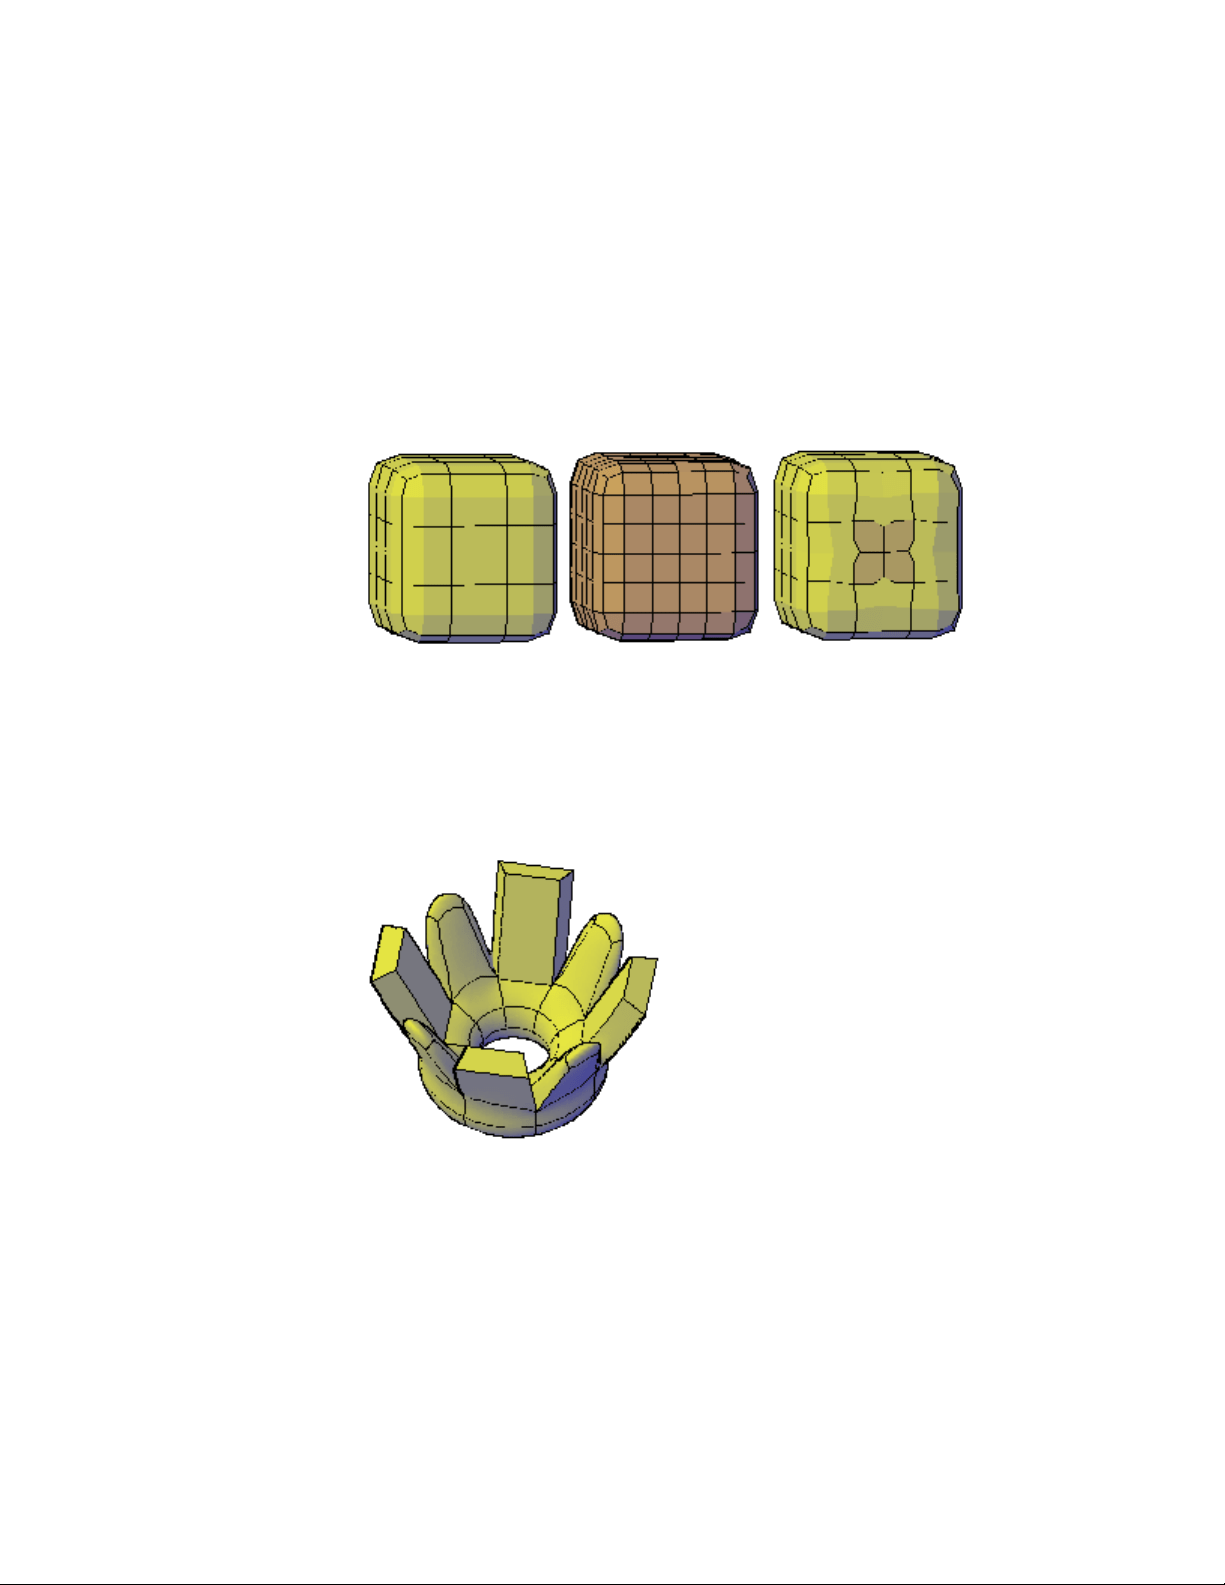
Refine or split a face instead of refining the entire object
Refinement is a powerful way to subdivide faces. However, by increasing the
number of faces, you add to the overall complexity of the model. In addition,
refining an entire mesh object resets the base level of smoothness to 0. This
change can result in a dense grid that can no longer be simplified. For best
results, avoid refining the object, and refine or split only the individual faces
that require more detailed modeling.
mesh box, refined mesh box, and mesh box with one face refined
Refining individual faces does not reset the level of smoothness for the object.
Crease edges to help limit distortion when the object is smoothed
Creased edges can be set to maintain their sharpness, no matter how much
the object is smoothed. You may also need to crease the edges in surrounding
faces to obtain the result you want.
extruded faces on mesh torus, creased and not creased
Creasing set to Always retains its sharpness after smoothing. If you set a crease
value, the creased edge becomes smoother at the equivalent level of
smoothness.
Modify 3D Models | 469
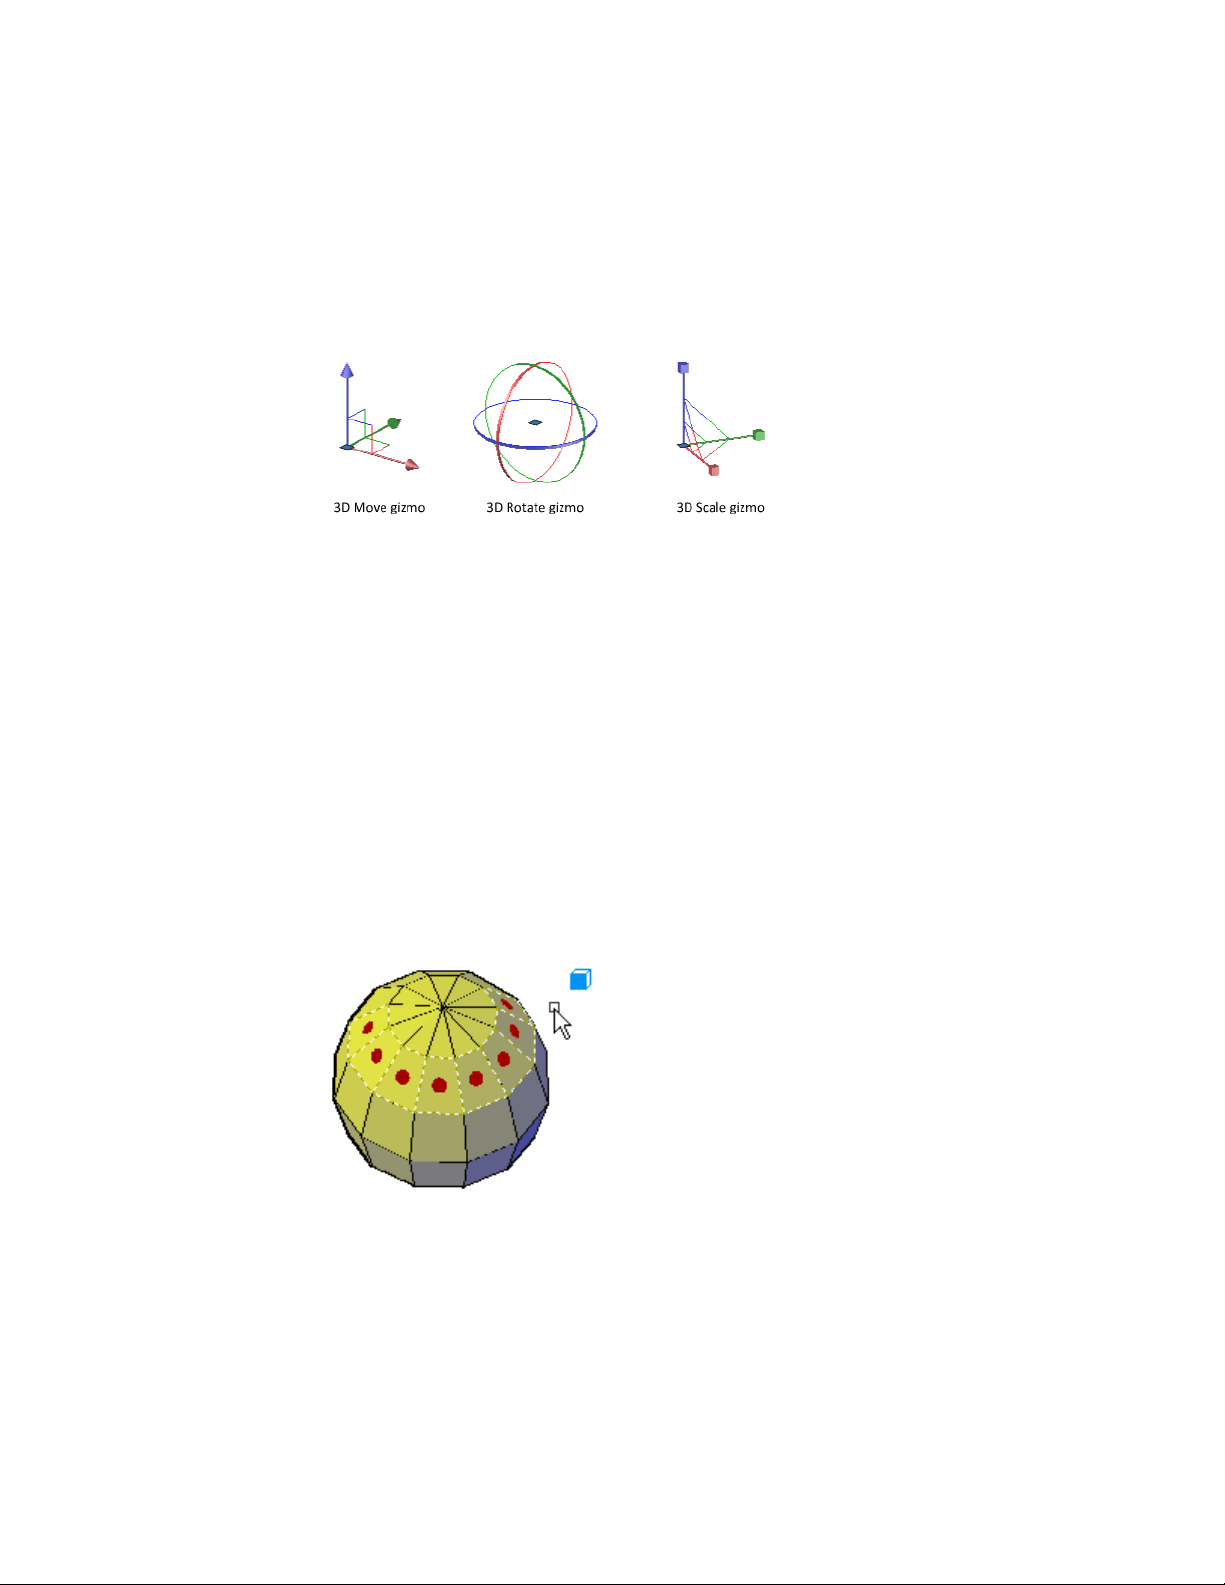
Use gizmos to model faces, edges, and vertices
3D Move, 3D Rotate, and 3D Scale gizmos can be used to modify entire mesh
objects, or specific subobjects.
For example, you can rotate and scale an individual face using the 3D Move,
Rotate, and Scale gizmos.
By constraining the modifications to a specified axis or plane, gizmos help
you avoid unexpected results. The default gizmo is displayed whenever you
select an object in a view that uses a 3D visual style. (You can also suppress
this display.) Therefore, you do not have to explicitly start the 3D Move, 3D
Rotate, or 3D Scale command to initiate these activities. You just need to select
an object.
When a gizmo is selected, you can use the shortcut menu to switch to a
different type of gizmo.
Use subobject selection filters to narrow the available selection candidates
In a smoothed mesh, trying to select a specific subject can be difficult unless
you turn on subobject selection (shortcut menu). By specifying that the
selection set is limited to faces, edges, vertices, or even solid history subobjects,
you can restrict which subobject type is available for selection.
Mesh faces selected when the face subobject selection filter is on.
470 | Chapter 8 Work with 3D Models
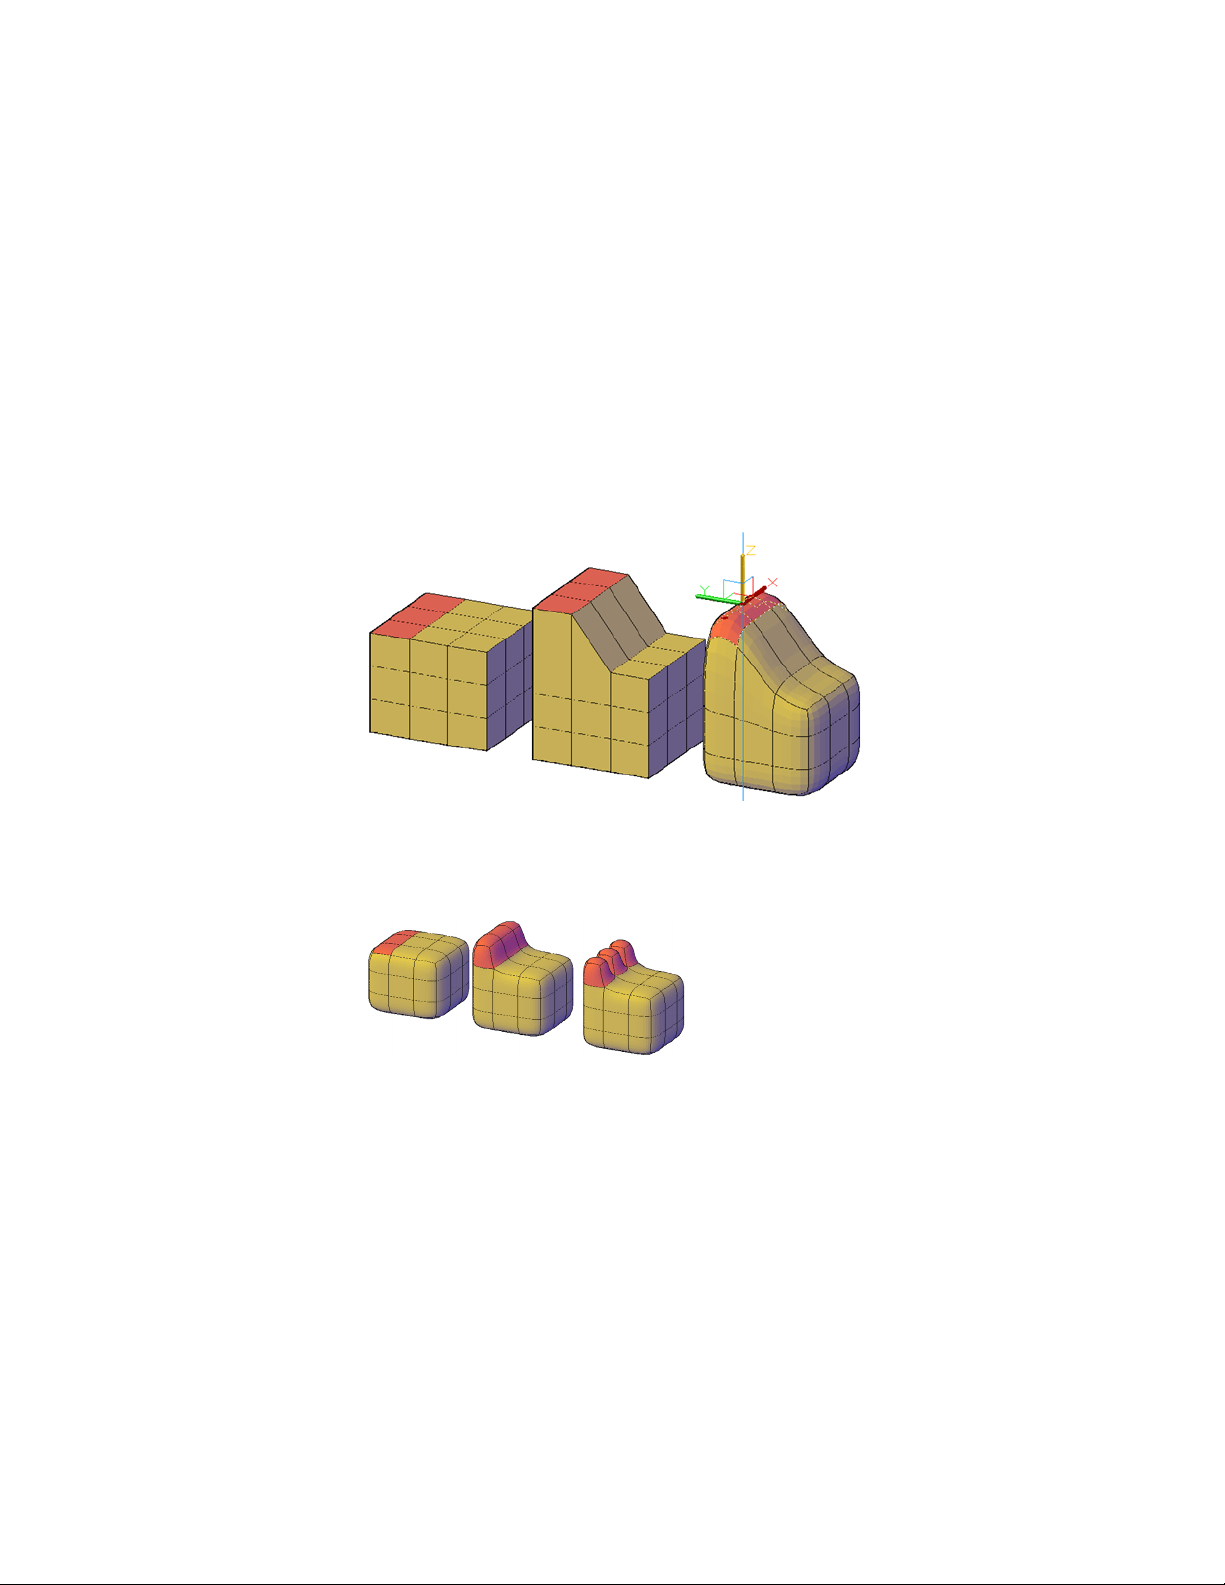
A filter is especially valuable for selecting mesh vertices, which are not
highlighted as you move the mouse over them.
In order to select the entire mesh object, you need to turn off the subselection
filters.
Model by extruding faces
A key difference between gizmo editing and extrusion occurs in the way each
face is modified. With gizmo editing, if you select and drag a set of faces,
adjacent faces are stretched to accommodate the modification. When the
object is smoothed, the adjacent faces adapt to the new location of the face.
Mesh faces extended using 3D Move gizmo.
Mesh extrusion, however, inserts additional faces to close the gap between
the extruded face and its original surface. With mesh extrusion, you can set
whether adjacent faces are extruded as a unit (joined) or separately (unjoined).
Mesh faces extruded, then smoothed.
If you are working on an object that has not been smoothed, try smoothing
it periodically to see how the extrusion is affected by smoothing.
Convert between mesh and 3D solids or surfaces
Mesh modeling is powerful, but it cannot do everything that solid modeling
can do. If you need to edit mesh objects through intersection, subtraction, or
Modify 3D Models | 471
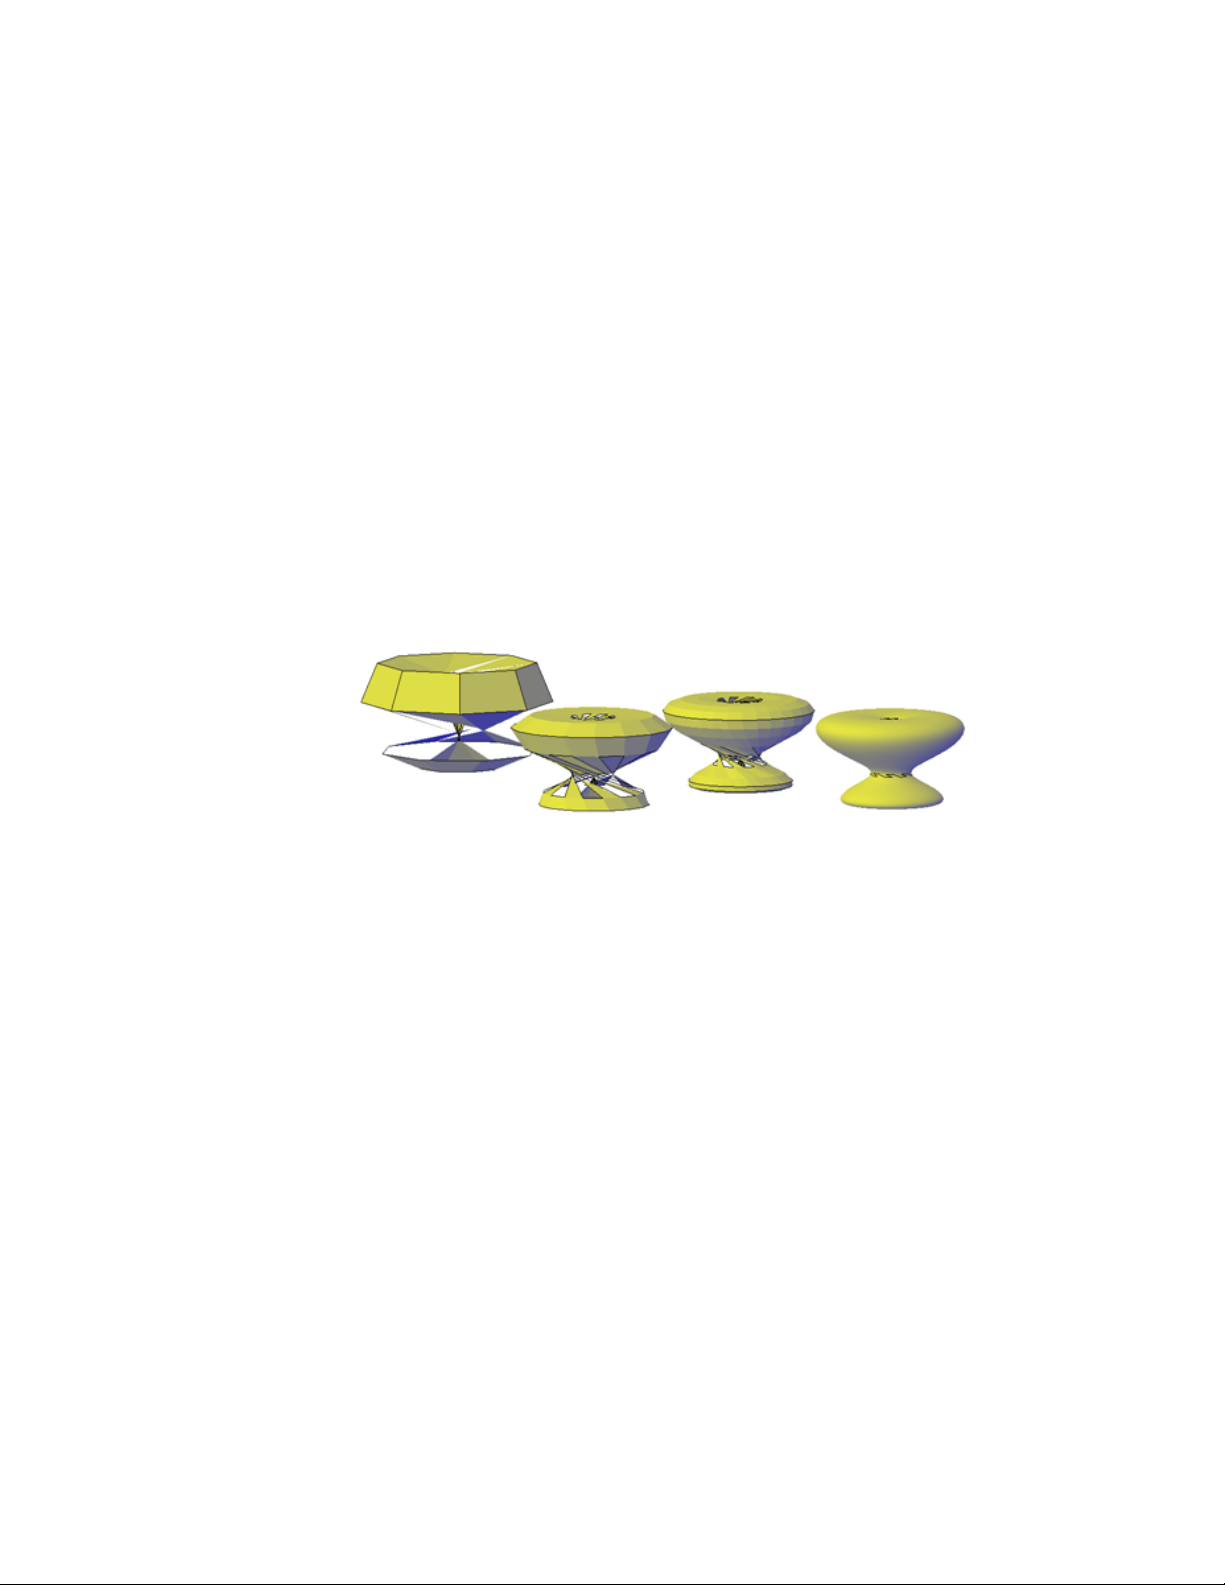
union, you can convert mesh to 3D solid or surface objects. Similarly, if you
need to apply creasing or smoothing to 3D solid or surface objects, you can
convert those objects to mesh.
Keep in mind that not all conversions retain complete fidelity to the shape
of the original object. Avoid switching between object types more than once,
if possible. If you notice that the conversion modifies the shape of the object
in an unacceptable way, undo the conversion and try again with different
settings.
The SMOOTHMESHCONVERT system variable sets whether the mesh objects
that you convert to 3D solids or surfaces are smoothed or faceted, and whether
their co-planar faces are optimized (merged).
You might have trouble converting some non-primitive mesh to solid objects
due to the following problems:
■ Gaps in the mesh. If you notice gaps, you can sometimes close them by
smoothing the object or by refining the faces that are adjacent to the gap.
Mesh torus that has been twisted using 3D Rotate at various smoothing levels.
You can also close holes by using MESHCAP.
■ Intersecting mesh faces. Be especially careful not to create
self-intersections as you move, rotate, or scale subobjects. (You create
self-intersections when you cause one or more faces to cross, or intersect
other faces in the same mesh model.) View the object from all viewpoints
to ensure you create a viable model.
472 | Chapter 8 Work with 3D Models
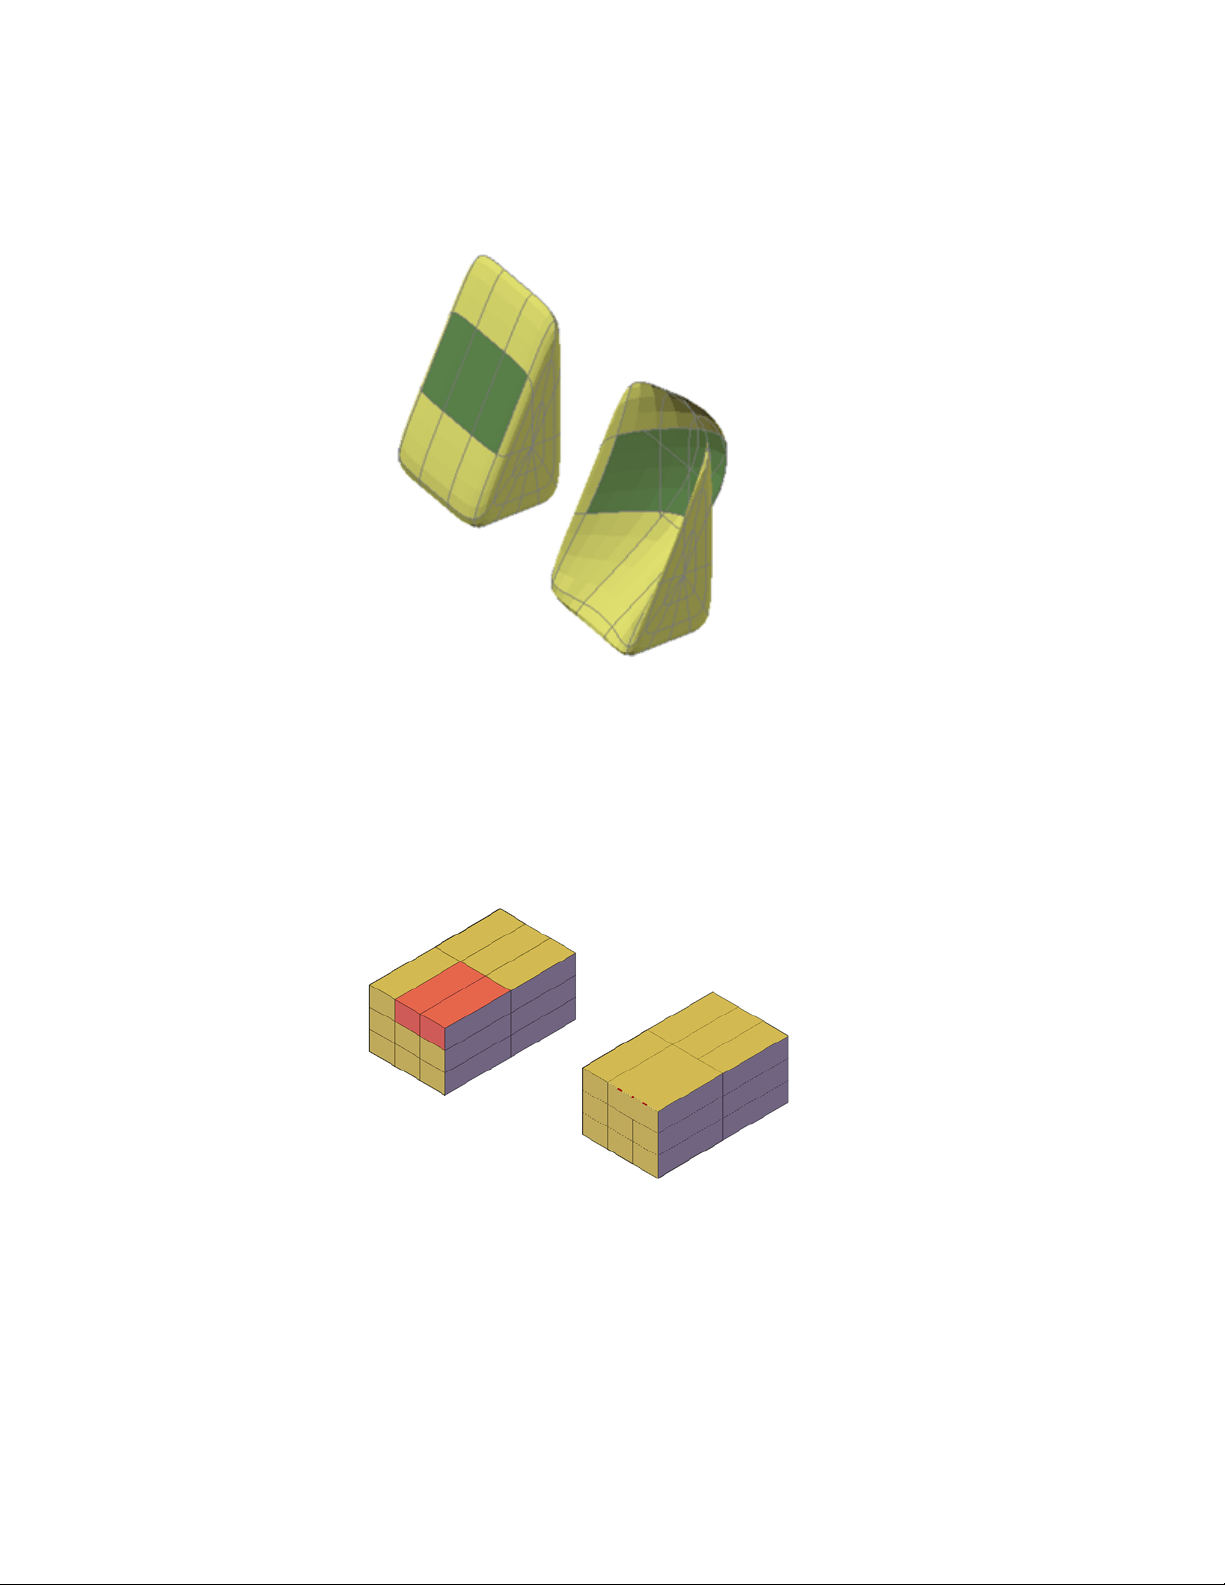
mesh wedge with front faces dragged past the back faces
Mesh objects that cannot be converted to solids can often be converted to
surfaces instead.
Avoid merging faces that wrap a corner
When you merge faces, you can create a mesh configuration in which the
merged face wraps a corner. If a resulting face has a vertex that has two edges
and two faces, you cannot convert the mesh to a smooth 3D solid object.
Modify 3D Models | 473

One way to resolve this problem is to convert the mesh to a faceted solid
instead of a smooth solid. You might also be able to repair the problem by
splitting the adjacent faces, starting at the shared vertex (MESHSPLIT).
Create Sections and Drawings from 3D Models
Create cross sections, cutting planes, flattened views, and 2D drawings of 3D
objects.
Work with Sections
Create cross sections of 3D models.
Overview of Section Objects
Create a section plane that can be modified and moved to achieve the cross
section view that you need.
With the SECTIONPLANE command, you can create one or more section
objects and place them throughout a 3D model (3D solids, surfaces, or mesh).
By activating live sectioning, you can then view transient cuts in the 3D model
as you move the section object through it. The 3D objects themselves do not
change.
Set the Cross-Section with the Section Plane Indicator
Section objects have a transparent section plane indicator that acts as a cutting
plane. This plane can be moved through a 3D model that is composed of 3D
solids, surfaces, or regions to obtain different section views.
474 | Chapter 8 Work with 3D Models
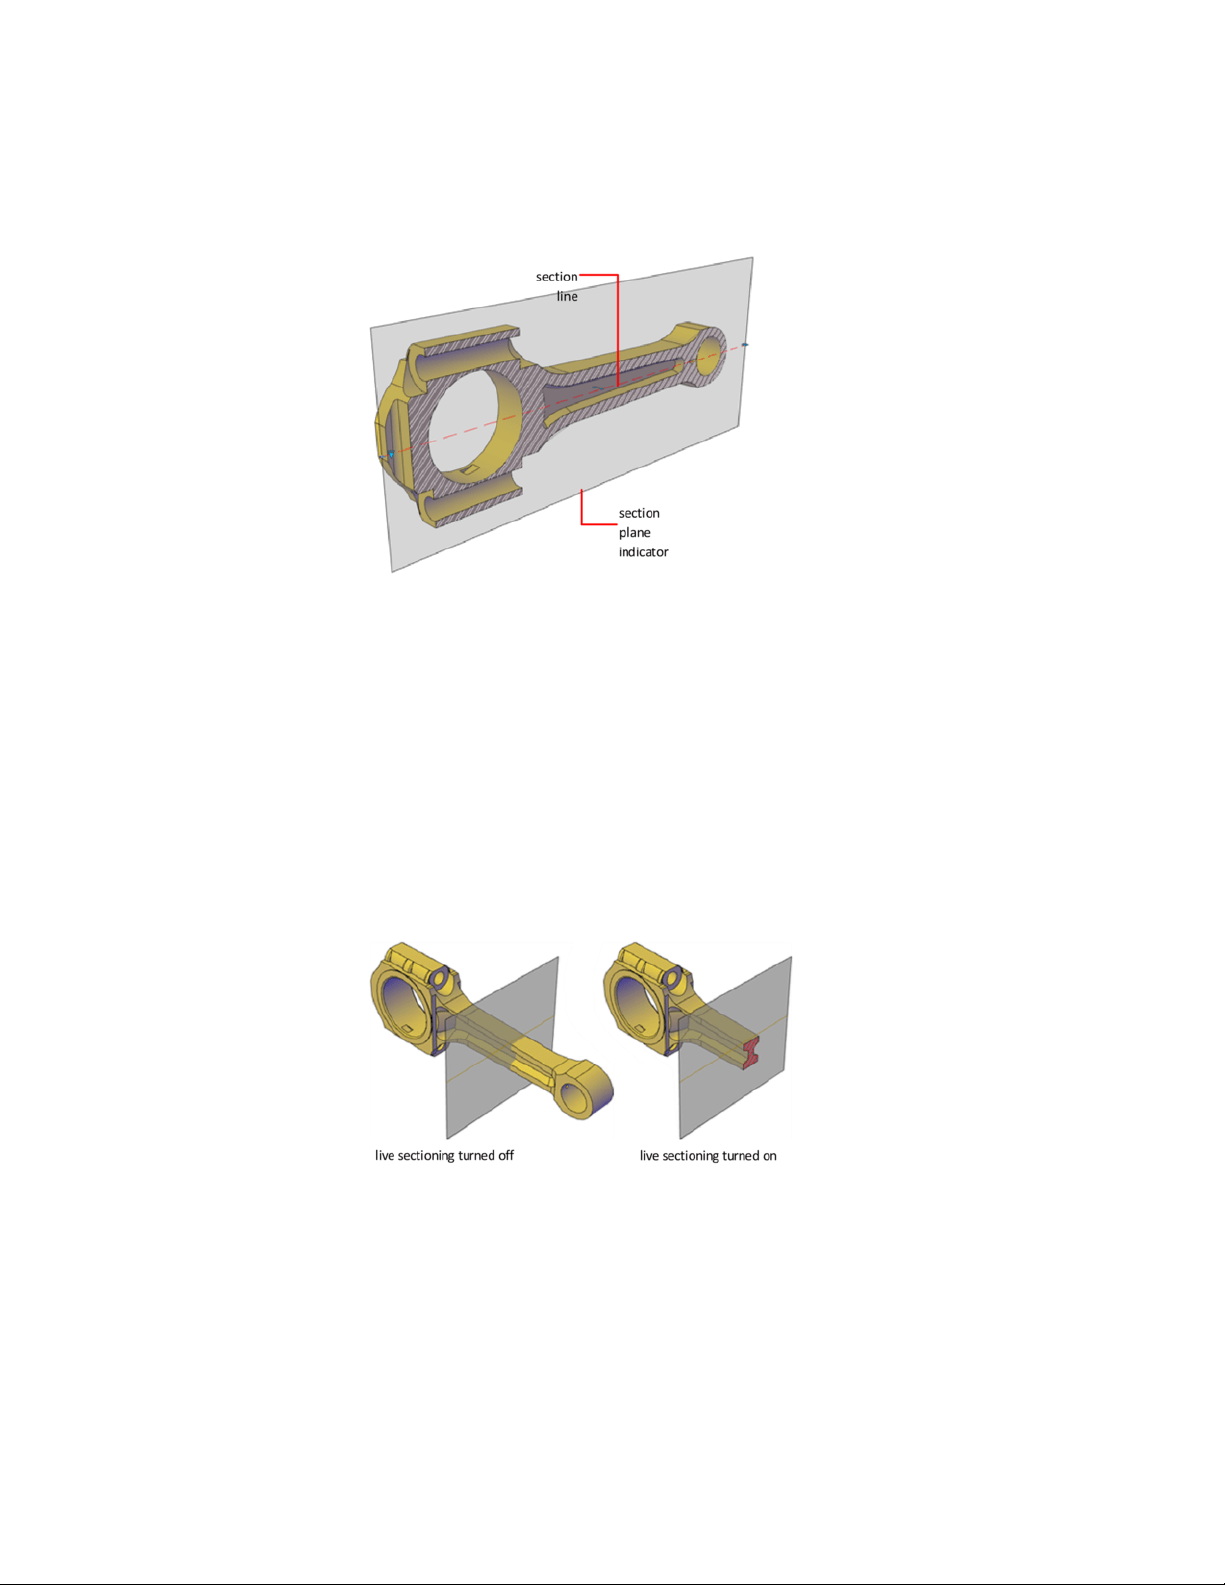
Store Properties in Section Lines
The section plane contains a section line that stores section object properties.
You can create multiple section objects to store different properties. For
example, one section object can display a hatch pattern at the section plane
intersection. Another section object can display a specific linetype for the
boundary of the intersected area.
Analyze the Model with Live Sectioning
With live sectioning, you can dynamically analyze the interior details of 3D
objects by moving and adjusting the section plane. You can specify whether
to hide, or cut away, the portion of the model that is on the viewing side of
the section plane indicator.
Create Sections and Drawings from 3D Models | 475
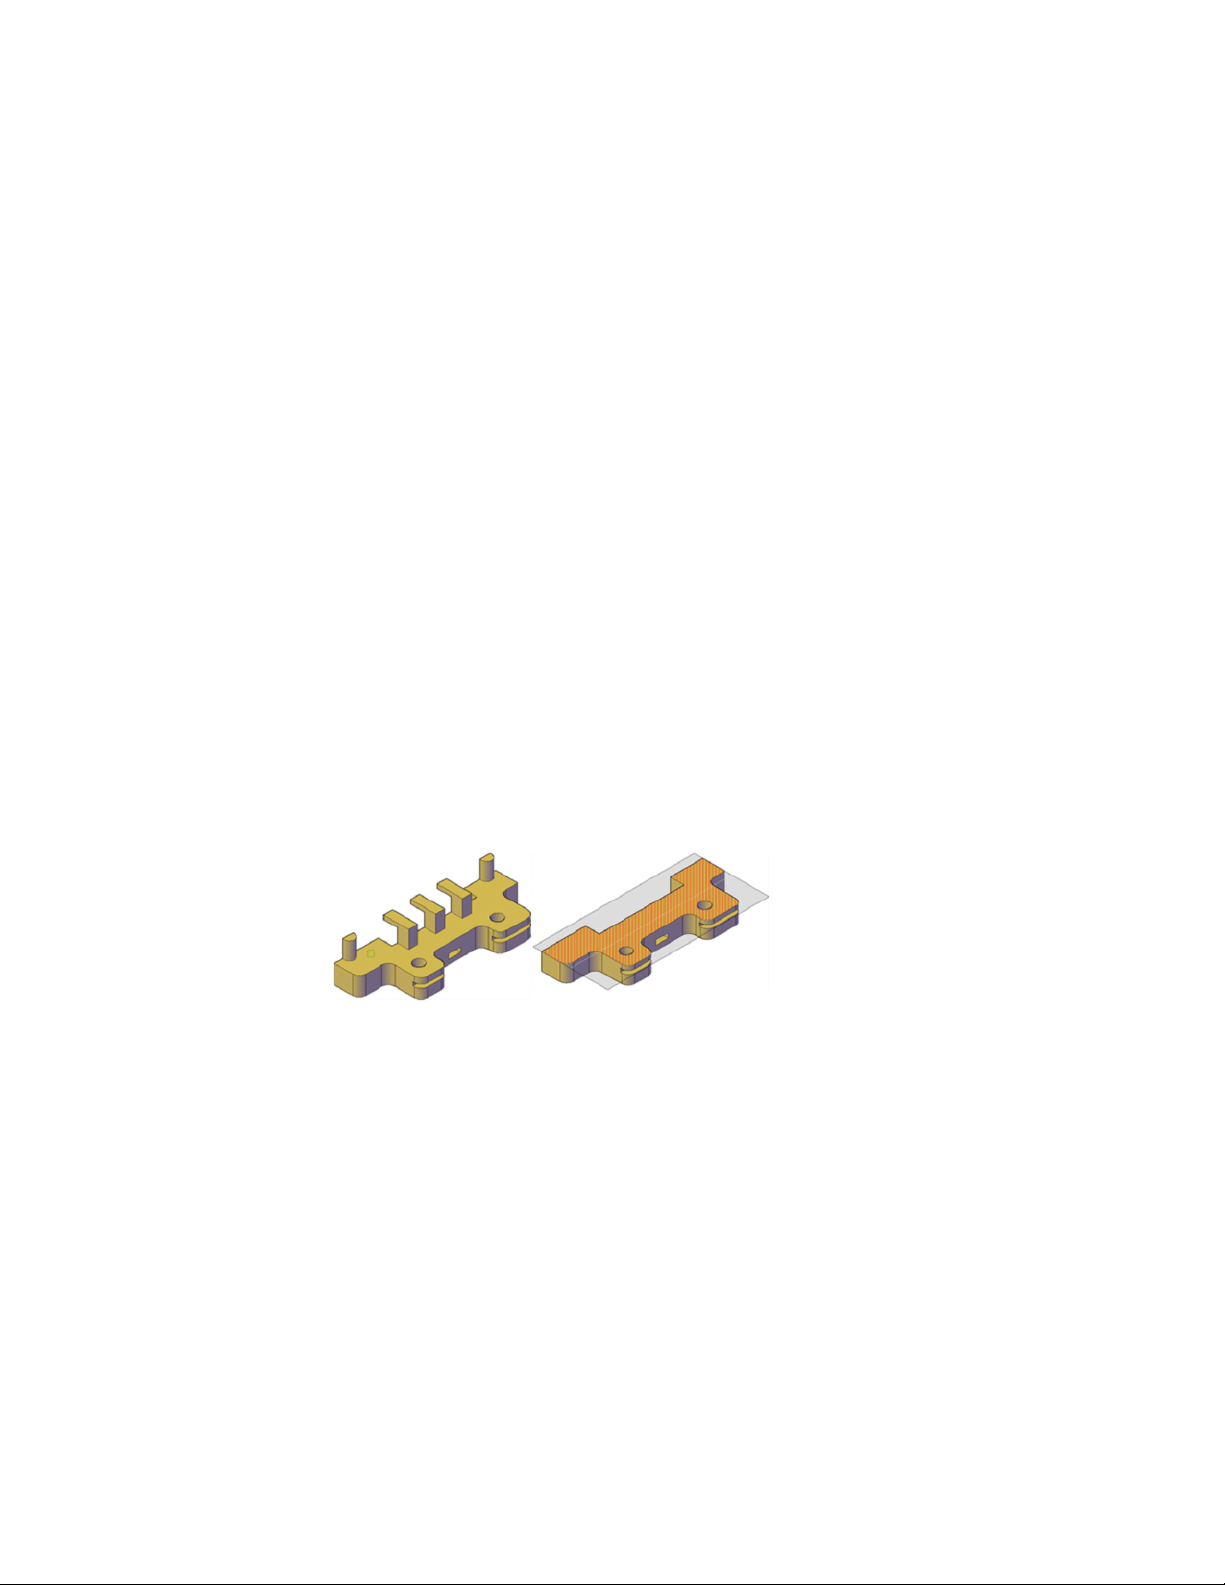
Save and Share Section Images
After you create a sectional view, you can generate an accurate 2D or 3D block
from the 3D model. These blocks can be analyzed or checked for clearances
and interference conditions. They can also be dimensioned, or used as
wireframe or rendered illustrations in documentation and presentation
drawings.
Create Section Objects
Create cross sections to show interior details of 3D objects.
With the SECTIONPLANE command, you create a section object that acts as a
cutting plane through solids, surfaces, meshes, or regions. Then turn on live
sectioning to move the section object through the 3D model to reveal its inner
details in real time.
You can align a section object using several methods.
Align the Section Plane to a 3D Face
One way to set the section plane is to click the face of an existing 3D object.
(As you move the cursor, a dotted outline indicates the side of the plane to
be selected.) The section plane is automatically aligned to the plane of the
face you select.
Section object aligned to face
Create a Straight Cutting Plane
Pick two points to create a straight cutting plane.
476 | Chapter 8 Work with 3D Models
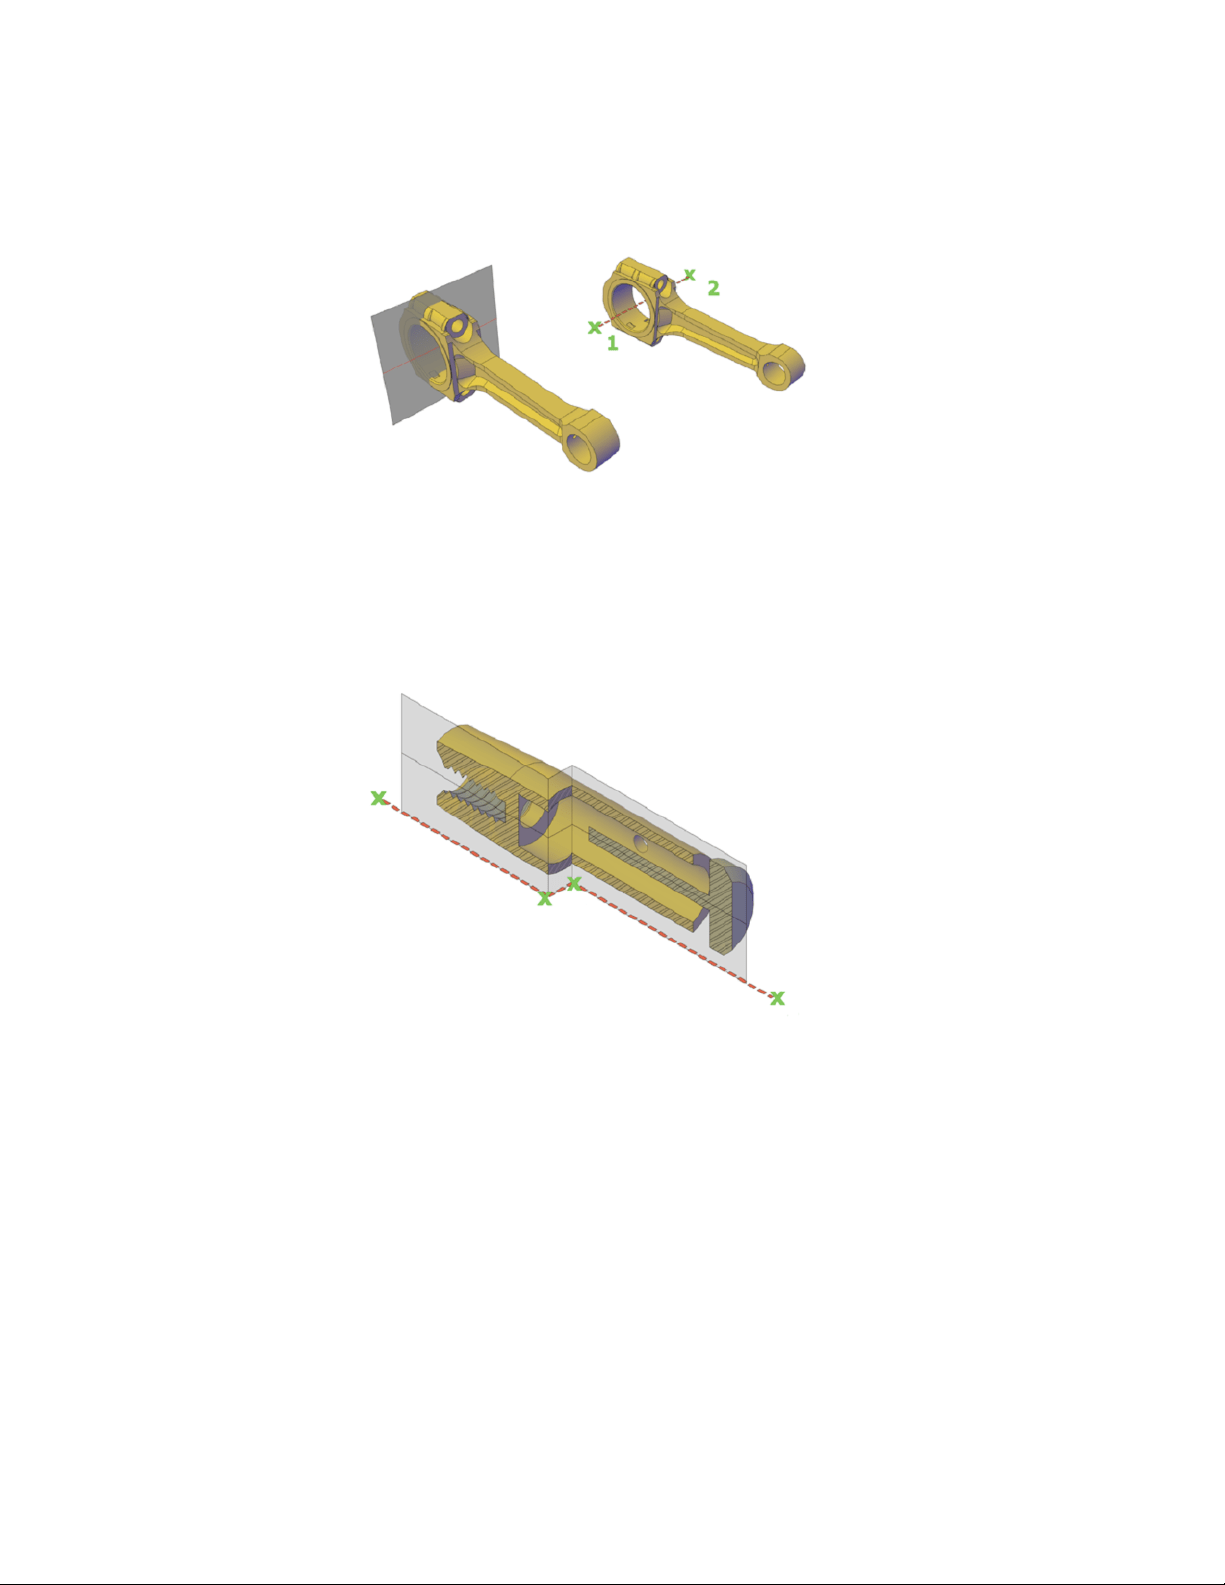
Add a Jogged Segment
The section plane can be a straight line or it can have multiple or jogged
sections. For example, a section containing a jog is one that cuts away a pie
slice-shaped wedge from a cylinder.
Create a section line that has jogged segments by using the Draw Section
option of SECTIONPLANE to pick multiple points throughout the 3D model.
Section object with jogged segment
Create Orthographic Sections
You can align section objects to a specified orthographic orientation of the
current UCS, such as front, back, bottom, top, left, or right.
Create Sections and Drawings from 3D Models | 477
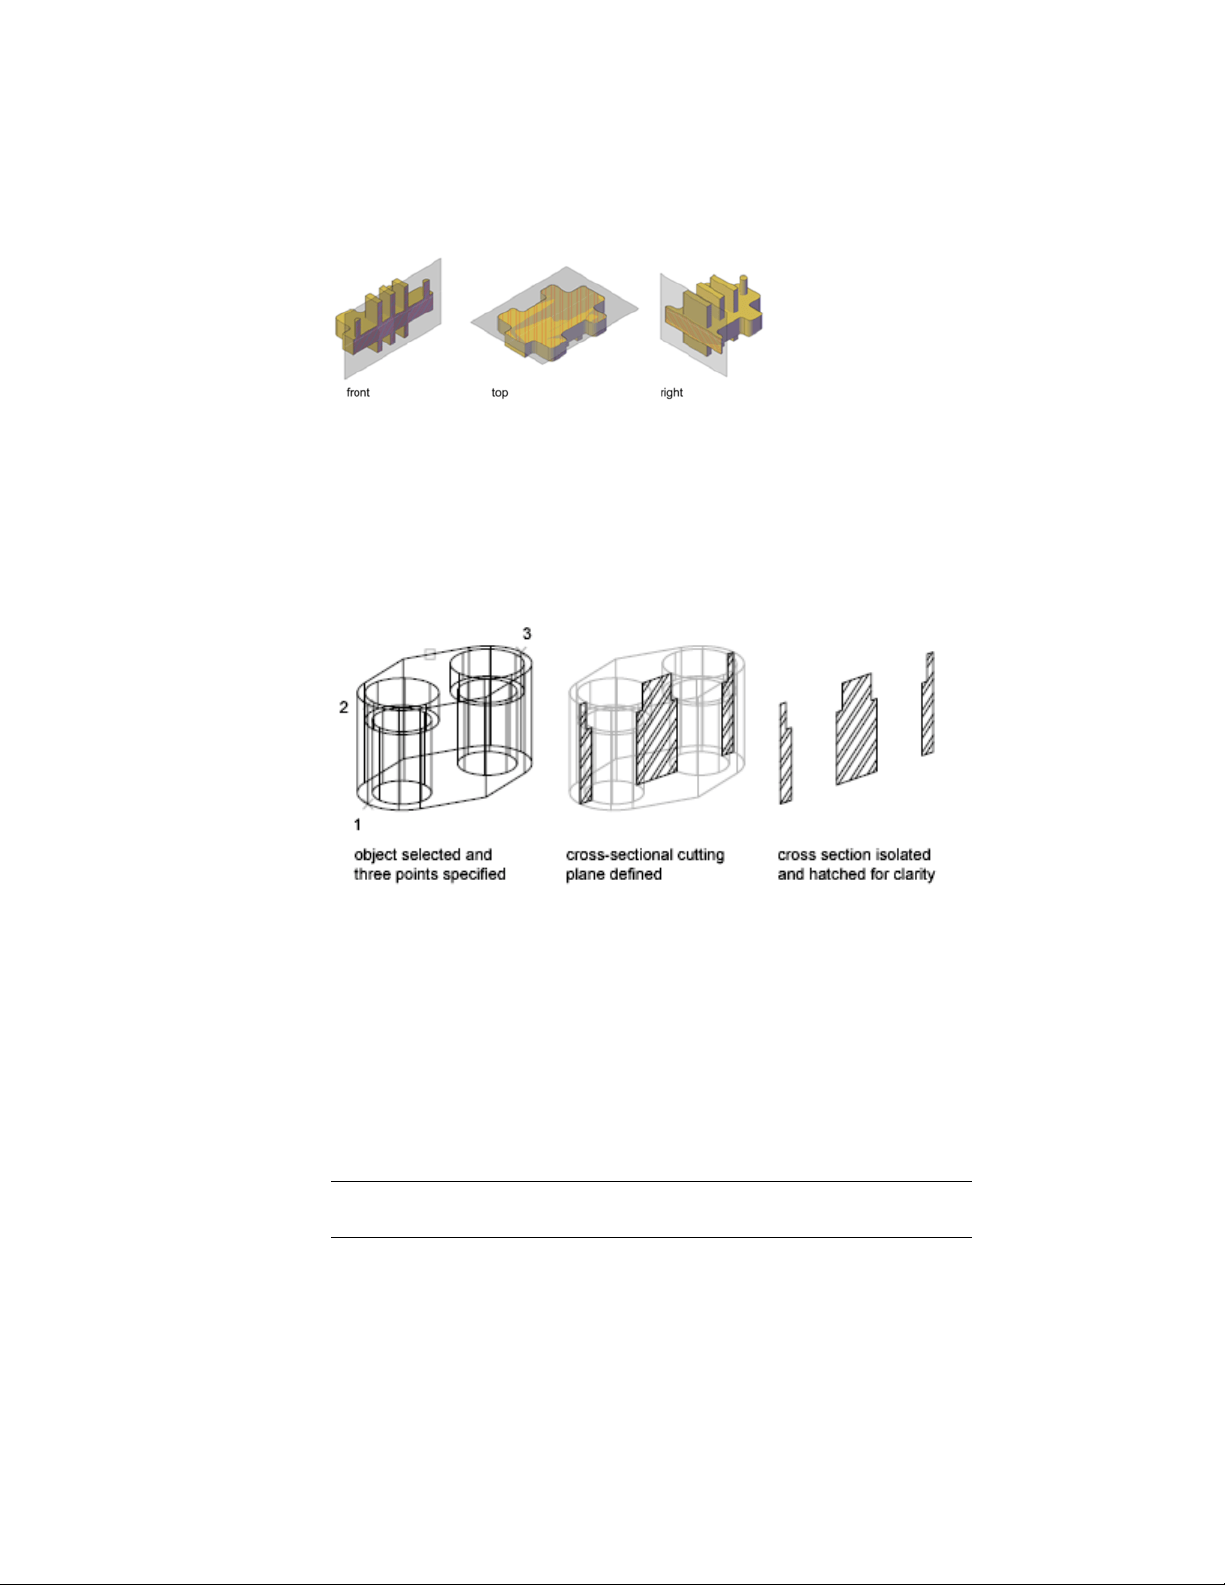
Orthographic section planes are placed so that they pass through the center
of the 3D extents of all 3D objects in the drawing.
Create a Region to Represent the Cross Section
With the SECTION command, you can create a 2D region object that represents
a planar cross section through a 3D solid object. You do not have live
sectioning capabilities when you use this legacy method to create cross sections.
Define the plane of the cross section using one of the following methods:
■ Specify three points
■ Specify a 2D object such as a circle, ellipse, arc, spline, or polyline
■ Specify a view
■ Specify the Z axis
■ Specify the XY, YZ, or ZX plane
The new region that represents the cross-sectional plane is placed on the
current layer.
NOTE Before you apply hatching to the cross-sectional cutting plane, align the
UCS with the cutting plane.
478 | Chapter 8 Work with 3D Models
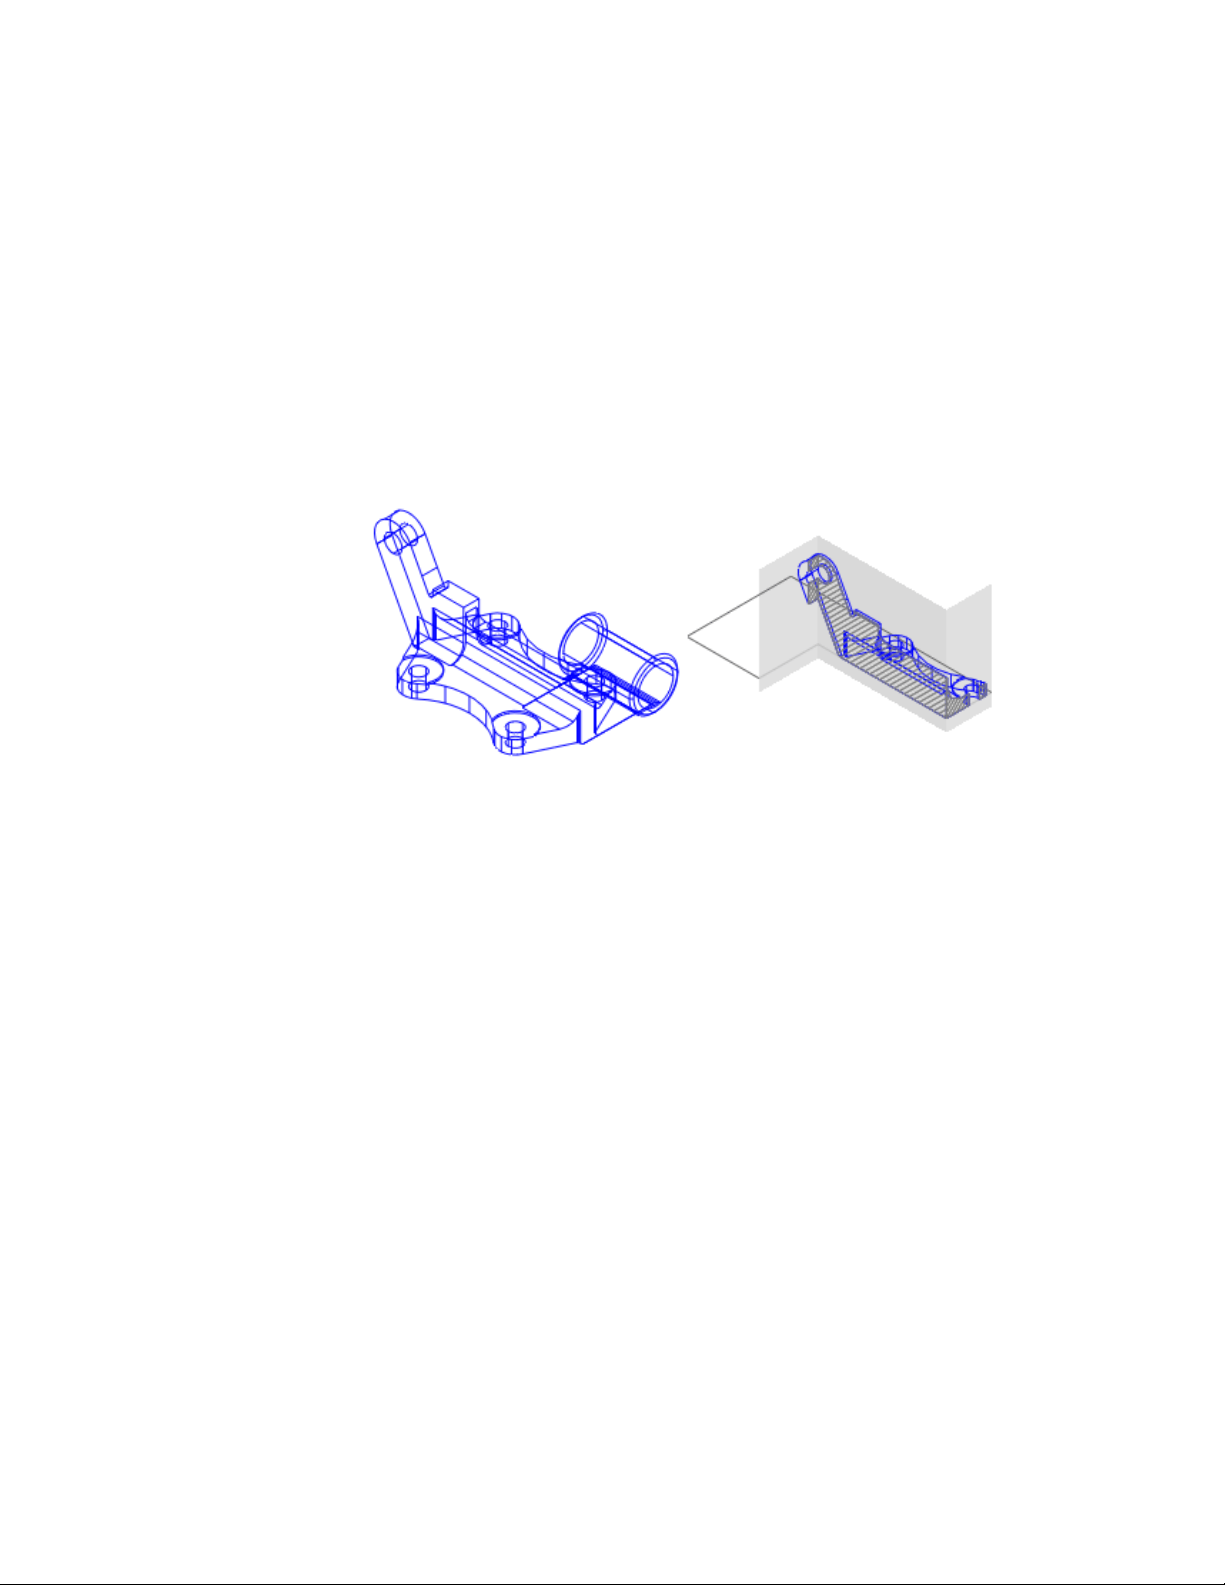
Modify a Section View
After you create a section, adjust its display or modify its shape and location
to change the represented section view.
Add Jogs to a Section
Add jogs, or angular segments, to existing section lines.
You can create a section plane that has multiple segments (jogs), using the
Draw Section option of the SECTIONPLANE command. You can also add a
jog to an existing section plane by selecting the section you want to add a job
to and then right-clicking. From the shortcut menu, click Add Jog to Section
(SECTIONPLANEJOG).
A jog that is added to an existing section object creates a segment that is
perpendicular to the selected segment. Its viewpoint is oriented in the direction
set by the Direction grip. The Nearest object snap is temporarily turned on to
help you place the jogs on a section.
You cannot add jogs to the side or back lines of the section object.
After adding jogs, you can reposition and resize the jogged sections by dragging
the section object grips.
Use Live Section to Adjust the Cross Section
Use live sectioning to move a section object through the 3D model or region
dynamically.
Create Sections and Drawings from 3D Models | 479
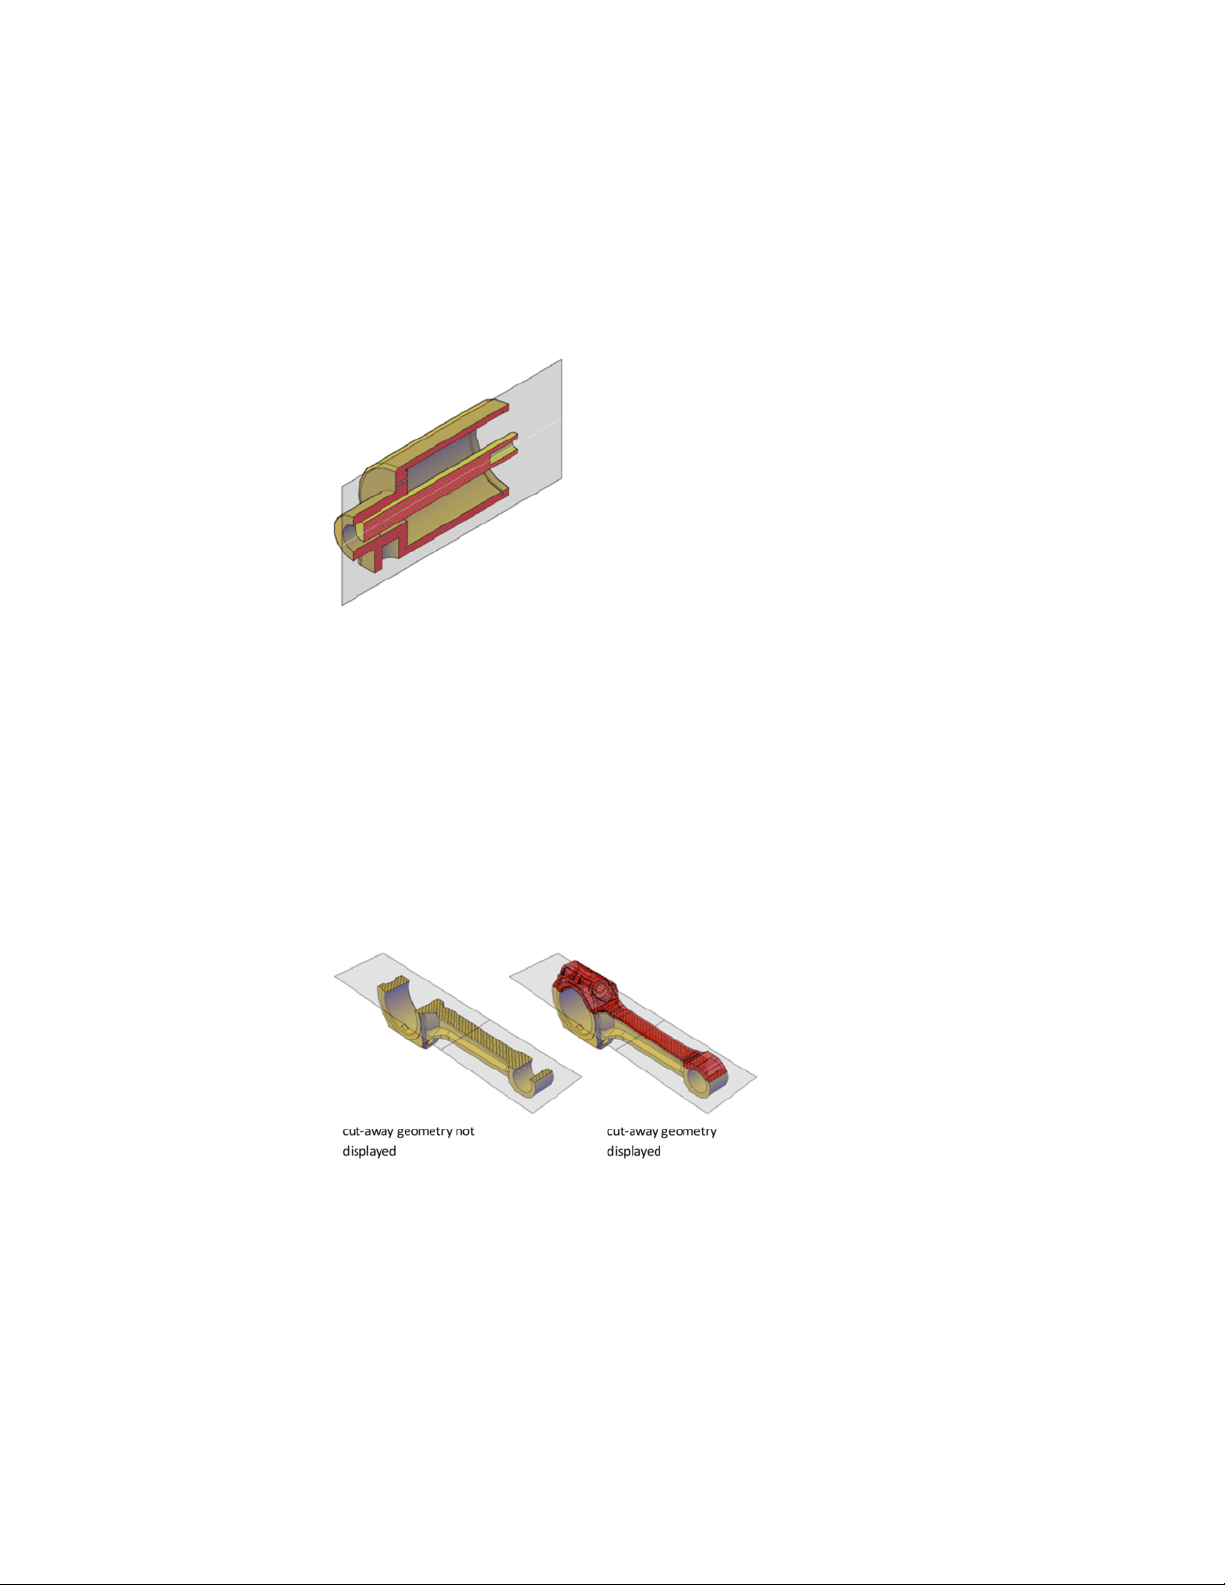
What Is Live Sectioning?
Live sectioning is an analytical tool for viewing cut geometry in a 3D solid,
surface, or region.
You can use live sectioning to analyze a model by moving the section object
through the object. For example, sliding the section object through an engine
assembly helps you visualize its internal components. You can use this method
to create a cross section view that you can save or reuse.
Turn on and Use Live Sectioning
Live sectioning works with 3D objects and regions in model space. When live
sectioning is activated, you can change the viewing planes by using grips to
adjust the location of the section object or its segments.
By turning on cutaway geometry, you can display the entire object that
contains the section plane. This option (available on the shortcut menu) can
only be turned on when section plane is active.
Live sectioning is turned on or off automatically, depending on how you
create the section object. For example, when you select a face to define the
section plane, live sectioning is turned on. When you create sections using
480 | Chapter 8 Work with 3D Models
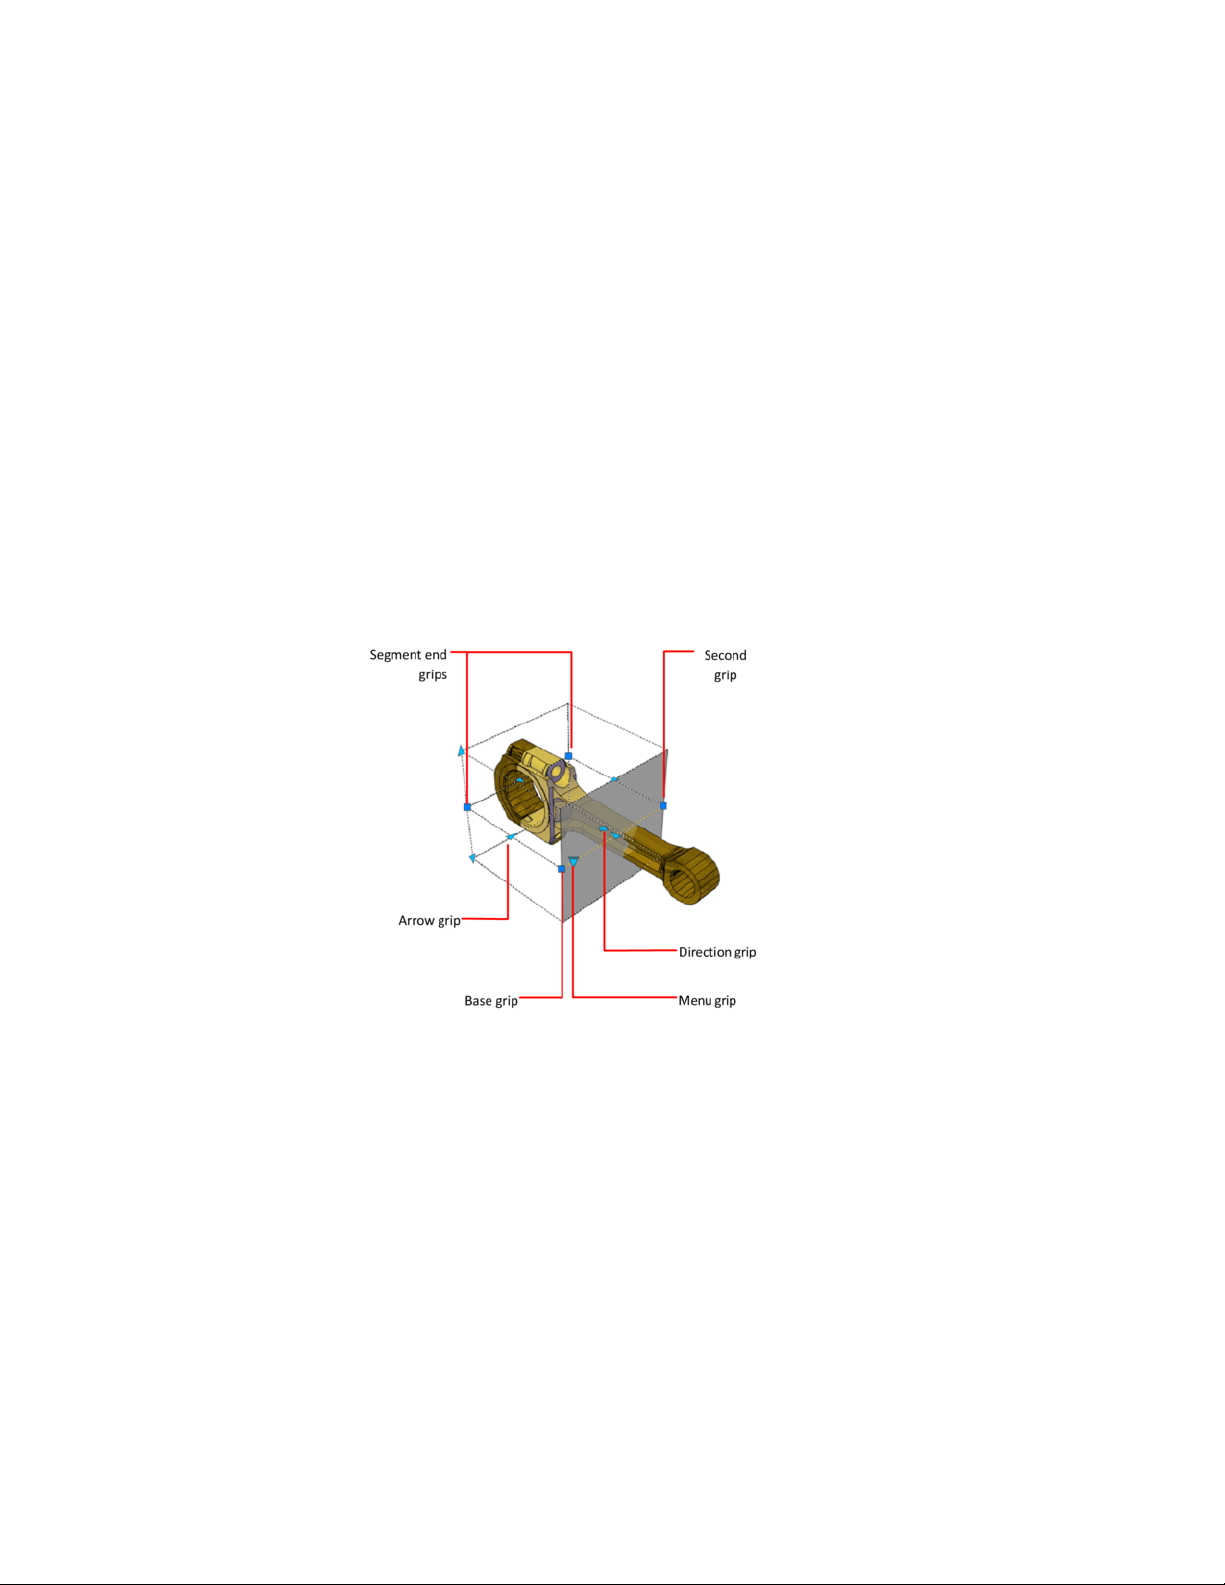
the Draw Section option of the SECTIONPLANE command, live sectioning is
turned off. Live sectioning can be manually turned on or off after a section
object is created.
A drawing can contain multiple section objects. However, live sectioning can
only be active for one section object at a time. Suppose that your model has
two sections objects: Section A and Section B. If Section A has live sectioning
turned on and you activate live sectioning for Section B, live sectioning for
Section A is automatically turned off.
Turning off a section object layer does not turn off live sectioning. However,
freezing the layer turns off live sectioning.
Use Grips to Modify Section Objects
Section object grips help you move and resize the section object.
Grips allow you to adjust the location, length, width, and height of the cutting
area.
■ Base grip.Acts as the base point for moving, scaling, and rotating the
section object. It is always adjacent to the Menu grip.
■ Second grip.Rotates the section object around the base grip.
■ Menu grip. Displays a menu of section object states, which control the
display of visual information about the cutting plane.
Create Sections and Drawings from 3D Models | 481
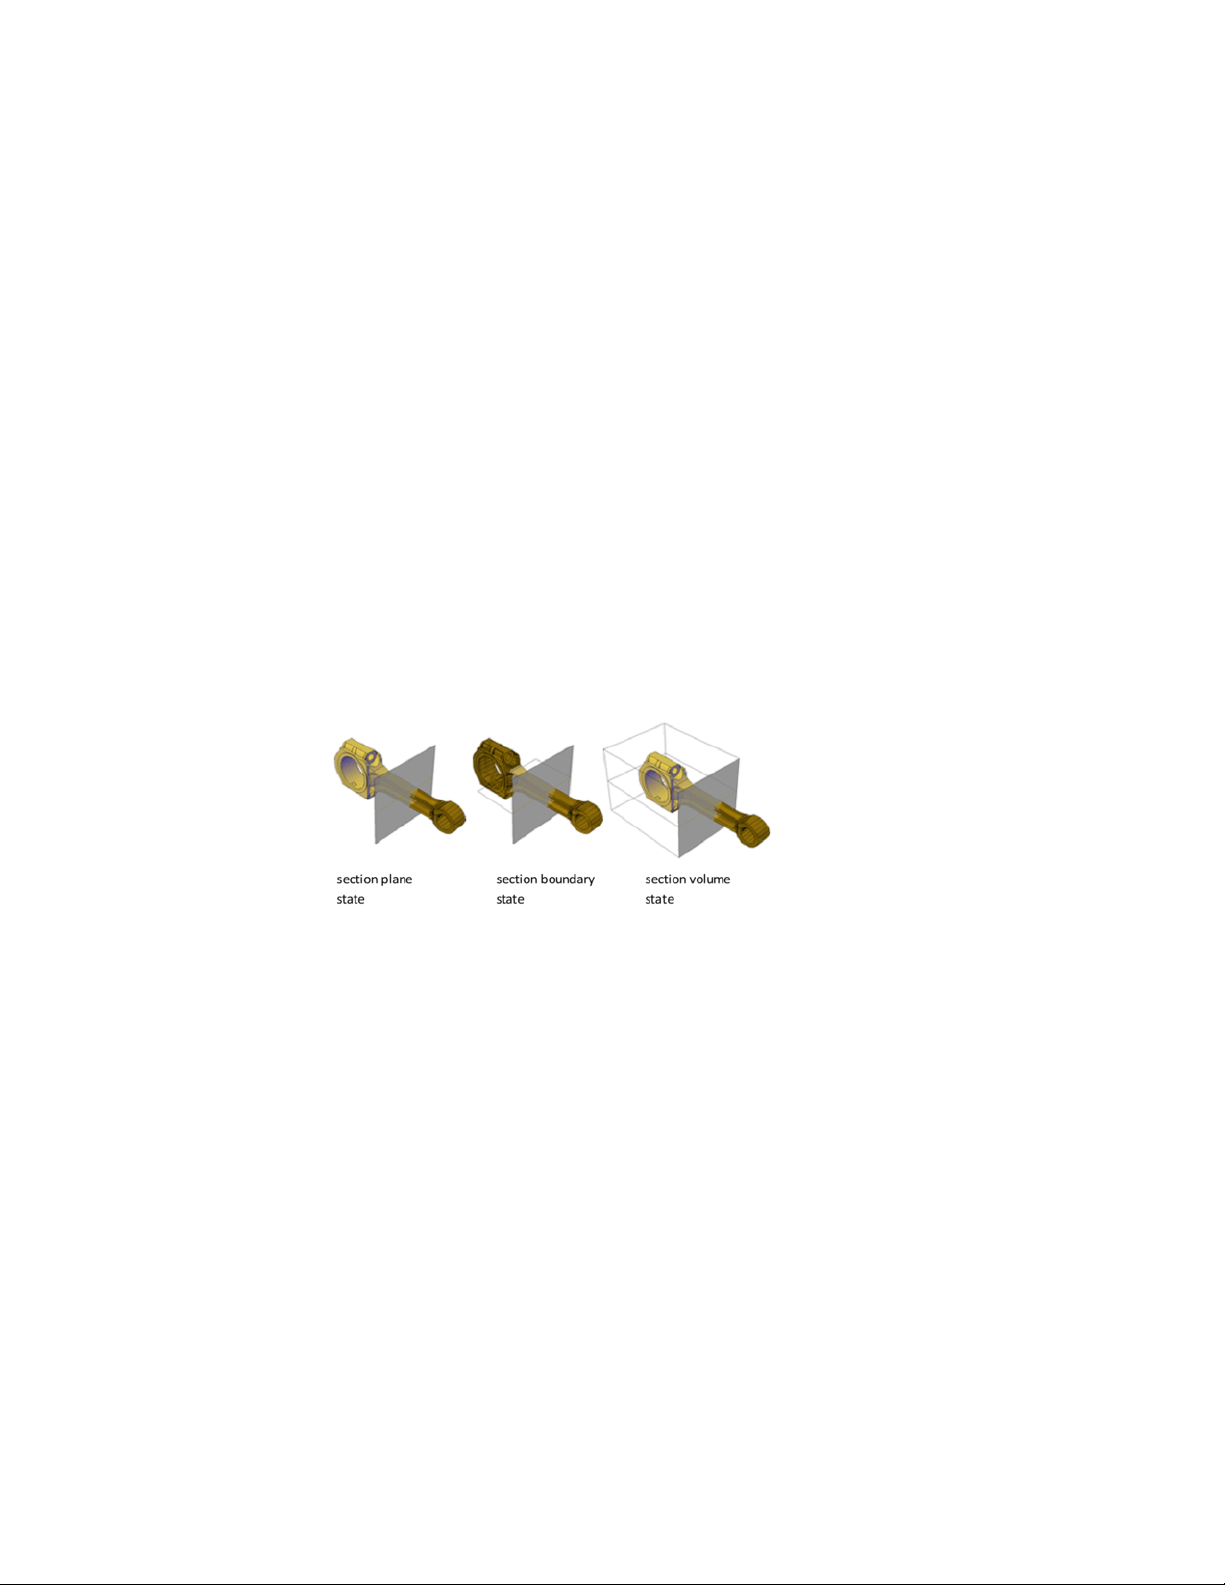
■ Direction grip.Controls the viewing direction of the 2D section. To
reverse the viewing direction of the section plane, click the Direction grip.
■ Arrow grip.Modifies the section object by modifying the shape and
position of the section plane. Only orthogonal movements in the direction
of the arrow are permitted. (Section Boundary and Volume states only.)
■ Segment end grips.Stretches the vertices of the section plane. You cannot
move segment end grips so that segments intersect. Segment end grips are
displayed at the endpoints of jogged segments. (Section Boundary and
Volume states only.)
You can select only one section object grip at a time.
Set Section Object States and Properties
Set the display of the section object.
Set Section Object States
Section objects have the following display states:
■ Section Plane. The section line and transparent section plane indicator
are displayed. The cutting plane extends infinitely in all directions.
■ Section Boundary. A 2D box shows the XY extents of the cutting plane.
The cutting plane along the Z axis extends infinitely.
■ Section Volume. A 3D box shows the extents of the cutting plane in all
directions.
You can switch between object states by clicking the Menu grip that is
displayed when you select the section object.
482 | Chapter 8 Work with 3D Models

Set Section Object Properties
Section objects have properties like other AutoCAD objects. Properties are
stored in the section line and can be accessed in the Properties Inspector.
For each section object, you can change the name, layer, and linetype. You
can also change the color and transparency of the section plane indicator (the
cutting plane).
Associate Section Objects with Named Views
Associate section objects with named views.
When you activate a named view that has an associated section object, live
sectioning is turned on for that section object. For a 3D model with multiple
section objects, you might want to associate a particular section object to a
view. Later, you can restore a saved sectional view and activate live sectioning
for the associated section object.
For example, you can set up two section objects that cut through the 3D model
in different directions. Section object A cuts the model along its width; Section
object B cuts the model along its length. Perhaps you want to view the sectional
cut that is perpendicular to your line of sight. By associating each section
object with a view, you can quickly switch between the two views and see the
desired cross section.
Save and Publish Section Objects
Save a section object as a block or publish it.
Save Sections as Blocks or Drawings
Save the representation of the cross-sectional area where a section object
intersects a 3D model as a block.
Save Sections as Blocks or Drawings
You can save the section objects you create as blocks. Working from the
Generate Section/Elevation dialog box, you can choose the type of block that
is created.
Create Sections and Drawings from 3D Models | 483
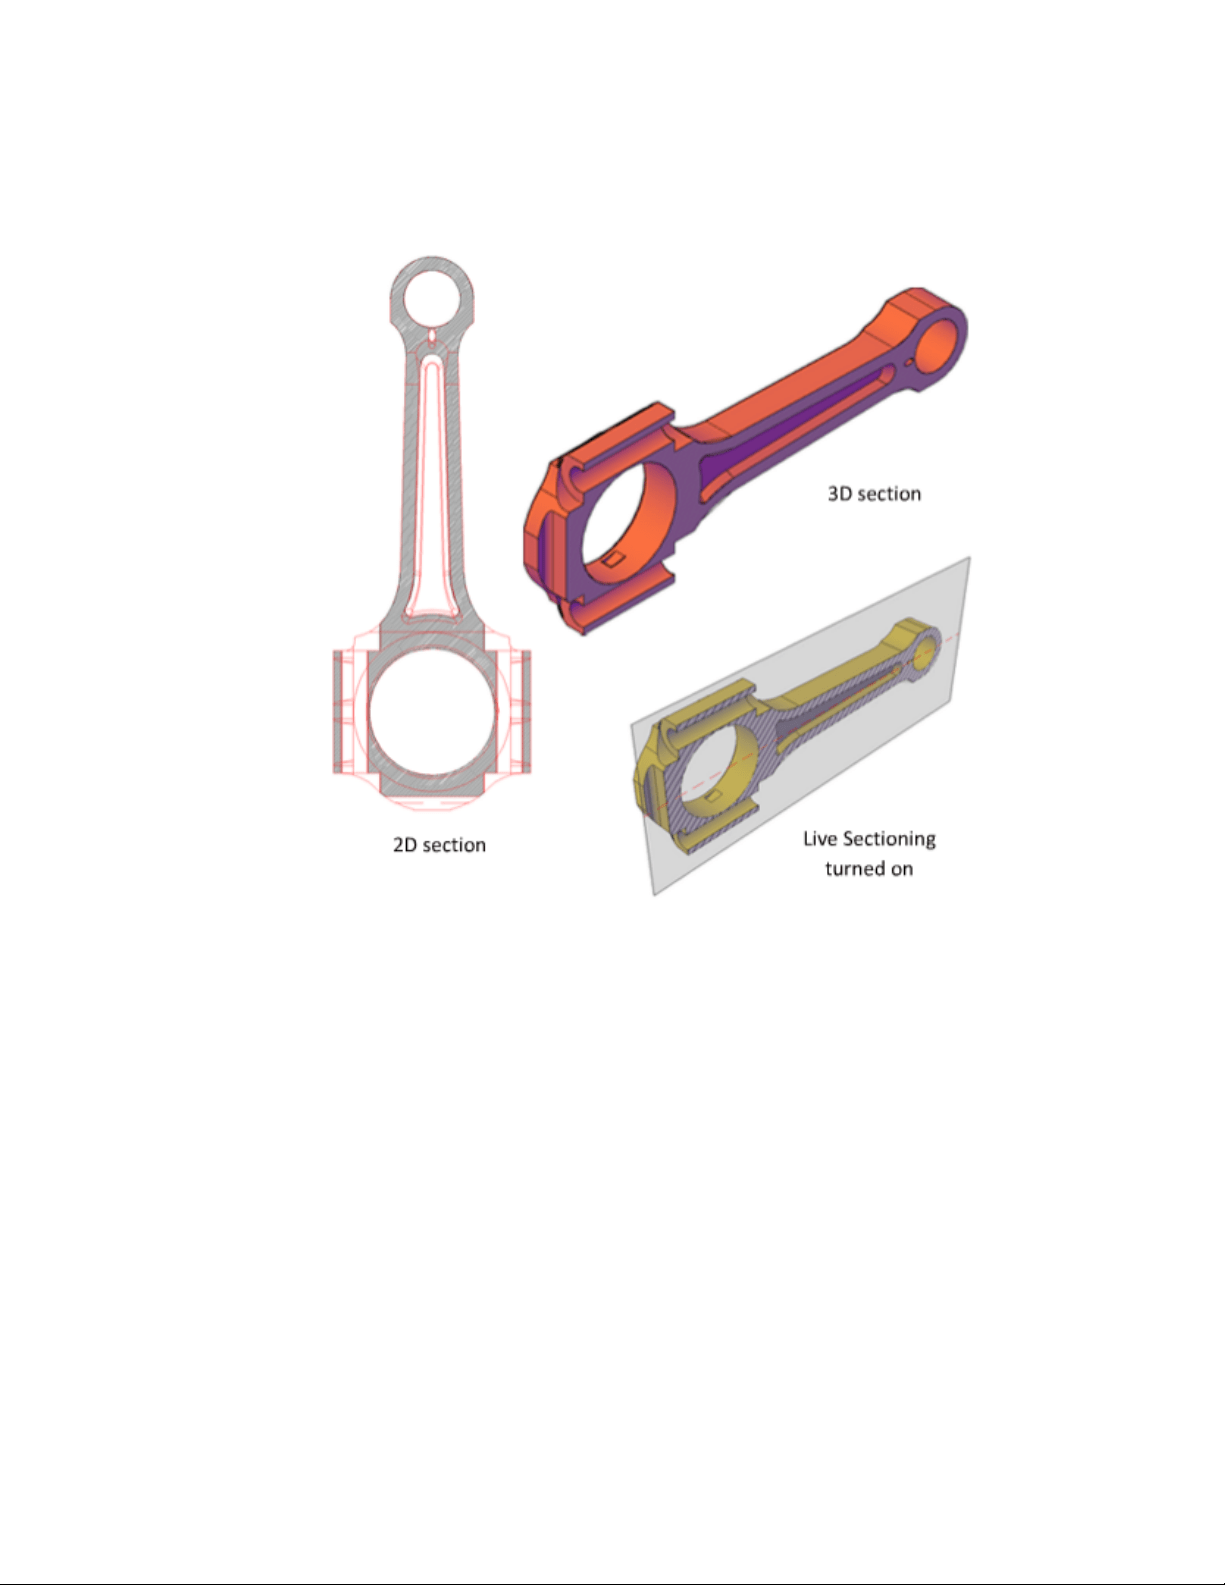
For example, suppose your project requires 2D elevation drawings or 2D cross
sections. The 2D Section / Elevation option creates an accurate block
representation that is ready for dimensioning.
To publish or render a cutaway of the 3D model, select the 3D Section option.
3D section geometry consists of mostly 3D solids and surfaces. However, profile
outlines and hatch patterns consist of 2D lines.
The display properties of 2D section/elevation blocks and 3D section blocks
are controlled in the Section Settings dialog box.
When you create section blocks, you have the following choices for how they
are handled:
■ Insert the section blocks. At the time of creation, you can insert a 2D
or 3D section block into the drawing or save it to an external file. A 2D
484 | Chapter 8 Work with 3D Models

section block is inserted on the XY plane of the current UCS, including
section blocks that extend into 3D space.
Inserted section blocks are initially unnamed. You can set the scale,
rotation, and base point upon insertion. You can modify and rename them
later by editing the block with BEDIT.
■ Export section blocks to a file. Save and name the new section objects
so they can be inserted later.
■ Save section block components on separate layers. By default,
section block components such as intersection boundary, intersection fill,
background lines, cutaway geometry, and curve tangency lines are saved
on Layer 0. However, you can separate the components of saved section
blocks onto separate layers with a suffix or prefix that you specify.
Assigning a suffix or prefix helps you organize the block components into
layers that you can sort and identify quickly. The Layer properties lists in
the Section Settings dialog box provide the opportunity to customize the
layer names.
■ Specify whether to limit the section block to certain objects.
The objects that are included in a section block vary, depending on which
section object state is selected. You can also select specific objects to be
included as you create the section block.
See also:
Publish Section Objects
Control the visibility of section objects when you render or print.
Render Section Objects
With live sectioning turned on, all lines on a section object are rendered as
2D lines. The section plane indicator is rendered as a transparent material. Its
degree of transparency is controlled in the Properties Inspector.
If you want to render a 3D cutaway, save the cutaway section as a 3D block
and render the block reference.
Print Section Objects
When a section object is in a Section Boundary or Section Volume state,
displayed lines cannot be printed. The section plane indicator is printed as if
Create Sections and Drawings from 3D Models | 485

it were transparent. However, it does not have the same visual quality that it
has when it is rendered.
If you do not want to plot the section line, place the section object on a layer
that is turned off.
Create a Flattened View
Create a flattened view of the 3D solids and regions in the current view.
Create a 2D Presentation of a 3D Model
With the FLATSHOT command, you can create a flattened, 2D representation
of the 3D model projected onto the XY plane. The resulting objects can be
inserted as a block or saved as a separate drawing.
The process is like taking a photograph of the entire 3D model and then laying
the photograph flat. This feature is useful for creating technical illustrations.
486 | Chapter 8 Work with 3D Models
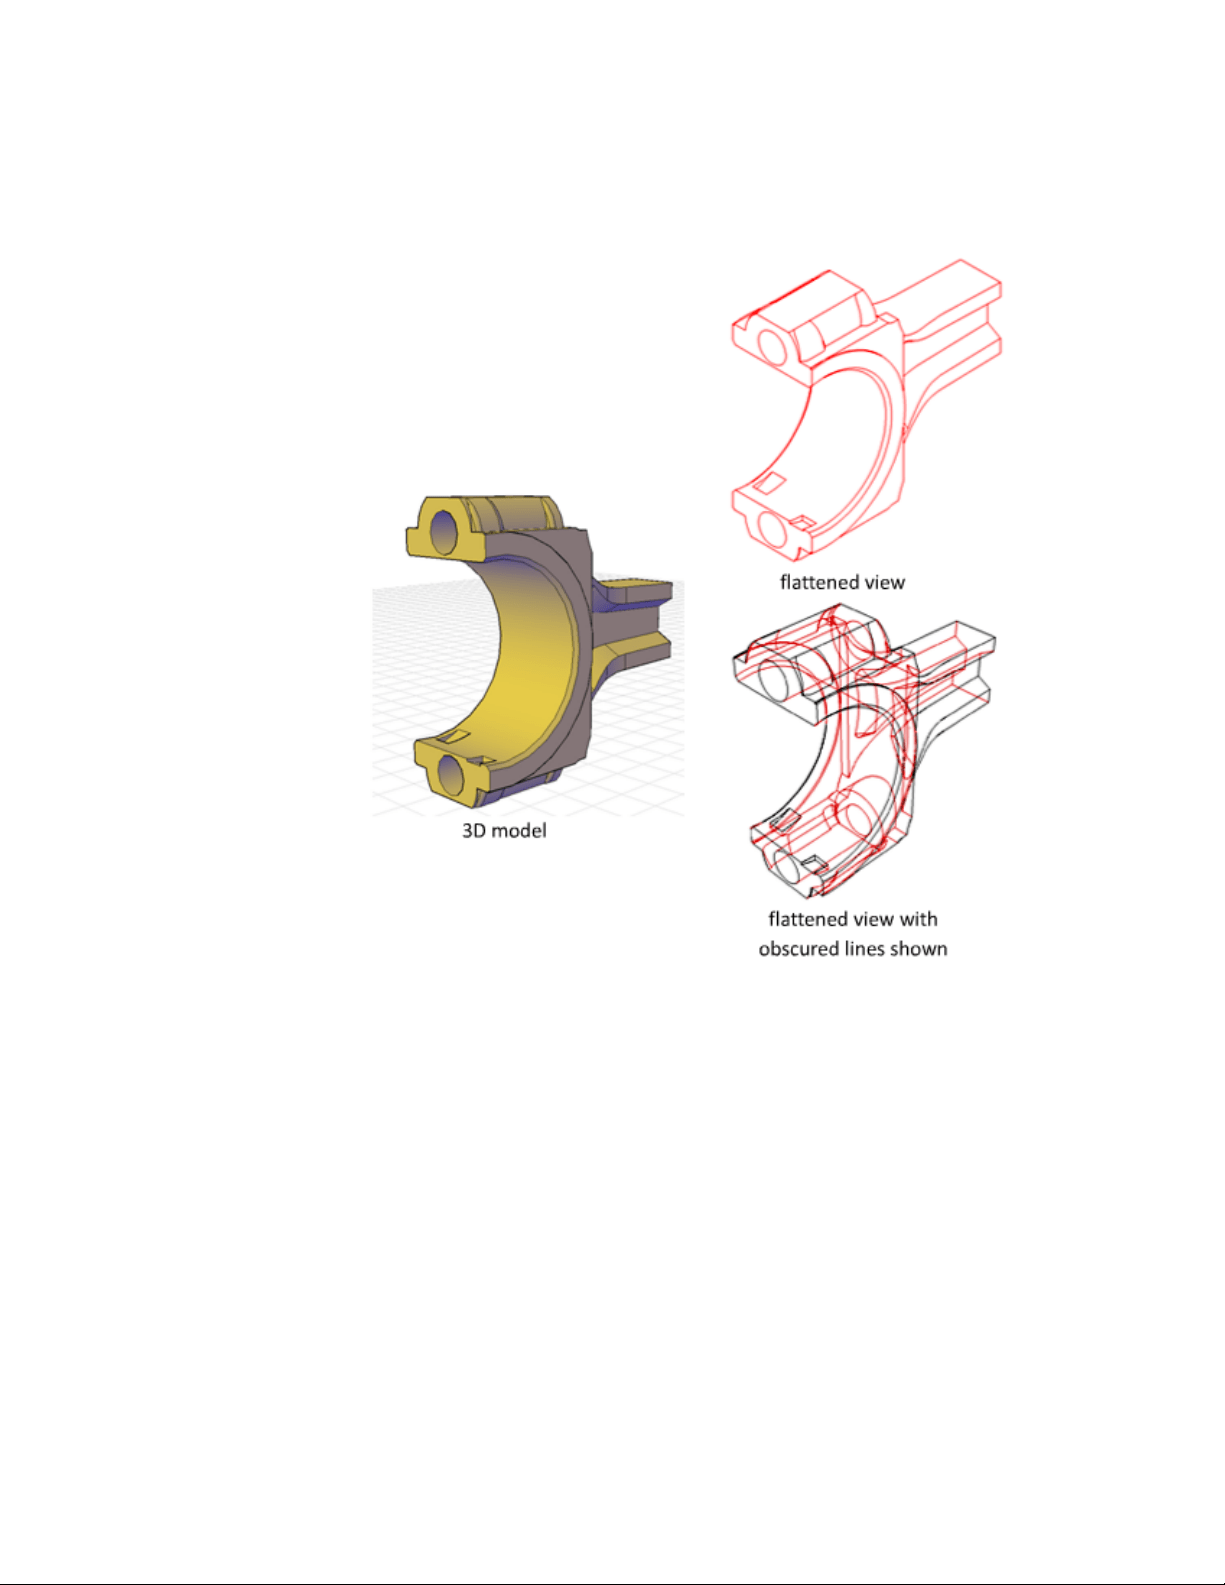
The flatshot process works only in model space. Start by setting up the view
you want, including orthographic or parallel views. All 3D objects in the model
space viewport are captured. Therefore, be sure to place the objects you do
not want captured on layers that are turned off or frozen.
As you create the block, you can control how hidden lines are displayed by
adjusting the Foreground and Obscured Lines settings in the Flatshot dialog
box. For best results with mesh objects, clear the Show box under Obscured
Lines so that hidden lines are not represented.
Three-dimensional objects that have been sectioned are captured in their
entirety, as if they had not been sectioned.
Create Sections and Drawings from 3D Models | 487

NOTE To create profile images of 3D solids in paper space, use the SOLPROF
command.
Modify a Block Created with Flatshot
You can modify a flattened view that has been inserted as a block in the same
way that you modify any other 2D block geometry.
488 | Chapter 8 Work with 3D Models

Annotate Drawings
Work with Annotations
When you annotate your drawings, you can use certain tools and properties to
make working with annotations easier.
Overview of Annotations
Annotations are notes or other types of explanatory symbols or objects that are
commonly used to add information to your drawing.
Examples of annotations include
■ Notes and labels
■ Tables
■ Dimensions and tolerances
■ Hatches
■ Callouts
■ Blocks
The types of objects that you use to create annotations include
■ Hatches
■ Text (single-line and multiline)
■ Tables
■ Dimensions
■ Tolerances
■ Leaders and multileaders
9
489

■ Blocks
■ Attributes
Scale Annotations
You can automate the process of scaling annotations in various layout
viewports and in model space.
Overview of Scaling Annotations
Objects that are commonly used to annotate drawings have a property called
Annotative. This property allows you to automate the process of scaling
annotations so that they plot or display at the correct size on the paper.
Instead of creating multiple annotations at different sizes and on separate
layers, you can turn on the annotative property by object or by style, and set
the annotation scale for model or layout viewports. The annotation scale
controls the size of the annotative objects relative to the model geometry in
the drawing.
The following objects are commonly used to annotate drawings and contain
an annotative property:
■ Text
■ Dimensions
■ Hatches
■ Tolerances
■ Multileaders
■ Blocks
■ Attributes
When the Annotative property for these objects is turned on (set to Yes), these
objects are called annotative objects.
You define a paper size for annotative objects. The annotation scale you set
for layout viewports and model space determines the size of the annotative
objects in those spaces.
490 | Chapter 9 Annotate Drawings

Save to Legacy Drawing File Format
Set the system variable SAVEFIDELITY to 1 when you save a drawing that
contains annotative objects to a legacy drawing file format (AutoCAD 2007
or earlier). This preserves the visual fidelity of the drawing when it is opened
in a release earlier than AutoCAD 2008 by saving individual representations
of each scale of each annotative object. The individual objects are saved to
layers that are used to organize objects of the same scale. Setting SAVEFIDELITY
to 0, when opening the drawing in AutoCAD 2008 or later release, results in
improved performance. For more information about saving a drawing to a
previous release, see Save a Drawing (page 48).
Set Annotation Scale
Annotation scale is a setting that is saved with model space, layout viewports,
and model views. When you add annotative objects to your drawing, they
support the current annotation scale and are scaled based on that scale setting
and automatically displayed at the correct size in model space.
Set Annotation Scale
Before you add annotative objects to your model, you set the annotation scale.
Think about the eventual scale settings of the viewports in which the
annotations will display. The annotation scale should be set to the same scale
as the viewport in which the annotative objects will display in the layout (or
the print scale if printing from model space). For example, if the annotative
objects will display in a viewport that has a scale of 1:2, then you set the
annotation scale to 1:2.
When working on the Model layout or when a viewport is selected, the current
annotation scale is displayed on the status bar. You can use the status bars to
change the annotation scale. You can reset the annotation scale list to the
default list of scales stored with your user profile in the Default Scale List dialog
box.
You can use the ANNOAUTOSCALE system variable to update annotative
objects to support the current scale automatically when the annotation scale
is changed. ANNOAUTOSCALE is turned off by default to keep file size down
and improve performance. When ANNOAUTOSCALE is off, this button
is displayed this way on the right side of the status bar.
Use the CANNOSCALE system variable to set a default annotation scale setting.
Work with Annotations | 491

You can reset the list of annotative scales in a drawing to the default list of
either metric or imperial scales defined in the registry with the Default Scale
dialog box. The unused scales in the drawing are purged and the customized
list of scales from your user profile are merged into the drawing
See also:
The Status Bar (page 28)
Create Annotative Objects
Objects that are commonly used to annotate drawings have a property called
Annotative. When the Annotative property for these objects is turned on (set
to Yes), these objects are called annotative objects
Overview of Creating Annotative Objects
When you add annotations to your drawing, you can turn on the Annotative
property for those objects. These annotative objects are scaled based on the
current annotation scale setting and are automatically displayed at the correct
size.
Overview of Creating Annotative Objects
Annotative objects are defined at a paper height and display at the size
determined by the annotation scale.
The following objects can be annotative (have an Annotative property):
■ Hatches
■ Text (single-line and multiline)
■ Dimensions
■ Tolerances
■ Leaders and multileaders (created with MLEADER)
■ Blocks
■ Attributes
492 | Chapter 9 Annotate Drawings

Many of the dialog boxes used to create these objects contain an Annotative
check box where you can make the object annotative. You can also change
existing objects to be annotative by changing the annotative property in the
Properties Inspector palette.
When you hover the cursor over an annotative object that supports one
annotation scale, the cursor displays a icon. When the object supports
more than one annotation scale, it displays a icon.
Text, dimension, and multileader styles can also be annotative. Annotative
styles create annotative objects.
Visual Fidelity for Annotative Objects
When working with annotative objects, this option allows you to maintain
visual fidelity for these objects when they are viewed in AutoCAD 2007 and
earlier releases. Visual fidelity is controlled by the SAVEFIDELITY system
variable.
If you work primarily in model space, it is recommended that you turn off
visual fidelity (set SAVEFIDELITY to 0). However, if you need to exchange
drawings with other users, and layout fidelity is most important, then visual
fidelity should be turned on (set SAVEFIDELITY to 1).
NOTE The SAVEFIDELITY system variable does not affect saving a drawing to the
AutoCAD 2010 drawing or DXF file formats.
Annotative objects may have multiple scale representations. When visual
fidelity is on, annotative objects are decomposed and scale representations
are saved (in an anonymous block) to separate layers, which are named based
on their original layer and appended with a number. If you explode the block
in AutoCAD 2007 or earlier releases, and then open the drawing in AutoCAD
2008 or later releases, each scale representation becomes a separate annotative
object, each with one annotation scale. It is not recommended that you edit
or create objects on these layers when working with a drawing created in
AutoCAD 2008 and later releases in AutoCAD 2007 and earlier releases.
When this option is not selected, a single model space representation is
displayed on the Model layout. More annotation objects may be displayed on
the Model layout depending on the ANNOALLVISIBLE setting. Also, more
objects may be displayed in paper space viewports at different sizes than in
AutoCAD 2008 and later releases.
Work with Annotations | 493

See also:
Work with Annotative Styles (page 494)
Work with Annotative Styles
You can minimize the steps to annotate a drawing by using annotative styles.
Work with Annotative Styles
Annotative text, dimension, and multileader styles create annotative objects.
The dialog boxes used to define these objects contain an Annotative check
box where you can make the styles annotative. Annotative styles display a
special icon before their names in dialog boxes and the Properties Inspector
palette.
You should specify the Paper Text Height value for any annotative text styles
you create. The Paper Text Height setting specifies the height of the text in
paper space.
NOTE If you have specified the Text Height value for a dimension or multileader
style, this setting overrides the text style Paper Text Height setting.
If you redefine styles to be annotative or non-annotative, existing objects that
reference those styles are not automatically updated to reflect the annotative
property of the style or definition. Use the ANNOUPDATE command to update
the existing objects to the current annotative properties of the style.
When you change the Style property of an existing object (whether it’s
annotative or non-annotative), the object’s annotative properties will match
that of the new style. If the style does not have a fixed height (the Text Height
value is 0), the paper height of the object is calculated based on the object’s
current height and the annotation scale.
See also:
Work with Text Styles (page 540)
Create Annotative Text (page 495)
Use Dimension Styles (page 565)
Create Annotative Dimensions and Tolerances (page 495)
494 | Chapter 9 Annotate Drawings

Work with Leader Styles (page 533)
Create Annotative Leaders and Multileaders (page 497)
Create Annotative Text
Use annotative text for notes and labels in your drawing. You create annotative
text by using an annotative text style, which sets the height of the text on
the paper.
Create Annotative Text
The current annotation scale automatically determines the display size of the
text in model space or paper space viewports.
For example, you want text to display at a height of 3/16" on the paper, so
you can define a text style to have a paper height of 3/16". When you add
text to a viewport that has a scale of 1/2"=1'0", the current annotation scale,
which is set to the same scale as the viewport’s, automatically scales the text
to display appropriately at 4.5".
You can also change existing non-annotative text to annotative by changing
the text’s Annotative property to Yes (On). This applies to any text created
through text styles or through the TEXT and MTEXT commands.
You can set the orientation of annotative text objects to match the orientation
of the paper. For more information about setting the orientation of annotative
objects, see Set Orientation for Annotations (page 502).
See also:
Create Text (page 517)
Work with Annotative Styles (page 494)
Set Orientation for Annotations (page 502)
Create Annotative Dimensions and Tolerances
You can create annotative dimensions for measurements in your drawing
through annotative dimension styles.
Work with Annotations | 495
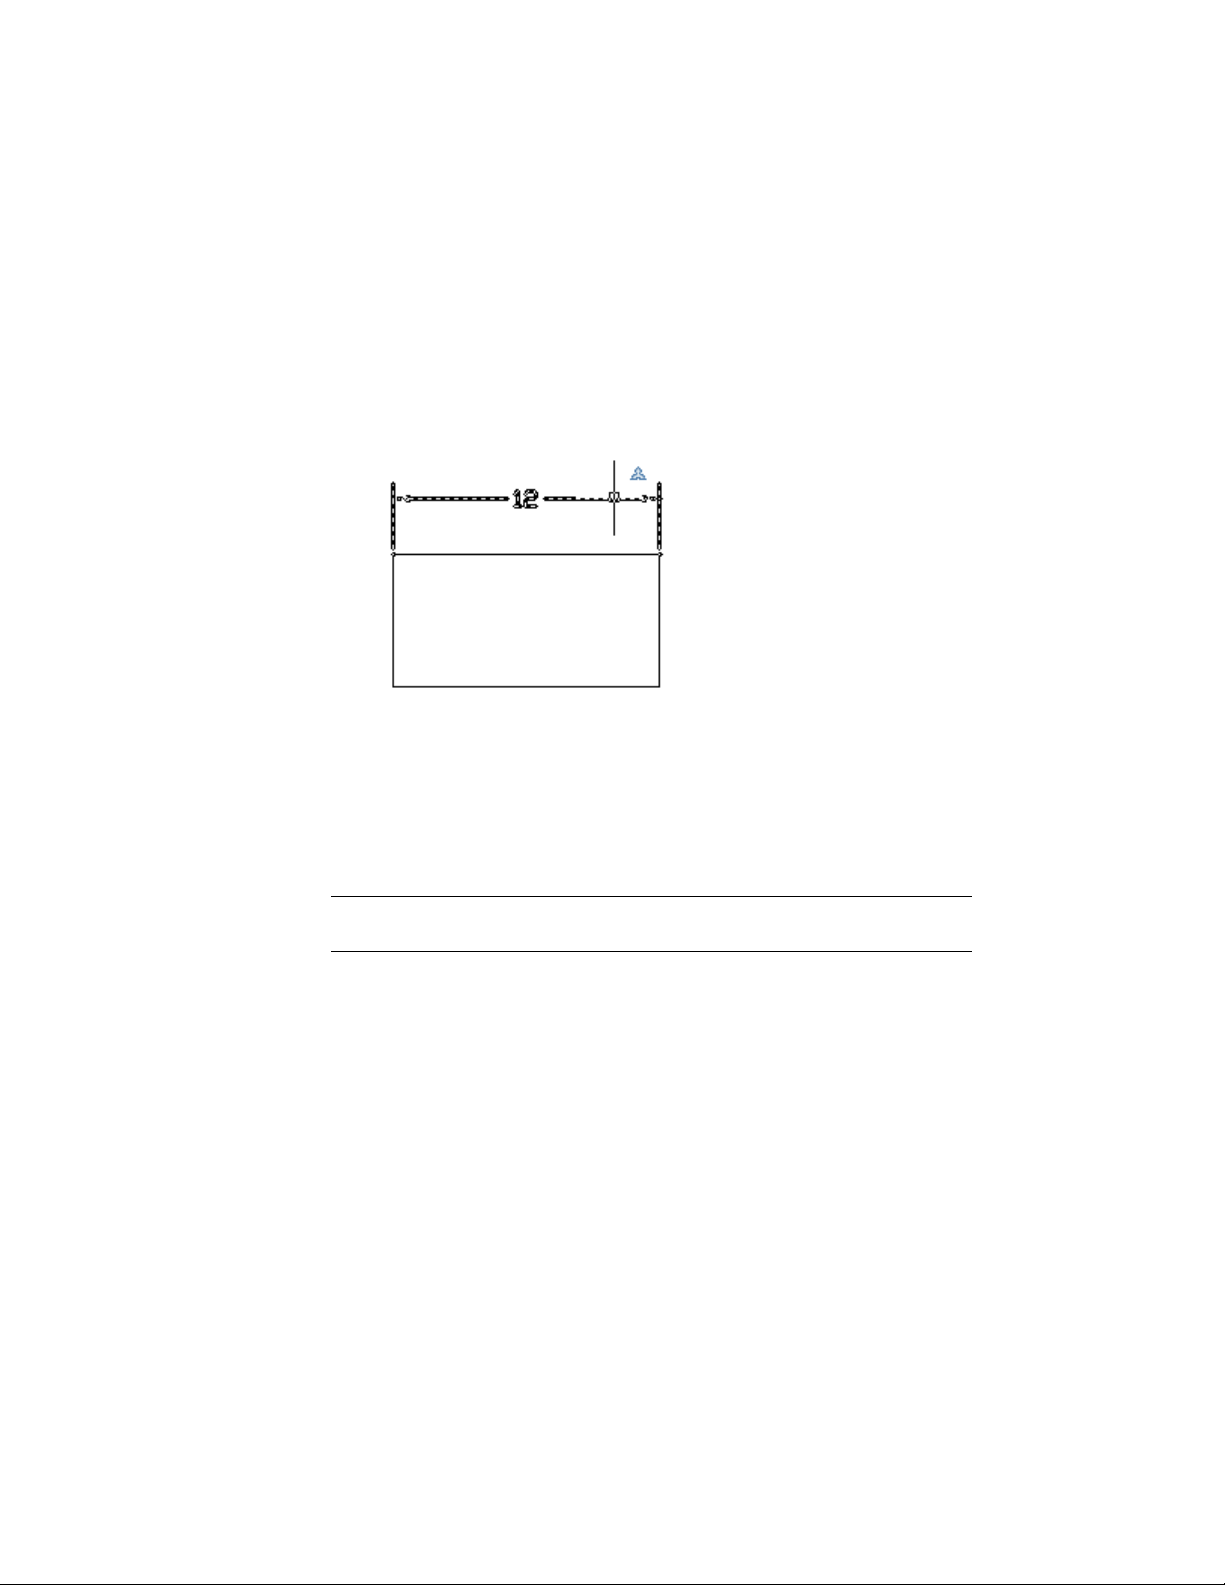
Create Annotative Dimensions and Tolerances
Annotative dimension styles create dimensions in which all the elements of
the dimension, such as text, spacing, and arrows, scale uniformly by the
annotation scale.
If you associate a dimension to an annotative object, the associativity of the
dimension is lost.
You can also change an existing non-annotative dimension to annotative by
changing the dimension’s Annotative property to Yes (On).
NOTE When the current dimension style is annotative, the value of DIMSCALE is
automatically set to zero, and does not affect the dimension scale.
You can also create annotative tolerances. Geometric tolerances show
acceptable deviations of form, profile, orientation, location, and runout of a
feature.
See also:
Dimensions and Tolerances (page 561)
Use Dimension Styles (page 565)
Work with Annotative Styles (page 494)
496 | Chapter 9 Annotate Drawings

Create Annotative Leaders and Multileaders
Leaders and multileaders are used to add call outs to your drawings. You can
create annotative leaders through an annotative dimension style and
multileaders through an annotative multileader style.
Create Annotative Leaders and Multileaders
When you create a leader, you create two separate objects: the leader and the
text, block, or tolerance associated with the leader. When you create a
multileader, you create a single object.
If the multileader style is annotative, the associated text or tolerance will be
annotative as well, regardless of the annotative setting of the text style or
tolerance.
NOTE It is recommended that you create non-annotative entities when creating
a multileader content block.
Blocks used in leaders and multileaders must be non-annotative.
You can change the Annotative property of leaders and multileaders in the
Properties Inspector palette.
See also:
Create Leaders (page 529)
Work with Leader Styles (page 533)
Create Annotative Blocks and Attributes
If you want to use geometric objects to annotate your drawing, combine the
objects into an annotative block definition.
Create Annotative Blocks and Attributes
Annotative block definitions create annotative block references. Annotative
block references and attributes initially support the current annotation scale
Work with Annotations | 497
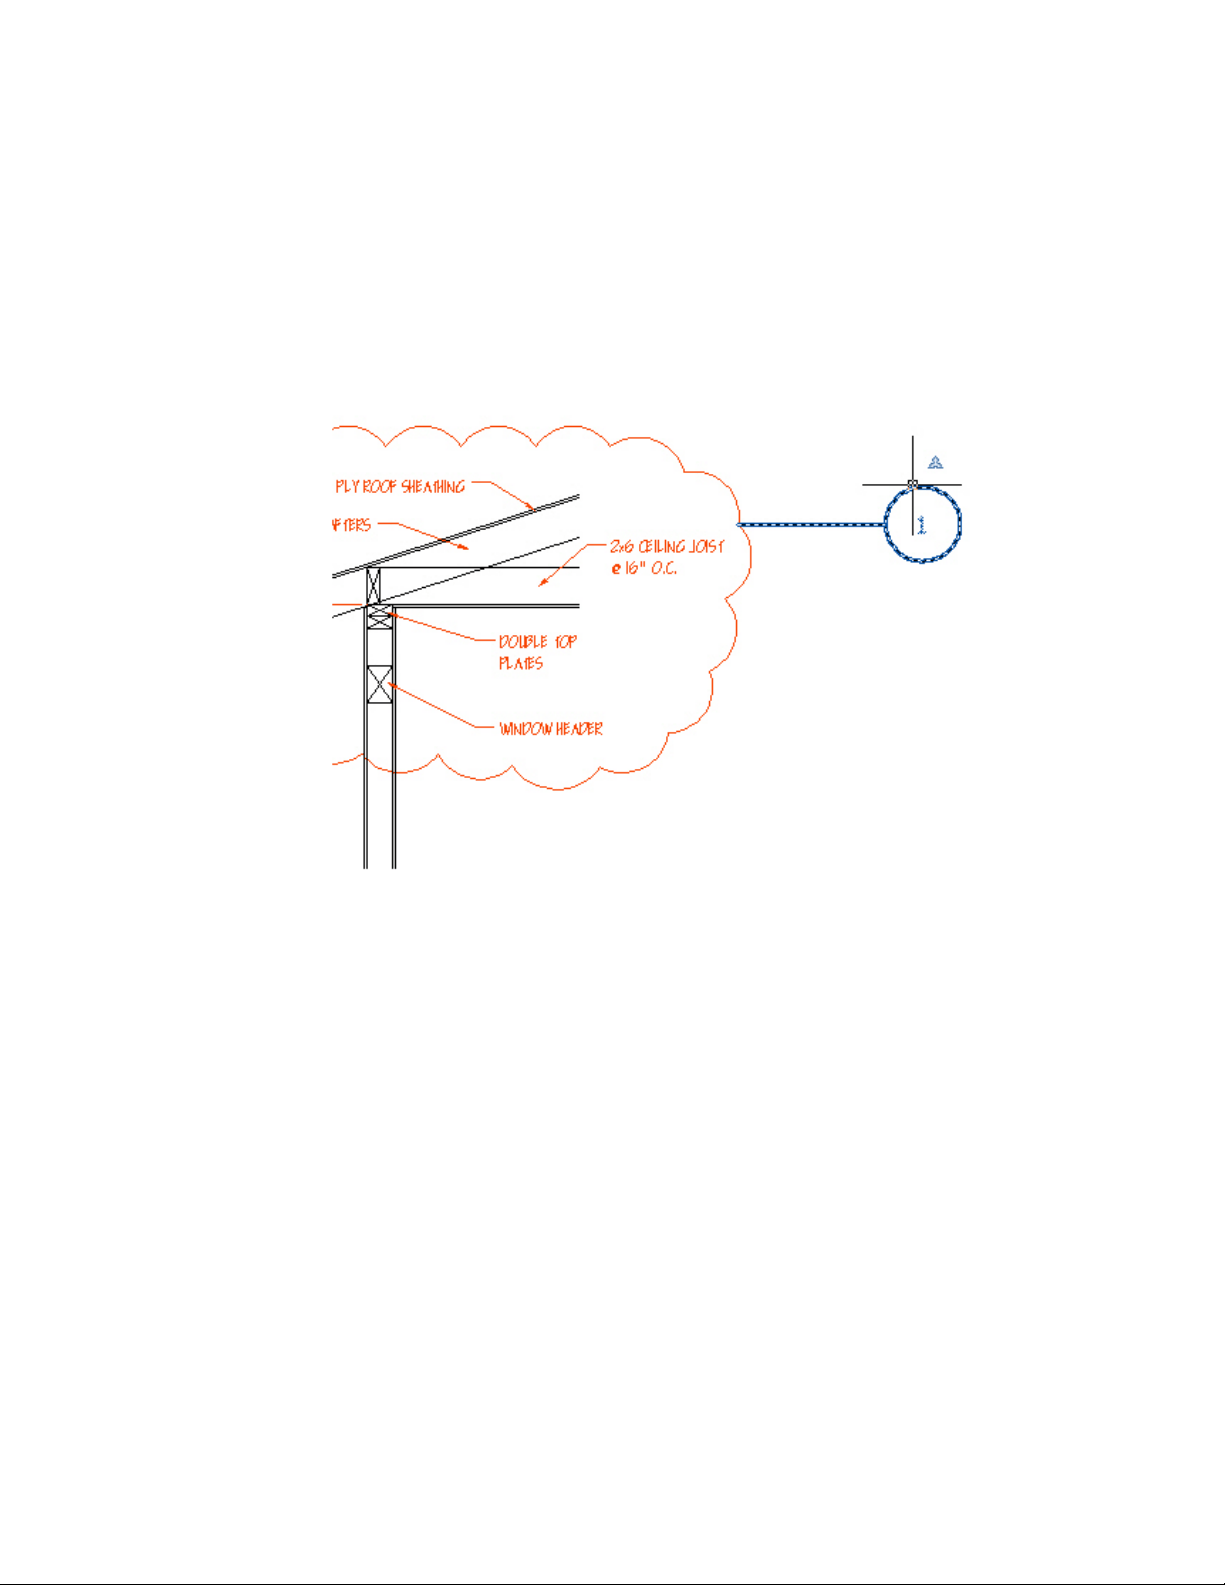
at the time they are inserted. You should insert annotative block references
with a unit factor of 1.
You cannot change the Annotative property of individual block references.
To set an annotative block’s paper size, you should define the block in paper
space or on the Model layout with the annotation scale set to 1:1.
When creating and working with annotative blocks and annotative objects
within blocks, the following points should be noted:
■ Non-annotative blocks can contain annotative objects, which are scaled
by the block’s scale factor in addition to the annotation scale.
■ Annotative blocks cannot reside in annotative blocks.
■ Annotative block references are scaled uniformly by the current annotation
scale as well as any user scale applied to the block reference.
■ Blocks that contain annotative objects should not be manually scaled.
498 | Chapter 9 Annotate Drawings

You can define annotative attributes for annotative and non-annotative blocks.
Use annotative attributes with non-annotative blocks when you want the
geometry in the block to display on the paper based on the scale of the
viewport, but you want the attribute text to display at the Paper Text Height
defined for the attribute.
You can set the orientation of annotative blocks to match the orientation of
the paper. For more information about setting the orientation of annotative
objects, see Set Orientation for Annotations (page 502).
You can use the ANNOTATIVEDWG system variable to specify whether or
not the entire drawing will behave as an annotative block when inserted into
another drawing. The ANNOTATIVEDWG system variable becomes read-only
if the drawing contains annotative objects.
NOTE The INSUNITS setting is ignored when inserting annotative blocks into a
drawing.
See also:
Work with Blocks (page 307)
Attach Data to Blocks (Block Attributes) (page 323)
Set Orientation for Annotations (page 502)
Create Annotative Hatches
Use an annotative hatch to symbolically represent material such as sand,
concrete, steel, earth, etc.
Create Annotative Hatches
An annotative hatch is defined at a paper size. You can create individual
annotative hatch objects as well as annotative hatch patterns.
The hatch pattern definitions stored in the acad.pat file contain information
that indicates whether the pattern is annotative or non-annotative.
You can use the HPANNOTATIVE system variable or the user interface to
specify whether or not new hatches are annotative. By default, new hatch
objects are non-annotative.
Work with Annotations | 499
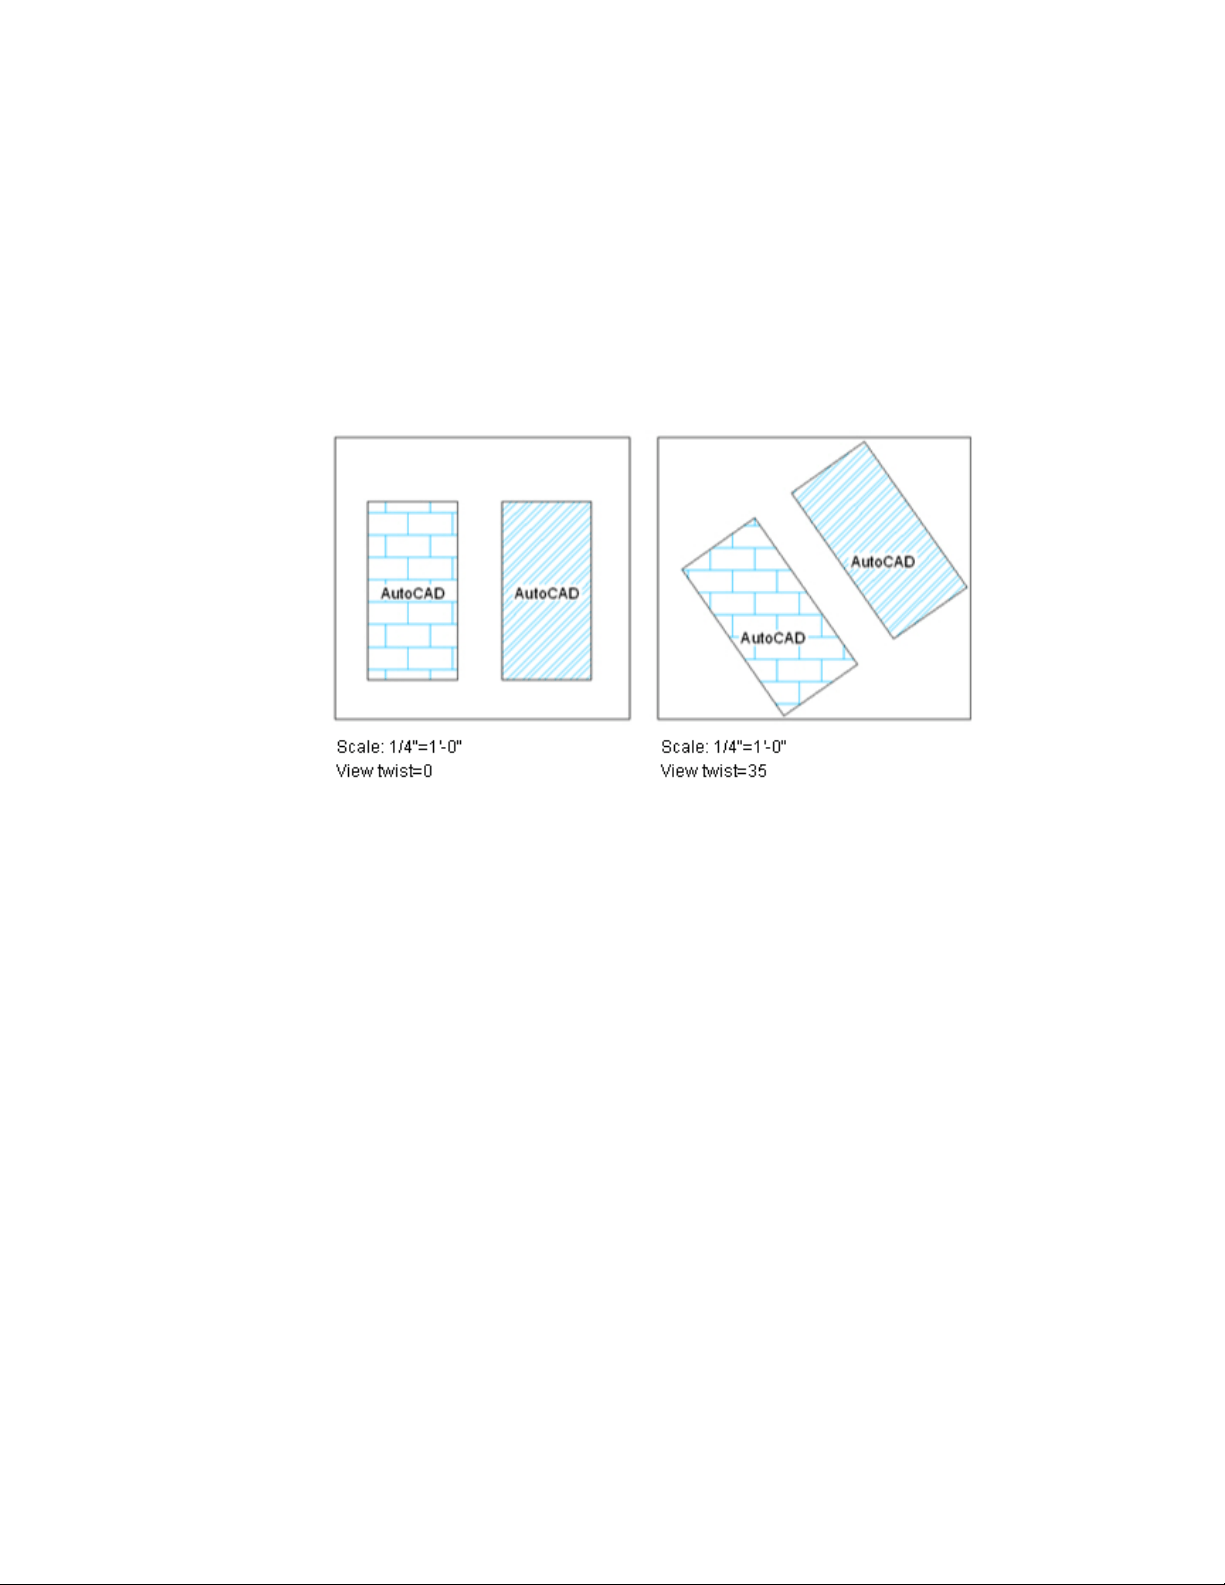
The orientation of annotative hatches always matches the orientation of the
layout.
See also:
Overview of Hatch Pattern Definitions in the Customization Guide
Display Annotative Objects
For model space or a layout viewport, you can display all the annotative objects
or only those that support the current annotation scale.
Display Annotative Objects
This reduces the need to use multiple layers to manage the visibility of your
annotations.
500 | Chapter 9 Annotate Drawings
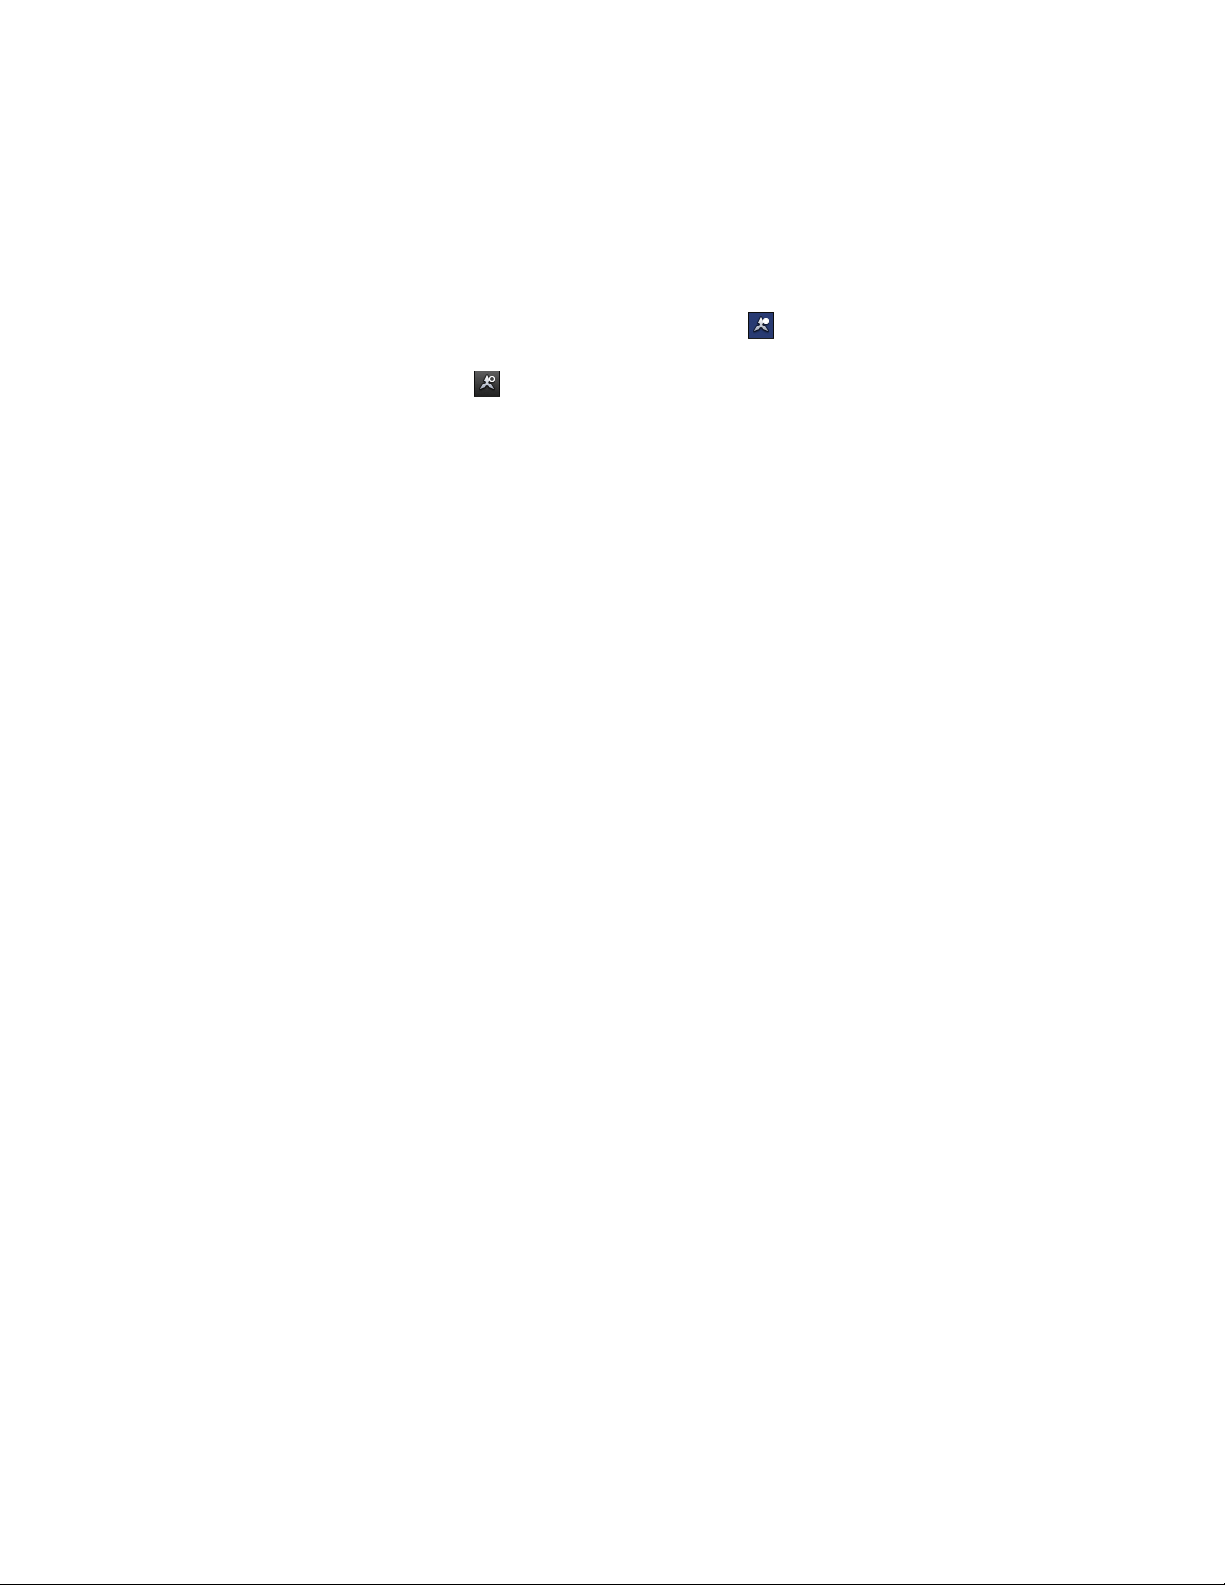
You use the Annotation Visibility button on the right side of the application
or drawing status bar to choose the display setting for annotative objects.
Annotation visibility is turned on by default. When annotation visibility
is turned on, all annotative objects are displayed. When annotation visibility
is turned off , only annotative objects for the current scale are displayed.
In general, you should turn off annotation visibility, except when inspecting
a drawing created by another person or when adding scales to existing
annotative objects.
Annotation visibility is also controlled by the ANNOALLVISIBLE system
variable.
In order for an annotative object to be visible, the layer the object is on must
be turned on.
If an object supports more than one annotation scale, the object will display
at the current scale.
When the MSLTSCALE system variable is set to 1 (default), linetypes displayed
on the model tab are scaled by the annotation scale
See also:
The Status Bar (page 28)
Add and Modify Scale Representations
When you create an annotative object in your drawing, it supports one
annotation scale, the annotation scale that was current when you created the
object. You can update annotative objects to support additional annotation
scales.
Add and Modify Scale Representations
When you update an annotative object to support additional scales, you add
additional scale representations to the object.
For example, if an annotative multileader supports two annotation scales, it
has two scale representations.
When you select an annotative object, grips are displayed on the scale
representation that supports the current annotation scale. You can use these
Work with Annotations | 501
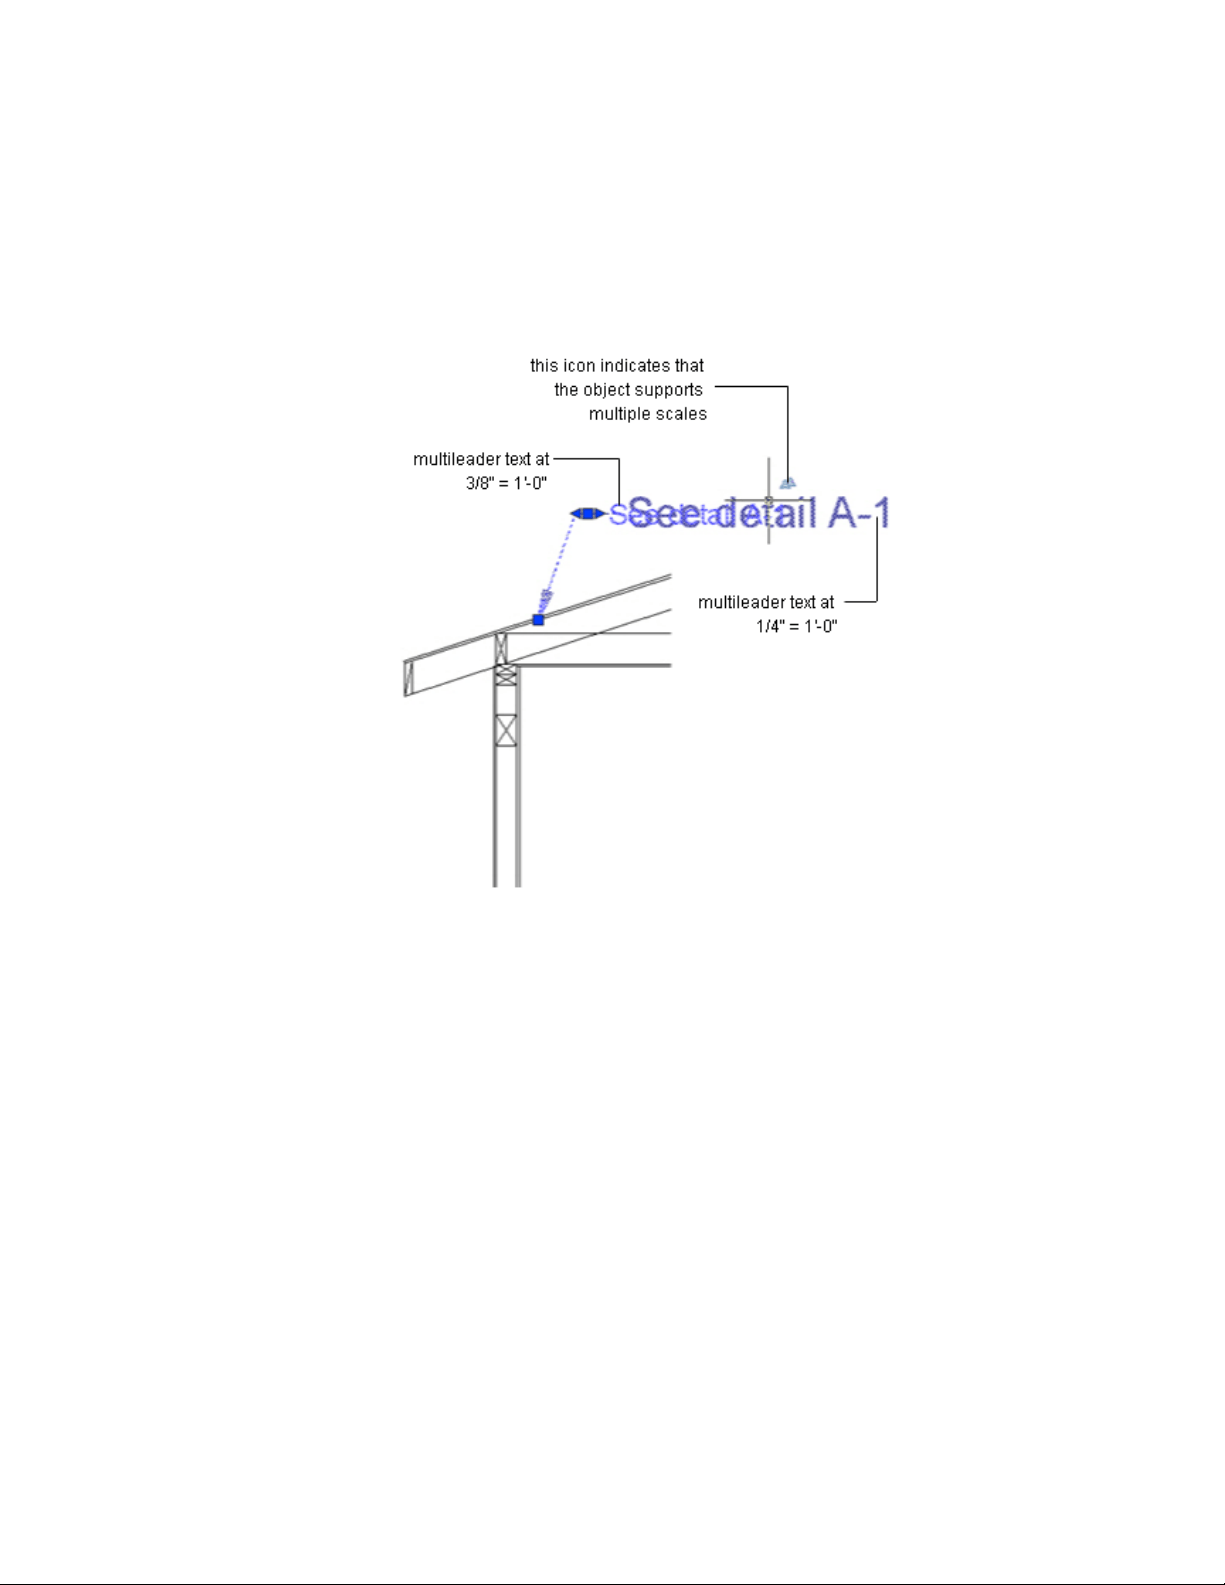
grips to manipulate the current scale representation. All other scale
representations of the object are displayed in a dimmed state when the
SELECTIONANNODISPLAY system variable is set to 1 (default).
Use the ANNORESET command to reset the location of all scale representations
for an annotative object to that of the current scale representation.
Set Orientation for Annotations
Annotative blocks and text can be set so that their orientation matches the
orientation of the layout. The orientation of annotative hatches always matches
the orientation of the layout.
502 | Chapter 9 Annotate Drawings
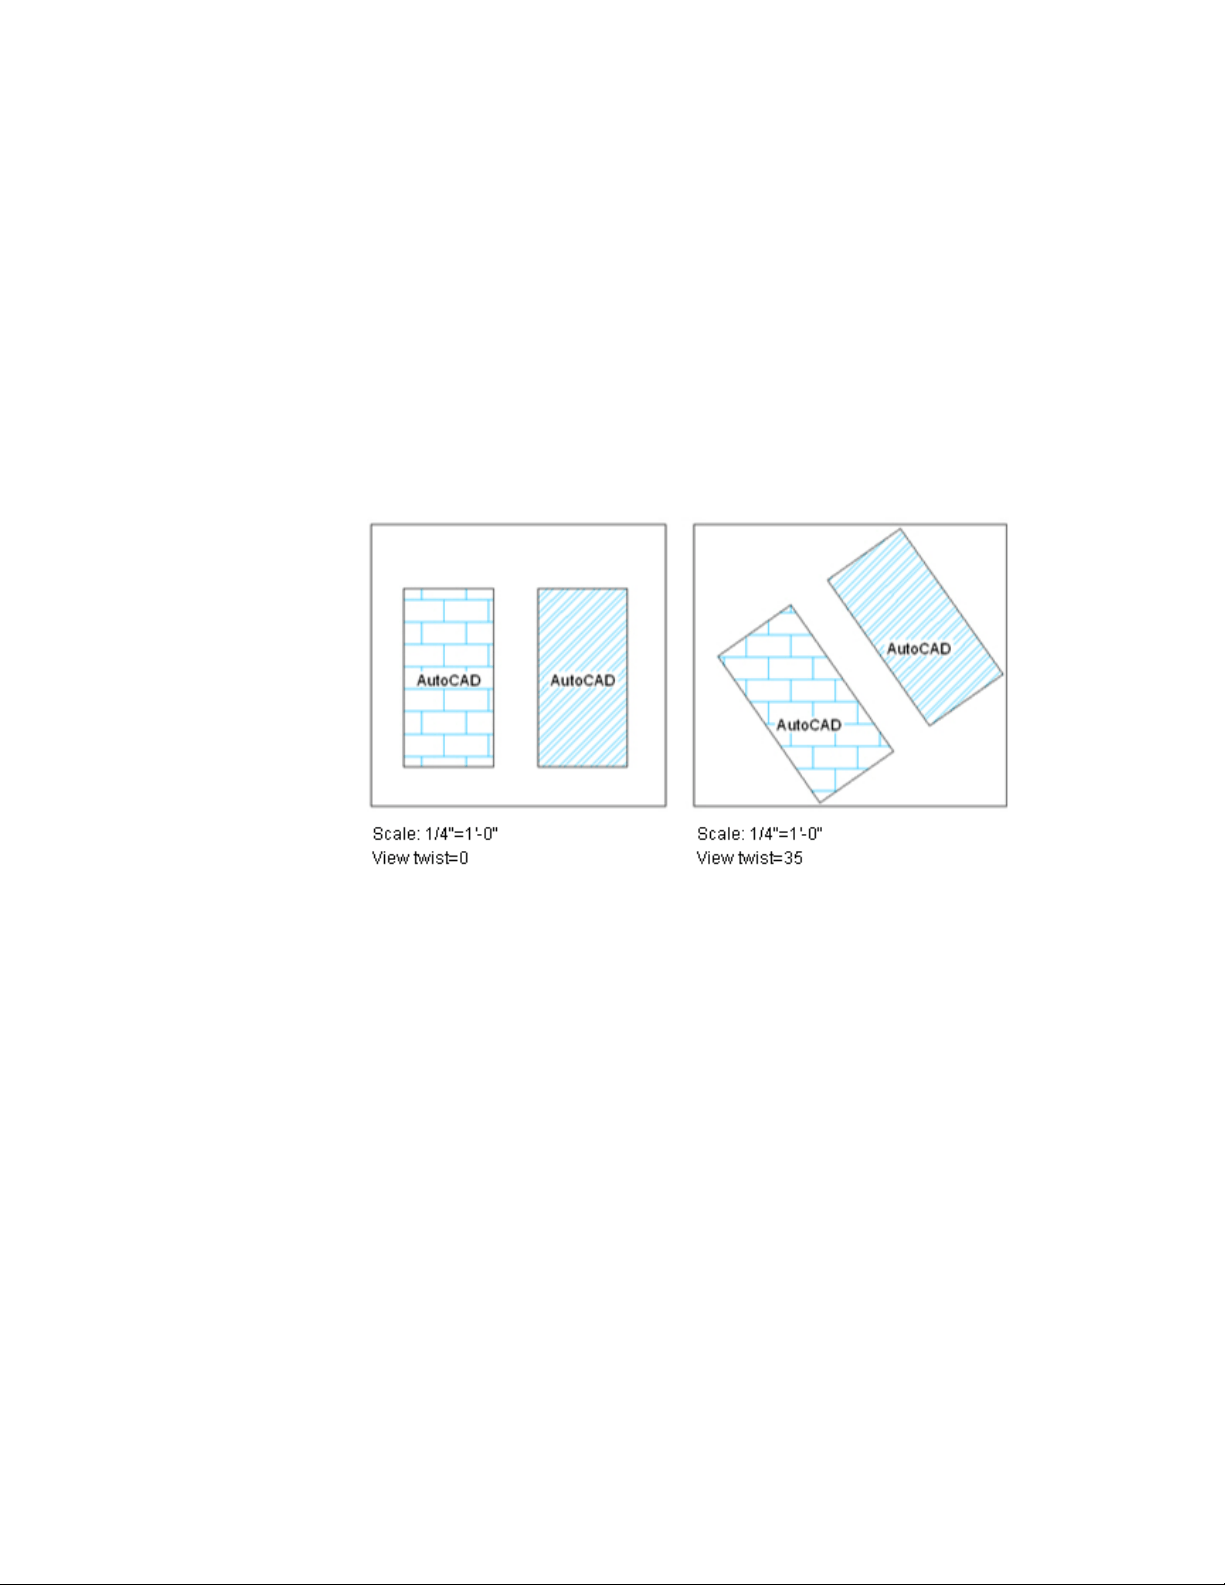
Set Orientation for Annotations
Even if the view in the layout viewport is twisted or if the viewpoint is
non-planar, the orientation of these objects in layout viewports will match
the orientation of the layout.
Annotative attributes in blocks match the paper orientation of the block.
See also:
Work with Text Styles (page 540)
Create Annotative Text (page 495)
Create Annotative Blocks and Attributes (page 497)
Create Annotative Hatches (page 499)
Work with Annotations | 503
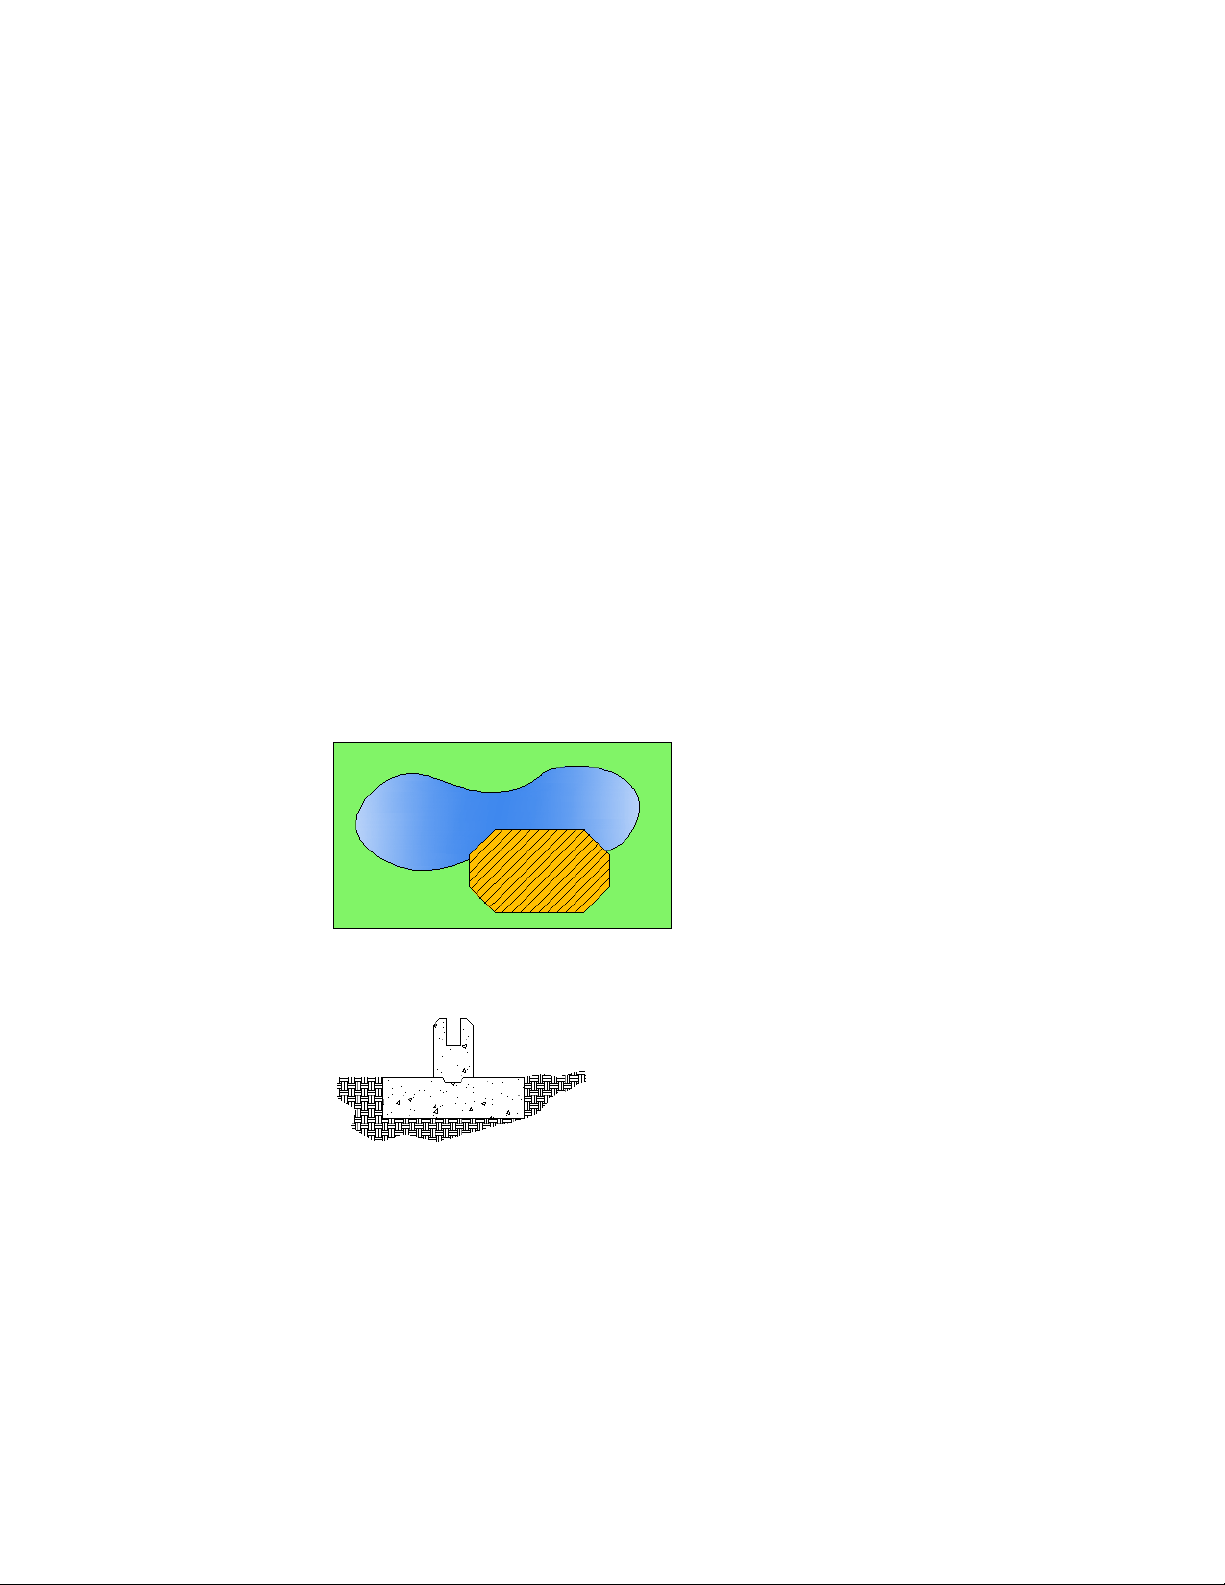
Hatches, Fills, and Wipeouts
Use hatch patterns, a solid fills, or gradient fills to cover an area. Use wipeout
objects to blank out areas.
See also:
Modify Objects (page 232)
Overview of Hatch Pattern Definitions in the Customization Guide
Overview of Hatch Patterns and Fills
A hatch object displays a standard pattern of lines and dots used to highlight
an area, or to identify a material, such as steel or concrete. It can also display
a solid fill or a gradient fill.
Create hatches and fills with the HATCH command. The following illustration
includes a solid fill, a gradient fill, and a hatch pattern. The hatch pattern has
a hatch background color assigned to it.
Hatches and fills do not have to be bounded. In the following illustration, the
concrete hatches are bounded, while the earth hatches are unbounded.
By default, bounded hatches are associative, which means that the hatch object
is associated with the hatch boundary objects, and changes to the boundary
objects are automatically applied to the hatch.
504 | Chapter 9 Annotate Drawings
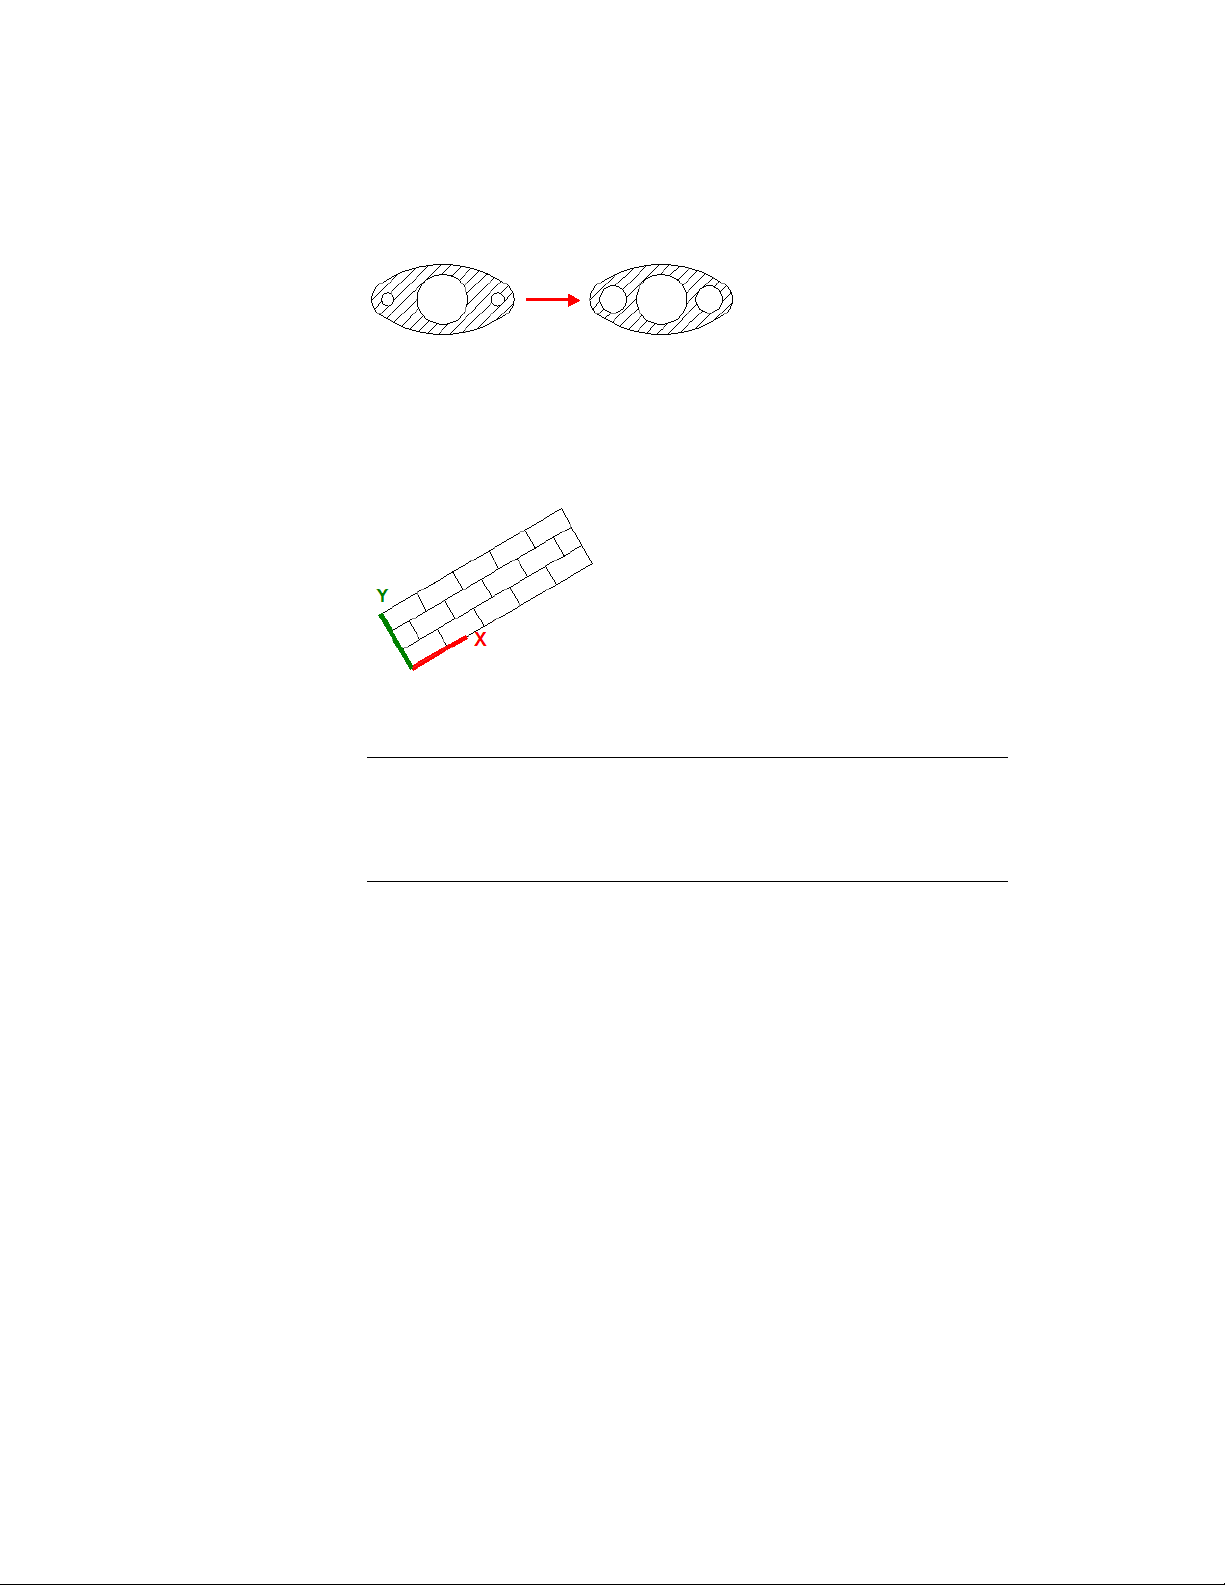
To maintain associativity, the boundary objects must continue to completely
enclose the hatch.
The alignment and orientation of a hatch pattern is determined by the current
location and orientation of the user coordinate system, in addition to controls
in the user interface.
Moving or rotating the UCS is an alternate method for controlling hatch
patterns.
NOTE By default, a preview of the hatch displays as you move the cursor over
enclosed areas. To improve the response time in large drawings, turn off the hatch
preview feature with the HPQUICKPREVIEW system variable, or decrease the time
before the preview is temporarily canceled with the HPQUICKPREVTIMEOUT system
variable.
Alternatively, solid-filled areas can be created using
■ 2D solids (SOLID)
■ Wide polylines (PLINE)
■ Donuts (DONUT)
Specify Hatch and Fill Areas
Define boundaries for hatches and fills from existing objects or from specified
boundary points.
Use one of several methods to specify the 2D geometric boundaries of a hatch
or fill.
■ Specify a point in an area that is enclosed by objects.
Hatches, Fills, and Wipeouts | 505
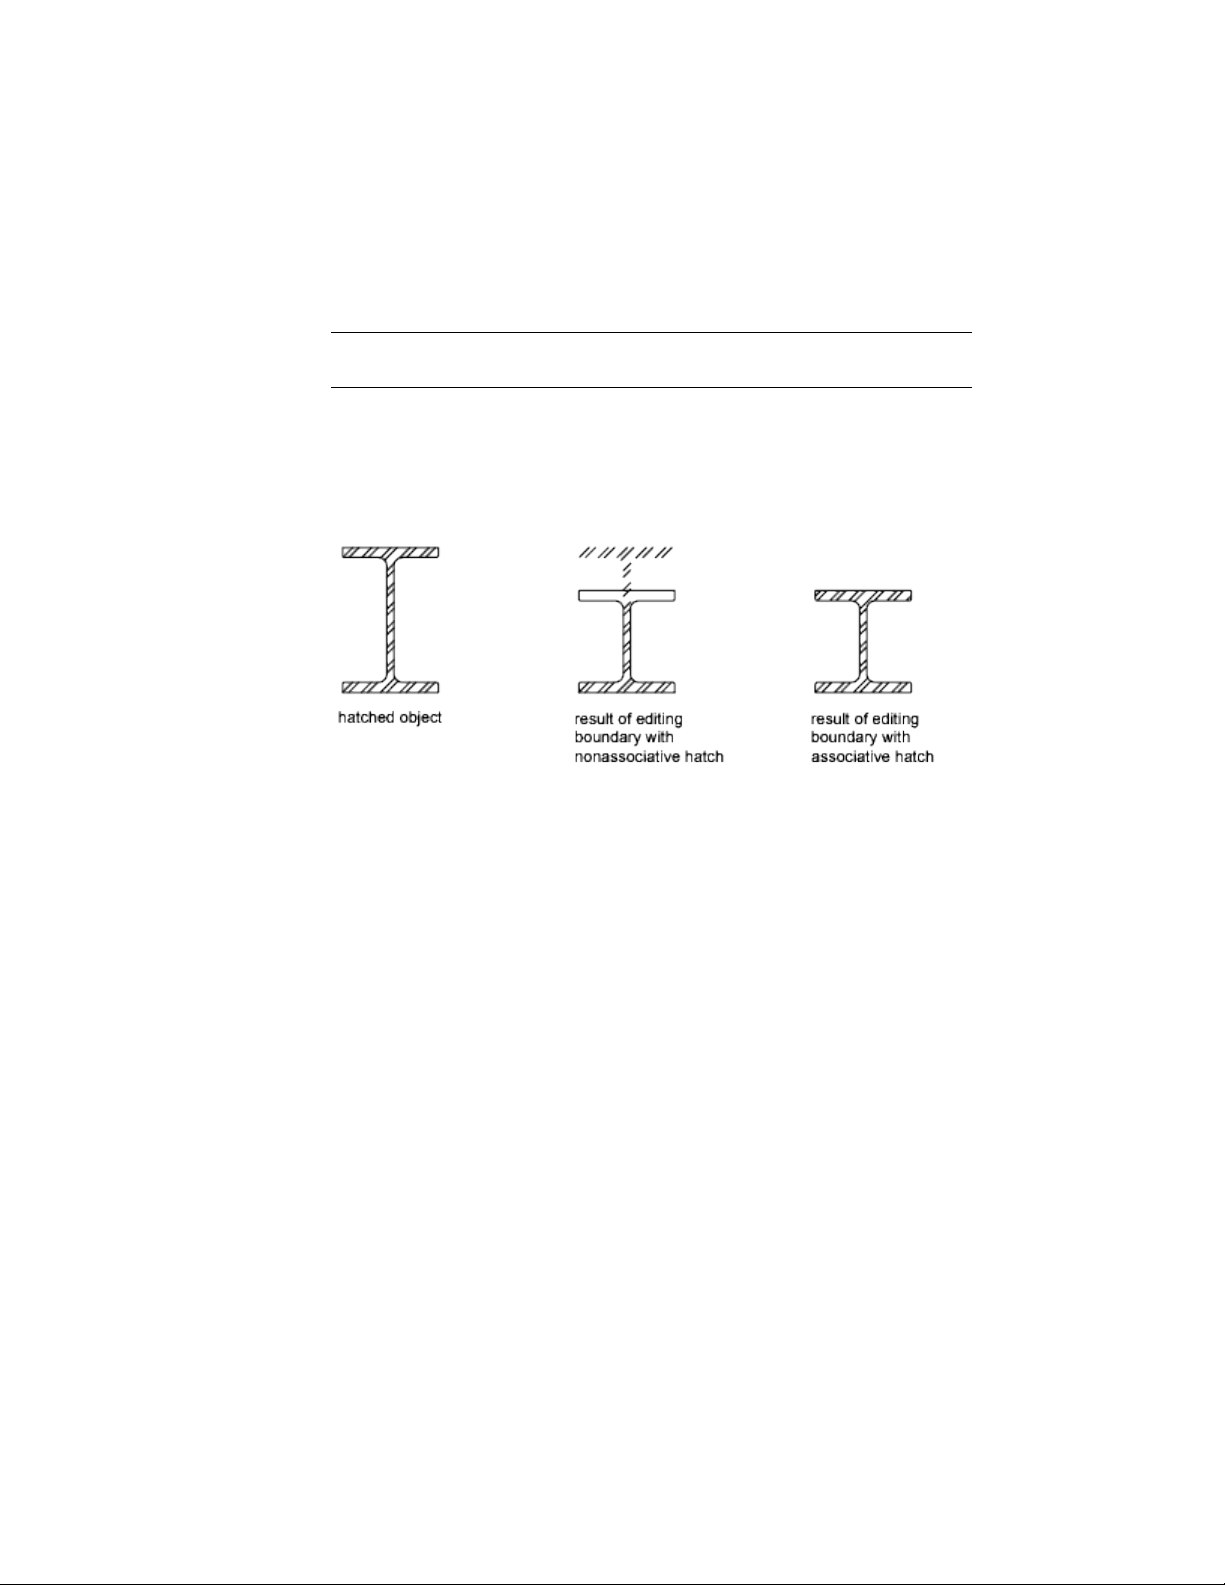
■ Select objects that enclose an area.
■ Specify boundary points using the Draw option of -HATCH.
NOTE Enclosed areas can be hatched only if they are in a plane parallel to the XY
plane of the current UCS.
Create Associative Hatches
Associative hatches are automatically updated when their boundary objects
are modified. Minor changes in the boundary of an associative hatch do not
require erasing and re-creating the hatch.
Hatch associativity is turned on by default and is controlled by the HPASSOC
system variable. You can also control hatch associativity using the following
tools in the user interface:
■ Hatch and Gradient dialog box
■ Hatch Edit dialog box
■ Hatch visor
■ Properties Inspector
Nonassociative hatches are not updated when their original boundary is
changed.
Hatch Enclosed Areas Within Boundaries
Enclosed areas within hatch boundaries are called islands. There are four island
detection styles available from the user interface:
■ Normal island detection
■ Outer island detection (recommended)
■ Ignore island detection
506 | Chapter 9 Annotate Drawings
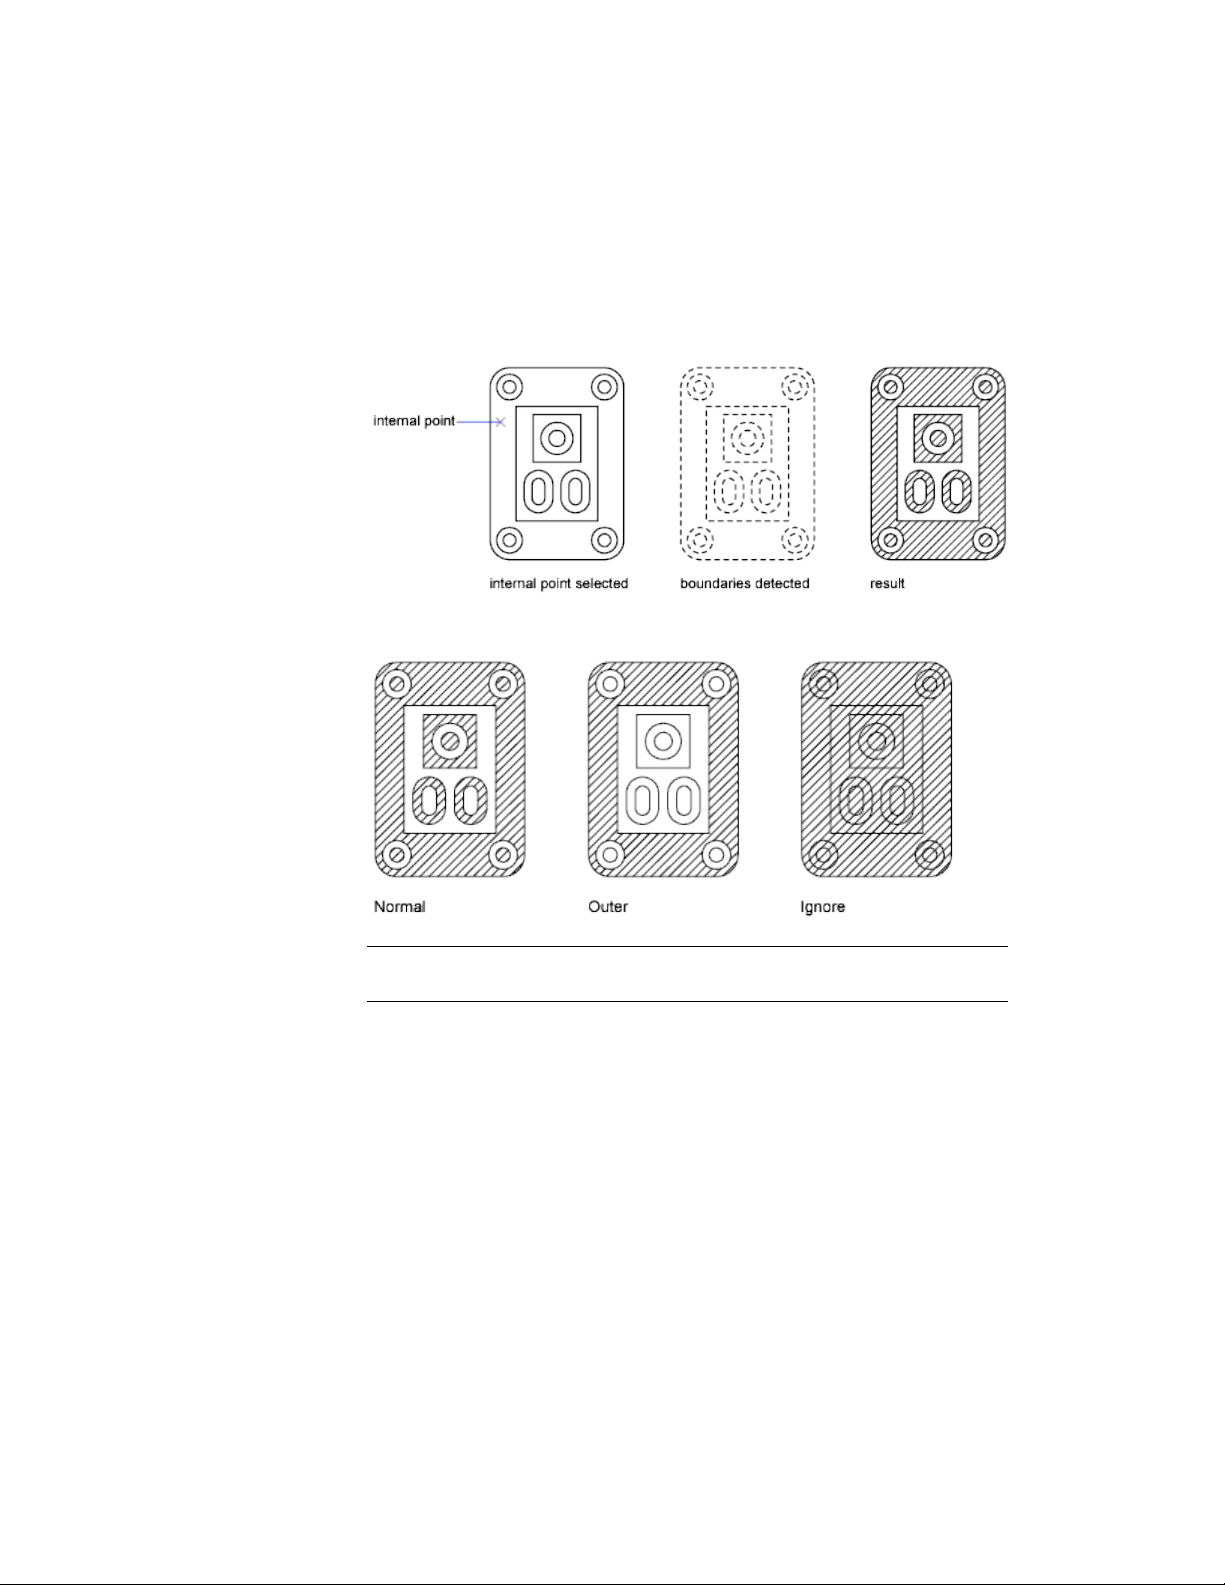
■ No island detection (legacy behavior that is similar to the Ignore style)
Using Normal island detection, if you specify the internal pick point shown,
islands remain unhatched and islands within islands are hatched.
Using the same pick point, the results of the options are compared below.
NOTE Text objects are treated as islands. If island detection is turned on, the result
always leaves a rectangular space around the text.
Include Objects in a Boundary Set
When hatching a small area in a large, complex drawing, you can save time
by selecting a smaller set of objects in the drawing to be used in determining
the hatch boundary.
Hatches, Fills, and Wipeouts | 507
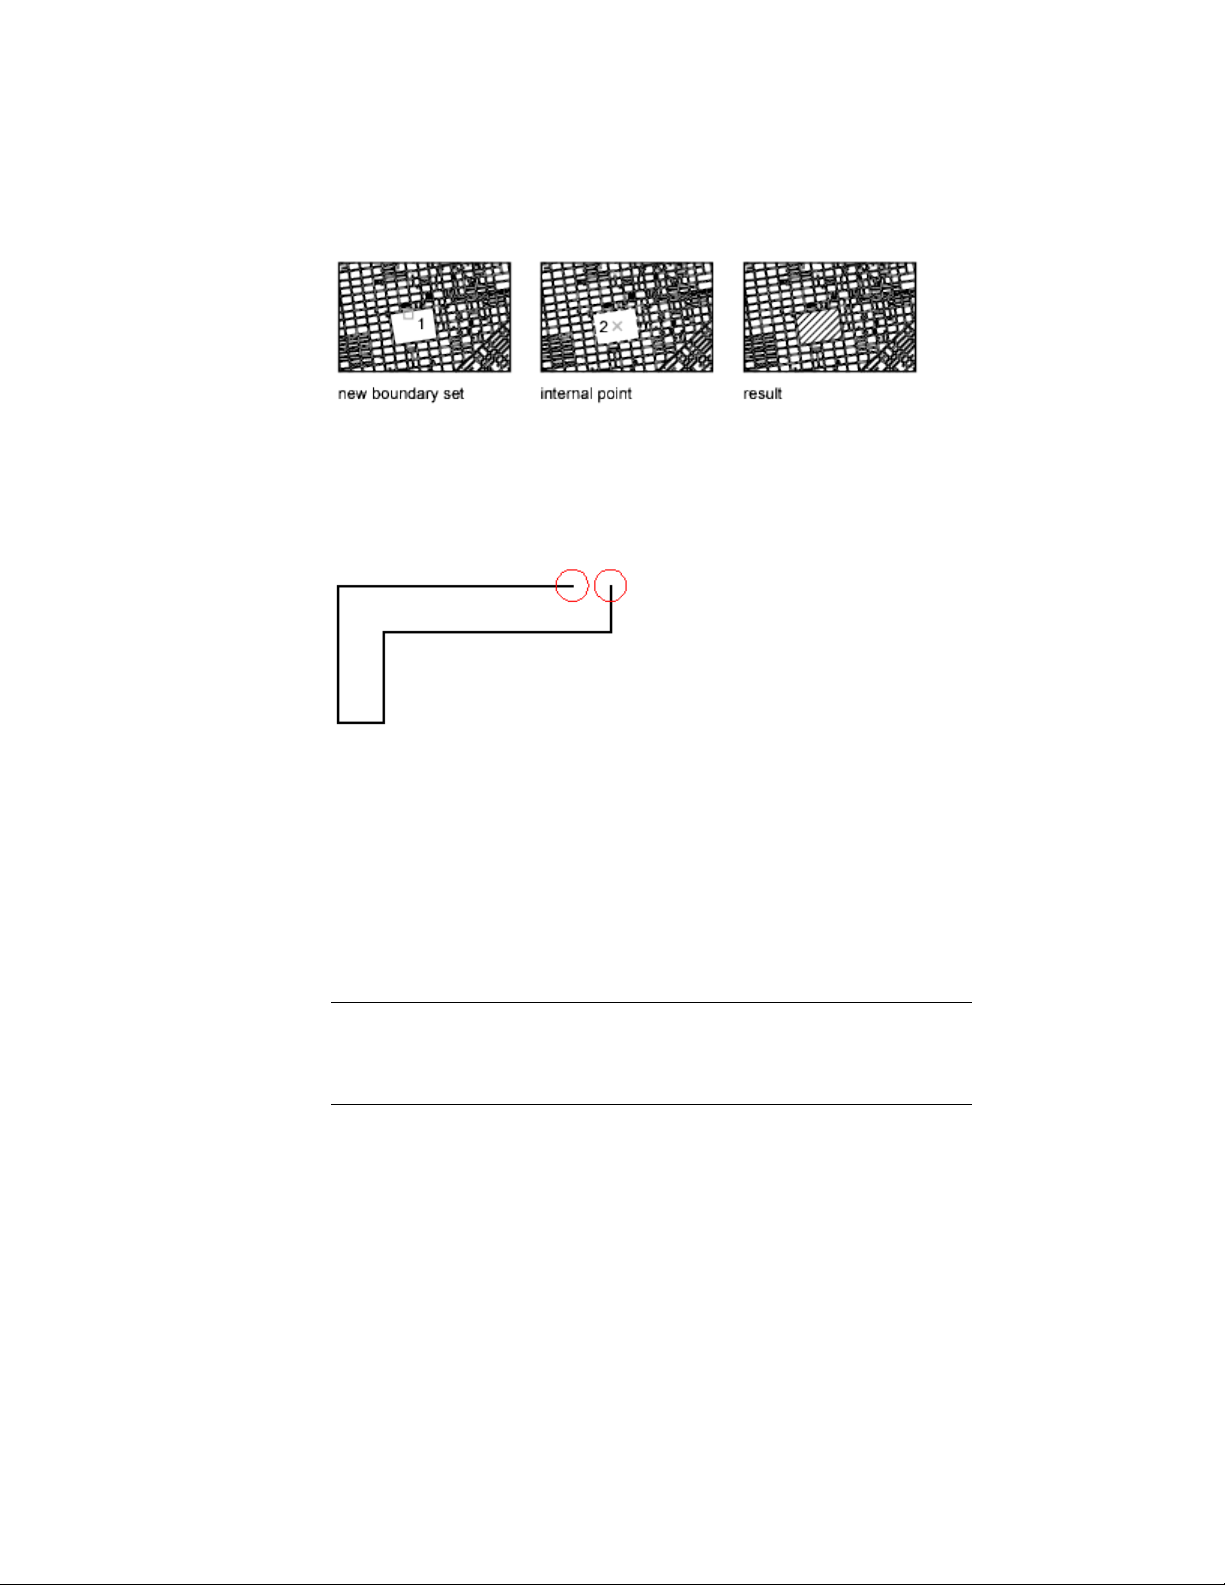
Identify Gaps in Hatch Boundaries
If the specified internal point is not within a fully enclosed area, red circles
are displayed at the unconnected endpoints of the boundary to identify the
gaps.
The red circles remain displayed after you exit HATCH. They are removed
when you specify another internal point for the hatch, or when you use
REDRAW, REGEN, or REGENALL.
To hatch an area whose boundary is not quite closed, do one of the following:
■ Locate the gaps and modify the boundary objects so they form a closed
boundary.
■ Set the HPGAPTOL system variable to a value large enough to bridge the
gaps. HPGAPTOL applies only to gaps between geometric objects that
would meet if extended.
NOTE By default, a preview of the hatch displays as you move the cursor over
bounded areas. To improve the response time in large drawings, turn off the hatch
preview feature (HPQUICKPREVIEW system variable), or decrease the preview
timeout value (HPQUICKPREVTIMEOUT system variable).
See also:
Reshape a Hatch or Fill (page 514)
508 | Chapter 9 Annotate Drawings
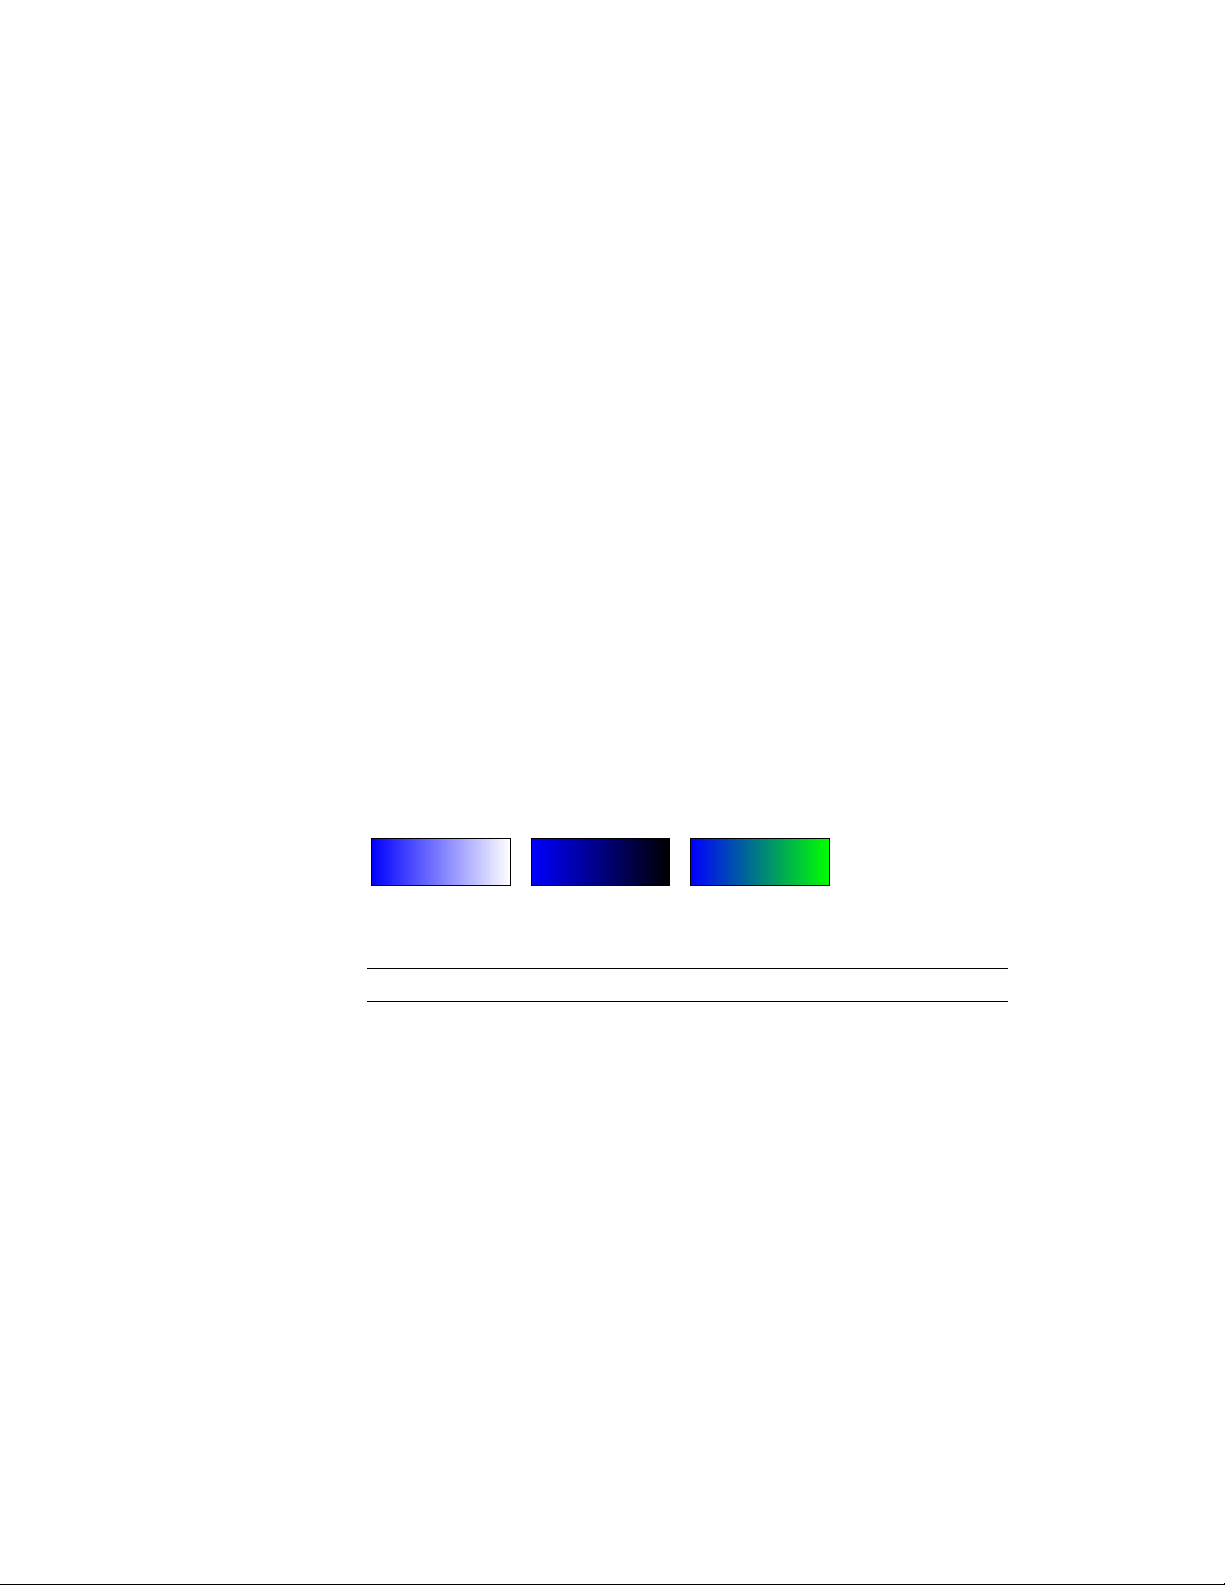
Control the Appearance of Hatches
Specify a hatch pattern or fill, and control its alignment and scale.
Choose a Hatch Pattern or Fill
Choose from three types of hatch patterns, and two types of fills.
■ Predefined hatch patterns. Choose from over 70 ANSI, ISO, and other
industry-standard hatch patterns that are available. You can also use hatch
patterns from hatch pattern libraries supplied by other companies. Hatch
patterns are defined in the acad.pat and acadiso.pat files.
■ User-defined hatch patterns. Define a hatch pattern that uses the
current linetype with a specified spacing and angle.
■ Custom hatch patterns. Define a custom hatch pattern definition in
a .pat file.
■ Solid fill. Fill an area with a solid color by choosing the SOLID predefined
hatch.
■ Gradient fill. Fill an enclosed area with a color gradient. A gradient fill
can be displayed as a tint (a color mixed with white), a shade (a color mixed
with black), or a smooth transition between two colors.
Gradients that mimic colors displayed on a cylinder, a sphere, or other shapes
are available.
NOTE You cannot use plot styles to control the printed color of gradient fills.
Assign a Background Color to Hatch Patterns
Predefined, user defined, and custom hatch patterns, can be assigned a
background fill color. The background fill color shares the same level of
transparency as the pattern itself.
See also:
Modify Hatch Properties (page 513)
Overview of Hatch Pattern Definitions in the Customization Guide
Hatches, Fills, and Wipeouts | 509
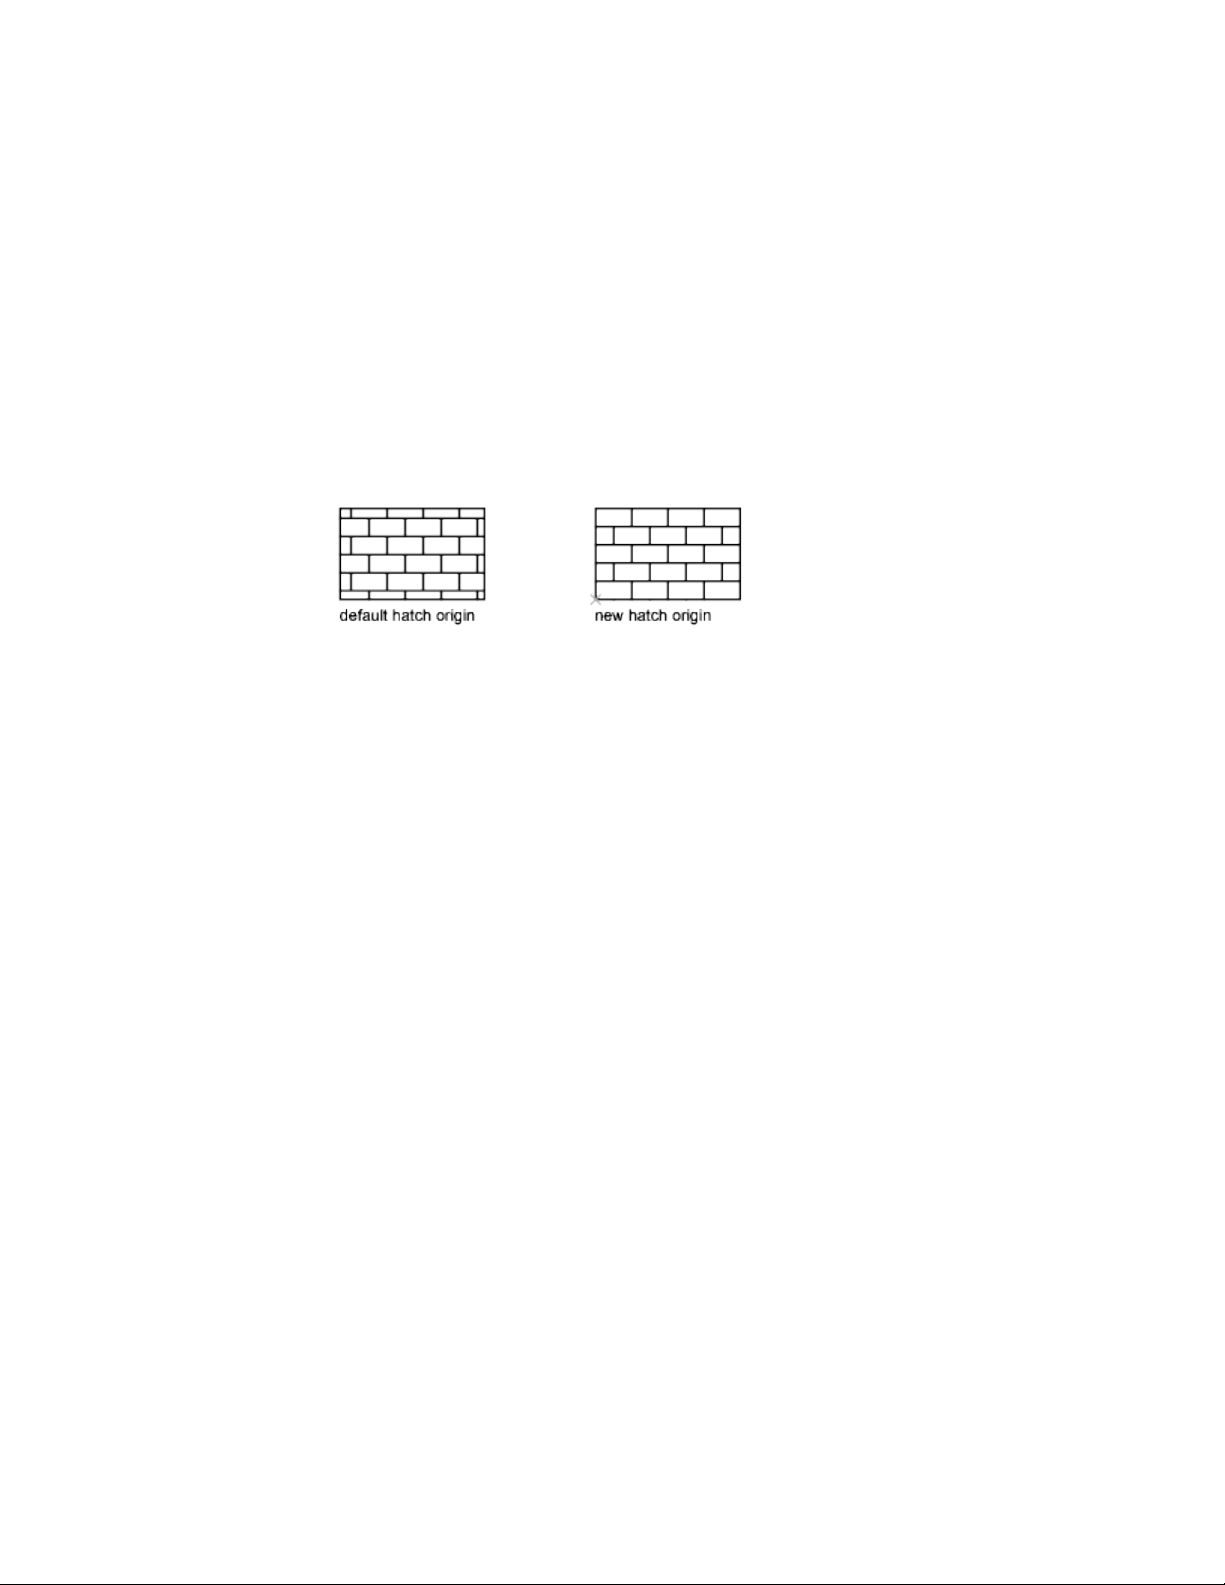
Control the Hatch Origin Point
Each hatch pattern is aligned with an origin point. Changing the origin point
shifts the pattern.
By default, hatch patterns are aligned with the origin point of the user
coordinate system. However, sometimes you need to move the origin point
of the hatch object. For example, if you create a brick pattern, you can start
with a complete brick in the lower-left corner of the hatched area by specifying
a new origin point.
The hatch origin and its behavior depend on settings in the user interface that
control the HPORIGIN, HPORIGINMODE, and HPINHERIT system variables.
Alternatively, you can control hatch patterns by changing the location and
orientation of the user coordinate system.
See also:
Modify Hatch Alignment, Scale, and Rotation (page 513)
Control the Scale of Hatch Patterns
The scale of hatch patterns can be set individually, or it can be set
automatically based on the scale of each layout viewport.
■ If you create hatch patterns exclusively for a single view or at a constant
scale, you can set the current hatch scale manually in the interface or with
the HPSCALE system variable.
■ If you work with layout viewports in different scales, you can apply scale
factors automatically by making them annotative. This method is more
efficient than creating duplicate hatch pattern objects with different scale
factors. For more information about using annotative scaling, see Create
Annotative Hatches (page 499).
510 | Chapter 9 Annotate Drawings

NOTE To prevent accidental creation of an enormous number of hatch lines, the
maximum number of hatch lines created in a single hatch operation is limited.
This limit prevents memory and performance problems. However, you can change
the maximum number of hatch lines with the HPMAXLINES system variable.
Similarly the number of enclosed areas in single hatch is limited by the
HPMAXAREAS system variable.
See also:
Scale Annotations (page 490)
Modify Hatch Alignment, Scale, and Rotation (page 513)
Create Annotative Hatches (page 499)
Set Property Overrides for Hatches and Fills
Control the default color, layer, and transparency of hatch objects separately
from other objects.
Hatch objects have an additional capability that is not available with other
types of objects. You can specify which layer, color, and transparency settings
will be automatically applied to each new hatch object, regardless of the current
property settings. This can save you time.
For example, you can specify that all new hatch objects are automatically
created on a specified layer regardless of the current layer setting.
NOTE If you do not want to override the current property settings, select Use
Current for the hatch’s layer, color, and transparency settings.
See also:
Modify Hatch Properties (page 513)
Control How Overlapping Objects Are Displayed (page 147)
Control the Display of Hatch Boundaries
Hide or remove boundary objects to create hatches without borders.
To create hatches that have no boundary objects, do one of the following:
■ Erase the boundary objects of an existing hatch.
Hatches, Fills, and Wipeouts | 511
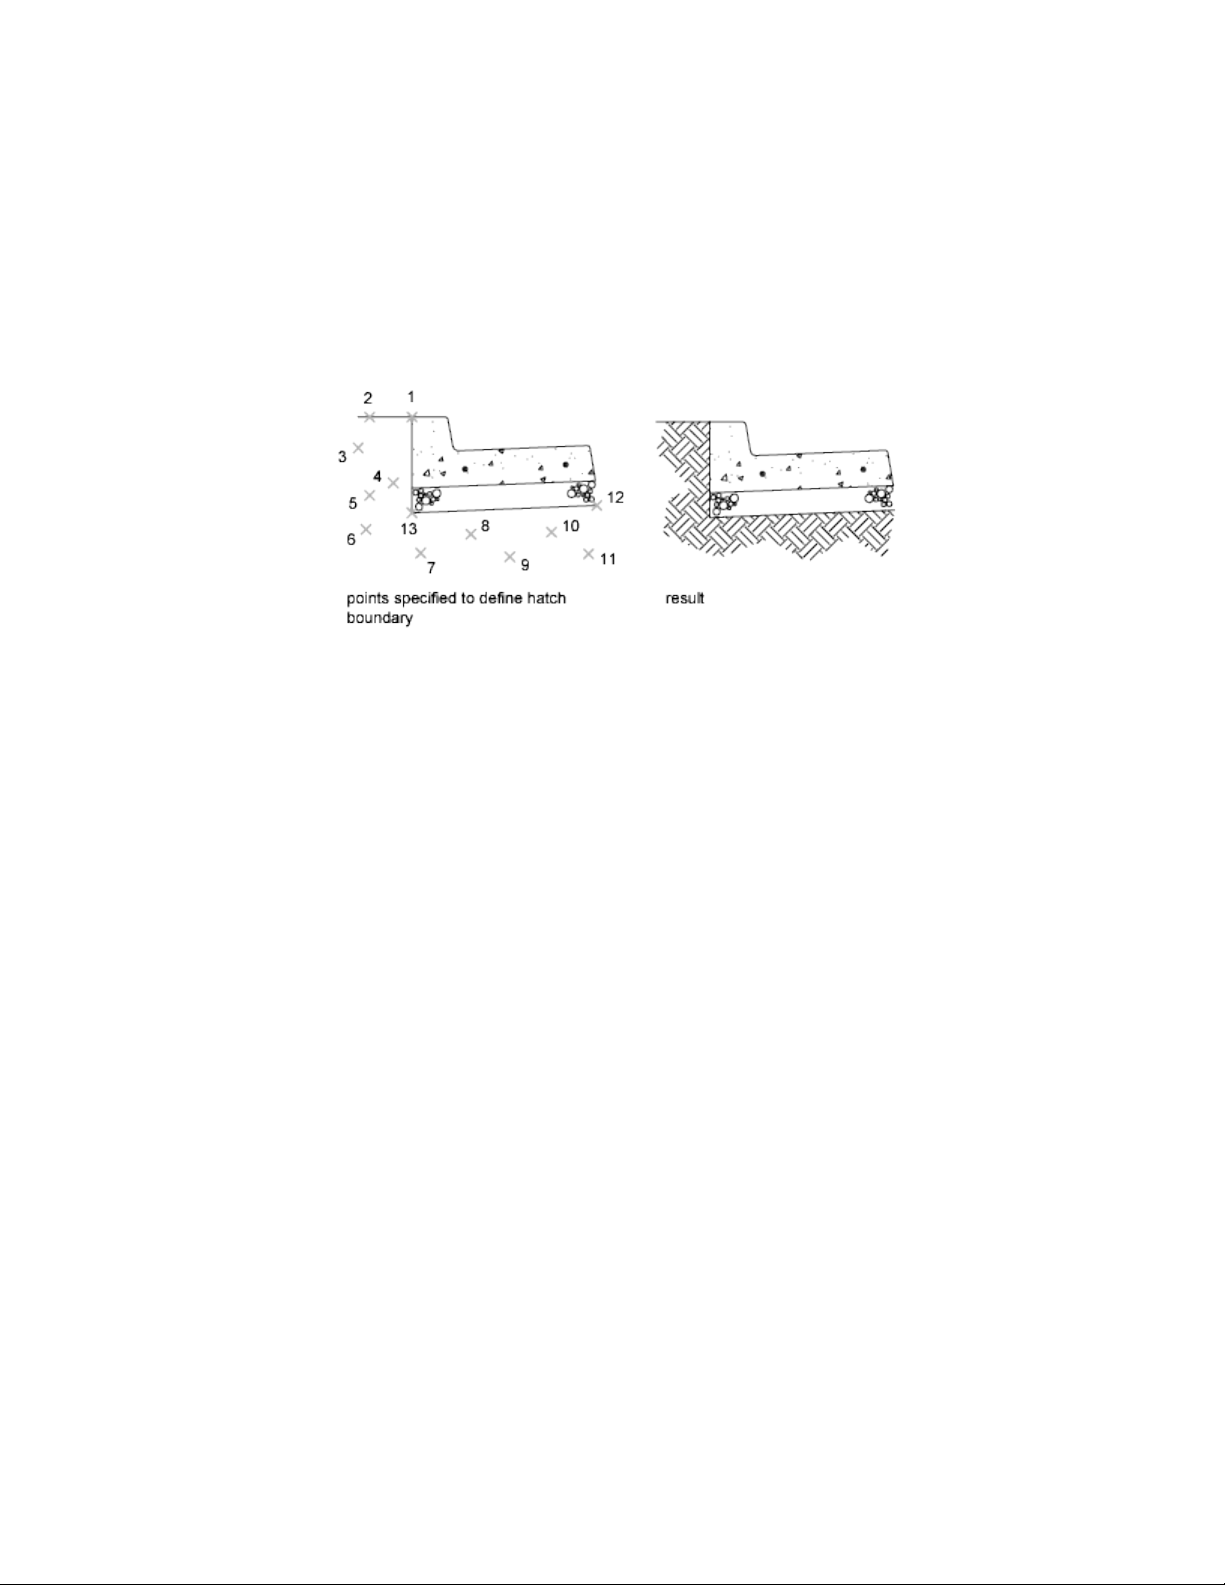
■ Trim an existing hatch to objects that cross the edges of the hatch. After
trimming, erase the objects.
■ Define hatch boundary points with the Draw option of the -HATCH
command.
To hide a hatch's boundary objects, assign the boundary objects to a different
layer than the hatch object, and then turn off or freeze the layer of the
boundary objects. This method maintains hatch associativity.
See also:
Reshape a Hatch or Fill (page 514)
Control the Draw Order of Hatches and Fills
Specify the draw order for a hatch object to control whether it is displayed
behind or in front of the hatch boundary, or behind or in front of all other
objects.
This behavior is controlled by the HPDRAWORDER system variable.
In drawings that contain many hatch objects, use the HATCHTOBACK
command to display all hatch objects behind all other objects.
Modify Hatches and Fills
Modify hatch properties and boundaries, or re-create the boundaries hatch
objects.
512 | Chapter 9 Annotate Drawings

Modify Hatch Properties
Modify the properties of hatch objects directly or copy them from another
hatch object.
The following tools are available for modifying hatch properties:
■ Hatch visor controls. Display on the visor by selecting a hatch or fill
object.
■ Hatch Edit dialog box. Access the dialog box with HATCHEDIT.
■ Properties Inspector.
■ Hatch shortcut menu. Access the menu by right-clicking a hatch object.
■ Hatch dynamic menu. Access the menu by hovering over the control
grip on a selected hatch.
■ Command line. Enter -HATCHEDIT.
When multiple hatches or fills are selected, the Hatch visor is displayed with
the properties common to all the selected hatches or fills enabled.
Copy the properties of one hatch to another using the following methods:
■ Inherit Properties button in the Hatch Edit dialog box. Copy all
hatch-specific properties.
■ Match Properties command. Use MATCHPROP to copy general
properties and hatch-specific properties, with the exception of the hatch
origin.
See also:
Control How Overlapping Objects Are Displayed (page 147)
Modify Hatch Alignment, Scale, and Rotation
Shift, scale, or rotate hatch patterns to align them with existing objects.
To shift a hatch pattern, relocate the origin point of the hatch object. The
same tools in the user interface as listed in Modify Hatch Properties (page 513)
include options for specifying a new origin point, specifying a different rotation
angle, and changing the scale of the hatch pattern.
In some cases, it might be easier to move or rotate the user coordinate system
to align with existing objects, and then recreate the hatch.
Hatches, Fills, and Wipeouts | 513
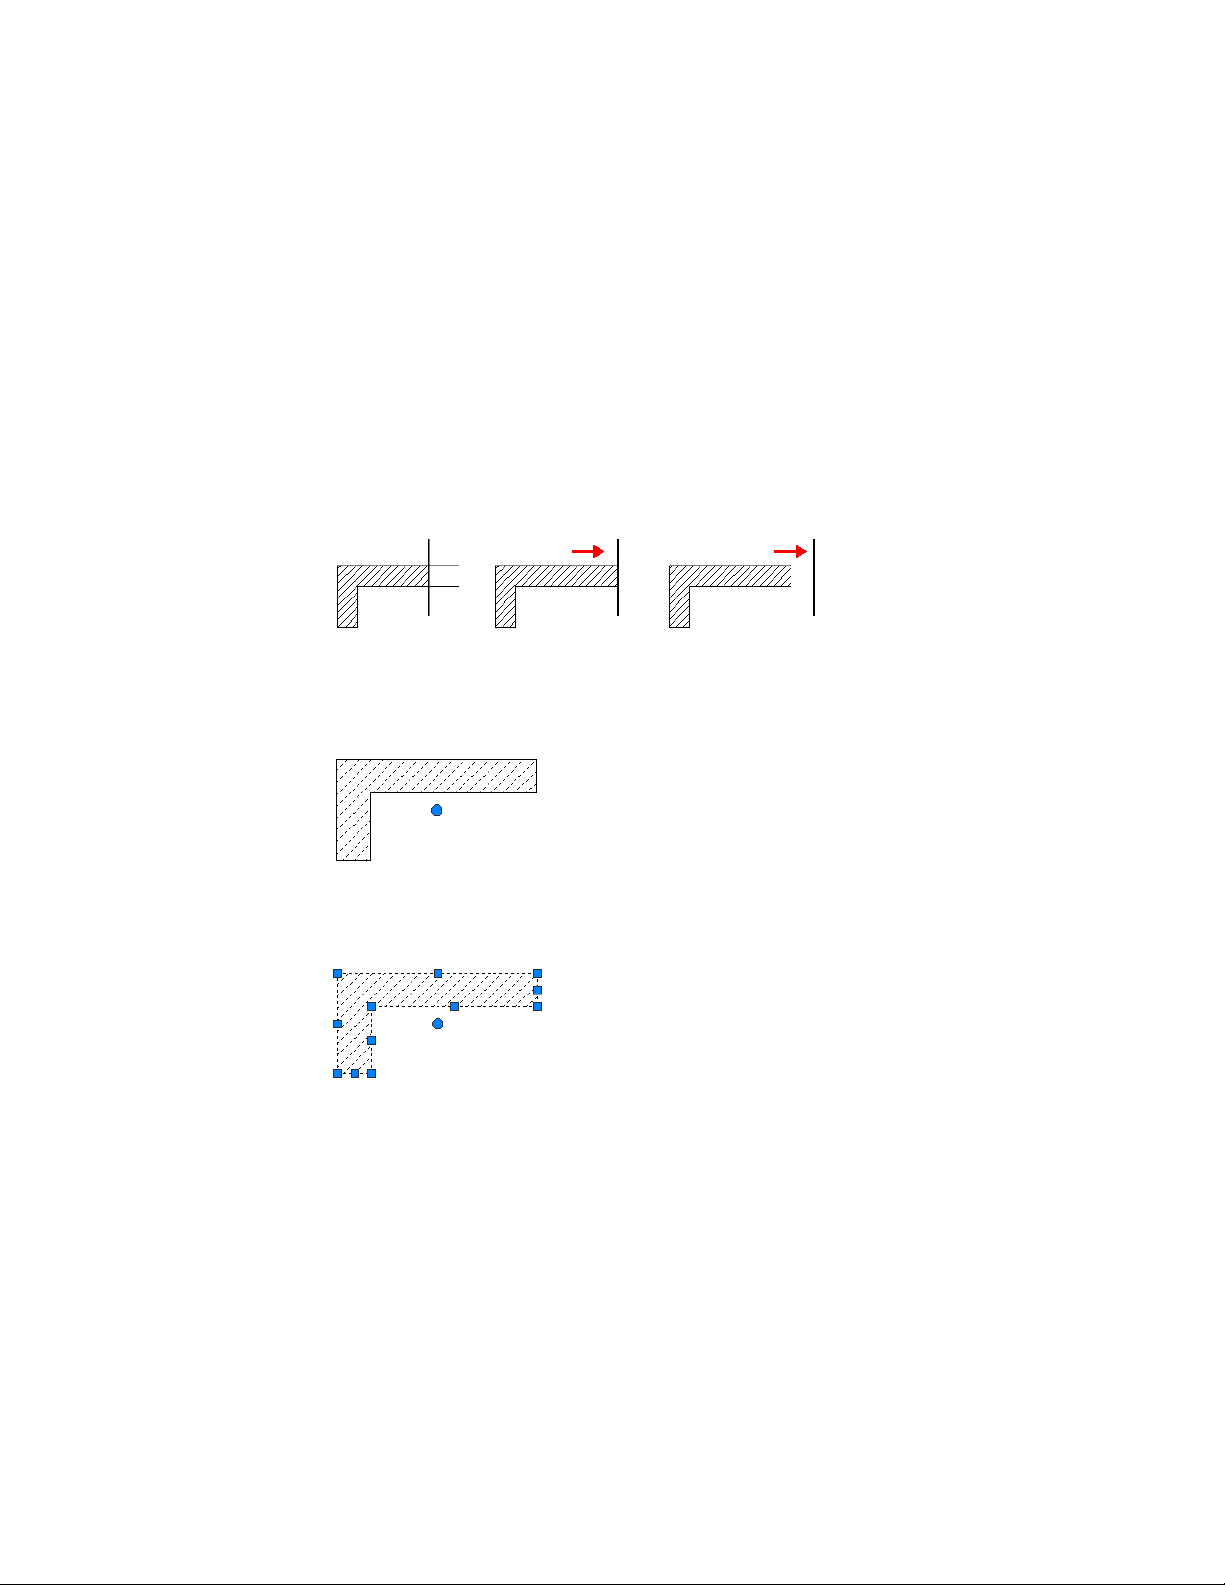
Reshape a Hatch or Fill
Reshape an associative hatch by modifying the boundary objects. Reshape a
nonassociative hatch by modifying the hatch object.
Modify the Extents of Associative Hatches and Fills
If you modify the boundary objects of an associative hatch, and the result
maintains a closed boundary, the associated hatch object is automatically
updated. If the changes result in an open boundary, the hatch loses its
associativity with the boundary objects, and the hatch remains unchanged.
When you select an associative hatch object, it displays a circular grip, called
the control grip, at the center of the hatch extents. Hover over the control grip
to display a shortcut menu with several hatch options, or right-click to display
additional options.
You can also change the hatch object by editing the grips of the associated
boundary objects. To easily select all of the objects in a complex boundary,
use the Display Boundary Objects option.
If the boundary object is a polyline or spline, multi-functional grips are displayed.
For more information, see Use Object Grips (page 233).
514 | Chapter 9 Annotate Drawings
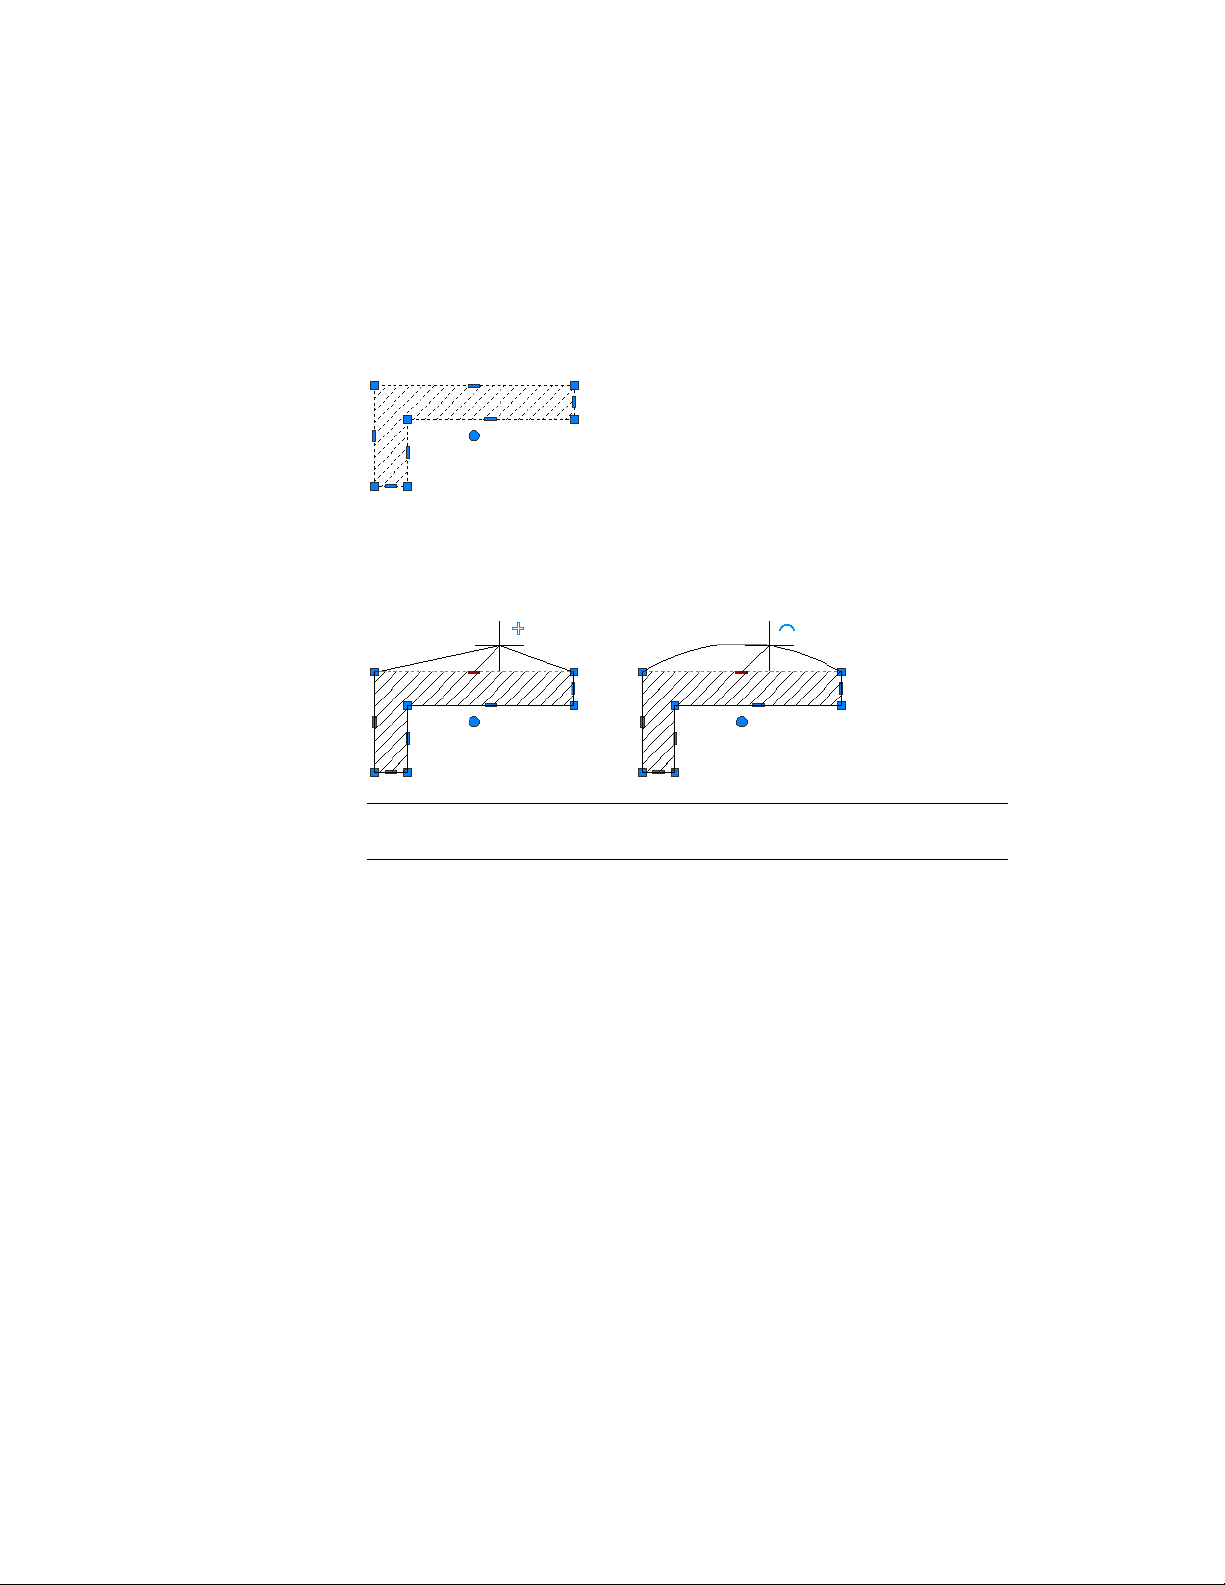
Modify the Extents of Non-associative Hatches and Fills
When you select a non-associative hatch, multi-functional grips are displayed
on the hatch. Use these grips to modify the hatch extents and some several
hatch properties.
When you hover over a grip on a nonassociative hatch object, a grip menu
displays several edit options based on the type of grip. For example, a linear
segment grip has an option to convert the segment to an arc, or to add a
vertex.
NOTE For drastic changes, you can use TRIM to reduce the area covered by a
hatch object, or EXPLODE to disassemble a hatch into its component objects.
See also:
Modify Objects Using Grips (page 233)
Re-create the Boundary of a Hatch or Fill
Create a new boundary object for a non-associative or an unbounded hatch
or fill.
Use the Recreate Boundary option to generate a closed polyline or a region
object around a selected hatch or fill. You can also specify that the new
boundary object is associated with the hatch.
Hatches, Fills, and Wipeouts | 515
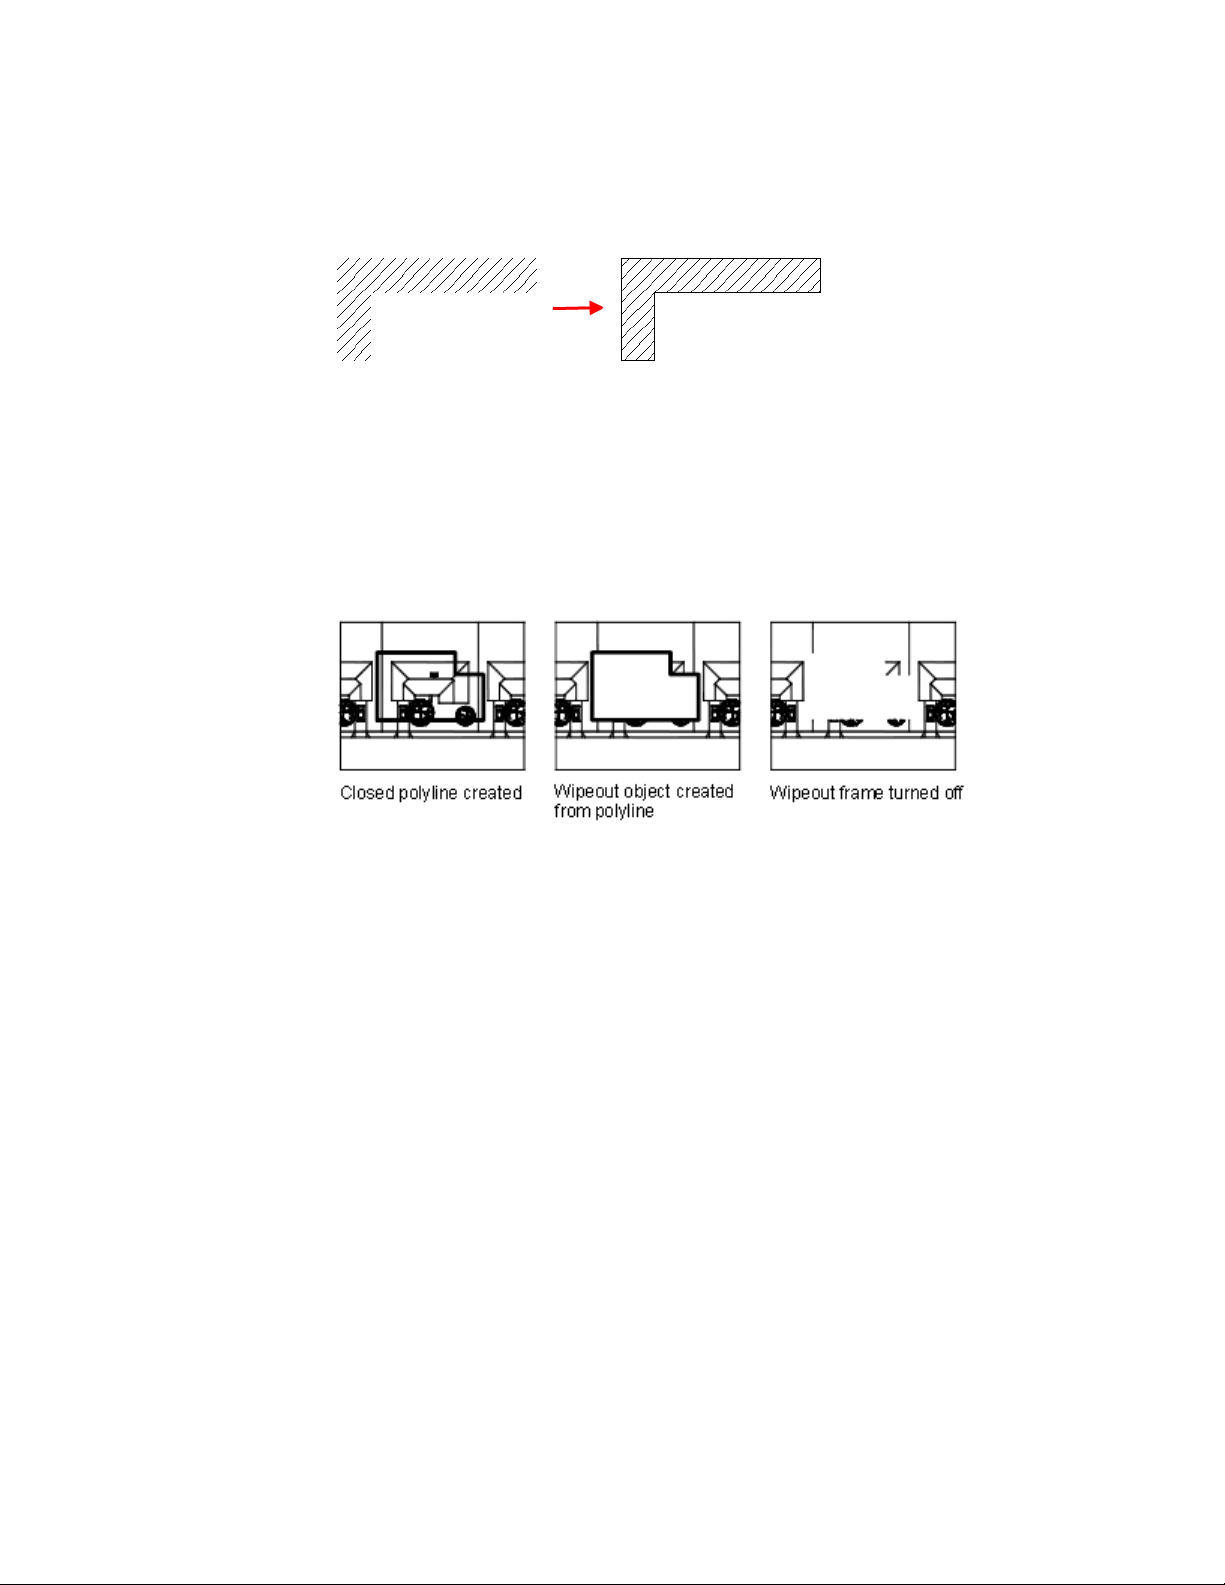
Create a Blank Area to Cover Objects
Create a polygonal area, called a wipeout to mask underlying objects with the
current background color.
A wipeout object covers existing objects with a blank area to make room for
notes or to mask details. This area is defined by the wipeout frame, which you
can turn on for editing, and turn off for plotting.
Use the WIPEOUT command both for creating a wipeout object, and for
controlling whether wipeout frames are displayed or hidden in the drawing.
If a polyline is used to create a wipeout object, the polyline must be closed,
contain line segments only, and have zero width.
Use Wipeout Objects on a Layout
You can create wipeout objects on a layout in paper space to mask objects in
model space. However, in the Page Setup dialog box, under Print Options, the
Print Paperspace Last option must be cleared before you print to ensure that
the wipeout object is printed correctly.
See also:
Control How Overlapping Objects Are Displayed (page 147)
516 | Chapter 9 Annotate Drawings

Notes and Labels
You can create and modify several types of text, including text with leaders.
You can control most text style settings by defining text styles.
Overview of Notes and Labels
You can create text in various ways. For short, simple entries, use single-line
text. For longer entries with internal formatting, use multiline text (mtext).
Although all entered text uses the current text style, which establishes the
default font and format settings, you can use several methods to customize
the text appearance. There are several tools that can change text scale and
justification, find and replace text, and check for spelling errors.
Text that is included in a dimension or tolerance is created using the
dimensioning commands. You can also create multiline text with leaders.
See also:
Control the Display of Polylines, Hatches, Gradient Fills, Lineweights, and
Text (page 145)
Control How Overlapping Objects Are Displayed (page 147)
Create Text
You can create text using several methods, depending on your needs.
See also:
Use Fields in Text (page 536)
Overview of Creating Text
The text you add to your drawings conveys a variety of information. It may
be a complex specification, title block information, a label, or even part of
the drawing.
Notes and Labels | 517

Single-Line Text
For short entries that do not require multiple fonts or lines, create single-line
text. Single-line text is most convenient for labels.
Multiline Text
For long, complex entries, create multiline, or paragraph text. Multiline text
consists of any number of text lines or paragraphs that fit within a width you
specify; it can extend vertically to an indefinite length.
Regardless of the number of lines, each set of paragraphs created in a single
editing session forms a single object, which you can move, rotate, erase, copy,
mirror, or scale.
There are more editing options for multiline text than there are for single-line
text. For example, you can apply underlining, fonts, color, and text height
changes to individual characters, words, or phrases within a paragraph.
Annotative Text
Use annotative text for notes and labels in your drawing. You create annotative
text by using an annotative text style, which sets the height of the text on
the paper.
For more information about creating and working with an annotative text,
see Create Annotative Text (page 495).
See also:
Scale Annotations (page 490)
Create Annotative Text (page 495)
Create Single-Line Text
You can use single-line text to create one or more lines of text, where each
text line is an independent object that you can relocate, reformat, or otherwise
modify.
Use single-line text (TEXT) to create one or more lines of text, ending each
line when you press Enter. Each text line is an independent object that you
can relocate, reformat, or otherwise modify.
When you create single-line text, you assign a text style and set alignment.
The text style sets the default characteristics of the text object. The alignment
518 | Chapter 9 Annotate Drawings
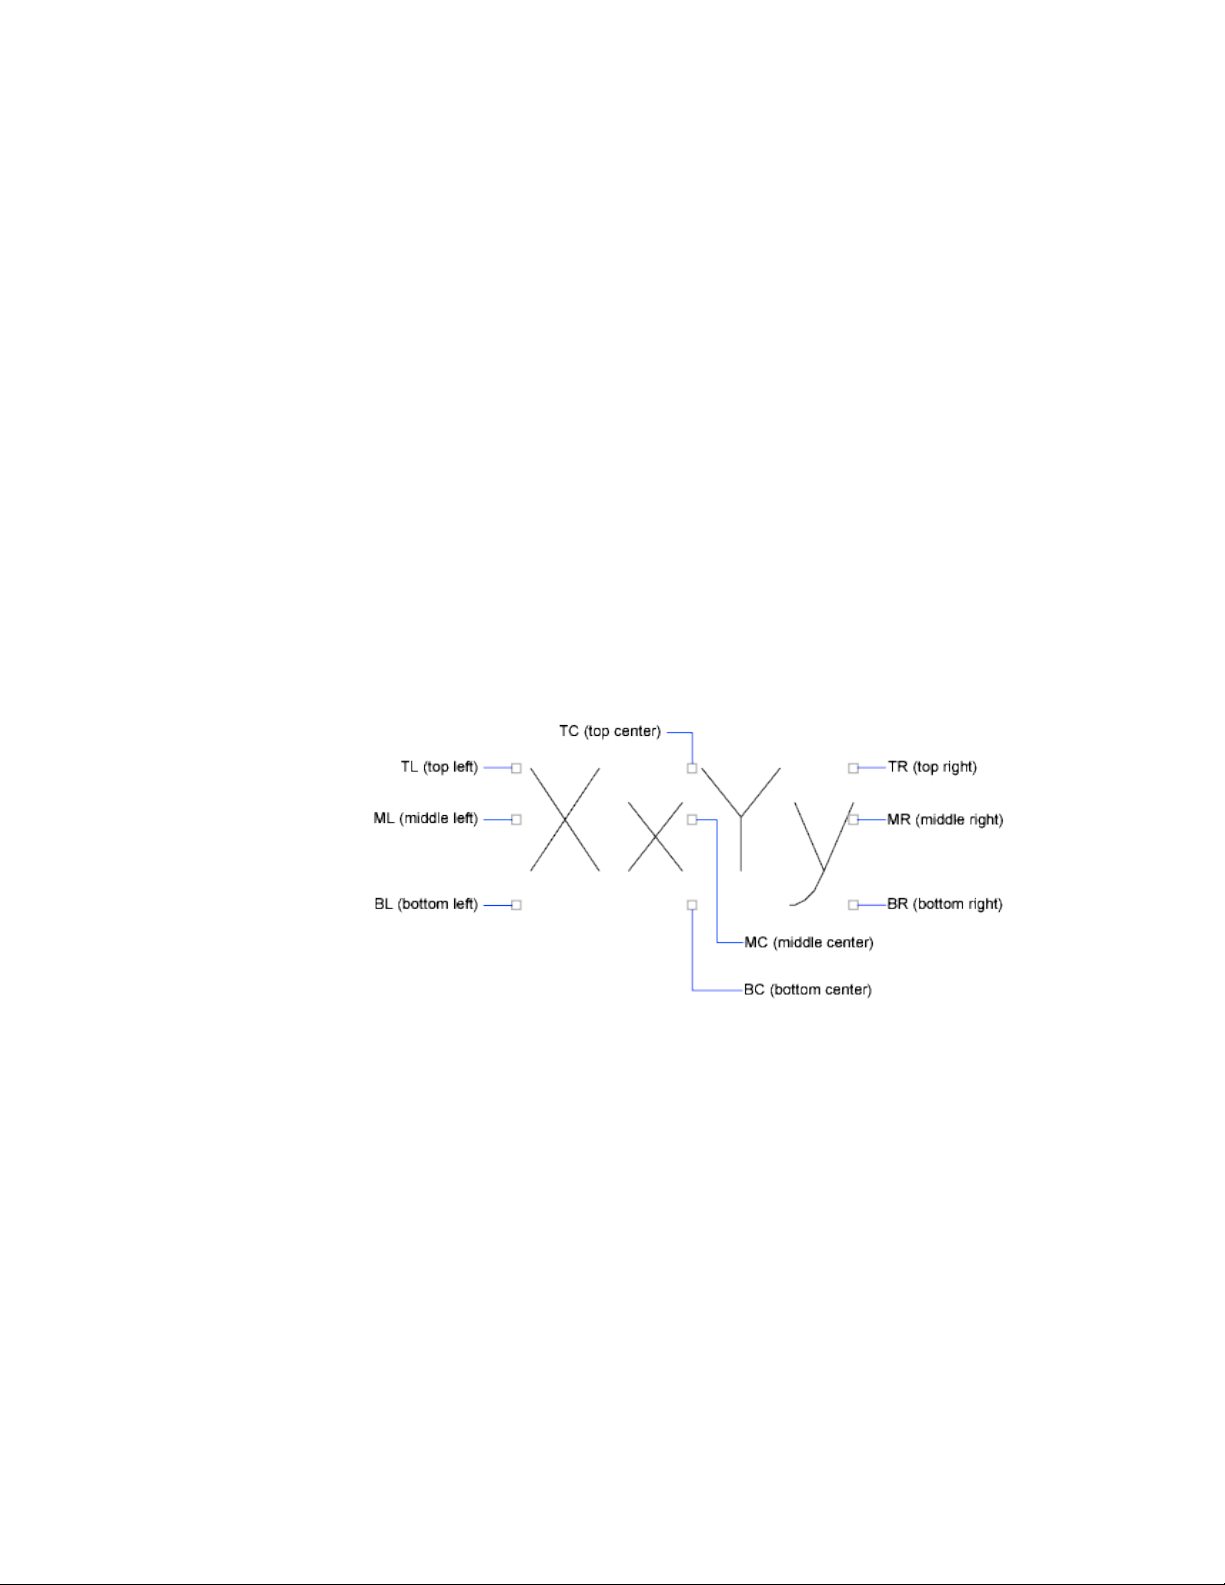
determines what part of the text character aligns with the insertion point. Use
the TEXT command to enter the text in-place, or enter -text to type text at
the Command prompt instead of in-place.
You can insert a field in single-line text. A field is text that is set up to display
data that might change. When the field is updated, the latest value of the field
is displayed.
The text styles used for single-line text are the same as those used for multiline
text. When you create text, you assign an existing style by entering its name
at the Style prompt. If you need to apply formatting to individual words and
characters, use multiline text instead of single-line text.
You can also compress single-line text to fit between points that you specify.
This option stretches or squeezes the text to fill the designated space.
Align Single-Line Text
As you create text, you can align it. That is, you can justify it with one of the
alignment options shown in the following illustrations. Left alignment is the
default. To left-align text, do not enter an option at the Justify prompt.
Notes and Labels | 519
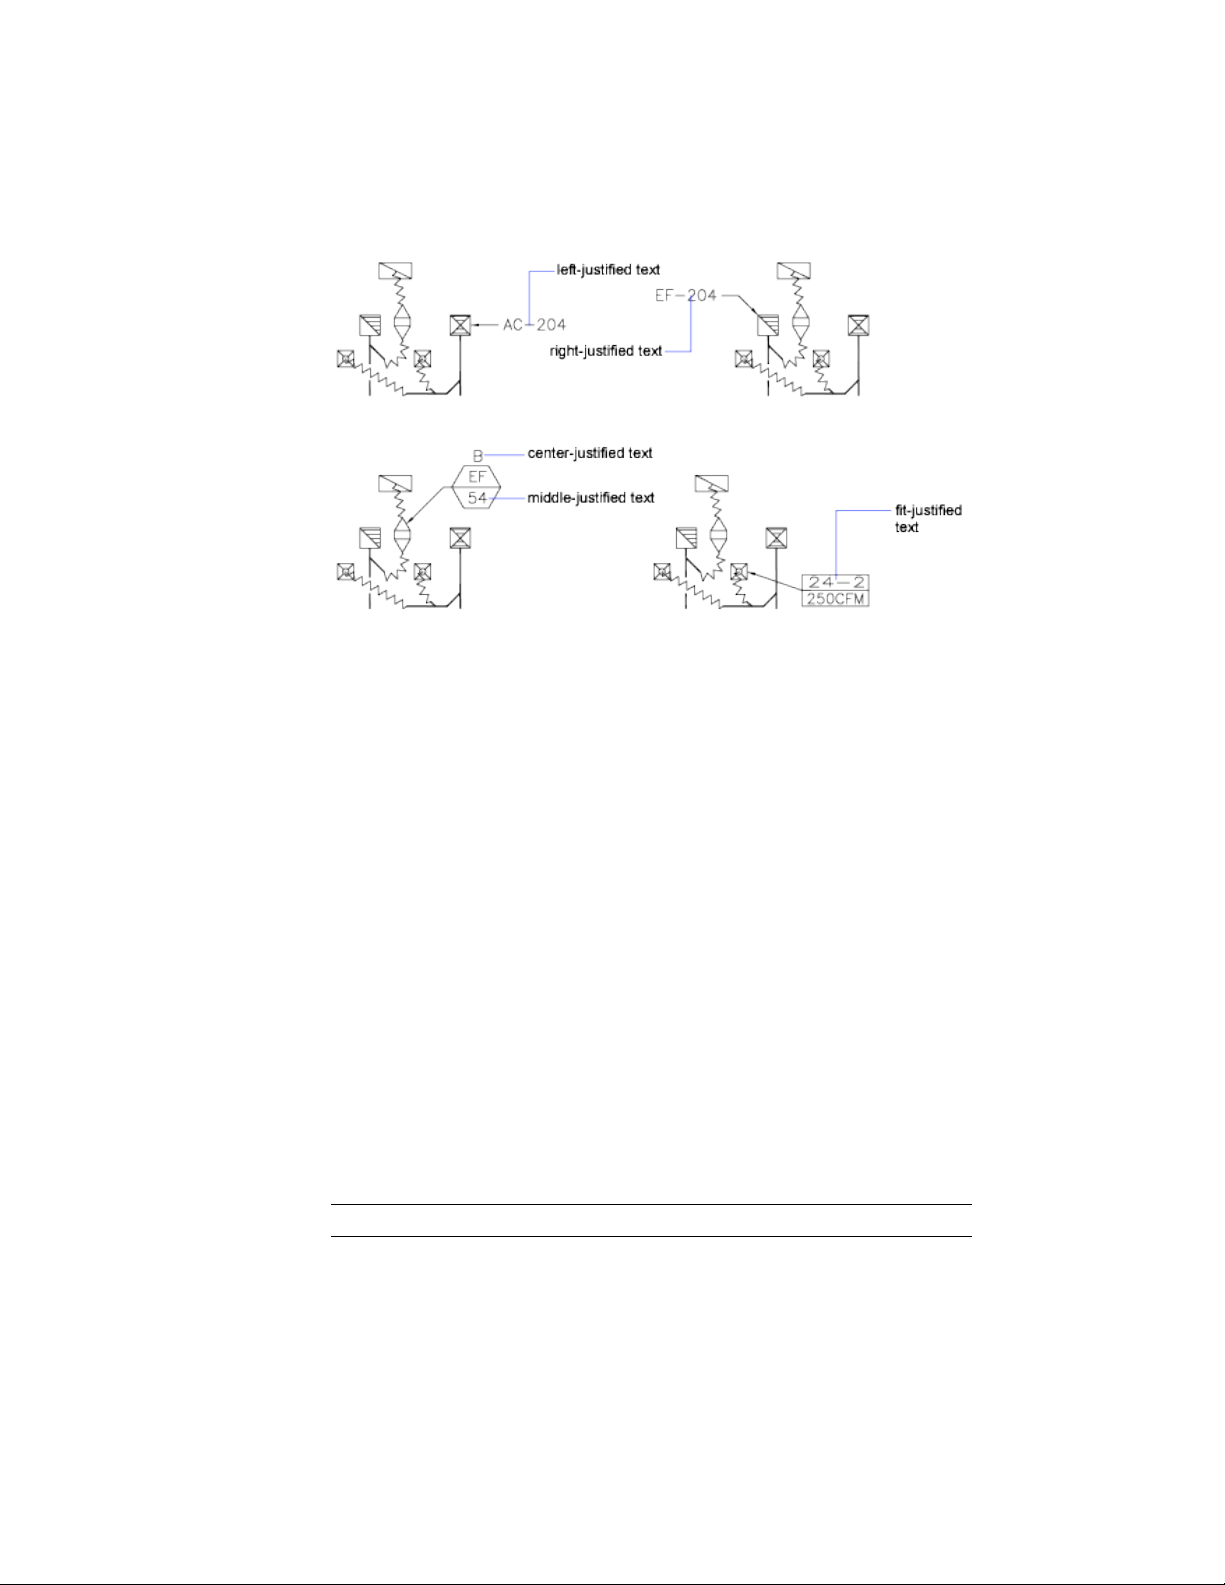
See also:
Use Fields in Text (page 536)
Create Multiline Text
A multiline text (mtext) object includes one or more paragraphs of text that
can be manipulated as a single object.
Overview of Multiline Text
You can create a multiline text (mtext) object by entering or importing text.
You can create one or more paragraphs of multiline text (mtext) in the In-Place
Text Editor. You can also type text at the Command prompt if you use -MTEXT.
You can insert text from a file saved in ASCII or RTF format.
Before entering or importing text, you specify opposite corners of a text
bounding box that defines the width of the paragraphs in the multiline text
object. The length of the multiline text object depends on the amount of text,
not the length of the bounding box. You can use grips to move or rotate a
multiline text object.
NOTE Multiline text objects and imported text files are limited to 256 KB in size.
520 | Chapter 9 Annotate Drawings

The In-Place Text Editor allows you to adjust the bounding box that defines
the size of the multiline text object, as well as create and edit tabs and indents
on the ruler along the top. The editor is transparent, as you create text, you
can see whether the text overlaps other objects.
To turn off transparency while you work, right-click in the In-Place Text Editor
and click Editor Settings ➤ Opaque Background from the shortcut menu.
You can also make the background of the finished multiline text object opaque
and set its color.
You can also insert fields in multiline text. A field is text that is set up to
display data that might change. When the field is updated, the latest value of
the field is displayed.
Text Style
Most characteristics of the text are controlled by the text style, which sets the
default font and other options, such as line spacing, justification, and color.
You can use the current text style or select a new one. The STANDARD text
style is the default.
Within the multiline text object, you can override the current text style by
applying formatting such as underlining, boldface, and different fonts to
individual characters. You can also create stacked text, such as fractions or
geometric tolerances and insert special characters, including Unicode
characters, for TrueType fonts.
NOTE Not all SHX and TrueType text fonts support Unicode characters.
Text Properties
In the Properties Inspector palette, you can view and change the object
properties of a multiline text object, including properties that apply specifically
to text.
■ Justification determines where text is inserted with respect to the bounding
box and sets the direction of text flow as text is entered.
■ Line space options control the amount of space between lines of text.
■ Width defines the width of the bounding box and therefore controls where
the text wraps to a new line.
■ Background inserts an opaque background so that objects under the text
are masked.
Notes and Labels | 521
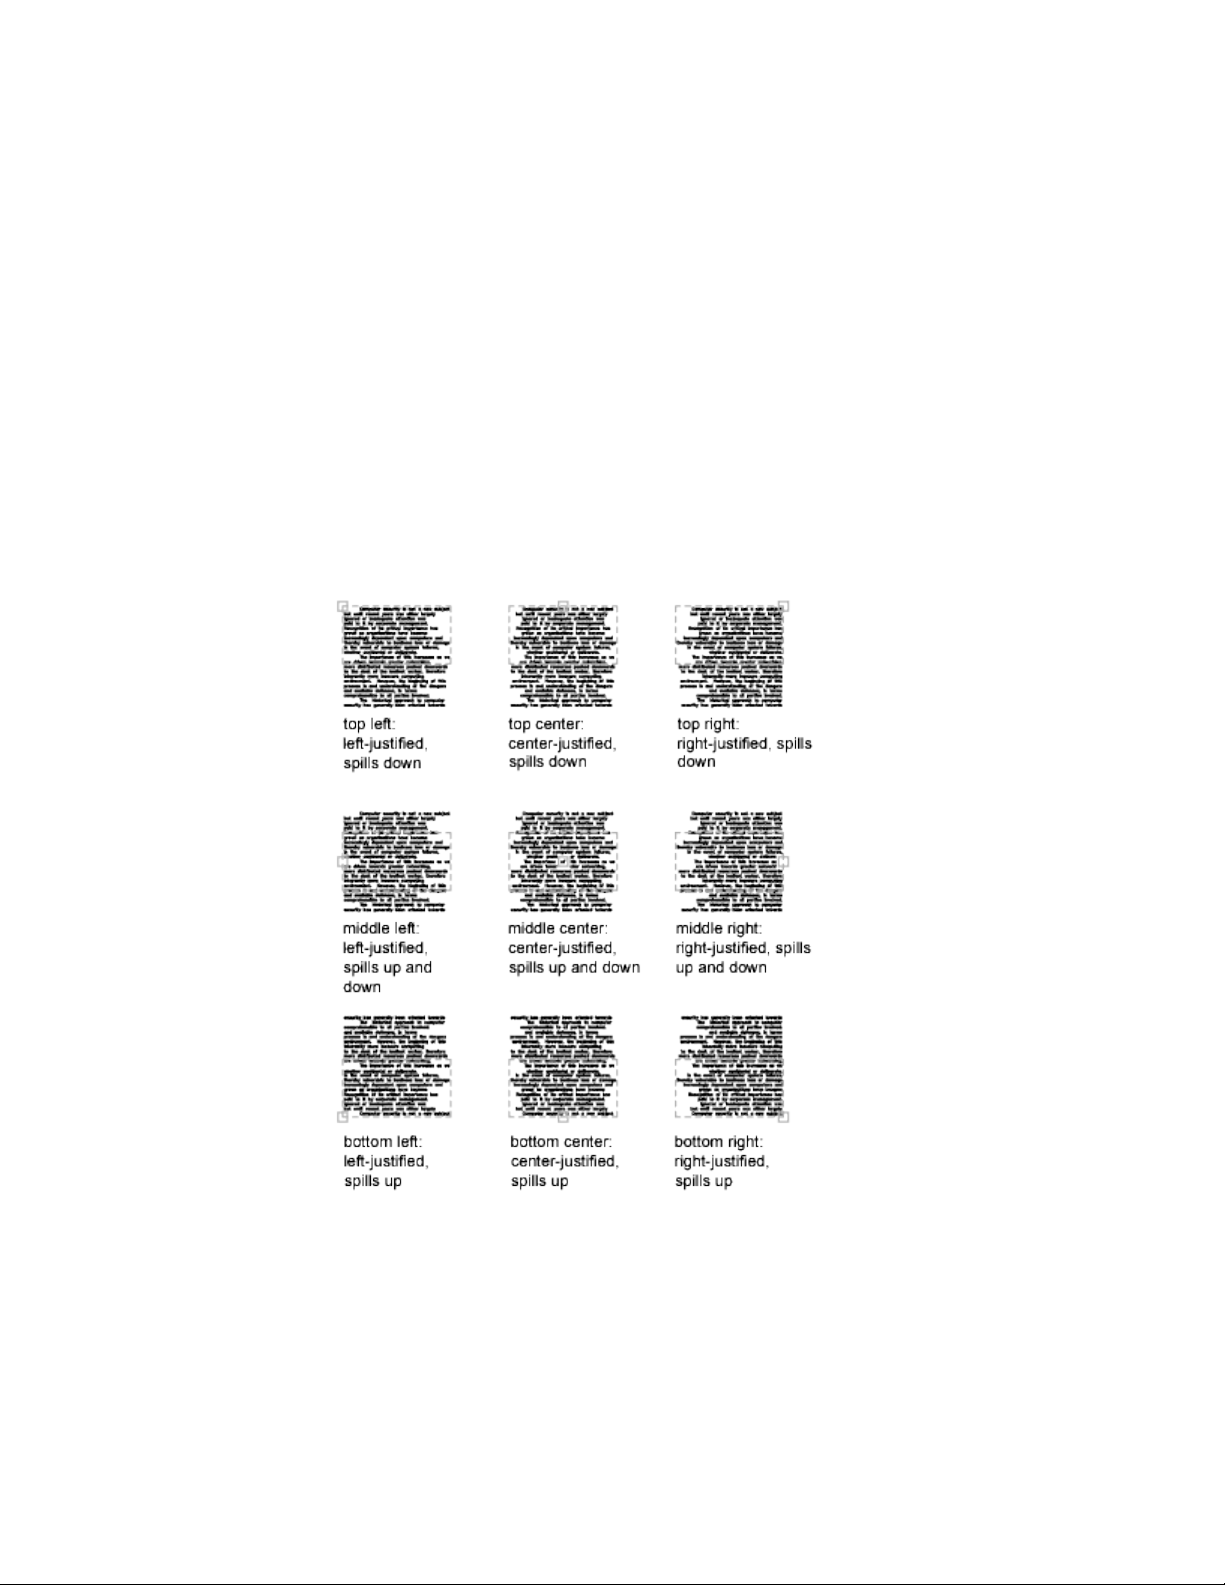
Justify Multiline Text
Justification of multiline text objects controls both text alignment and text
flow relative to the text insertion point.
Justification controls both text alignment and text flow relative to the text
insertion point. Text is left-justified and right-justified with respect to the
boundary rectangle that defines the text width. Text flows from the insertion
point, which can be at the middle, the top, or the bottom of the resulting text
object.
There are nine justification settings for multiline text.
If a single word is longer than the width of the paragraph, the word will extend
beyond the paragraph boundary.
522 | Chapter 9 Annotate Drawings

Format Characters Within Multiline Text
You can override the text style and apply different formatting to individual
words and characters within multiline text.
The format changes affect only the text you select; the current text style is
not changed.
You can specify a different font and text height and apply boldface, italics,
underlining, overlining, and color. You can also set an obliquing angle, change
the space between characters, and make characters wider or narrower. The
Remove Formatting option on the In-Place Text Editor shortcut menu resets
the character attributes of selected text to the current text style and text color.
The text height setting specifies the height of capitalized text. For more
information about how height is calculated, see MTEXT.
See also:
Work with Text Styles (page 540)
Create Lists in Multiline Text
You can create bulleted lists, lettered or numbered lists, or simple outlines in
multiline text.
Lines of multiline text can be formatted as a list. When you add or delete an
item, or move an item up or down a level, the list numbering automatically
adjusts. You can remove and reapply list formatting with the same method
as used in most text editors.
Use Automatic List Formatting
By default, list formatting is applied to all text that looks like a list. Text that
meets all the following criteria is considered to be a list:
■ The line begins with one or more letters or numbers or a symbol.
■ The letters or numbers is followed by punctuation.
■ A space after the punctuation is created by pressing Tab.
■ The text following the space is ended by Enter or Shift-Enter.
Notes and Labels | 523
NOTE If you do not want list formatting applied to all text that fits the criteria,
clear the Allow Bullets and Lists option. (Right-click in the In-Place Text Editor,
click Bullets and Lists ➤ Allow Bullets and Lists.) When Allow Bullets and Lists is
not checked, you cannot create new formatted lists in the multiline text object.
To create a list, use one of the following methods:
■ Apply list formatting to new or selected text.
■ Use Auto-list (on by default) and type the elements of a list.
■ With Auto-list off, type the elements of a list and close and reopen the
editor to convert the text to a list.
Apply List Formatting
When you apply list formatting, you can specify bullets, uppercase or lowercase
letters, or numbers. Default settings are used for the type of list you choose.
Letters or numbers are followed by a period. Nested lists use a double bullet,
letter, or number. Items are indented based on the tab stops on the ruler in
the In-Place Text Editor.
Use Auto-list to Type a List
When Auto-list is on, you can create a list as you type. You can use letters,
numbers, or symbols.
For example, in the editor, enter \U+25CB, press Tab, and then enter some
text. This creates a empty circle style bullet.
Not all symbols are available from the character map for a particular text font.
However, if you specify the Unicode text directly (\U+25CB in this case), you
can always get the bullet format of your choice.
NOTE Press Tab after you enter the Unicode text or symbol, or it will remain a
separate character.
You can also paste a symbol from the Characters dialog box
The following characters can be used as punctuation after the number or letter
when you type a list but cannot be used as bullets:
DescriptionCharacter
Period.
524 | Chapter 9 Annotate Drawings
DescriptionCharacter
Colon:
Close parenthesis)
Close angle bracket>
Close square bracket]
Close curly bracket}
Paste a List from Another Document
If you copy a nested bulleted list (a list within a list) from a word processor
and paste the list into a multiline text, the bullets that are displayed as empty
circles might not be formatted like other bullets in multiline text. This is
because the bullet might be a letter, such as o, instead of a bullet for nested
bulleted lists. You can remove formatting from the nested list and reapply to
change the bullets to double bullets.
Indent Multiline Text and Use Tabs
You can control how paragraphs are indented in a multiline text (mtext)
object. The ruler in the In-Place Text Editor shows the settings for the current
paragraph.
Tabs and indents that you set before you start to enter text apply to the whole
multiline text object. To apply different tabs and indents to individual
paragraphs, click in a single paragraph or select multiple paragraphs and then
change the settings.
Sliders on the ruler show indentation relative to the left side of the bounding
box. The top slider indents the first line of the paragraph, and the bottom
slider indents the other lines of the paragraph.
The long tick marks on the ruler show the default tab stops. If you click the
ruler to set your own tabs, the ruler displays a small, L-shaped marker at each
custom tab stop. You can delete a custom tab stop by dragging the marker off
the ruler.
Notes and Labels | 525
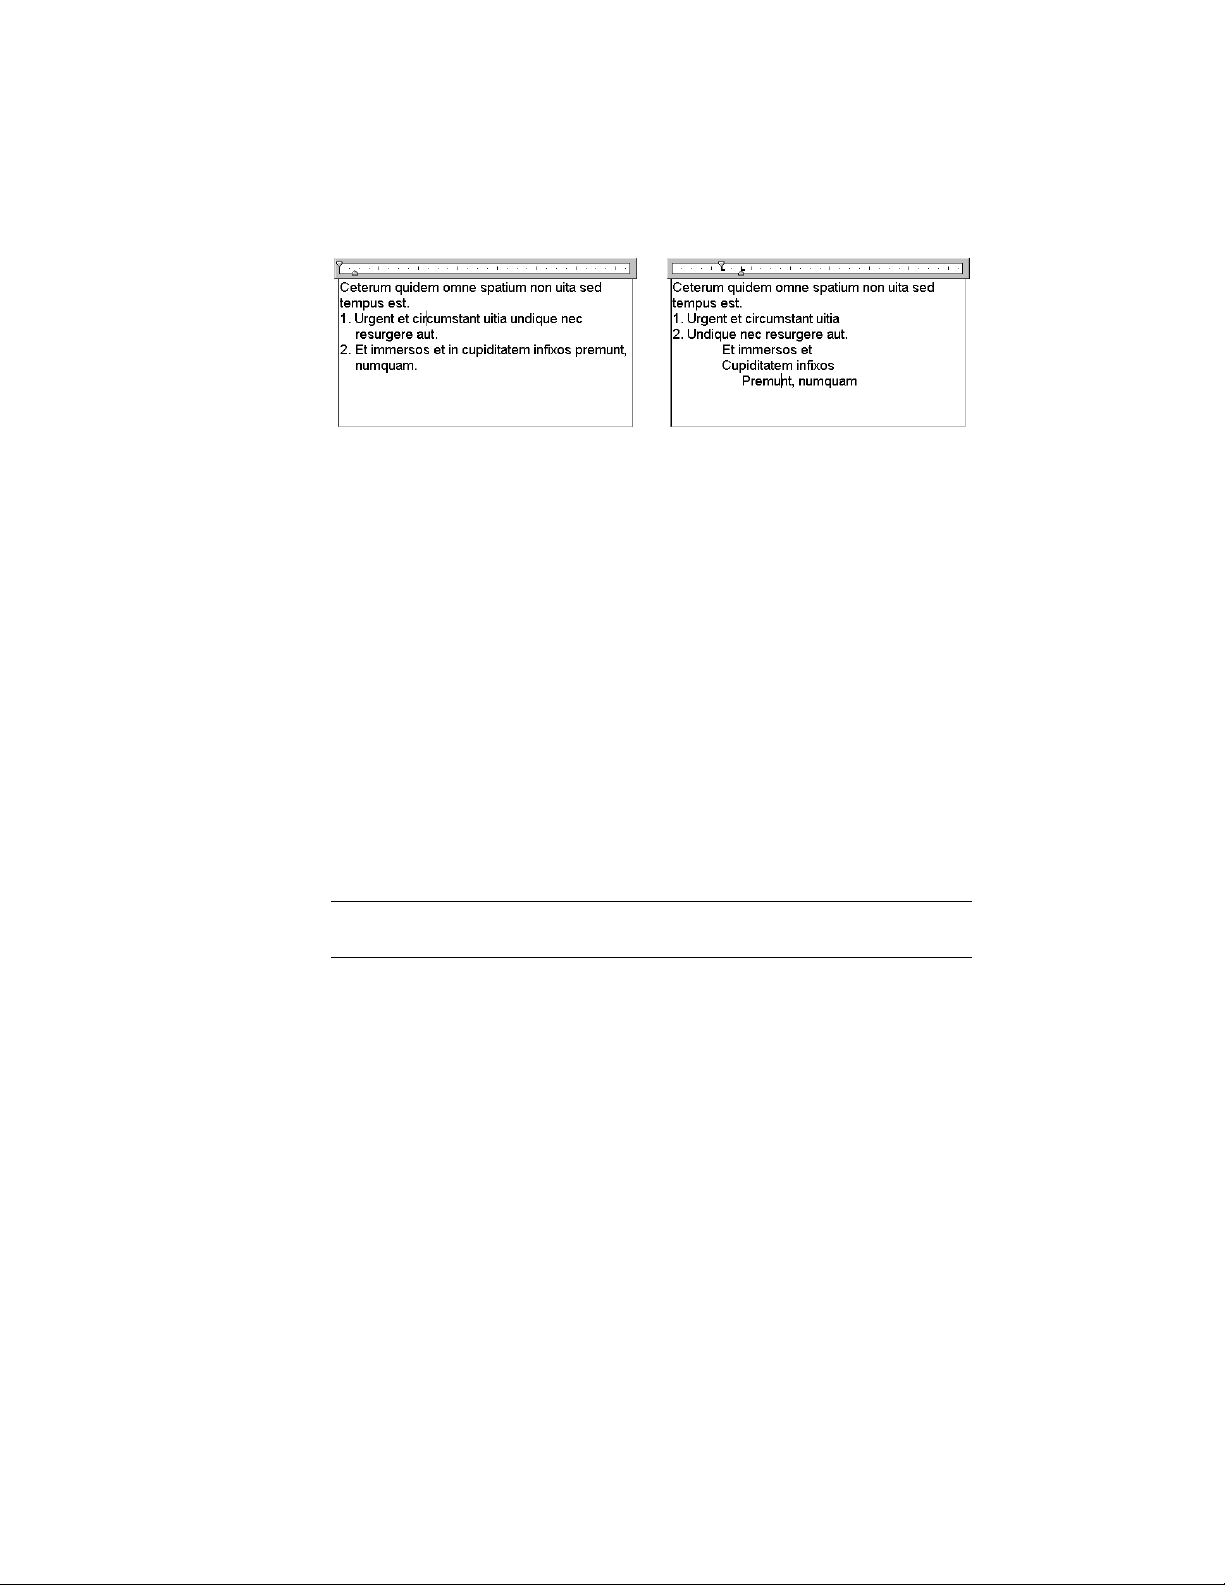
Specify the Line Spacing Within Multiline Text
Line spacing for multiline text is the distance between the baseline (bottom)
of one line of text and the baseline of the next line of text. The line space
factor applies to the entire multiline text object, not to selected lines.
You can set the spacing increment to a multiple of single line spacing, or as
an absolute distance. Single spacing is 1.66 times the height of the text
characters.
The default line space style, At Least, automatically increases line spacing to
accommodate characters that are too large to fit the line spacing you set for
the multiline text object. Use the other line space style, Exactly, to line up
text in tables.
To ensure that line spacing is identical in multiple multiline text objects, use
Exactly and set the Line Space Factor to the same value in each multiline text
object.
NOTE Using Exactly can cause text in lines located above or below lines with large
font characters to overlap the larger characters.
Create Stacked Characters Within Multiline Text
Characters representing fractions and tolerances can be formatted to conform
to several standards.
Stacked text refers to the fraction and tolerance formats applied to characters
within multiline text object and multileaders.
526 | Chapter 9 Annotate Drawings
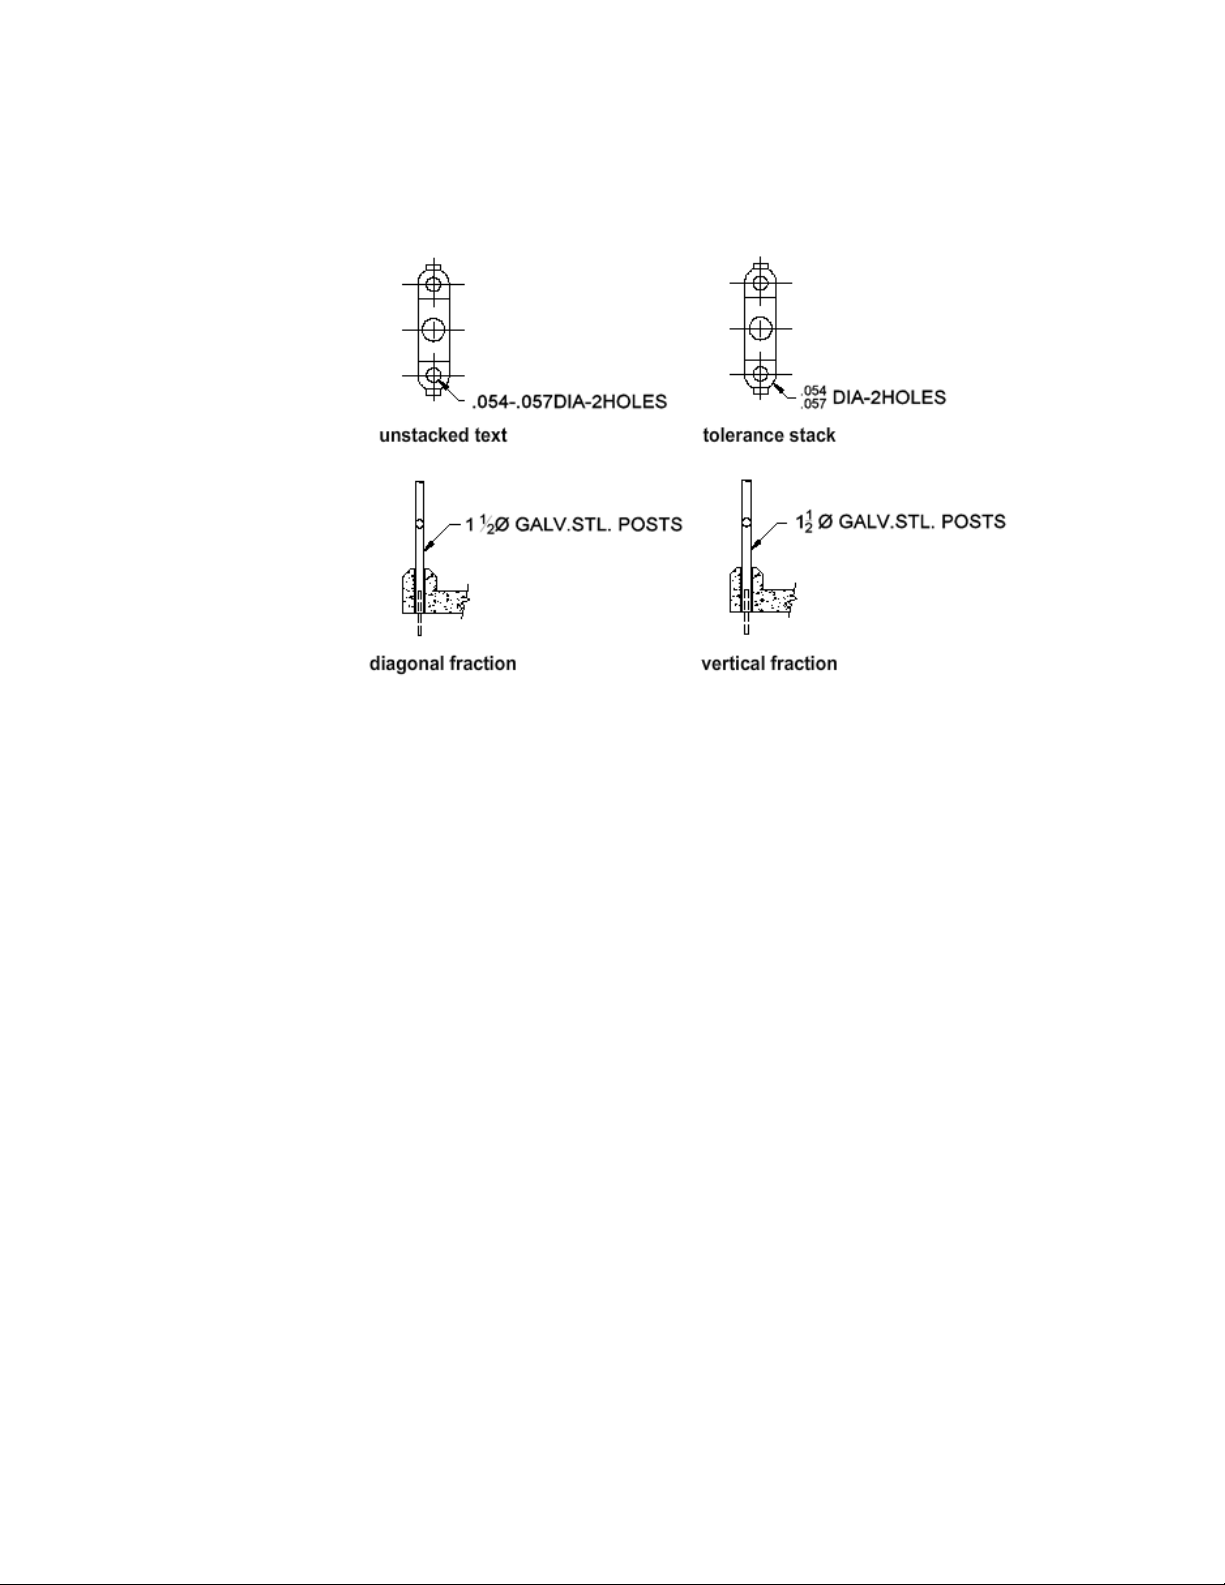
You use special characters to indicate how selected text should be stacked.
■ Slash (/) stacks text vertically, separated by a horizontal line.
■ Pound sign (#) stacks text diagonally, separated by a diagonal line.
■ Carat (^) creates a tolerance stack, which is stacked vertically and not
separated by a line.
To stack characters manually within the In-Place Text Editor, select the text
to be formatted, including the special stacking character, and right-click. From
the shortcut menu, click Stack.
Stack Numeric and Tolerance Characters Automatically
You can specify that numeric characters entered before and after a slash, pound
sign, or carat will stack automatically. For example, if you enter 1#3 followed
by a nonnumeric character or space, the AutoStack Properties dialog box is
displayed by default, and you can change the settings in the Stack Properties
dialog box to specify your formatting preferences.
The automatic stacking feature applies only to numeric characters immediately
before and after the slash, pound sign, and carat. For tolerance stacking, the
+, -, and decimal character also stack automatically.
Notes and Labels | 527
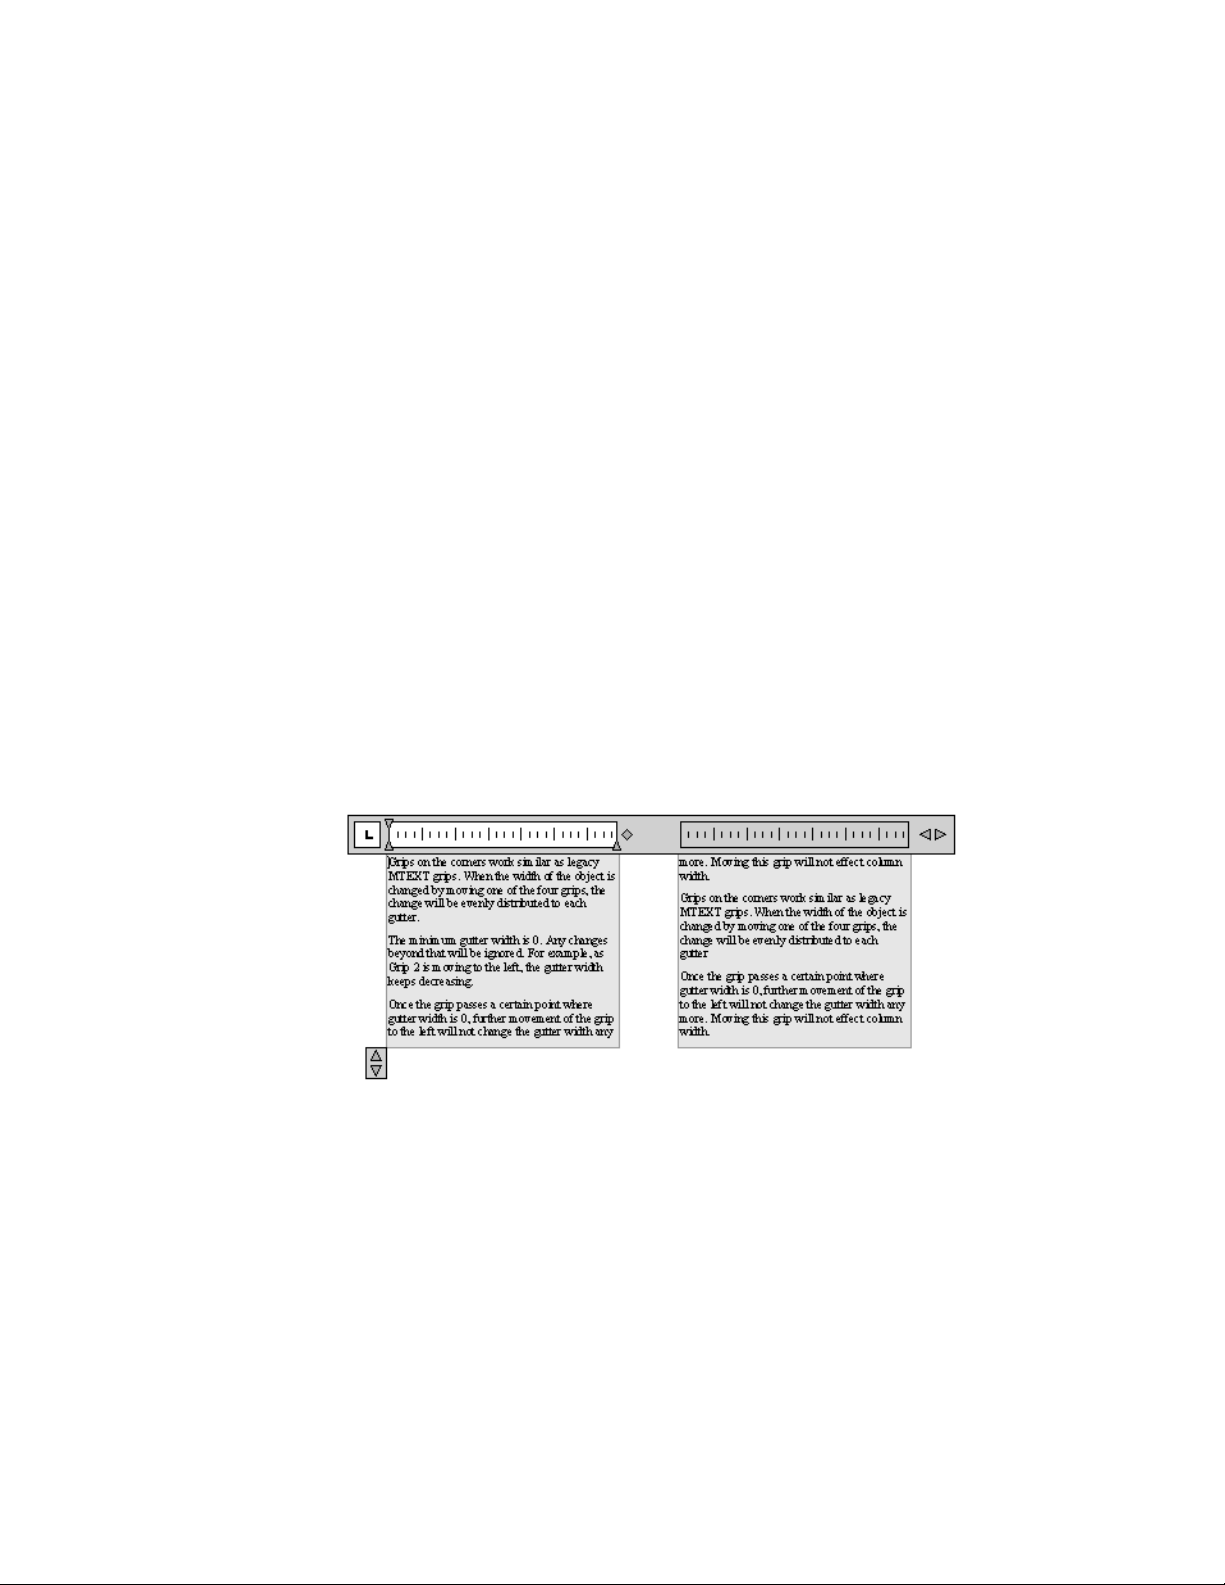
See also:
Work with Text Styles (page 540)
Create and Edit Columns in Multiline Text
You can create and edit multiple columns using the In-Place Text Editor
column options and column grips.
Multiple columns can be created and edited with the In-Place Text Editor and
through grip editing. Editing columns using grips allows you the flexibility
of seeing the changes as you make them.
Columns follow a few rules. All columns have equal width and equal gutters.
A gutter is the space between columns. The height of columns remains constant
unless more text than the column can accommodate is added, or you manually
move the editing grip to adjust the column height.
Editing Columns in the In-Place Text Editor
When you are working with columns in the In-Place Text Editor, the columns
will be in a frame. The ruler bar spans across all columns, but is only active
for the current column.
Adding text to a column with an arbitrary height will not increase the column
height even if text is already filling the column. Text will flow into another
column.
You can also insert a column break to force text to start flowing into the next
column. Anytime a column break is inserted, it is assumed that the current
528 | Chapter 9 Annotate Drawings

height of the column is fixed. To delete the break, highlight and delete it or
use the Backspace key right after the break.
Editing Columns in the Properties Inspector
You will be able to select Static or Dynamic columns, turn off columns and
change column and gutter width through the Properties Inspector palette.
Changing column width in the palette will exhibit results similar to changing
width using grips. The palette is the only place that you can also change gutter
setting.
Import Text from External Files
You can insert TXT or RTF text files created in word processors into your
drawing by importing the text.
Importing TXT or RTF files from other sources gives you the most flexibility.
For example, you can create a text file of standard notes that you include in
drawings. The imported text becomes a multiline text object, which you can
edit and reformat. Text imported from a TXT file inherits the current text
style. Text imported from an RTF file inherits the current text style name, but
retains its original fonts and format. Imported text files are limited to 256 KB
and must have a file extension of .txt or .rtf.
If you use the Clipboard to paste text from another application, the text is
pasted as formatted or unformatted based on the original source. If you use
the Clipboard to paste text from another drawing file, the text is inserted as
a block reference, and it retains its original formatting.
See also:
Create Leaders
You can create, modify and add content to a leader object.
Overview of Leader Objects
A leader object is a line or a spline with an arrowhead at one end and a
multiline text object or block at the other.
Notes and Labels | 529
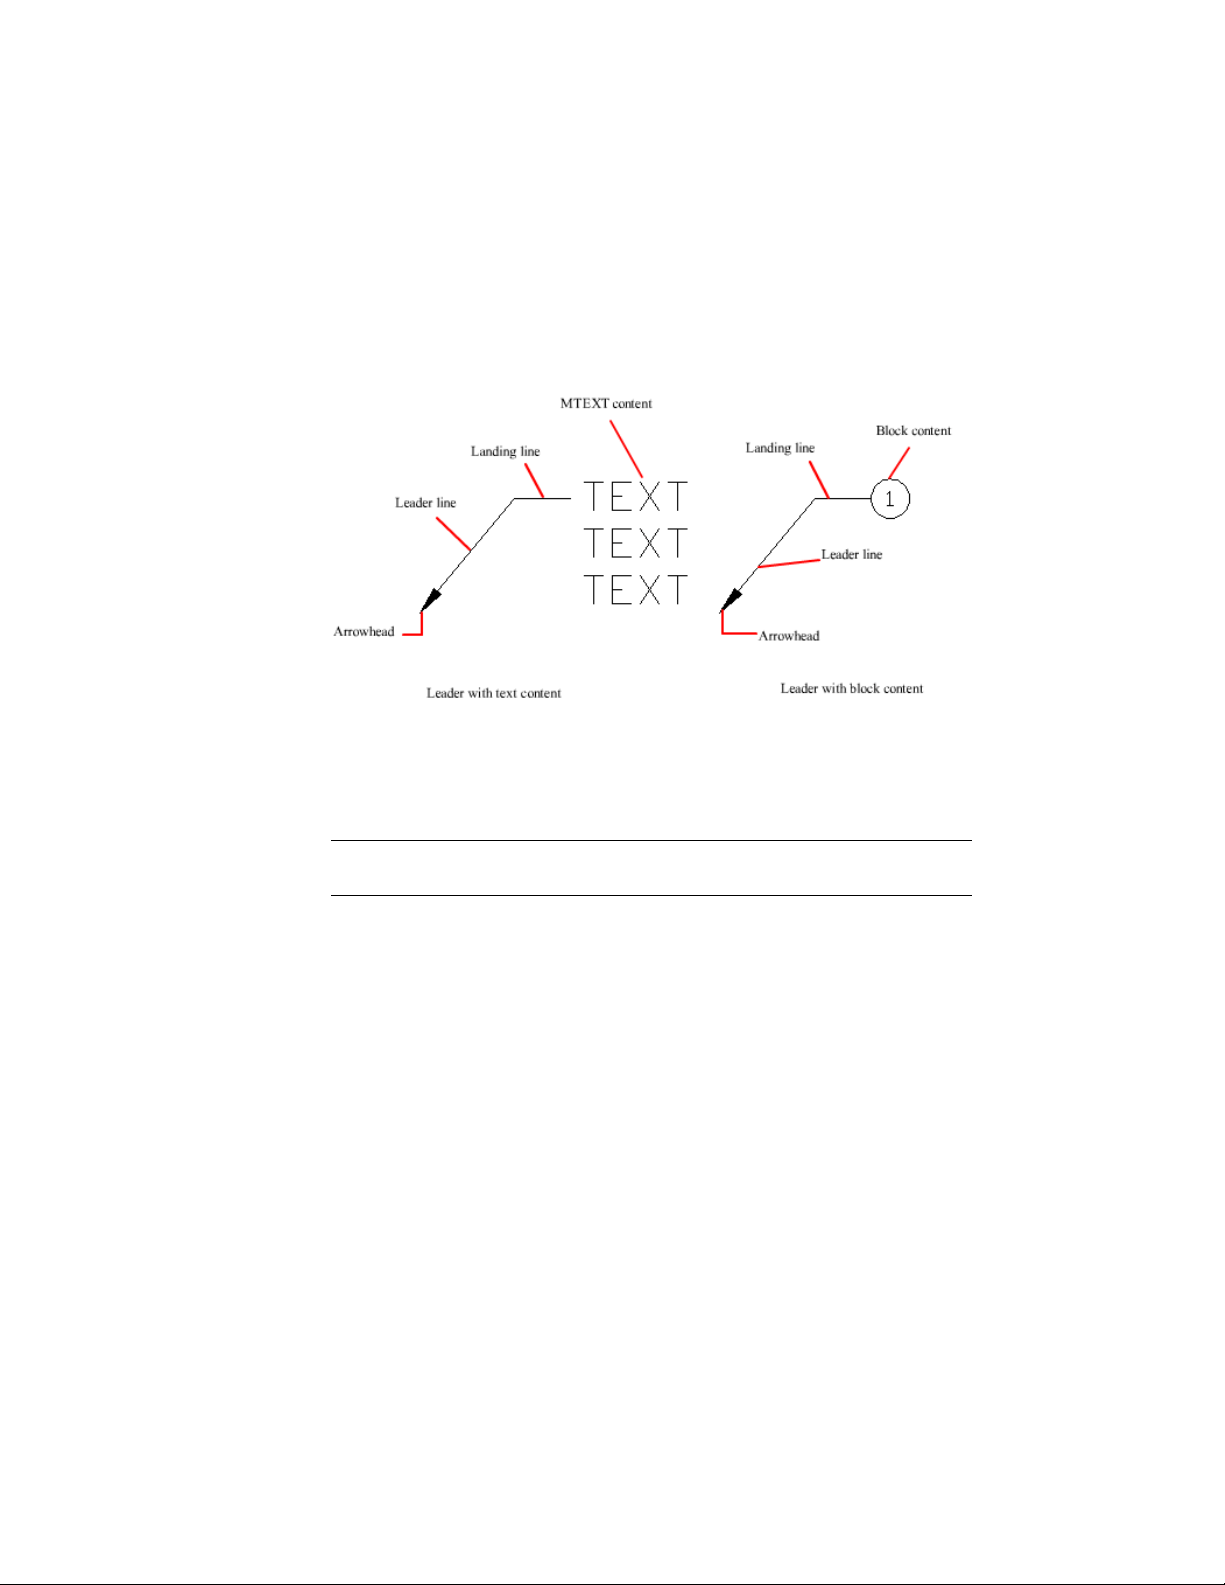
In some cases, a short horizontal line, called a landing, connects text or blocks
and feature control frames to the leader line.
The landing and leader line are associated with the multiline text object or
block, so when the landing is relocated, the content and leader line move
along with it.
When associative dimensioning is turned on and object snaps are used to
locate the leader arrowhead, the leader is associated with the object to which
the arrowhead is attached. If the object is relocated, the arrowhead is relocated,
and the landing stretches accordingly.
NOTE The leader object should not be confused with the leader line that is
automatically generated as part of a dimension line.
Create and Modify Leaders
A leader object typically consists of an arrowhead, an optional horizontal
landing, a leader line or curve, and either a multiline text object or block.
You can create a leader line from any point or feature in a drawing and control
its appearance as you draw. Leaders can be straight line segments or smooth
spline curves.
530 | Chapter 9 Annotate Drawings
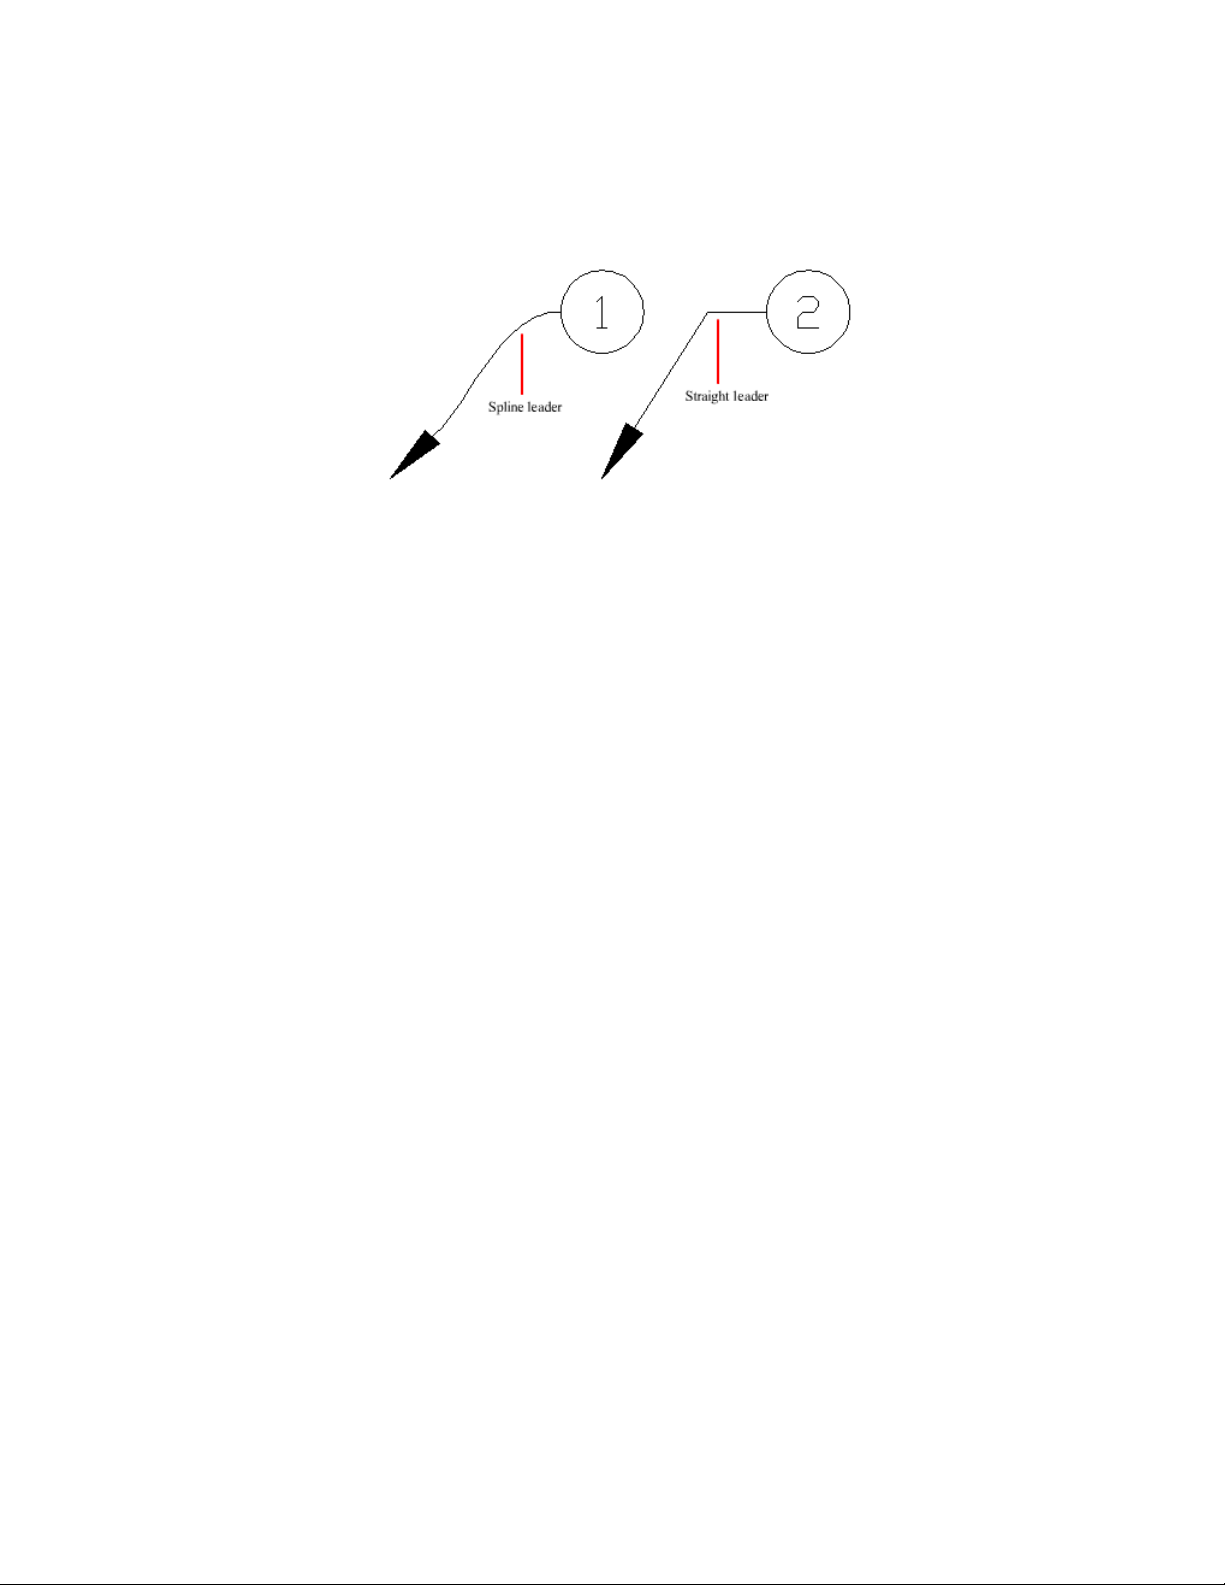
A multileader object, or mleader, comprises a leader and a note. It can be
created arrowhead first, tail first, or content first. If a multileader style has
been used, then the multileader can be created from that style
Multileader objects can contain multiple leader lines, each of which can have
one or more segments, so that one note can point to multiple objects in your
drawing. You can modify the properties of leader segment in the Properties
Inspector palette. Add leaders to or remove leaders from a multileader object
with MLEADEREDIT or choose options from the leader grip menus (see
Modify Leaders Using Grips (page 532)).
Annotative multileaders containing multiple leader segments can have different
head points in each scale representation. Horizontal landings and arrowheads
can have different sizes, and landing gaps can have different distances,
depending on the scale representation. The appearance of the horizontal
landing within a multileader, as well as the type of leader line (straight or
spline) and number of leader segments will remain the same in all scale
representations. For more information, see Create Annotative Leaders and
Multileaders (page 497).
Arrange Leaders
Multileaders can be arranged to add order and consistency to your drawing.
Multileader objects with blocks as content can be collected and attached to
one landing line. Using MLEADERCOLLECT, multileaders can be collected
horizontally, vertically, or within a specified area depending on your drawing
needs.
Multileader objects can be sorted evenly along a specified line. Using
MLEADERALIGN, selected multileaders can be aligned and evenly spaced as
specified.
Notes and Labels | 531
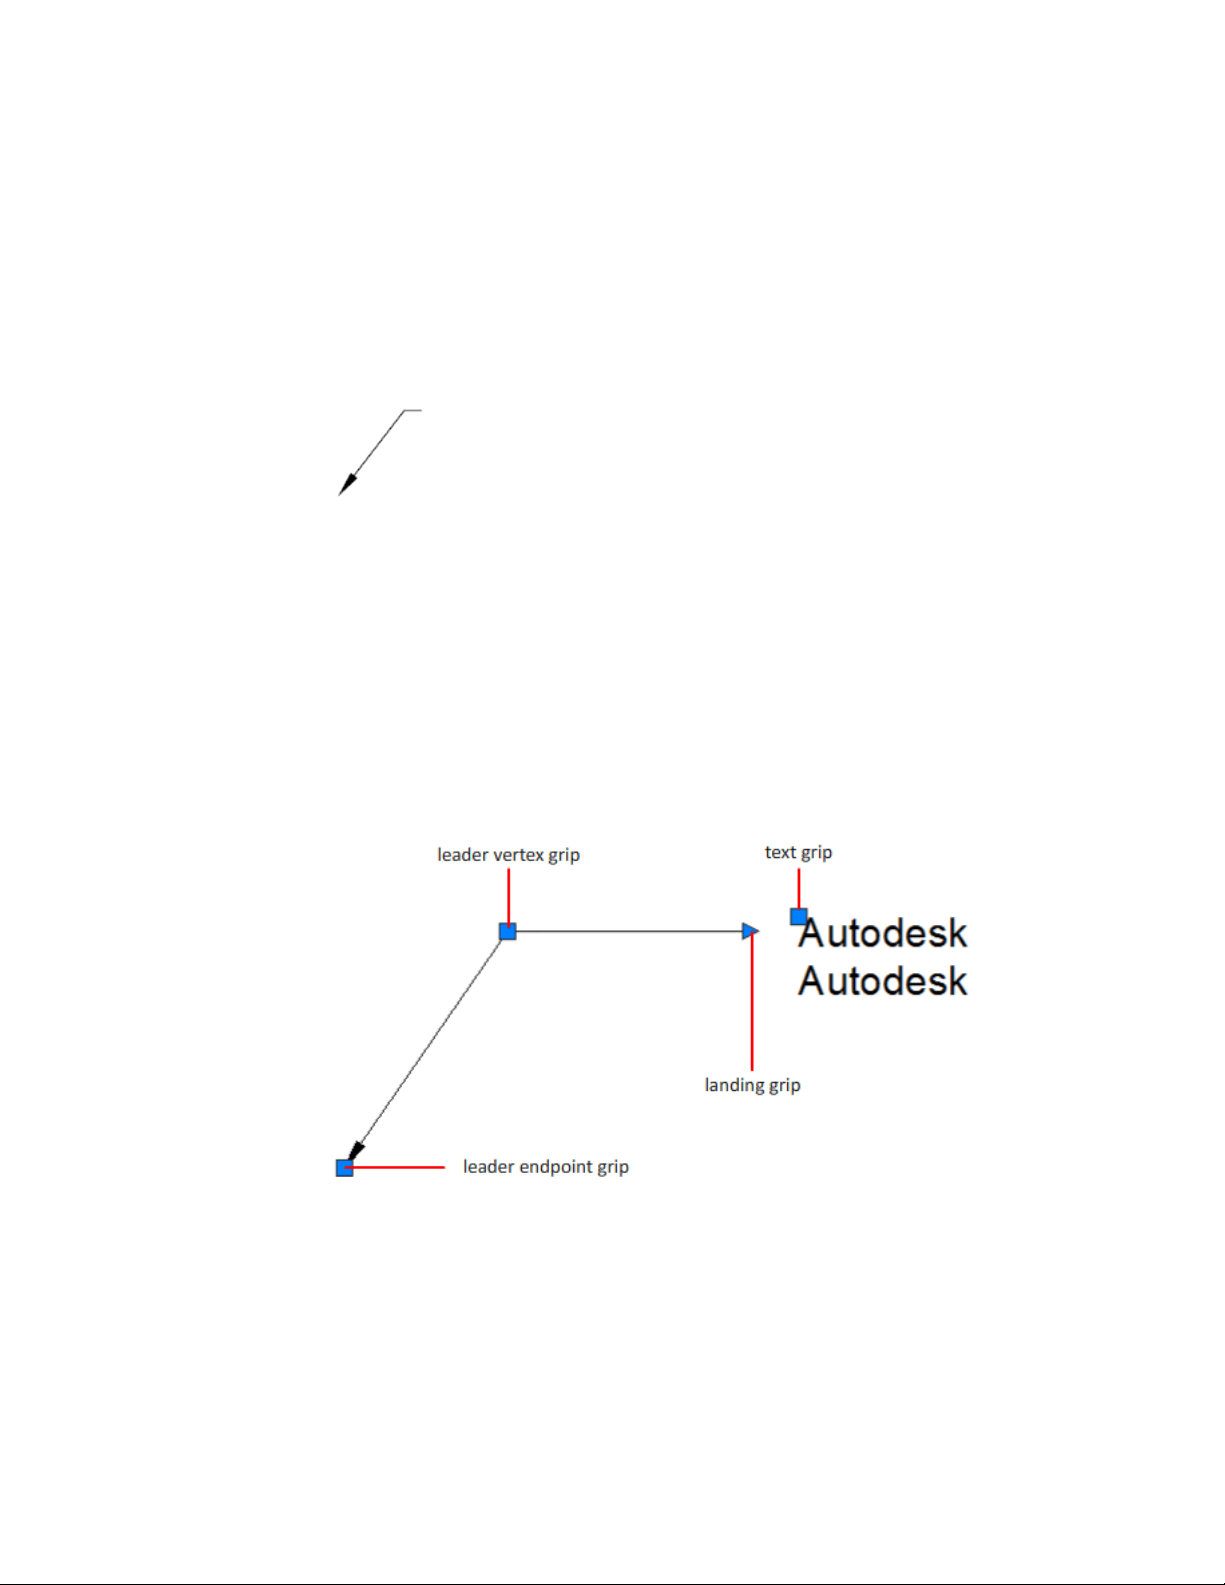
Associate Leaders with Objects
When associative dimensioning is turned on (DIMASSOC system variable),
the leader arrowhead can be associated with a location on an object using an
object snap. If the object is relocated, the arrowhead remains attached to the
object and the leader line stretches, but the multiline text remains in place.
See also:
Create Annotative Leaders and Multileaders (page 497)
Modify Leaders Using Grips (page 532)
Modify Leaders Using Grips
You can make many leader edits directly using multi-functional grips. You
can add and remove leaders, add and remove vertices, lengthen or move the
landing line, or move the leader text.
Hover over a grip to access the option you want.
■ From the Landing grip, you can choose:
■ Stretch to move the leader landing.
532 | Chapter 9 Annotate Drawings

■ Lengthen Landing to extend the Landing line.
■ Add Leader to add one or more leader lines.
■ From a leader endpoint grip, you can choose:
■ Stretch to move the leader endpoint.
■ Add Vertex to add a vertex to the leader line.
■ Remove Leader to delete the selected leader line.
■ From a leader vertex grip, you can choose:
■ Stretch to move the vertex.
■ Add Vertex to add a vertex on the leader line.
■ Remove Vertex to delete the vertex.
See also:
Create and Modify Leaders (page 530)
Work with Leader Styles
The appearance of a leader is controlled by its multileader style. You can use
the default multileader style, STANDARD, or create your own multileader
styles.
The multileader style can specify formatting for landing lines, leader lines,
arrowheads, and content. For example, the STANDARD multileader style uses
a straight leader line with a closed filled arrowhead and multiline text content.
NOTE Annotative blocks cannot be used as either content or arrowheads in
multileader objects.
Once a multileader style has been defined, you can set it as the current
multileader style to be used when the MLEADER command is invoked.
Add Content to a Leader
Leaders can contain multiline text or blocks to label parts of your drawing.
Notes and Labels | 533
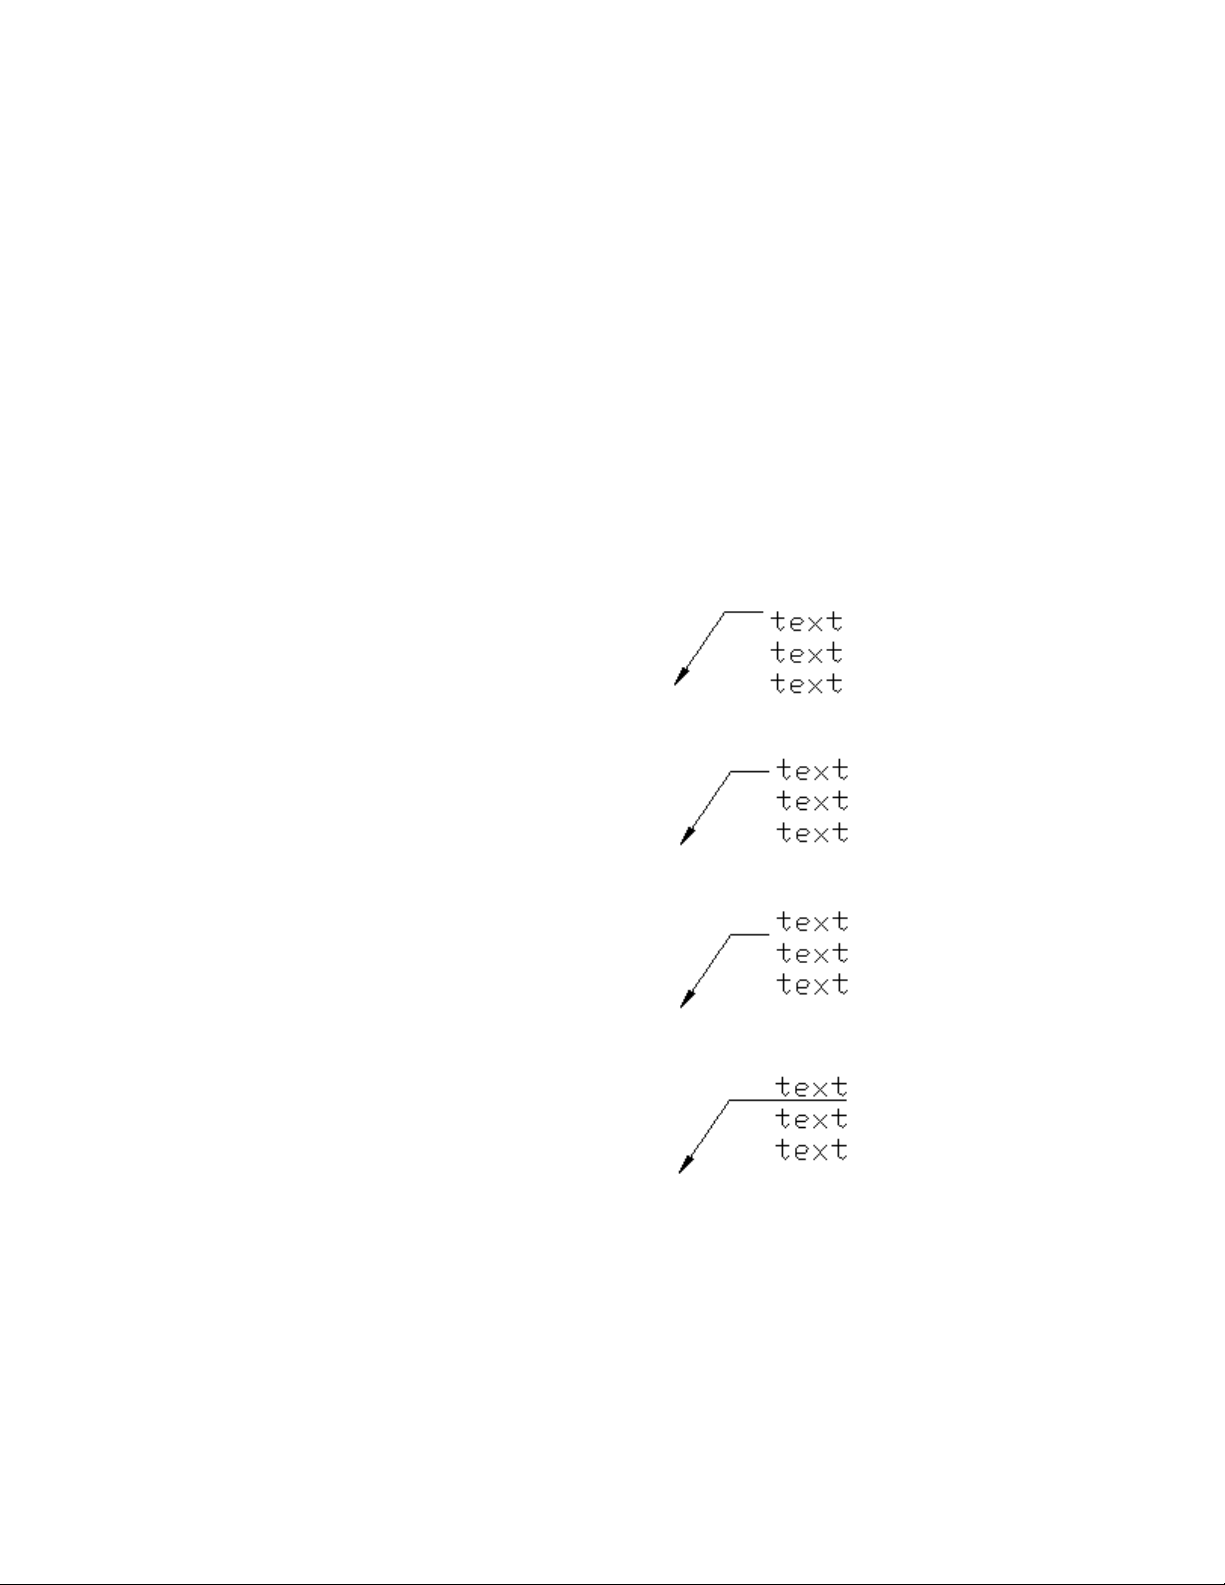
Leaders Containing Multiline Text
Leaders can contain multiline text as content. Text can be inserted by default
when creating a leader style. Text style, color, height, and alignment can be
applied and modified in leader annotations. You can also offset a multiline
text object by specifying a landing gap distance in the current leader style.
You can create annotative multileaders with text as content. The text content
will be scaled according to the specified scale representation. Width,
justification, attachment, and rotation settings for text content can be different
depending on the specified scale representation. Actual text content cannot
change with the scale representation.
There are several options for placing multiline text as content in a leader
object.
Top of top line
Middle of top line
Bottom of top line
Underline top line
534 | Chapter 9 Annotate Drawings
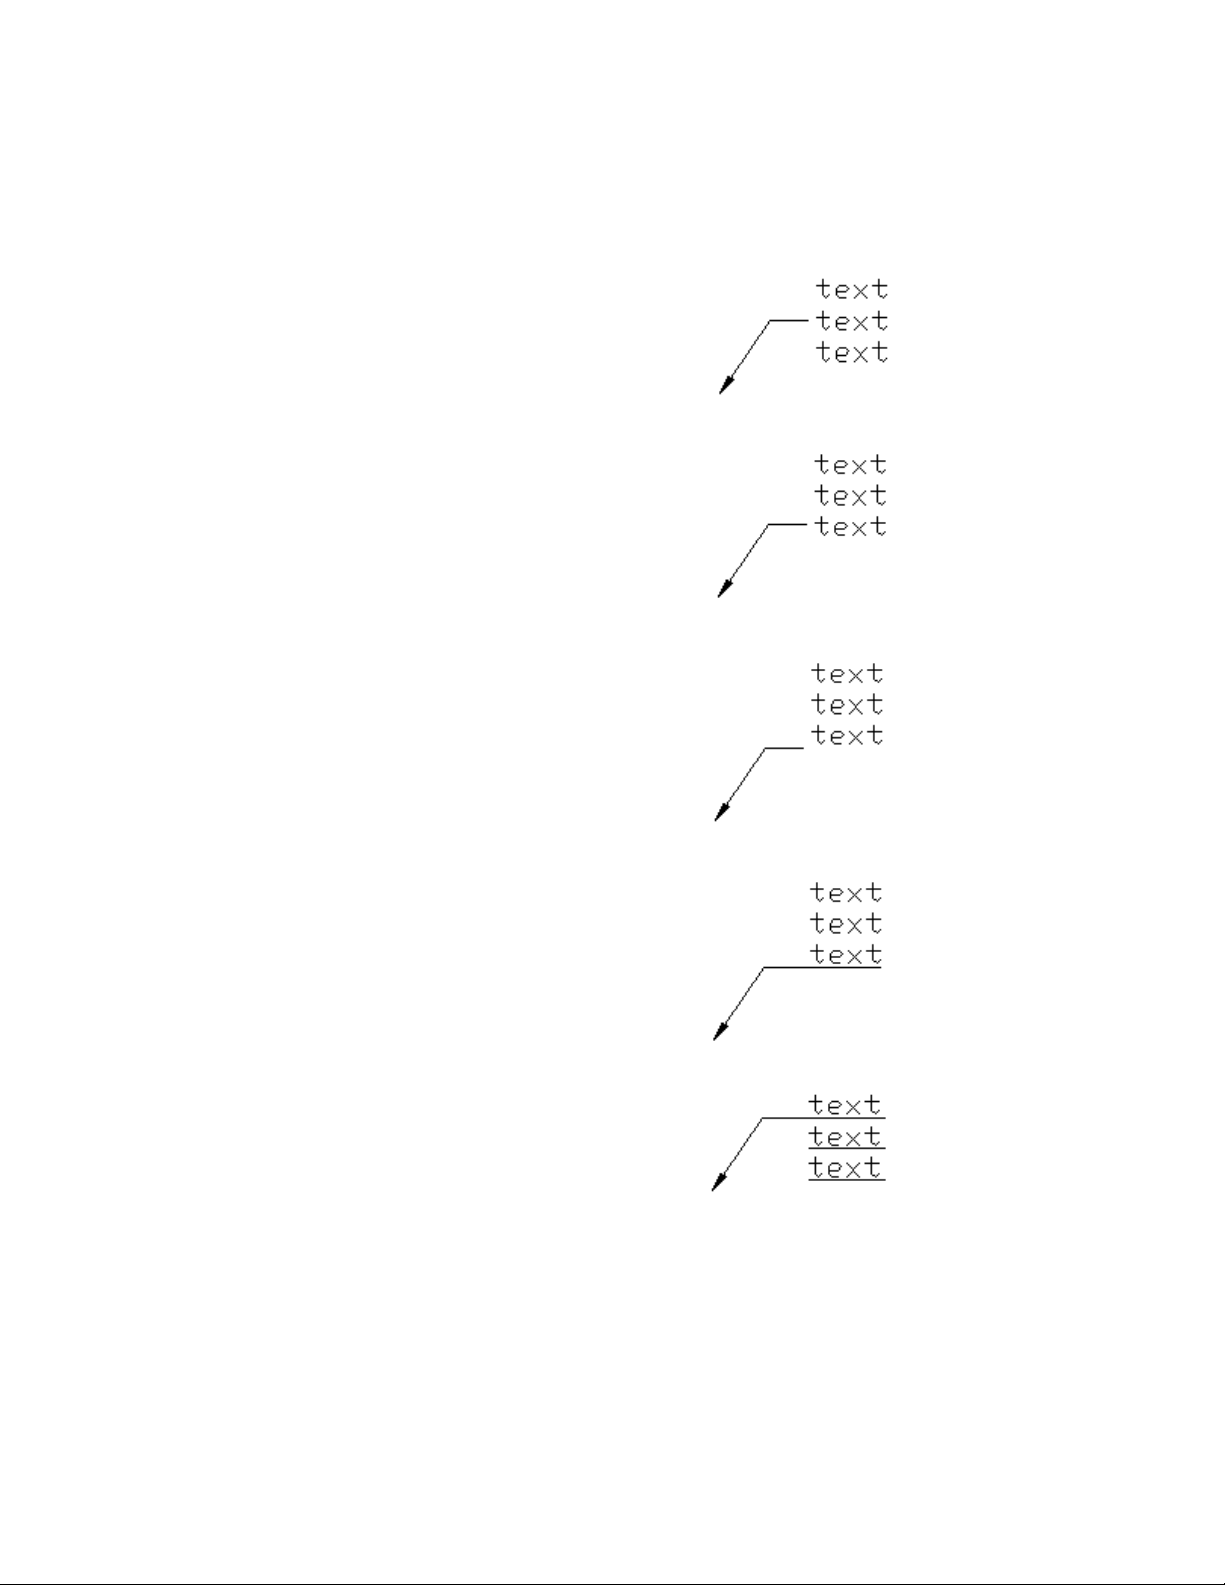
Middle of text
Middle of bottom line
Bottom of bottom line
Underline bottom line
Underline all text
Notes and Labels | 535

Leaders Containing Blocks
Multileaders can contain blocks as content by applying a multileader style
that references a block in your drawing.
NOTE Annotative blocks cannot be used as either content or arrowheads in
multileader objects.
Blocks can be connected to a multileader by attaching the landing to a selected
insertion point on the block. You can also connect a multileader to a center
point on the selected block.
You can create annotative multileaders with blocks as content. The block
content will be scaled according to the specified scale representation. Any
attributes within the block content will not change with the scale
representation. Non-annotative multileader objects can be scaled using the
MLEADERSCALE system variable.
See also:
Use Fields in Text (page 536)
Use Fields in Text
A field is updatable text that is set up to display data that may change during
the life cycle of the drawing. When the field is updated, the latest value of the
field is displayed.
Insert Fields
A field is text that contains instructions to display data that you expect to
change during the life cycle of the drawing.
When a field is updated, the latest data is displayed. For example, the value
of the FileName field is the name of the file. If the file name changes, the new
file name is displayed when the field is updated.
Fields can be inserted in any kind of text (except tolerances), including text
in table cells, attributes, and attribute definitions. When any text command
is active, Insert Field is available on the shortcut menu.
Some project fields can be inserted as placeholders. For example, you can
insert CurrentLayoutNumberAndTitle as a placeholder. Later, when the layout
536 | Chapter 9 Annotate Drawings

is added to a project, the placeholder field displays the correct layout number
and title.
A field for which no value is available displays hyphens (----). For example,
the PageSetupName field, which is set in the Page Setup Manager, may be
blank.
An invalid field displays pound signs (####). For example, the
CurrentLayoutTitle field, which is valid only in paper space, displays pound
signs if it is placed in model space.
Change the Appearance of a Field
The field text uses the same text style as the text object in which it is inserted.
By default, fields are displayed with a light gray background that is not plotted
(FIELDDISPLAY system variable).
Formatting options in the Insert Field dialog box control the appearance of
the text that is displayed. The options that are available depend on the type
of field. For example, the format for date fields includes options for displaying
the day of the week and the time, and the format for named object fields
includes capitalization options.
Edit a Field
A field is part of a text object and it can be edited from a text editor. The easiest
way to edit a field is to double click the text object that contains the field and
then, to display the Insert Field dialog box, double click the field. These
operations are available on the shortcut menus as well.
If you no longer want to update a field, you can preserve the value that is
currently displayed by converting the field to text.
The field expression, consisting of escape characters and a field code, is shown
in the Insert Field dialog box but cannot be edited.
Update Fields
When a field is updated, it displays the latest value. You can update fields
individually or update all fields in one or more selected text objects.
You can also set fields to be updated automatically when the drawing is
opened, saved, printed, and regenerated.
Notes and Labels | 537
FIELDEVAL controls whether fields are updated automatically or on demand.
The Date field cannot be updated automatically regardless of the setting of
FIELDEVAL.
NOTE When the DEMANDLOAD system variable is set to 2, fields cannot be
updated until you use FIELD or UPDATEFIELD.
Contextual Fields in Blocks and Xrefs
Some fields are contextual; that is, their value is different depending on which
space or layout they reside in. For example, because each layout can have a
different page setup attached, the value displayed by the PlotOrientation field
can be different in different layouts in the same drawing.
List of contextual fields
CurrentLayoutTitleCurrentLayoutCategory
DeviceNameCurrentLayoutCustom
PageSetupNameCurrentLayoutDescription
PaperSizeCurrentLayoutGroup
PlotDateCurrentLayoutIssuePurpose
PlotOrientationCurrentLayoutNumber
PlotScaleCurrentLayoutNumberAndTitle
PlotStyleTableCurrentLayoutRevisionDate
CurrentLayoutRevisionNumber
For compatibility with previous releases, contextual fields in blocks and xrefs
are not updated when you insert them in a drawing; instead, the field displays
the last cached value. Therefore, if you want to use a contextual field within
a block, for example, a title block, you must insert the field as an attribute.
538 | Chapter 9 Annotate Drawings

NOTE The Block Placeholder and Hyperlink fields are not available in AutoCAD
2013. The drawings created in AutoCAD that contain these fields can be opened
and the cached value is displayed.
For compatibility with previous releases, contextual fields in blocks and xrefs
are not updated when you insert them in a drawing; instead, the field displays
the last cached value. Therefore, if you want to use a contextual field within
a block, for example, a title block, you must insert the field as an attribute.
For example, a title block can use the CurrentLayoutNumber field as an
attribute. When you insert the title block, the field displays the number of
the layout on which the title block is inserted.
Most fields are not contextual and are updated in blocks and xrefs. Fields in
xrefs are updated based on the host file, not the source xref. These fields do
not have to be placed in attributes. For example, a field that displays the layout
number of a particular layout in a project and that updates if that layout
number changes, is a property of the project. When you create the field, you
select the Project field name, select the project and the layout that you want
in the Project Navigation tree, and then select the property SheetNumber for
the field value to be displayed. This field displays the layout number of that
layout, even if you put the field in a block and insert it in another drawing.
If the layout is removed from the project, it no longer has a layout number,
and the field becomes invalid and displays pound signs.
Some project fields can be inserted as placeholders. For example, when you
create your own callout blocks and label blocks, you can insert the
CurrentLayoutNumber field as a placeholder. Later, when the block is inserted
from the Project Manager, the field displays the layout number of the drawing.
Compatibility with Previous Releases
When a drawing with fields is opened in AutoCAD 2004 or earlier, the fields
are not updated; they display the value last displayed in the drawing before
it was opened. If no changes are made to a field, it is updated normally when
it is reopened in a release that supports fields.
See also:
Work with AutoCAD Drawings in AutoCAD LT (page 700)
Notes and Labels | 539
Work with Text Styles
When you enter text into your drawing, the current text style determines the
text font, size, angle, orientation, and other text characteristics.
Overview of Text Styles
All text in a drawing has a text style associated with it. When you enter text,
the program uses the current text style.
The current text style sets the font, size, obliquing angle, orientation, and
other text characteristics. If you want to create text using a different text style,
you can make another text style current. The table shows the settings for the
STANDARD text style.
Text Style Settings
DescriptionDefaultSetting
Name with up to 255 charactersSTANDARDStyle name
File associated with a font (character style)txt.shxFont name
Special shape definition file used for a non-AS-
CII character set, such as Kanji
NoneBig Font
/Asian Set
Character height0Height
Expansion or compression of the characters1Width factor
Slant of the characters0Obliquing angle
Backwards textNoBackwards
Upside-down textNoUpside down
Vertical or horizontal textNoVertical
540 | Chapter 9 Annotate Drawings
The settings for the current text style are displayed at the Command prompts.
You can use or modify the current text style or create and load a new text
style. Once you've created a text style, you can modify its characteristics,
change its name, or delete it when you no longer need it.
Create and Modify Text Styles
Except for the default STANDARD text style, you must create any text style
that you want to use.
Text style names can be up to 255 characters long. They can contain letters,
numbers, and the special characters dollar sign ($), underscore (_), and hyphen
(-). If you don't enter a text style name, the text styles are automatically named
Stylen, where n is a number that starts at 1.
You can modify an existing text style in the Text Style dialog box by changing
the settings. You can also update existing text of that text style to reflect the
changes.
Certain style settings affect multiline and single-line text objects differently.
For example, changing the Upside Down and Backwards options has no effect
on multiline text objects. Changing Width Factor and Obliquing options has
no effect on single-line text.
If you rename an existing text style, any text using the old name assumes the
new text style name.
You can remove unreferenced text styles from your drawing with PURGE or
by deleting the text styles from the Text Styles dialog box. The STANDARD
text style cannot be removed.
Change Text Style
When you change the text style of a multiline text object, the updated settings
are applied to the entire object, and some formatting of individual characters
might not be retained. The following table describes the effects of text style
change on character formatting.
Retained?Formatting
NoBold
YesColor
NoFont
Notes and Labels | 541
Retained?Formatting
NoHeight
NoItalic
YesStacking
YesUnderlining
Annotative Text Styles
Use annotative text for notes and labels in your drawing. You create annotative
text by using an annotative text style, which sets the height of the text on
the paper.
For more information about creating and working with an annotative text,
see Create Annotative Text (page 495).
See also:
Scale Annotations (page 490)
Create Annotative Text (page 495)
Assign Text Fonts
You can assign a text font as part of the text style definition. Several factors
depend on the type of text you are working with.
Overview of Assigning Text Fonts
Fonts define the shapes of the text characters that make up each character set.
You can use TrueType fonts in addition to compiled SHX fonts.
A single font can be used by more than one text style. If your company has a
standard font, you can modify other text style settings to create a set of text
styles that use this standard font in different ways.
You can assign a font to a text style by selecting a font file from the list in the
Text Style dialog box.
542 | Chapter 9 Annotate Drawings

Use TrueType Fonts
Several factors affect the display of TrueType fonts in a drawing.
TrueType fonts always appear filled in your drawing; however, when you plot,
the TEXTFILL system variable controls whether the fonts are filled. By default
TEXTFILL is set to 1 to plot the filled-in fonts.
The In-Place Text Editor can display only fonts that are recognized by the
operating system. Because SHX fonts are not recognized by the operating
system, a TrueType equivalent is supplied in the In-Place Text Editor when
you select an SHX or any other non-TrueType font for editing.
See also:
Set Text Height (page 547)
Use Text Fonts for International Work
Several factors affect your choosing, entering, and displaying international
text in a drawing.
The program supports the Unicode character-encoding standard. An SHX font
encoded using the Unicode standard font can contain many more characters
than are defined in your system; therefore, to use a character not directly
available from the keyboard, you can enter the escape sequence \U+nnnn,
where nnnn represents the Unicode hexadecimal value for the character.
Beginning with AutoCAD 2007, all SHX shape fonts are encoded with the
Unicode standard with the exception of Asian sets, or more commonly known
as Big Fonts. When choosing a text font for international work, you can use
either a TrueType Font or a Big Font.
Notes and Labels | 543
Asian Big Font SHX Files
Asian alphabets contain thousands of non-ASCII characters. To support such
text, the program provides a special type of shape definition known as a Big
Font file. You can set a style to use both regular and Big Font files.
Asian Language Big Fonts Included in the Product
DescriptionFont File Name
Japanese vertical font (a few characters are ro-
tated to work correctly in vertical text)
@extfont2.shx
Japanese font, subset of charactersbigfont.shx
Traditional Chinese fontchineset.shx
Japanese extended font, level 1extfont.shx
Japanese extended font, level 2extfont2.shx
Simplified Chinese fontgbcbig.shx
Korean fontwhgdtxt.shx
Korean fontwhgtxt.shx
Korean fontwhtgtxt.shx
Korean fontwhtmtxt.shx
When you specify fonts using -STYLE, the assumption is that the first name
is the normal font and the second (separated by a comma) is the Big Font. If
you enter only one name, it's assumed that it is the normal font and any
associated Big Font is removed. By using leading or trailing commas when
544 | Chapter 9 Annotate Drawings
specifying the font file names, you can change one font without affecting the
other, as shown in the following table.
Specifying fonts and Big Fonts at the Command prompt
To specify this ...Enter this ...
Both normal fonts and Big Fonts[font name],[big font name]
Only a normal font (Big Font unchanged)[font name],
Only a Big Font (normal font unchanged),[big font name]
Only a normal font (Big Font, if any, removed)[font name]
No changeENTER (null response)
NOTE Long file names that contain commas as font file names are not accepted.
The comma is interpreted as a separator for an SHX font-Big Font pair.
See also:
Substitute Fonts (page 545)
Substitute Fonts
A font used in a drawing but that is not currently available on your system is
automatically substituted with another font.
The program accommodates a font that is not currently on your system by
substituting another font.
Specify an Alternate Font
If your drawing specifies a font that is not currently on your system, the font
designated as your alternate font is automatically substituted. By default, the
simplex.shx file is used. If you want to specify a different font, enter the
alternate font file name by changing the FONTALT system variable. If you use
a text style that uses a Big Font (or Asian Set), you can map it to another font
using the FONTALT system variable. This system variable uses a default font
Notes and Labels | 545

file pair: txt.shx and bigfont.shx. For more information, see Use Text Fonts for
International Work (page 543).
In previous releases, you could display PostScript
®
fonts in the drawing. Because
later releases cannot display PostScript fonts, Autodesk has supplied TrueType
font equivalents. These PostScript fonts are mapped to the equivalent TrueType
fonts in a font mapping file. Additionally, when a TrueType font is not
available, you can specify a different TrueType font, making sure that the
fonts are similar to avoid text length or wrapping problems.
If the default font does not support the characters you enter using the In-Place
Text Editor (MTEXT command), an alternative font is substituted.
CIF or MIF codes entered with the In-Place Text Editor or with the TEXT
command are now automatically converted to display the actual characters.
Edit the Font Mapping File
A font mapping file is a list of text fonts and their substitutes. If a text font
used in a drawing cannot be located, another text font is substituted for the
missing font using a font mapping file.
Each line in the font mapping file contains the name of a font file (with no
file extension or path) followed by a semicolon (;) and the name of the
substitute font file. The substitute file name includes a file extension such as
.ttf.
A font mapping file is an ordinary ASCII text file with a .fmp extension. The
default font mapping file is acad.fmp. You can change the font assignments
in a font mapping file using any ASCII text editor.
For example, you could use the following entry in a font map file to specify
that the timesnr.pfb font file be substituted with the times.ttf font file:
timesnr;times.ttf
The following table shows the font substitution rules used if a font file cannot
be located when a drawing is opened.
Font substitution
Fourth map-
ping order
Third mapping
order
Second mapping
order
First mapping or-
der
File exten-
sion
Windows substitutes
a similar font
Use font defined in
text style
Use font mapping
table
.ttf
546 | Chapter 9 Annotate Drawings
Font substitution
Fourth map-
ping order
Third mapping
order
Second mapping
order
First mapping or-
der
File exten-
sion
Prompt for new
font
Use FONTALTUse font defined in
text style
Use font mapping
table
.shx
Prompt for new fontUse FONTALTUse font mapping
table
.pfb
Display Proxy Fonts
For third-party or custom SHX fonts that have no TrueType equivalent, one
of several different TrueType fonts called proxy fonts is substituted. In the
In-Place Text Editor, proxy fonts look different from the fonts they represent
to indicate that the proxy fonts are substitutions for the fonts used in the
drawing.
If you want to format characters by assigning one of these fonts, first create
a text style that uses the font and then apply that text style to the characters.
Set Text Height
Text height determines the size in drawing units of the letters in the font you
are using.
Set Text Height
The exception is TrueType fonts: the value usually represents the size of the
uppercase letters.
If you specify a fixed height as part of a text style, the Height prompt is
bypassed when you create single-line text. When the height is set to 0 in the
text style, you are prompted for the height each time you create single-line
text. Set the value to 0 if you want to specify the height as you create text.
Notes and Labels | 547
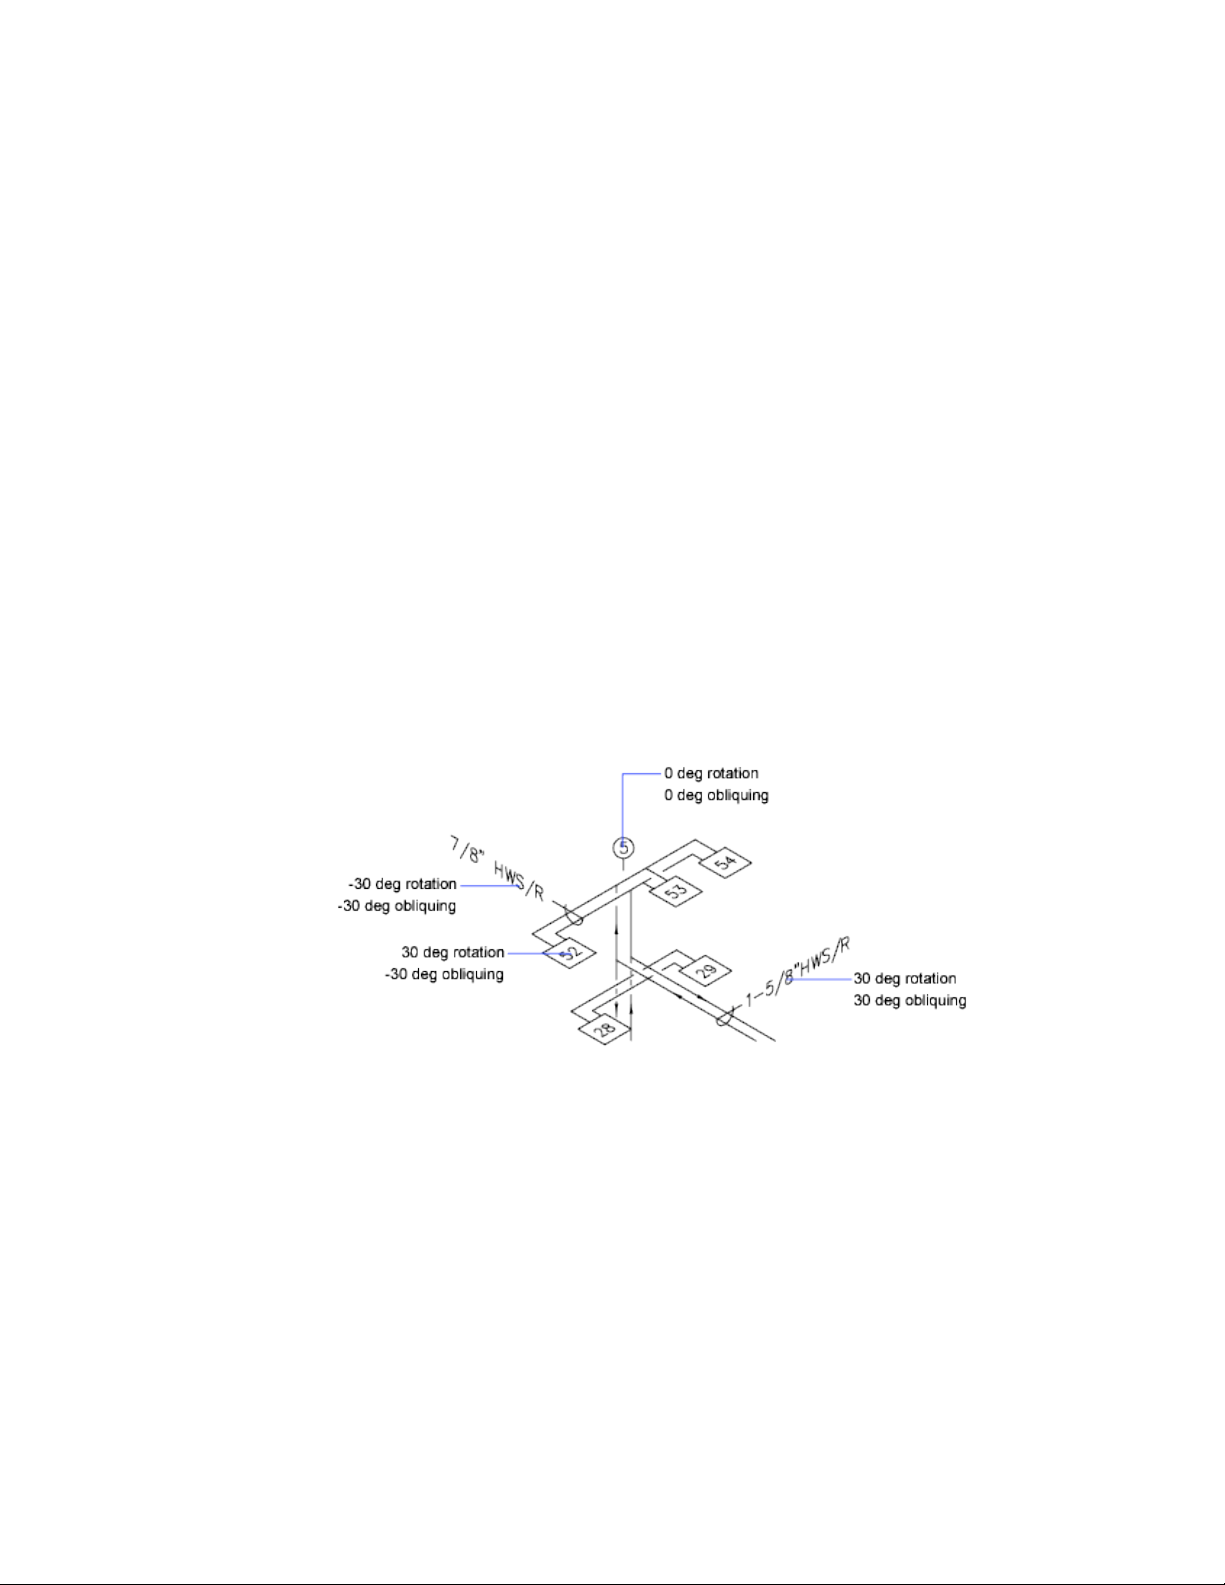
TrueType Fonts
For TrueType fonts, the value specified for text height represents the height
of a capital letter plus an ascent area reserved for accent marks and other marks
used in non-English languages. The relative portion of text height that is
assigned to capital letters and ascent characters is determined by the font
designer at the time the font is designed; consequently, it varies from font to
font.
In addition to the height of a capital letter and the ascent area that make up
the text height specified by the user, TrueType fonts have a descent area for
portions of characters that extend below the text insertion line, for example,
y, j, p, g, and q.
When you apply a text height override to all text in the editor, the entire
multiline text object is scaled, including its width.
Set Text Obliquing Angle
The obliquing angle determines the forward or backward slant of the text.
The angle represents the offset from 90 degrees.
Entering a value between -85 and 85 makes the text oblique. A positive
obliquing angle slants text to the right. A negative obliquing angle slants text
to the left.
548 | Chapter 9 Annotate Drawings
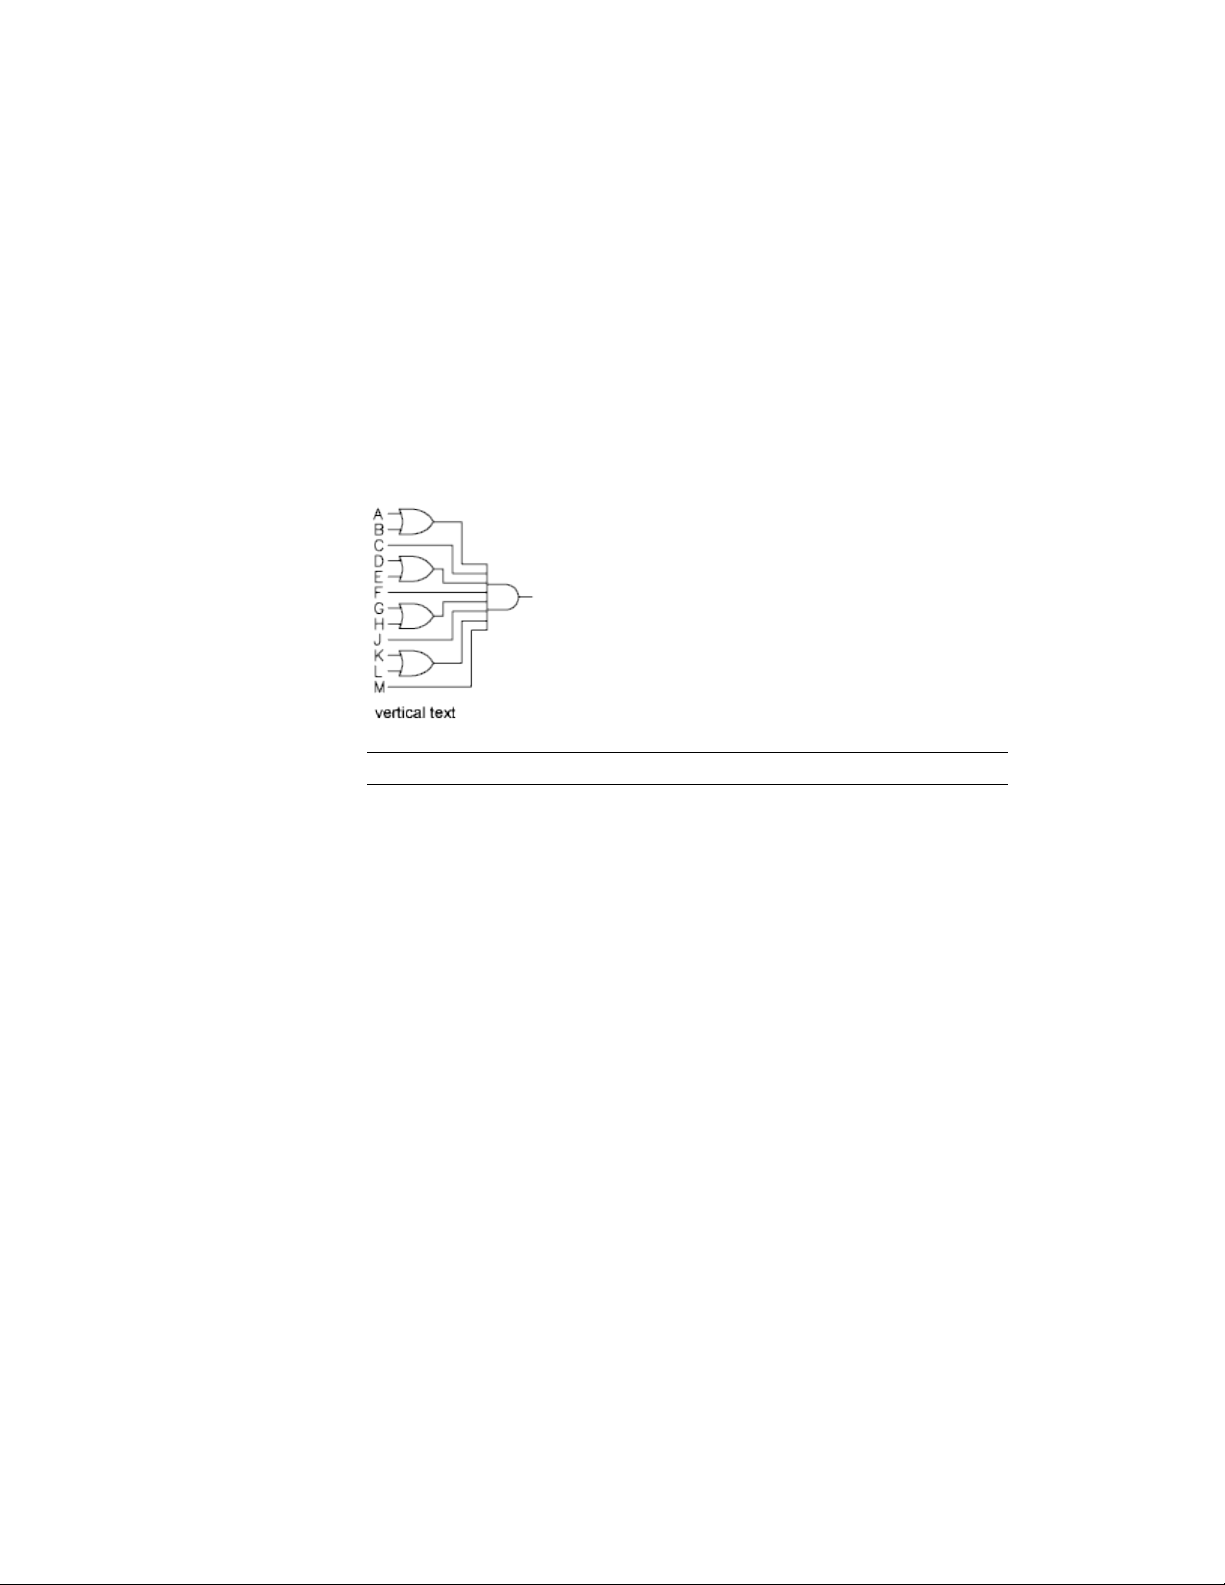
Set Horizontal or Vertical Text Orientation
Text can be vertical or horizontal. Text can have a vertical orientation only if
the associated font supports dual orientation.
Lines of text are oriented to be vertical or horizontal. Text can have a vertical
orientation only if the associated font supports dual orientation. You can
create more than one line of vertical text. Each successive text line is drawn
to the right of the preceding line. The normal rotation angle for vertical text
is 270 degrees.
NOTE Vertical orientation is not supported for TrueType fonts and symbols.
Vertical Text for Asian Languages
■ SHX fonts. Text can be created with SHX fonts and Big Fonts for vertical
display in the same way as for previous releases. For best results, use the
single-line TEXT command, not MTEXT. You can select a vertical style in
the Text Style dialog box.
■ TrueType fonts. You still select fonts starting with the @ sign, but now
the text is automatically rotated 270 degrees. (In AutoCAD 2005 and earlier
releases, you had to manually rotate this text.) Vertical cursor movement
is now supported for vertical text.
Change Text
You can change text content, formatting, and properties such as scale and
justification.
Notes and Labels | 549
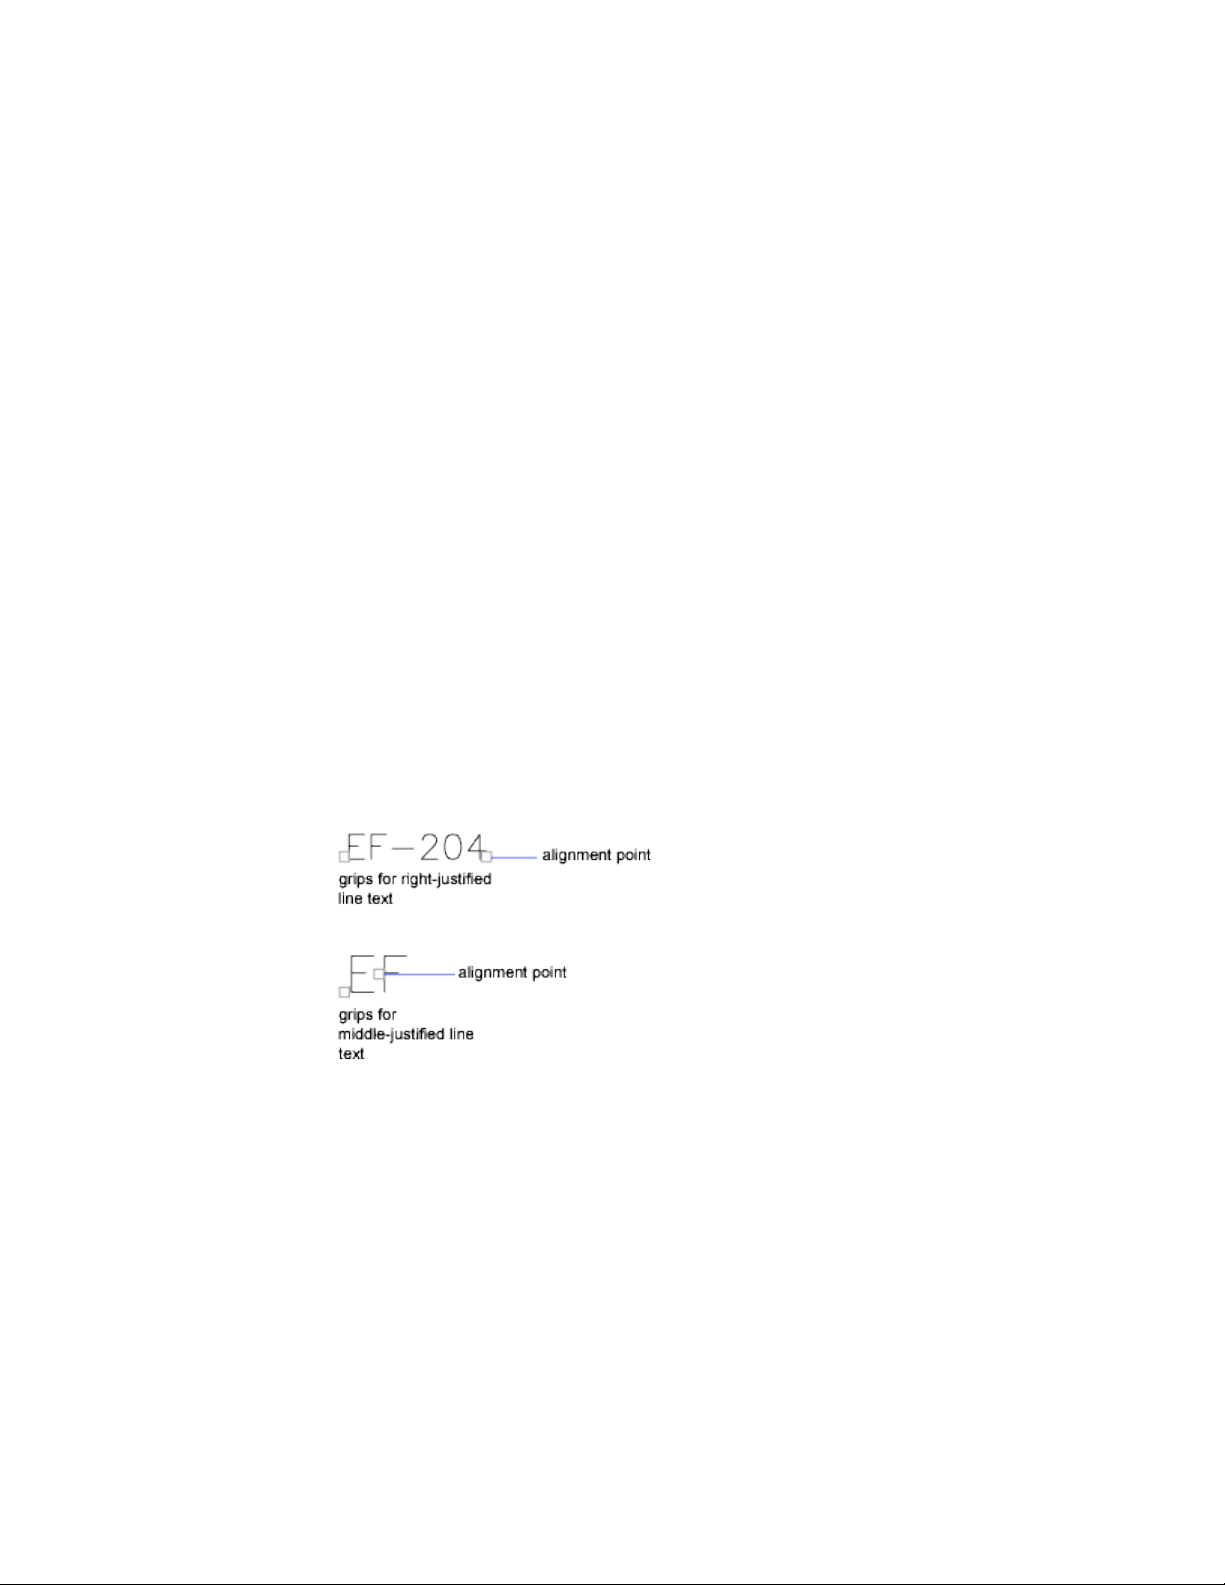
Overview of Changing Text
Text, whether created with TEXT, MTEXT, or MLEADER can be modified like
any other object.
You can move, rotate, erase, and copy it. You can change text properties in
the Properties Inspector palette.
You can also edit the contents of existing text and create a mirror image of
it. The MIRRTEXT system variable controls whether text is also reversed when
you mirror objects in your drawing.
Change Single-Line Text
You can change the contents, formatting and properties of single-line text.
You can change single-line text with DDEDIT and PROPERTIES. Use DDEDIT
when you need to change only the content of the text, not the formatting or
properties of the text object. Use PROPERTIES when you want to change
content, text style, location, orientation, size, justification, and other
properties.
Text objects also have grips for moving, scaling, and rotating. A text object
has grips at the lower-left corner of the baseline and at the alignment point.
The effect of a command depends on which grip you choose.
Change Multiline Text
You can change the location and content of multiline text objects with the
Properties Inspector palette, the In-Place Text Editor, and grips.
550 | Chapter 9 Annotate Drawings

After you create multiline text, you can use the Properties Inspector palette
to change the following:
■ Text style assignment
■ Justification
■ Width
■ Rotation
■ Line spacing
In addition, you can use the following to modify individual formatting, such
as boldface and underlining, and width for multiline text objects:
■ Text Editor visor
■ In-Place Text Editor
■ Grips
Change Text Location
You can use many of the common modifying commands and grips to move
multiline text objects. A multiline text object has grips at the four corners of
the text boundary and, in some cases, at the justification point.
Commands such as DIMLINEAR or LEADER create multiline text automatically
without requiring that a bounding box be specified; these objects have only
a single grip at the justification point.
When you need to align or move multiline text objects, you can use the Node
and Insertion object snaps for precision. If the OSNAPNODELEGACY system
variable is set to 0, the Node object snap ignores multiline text.
See also:
Work with Text Styles (page 540)
Control the Display of Polylines, Hatches, Gradient Fills, Lineweights, and
Text (page 145)
Find and Replace Text
You can easily find and replace text with the FIND command
To search for and replace text, use FIND. Replacement is based on text content
only; character formatting and text properties are not changed.
Notes and Labels | 551
When searching for text in a 3D view, the viewport will temporarily change
to a 2D viewport so that text is not blocked by 3D objects in your drawing.
With FIND, you can use wild-card characters in your search.
DefinitionCharacter
Matches any numeric digit# (Pound)
Matches any alphabetic character@ (At)
Matches any non-alphanumeric character. (Period)
Matches any string and can be used anywhere in the search
string
* (Asterisk)
Matches any single character; for example, ?BC matches ABC,
3BC, and so on
? (Question mark)
Matches anything but the pattern; for example; ~*AB*matches
all strings that do not contain AB
~ (Tilde)
Matches any one of the characters enclosed; for example,
[AB]C matches AC and BC
[ ]
Matches any character not enclosed; for example, [~AB]C
matches XC but not AC
[~]
Specifies a range for a single character; for example, [A-G]C
matches AC, BC, and so on to GC, but not HC
[-]
Reads the next character literally; for example, `~AB matches
~AB
` (Reverse quote)
Check Spelling
You can check the spelling of all text as it is entered in your drawing. You can
also specify the specific language dictionary that is used and customize and
manage multiple custom spelling dictionaries.
552 | Chapter 9 Annotate Drawings
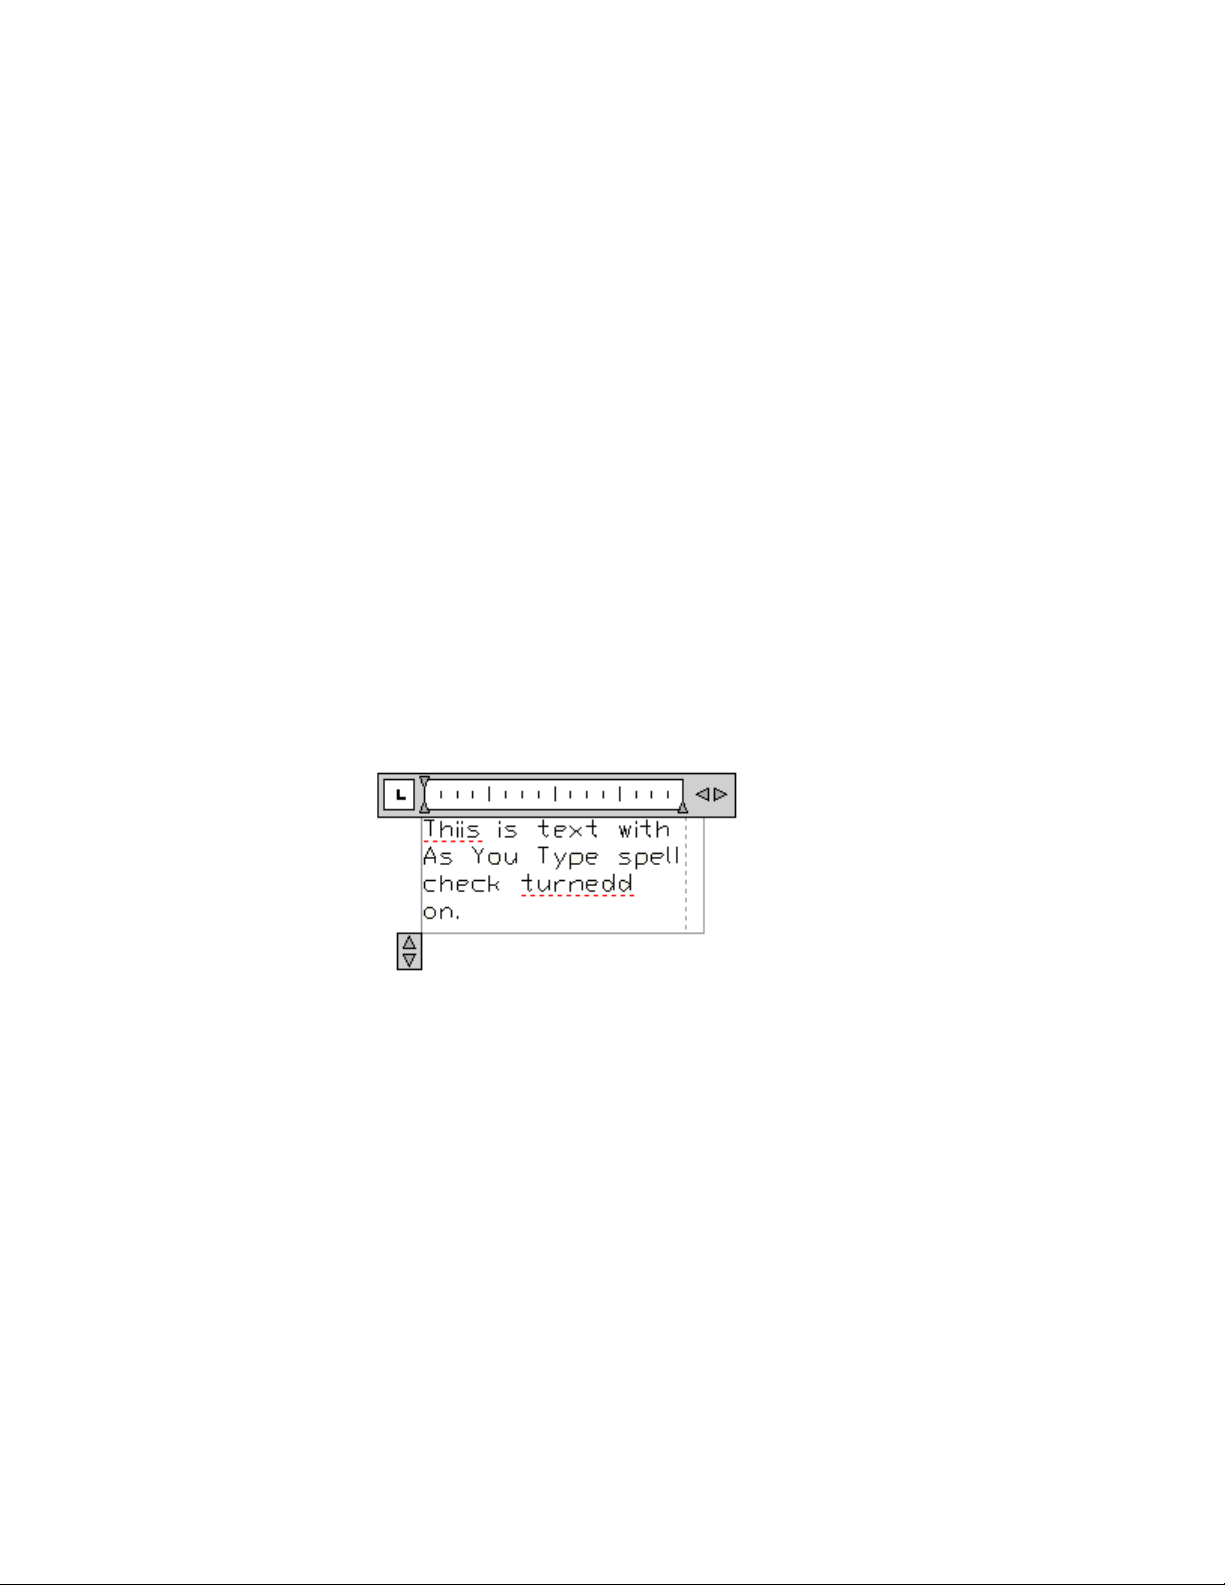
You can check the spelling of all text objects in your drawing, including
■ Single and multiline text
■ Dimension text
■ Multileader text
■ Text within block attributes
■ Text within xrefs
With Check Spelling, your drawing or the areas of your drawing’s text that
you specify are searched for misspelled words. If a misspelled word is identified,
the word is highlighted and the drawing area zooms to that word in a scale
that is easy to read.
Check Spelling As You Type
By default, you can check spelling as you enter text in the In-Place Text Editor.
Any word you enter is checked for spelling errors when it is completed. A
word is considered completed when one of the following actions are taken:
■ Pressing Spacebar or Enter
■ Moving the cursor to another position within the In-Place Text Editor.
Misspelled words are underlined with a red dotted line.
Any word not found in the current dictionary is underlined as misspelled.
Spelling suggestions are displayed when you right-click the underlined word.
Format Multiline Text at the Command Prompt
If you are writing scripts or custom applications that create multiline text,
you can apply formatting to the text by using format codes.
Notes and Labels | 553
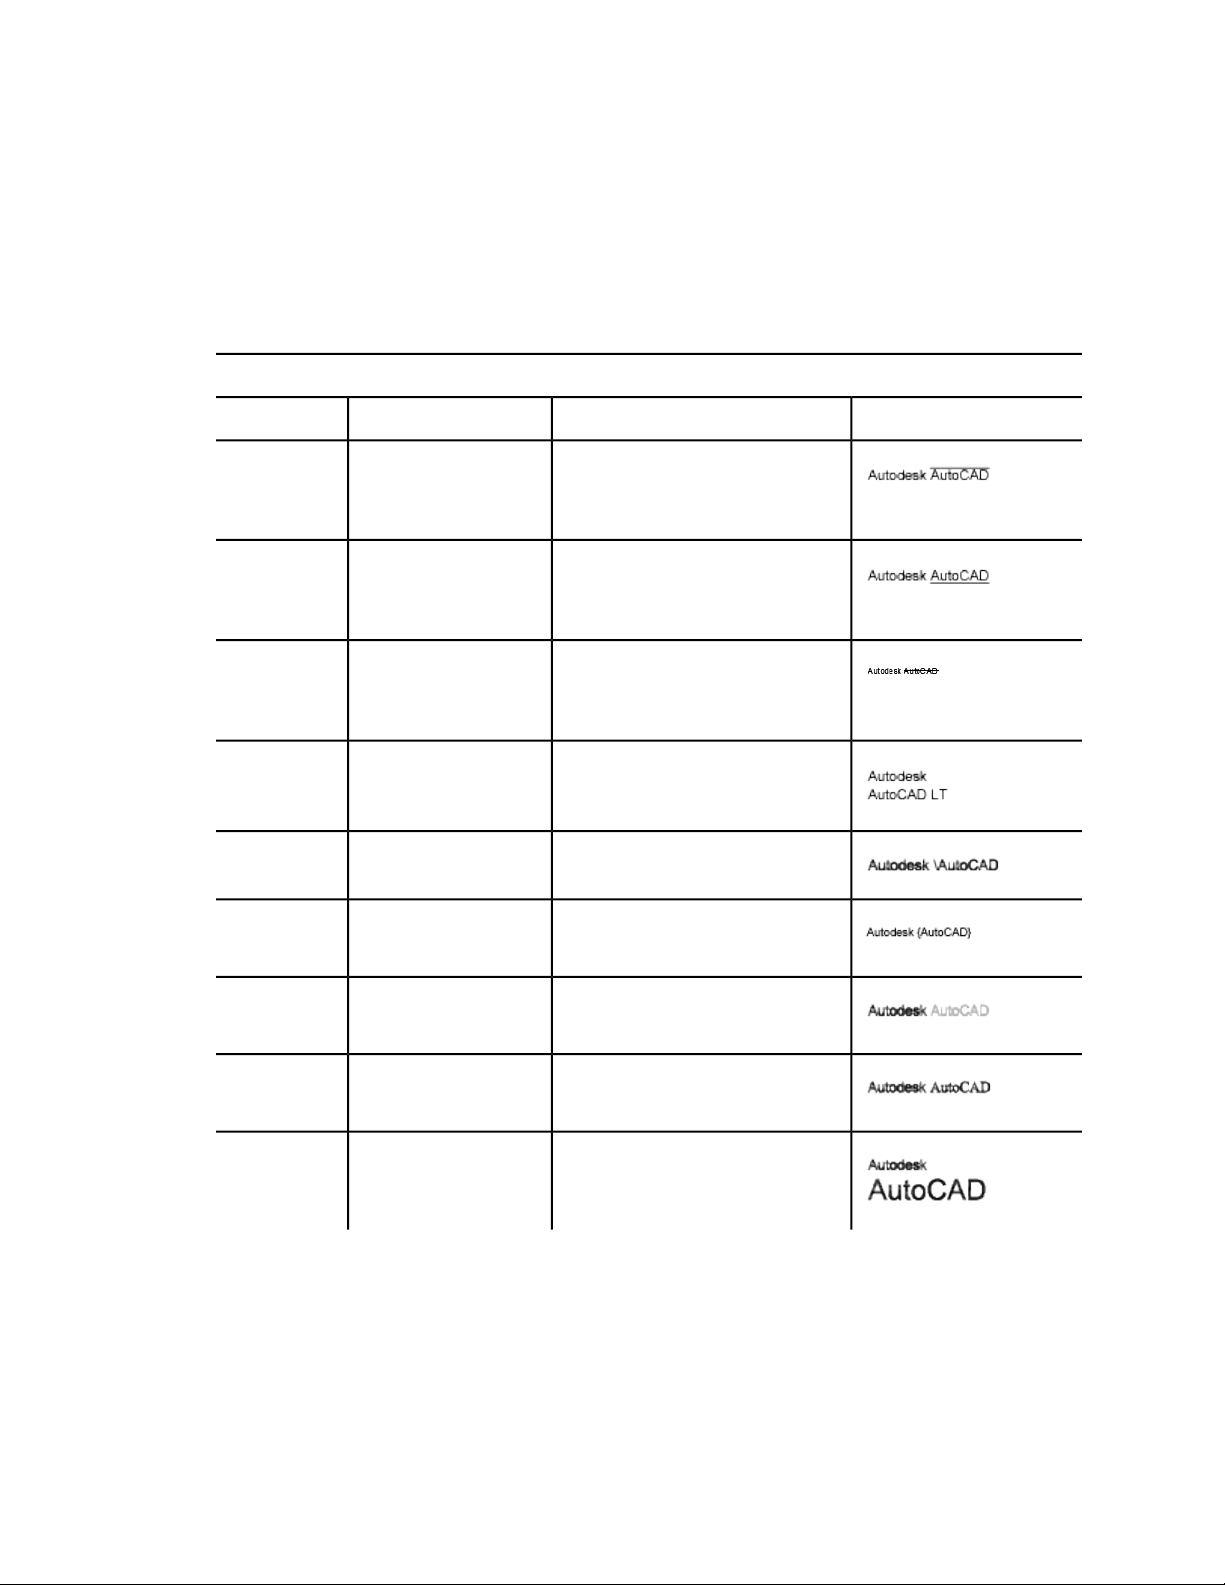
You can underline text, add a line over text, and create stacked text. You can
also change color, font, and text height. You can change the spaces between
text characters or increase the width of the characters themselves. To apply
formatting, use the format codes shown in the following table.
Format codes for paragraphs
To produce this …Enter this …PurposeFormat code
Autodesk \OAutoCAD\o
or
Autodesk {\OAutoCAD}
Adds a line above the
characters
\0...\o
or
{\0...}
Autodesk \LAutoCAD\l
or
Autodesk {\LAutoCAD}
Adds a line below the
characters
\L...\l
or
{\L...}
Autodesk \KAutoCAD\k
or
Places a strike through the
characters
\K...\k
or
{\K...} Autodesk {\KAutoCAD}
Autodesk AutoCAD\~LTInserts a nonbreaking
space
\~
Autodesk \\AutoCADInserts a backslash\\
Autodesk \{AutoCAD\}Inserts an opening and
closing brace
\{...\}
Autodesk \C2;AutoCADChanges to the specified
color
\Cvalue;
Autodesk \Ftimes; AutoCADChanges to the specified
font file
\File name;
Autodesk \H2;AutoCADChanges to the text height
specified in drawing units
\Hvalue;
554 | Chapter 9 Annotate Drawings
Format codes for paragraphs
To produce this …Enter this …PurposeFormat code
Autodesk \H3x;AutoCADChanges the text height
to a multiple of the current
text height
\Hvaluex;
1.000\S+0.010^-0.000;Stacks the subsequent text
at the /, #, or ^ symbol
\S...^...;
\T2;AutodeskAdjusts the space between
characters. Valid values
\Tvalue;
range from a minimum of
.75 to 4 times the original
spacing between charac-
ters.
\Q20;AutodeskChanges obliquing angle\Qangle;
\W2;AutodeskChanges width factor to
produce wide text
\Wvalue;
\A1;1\S1/2Sets the alignment value;
valid values: 0, 1, 2 (bot-
tom, center, top)
\A
Autodesk\PAutoCADEnds paragraph\P
Braces can be nested up to eight levels deep.
You can also use control codes to add special characters, such as tolerance or
dimensioning symbols. See MTEXT.
Notes and Labels | 555
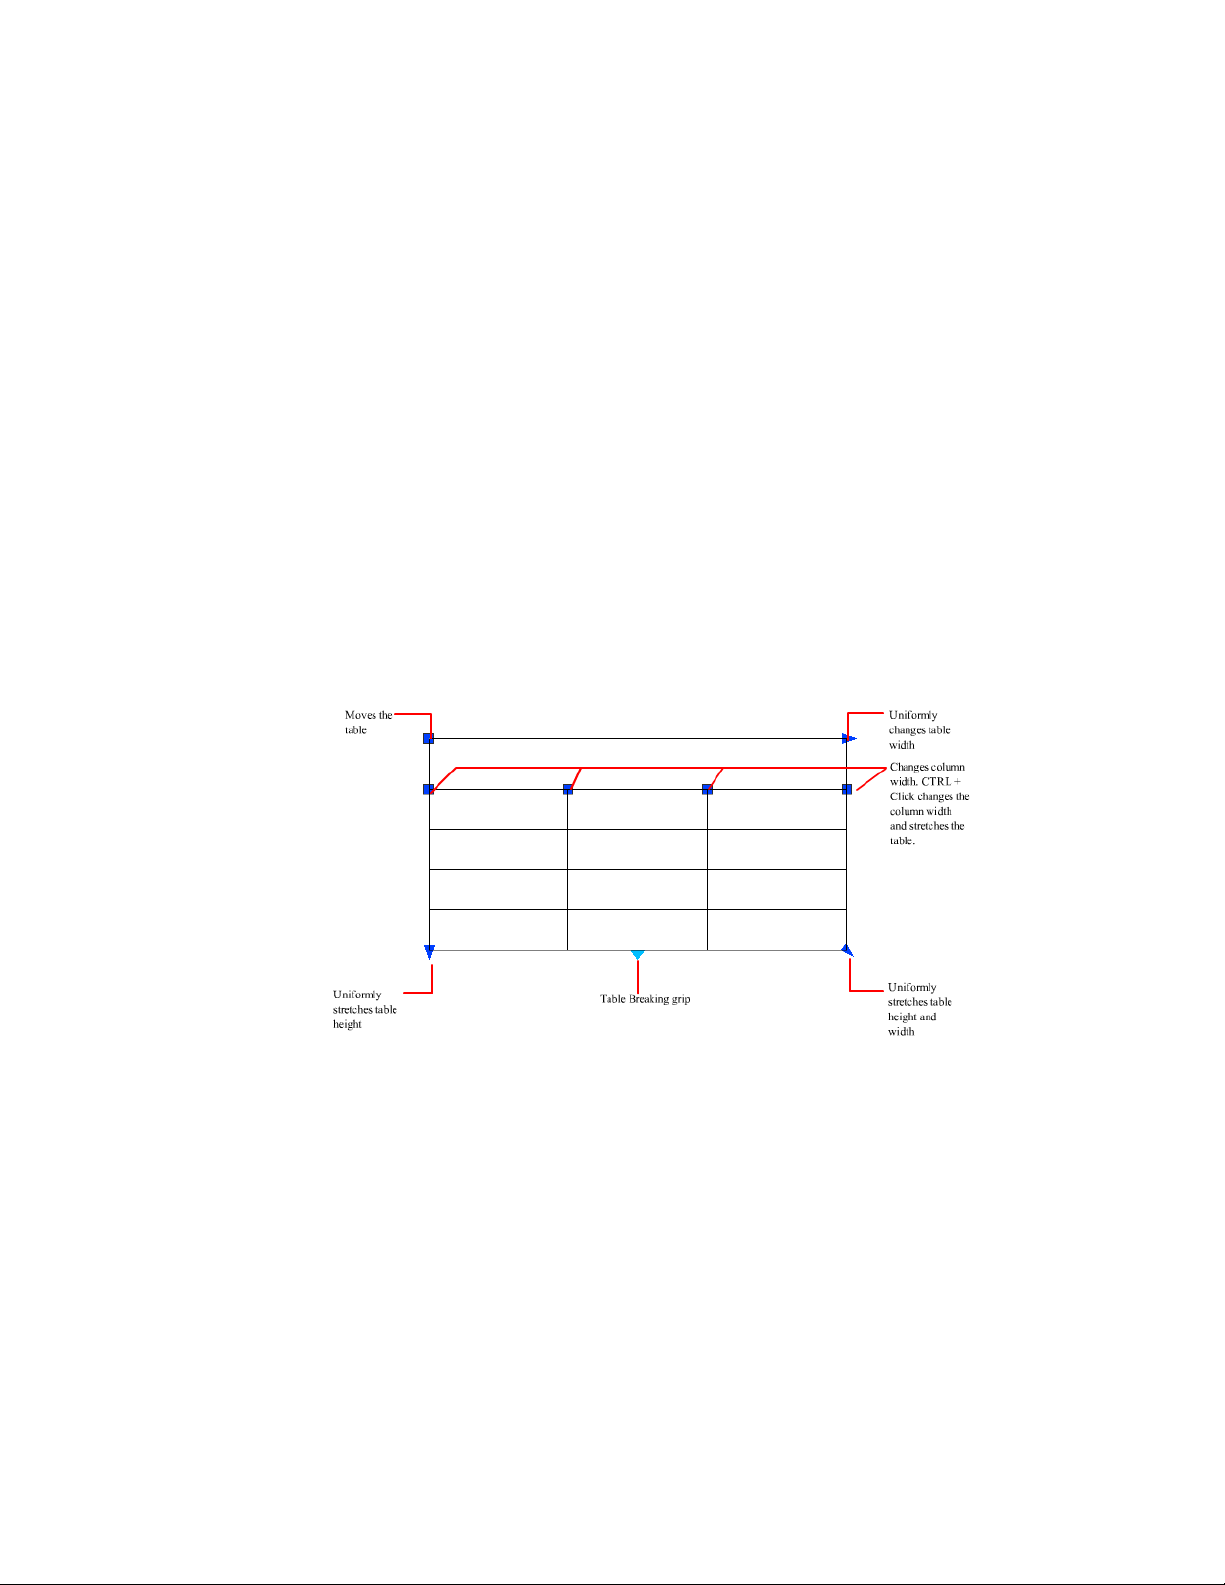
Tables
A table is a rectangular array of cells that contain annotation, primarily text
but also multiple blocks.
Tables appear in many different forms on many of the sheets that make up
drawing sets. In the AEC industry, tables are often referred to as “schedules”
and contain information about the materials needed for the construction of
the building being designed. In the manufacturing industry, they are often
referred to as “BOM” (bills of materials).
Create and Modify Tables
A table is an object that contains data in rows and columns. A table object
can be created from an empty table or table style.
After the table has been created, you can click any gridline on the table to
select it and then modify it by using the Properties Inspector or grips.
When you change the height or width of the table, only the row or column
adjacent to the grip you have selected will change. The table will maintain its
height or width. To change the size of the table proportionally to the size of
the row or column you are editing, press Ctrl while using a column grip.
556 | Chapter 9 Annotate Drawings
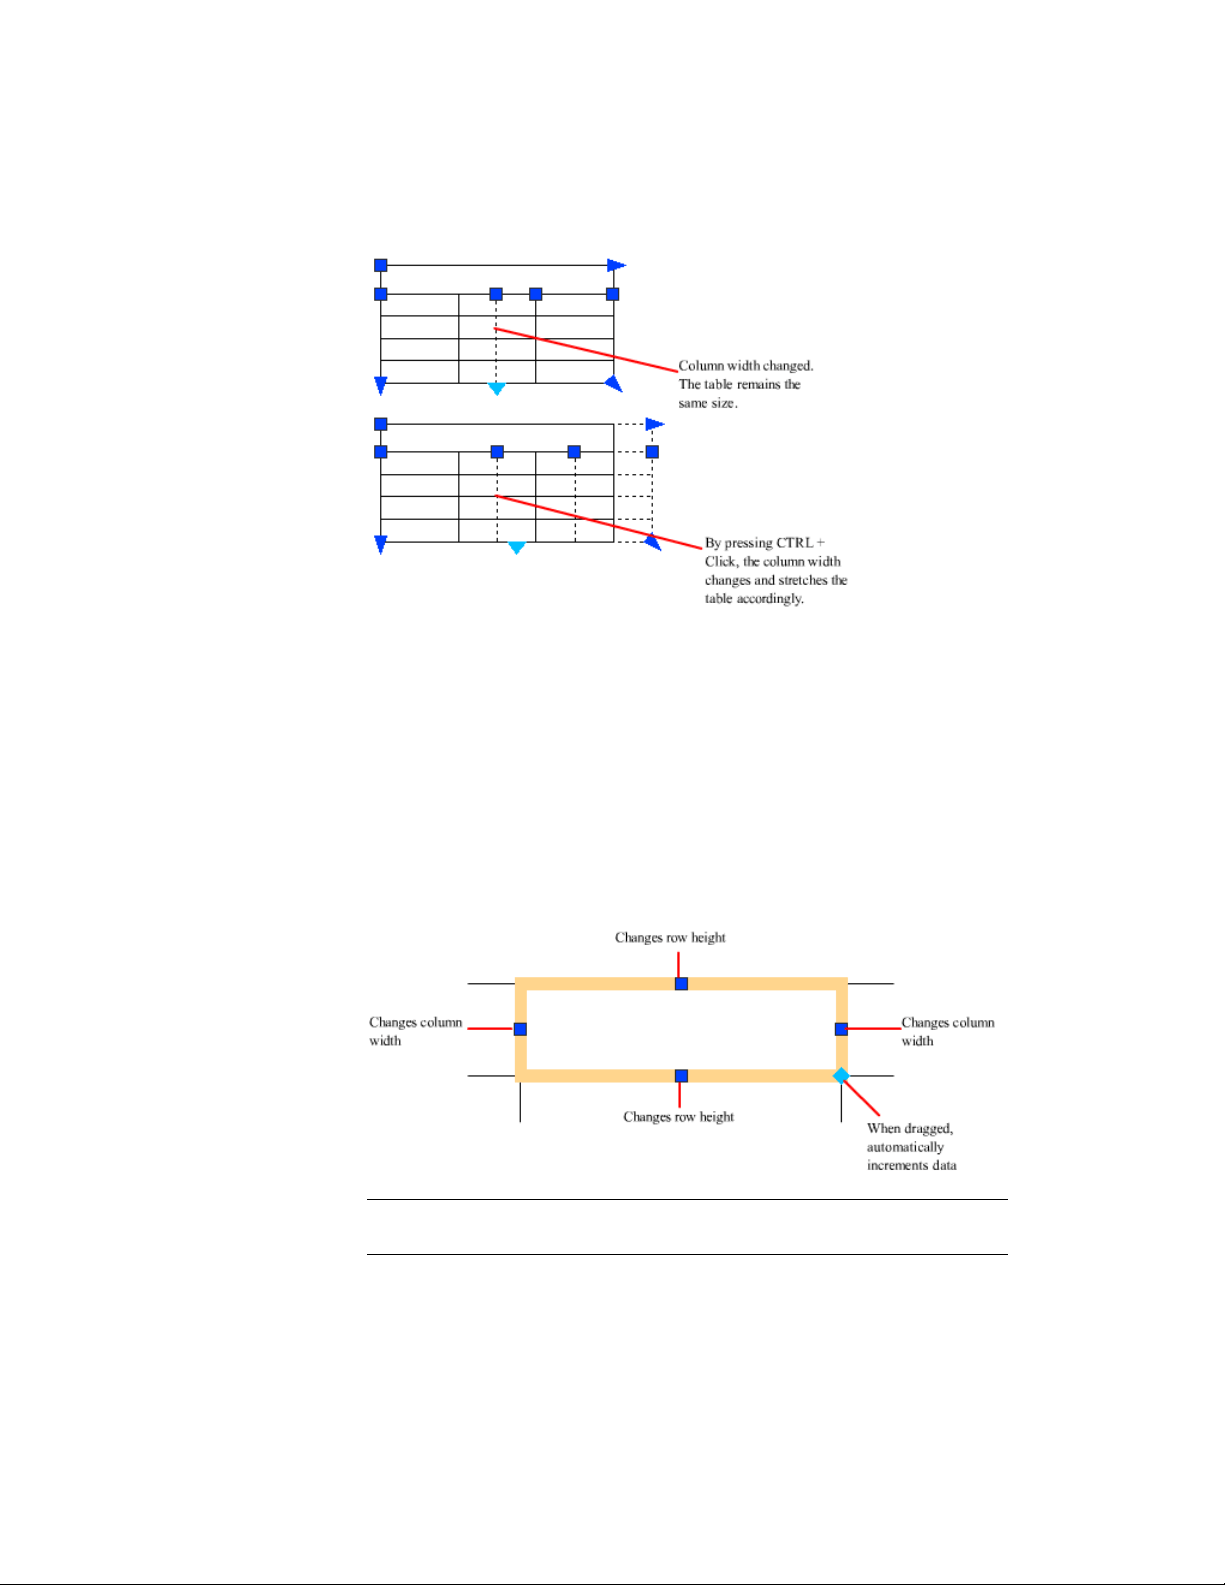
Break Tables into Multiple Parts
A table with a large amount of data can be broken into primary and secondary
table fragments. Use the table breaking grips found at the bottom of your table
to make a table span multiple columns in your drawing or to manipulate the
different table parts you have already created.
Modify a Table Cell
You can click inside a cell to select it. Grips are displayed in the middle of the
cell borders. Click inside another cell to move selection to that cell. Drag the
grips on a cell to make the cell and its column or row larger or smaller.
NOTE When a cell is selected, double-click to edit the cell text. You can also start
entering text when a cell is highlighted to replace its current content.
Tables | 557

To select more than one cell, click and drag over several cells. You can also
hold down Shift and click inside another cell to select those two cells and all
the cells between them.
When you click inside a table cell, the Table Cell visor is displayed. From here,
you can
■ Insert and delete rows and columns
■ Merge and unmerge cells
■ Match cell styles
■ Alter the appearance of cell borders
■ Edit data formatting and alignment
■ Insert blocks, fields, and formulas
■ Size rows and columns equally
■ Remove all property overrides
Customize Display of Column Letters and Row Numbers
By default, the In-Place Text Editor displays column letters and row numbers
when a table cell is selected for editing. Use the TABLEINDICATOR system
variable to turn this display on and off.
See also:
Add Text and Blocks to Tables (page 559)
Work with Table Styles
The appearance of the table is controlled by its table style. You can use the
default table style, STANDARD, or a custom table style saved in the drawing.
NOTE AutoCAD 2013 does not support the ability to create or modify table and
cell styles. You can edit the properties of a table and individual cells using the
Properties Inspector.
When you select a table, you can change the appearance of the a table under
the Table and Table Breaks sections of the Properties Inspector and Table visor.
To display all of the table properties in the Properties Inspector, click All below
the Object drop-down list. If you have a table style saved in your drawing,
you can assign it to the table using the Table Style property under the Table
section.
558 | Chapter 9 Annotate Drawings

Table styles control the appearance of a table and all of the cells contained in
the table, but you can override the style of individual cells. The Cell and
Contents sections of the Properties Inspector are used to control the border
styles, text formatting, and the size of the cells.
The border properties in a table’ s cell style control the display of the gridlines
that divide the table into cells. The borders of the title row, the column heads
row, and the data rows can have different lineweight and color and can be
displayed or not displayed.
The appearance of text in the cells of the table is controlled by the text style
that is specified in the current cell style. You can use any text style in the
drawing or create a new one. The type of data you display in a row and the
formatting for that data type is controlled by the formatting options you select
in the Table Cell Format dialog box.
See also:
Work with Text Styles (page 540)
Add Text and Blocks to Tables
Table cell data can include text and multiple blocks.
When a table is created, the first cell is highlighted, and you can begin entering
text. The row height of the cell increases to accommodate the number of lines
of text. To move to the next cell, press Tab, or use the arrow keys to move
left, right, up, and down. You can quickly edit cell text by double-clicking in
a selected cell or start entering text to replace the current content of a cell.
When you insert a block into a table cell, either the block can be automatically
fit to the size of the cell, or the cell can adjust to accommodate the size of the
block.
Blocks can be inserted from the Table Cell visor. Multiple blocks can be inserted
in a table cell. If there is more than one block in a table cell, use the Manage
Cell Content dialog box to customize the way the cell content is displayed.
Inside the cell, the arrow keys move the cursor. Use the Table and Table Cell
visors, Properties Inspector, and shortcut menus to format text, import text,
or make other changes to the text in the cell.
See also:
Use Fields in Text (page 536)
Tables | 559

Create Multiline Text (page 520)
Use Formulas in Table Cells
Table cells can contain formulas that do calculations using the values in other
table cells.
With a table cell selected, you can insert formulas from the Table Cell visor.
You can also open the In-Place Text Editor and enter a formula in a table cell
manually.
Insert a Formula
In formulas, cells are referred to by their column letter and row number. For
example, the cell at top left in the table is A1. Merged cells use the number
of what would be the top-left cell. A range of cells is defined by the first and
last cells, with a colon between them. For example, the range A5:C10 includes
cells in rows 5 through 10 in columns A, B, and C.
A formula must start with an equal sign (=). The formulas for sum, average,
and count ignore empty cells and cells that do not resolve to a numeric value.
Other formulas display an error (#) if any cell in the arithmetic expression is
empty or contains nonnumeric data.
Use the Cell option to select a cell in another table in the same drawing. When
you have selected the cell, the In-Place Text Editor opens so you can enter the
rest of the formula.
Copy a Formula
When you copy a formula to another cell in the table, the range changes to
reflect the new location. For example, if the formula in A10 sums A1 through
A9, when you copy it to B10, the range of cells changes so that it sums B1
through B9.
If you don't want a cell address to change when you copy and paste the
formula, add a dollar sign ($) to the column or row part of the address. For
example, if you enter $A10, the column stays the same and the row changes.
If you enter $A$10, both column and row stay the same.
Insert Data Automatically
You can automatically increment data in adjacent cells within a table by using
the AutoFill grip. For example, a table with a date column can have the dates
560 | Chapter 9 Annotate Drawings

automatically entered by entering the first necessary date and dragging the
AutoFill grip.
Numbers will fill automatically by increments of 1 if one cell is selected and
dragged. Similarly, dates will resolve by increments of one day if only one cell
is selected. If two cells are manually filled with dates one week apart, the
remaining cells are incremented by one week.
See also:
Use Fields in Text (page 536)
Dimensions and Tolerances
You can add measurements to your drawing with several dimensioning
commands. Use dimension styles to format dimensions quickly and maintain
industry or project dimensioning standards.
Understand Basic Concepts of Dimensioning
You can create several types of dimensions, and you can control their
appearance by setting up dimension styles or by editing individual dimensions.
Overview of Dimensioning
Dimensioning is the process of adding measurement annotation to a drawing.
You can create dimensions for a variety of object types in many orientations.
The basic types of dimensioning are
■ Linear
■ Radial (radius, diameter and jogged)
■ Angular
■ Ordinate
■ Arc Length
Linear dimensions can be horizontal, vertical, aligned, rotated, baseline, or
continued (chained). Some examples are shown in the illustration.
Dimensions and Tolerances | 561
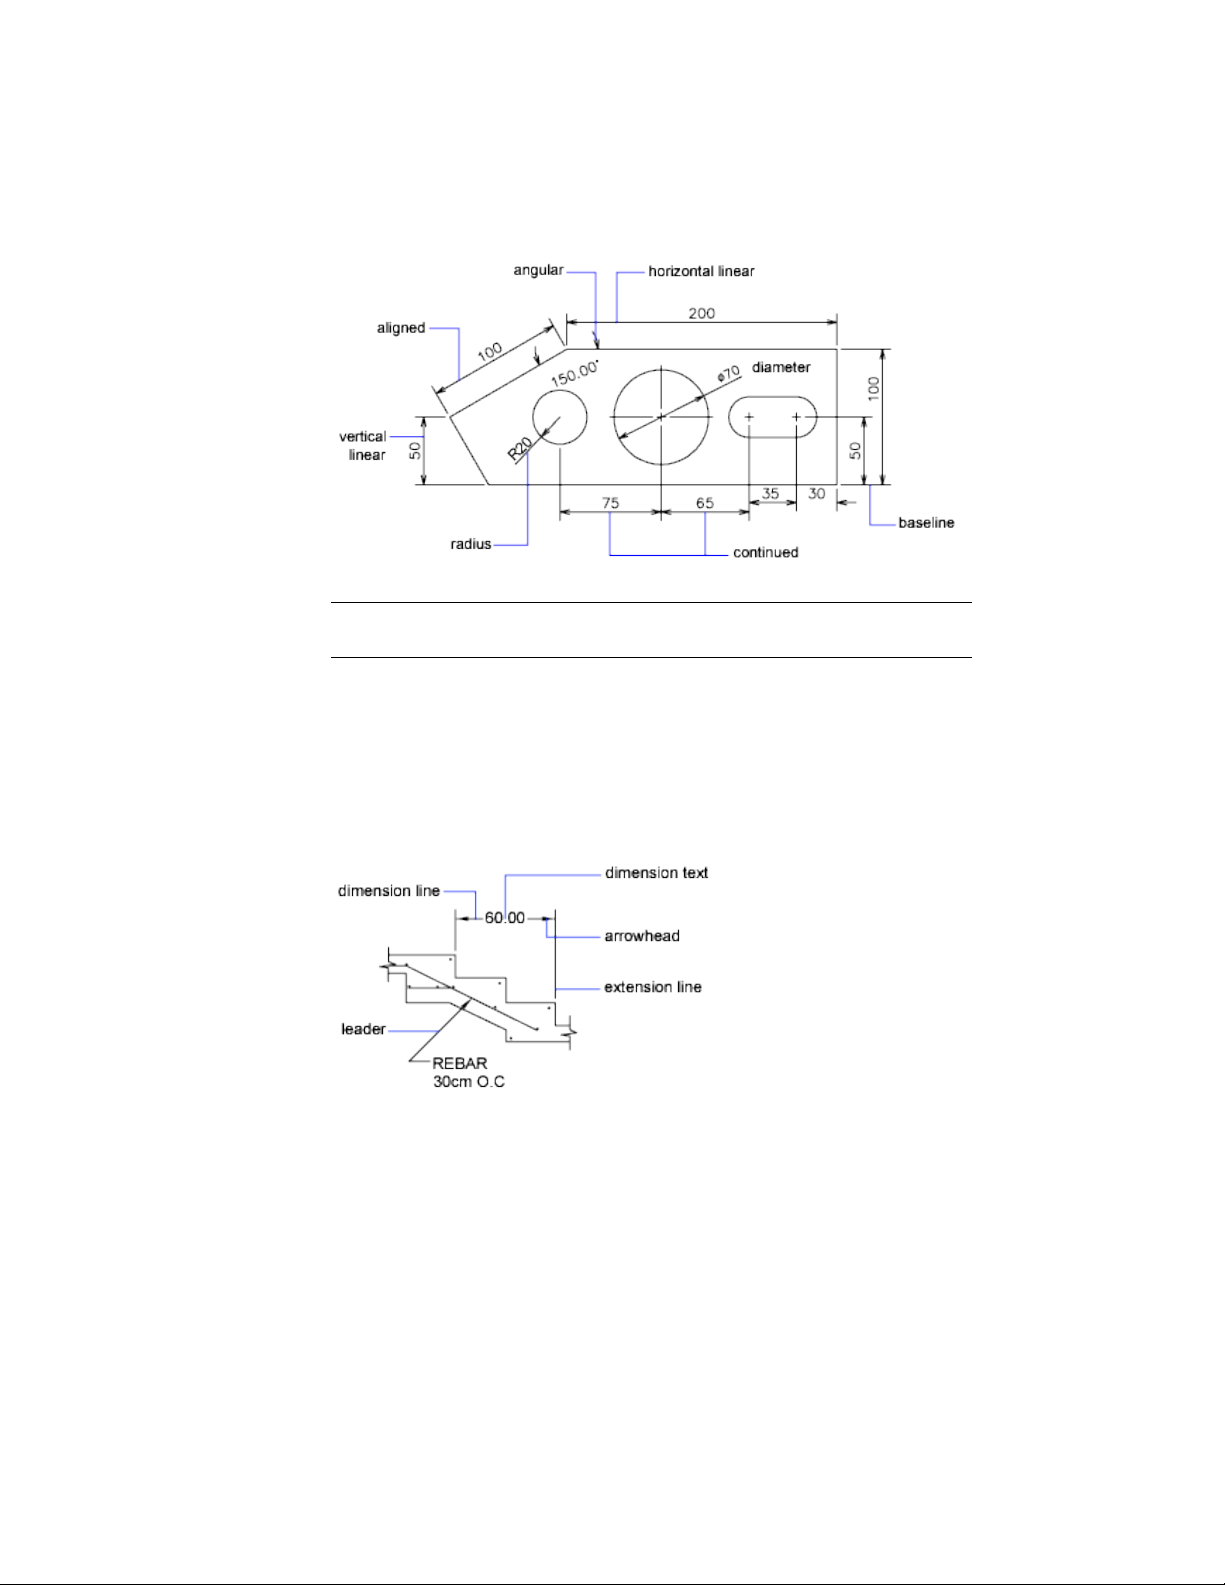
NOTE To simplify drawing organization and dimension scaling, it is recommended
that you create dimensions on layouts rather than in model space.
Parts of a Dimension
Here is a list of the parts of a dimension along with their descriptions.
Dimensions have several distinct elements: dimension text, dimension lines,
arrowheads, and extension lines.
Dimension text is a text string that usually indicates the measurement value.
The text can also include prefixes, suffixes, and tolerances.
A dimension line indicates the direction and extent of a dimension. For angular
dimensions, the dimension line is an arc.
562 | Chapter 9 Annotate Drawings
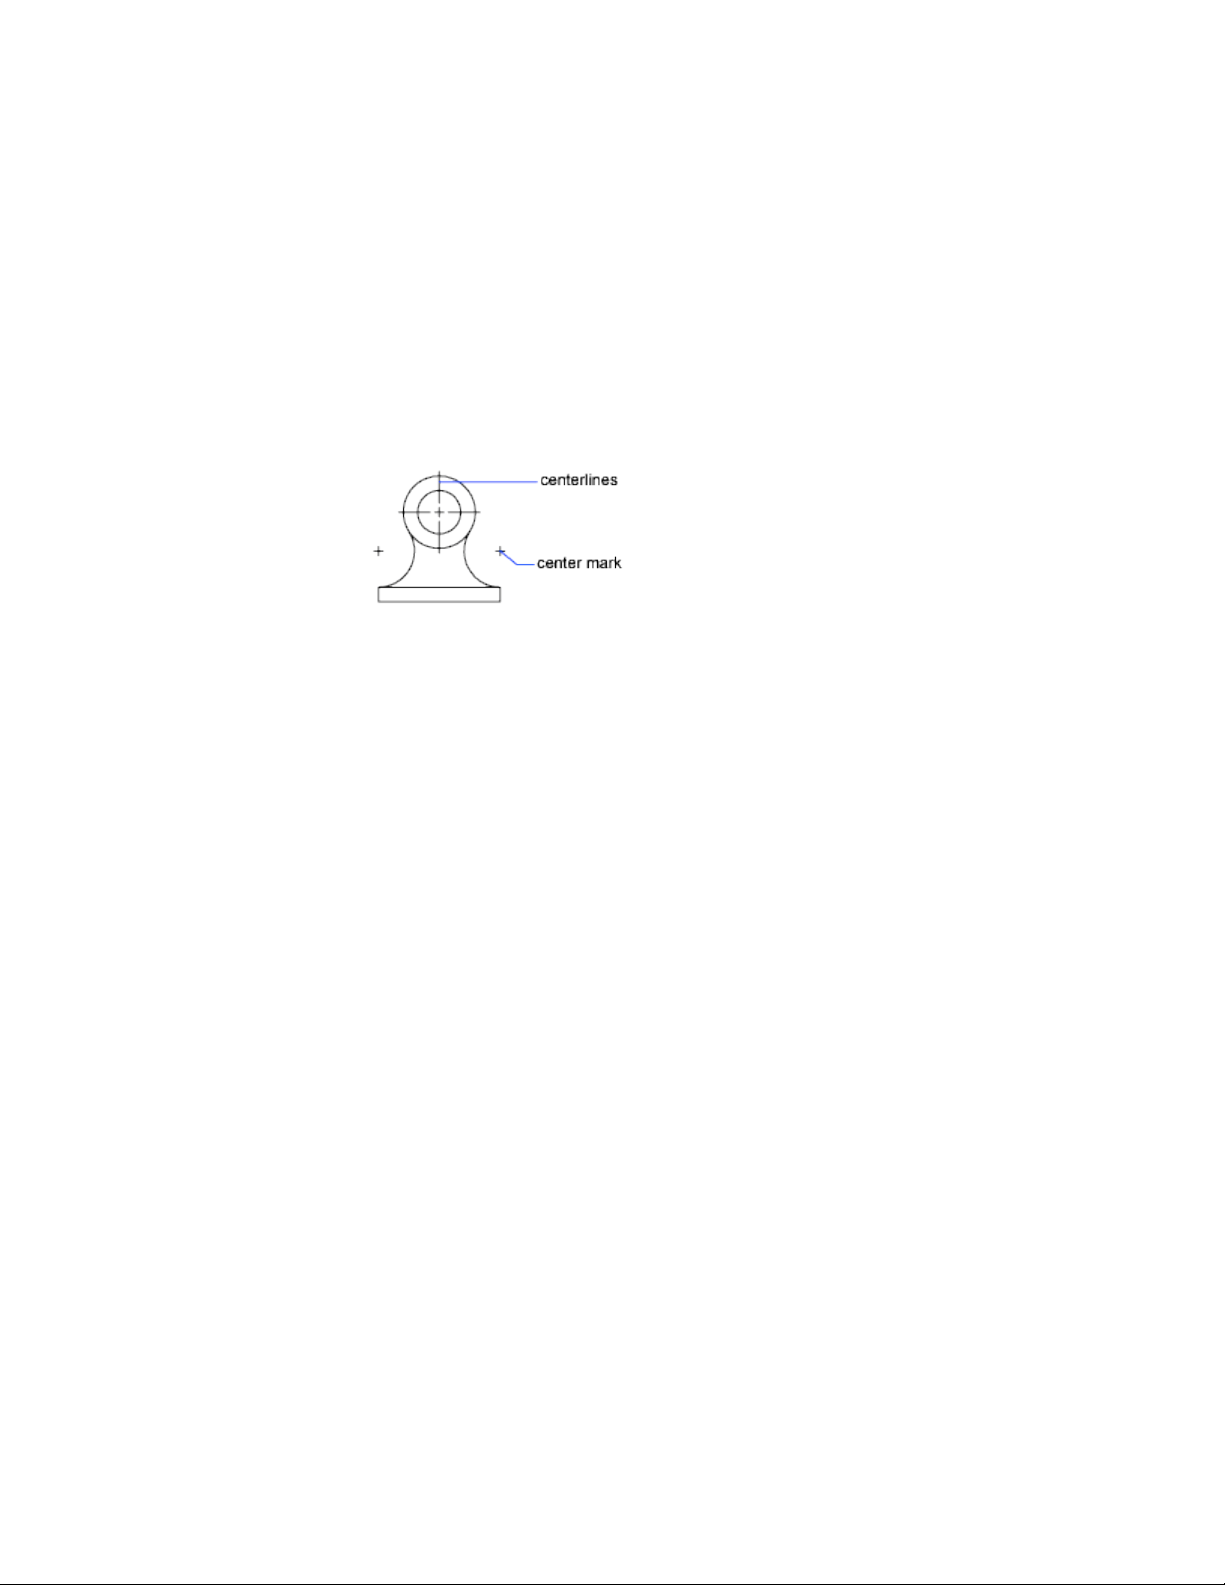
Arrowheads, also called symbols of termination, are displayed at each end of
the dimension line. You can specify different sizes and shapes for arrowheads
or tick marks.
Extension lines, also called projection lines or witness lines, extend from the
feature to the dimension line.
A center mark is a small cross that marks the center of a circle or arc.
Centerlines are broken lines that mark the center of a circle or arc.
Associative Dimensions
Dimensions can be associative, nonassociative, or exploded. Associative
dimensions adjust to changes in the geometric objects that they measure.
Dimension associativity defines the relationship between geometric objects
and the dimensions that give their distance and angles. There are three types
of associativity between geometric objects and dimensions.
■ Associative dimensions. Automatically adjust their locations,
orientations, and measurement values when the geometric objects
associated with them are modified. Dimensions in a layout may be
associated to objects in model space. The DIMASSOC system variable is
set to 2.
■ Non-associative dimensions. Selected and modified with the geometry
they measure. Non-associative dimensions do not change when the
geometric objects they measure are modified. The dimension variable
DIMASSOC is set to 1.
■ Exploded dimensions. Contain a collection of separate objects rather
than a single dimension object. The DIMASSOC system variable is set to
0.
You can determine whether a dimension is associative or non-associative by
selecting the dimension and doing one of the following:
■ Use the Properties Inspector to display the properties of the dimension.
Dimensions and Tolerances | 563

■ Use the LIST command to display the properties of the dimension.
A dimension is considered associative even if only one end of the dimension
is associated with a geometric object. The DIMREASSOCIATE command displays
the associative and non-associative elements of a dimension.
Special Situations and Limitations
You may need to use DIMREGEN to update associative dimensions after
panning or zooming, after opening a drawing that was modified with an earlier
release, or after opening a drawing with external references that have been
modified.
Although associative dimensions support most object types that you would
expect to dimension, they do not support the following:
■ Hatches
■ Multiline objects
■ 2D solids
■ Objects with nonzero thickness
■ Images
■ PDF underlays
When selecting objects to dimension, make sure that the objects that you
select do not include a directly overlapping object that does not support
associative dimensioning such as a 2D solid.
Associativity is not maintained between a dimension and a block reference if
the block is redefined.
Associativity might not maintained between a dimension and a 3D solid if
the shape of the 3D solid is modified.
Dimensions created with QDIM are not associative but may be associated
individually with DIMREASSOCIATE.
For information about working with associative dimensions in combination
with previous releases, see Save Drawings to Previous Drawing File Formats
(page 699).
See also:
Change Dimension Associativity (page 600)
Save Drawings to Previous Drawing File Formats (page 699)
564 | Chapter 9 Annotate Drawings

Use Dimension Styles
You can control the appearance of dimensions by changing settings. For
convenience and to help maintain dimensioning standards, you can store
these settings in dimension styles.
Overview of Dimension Styles
A dimension style is a named collection of dimension settings that controls
the appearance of dimensions, such as arrowhead style, text location, and
lateral tolerances.
You create dimension styles to specify the format of dimensions quickly, and
to ensure that dimensions conform to industry or project standards.
■ When you create a dimension, it uses the settings of the current dimension
style
■ If you change a setting in a dimension style, all dimensions in a drawing
that use the style update automatically
■ You can create dimension substyles that, for specified types of dimensions,
deviate from the current dimension style
■ If necessary, you can override a dimension style temporarily
Compare Dimension Styles and Variables
You can view all the settings in a dimension style. Dimension styles used in
externally referenced drawings are differentiated from those defined in your
current drawing.
You can list the dimension styles in the current drawing. You can also list all
dimensioning system variables and their current status or only the variables
affected by a dimension style.
When you list the current status of all dimensioning system variables, any
running overrides that apply to the current dimension style are listed. You
can also list the differences between a named dimension style and the current
dimension style.
Dimensions and Tolerances | 565
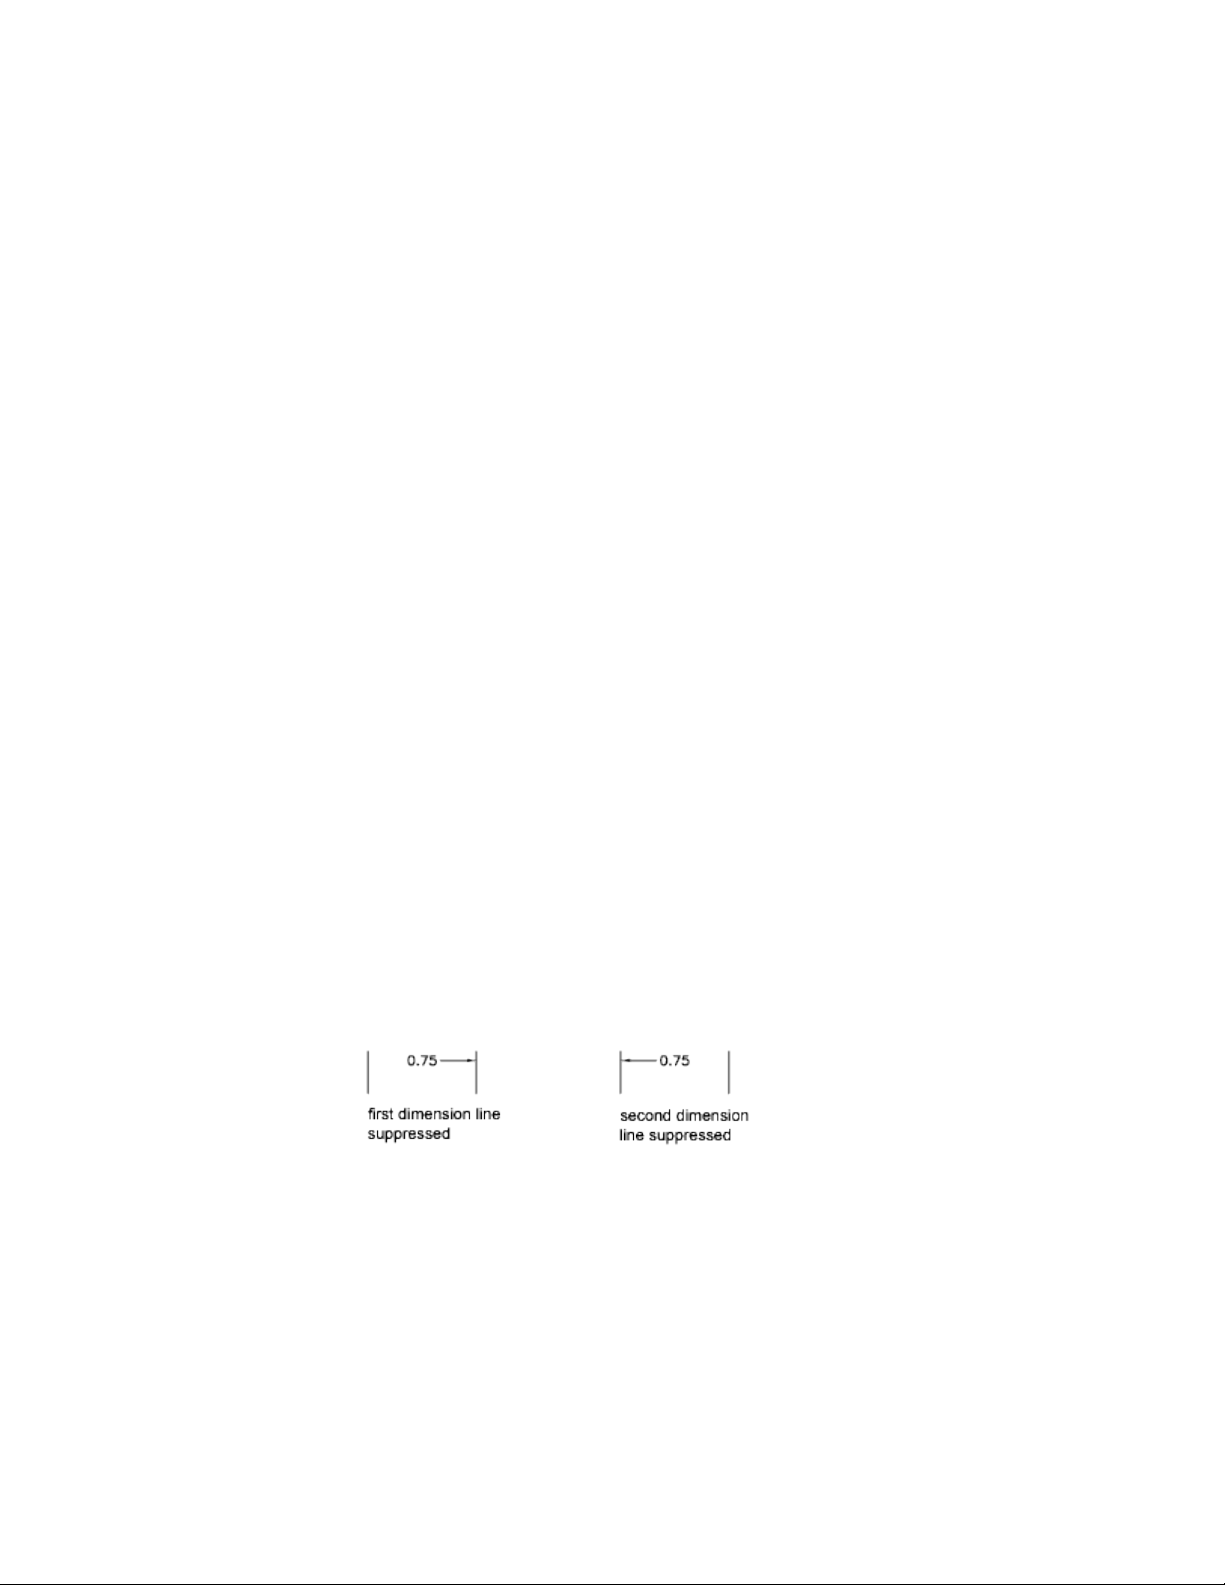
Use Externally Referenced Dimension Styles
The program displays externally referenced dimension style names using the
same syntax as for other externally dependent named objects. When you view
externally referenced dimension styles using the Dimension Style Manager,
the name of the xref displays in the Styles list as Xref:”drawing name” with
each xref style appearing below the drawing name.
For example, if the drawing file baseplat.dwg has a dimension style called
FRACTIONAL-1, and you attach baseplat.dwg as an xref to a new drawing, then
the xref dimension style is displayed in the Styles list of the Dimension Style
Manager as Xref:”baseplat.dwg”, and FRACTIONAL-1 appears under the drawing
name.
Externally referenced dimension styles can be examined, but they cannot be
modified or made current. You can use an externally referenced dimension
style as a template for creating a new dimension style in your current drawing.
Control Dimension Geometry
You can control the appearance of dimension lines, extension lines,
arrowheads, and center marks.
Control Dimension Lines
You can control dimension line properties including color, lineweight, and
spacing.
You can control several aspects of a dimension line. You can
■ Specify color and lineweight for visual effect and printing
■ Suppress the dimension line or, if the dimension line is broken by text,
one or both halves
■ Control the spacing between successive dimension lines in baseline
dimensions
566 | Chapter 9 Annotate Drawings
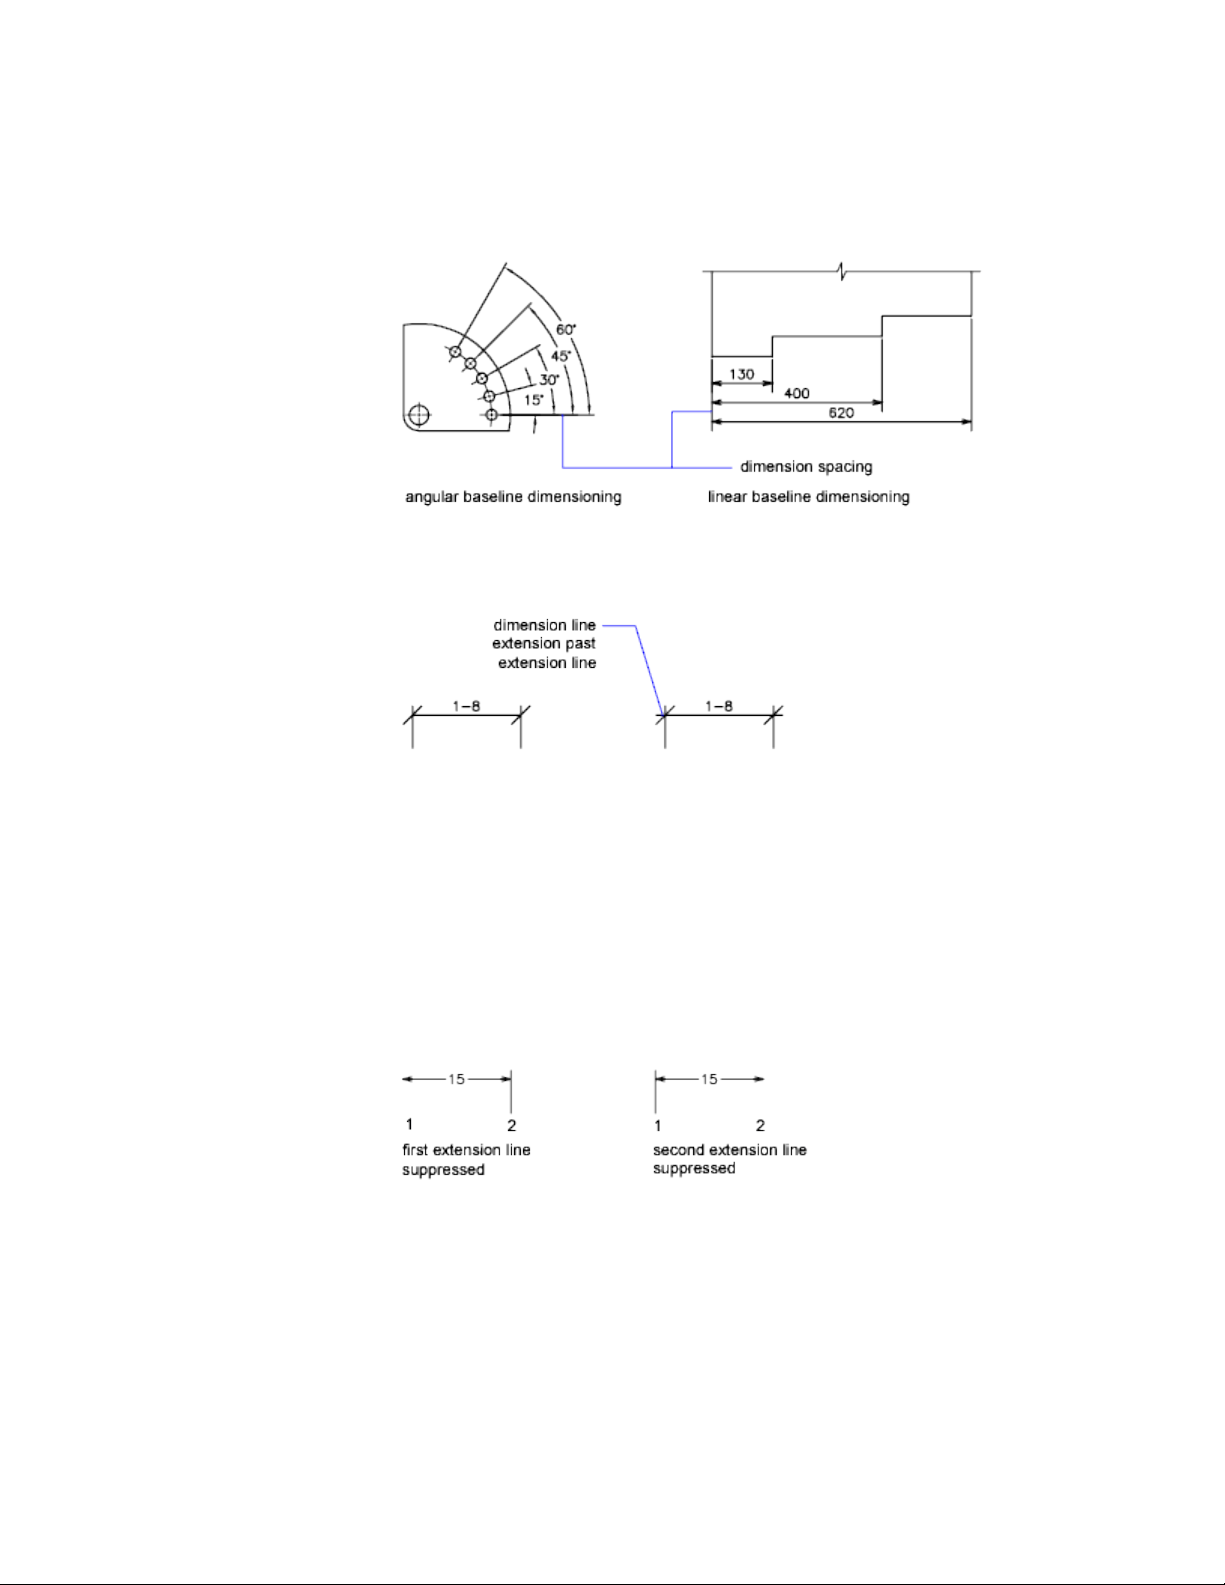
■ Control the distance by which the dimension line extends beyond the
extension lines for architectural tick (oblique stroke) arrowheads
Control Extension Lines
You can control extension line properties including color, lineweight,
overshoot, and offset length.
You can
■ Specify color and lineweight for visual effect and printing
■ Suppress one or both extension lines if they are unnecessary, or if there is
not enough space
■ Specify how far beyond from the dimension line the extension line extends
(overshoot)
Dimensions and Tolerances | 567
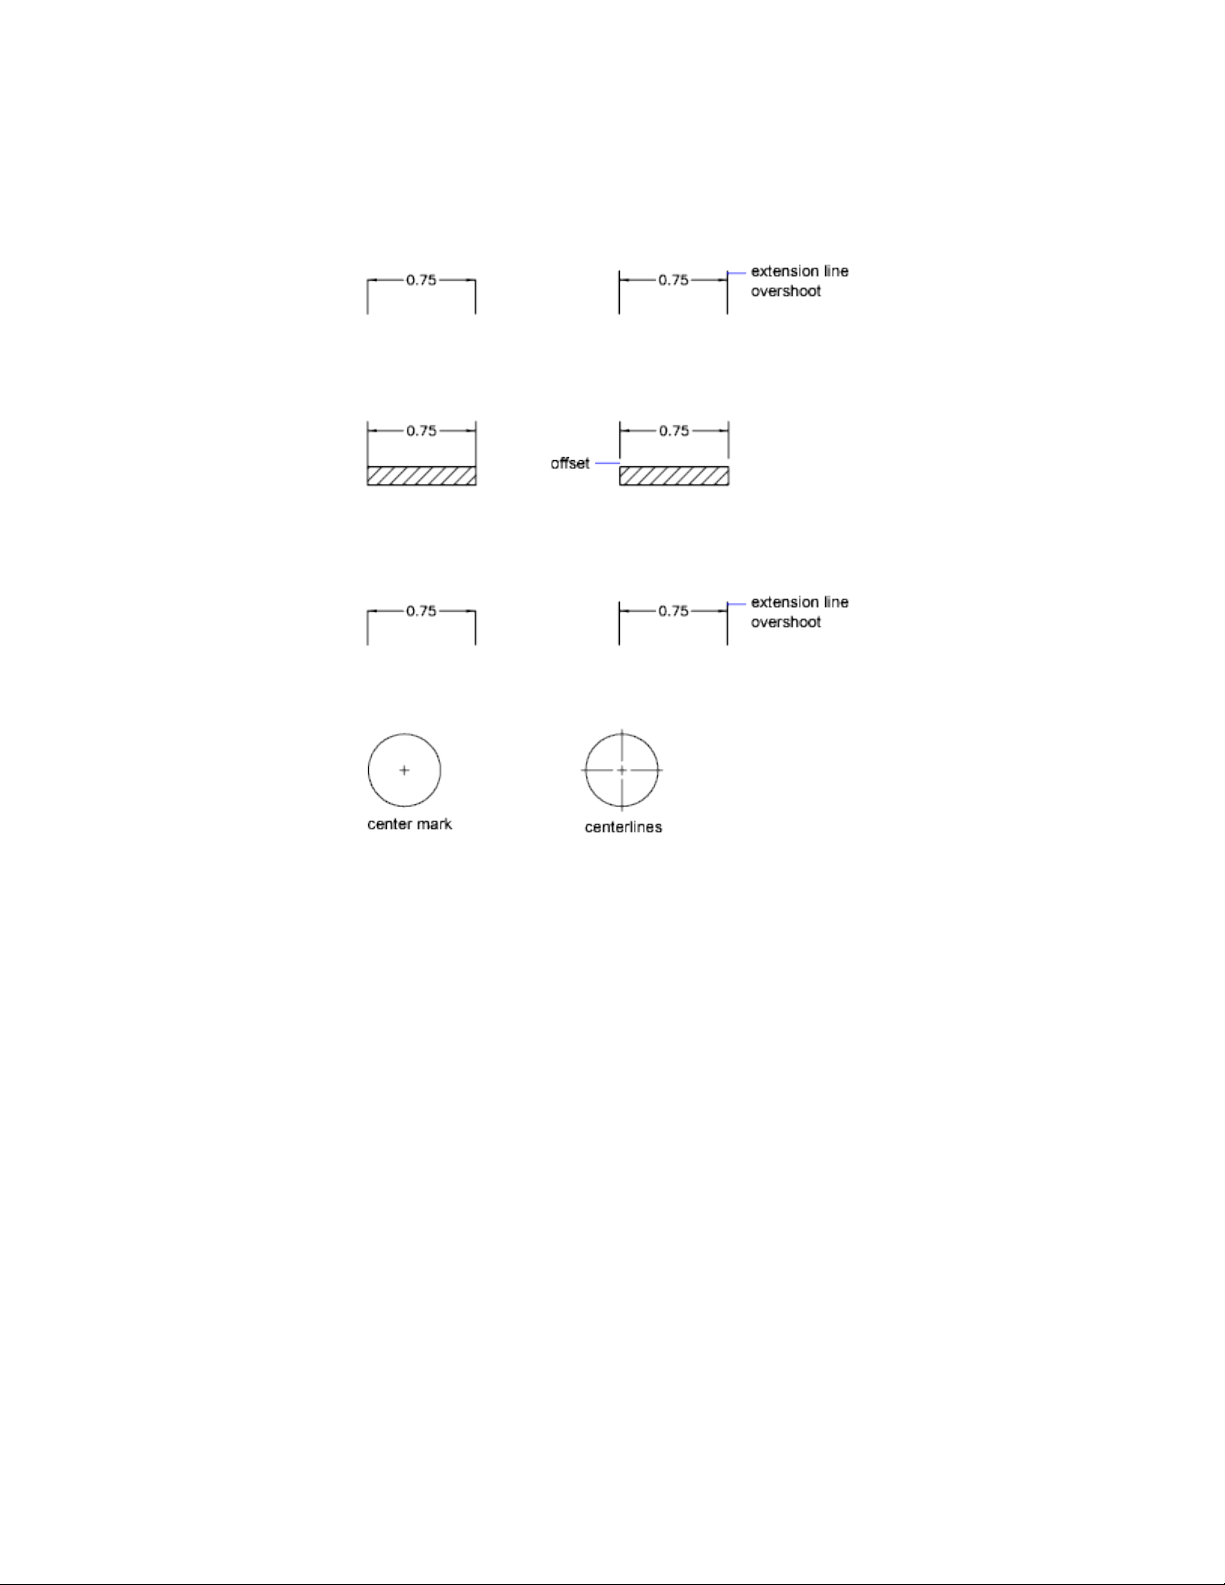
■ Control the extension origin offset, the distance between the extension
line origin, and the start of the extension line
■ Specify a fixed length for extension lines, as measured from the dimension
line toward the extension line origin
■ Specify a noncontinuous linetype, typically used for centerlines
■ Modify the angle of the extension lines of a selected dimension to make
them oblique
568 | Chapter 9 Annotate Drawings
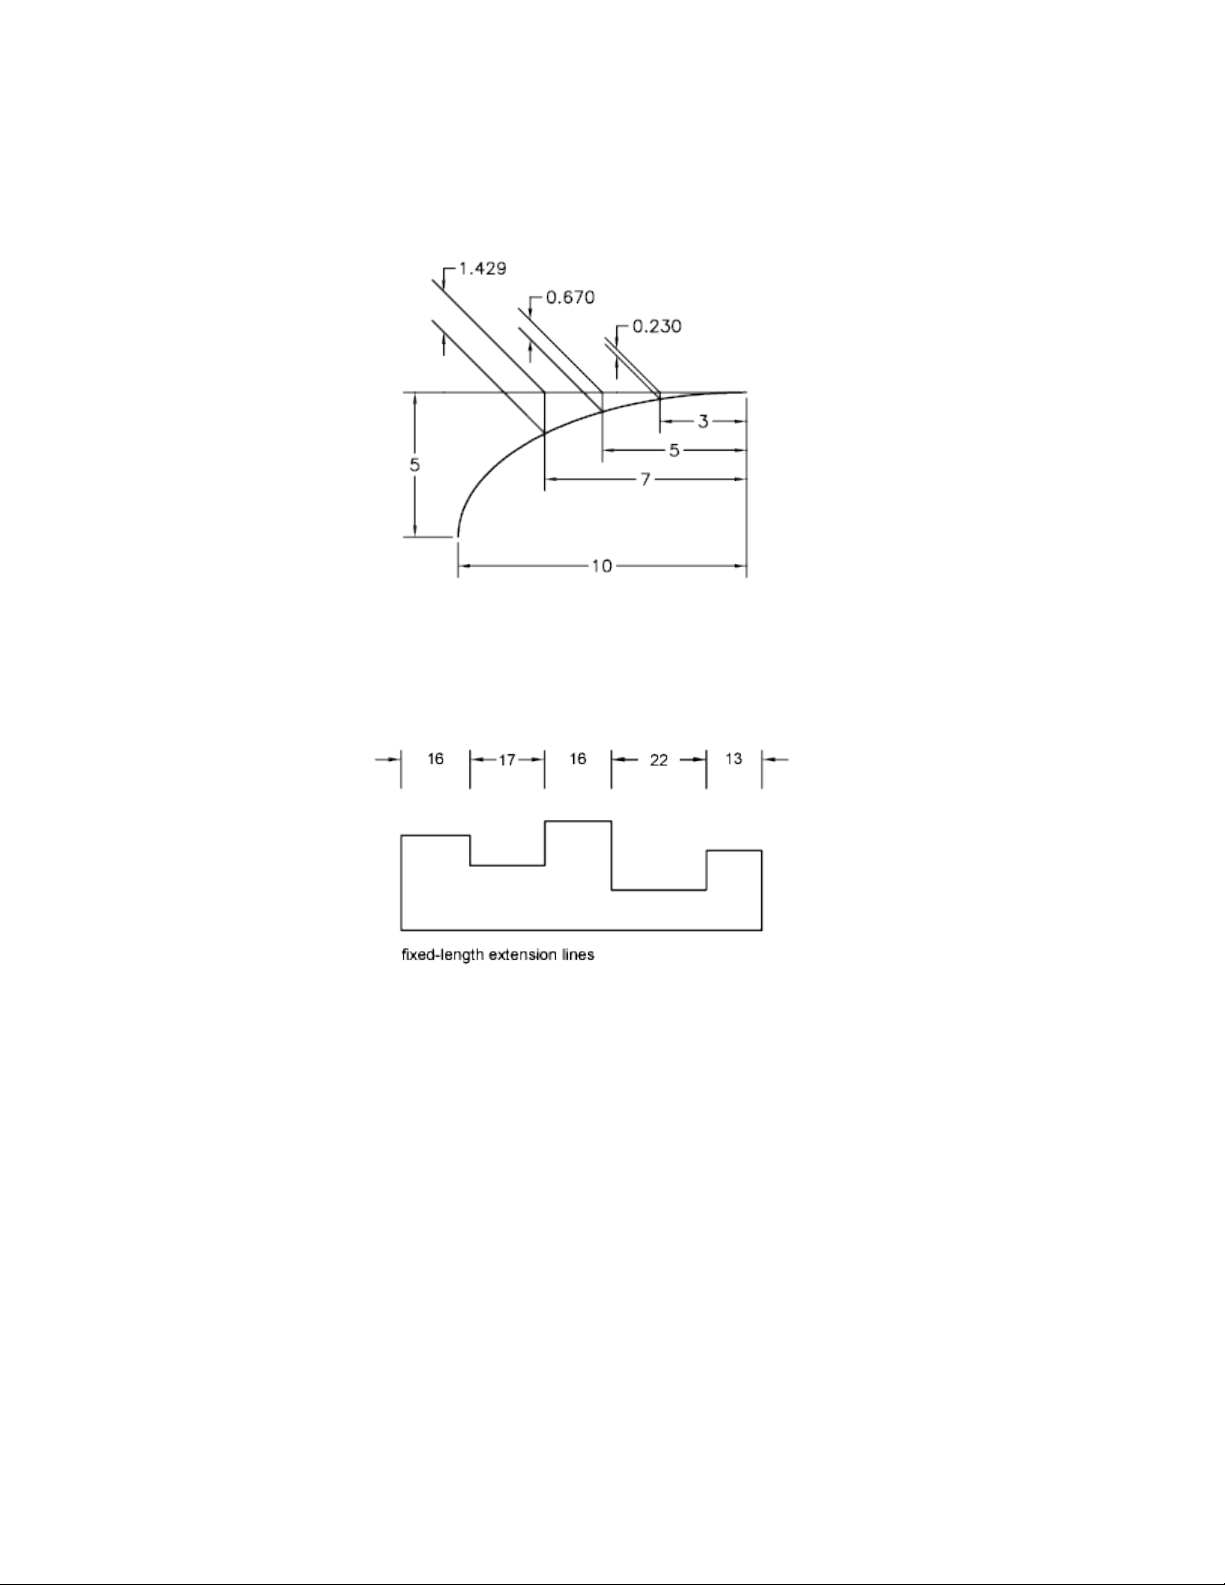
Fixed-Length Extension Lines
You can specify a dimension style that sets the total length for extension lines
starting from the dimension line toward the dimension origin point.
The extension line offset distance from the origin will never be less than the
value specified by the DIMEXO system variable.
See also:
Create Dimensions with Oblique Extension Lines (page 587)
Dimensions and Tolerances | 569

Control Dimension Arrowheads
You can control the arrowhead symbols in dimensions and leaders including
their type, size, and visibility.
You can choose from many standard types of arrowheads, or you can create
your own arrowheads. Additionally, you can
■ Suppress the display of arrowheads, or use one arrowhead only
■ Apply a different type of arrowhead to each end of a dimension line
■ Control the size of arrowheads
■ Flip the direction of an arrowhead using the dimension shortcut menu
NOTE Flipped arrowheads maintain their appearance in versions later than
AutoCAD 2002. However, if you edit a drawing with flipped arrowheads in a
release earlier than AutoCAD 2006, the arrowhead directions will revert to their
original orientations.
See also:
Customize Arrowheads (page 570)
Customize Arrowheads
You can create your own custom arrowheads.
Arrowheads are stored as block definitions. To use your own arrowhead,
provide the name of an existing block definition. For information about
creating blocks, see Create Blocks Within a Drawing (page 317).
NOTE Annotative blocks cannot be used as custom arrowheads for dimensions or
leaders.
Arrowhead sizing relies on the overall dimension scale factor. When you create
a dimension, the block is inserted where the arrowheads would normally go.
The object's X and Y scale factors are set to arrowhead size overall scale. The
dimension line is trimmed by text gap x overall scale units at each end. To trim
the dimension line, the rightmost block is inserted with a zero rotation angle
for horizontal dimensioning. The leftmost block is rotated 180 degrees about
its insertion point.
570 | Chapter 9 Annotate Drawings

NOTE The insertion point a block is defined with affects its placement as a custom
arrowhead on a dimension or leader. For information on changing the insertion
point of a block, see Create Drawing Files for Use as Blocks (page 318).
If you use paper-space scaling, the scale factor is computed before applying it
to the arrowhead size value.
See also:
Create Blocks Within a Drawing (page 317)
Create Drawing Files for Use as Blocks (page 318)
Control Dimension Text
You can control the placement of dimension text, arrowheads, and leader
lines relative to the dimension and extension lines.
Fit Dimension Text Within Extension Lines
Dimension text and arrowheads usually appear between the extension lines
when there is enough space. You can specify how these elements are placed
when space is limited.
Many factors, such as the size of extension line spacing and arrowhead size,
influence how dimension text and arrowheads fit within the extension lines.
In general, the best fit, given the available space, is applied. If possible, both
text and arrowheads are accommodated between the extension lines, no matter
what fit option you choose.
When creating new dimensions, you can choose to place text by entering a
coordinate or using the pointing device; this is known as user-defined text
placement. Alternatively, the program can compute the text position for you.
The options for automatic fitting of text and arrowheads are listed in the
Modify/New Dimension Style dialog box, Fit tab.
For example, you can specify that text and arrowheads be kept together. In
this case, if there is not room for both between the extension lines, they are
both placed outside. You can specify that if there is room for only text or
arrowheads, then either text only or arrowheads only are placed between the
extension lines.
Dimensions and Tolerances | 571
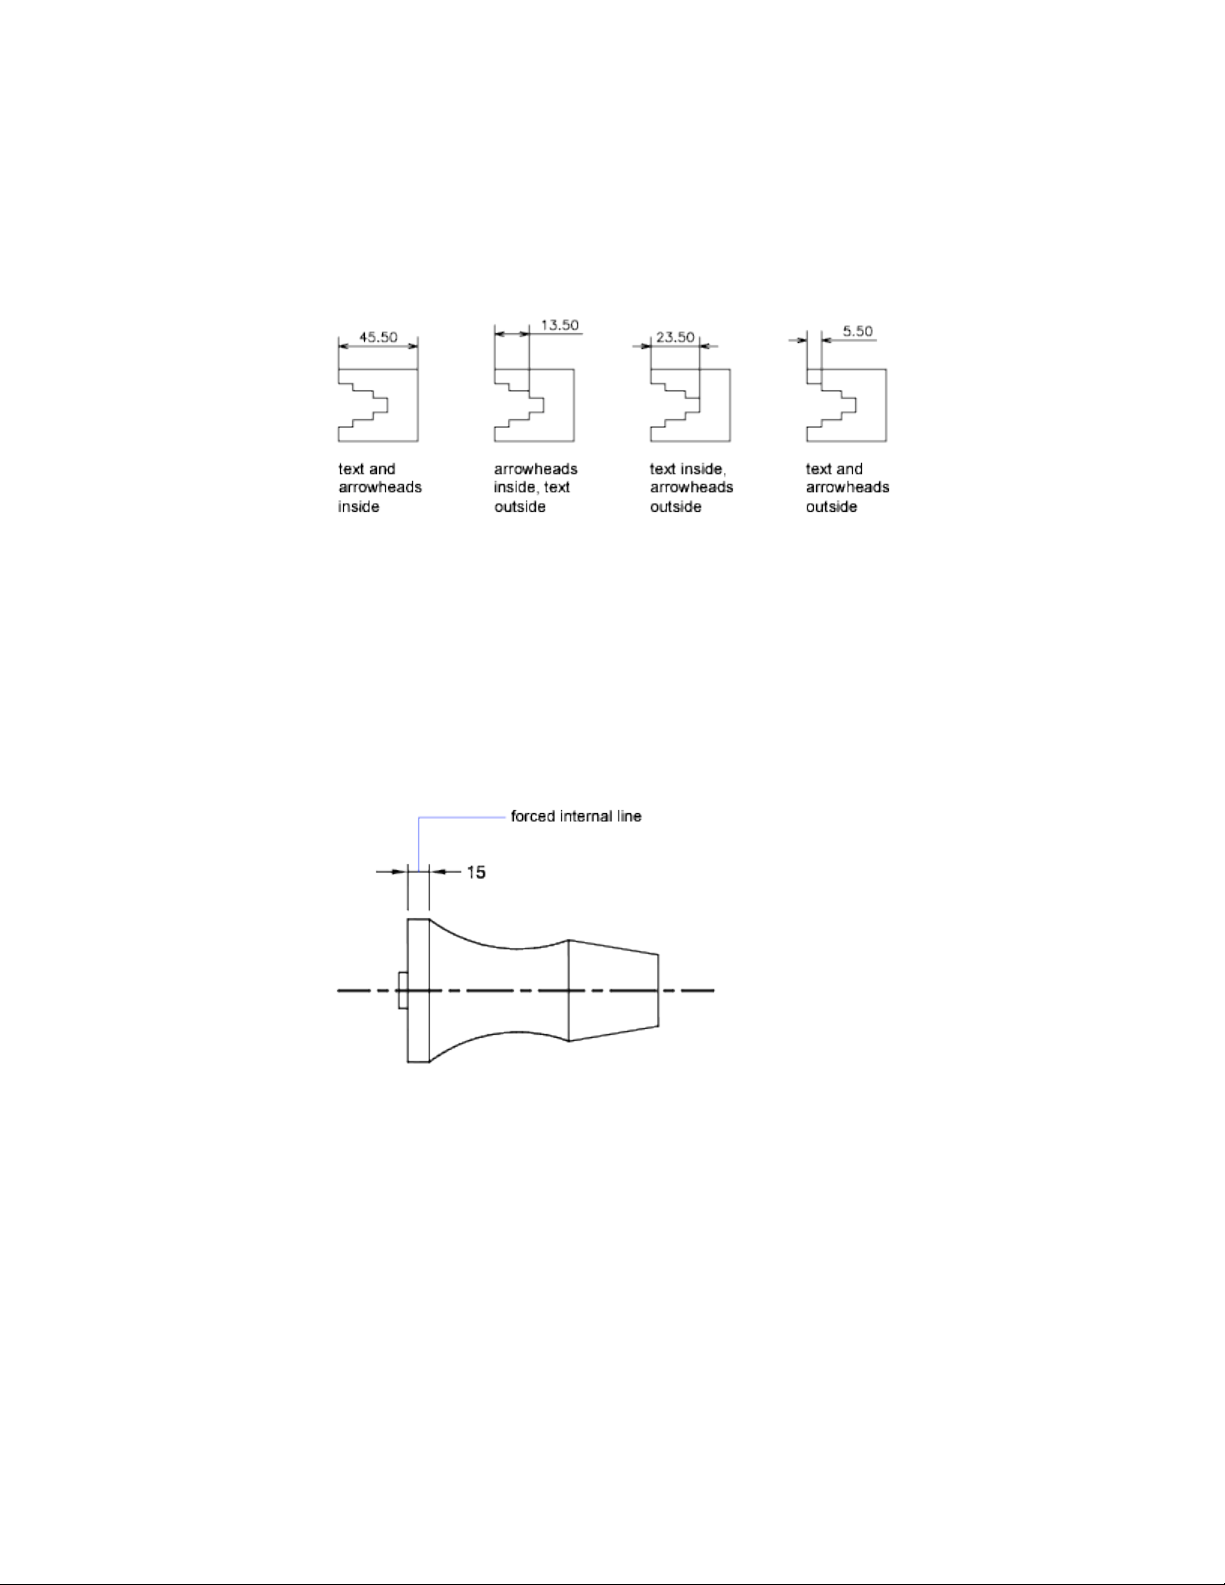
The following illustrations show how the program applies a "best fit" for
arrowheads and text.
If there is no room for text between the extension lines, you can have a leader
line created automatically. This is useful in cases where text outside the
extension lines would interfere with other geometry, for example, in continued
dimensions. Whether text is drawn to the right or the left of the leader is
controlled by the horizontal justification setting in the Modify/New Dimension
Style dialog box, Text tab. Also, you can fit text and arrowheads by changing
their size.
Even if the arrowheads are outside the extension lines, you can have a line
drawn between the extension lines. This is called forcing an internal line and
is illustrated as follows.
Fit Diameter Dimension Text
You can draw several different diameter dimensions depending on text
placement, horizontal settings on the Modify/New Dimension Style dialog
box, Text tab, and whether you select the Draw Dim Line Between Ext Lines
option on the Modify/New Dimension Style dialog box, Fit tab.
572 | Chapter 9 Annotate Drawings
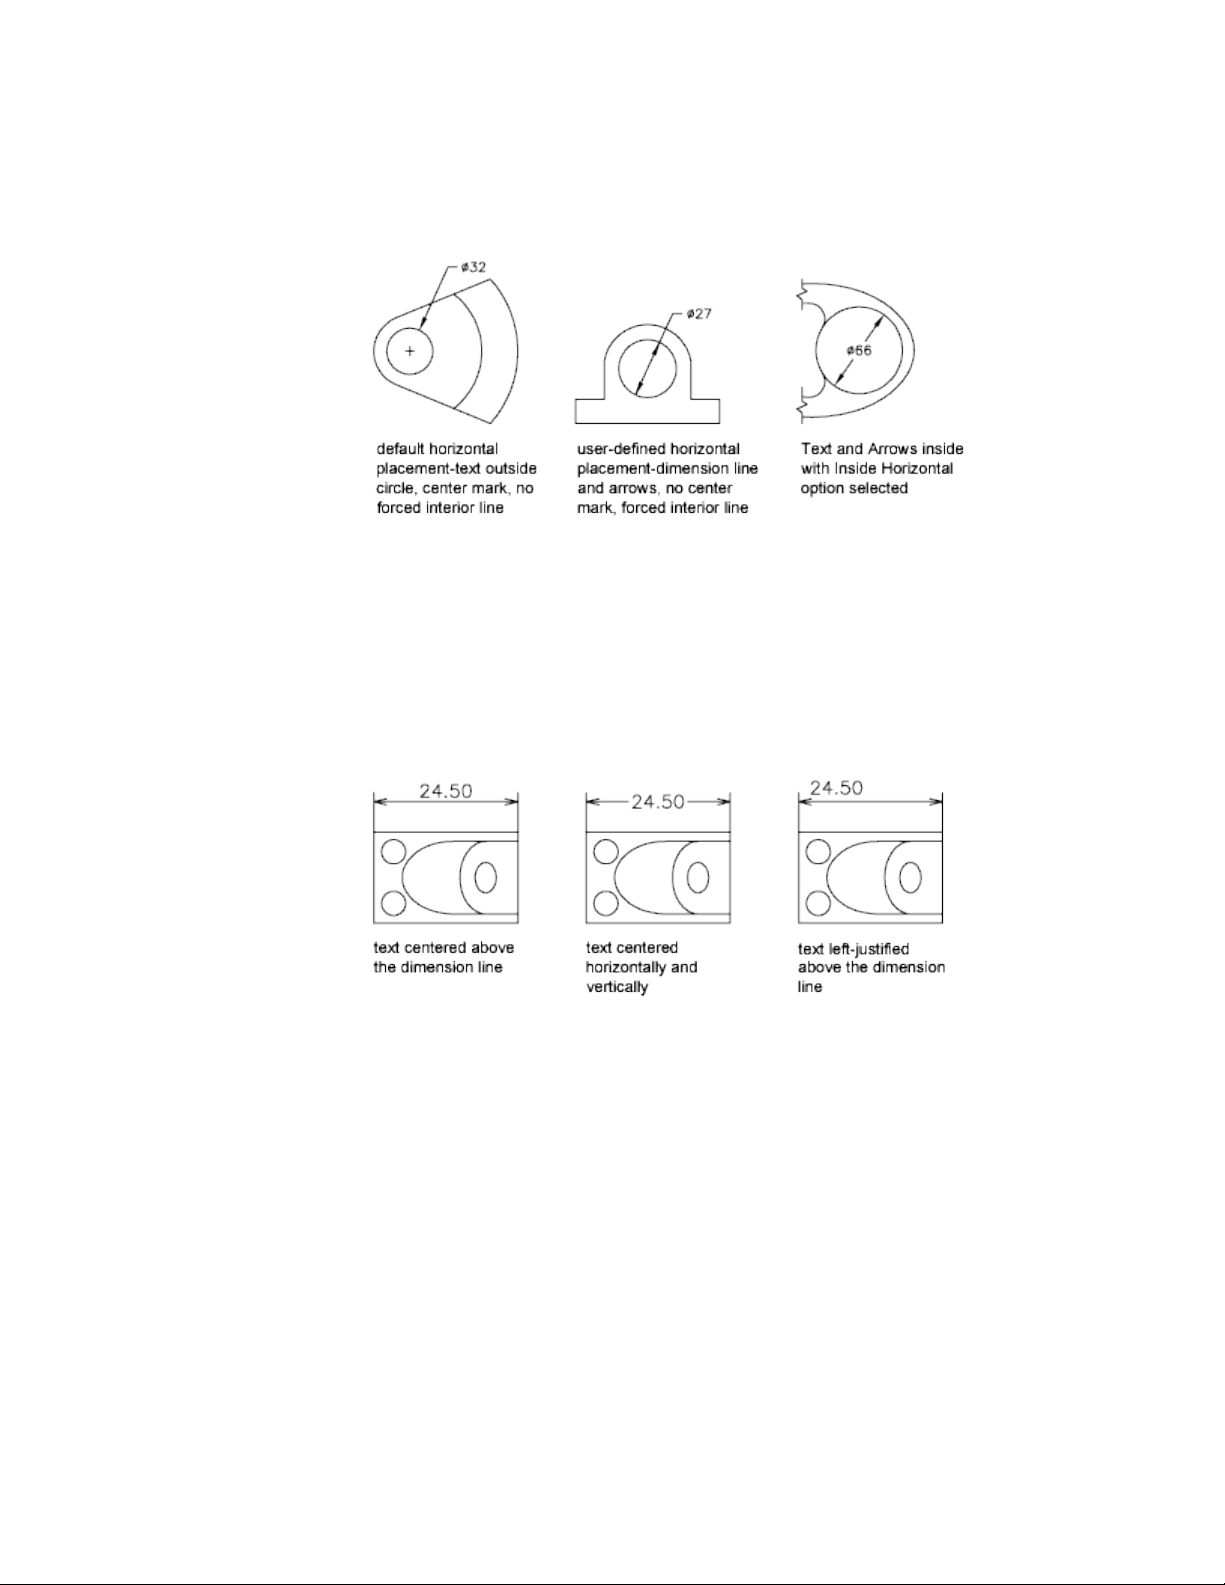
Control the Location of Dimension Text
You can locate dimension text manually and specify its alignment and
orientation.
The program comes with several justification settings that facilitate compliance
with international standards, or you can choose your own location for the
text.
Many of the settings are interdependent. Example images in the Dimension
Style Manager are updated dynamically to illustrate how text appears as you
change the settings.
Align Dimension Text
Whether text is inside or outside the extension lines, you can choose whether
it is aligned with the dimension line or remains horizontal. The following
examples show two combinations of these options.
Dimensions and Tolerances | 573
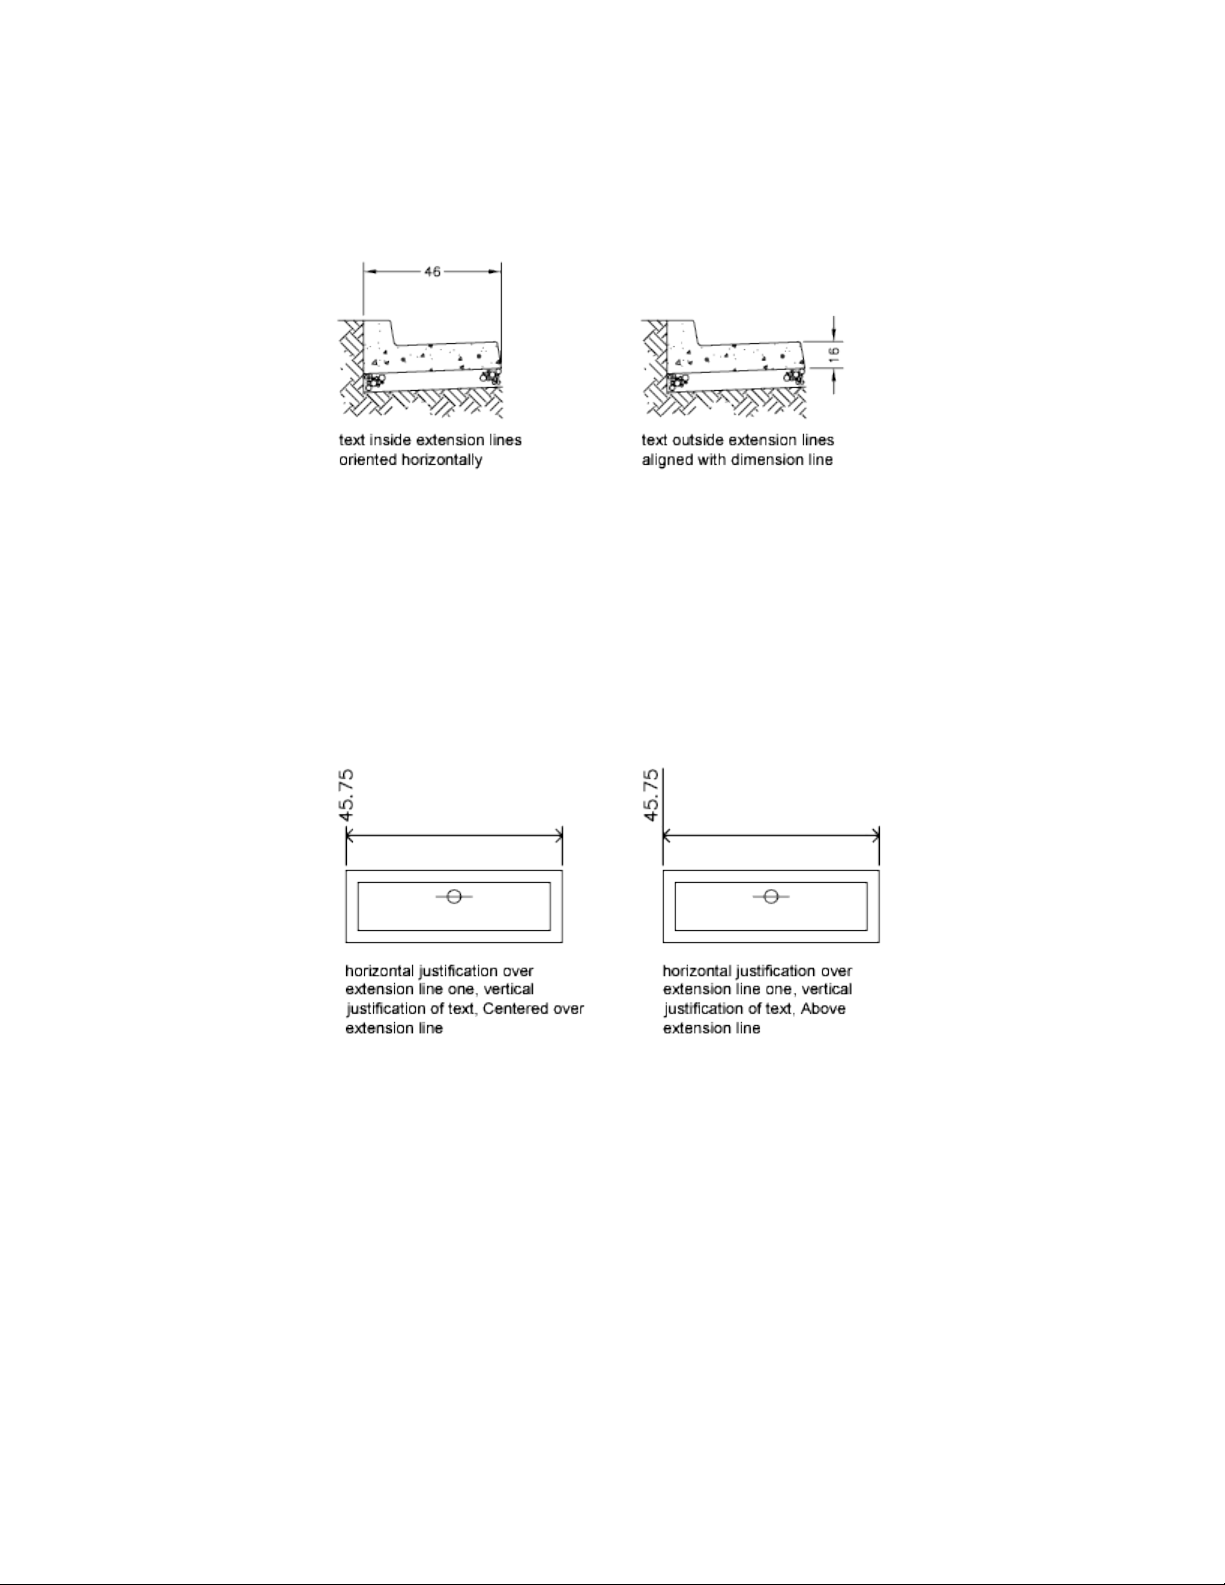
The default alignment is horizontal dimension text, even for vertical
dimensions.
Position Dimension Text Horizontally
The position of the text along the dimension line in relation to the extension
lines is referred to as text placement. To place text yourself when you create
a dimension, use the Place Text Manually option on the Modify/New
Dimension Style dialog box, Fit tab. Use the text placement options to
automatically place text at the center of the dimension line, at either extension
line, or over either extension line.
First and second extension lines are defined by the order in which you specified
the extension line origins when you created the dimension. For angular
dimensions, the second extension line is counterclockwise from the first. In
the following illustrations, 1 is the first extension line origin and 2 the second.
574 | Chapter 9 Annotate Drawings
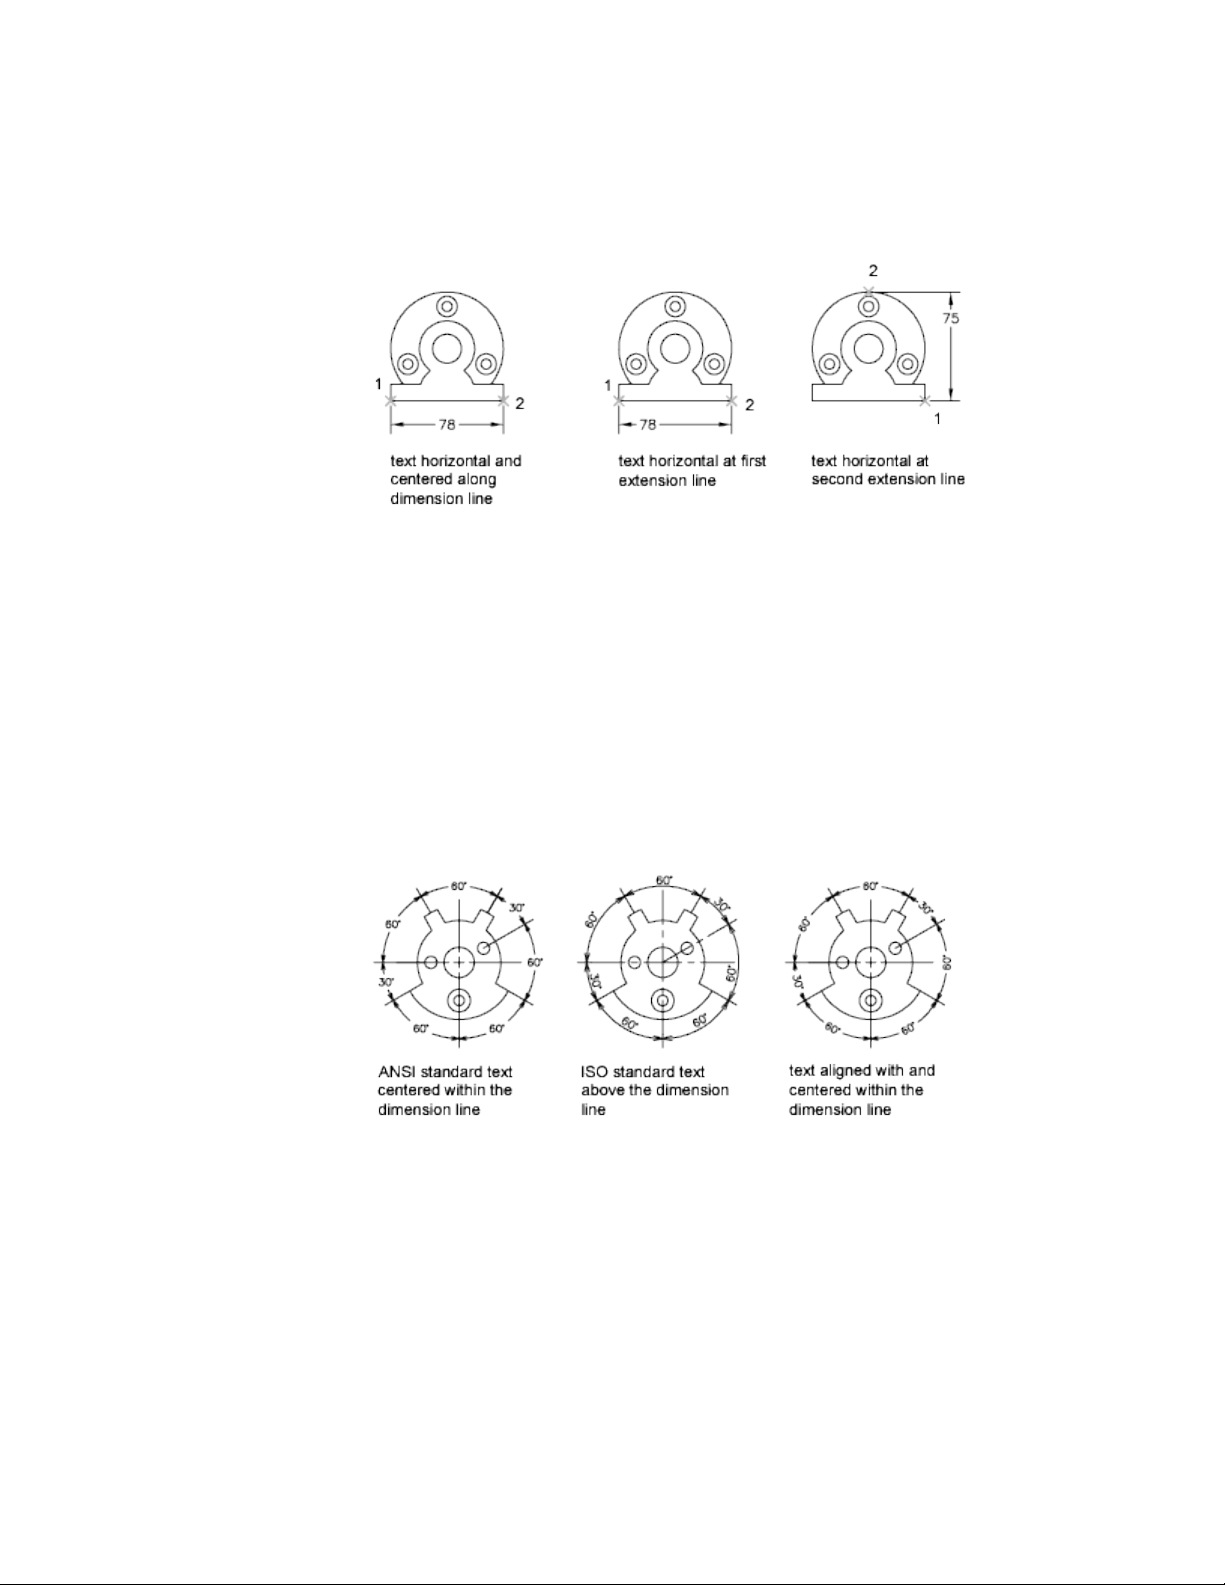
If you place text manually, you can place the dimension text anywhere along
the dimension line, inside or outside the extension lines, as you create the
dimension. This option provides flexibility and is especially useful when space
is limited. However, the horizontal alignment options provide better accuracy
and consistency between dimensions.
Position Dimension Text Vertically
The position of the text relative to the dimension line is referred to as vertical
text placement. Text can be placed above or below or centered within the
dimension line. In the ANSI standards, centered text usually splits the
dimension line. In the ISO standards, it is usually above or outside the
dimension line. For example, ISO standards permit angular dimension text
to appear in any of the ways shown.
Other settings, such as Text Alignment, affect the vertical alignment of text.
For example, if Horizontal Alignment is selected, text inside the extension
lines and centered within the dimension line is horizontal, as shown in the
leftmost illustration above. The text is horizontal even if the dimension line
is not itself horizontal.
Dimensions and Tolerances | 575

Control the Appearance of Dimension Text
You can include prefixes, suffixes, and user-supplied text in dimensions. You
can also control the text style and formatting used in dimension text.
The program supports a mixture of user-supplied text, prefixes and suffixes
supplied by the dimension style, and generated measurements. For example,
you could add a diameter symbol as a prefix to a measurement or add the
abbreviation for a unit, such as mm, as a suffix. Text in this context refers to
all dimension text, prefixes and suffixes, primary and alternate units, and
lateral tolerances. Geometric tolerances are controlled independently.
Dimension text is treated as a single string of text, which you create and format
using your text editor.
Control the Text Style in Dimensions
The appearance of dimension text is governed by the text style selected in the
Modify/New Dimension Style dialog box, Text tab. You can choose a text style
while creating a dimension style and specify a text color and a height
independent of the current text style's height setting. You can also specify the
gap between base dimension text and the box that surrounds it.
The text styles used for dimensions are the same text styles used by all text
created in your drawing.
For more information, see Work with Text Styles (page 540).
Supply User Text to Dimensions
In addition to the prefixes and suffixes specified for primary and alternate
units, you can supply your own text as you create a dimension. Because the
prefix, suffix, and user-supplied text form a single text string, you can represent
tolerance stacks and apply changes to font, text size, and other characteristics
using the text editor.
To add user text above and below the dimension line, use the separator symbol
\X. Text that precedes this symbol is aligned with and above the dimension
line. Text that follows the \X symbol is aligned with and below the dimension
line. The space between the dimension line and the text is determined by the
value you enter in Offset from Dim Lim on the Modify/New Dimension Style
dialog box, Text tab.
576 | Chapter 9 Annotate Drawings
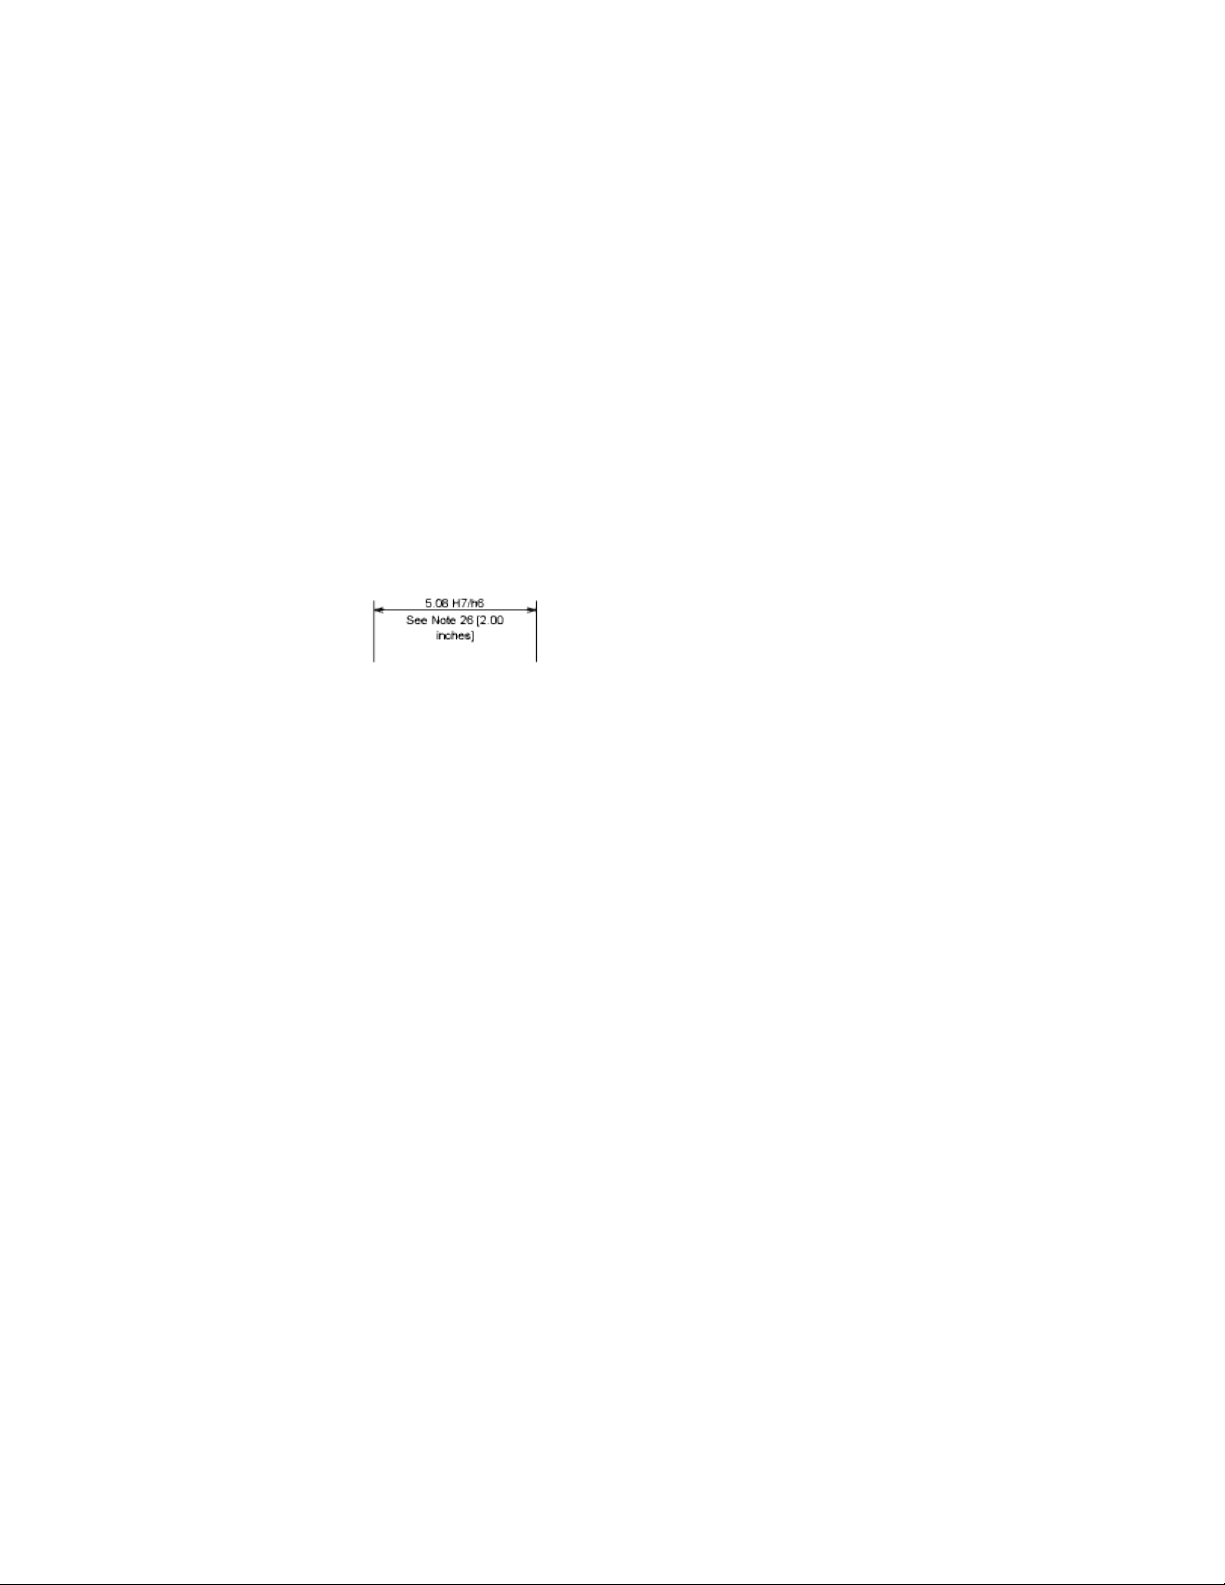
Example: User Text in Dimensions
In this example, the primary dimension measurement is 5.08, and the alternate
dimension measurement is 2.00. The primary units have the suffix H7/h6,
and the alternate units have the suffix inches.
At the text prompt, while creating the dimension, you enter the following
format string:
<> H7/h6\XSee Note 26\P[ ]
The angle brackets represent the primary units, and the square brackets
represent the alternate units. The \X separates text above the dimension line
from text below the dimension line. The \P is a paragraph break.
The resulting text appears as follows:
Control Dimension Values
The numeric values displayed in dimensions can appear in several formats.
You can also control how numeric distances are represented.
Control the Display of Dimension Units
The numeric values of dimensions can be displayed as a single measurement
or in two measurement systems. In either case, you can control details of how
the numeric values are presented.
The settings for primary units control the display of the dimension values,
including the unit format, the numeric precision, and the decimal separator
style. For example, you can enter the diameter symbol as a prefix, as shown
in the illustration. Any prefix you specify replaces the prefixes normally used
for diameter and radius dimensions (unicode 2205 and R, respectively).
Dimensions and Tolerances | 577
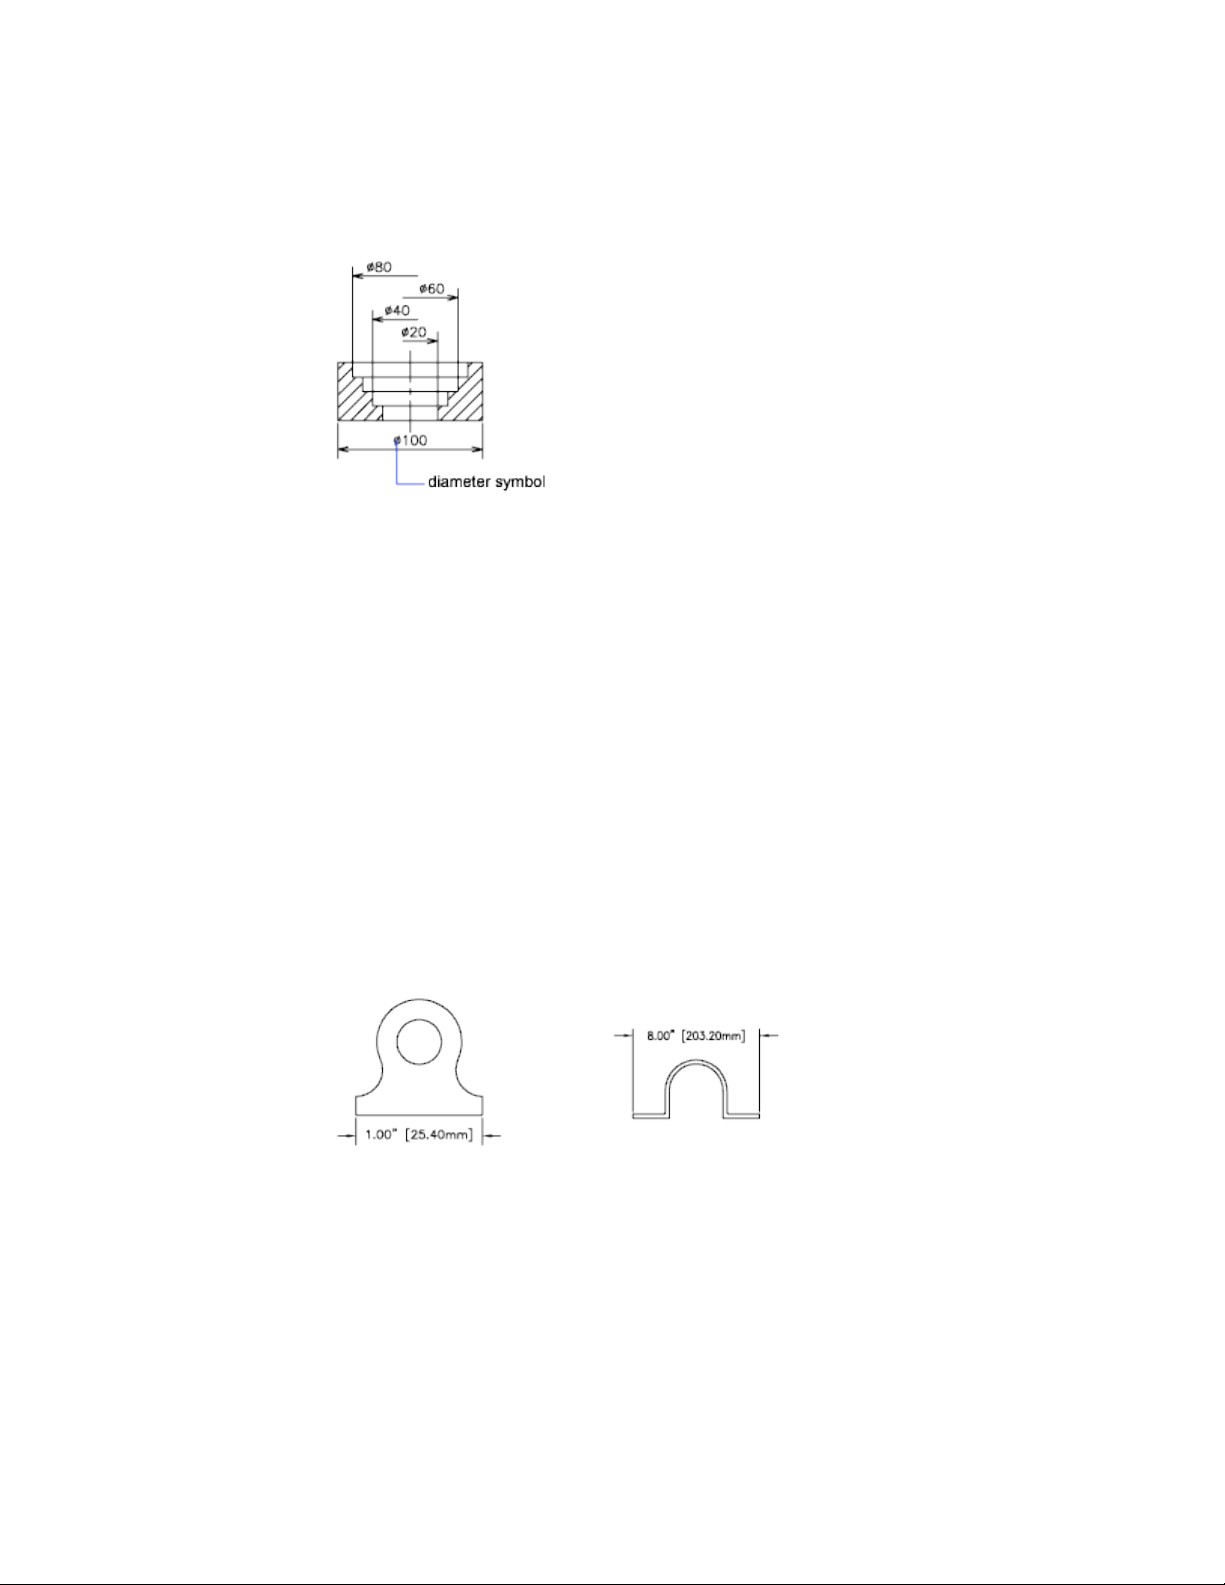
These settings are available on the Modify/New Dimension Style dialog box,
Primary Units tab.
Control the Display of Alternate Units
You can create dimensions in two systems of measurement simultaneously.
A common use of this feature is to add feet and inches dimensions to drawings
created using metric units. The alternate units appear in square brackets ([ ])
in the dimension text. Alternate units cannot be applied to angular dimensions.
If alternate-units dimensioning is on when you edit a linear dimension, the
measurement is multiplied by an alternate scale value that you specify. This
value represents the number of alternate units per current unit of measurement.
The default value for imperial units is 25.4, which is the number of millimeters
per inch. The default value for metric units is about 0.0394, which is the
number of inches per millimeter. The number of decimal places is specified
by the precision value for alternate units.
For example, for imperial units, if the alternate scale setting is the default
value, 25.4, and the alternate precision is 0.00, the dimension might look like
the following figure.
578 | Chapter 9 Annotate Drawings
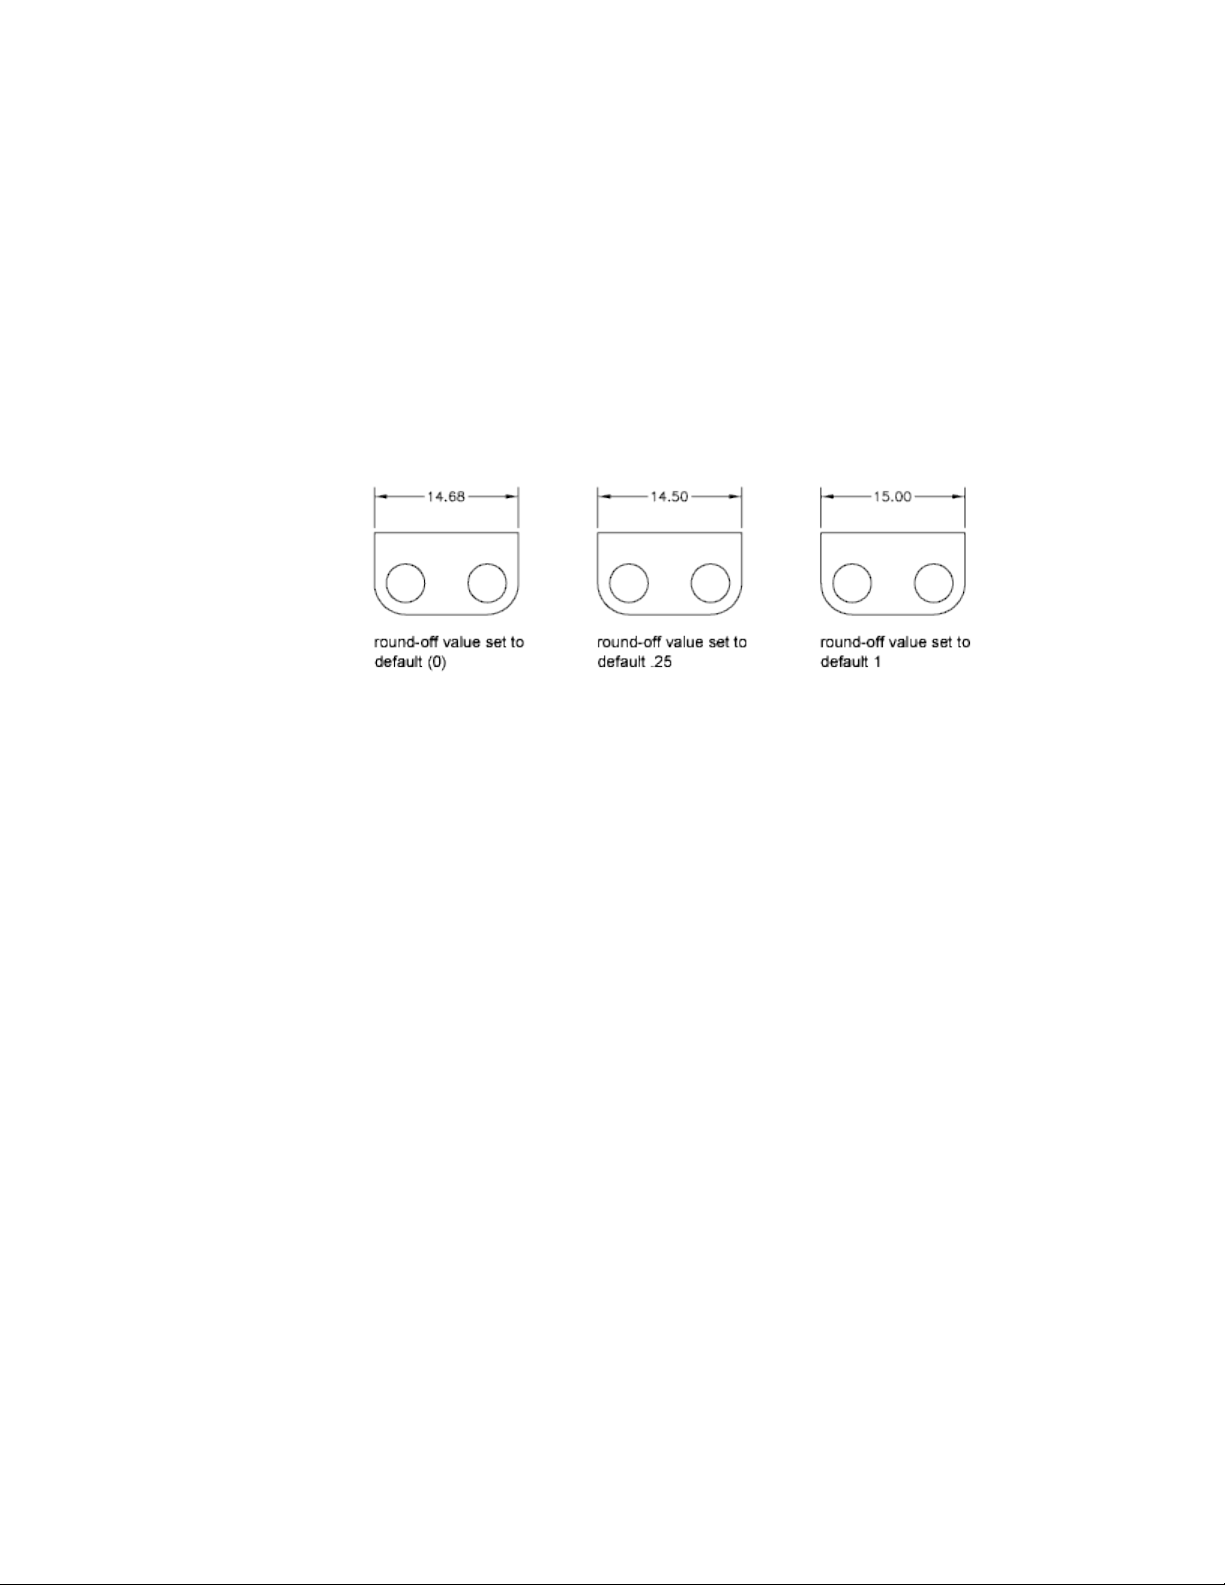
Round Off Dimension Values
You can round off the numeric values in dimensions and lateral tolerances.
You can round off all dimension values except those for angular dimensions.
For example, if you specify a round-off value of 0.25, all distances are rounded
to the nearest 0.25 unit. The number of digits displayed after the decimal
point depends on the precision set for primary and alternate units and lateral
tolerance values.
Suppress Zeros in Dimensions
You can suppress leading and trailing zeros in the numeric portion of
dimension text. You can also specify the sub unit for the dimension distance.
If you suppress leading zeros in decimal dimensions, 0.500 becomes .500. If
you suppress trailing zeros, 0.500 becomes 0.5. You can suppress both leading
and trailing zeros so that 0.5000 becomes .5 and 0.0000 becomes 0.
For dimension distances less than one unit, you can set the dimension distance
to display in sub units. If the distance is shown in m, you can set to display
distances less than one m in cm or mm.
The table shows the effect of selecting each option and provides examples of
the architectural units style. If feet are included with a fractional inch, the
Dimensions and Tolerances | 579
number of inches is indicated as zero, no matter which option you select.
Thus, the dimension 4'-3/4" becomes 4'-0 3/4".
Zero suppression for feet and inches
ExamplesEffectOption
1'-0
3/4"
1'-0"0'-6"0'-0 1/2"Includes zero feet and zero
inches
No options
selected
1'-0
3/4"
1'0'-6"0'-0 1/2"Suppresses zero inches
(includes zero feet)
0 Inches selec-
ted
1'-0
3/4"
1'-0"6"1/2"Suppresses zero feet (in-
cludes zero inches)
0 Feet selec-
ted
1'-0
3/4"
1'6"1/2"Suppresses zero feet and
zero inches
0 Feet and 0
Inches selec-
ted
Display Lateral Tolerances
Lateral tolerances are values indicating the amount a measured distance can
vary. You can control whether lateral tolerances are displayed and you can
choose from several styles of lateral tolerances.
A lateral tolerance specifies the amount by which a dimension can vary. By
specifying tolerances in manufacturing, you can control the degree of accuracy
needed for a feature. A feature is some aspect of a part, such as a point, line,
axis, or surface.
You can apply tolerances directly to a dimension by appending the tolerances
to the dimension text. These dimension tolerances indicate the largest and
smallest permissible size of the dimension. You can also apply geometric
tolerances, which indicate deviations of form, profile, orientation, location,
and runout.
Lateral tolerances can be specified from theoretically exact measurements.
These are called basic dimensions and have a box drawn around them.
If the dimension value can vary in both directions, the plus and minus values
you supply are appended to the dimension value as deviation tolerances. If
580 | Chapter 9 Annotate Drawings
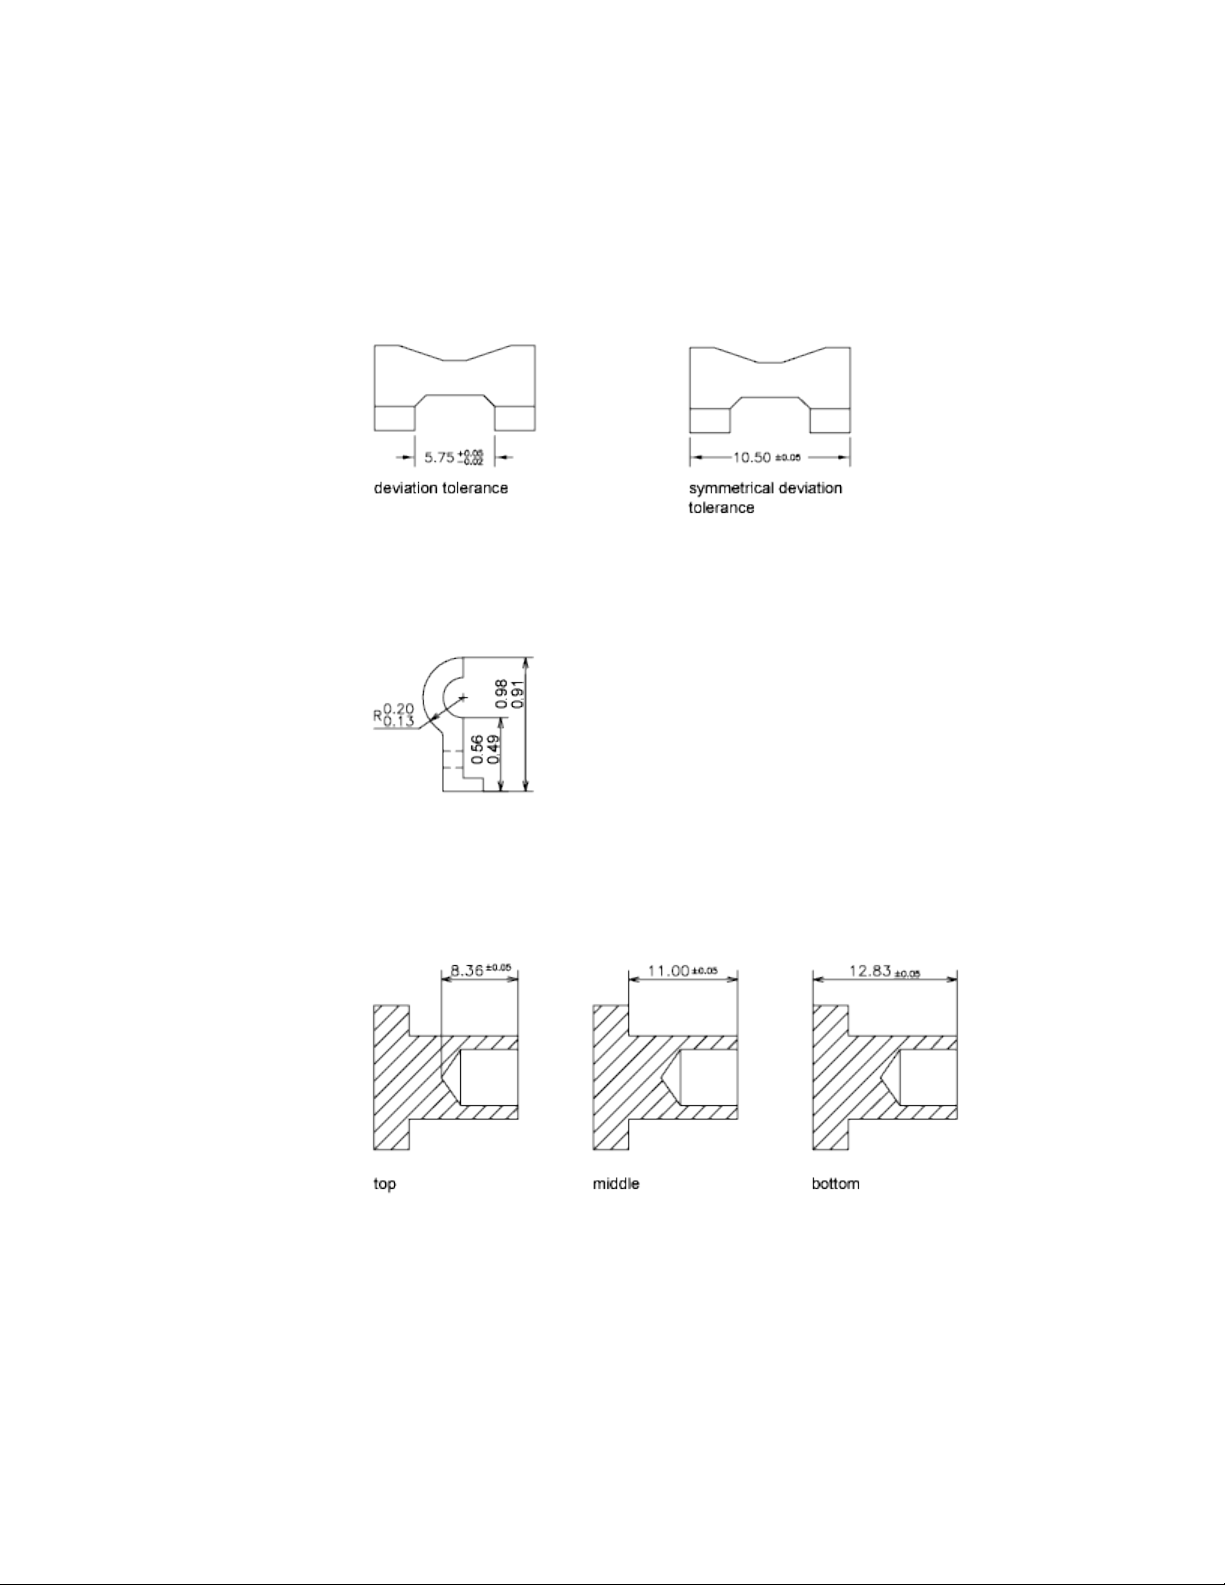
the deviation tolerance values are equal, they are displayed with a sign and
they are known as symmetrical. Otherwise, the plus value goes above the
minus value.
If the tolerances are applied as limits, the program uses the plus and minus
values you supply to calculate a maximum and minimum value. These values
replace the dimension value. If you specify limits, the upper limit goes above
the lower.
Format Lateral Tolerances
You can control the vertical placement of tolerance values relative to the main
dimension text. Tolerances can align with the top, middle, or bottom of the
dimension text.
Dimensions and Tolerances | 581
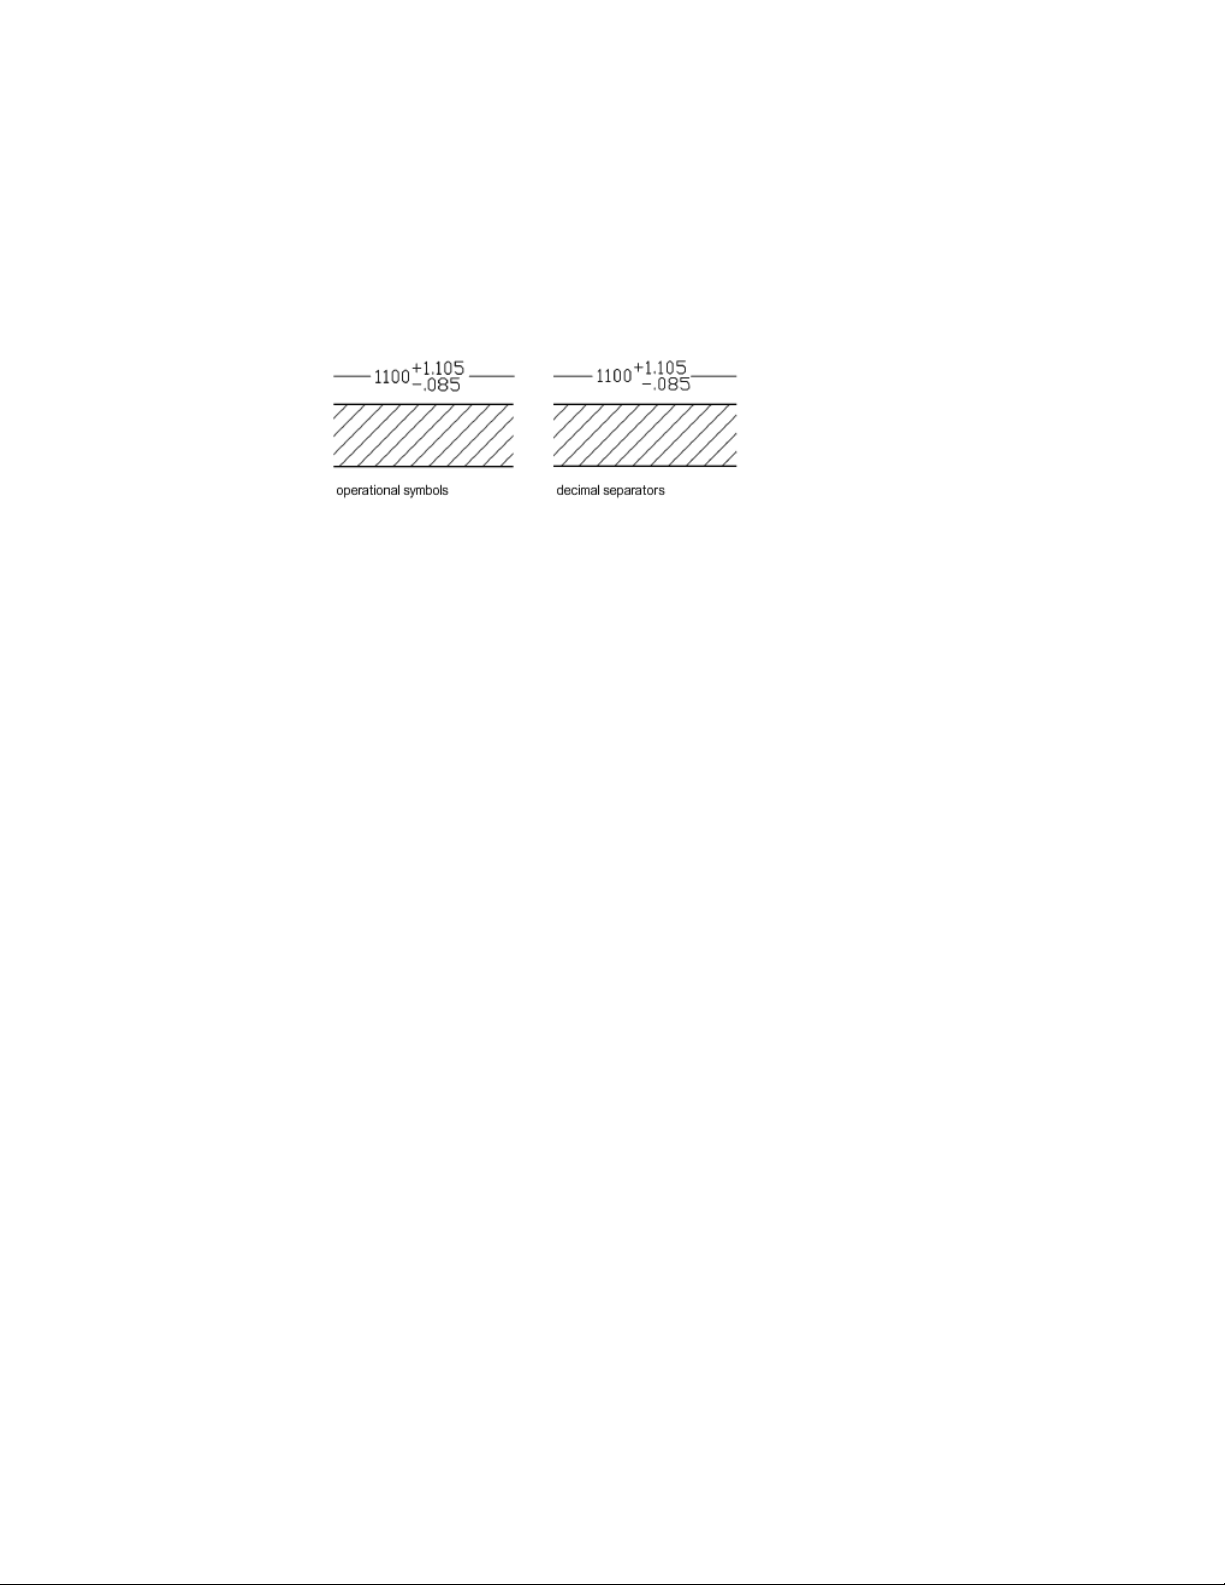
Along with vertical placement of tolerance values, you can also control the
horizontal alignment of the upper and lower tolerance values. The upper and
lower tolerance values can be aligned using either the operational symbols or
decimal separators.
You can also control zero suppression as you can with the primary and
alternate units. Suppressing zeros in lateral tolerances has the same effect as
suppressing them in the primary and alternate units. If you suppress leading
zeros, 0.5 becomes .5, and if you suppress trailing zeros, 0.5000 becomes 0.5.
See also:
Add Geometric Tolerances (page 610)
Control the Display of Fractions
You can control the format of the fraction displayed in dimensions.
You can set the fraction format in dimensions using the DIMFRAC system
variable when the DIMLUNIT system variable is set to 4 (architecture) or 5
(fractional).
The following illustration shows the different fraction formats available.
582 | Chapter 9 Annotate Drawings
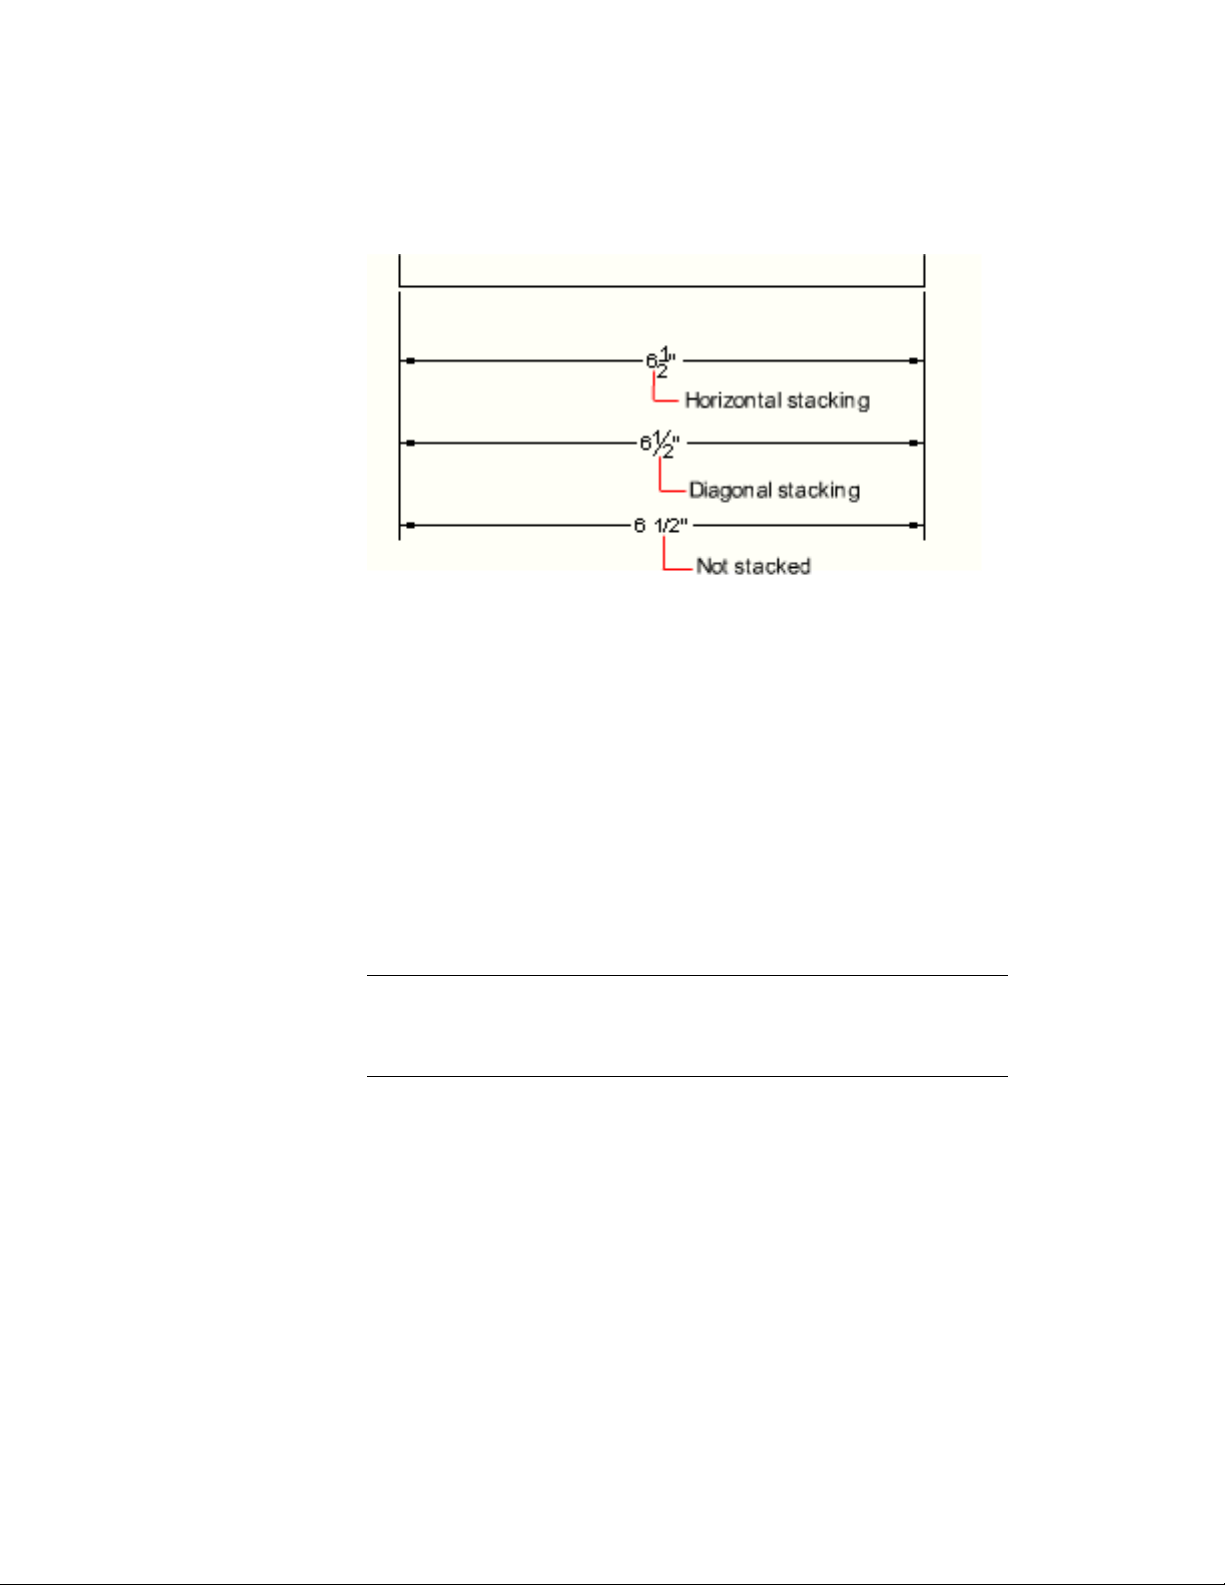
These settings are available on the Modify/New Dimension Style dialog box,
Primary Units tab.
Set the Scale for Dimensions
You can specify the size of dimensions in your drawing. How you set dimension
size depends on the method you use to lay out and print drawings.
Dimension scale affects the size of the dimension geometry relative to the
objects in the drawing. Dimension scale affects sizes, such as text height and
arrowhead size, and offsets, such as the extension line origin offset.
You should set these sizes and offsets to values that represent their actual
printed size. Dimension scale does not apply the overall scale factor to
tolerances or measured lengths, coordinates, or angles.
NOTE You can use annotative scaling to control the overall scale of dimensions
displayed in layout viewports. When you create annotative dimensions, they are
scaled based on the current annotation scale setting and automatically displayed
at the correct size.
Setting dimension scale depends on how you lay out your drawing. There are
three methods used to create dimensions in a drawing layout:
■ Dimension in model space for printing in model space. This is
the traditional method used with single-view drawings. To create
dimensions that are scaled correctly for printing, set the DIMSCALE system
variable to the inverse of the intended print scale. For example, if the print
scale is 1/4, set DIMSCALE to 4.
Dimensions and Tolerances | 583

■ . This was the preferred method for complex, multiple-view drawings prior
to AutoCAD 2002. Use this method when the dimensions in a drawing
need to be referenced by other drawings (xrefs) or when creating isometric
dimensions in 3D isometric views. To prevent the dimensions in one layout
viewport from being displayed in other layout viewports, create a
dimensioning layer for each layout viewport that is frozen in all other
layout viewports. To create dimensions that are scaled automatically for
display in a paper space layout, set the DIMSCALE system variable to 0.
■ Dimension in layouts. This is the simplest dimensioning method.
Dimensions are created in paper space by selecting model space objects or
by specifying object snap locations on model space objects. By default,
associativity between paper space dimensions and model space objects is
maintained. No additional scaling is required for dimensions created in a
paper space layout: DIMLFAC and DIMSCALE do not need to be changed
from their default value of 1.0000.
NOTE When you dimension model space objects in paper space using associative
dimensions, dimension values for the display scale of each viewport are
automatically adjusted. This adjustment is combined with the current setting for
DIMLFAC and is reported by the LIST command as a dimension style override. For
nonassociative dimensions, you must set DIMLFAC manually.
See also:
Draw, Scale, and Annotate in Model Space (page 86)
Scale Views in Layout Viewports (page 95)
Scale Annotations (page 490)
Create Dimensions
You can create all of the standard types of dimensions.
Create Linear Dimensions
You can create linear dimensions with horizontal, vertical, and aligned
dimension lines. These linear dimensions can also be stacked, or they can be
created end to end.
584 | Chapter 9 Annotate Drawings
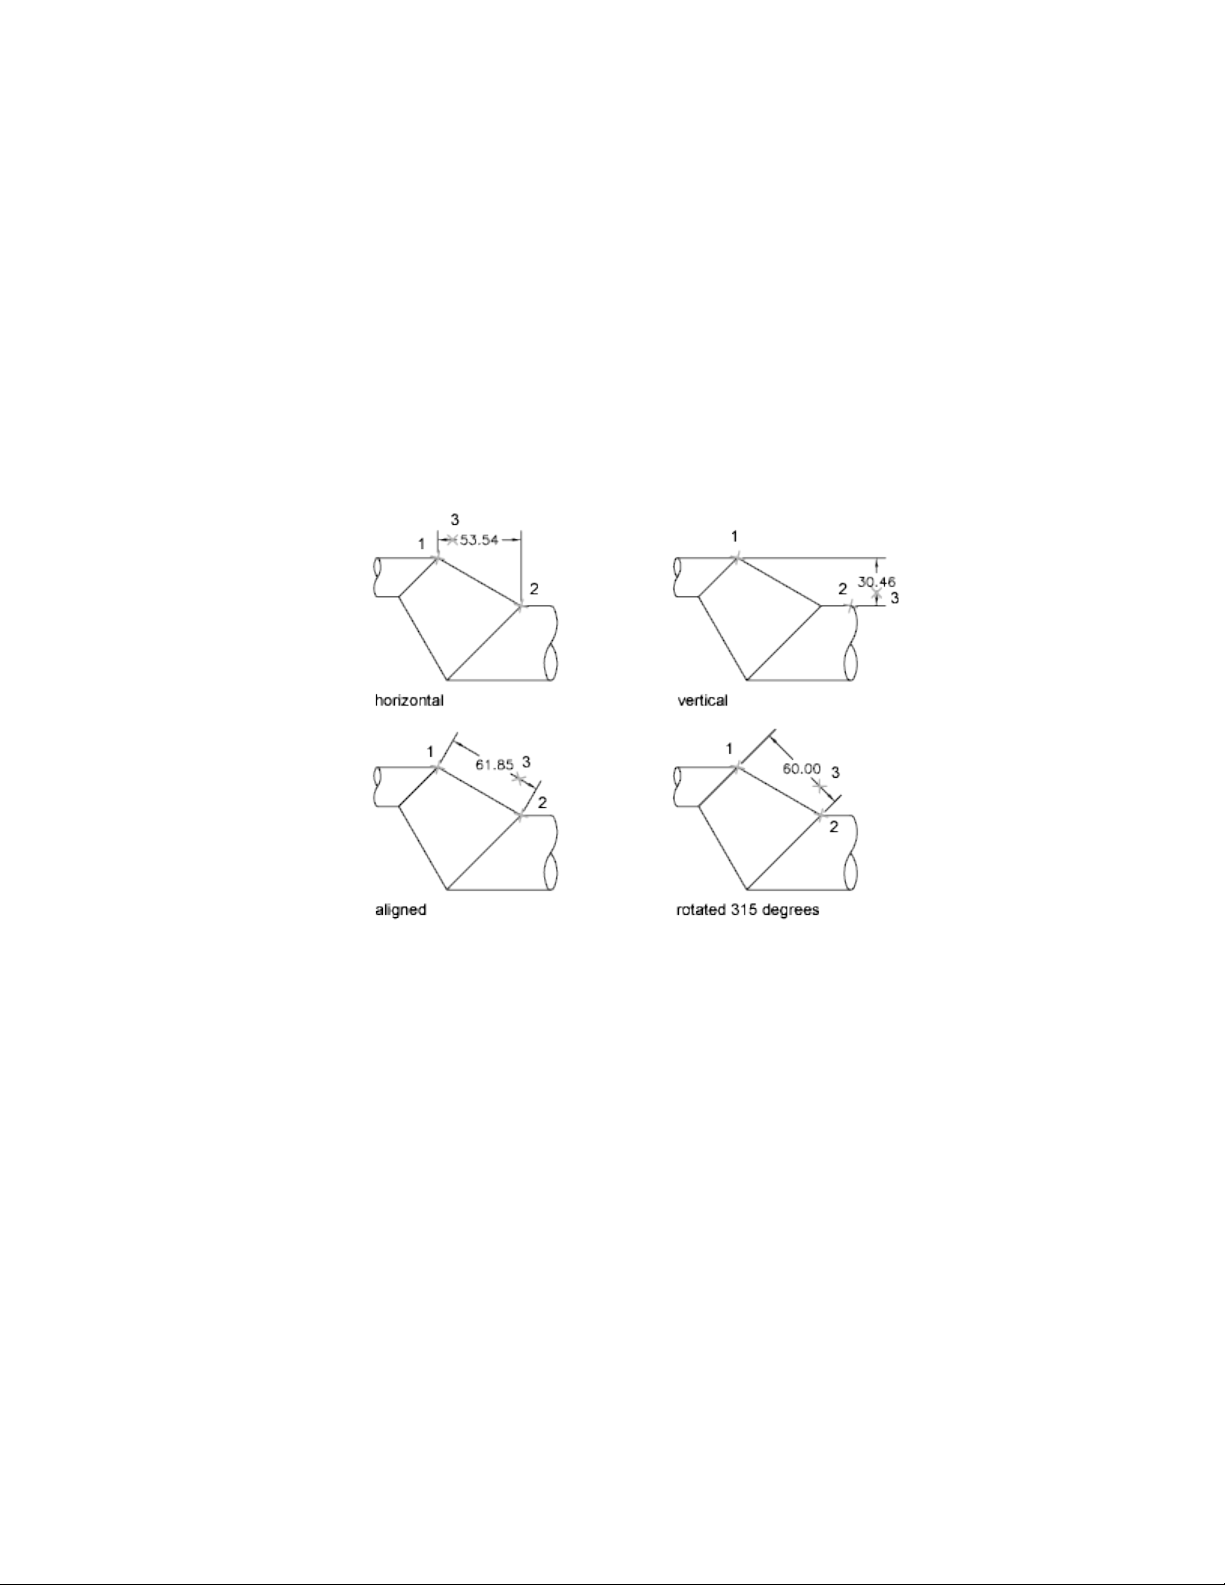
Overview of Creating Linear Dimensions
Linear dimensions can be horizontal, vertical, or aligned. With aligned
dimensions, the dimension line is parallel to the line (imaginary or real)
between the extension line origins. Baseline (or parallel) and continued (or
chain) dimensions are series of consecutive dimensions that are based on a
linear dimension.
In all four illustrations, the extension line origins are designated explicitly at
1 and 2, respectively. The dimension line location is specified at 3.
As you create linear dimensions, you can modify the content of the text, the
angle of the text, or the angle of the dimension line.
Create Horizontal and Vertical Dimensions
You can create dimensions using only the horizontal or vertical components
of the locations or objects that you specify.
The program automatically applies a horizontal or vertical dimension according
to the extension line origins that you specify or the location where you select
an object; however, you can override this as you create the dimension by
specifying that a dimension be horizontal or vertical. For example, in the
Dimensions and Tolerances | 585
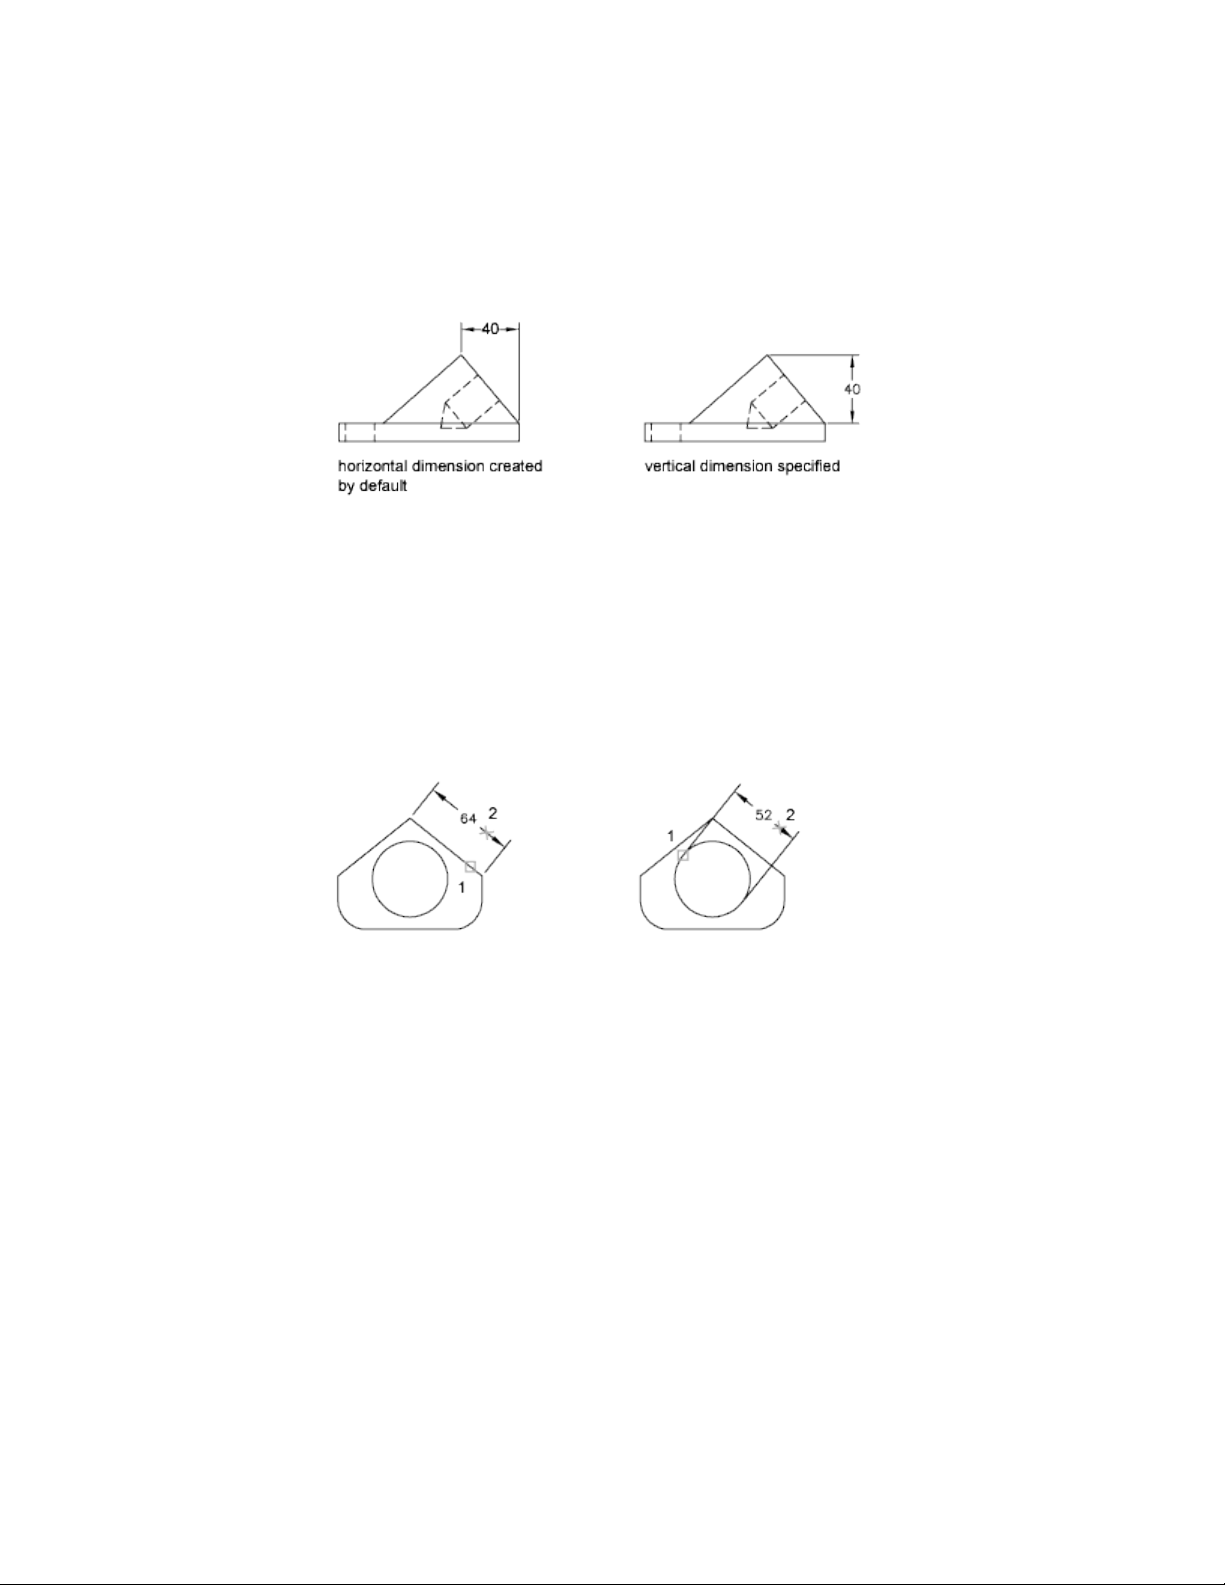
following illustration, a horizontal dimension is drawn by default unless you
specify a vertical one.
Create Aligned Dimensions
You can create dimensions that are parallel to the locations or objects that
you specify.
In aligned dimensions, the dimension line is parallel to the extension line
origins. The illustration shows two examples of aligned dimensioning. The
object is selected (1), and the location of the aligned dimension is specified
(2). The extension lines are drawn automatically.
Create Baseline and Continued Dimensions
Baseline dimensions are multiple dimensions measured from the same baseline.
Continued dimensions are multiple dimensions placed end to end.
You must create a linear, aligned, or angular dimension before you create
baseline or continued dimensions. You create baseline dimensions
incrementally from the most recently created dimension in the current session.
586 | Chapter 9 Annotate Drawings
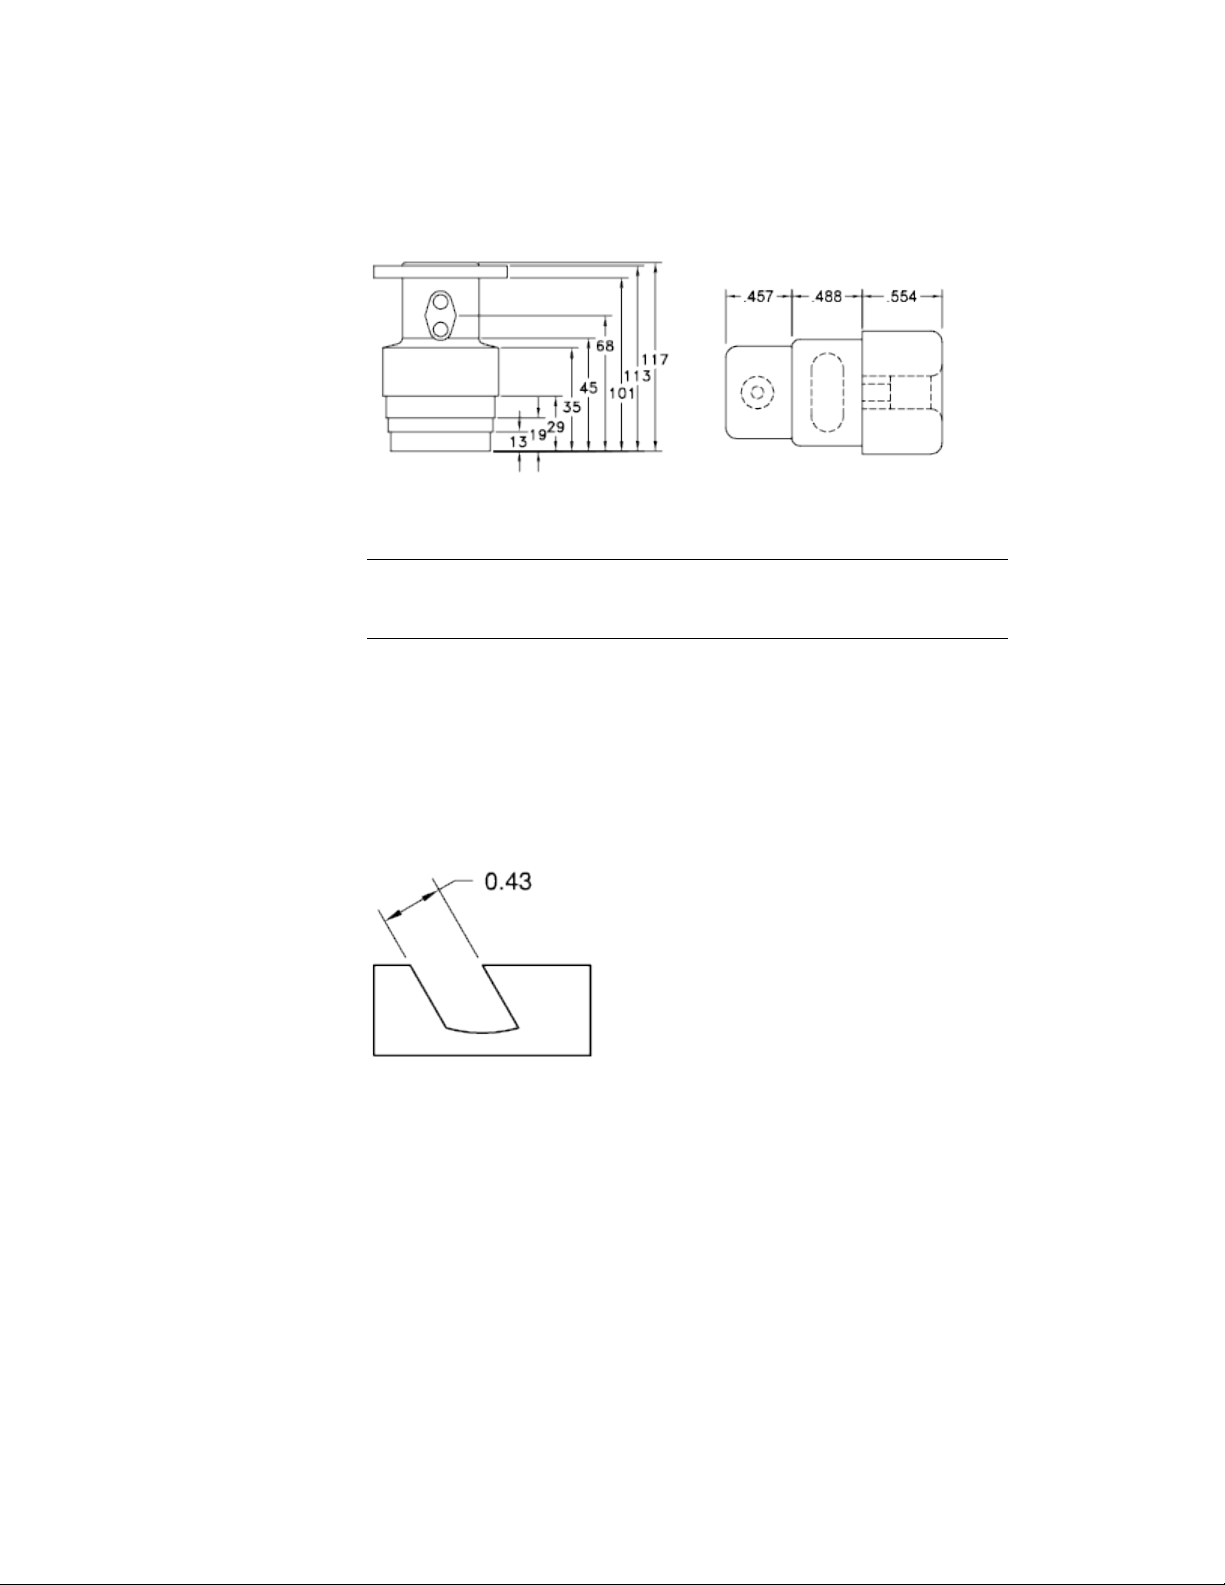
Both baseline and continued dimensions are measured from the previous
extension line unless you specify another point as the point of origin.
TIP Hover over a dimension line endpoint grip to quickly access the Baseline or
Continued commands from the grip menu. For more information, see Use Multi-
Functional Dimension Line Grips (page 599).
Create Rotated Dimensions
In rotated dimensions, the dimension line is placed at an angle to the extension
line origins.
The illustration shows an example of a rotated dimension. In the example,
the angle specified for dimension rotation is equal to the angle of the slot.
Create Dimensions with Oblique Extension Lines
You can create dimensions with extension lines that are not perpendicular to
their dimension lines.
Dimensions and Tolerances | 587
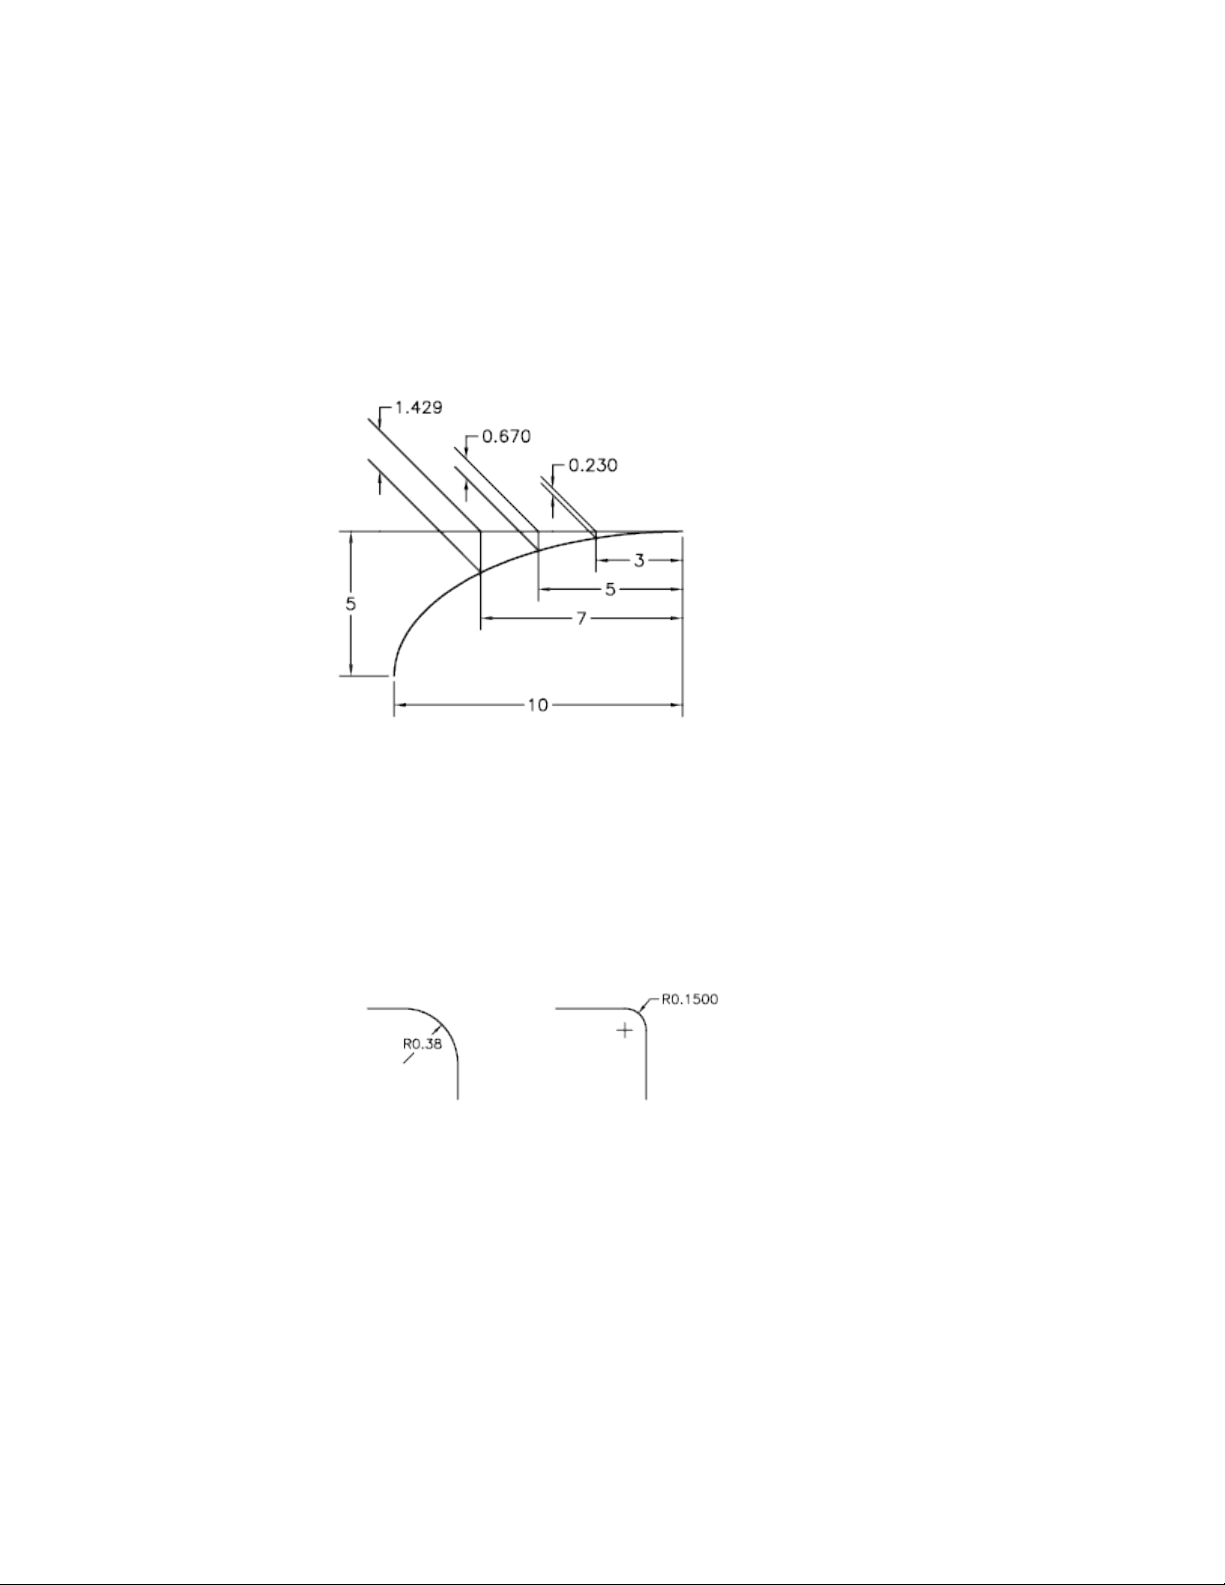
Extension lines are created perpendicular to the dimension line. However, if
the extension lines conflict with other objects in a drawing, you can change
their angle after the dimension has been drawn.
New dimensions are not affected when you make an existing dimension
oblique.
Create Radial Dimensions
Radial dimensions measure the radii and diameters of arcs and circles with
optional centerlines or a center mark.
There are two types of radial dimensions:
■ DIMRADIUS measures the radius of an arc or circle, and displays the
dimension text with the letter R in front of it.
■ DIMDIAMETER measures the diameter of an arc or circle, and displays the
dimension text with the diameter symbol in front of it.
588 | Chapter 9 Annotate Drawings
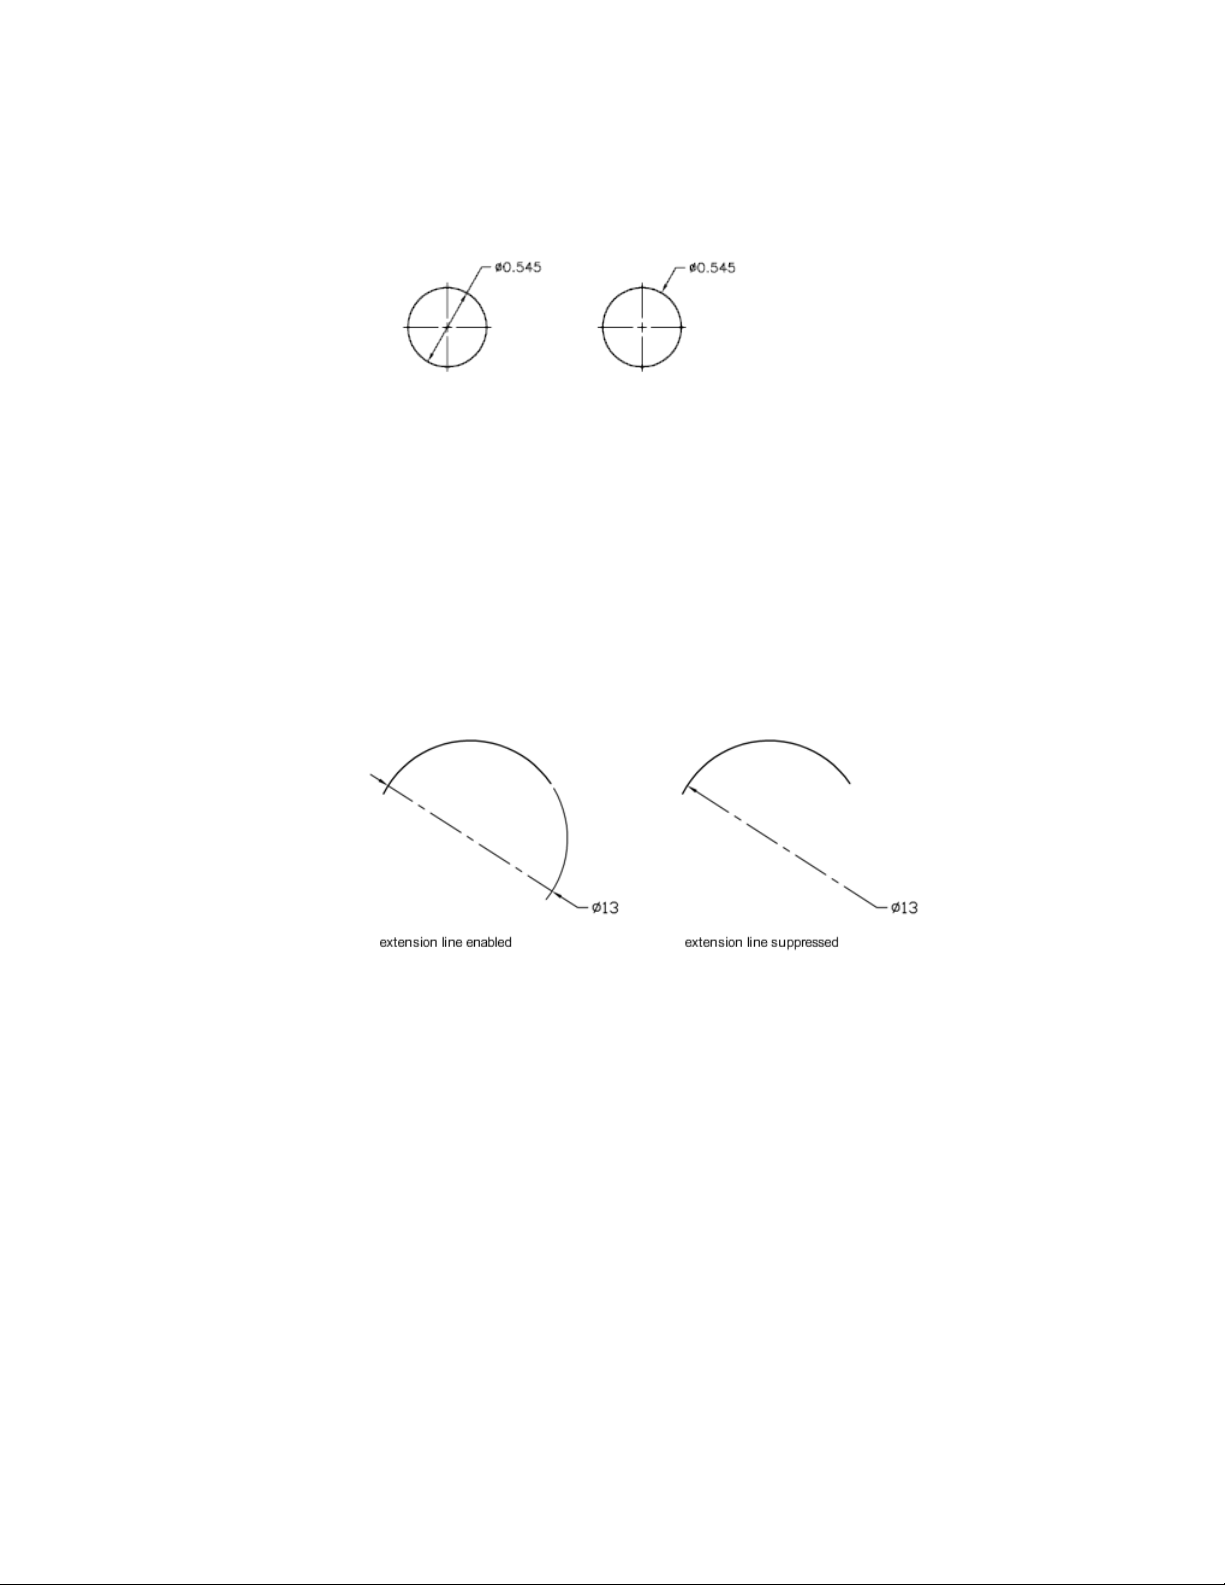
For horizontal dimension text, if the angle of the radial dimension line is
greater than 15 degrees from horizontal, a hook line, also called a dogleg or
landing, one arrowhead long, is created next to the dimension text.
Control Extension Lines
When an arc is dimensioned, the radial or diametric dimension does not have
to be positioned along the arc directly. If a dimension is positioned past the
end of an arc, either an extension line will be drawn that follows the path of
the arc being dimensioned or no extension line will be drawn. When the
extension line is suppressed (off), the dimension line of the radial or diametric
dimension is drawn through the center point of the arc instead of to the
extension line.
The DIMSE1 system variable controls whether or not a radial or diametric
dimension will be drawn with an extension line when it is positioned off the
end of an arc. When the display of the arc extension line is not suppressed,
a gap between the arc and arc extension line is made. The size of the gap
drawn is controlled with the DIMEXO system variable.
Dimensions and Tolerances | 589
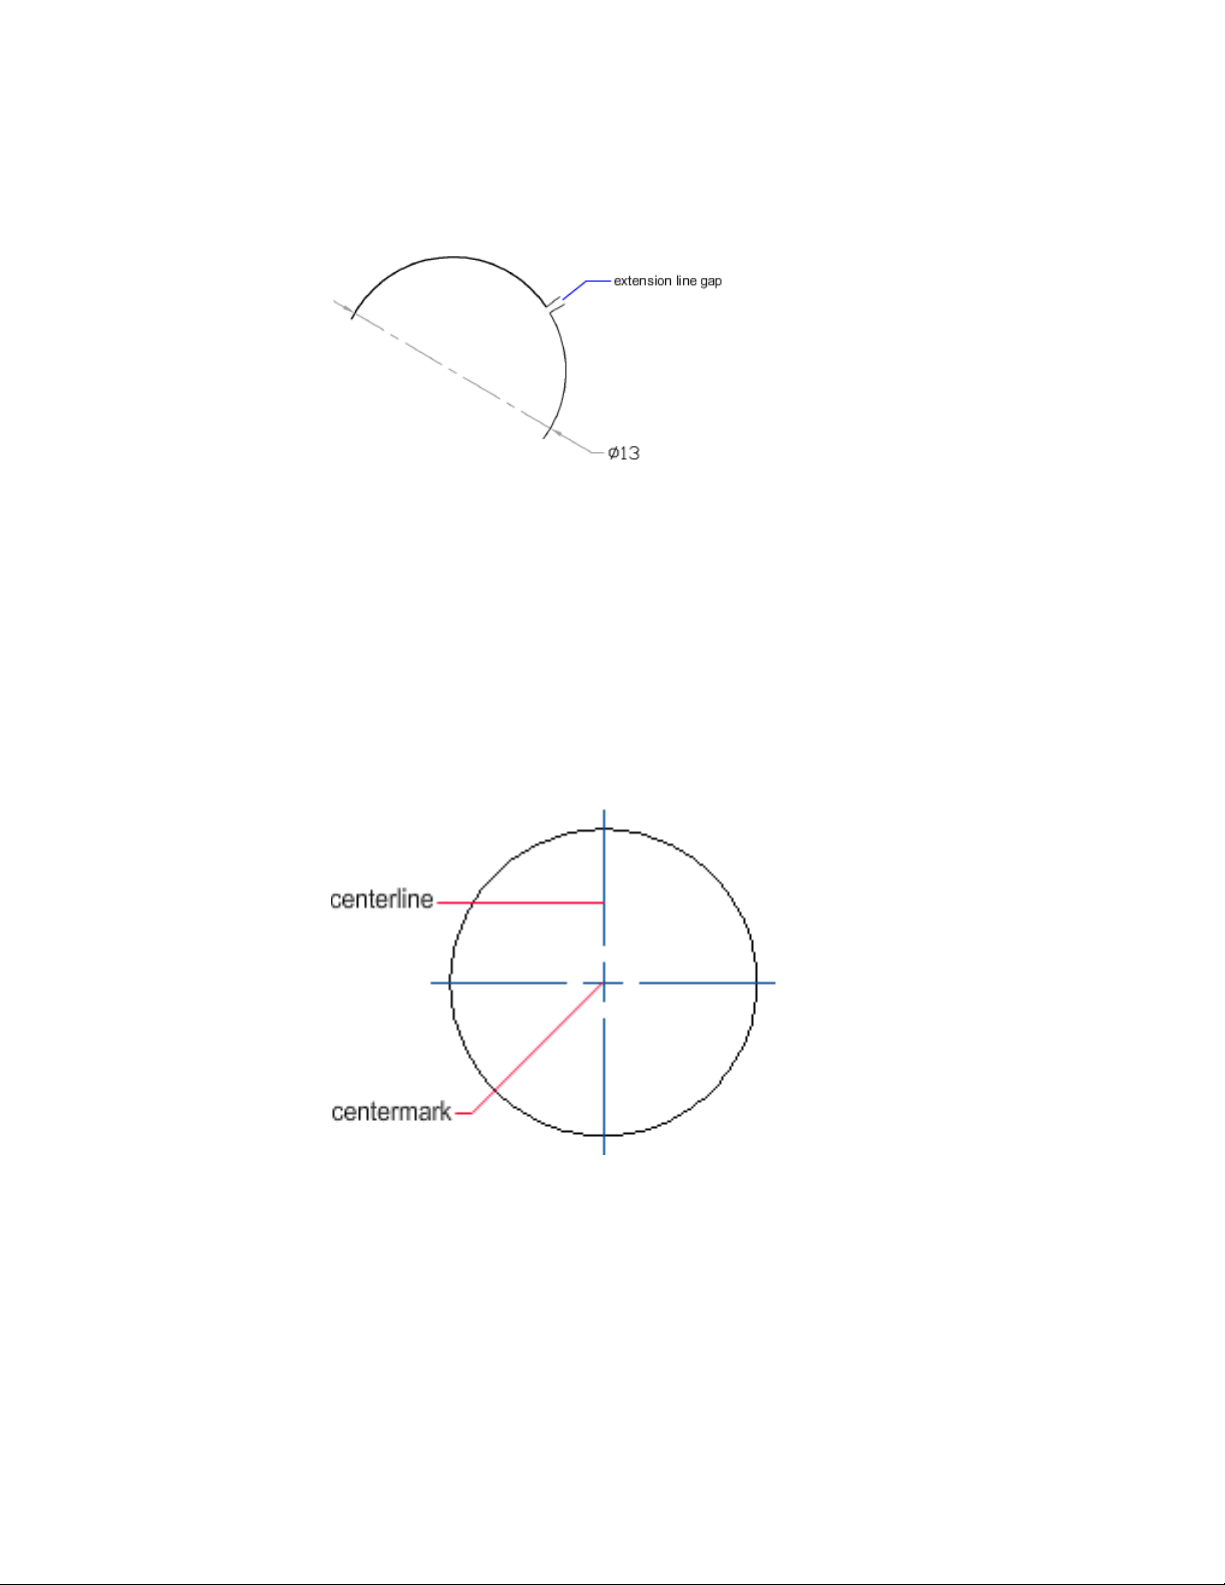
Control Centerlines and Center Marks
Depending on your dimension style settings, center marks and lines generate
automatically for diameter and radius dimensions. They are created only if
the dimension line is placed outside the circle or arc. You can create centerlines
and center marks directly with the DIMCENTER command.
You can control the size and visibility of centerlines and center marks on the
New/Modify Dimension Style dialog box, Symbols and Arrows tab, under
Center Marks. You can also access this setting with the DIMCEN system
variable.
The size of the centerline is the length of the centerline segment that extends
outside the circle or arc. It is also the size of the gap between the center mark
590 | Chapter 9 Annotate Drawings
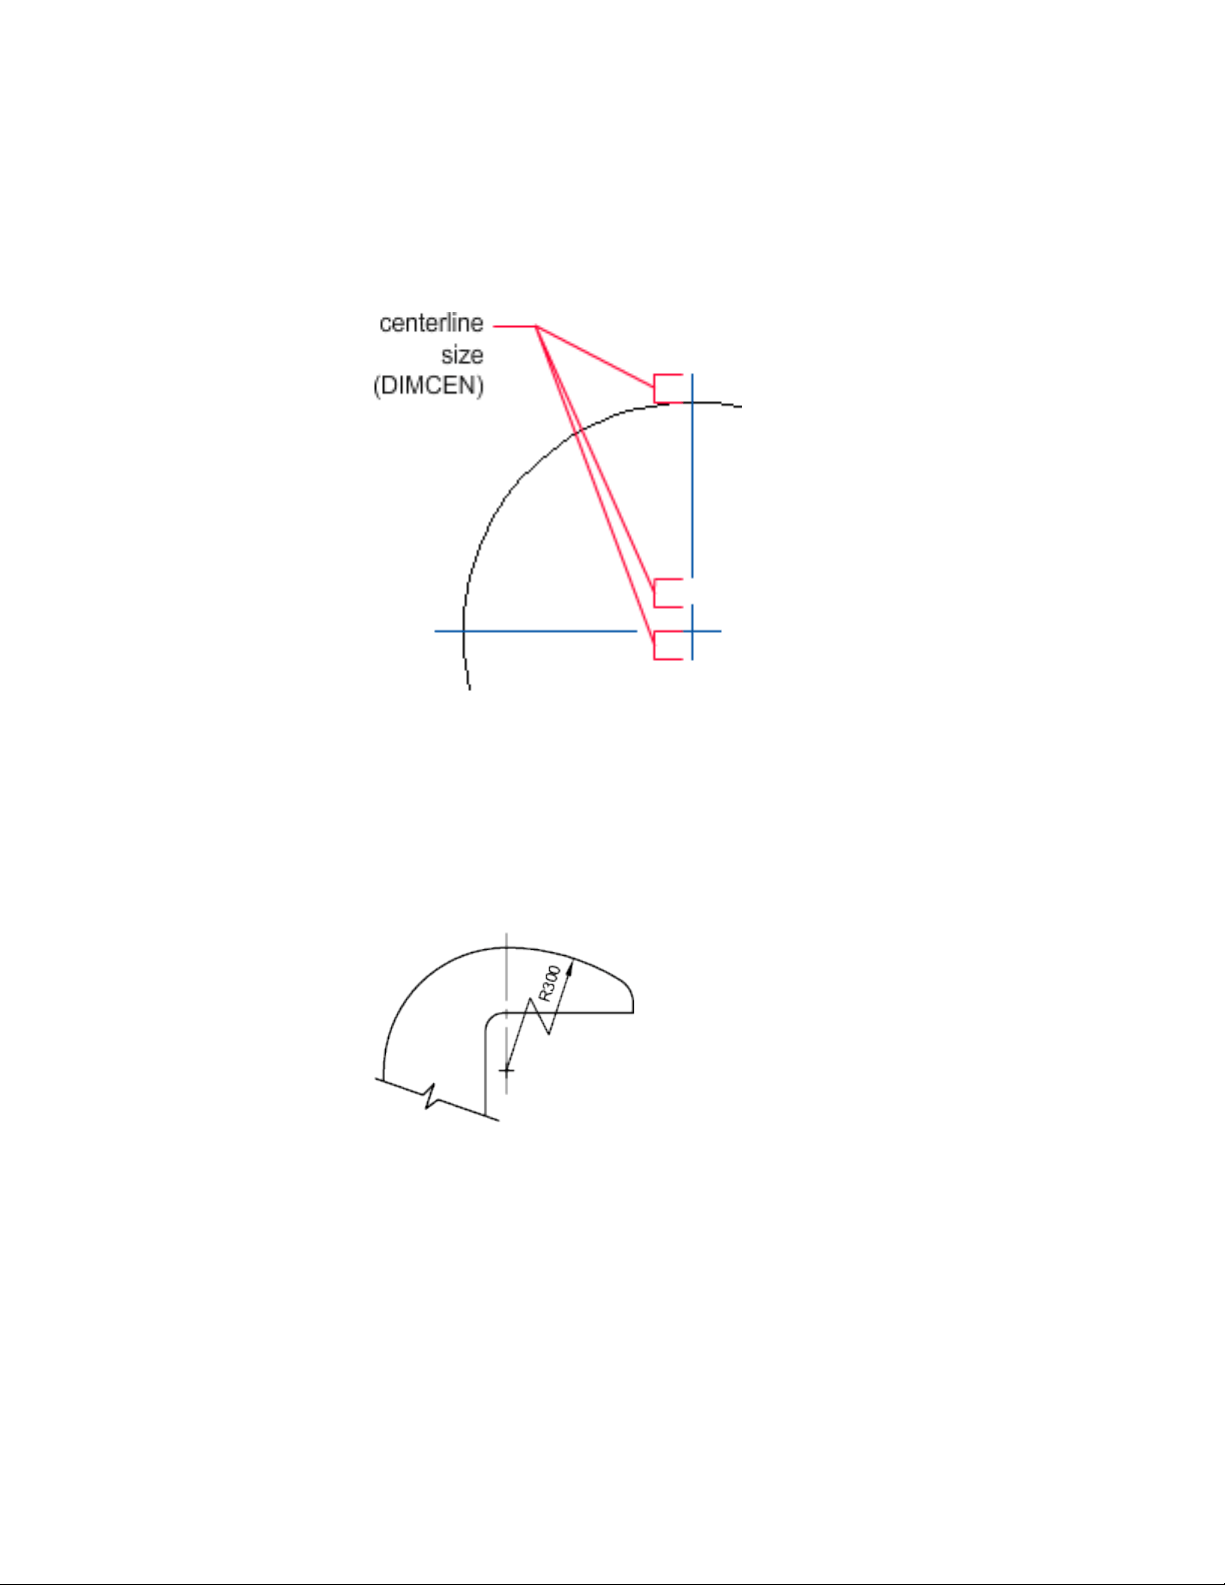
and the start of the centerline. The size of the center mark is the distance from
the center of the circle or arc to the end of the center mark.
Create Jogged Radius Dimensions
With the DIMJOGGED command, you can create jogged radius dimensions,
also called “foreshortened radius dimensions,” when the center of an arc or
circle is located off the layout and cannot be displayed in its true location.
The origin point of the dimension can be specified at a more convenient
location called the center location override.
You can control the default angle of the jog in the New/Modify Dimension
Style dialog box, Symbols and Arrows tab, under Radius Dimension Jog.
Dimensions and Tolerances | 591
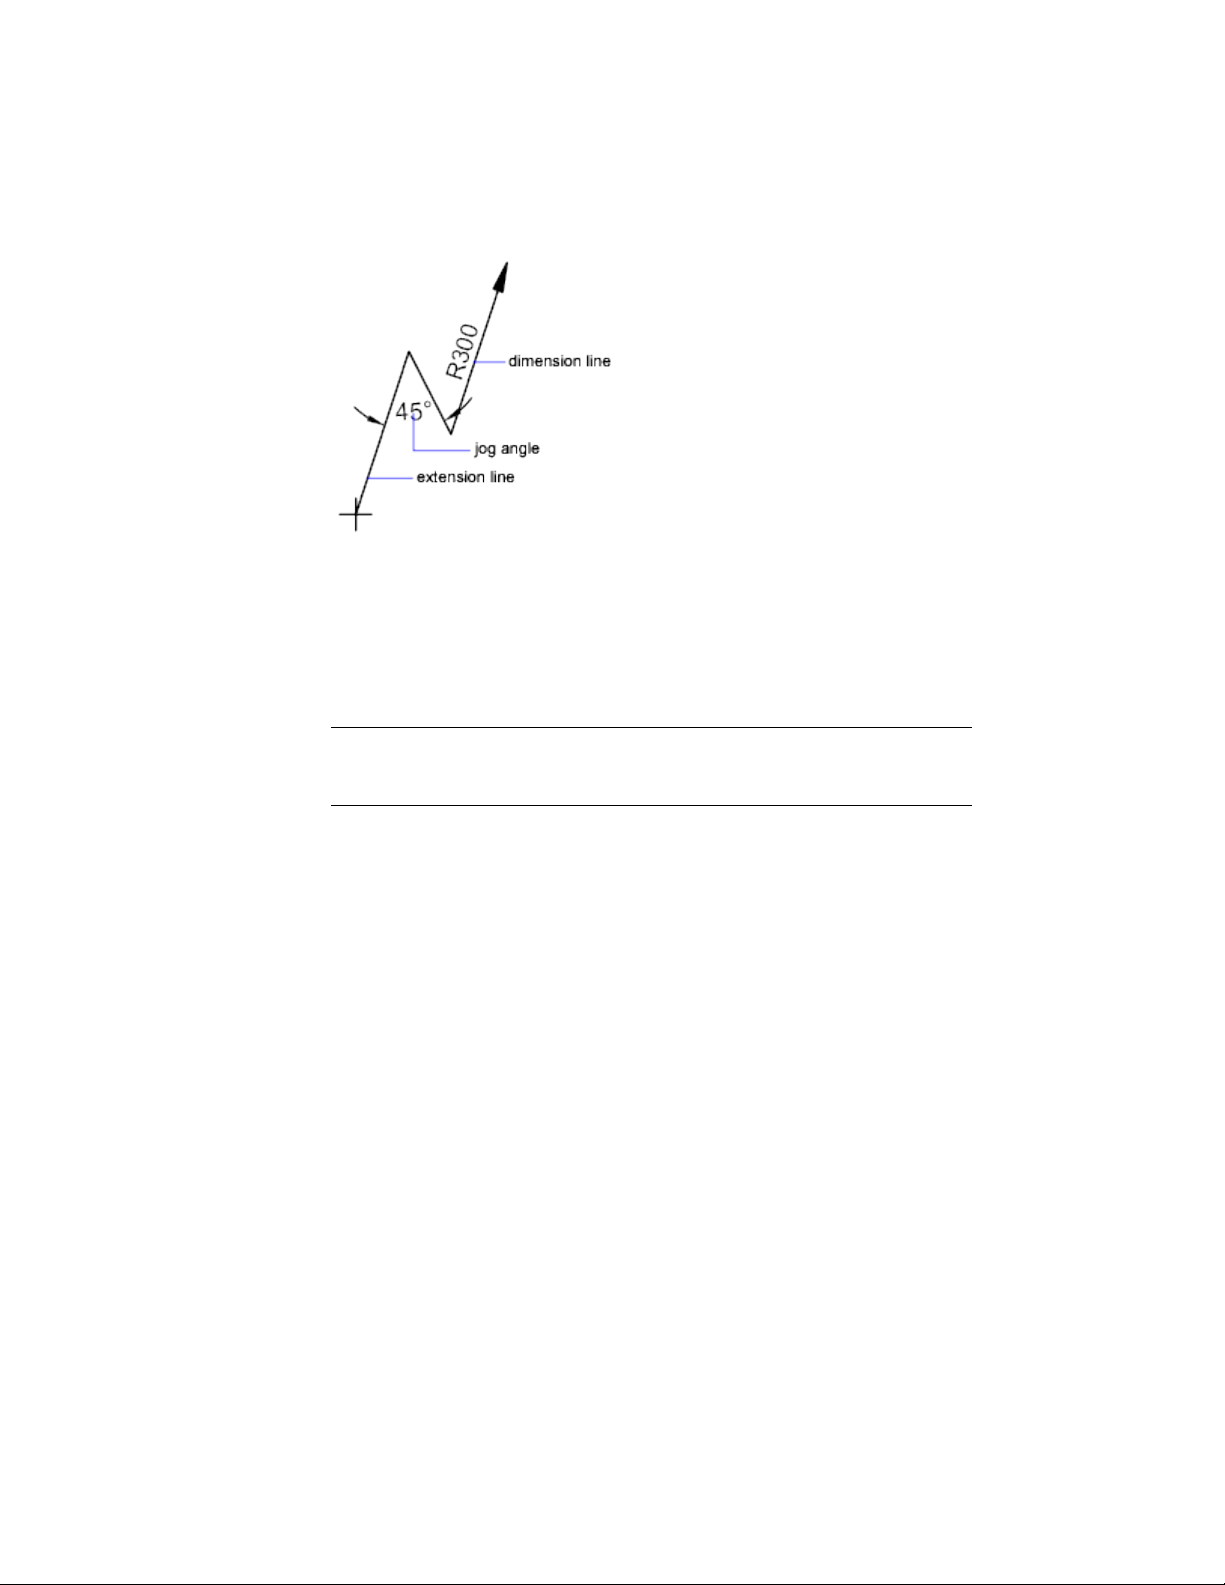
Once a jogged radius dimension is created, you can modify the jog and the
center location override by
■ Using grips to move the features
■ Changing the locations of the features with the Properties Inspector
■ Using STRETCH
NOTE Jogged radius dimensions can be viewed but not edited in versions previous
to AutoCAD 2006. Also, if you make dramatic changes to the associated geometry,
you may get unpredictable results for the jogged radius dimension.
See also:
Fit Dimension Text Within Extension Lines (page 571)
Create Angular Dimensions
Angular dimensions measure the angle between two lines or three points.
To measure the angle between two radii of a circle, you select the circle and
specify the angle endpoints. With other objects, you select the objects and
then specify the dimension location. You can also dimension an angle by
specifying the angle vertex and endpoints. As you create the dimension, you
can modify the text content and alignment before specifying the dimension
line location.
592 | Chapter 9 Annotate Drawings
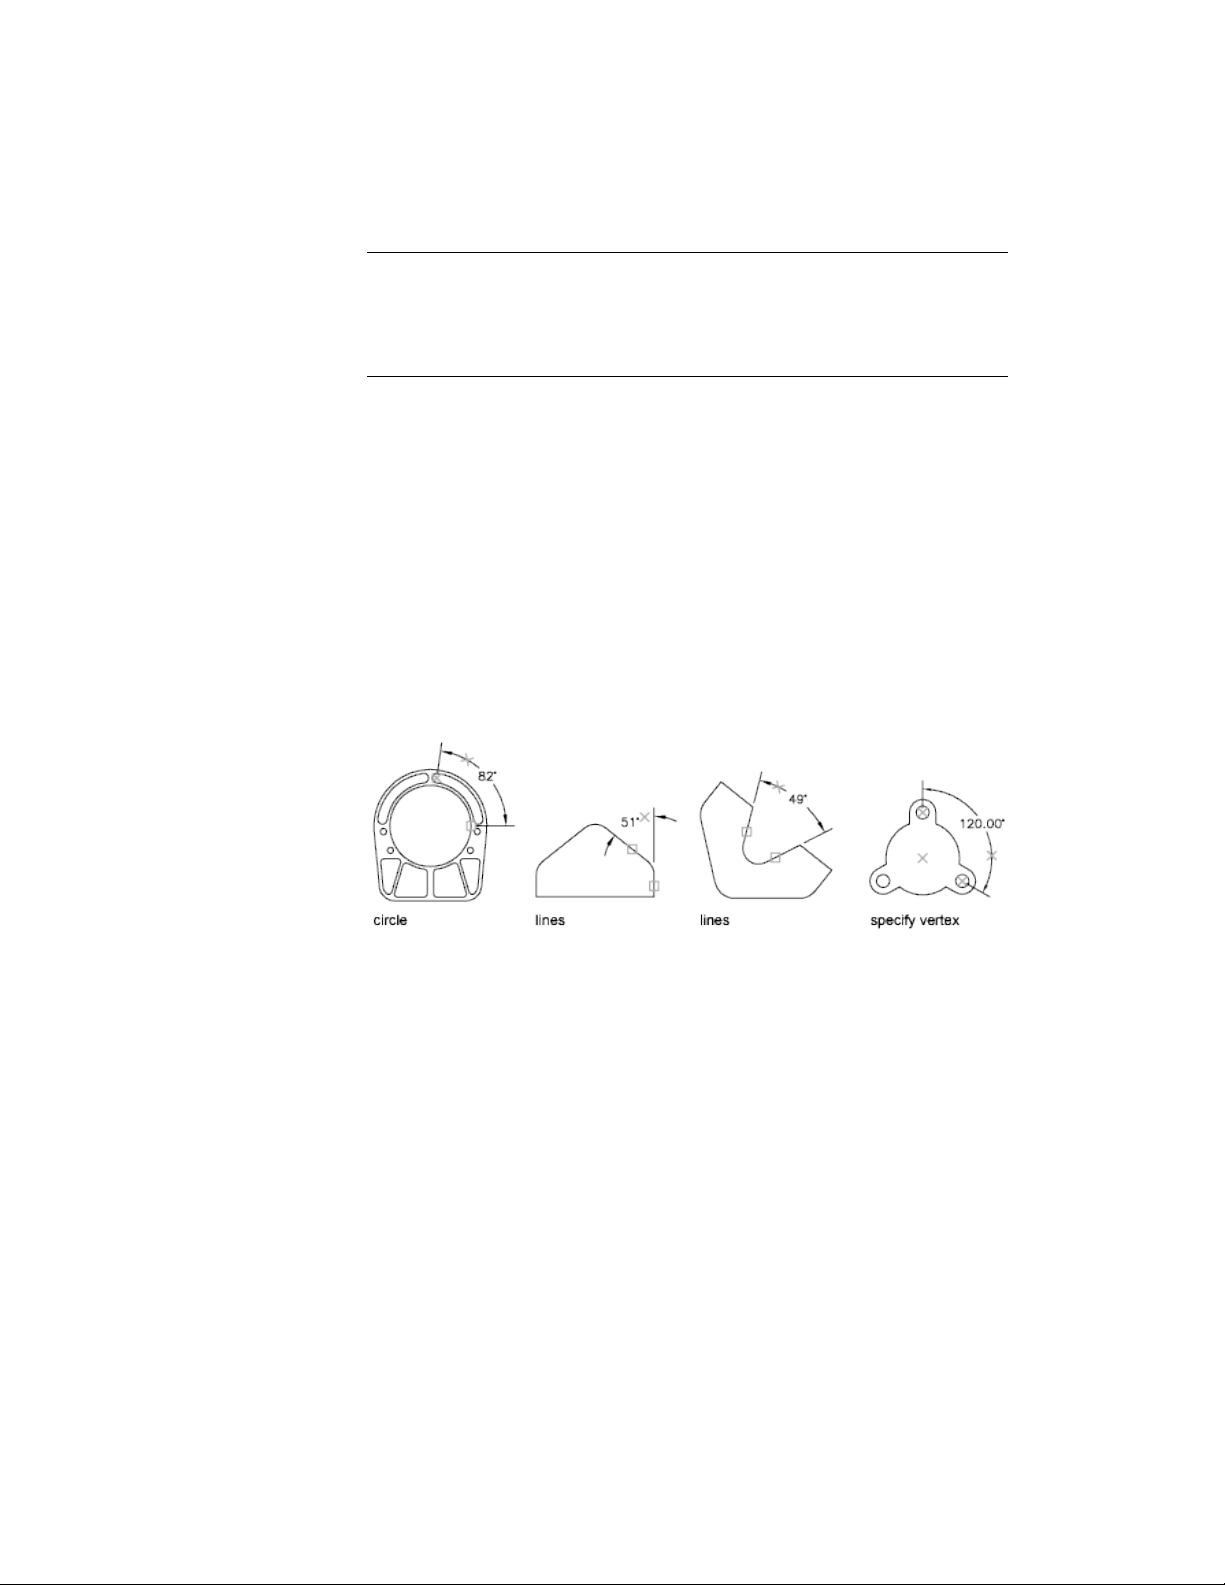
NOTE You can create baseline and continued angular dimensions relative to
existing angular dimensions. Baseline and continued angular dimensions are limited
to 180 degrees or less. To obtain baseline and continued angular dimensions larger
than 180 degrees, use grip editing to stretch the location of the extension line of
an existing baseline or continued dimension.
Dimension Lines
If you use two straight, nonparallel lines to specify an angle, the dimension
line arc spans the angle between the two lines. If the dimension line arc does
not meet one or both of the lines being dimensioned, The program draws one
or two extension lines to intersect the dimension line arc. The arc is always
less than 180 degrees.
Dimension Circles and Arcs
If you use an arc or a circle or three points to specify an angle, the program
draws the dimension line arc between the extension lines. The extension lines
are drawn from the angle endpoints to the intersection of the dimension line
arc.
The location that you specify for the dimension line arc determines the
quadrant of the dimensioned angle.
Dimension to a Quadrant
Angular dimensions can measure a specific quadrant that is formed when
dimensioning the angle between of the endpoints of a line or arc, center point
of a circle, or two vertices. As an angular dimension is being created, there are
four possible angles that can be measured. By specifying a quadrant it allows
you to ensure that the correct angle is dimensioned. When placing an angular
dimension after a quadrant has been specified, you can place the dimension
text outside of the extension lines of the dimension. The dimension line is
automatically extended.
Dimensions and Tolerances | 593
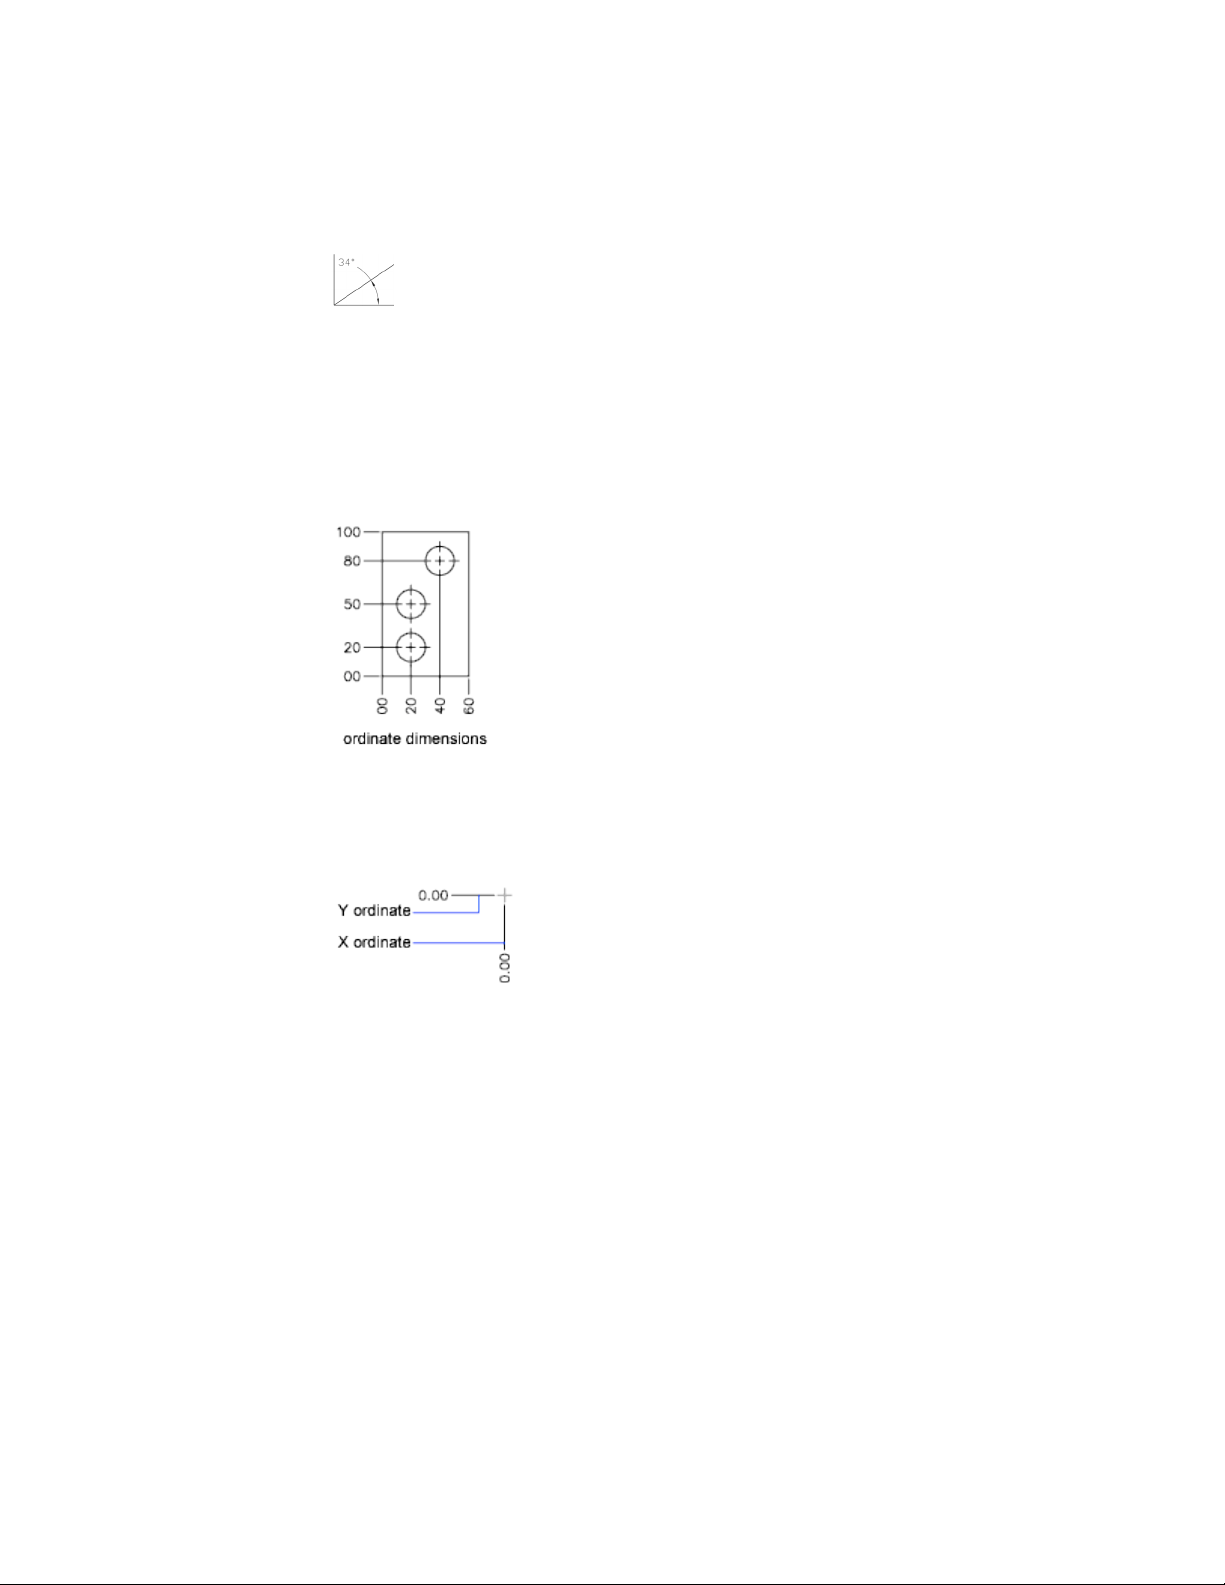
Create Ordinate Dimensions
Ordinate dimensions measure the perpendicular distance from an origin point
called the datum to a feature, such as a hole in a part. These dimensions prevent
escalating errors by maintaining accurate offsets of the features from the
datum.
Ordinate dimensions consist of an X or Y value with a leader line. X-datum
ordinate dimensions measure the distance of a feature from the datum along
the X axis. Y-datum ordinate dimensions measure the distance along the Y
axis.
Locate the Datum
The location and orientation of the current UCS determines the ordinate
values. Before creating ordinate dimensions, you typically set the UCS origin
to coincide with the datum.
594 | Chapter 9 Annotate Drawings
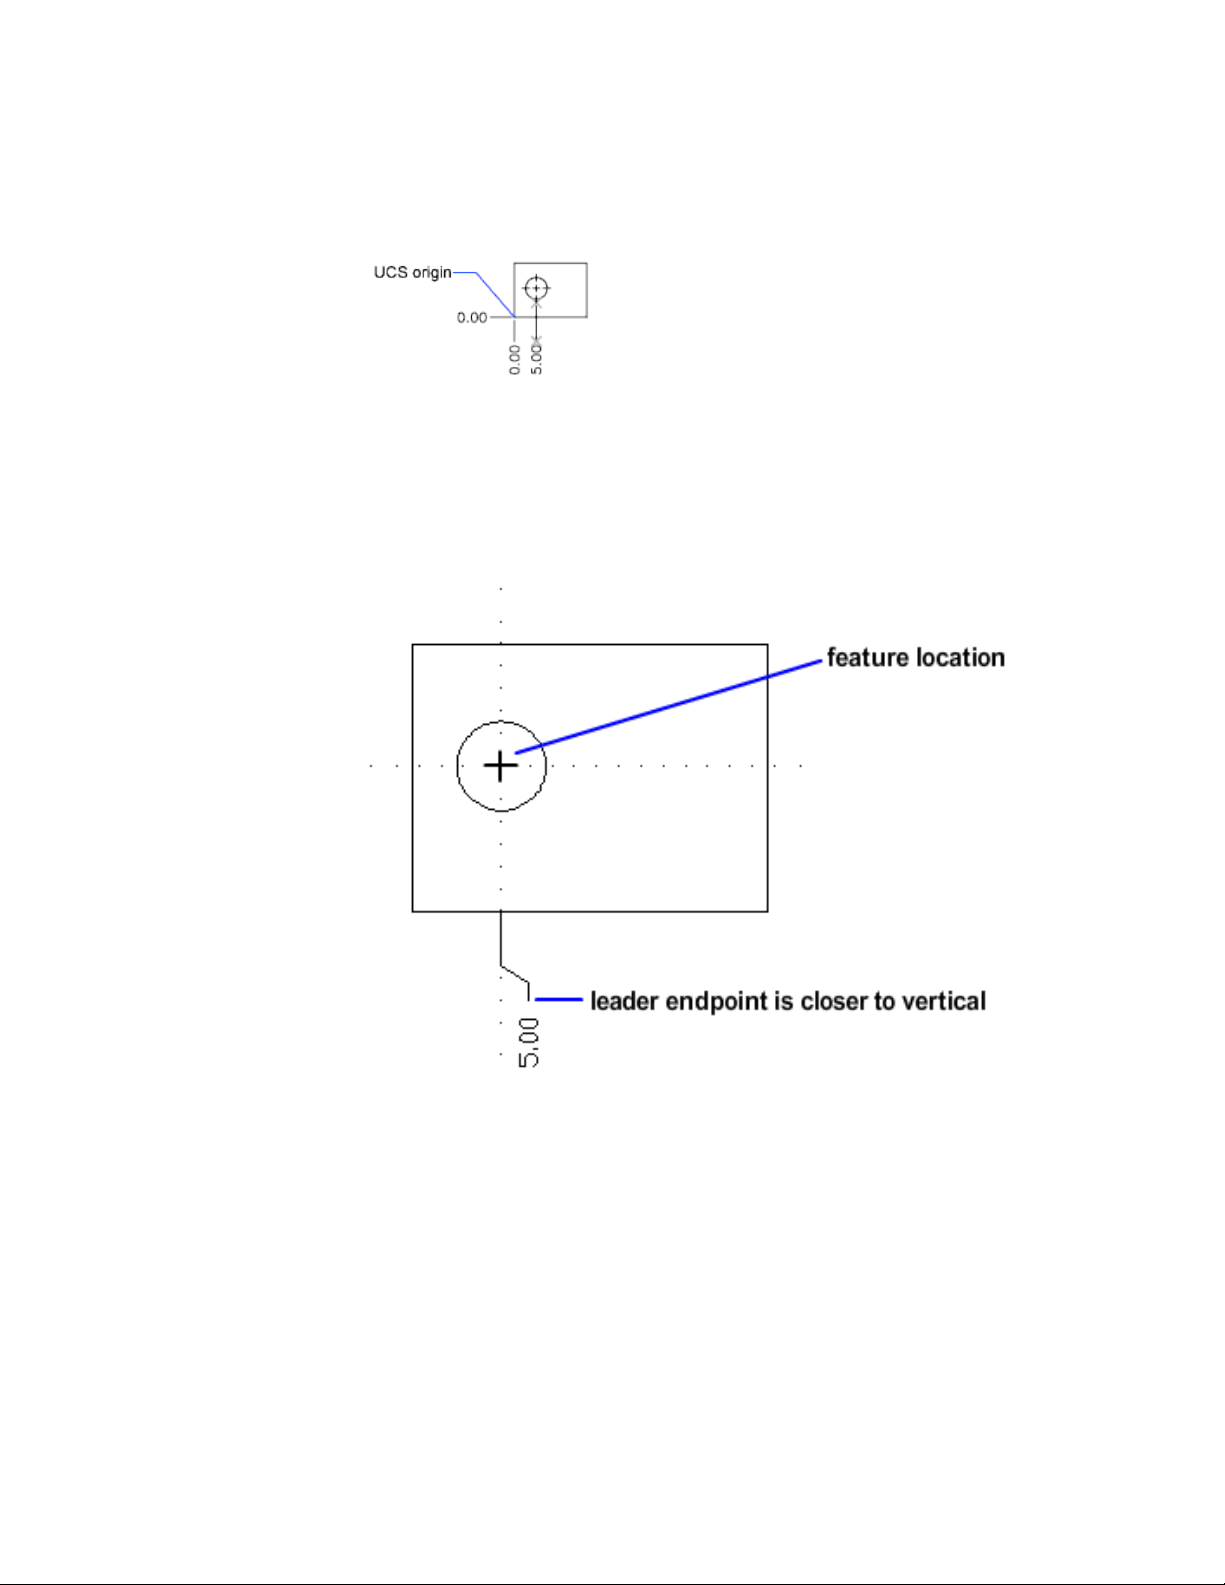
Locate the Leader
After you specify the feature location, you are prompted for the leader
endpoint. By default, the leader endpoint that you specify automatically
determines whether an X- or a Y-datum ordinate dimension is created. For
example, you can create an X-datum ordinate dimension by specifying a
location for the leader endpoint that is closer to vertical than horizontal.
After creating an ordinate dimension, you can easily relocate the dimension
leader and text using grip editing. The dimension text is always aligned with
the ordinate leader line.
Dimensions and Tolerances | 595
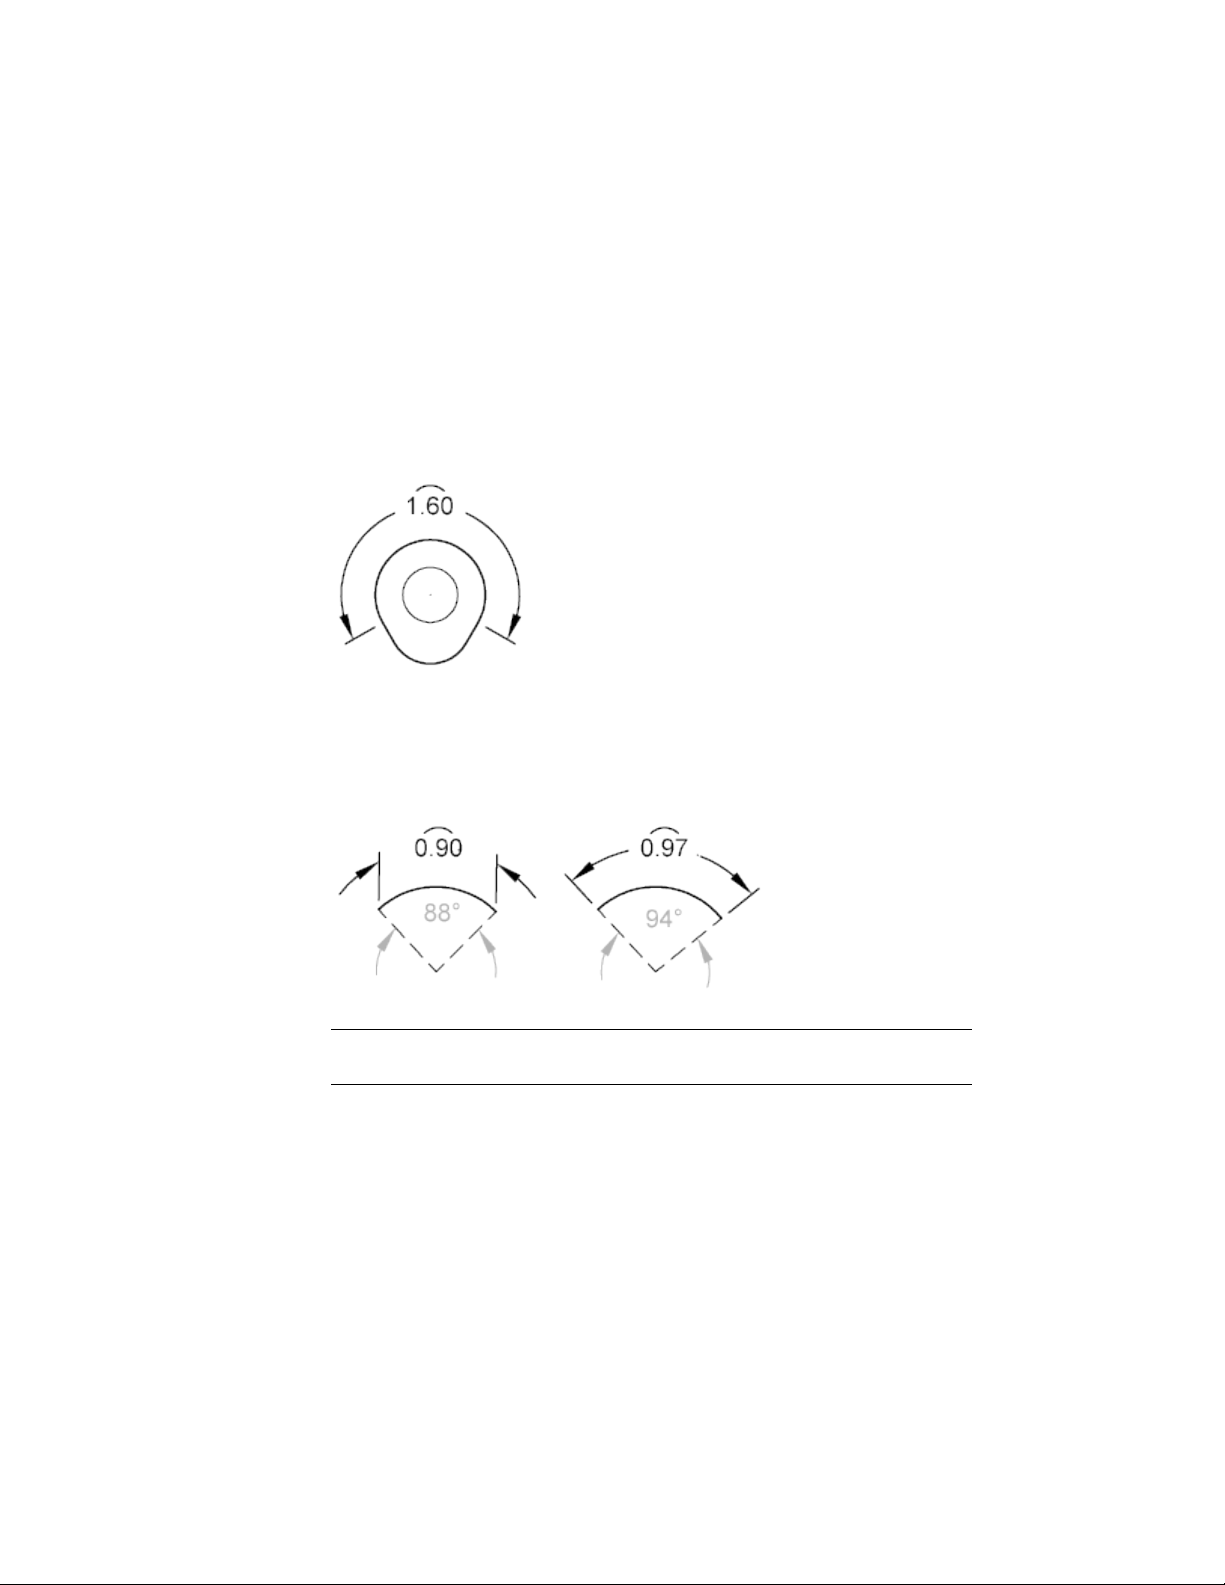
Create Arc Length Dimensions
Arc length dimensions measure the distance along an arc or polyline arc
segment.
Typical uses of arc length dimensions include measuring the travel distance
around a cam or indicating the length of a cable. To differentiate them from
linear or angular dimensions, arc length dimensions display an arc symbol
by default.
The arc symbol, also called a hat or cap, is displayed either above the dimension
text or preceding the dimension text. The placement style can be changed on
the New/Modify Dimension Style dialog box, Symbols and Arrows tab.
The extension lines of an arc length dimension can be orthogonal or radial.
NOTE Orthogonal extension lines are displayed only when the included angle of
the arc is less than 90 degrees.
Modify Existing Dimensions
You can modify all components of the existing dimension objects in a drawing
either individually or by using dimension styles.
596 | Chapter 9 Annotate Drawings

Modify A Dimension
Dimensions can be modified to include more information than just the values
of the dimension. Dimensions can also be modified visually by using breaks
and by adjusting the spacing between them.
Overview of Modifying Dimensions
After you place a dimension, there are times when you need to modify the
information that the dimension represents. You can add a jog line to a linear
dimension to indicate that the dimension value does not represent the actual
dimensioned value or add an inspection dimension to represent how often a
dimension value of a manufactured part should be checked.
At times you might want to modify a dimension to simply improve readability.
You can make sure that the extension or dimension lines do not obscure any
objects; you can reposition dimension text; and you can adjust the placement
of linear dimensions so they are evenly spaced.
The easiest way to modify dimensions individually is to use the
multi-functional dimension grips.
Modify Dimension Geometry
You can modify dimensions with the editing commands and with grip editing.
Grip editing is the quickest and easiest way to modify dimensions. How you
edit dimensions depends on whether the dimension is associative.
Modify Associative Dimensions
Associative dimensions retain their associativity to dimensioned objects
through many editing commands if both the dimension and the associated
geometry are selected and operated on with a single command. For example,
if a dimension and its associated geometry are moved, copied, or arrayed in
the same command, each dimension retains associativity with its respective
geometry.
In some circumstances, dimensions are automatically disassociated, including
■ If the associated geometric object is erased
Dimensions and Tolerances | 597

■ If the associated geometric object undergoes a boolean operation such as
UNION or SUBTRACT
■ If grip editing is used to stretch a dimension parallel to its dimension line
■ If the association to a geometric object is specified using the Apparent
Intersection object snap, and the geometric object is moved so that the
apparent intersection no longer exists
In other circumstances, a dimension may become partially associated. For
example, if a linear dimension is associated with the endpoints of two
geometric objects and one of the objects is erased, the remaining association
is preserved. The disassociated end of the linear dimension may then be
associated with another geometric object using DIMREASSOCIATE.
NOTE The Command prompt displays a warning message if a dimension is
disassociated.
Modify Non-associative Dimensions
For non-associative dimensions, when you edit dimensioned objects, you
must include the relevant dimension definition points in the selection set, or
the dimension is not updated. Definition points determine the dimension
location. For example, to stretch a dimension, you must include the appropriate
definition points in the selection set. You can easily include them by turning
on grips and selecting the object so that the grips are highlighted.
The definition points for each type of dimension are indicated in the following
illustrations. The middle point of the dimension text is a definition point for
all dimension types.
598 | Chapter 9 Annotate Drawings
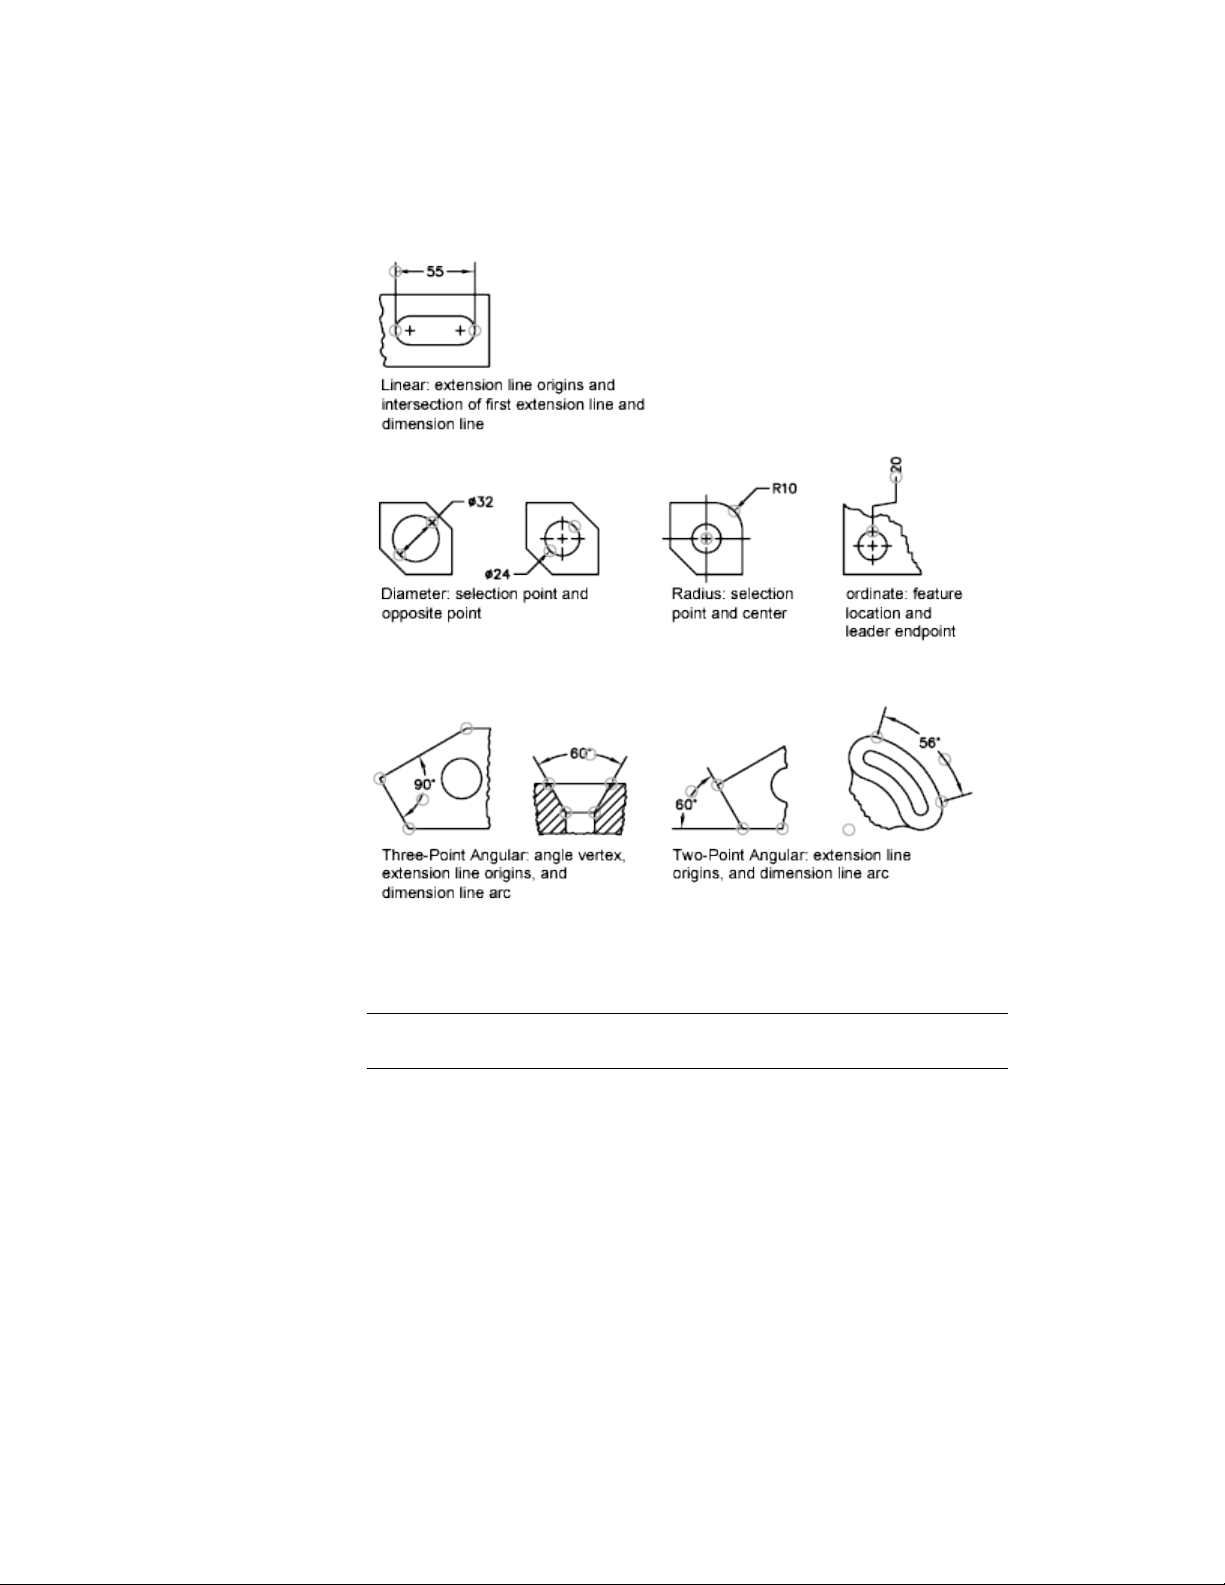
If no angle vertex is shown, definition points are placed at the ends of the
lines that form the angle. In the two-line angular example, a definition point
is placed at the center point of the dimensioned arc.
NOTE Definition points are drawn on a special layer named DEFPOINTS, which
is not printed.
Use Dimension Line Grips
Hover over the grip on the endpoint of a dimension line to quickly access the
following functionality:
■ Stretch. Stretches the extension lines to move the dimension line farther
away or closer to the object being dimensioned. Use command line prompts
Dimensions and Tolerances | 599

to specify a different base point or copy the dimension line. This is the
default grip behavior.
■ Continue dimension. Invokes the DIMCONTINUE command.
■ Baseline dimension. Invokes the DIMBASELINE command.
■ Flip arrow. Flips the direction of the dimension arrowhead.
Modify Exploded Dimensions
You can edit exploded dimensions as you would any other objects because
an exploded dimension is a collection of separate objects: lines, 2D solids, and
text. Occasionally you may need to explode a dimension to make changes
such as creating a break in a dimension line or extension line. Once a
dimension is exploded, you cannot reassociate the dimension into a dimension
object.
See also:
Overview of Modifying Dimensions (page 597)
Change Dimension Associativity (page 600)
Control Dimension Geometry (page 566)
Change Dimension Associativity
You may need to change the associativity of dimensions in several
circumstances including adding associativity to dimensions created in previous
releases.
You may need to change the associativity of dimensions in several
circumstances such as the following:
■ Redefine the associativity of dimensions in drawings that have been edited
significantly.
■ Add associativity to dimensions that have been partially disassociated.
■ Add associativity to dimensions in legacy drawings.
■ Remove associativity from dimensions in drawings that will be used by
people working in releases prior to AutoCAD 2002, but who do not want
any proxy objects in the drawings.
600 | Chapter 9 Annotate Drawings

Reassociate Dimensions to Different Objects
With DIMREASSOCIATE, you can select one or more dimensions and step
through the extension-line origin points of each dimension. For each
extension-line origin point, you can specify a new association point on a
geometric object. Association points determine the attachment of extension
lines to locations on geometric objects.
NOTE When you create or modify associative dimensions, it is important to locate
their association points carefully so that if you make a future design change, the
geometric objects that you change will also change the dimensions associated
with them.
When you use the DIMREASSOCIATE command, a marker is displayed that
indicates whether each successive extension line origin point of the dimension
is associative or nonassociative. A square with an X in it means that the point
is associated with a location on an object, while an X without the square
means that the point is not associated with an object. Use an object snap to
specify the new association for the extension-line origin point or press Enter
to skip to the next extension-line origin point.
NOTE The marker disappears if you pan or zoom.
Change Non-associative Dimensions to Associative
You can change all the non-associative dimensions in a drawing to associative.
Select all non-associative dimensions, and then use DIMREASSOCIATE to step
through the dimensions, associating each one with locations on geometric
objects.
Change Associative Dimensions to Non-associative
You can change all associative dimensions in a drawing to nonassociative
dimensions. Select all associative dimensions, and then use DIMDISASSOCIATE
to convert them into nonassociative dimensions.
See also:
Associative Dimensions (page 563)
Save Drawings to Previous Drawing File Formats (page 699)
Dimensions and Tolerances | 601
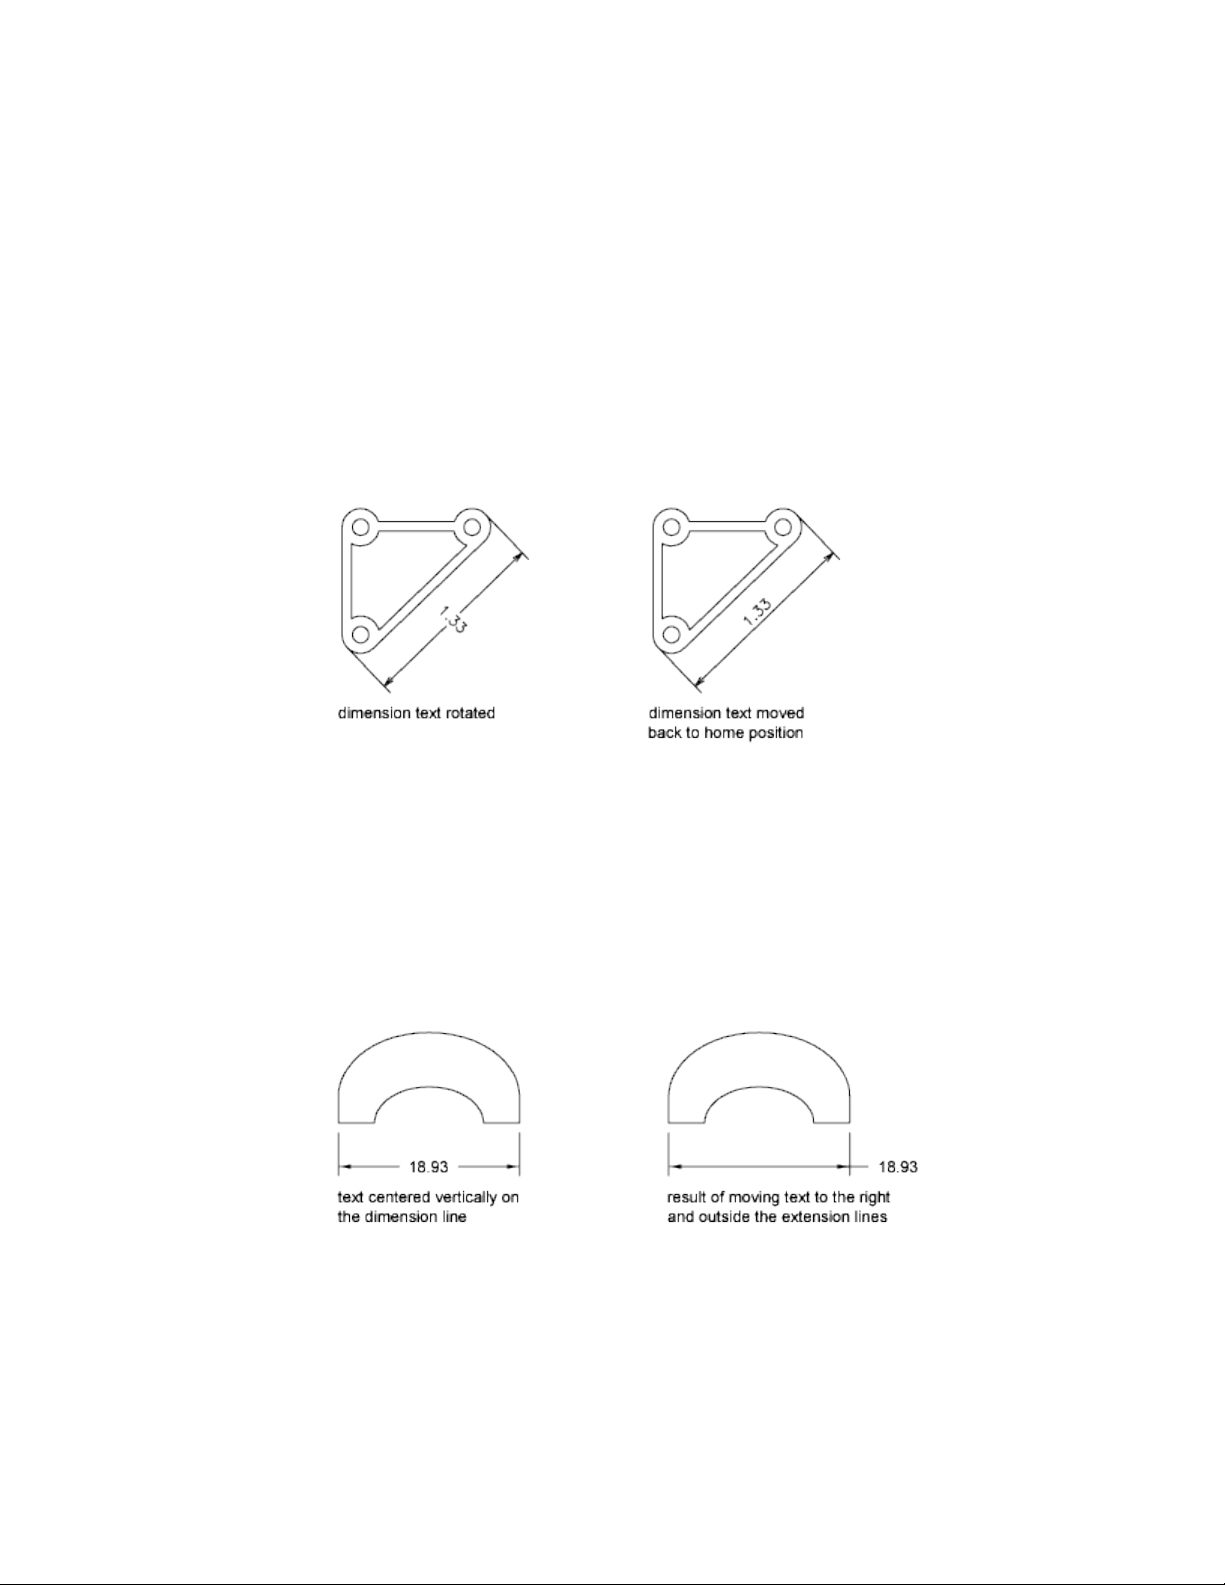
Modify Dimension Text
Once you've created a dimension, you can change the location and orientation
of the existing dimension text or replace it with new text.
Once you've created a dimension, you can rotate the existing text or replace
it with new text. You can move the text to a new location or back to its home
position, which is the position defined by the current dimension style. In the
following illustration, the home position is above and centered on the
dimension line.
When you rotate or replace dimension text, you specify the change first, for
example, rotating the text to be at an angle. When you move dimension text,
you select a single dimension to move.
You can move dimension text to the left, right, or center along the dimension
line or to any position inside or outside the extension lines. A quick and simple
way to do this is by using grips. If you move text up or down, the current
vertical alignment of the text relative to the dimension line is not changed,
so the dimension and extension lines are modified accordingly. The following
illustration shows the result of moving text down and to the right. The text
remains centered vertically in relation to the dimension line.
602 | Chapter 9 Annotate Drawings

Use Dimension Text Grips
Hover over a dimension text grip to quickly access the following functionality:
■ Stretch. This is the default grip behavior:
■ If the text is positioned on the dimension line, Stretch moves the
dimension line farther away or closer to the object being dimensioned.
Use command line prompts to specify a different base point or copy
the dimension line.
■ If the text is positioned away from the dimension line, with or without
a leader, Stretch moves the text without moving the dimension line.
■ Move with Dim Line. Positions text on the dimension line, and moves
the dimension line farther away or closer to the object being dimensioned
(no additional prompts).
■ Move Text Only. Positions the dimension text without moving the
dimension line.
■ Move with Leader. Positions the dimension text with a leader line to
the dimension line.
■ Above Dim Line. Positions the dimension text above the dimension line
(left of the dimension line for vertical dimensions).
■ Center Vertically. Positions the dimension text so that the dimension
line cuts through the vertical center of the text.
■ Reset Text Position. Positions the dimension text back to its default (or
“home”) position based on the active dimension style.
See also:
Control Dimension Text (page 571)
Overview of Modifying Dimensions (page 597)
Dimension Jog
Jog lines are used to represent a dimension value that does not display the
actual measurement in a linear dimension. Typically, the actual measurement
value of the dimension is smaller than the displayed value.
The jog is made up of two parallel lines and a cross line that forms two
40-degree angles. The height of the jog is determined by the linear jog size
value of the dimension style.
Dimensions and Tolerances | 603
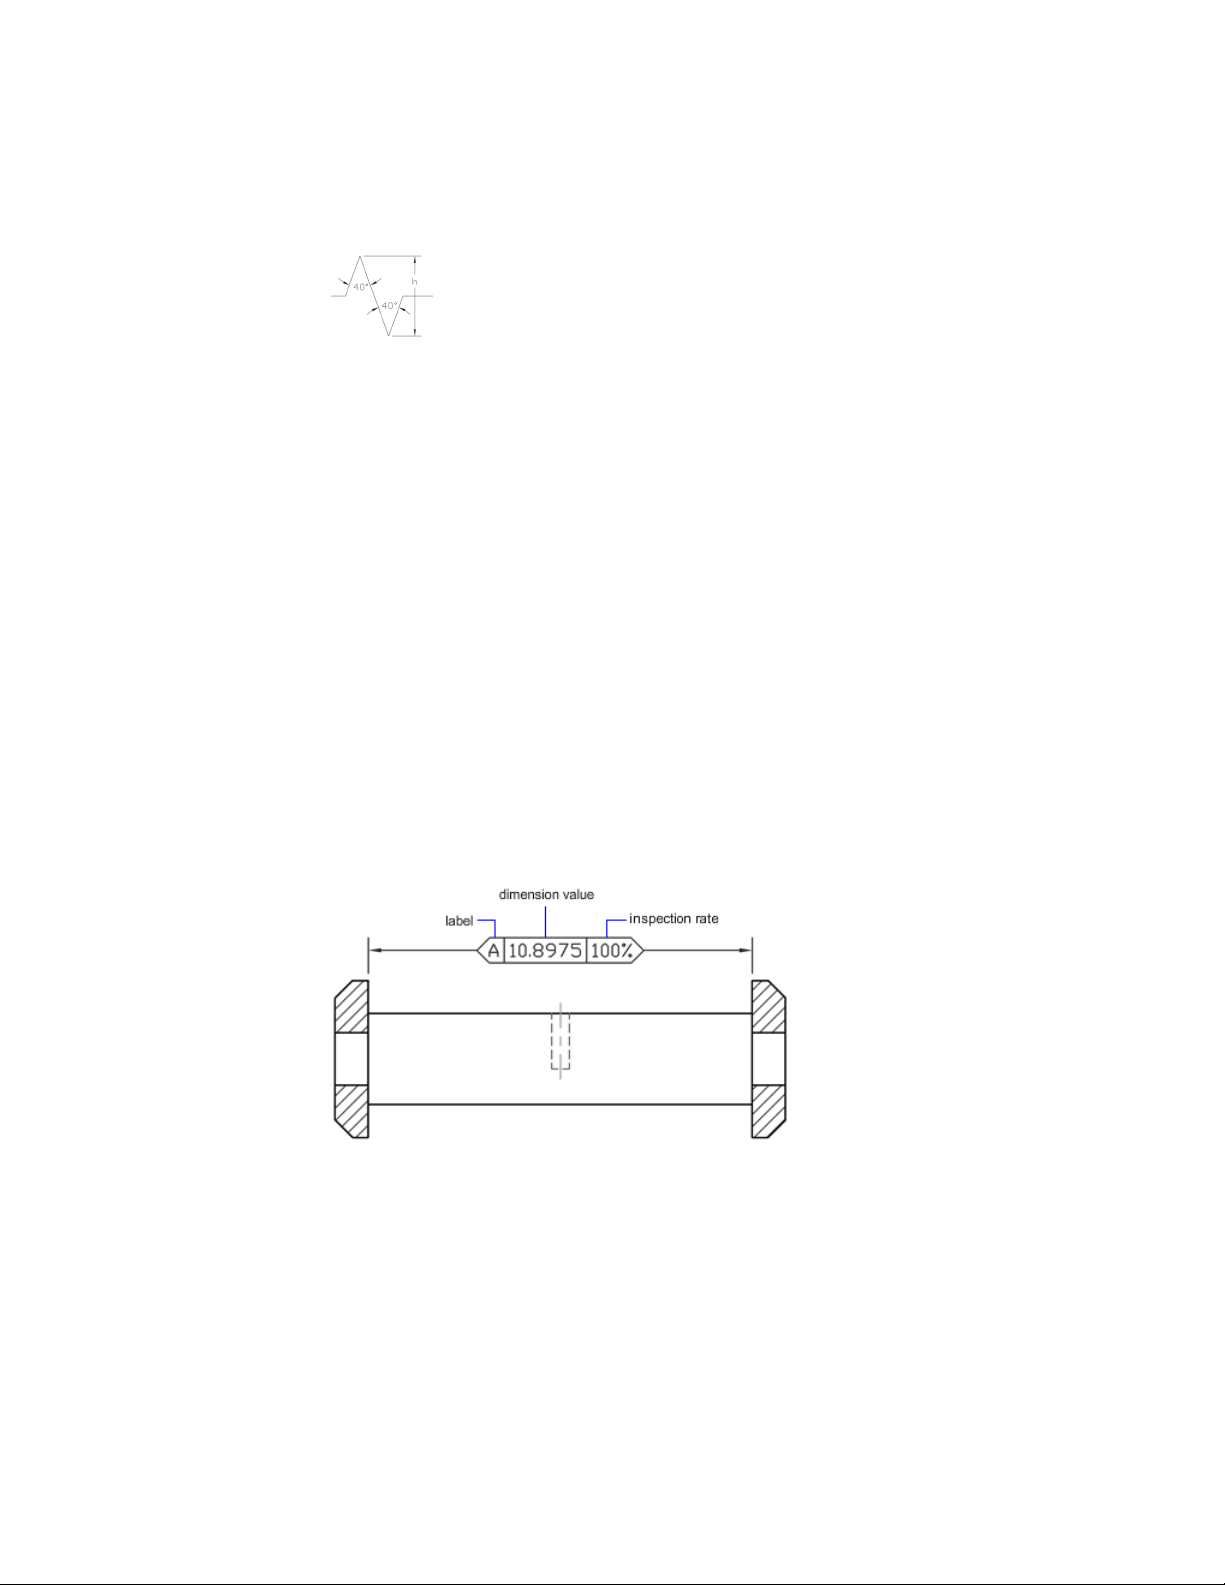
Once you add a jog to a linear dimension, you can position it by using grips.
To reposition the jog, select the dimension and then select the grip. Move the
grip to another point along the dimension line. You can also adjust the height
of the jog symbol on a linear dimension on the Properties Inspector under
Lines & Arrows.
Convert Dimensions into Inspection Dimensions
Inspection dimensions allow you to effectively communicate how frequently
manufactured parts should be checked to ensure that the dimension value
and tolerances of the parts are within the specified range.
When working with parts that need to met a specific tolerance or dimension
value before installing them into the final assembled product, you can use an
inspection dimension to specify how often the part should be tested.
You can add an inspection dimension to any type of dimension object; it is
composed of a frame and text values. The frame for an inspection dimension
is made up of two parallel lines and the end is round or square. The text values
are separated by vertical lines. An inspection dimension can contain up to
three different fields of information: inspection label, dimension value, and
inspection rate.
Inspection Dimension Fields
Inspection Label Text used to identify individual inspection dimensions. The
label is located in the leftmost section of the inspection dimension.
604 | Chapter 9 Annotate Drawings
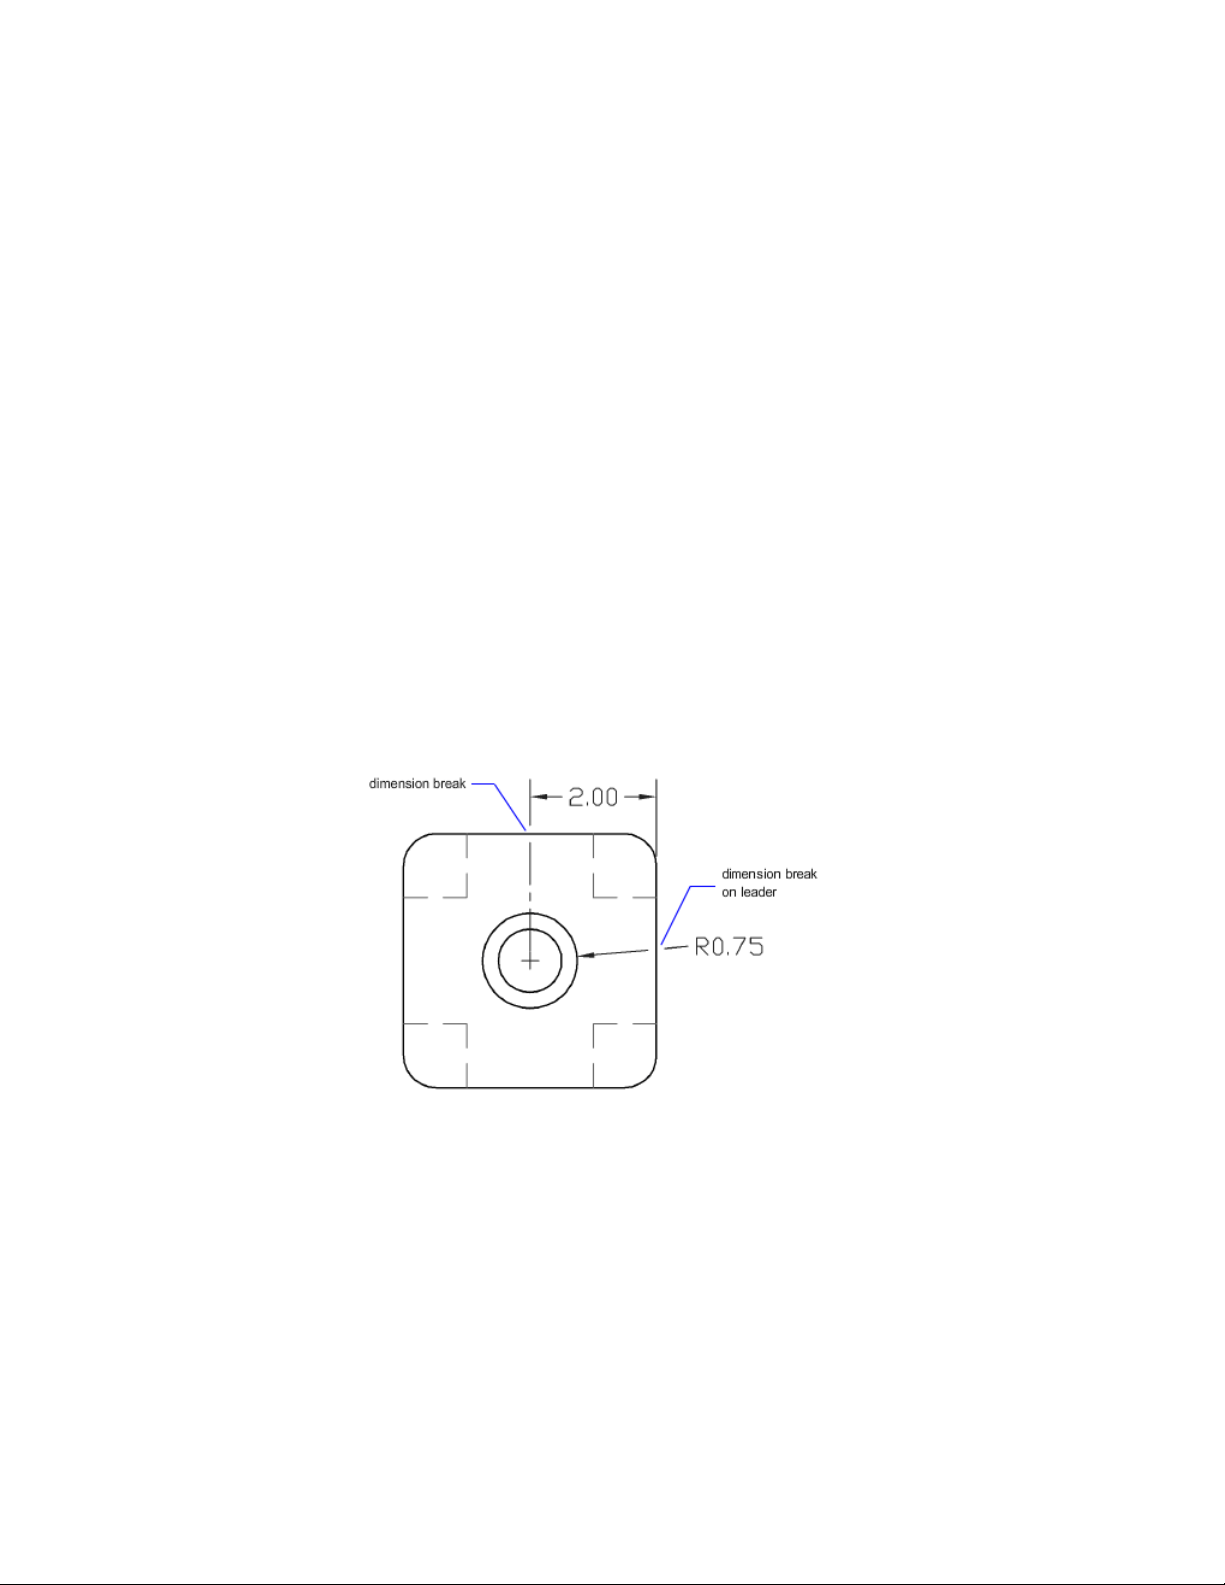
Dimension Value Dimension value that is displayed is the same value before
the inspection dimension is added. The dimension value can contain
tolerances, text (both prefix and suffix), and the measured value. The
dimension value is located in the center section of the inspection dimension.
Inspection Rate Text used to communicate the frequency that the dimension
value should be inspected, expressed as a percentage. The rate is located in
the rightmost section of the inspection dimension.
You can add inspection dimensions to any type of dimension. The current
values of an inspection dimension are displayed on the Properties Inspector,
under Misc. The values include the properties that are used to control the look
of the frame, and the text for both the label and rate values.
Break a Dimension Line
With dimension breaks, you can keep the dimension, extension, or leader
lines from appearing as if they are a part of the design.
Dimension breaks can be added to a dimension or a multileader automatically
or manually. The method that you choose to place dimension breaks depends
on the number of objects that intersect a dimension or multileader.
You can add dimension breaks to the following dimension and leader objects:
■ Linear dimensions, including aligned and rotated
■ Angular dimensions, including 2- and 3-point
■ Radial dimensions, including radius, diameter, and jogged
■ Arc length dimensions
Dimensions and Tolerances | 605
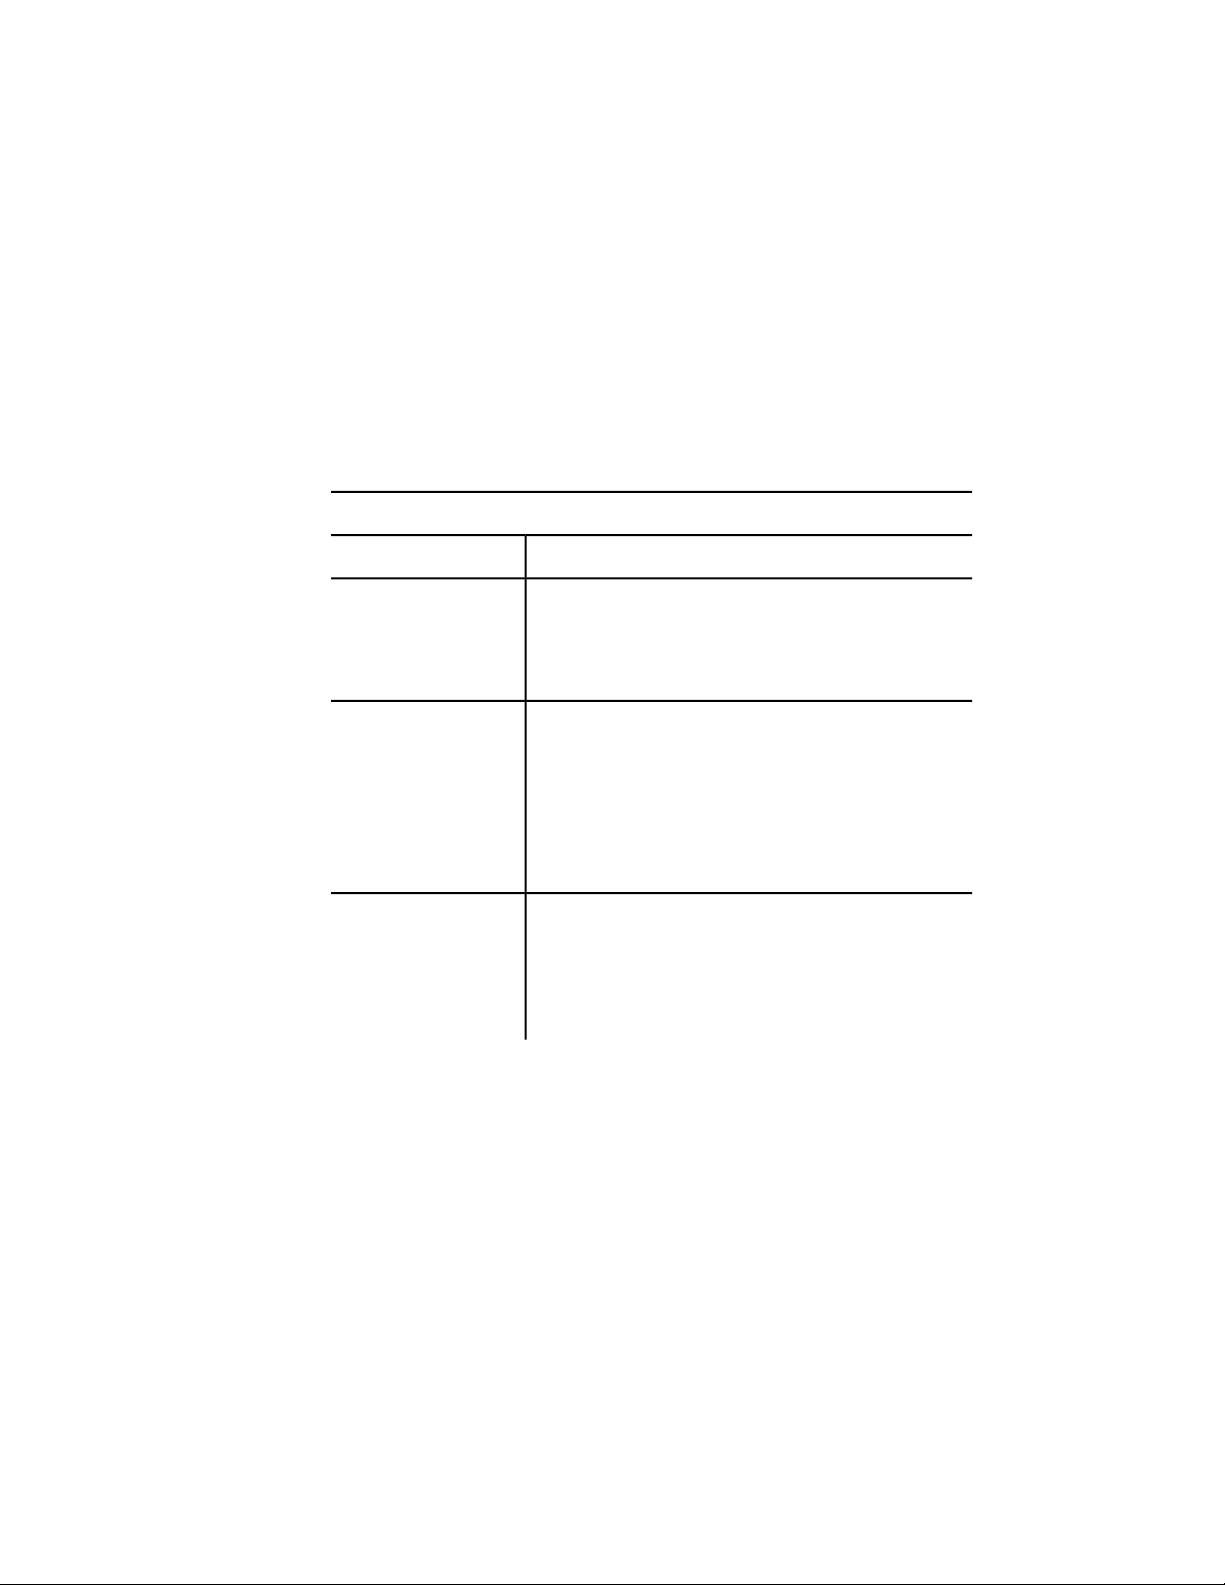
■ Ordinate dimensions
■ Multileaders that use straight-line leaders
The following dimension and leader objects do not support dimension breaks:
■ Multileaders that use spline leaders
■ Leaders created with the LEADER command
The following table explains the conditions where dimension breaks do not
work or are not supported.
Dimension Break Exceptions
DescriptionCondition
Dimension breaks on dimensions or multileaders in xrefs and
blocks are not supported. However, the objects in an xref or
No break in xrefs or
blocks
block can be used as the cutting edges for dimension breaks
on dimensions or multileaders that are not in an xref or block.
Dimension breaks cannot be placed on an arrowhead or the
dimension text. If you want a break to appear at the dimension
No break on arrowhead
and dimension text
text, it is recommended to use the background mask option.
If the intersecting point of an object and the dimension are
at the arrowhead or dimension text, the break will not be
displayed until the intersecting object, or dimension or mul-
tileader are moved.
Automatic breaks are not supported for objects and dimen-
sions or multileaders that are in different spaces. In order to
No break on trans-spatial
dimensions
break a dimension or multileader that is in a different space,
you need to use the Manual option of the DIMBREAK com-
mand.
You can also remove dimension breaks from dimensions or multileaders with
the Remove option of DIMBREAK. When removing them, all dimension breaks
are removed from the selected dimension or multileader, but you can always
add them back individually.
The following objects can be used as cutting edges when adding a dimension
break:
■ Dimension
606 | Chapter 9 Annotate Drawings

■ Leader
■ Line
■ Circle
■ Arc
■ Spline
■ Ellipse
■ Polyline
■ Text
■ Multiline text
■ Blocks but limited to the previously mentioned objects in this list
■ Xrefs but limited to the previously mentioned objects in this list
Automatic Dimension Breaks
To create dimension breaks automatically, you select a dimension or
multileader, and then use the Auto option of the DIMBREAK command.
Automatic dimension breaks are updated any time the dimension or
multileader, or intersecting objects are modified.
Dimension Break Gap Size
You control the size of dimension breaks on the New/Modify Dimension Style
dialog box, Symbols and Arrows tab. The specified size is affected by the
dimension break size, dimension scale, and current annotation scale for the
current viewport. For more information about annotation scaling, see Scale
Annotations (page 490).
Dimension Break Created by Selecting an Object
Instead of placing a dimension break for each object that intersects a dimension
or multileader, you can specify which of the intersecting objects to use.
Dimension breaks that are added by selecting individual intersecting objects
are updated any time the dimension or multileader, or intersecting objects
are modified.
Dimension Break Created by Picking Two Points
You can place a dimension break by picking two points on the dimension,
extension, or leader line to determine the size and placement of the break.
Dimensions and Tolerances | 607
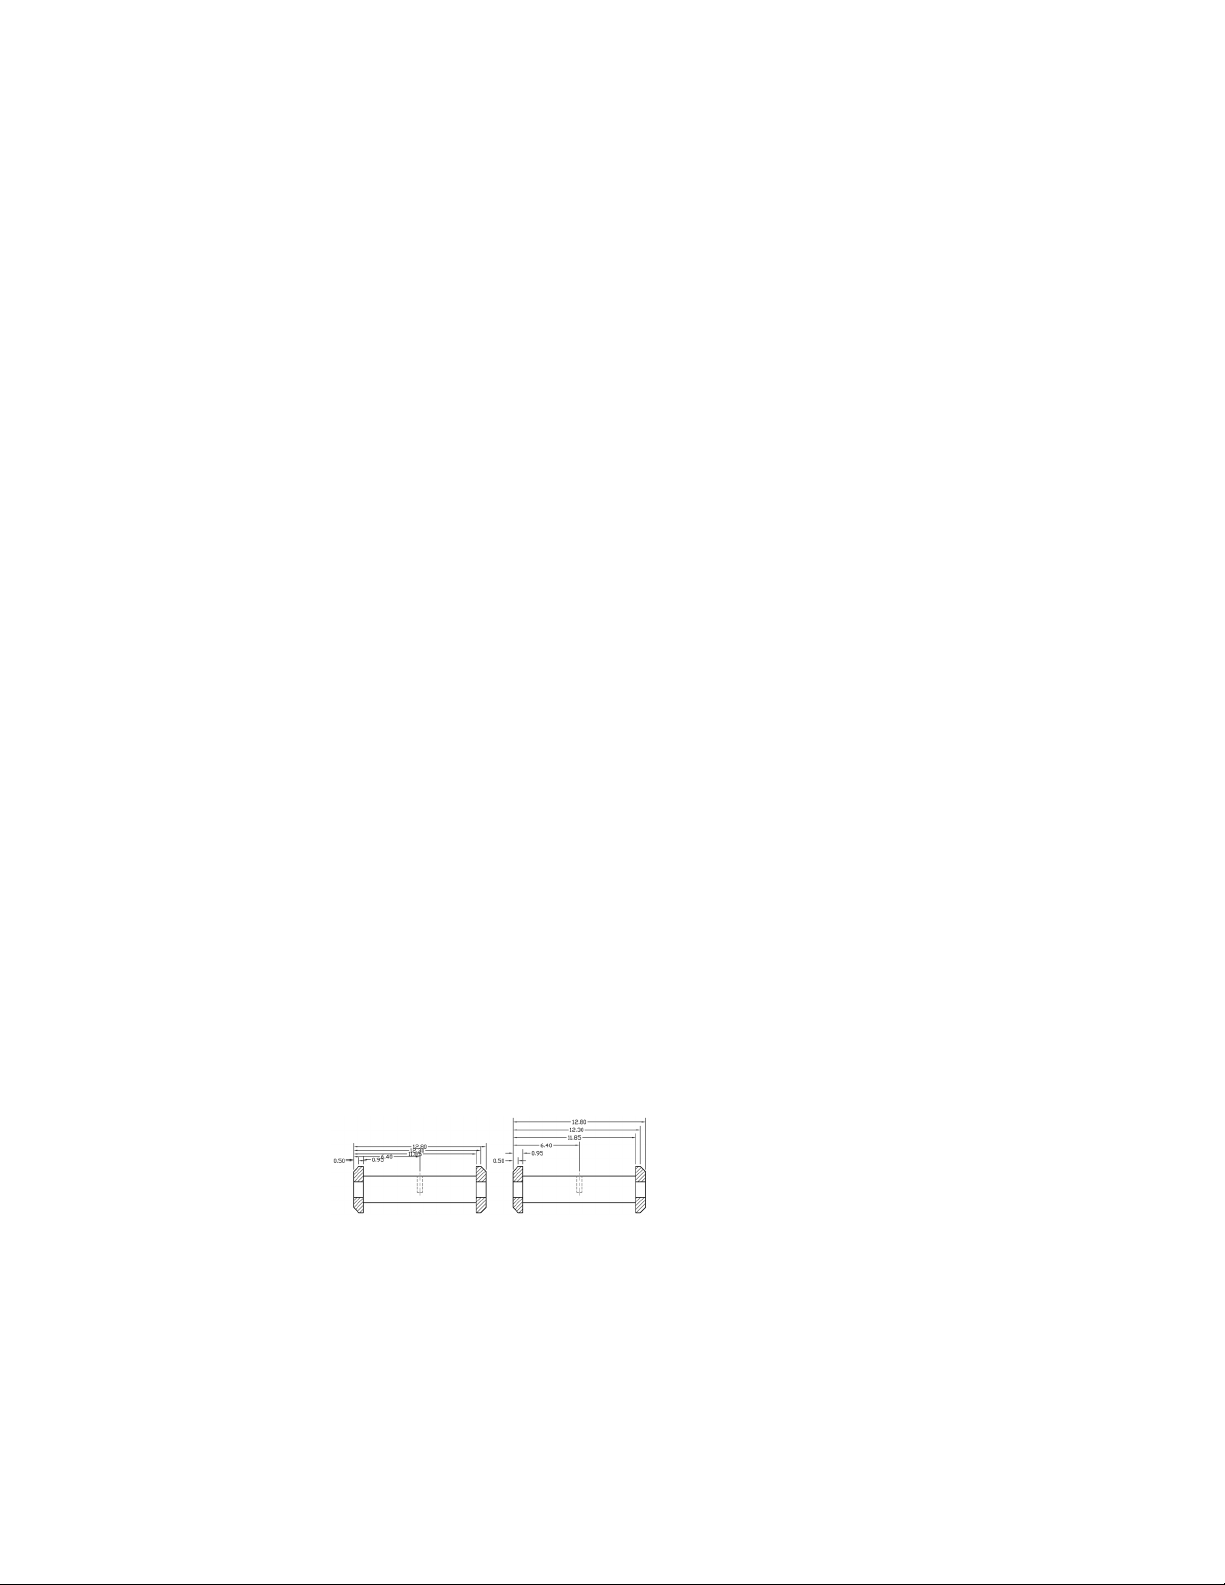
Dimension breaks that are added manually by picking two points are not
automatically updated if the dimension or multileader, or intersecting object
is modified.
So if a dimension or multileader with a manually added dimension break is
moved or the intersecting object is modified, you might have to restore the
dimension or multileader, and then add the dimension break again. The size
of a dimension break that is created by picking two points is not affected by
the current dimension scale or annotation scale value for the current viewport.
Adjust Dimension Spacing
You can automatically adjust existing parallel linear and angular dimensions
in a drawing so they are equally spaced or aligned at the dimension line with
each other.
Parallel linear and angular dimensions can be created in a number of different
ways in a drawing. With the DIMLINEAR and DIMANGULAR commands you
can place one dimension at a time; you can use the DIMBASELINE and
DIMCONTINUE commands to help place additional linear dimensions based
on the previous linear dimension placed.
The DIMBASELINE command uses the DIMDLI system variable to create
equally spaced dimensions, but once the dimensions are placed, changing the
value of the system variable has no affect on the spacing of dimensions. If
you change the text size or adjust the scale for the dimensions, they remain
in the original position which can cause problems with overlapping dimension
lines and text.
You can space linear and angular dimensions that overlap or are not equally
spaced with the DIMSPACE command. The dimensions that are selected must
be linear or angular, of the same type (rotated or aligned), parallel or concentric
to one another, and on the extension lines of each other. You can also align
linear and angular dimensions by using a spacing value of 0.
The following illustration shows parallel linear dimensions that are not equally
spaced and then those that are equally spaced after using the DIMSPACE
command.
608 | Chapter 9 Annotate Drawings

Apply a New Dimension Style to Existing Dimensions
You can modify existing dimensions by applying a different dimension style.
If you make changes to a dimension style, you can choose whether to update
the dimensions associated with that dimension style.
When you create a dimension, the current dimension style is associated with
that dimension. The dimension retains this dimension style unless you apply
a new dimension style to it or set up dimension style overrides.
You can modify existing dimensions by applying a different dimension style.
If you make changes to a dimension style, you can choose whether to update
the dimensions associated with that dimension style.
You can restore an existing dimension style or apply the current dimension
style, including any dimension style overrides, to selected dimensions.
Override a Dimension Style
With dimension style overrides, you can temporarily change a dimensioning
system variable without changing the current dimension style.
A dimension style override is a change made to specific settings in the current
dimension style. It is equivalent to changing a dimensioning system variable
without changing the current dimension style.
You can define dimension style overrides for individual dimensions, or for
the current dimension style.
■ For individual dimensions, you may want to create overrides to suppress
a dimension's extension lines or modify text and arrowhead placement so
that they do not overlap drawing geometry without creating a different
dimension style.
■ You can also set up overrides to the current dimension style. All dimensions
you create in the style include the overrides until you delete the overrides,
save the overrides to a new style, or set another style current. For example,
if you choose Override in the Dimension Style Manager, and change the
color of extension lines on the Override Current Style dialog box, Lines
tab, the current dimension style remains unchanged. However, the new
value for color is stored in the DIMCLRE system variable. The next
dimension you create will have extension lines in the new color. You can
save the dimension style overrides as a new dimension style.
Dimensions and Tolerances | 609

Some dimension characteristics are common to a drawing or to a style of
dimensioning and are therefore suited to be permanent dimension style
settings. Others generally apply on an individual basis and can be applied
more effectively as overrides. For example, a drawing usually uses a single type
of arrowhead, so it makes sense to define the arrowhead type as part of the
dimension style. Suppression of extension lines, however, usually applies in
individual cases only and is more suited to a dimension style override.
There are several ways to set up dimension style overrides. You can change
options in the dialog boxes or change system variable settings at the Command
prompt. You reverse the override by returning the changed settings to their
original values. The overrides apply to the dimension you are creating and all
subsequent dimensions created with that dimension style until you reverse
the override or make another dimension style current.
Example: Change a Dimension Style Override at the Command Prompt
You can override the current dimension style while creating a dimension by
entering the name of any dimensioning system variable at any prompt. In
this example, the dimension line color is changed. The change affects
subsequent dimensions you create until you reverse the override or make
another dimension style current.
Command: dimoverride
Enter dimension variable name to override or [Clear
overrides]: dimclrd
Enter new value for dimension variable <BYBLOCK>: 5
Enter dimension variable name to override: Enter another dimension
variable name or press Enter
Select objects: Use an object selection method and press Enter when you
finish
Add Geometric Tolerances
You can add geometric tolerances that show acceptable deviations of form,
profile, orientation, location, and runout of a feature.
Overview of Geometric Tolerances
Geometric tolerances show acceptable deviations of form, profile, orientation,
location, and runout of a feature.
610 | Chapter 9 Annotate Drawings
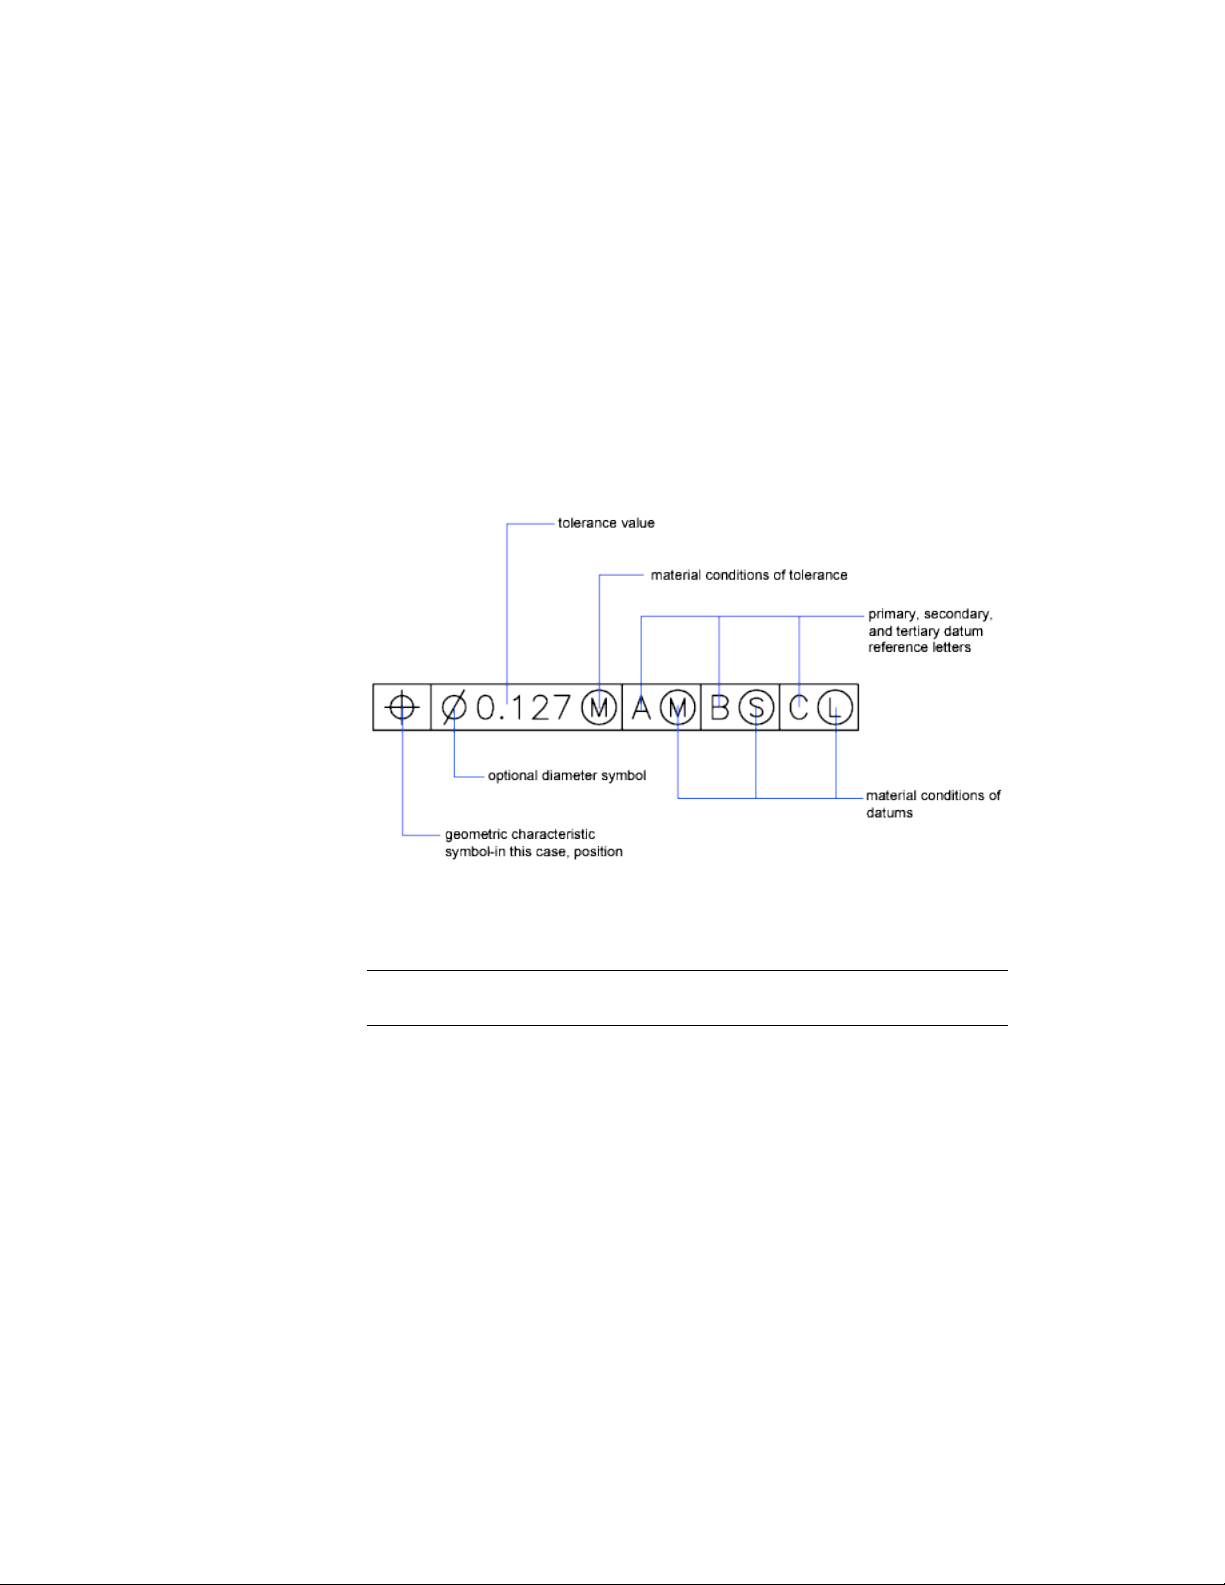
You add geometric tolerances in feature control frames. These frames contain
all the tolerance information for a single dimension. Geometric tolerances
can be created with or without leader lines, depending on whether you create
them with TOLERANCE or LEADER.
A feature control frame consists of two or more components. The first feature
control frame contains a symbol that represents the geometric characteristic
to which a tolerance is being applied, for example, location, profile, form,
orientation, or runout. Form tolerances control straightness, flatness, circularity
and cylindricity; profiles control line and surface. In the illustration, the
characteristic is position.
You can use most editing commands to change feature control frames, and
you can snap to them using the object snap modes. You can also edit them
with grips.
NOTE Unlike dimensions and leaders, geometric tolerances cannot be associated
with geometric objects.
You can also create annotative tolerances. For more information about creating
and working with an annotative tolerances, see Create Annotative Dimensions
and Tolerances (page 495).
See also:
Scale Annotations (page 490)
Create Annotative Dimensions and Tolerances (page 495)
Dimensions and Tolerances | 611

Material Conditions
Material conditions apply to features that can vary in size.
The second compartment contains the tolerance value. Depending on the
control type, the tolerance value is preceded by a diameter symbol and followed
by a material condition symbol.
Material conditions apply to features that can vary in size:
■ At maximum material condition (symbol M, also known as MMC), a feature
contains the maximum amount of material stated in the limits.
■ At MMC, a hole has minimum diameter, whereas a shaft has maximum
diameter.
■ At least material condition (symbol L, also known as LMC), a feature contains
the minimum amount of material stated in the limits.
■ At LMC, a hole has maximum diameter, whereas a shaft has minimum
diameter.
■ Regardless of feature size (symbol S, also known as RFS) means a feature can
be any size within the stated limits.
Datum Reference Frames
The tolerance values in the feature control frame are followed by up to three
optional datum reference letters and their modifying symbols.
A datum is a theoretically exact point, axis, or plane from which you make
measurements and verify dimensions. Usually, two or three mutually
perpendicular planes perform this task best. These are jointly called the datum
reference frame.
The following illustration shows a datum reference frame verifying the
dimensions of the part.
612 | Chapter 9 Annotate Drawings
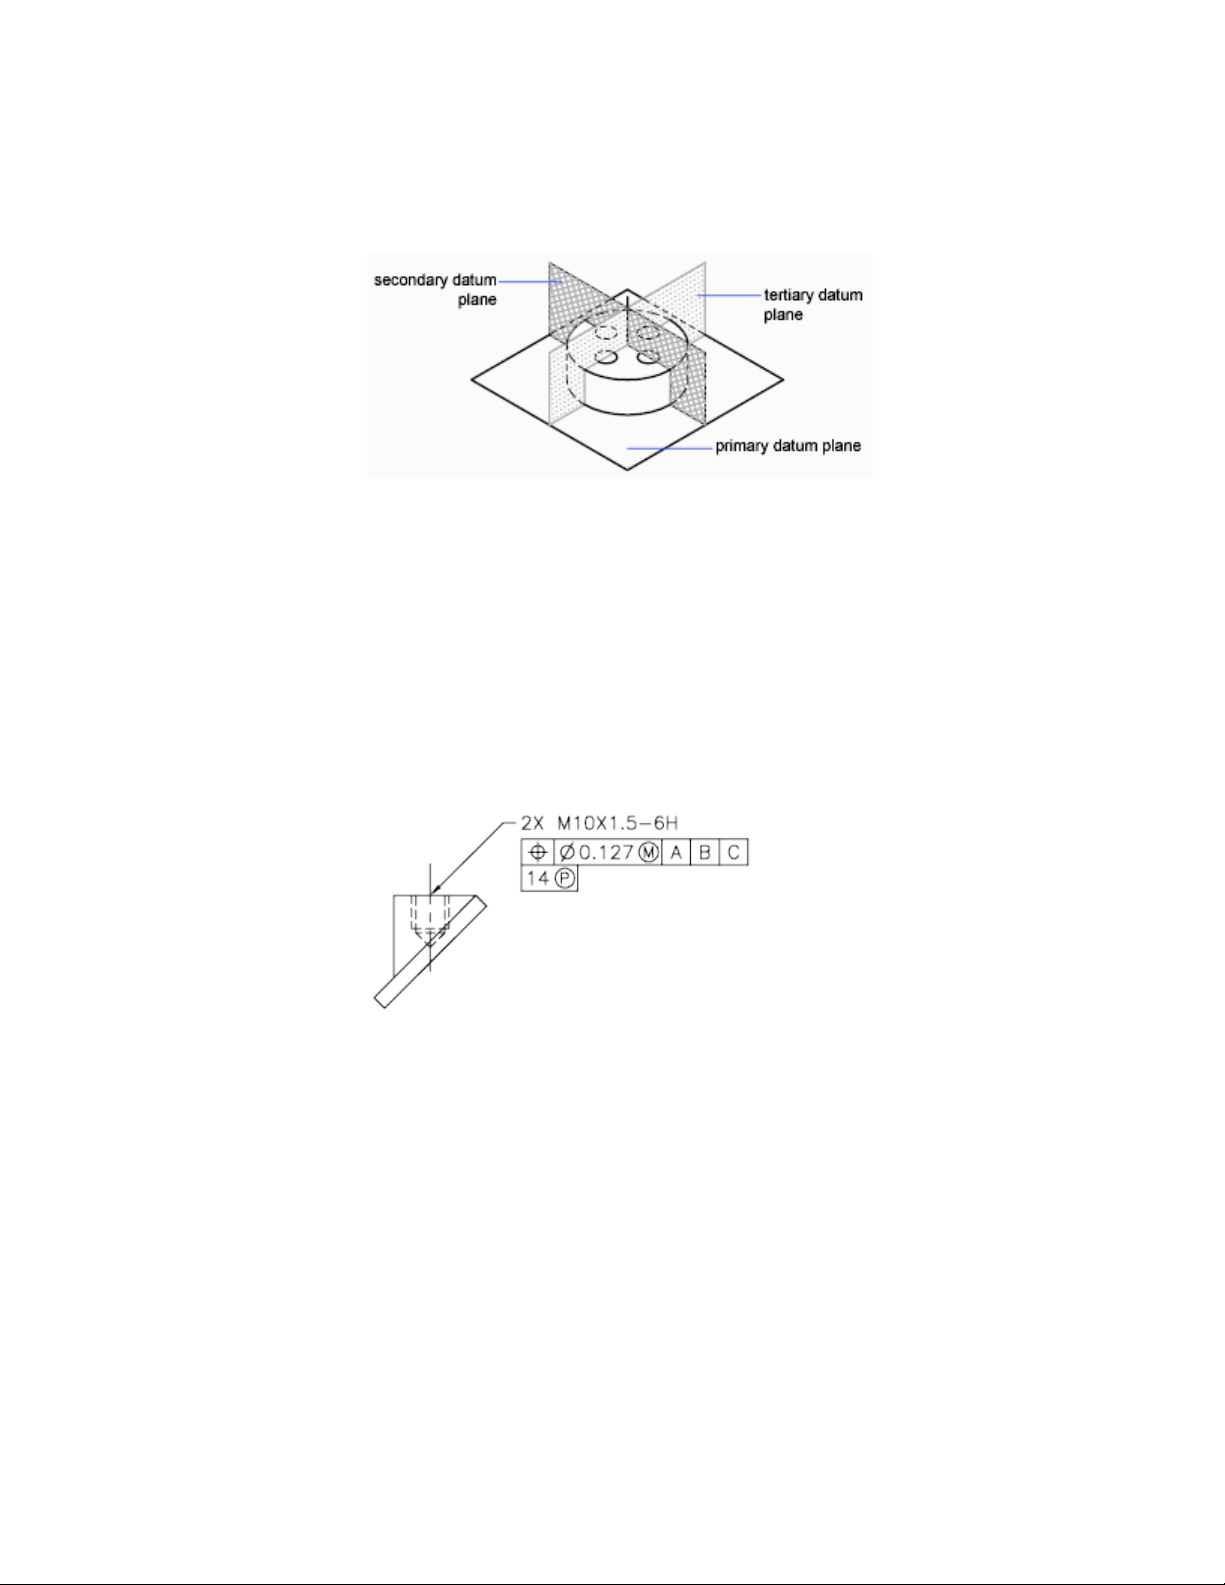
Projected Tolerance Zones
Projected tolerances are used to make the tolerance more specific.
Projected tolerances are specified in addition to positional tolerances to make
the tolerance more specific. For example, projected tolerances control the
perpendicularity tolerance zone of an embedded part.
The symbol for projected tolerance ( ) is preceded by a height value, which
specifies the minimum projected tolerance zone. The projected tolerance zone
height and symbol appear in a frame below the feature control frame, as shown
in the following illustration.
Composite Tolerances
A composite tolerance specifies two tolerances for the same geometric
characteristic of a feature or for features that have different datum
requirements. One tolerance relates to a pattern of features and the other
tolerance to each feature within the pattern. The individual feature tolerance
is more restrictive than the pattern tolerance.
Dimensions and Tolerances | 613
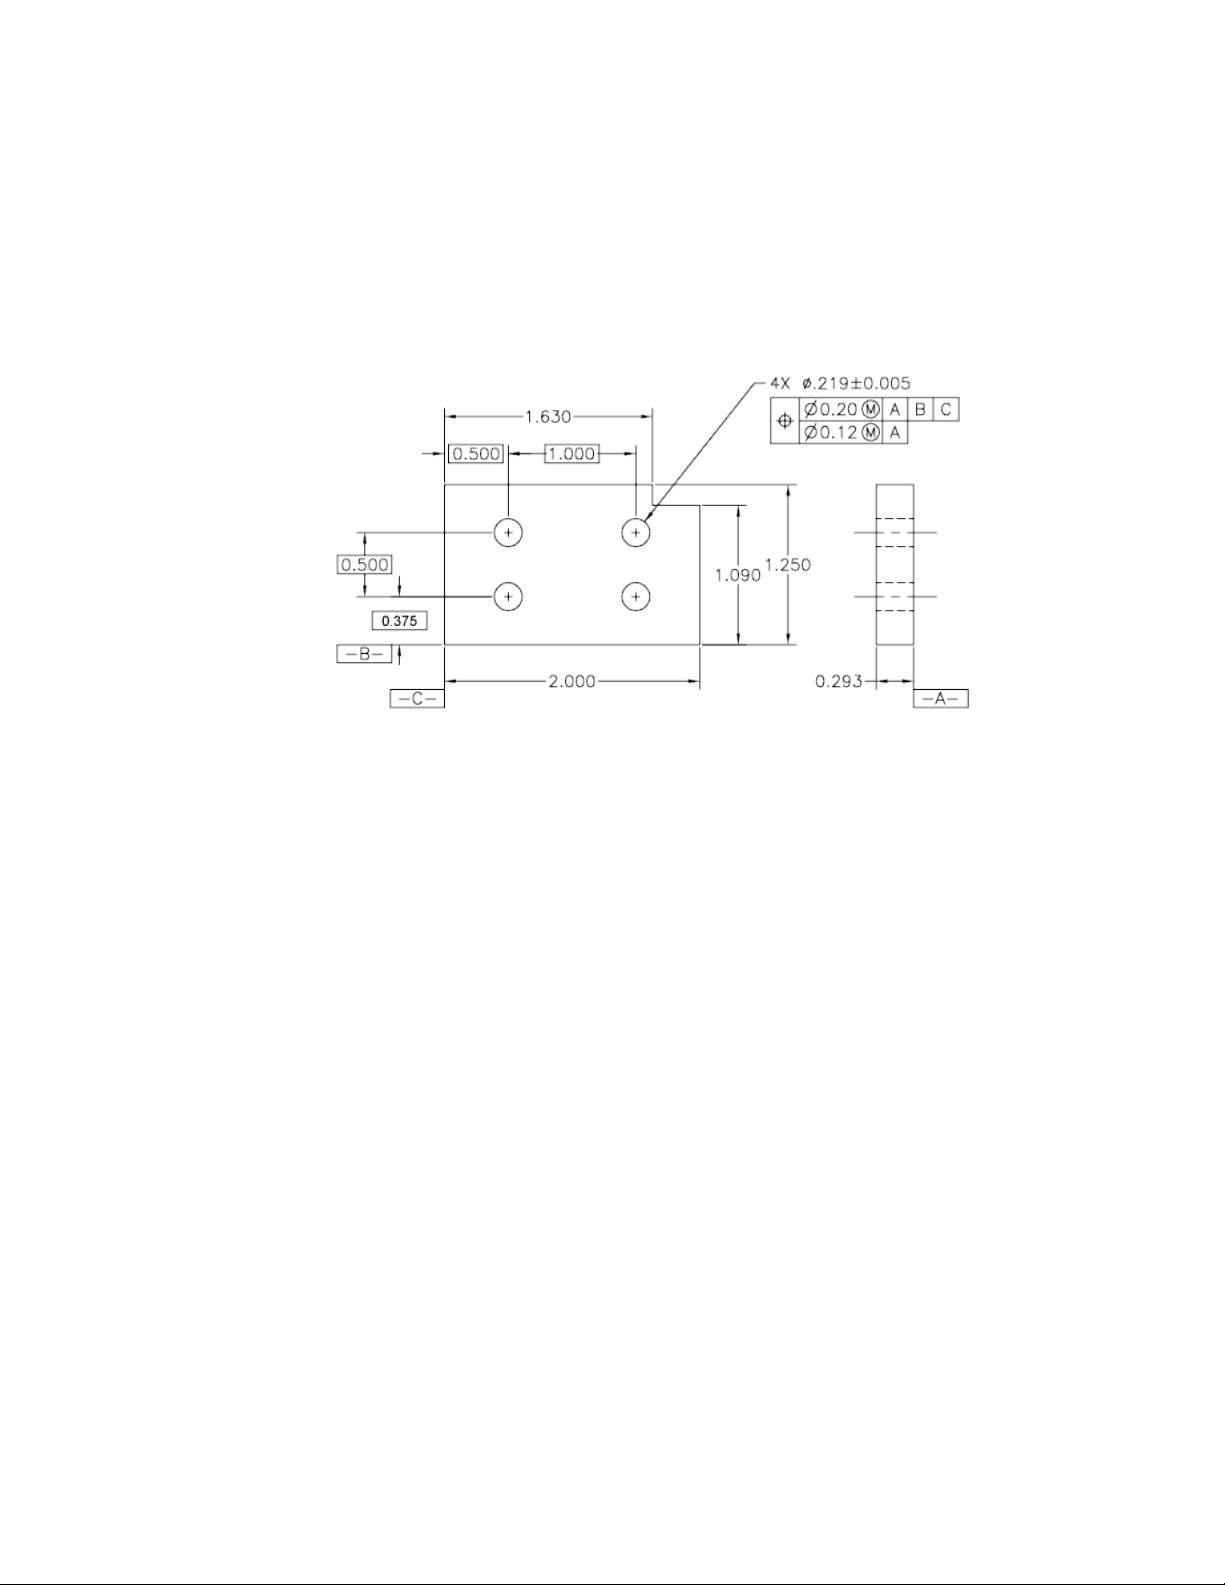
In the following illustration, the point where datums A and B intersect is called
the datum axis, the point from which the position of the pattern is calculated.
A composite tolerance could specify both the diameter of the pattern of holes
and the diameter of each individual hole, as in the following illustration.
When you add composite tolerances to a drawing, you specify the first line
of a feature control frame and then choose the same geometric characteristic
symbol for the second line of the feature control frame. The geometric symbol
compartment is extended over both lines. You can then create a second line
of tolerance symbols.
614 | Chapter 9 Annotate Drawings
Plot and Publish Draw-
ings
Specify Settings for Plotting
Before you plot a drawing, you must specify the settings that determine the
output. To save time, you can store these settings with the drawing as a named
page setup.
Save Plot Settings as Named Page Setups
If you want to plot the same layout more than one way, or if you want to specify
the same output options for several layouts, use named page setups.
Before you plot a drawing, you must specify the settings that determine the
appearance and format of the output. To save time, you can store these settings
with the drawing as a named page setup.
For example, when you access a layout for the first time, a single layout viewport
is displayed, and a dashed line indicates the printable area of the paper for the
currently configured paper size and printer or plotter.
10
615
In addition, the page setup also includes many other settings and options
such as
■ The orientation of the plot, portrait or landscape
■ The plot scale
■ Whether lineweights should be plotted
■ The shading style
By default, the first time you access a layout, it becomes initialized, and a
default page setup is assigned to it. Default page setups are assigned names
such as *model*, *layout1*, *layout2*, and so on.
Reuse Named Page Setups
You can save plot device and other page setup settings as named page setups
that can be modified and imported into other drawings.
Named page setups are saved in the current drawing file and can be imported
into other drawing files and applied to other layouts.
If you want to plot the same layout more than one way, or if you want to
specify the same output options for several layouts, use named page setups.
You can apply a named page setup to model space or to a layout using the
Page Setup Manager. Other options available in the Page Setup Manager include
■ Apply a named page setup saved with one layout to another layout in the
same drawing
■ Modify the settings of a page setup at any time
■ Import a named page setup from another drawing, and apply it to layouts
in the current drawing
You can also apply different named page setups to the same layout to achieve
specific results when plotting. For example, you might create the named page
setups in the following table to control scaling and paper size.
DescriptionPage setup name
Plot at scale 1:1, E-size sheetNoScaling
Plot at scale 1:2, C-size sheetScale 1 to 2
616 | Chapter 10 Plot and Publish Drawings
DescriptionPage setup name
Plot to the draft-quality plotterDraft
Plot to the high-quality plotterFinal
Fit to Paper, A-size sheetFit-to-Paper
Once you specify a named page setup for a layout, whenever you plot the
layout, it is plotted with the settings you specified.
Specify Page Setup Settings
Page setups are associated with model space and with layouts, and are saved
in the drawing file. The settings specified in a page setup determine the
appearance and format of your final output.
Select a Printer or Plotter for a Layout
To print a layout, select a printing or plotting device in the Page Setup dialog
box. You can also view details about the name and location of the device, and
change the device's configuration.
The printer or plotter you select in the Page Setup dialog box determines the
printable area of the layout. This printable area is indicated by the dashed line
in the layout. If you change the paper size or the printing or plotting device,
it may change the printable area of your drawing page.
See also:
Select a Printer or Plotter (page 624)
Select a Paper Size for a Layout
You can select a paper size from a standard list, or you can add custom paper
sizes using the Page Setup dialog box or Print dialog box.
You can select a paper size from a standard list. The paper sizes available in
the list are determined by the plot device that is currently selected for the
Specify Settings for Plotting | 617

layout. If your plotter is configured for raster output, you must specify the
output size in pixels.
Determine the Drawing Orientation of a Layout
You can specify the orientation of the drawing on the paper using the
Landscape and Portrait settings.
Landscape orients the drawing on the paper so that the long edge of the paper
is horizontal, and Portrait orients the paper so that the short edge is horizontal.
Changing the orientation creates the effect of rotating the paper underneath
the drawing.
In either landscape or portrait orientation, you can select Plot Upside-Down
to control whether the top or bottom of the drawing is plotted first.
Although you can specify the drawing orientation in both the Page Setup
dialog box and the Print dialog box, the Page Setup settings are always saved
and reflected in the layout. In the Print dialog box, you can override the page
setup settings for a single plot; however, the settings you apply are not saved
in the layout.
If you change the drawing orientation, the layout origin remains in the
lower-left corner of the rotated page.
Set the Plot Area of a Layout
You can specify the plot area to determine what will be included in the plot.
When you prepare to plot from model space or a layout, you can specify the
plot area to determine what will be included in the plot. When you create a
new layout, the default Plot Area option is Layout. Layout plots all objects
within the printable area of the specified paper size.
The Display Plot Area option plots all the objects displayed in the drawing.
The Extents Plot Area option plots all the visible objects in the drawing. The
View Plot Area option plots a saved view. You can use the Window Plot Area
option to define an area to be plotted.
See also:
Specify the Area to Plot (page 624)
618 | Chapter 10 Plot and Publish Drawings
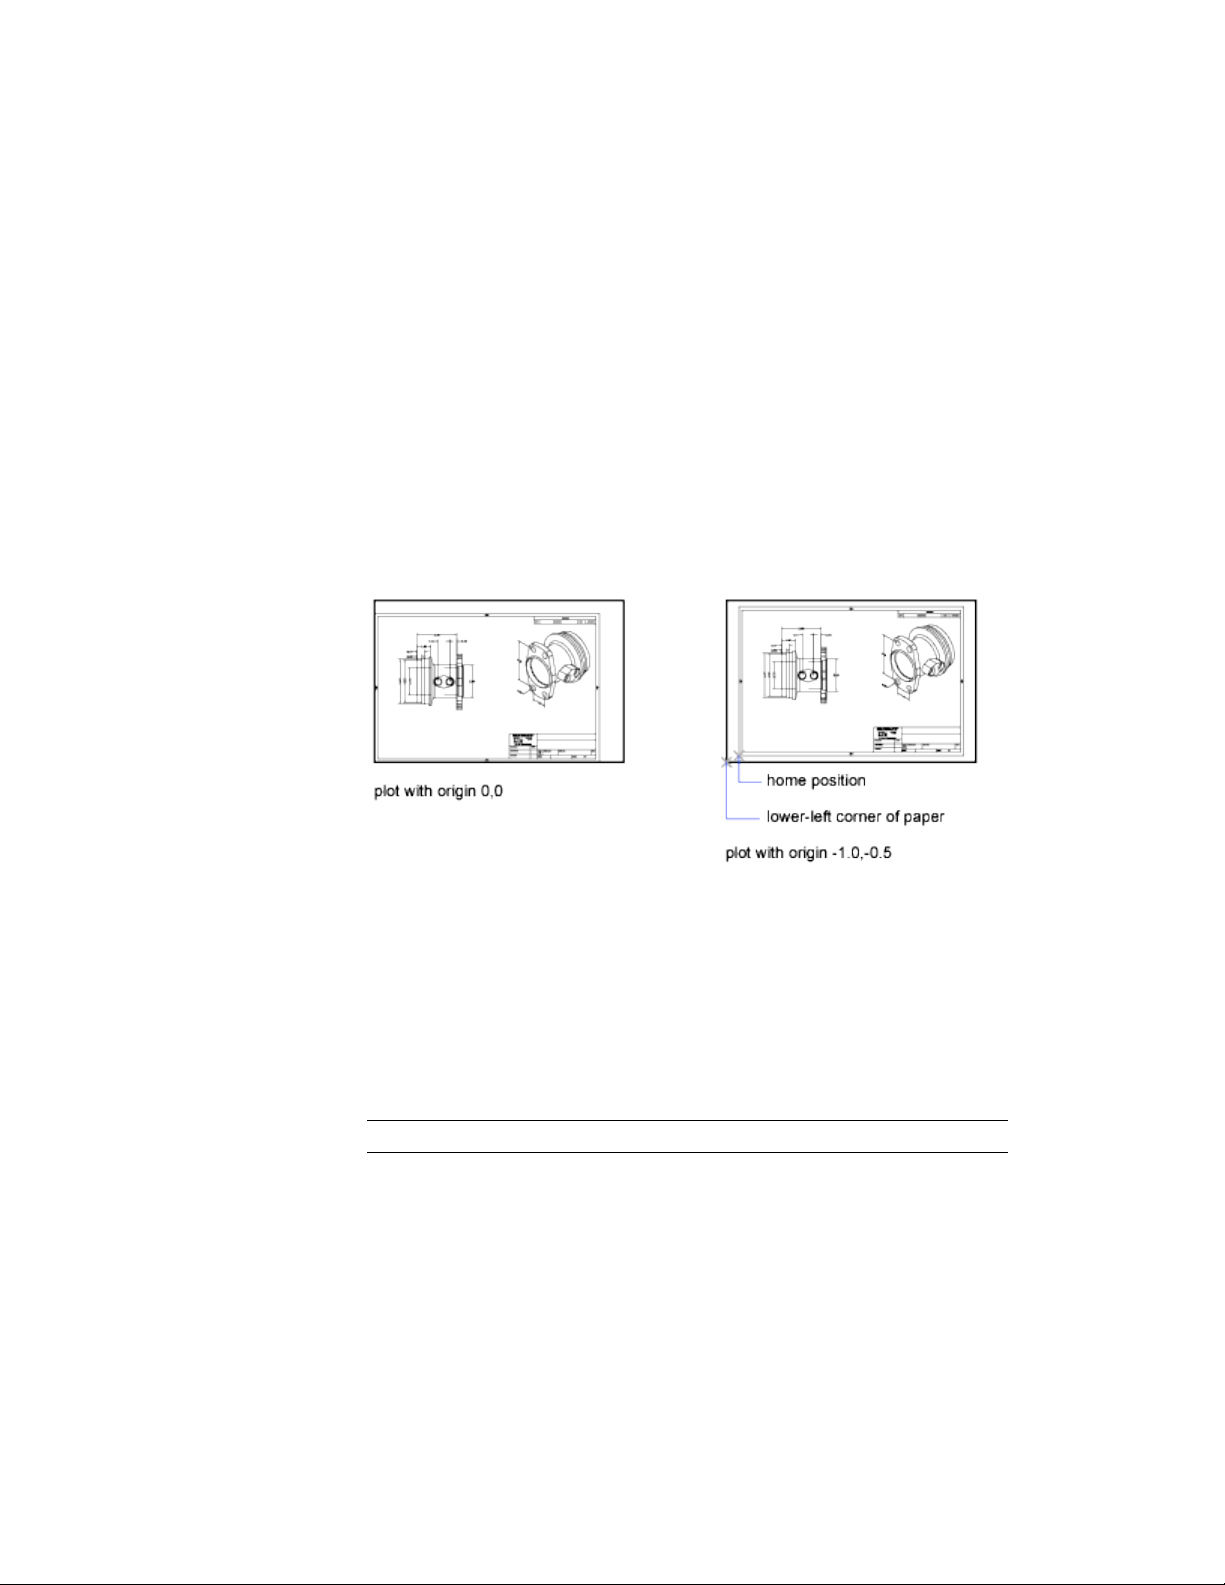
Adjust the Plot Offset of a Layout
The printable area of a drawing sheet is defined by the selected output device
and is represented by the dashed line in a layout. When you change the output
device, the printable area may change.
The plot offset specifies an offset of the plot area relative to the lower-left
corner (the origin) of the printable area or the edge of the paper.
You can offset the geometry on the paper by entering a positive or negative
value in the X and Y Offset boxes. However, this may result in the plot area
being clipped.
If you choose to plot an area other than the entire layout, you can also center
the plot on the sheet of paper.
Set the Plot Scale for a Layout
When you plot a drawing layout, you can either specify a precise scale for the
layout or fit the image to the paper.
Normally, you plot a layout at a 1:1 scale. To specify a different scale for the
layout, set the plot scale for the layout in the Page Setup or the Print dialog
box. In those dialog boxes, you can select a scale from a list or enter a scale.
NOTE You can modify the list of scales with SCALELISTEDIT.
When you are reviewing an early draft view, a precise scale is not always
important. You can use the Fit to Paper setting to plot the layout at the largest
possible size that fits the paper.
Specify Settings for Plotting | 619

See also:
Scale Views in Layout Viewports (page 95)
Draw, Scale, and Annotate in Model Space (page 86)
Set the Lineweight Scale for a Layout
You can scale lineweights proportionately in a layout with the plot scale.
Typically, lineweights specify the line width of plotted objects and are plotted
with the line width size regardless of the plot scale. Most often, you use the
default plot scale of 1:1 when plotting a layout. However, if you want to plot
an E-size layout that is scaled to fit on an A-size sheet of paper, for example,
you can specify lineweights to be scaled in proportion to the new plot scale.
See also:
Control Lineweights (page 141)
Select a Plot Style Table for a Layout
A plot style table is a collection of plot styles assigned to a layout or model
space.
A plot style is an object property, similar to linetype and color. Therefore, it
can be assigned to an object or a layer and they control an object's plotted
properties.
If you select the Display Plot Styles option under Plot Style Table, the properties
of the plot styles assigned to objects are displayed in the selected layout.
See also:
Control How Objects Are Plotted (page 627)
Set Shaded Viewport and Plot Options for a Layout
Shaded viewport and plot options settings affect how objects are plotted and
are saved in the page setup.
Shaded viewport and plot options affect how objects are plotted. The options
for shaded viewport plotting give you a large degree of flexibility in conveying
620 | Chapter 10 Plot and Publish Drawings

your three-dimensional designs to others. You can convey your design intent
by choosing how viewports are plotted and by specifying resolution levels.
Shaded Viewport Plotting Options
With shaded plotting options, you can choose whether to plot a set of shaded
objects using the As Displayed, Wireframe, Hidden, or Rendered option.
Shaded viewport plotting options apply to all objects in viewports and model
space. If you use the Shaded or Rendered options, plot style tables included
in the page setup do not affect plots. If you use the Render option,
two-dimensional wireframe objects, such as lines, arcs, and text, are not plotted.
NOTE Shaded viewport plotting requires a raster-capable device. Most modern
plotters and printers are raster-capable devices.
See also:
Set Shaded Viewport Options (page 628)
Set Options for Plotted Objects (page 630)
Named Page Setups with Projects
You can use named page setups to specify the same output options for all the
layouts in a project.
You can create a layout from scratch using the Project Manager, and then
apply a named page setup to the layout.
You can also apply named page setups that are stored in the project's page
setup overrides drawing template (DWT) file to a single layout or to an entire
project for a one-time publish operation.
Print or Plot Drawings
Once you have completed a drawing, you can use a number of methods to
output the drawing. You can plot the drawing on paper or create a file for use
with another application. In either case, you select the plot settings.
Print or Plot Drawings | 621

Overview of Plotting
Understanding terms and concepts that relate to plotting makes your first
plotting experience in the program easier.
Am I Printing or Plotting?
The terms printing and plotting can be used interchangeably for CAD output.
Historically, printers would generate text only, and plotters would generate
vector graphics. As printers became more powerful and could generate
high-quality raster images of vector data, the distinction mostly disappeared.
In addition to paper output, electronic delivery of multiple drawing layouts
uses the encompassing term, publishing.
Layouts
A layout represents a drawing sheet, and typically includes
■ A drawing border and title block
■ One or more layout viewports that display views of model space
■ General notes, labels, and possibly dimensions
■ Tables and schedules
Usually a drawing file contains only one layout, but you can create as many
layouts as you need. The first time you display a layout, it is initialized and a
default page setup is assigned to it.
Once initialized, layouts can be modified and published.
Page Setups
When you create a layout, you specify a plotter, and settings such as paper
size and orientation. These settings are saved in the drawing as a page setup.
Each layout can be associated with a different page setup.
You can control these settings for layouts and for model space using the Page
Setup Manager. You can name and save page setups for use with other layouts.
If you do not specify all the settings in the Page Setup dialog box when you
create a layout, you can set up the page just before you plot. Or you can
override a page setup at plot time. You can use the new page setup temporarily
for the current plot, or you can save the new page setup.
622 | Chapter 10 Plot and Publish Drawings

Plot Styles
A plot style is an optional method that controls how each object or layer is
plotted. Assigning a plot style to an object or a layer overrides properties such
as color, lineweight, and linetype when plotting. Only the appearance of
plotted objects is affected by plot style.
Plot style tables collect groups of plot styles, and save them in a file that you
can later apply when plotting.
There are two plot style types: color-dependent and named. A drawing can
use only one type of plot style table. You can convert a plot style table from
one type to the other. You can also change the type of plot style table a
drawing uses once it has been set.
For color-dependent plot style tables, an object's color determines how it is plotted.
These plot style table files have .ctb extensions. You cannot assign
color-dependent plot styles directly to objects. Instead, to control how an
object is plotted, you change its color. For example, all objects assigned the
color red in a drawing are plotted the same way.
Named plot style tables use plot styles that are assigned directly to objects and
layers. These plot style table files have .stb extensions. Using them enables
each object in a drawing to be plotted differently, independent of its color.
Plot Stamps
A plot stamp is a line of text that is added to your plot. You can specify where
this text is located on the plot in the Plot Stamp dialog box. Turn this option
on to add specified plot stamp information—including drawing name, layout
name, date and time, and so on—to a drawing that is plotted to any device.
You can choose to record the plot stamp information to a log file instead of
plotting it, or in addition to plotting it.
IMPORTANT A drawing file or drawing template file that was created with an
educational version will always be plotted with the following plot stamp:
PRODUCED BY AN AUTODESK EDUCATIONAL PRODUCT. Blocks and xrefs created
with an educational version and used in a commercial version will also result in
the educational plot stamp being plotted.
See also:
Create Multiple-View Drawing Layouts (Paper Space) (page 89)
Print or Plot Drawings | 623

Use a Page Setup to Specify Plot Settings
You can use a page setup to save and reuse settings for your plot jobs.
When you select a page setup in the Print dialog box, the settings from the
page setup are added to the Print dialog box. You can choose to plot with
those settings, or change any of the settings individually and then plot.
Any settings specified from the Print dialog box, whether you have applied a
page setup from the Page Setup list in the Page Setup dialog box, or changed
the settings individually, can be saved to the layout for use the next time you
plot.
See also:
Specify Page Setup Settings (page 617)
Select a Printer or Plotter
Before plotting a drawing, you must select a printer or plotter. The device you
select affects the printable area of the drawing.
After selecting a printing or plotting device, you also can easily plot a drawing
using the default settings in the Print dialog box.
See also:
Specify Page Setup Settings (page 617)
Specify the Area to Plot
When plotting a drawing, you must specify the area of the drawing to plot.
The Print dialog box provides the following options under What to Print.
■ Layout or Limits. When plotting a layout, plots everything within the
printable area of the specified paper size, with the origin calculated from
0,0 in the layout. When plotting the Model layout, plots the entire drawing
area defined by the grid limits. If the current viewport does not display a
plan view, this option has the same effect as the Extents option.
■ Extents. Plots the portion of the current space of the drawing that contains
objects. All geometry in the current space is plotted. The drawing might
be regenerated to recalculate the extents before plotting.
624 | Chapter 10 Plot and Publish Drawings

■ Display. Plots the view in the current viewport in the Model layout or
the current paper space view on a named layout.
■ Model/Layout View. Plots a view saved previously with the -VIEW
command. You can select a named view from the list provided. If there
are no saved views in the drawing, this option is unavailable.
■ Window. Plots any portion of the drawing you specify. Click the Window
button to use a pointing device to specify opposite corners of the area to
be plotted, or enter coordinate values.
Set Paper Size
When plotting a drawing, select the paper size that you want to use.
If you plot from a layout, you may have already specified a paper size in the
Page Setup dialog box. However, if you plot from the model space, you need
to specify a paper size when you plot.
In the Print dialog box, select the paper size that you want to use. The list of
paper sizes depends on the printer or plotter that you have selected in either
the Print or Page Setup dialog box. The list of available printers or plotters
includes all those that are currently configured through the Mac operating
system.
NOTE If the PAPERUPDATE system variable is set to 0, you are prompted if the
layout's existing paper size is not supported by the plotter you have selected. If
the PAPERUPDATE system variable is set to 1, the paper size is automatically
updated to reflect the default paper size of the selected plotter.
Position the Drawing on the Paper
There are several ways to position a drawing on the paper. You can specify
the printable area, set the position of the plot, and set the orientation.
Specify the Printable Area
The printable area is displayed by a dashed border in a layout. The plotter and
paper size you select determine the printable area.
Print or Plot Drawings | 625
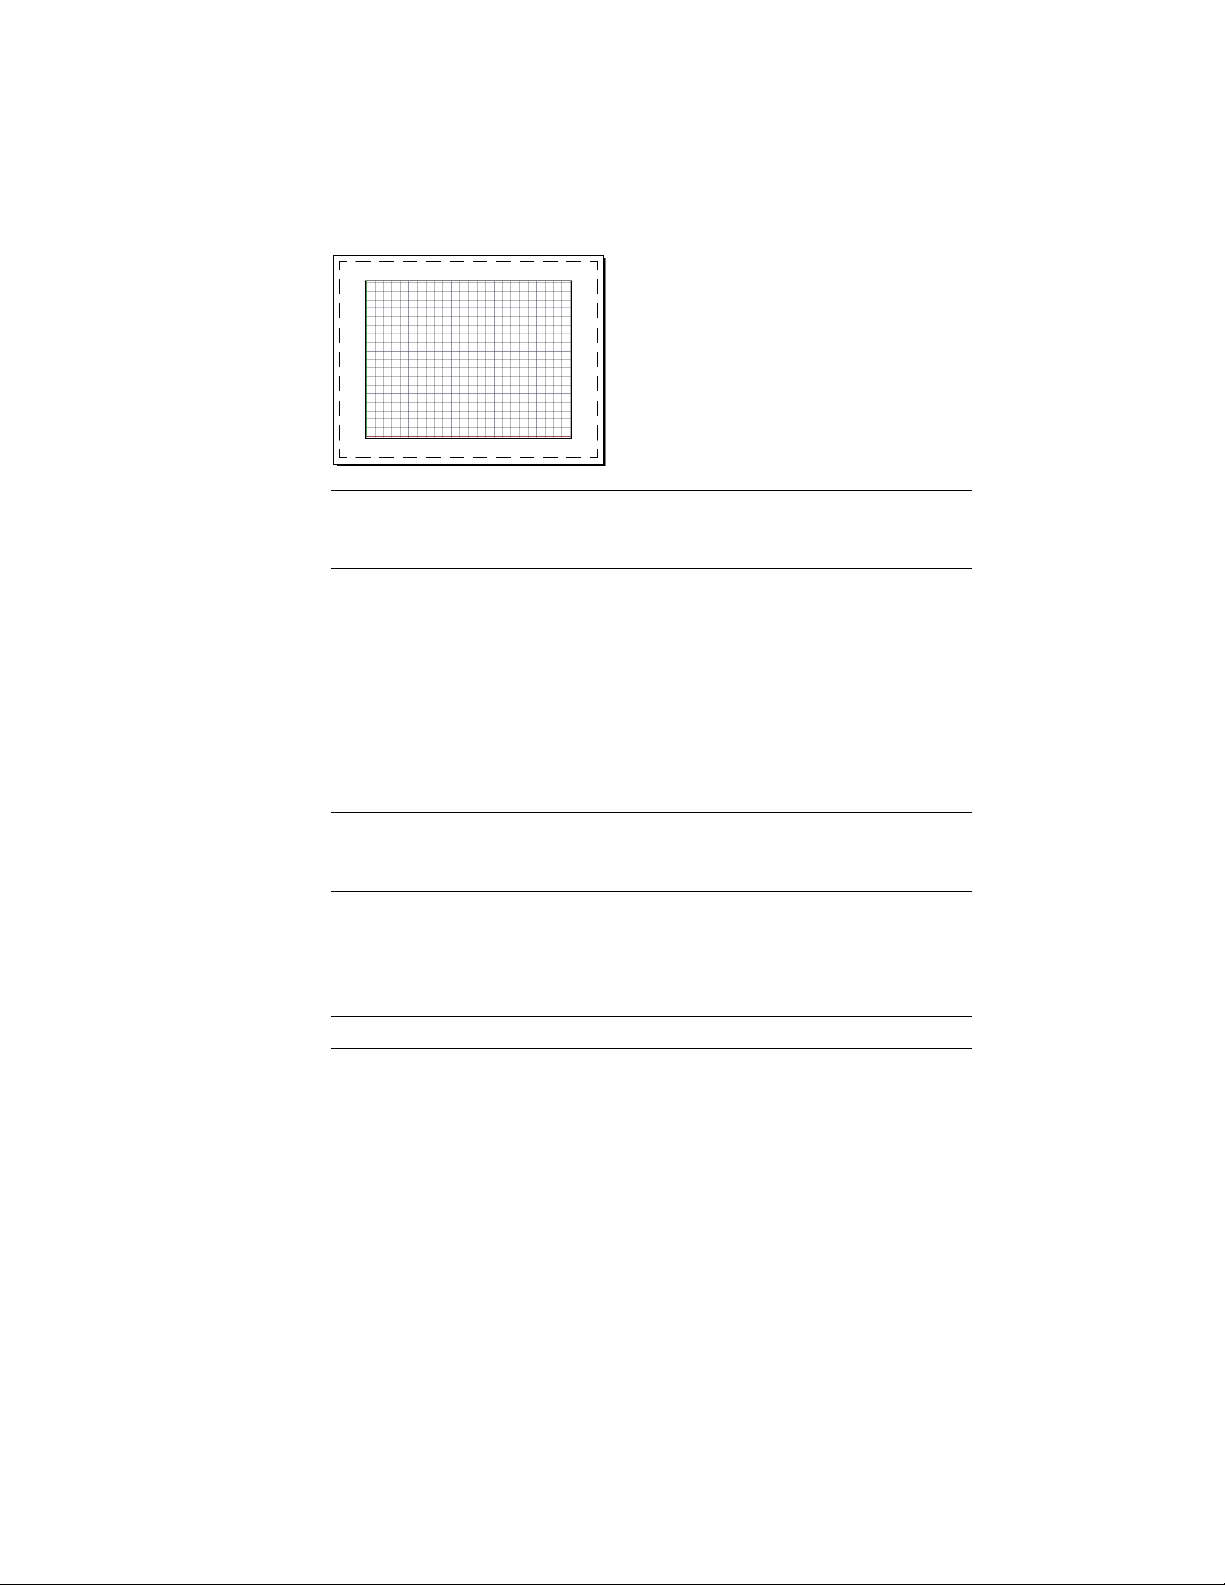
WARNING If you set your plotter to use paper-saving features such as plotting
inked area or nesting, your plotter will probably not use the printable area and
plot offset specifications.
Set the Position of the Plot
The printable area of a drawing sheet is defined by the selected printer or
plotter, but you can change the position of plot relative to the printable area
or to the edge of the paper.
You can specify an offset of the plot area relative to the lower-left corner (the
origin) of the printable area.
NOTE If you are plotting from the Model layout or named layout, the settings for
this option are located in the Page Setup dialog box under Offset for Printable
Area.
You can shift the drawing on the paper by entering positive or negative values
in the X and Y boxes. However, this can result in the plot area being clipped.
If the What to Print is not set to Layout (Extents, Display, or Window), you
can also select the Center on Page option.
NOTE If you specify a different printer or plotter, the printable area might change.
Set Drawing Orientation
The drawing orientation determines whether the position of the plotted
drawing is landscape (the longer edge of the drawing is horizontal) or portrait
(the longer edge of the drawing is vertical). This is based on the size of paper
selected. You can also choose to plot upside down.
626 | Chapter 10 Plot and Publish Drawings

Control How Objects Are Plotted
You can control how objects are plotted by setting the plot scale, by using
plot styles and plot style tables, and by setting an object's layer properties.
Set Plot Scale
When you specify a scale to output your drawing, you can choose from a list
of real-world scales, enter your own scale, or select Fit to Paper to scale the
drawing to fit onto the selected paper size.
Usually, you draw objects at their actual size. That is, you decide how to
interpret the size of a unit (an inch, a millimeter, a meter) and draw on a 1:1
scale. For example, if your unit of measurement is millimeters, then every unit
in your drawing represents a millimeter. When you plot the drawing, you
either specify a precise scale or fit the image to the paper.
Most final drawings are plotted at a precise scale. The method used to set the
plot scale depends on whether you plot model space or a layout:
■ From model space, you can establish the scale in the Print dialog box. This
scale represents a ratio of plotted units to the world-size units you used to
draw the model.
■ In a layout, you work with two scales. The first affects the overall layout
of the drawing, which usually is scaled 1:1, based on the paper size. The
second is the scale of the model itself, which is displayed in layout
viewports. The scale in each of these viewports represents a ratio of the
paper size to the size of the model in the viewport.
NOTE You can modify the list of scales that are displayed in all view and plot scale
lists with SCALELISTEDIT.
Set a Specific Scale
When you plot, the paper size you select determines the unit type, inches or
millimeters. For example, if the paper size is in mm, entering 1 under mm
and 10 under Units produces a plotted drawing in which each plotted
millimeter represents 10 actual millimeters.
The illustrations show a light bulb plotted at three different scales.
Print or Plot Drawings | 627
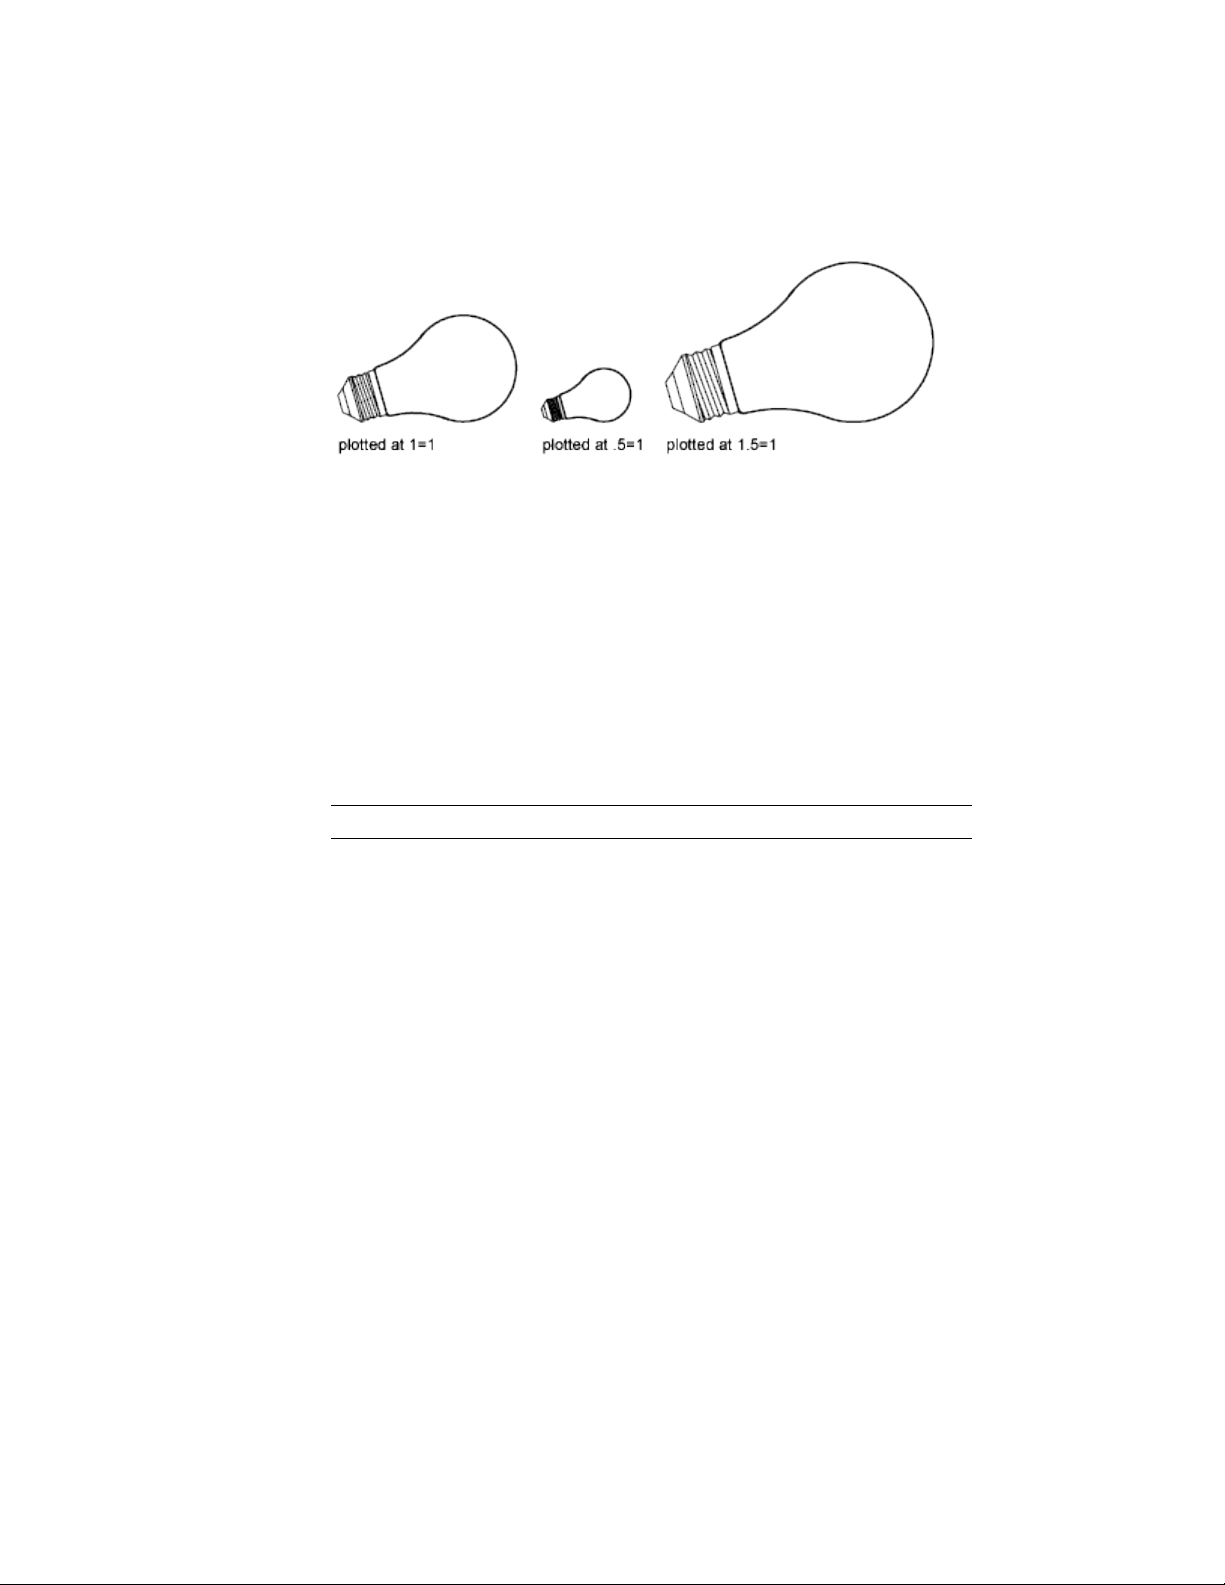
Scale the Drawing to Fit the Page
When you review drafts, a precise scale is not always important. You can use
the Fit to Paper option to plot the view at the largest possible size that fits the
paper. The height or width of the drawing is fit to the corresponding height
or width of the paper.
When you plot a perspective view from model space, the view is scaled to fit
the paper even when you enter a scale.
When you select the Fit to Paper option, the text boxes change to reflect the
ratio of plotted units to drawing units. This scale is updated whenever you
change the paper size, plotter, plot origin, orientation, or size of the plotted
area in the Print dialog box.
NOTE This option is not available when the What to Print is set to Layout.
Set Shaded Viewport Options
You can choose among several options for plotting shaded and rendered
viewports. You can plot a viewport as it is displayed, in wireframe, with hidden
lines removed, or as rendered.
Overview of Shaded Viewport Plotting
The options for shaded viewport plotting provide flexibility in presenting
your 3D designs to others.
With shaded plotting options, you can choose whether to plot a set of shaded
objects as displayed or in wireframe, hidden mode, a visual style, or rendered.
628 | Chapter 10 Plot and Publish Drawings

Shaded viewport plotting options apply to all objects in viewports and model
space. If you use the Shaded or Rendered options, plot style tables included
in the page setup do not affect plots. If you use the Render option,
two-dimensional wireframe objects, such as lines, arcs, and text, are not plotted.
NOTE Shaded viewport plotting requires a raster-capable device. Most modern
plotters and printers are raster-capable devices.
Specify Shaded Plotting Settings
If you are plotting a drawing that contains 3D solids that are shaded, you can
control how the drawing is plotted.
Specifically, you can choose from the following options:
■ As Displayed. Plots the design as it is displayed; all the shading is
preserved.
■ Wireframe. Displays lines and curves to represent object boundaries.
■ Hidden. Suppresses the plotting of objects that are located behind other
objects.
■ Visual Styles. Plots the design as it appears in the visual style you select.
■ Rendered. Renders objects before they are plotted, based on Render
options you set before you plot or based on the render preset you select.
■ Render Presets. Renders objects based on the render preset you select.
You can select an option for your drawing either from model space or from a
layout. From model space, the options are available in the Properties Inspector
palette and the Print dialog box. From a layout, after you select a viewport,
the options are available from the shortcut menu and from the Properties
Inspector palette.
NOTE If you select the Rendered option, specify Render settings before plotting.
If the Rendered option is used for a highly complex set of objects, the hardcopy
output might contain only the viewport border.
Specify a Resolution Level for Shaded Plotting
You can set the resolution of shaded plots for either greater speed or higher
fidelity.
Print or Plot Drawings | 629

After you select an appropriate plotter, you can specify the level of quality for
plotted output. The quality level determines the dots per inch (dpi). The dpi
that corresponds to a quality level is based on the plotter you select.
The maximum dpi available is also based on the plotter you select. You can
specify a custom quality level and directly change the dpi to a setting between
100 and the maximum dpi of the plotter.
The higher the fidelity, the more computer memory is used, so the longer it
takes to plot. High fidelity is not necessary for all plots, and a setting between
300 and 600 dpi is generally sufficient for most plots.
Set Options for Plotted Objects
In the Print and the Page Setup dialog boxes, you can choose from options
that affect how objects are plotted.
■ Shaded Viewport Plotting. Specifies shaded plotting options: As
Displayed, Wireframe, or Hidden. The effect of this setting is reflected in
the plot preview, but not in the layout.
■ Plot Object Lineweights. Specifies that lineweights assigned to objects
and layers are plotted.
■ Plot Transparency. Specifies that transparency levels applied to objects
and layers are plotted. Plot Transparency applies to wireframe and hidden
plots only. Other visual styles, such as Realistic, Conceptual, or Shaded
will always plot with transparency.
IMPORTANT This setting can be overridden by the
PLOTTRANSPARENCYOVERRIDE system variable.
■ Plot with Plot Styles. Specifies that the drawing is plotted using plot
styles. Selecting this option automatically plots lineweights. If you do not
select this option, objects are plotted with their assigned properties and
not with the plot style overrides.
NOTE Plot styles are not available for objects with the Jitter edge modifier
applied (-VISUALSTYLES).
■ Plot Paper Space Last. Specifies that objects in model space are plotted
before those in paper space.
■ Hide Paperspace Objects. Specifies whether the Hide operation applies
to objects in the layout viewport. The effect of this setting is reflected in
the plot preview, but not in the layout.
630 | Chapter 10 Plot and Publish Drawings

■ Plot Stamp On. Turns on plot stamps and places a plot stamp on a
specified corner of each drawing and can add it to a log file. Plot stamp
settings are specified in the Plot Stamp dialog box, where you can specify
the information you want applied to the plot stamp, such as drawing name,
date and time, plot scale, and so on.
Use Plot Styles to Control Plotted Objects
You can control many aspects of how an object is plotted by using plot styles.
Overview of Plot Styles
A plot style is an object property, similar to linetype and color. A plot style
can be assigned to an object or assigned to a layer. A plot style controls an
object's plotted properties, including
■ Color
■ Dither
■ Grayscale
■ Pen number
■ Virtual pen
■ Screening
■ Linetype
■ Lineweight
■ Transparency
■ Line end style
■ Line join style
■ Fill style
Using plot styles gives you great flexibility because you can set them to override
other object properties or turn off the override as needed.
Groups of plot styles are saved in either of two types of plot style tables:
color-dependent (CTB) or named (STB). Color-dependent plot style tables set
style based on the color of the object. Named plot styles can be assigned to
an object independent of color.
Print or Plot Drawings | 631

NOTE Plot styles are not available for objects with the Jitter edge modifier applied
(-VISUALSTYLES).
Choose a Type of Plot Style Table
A plot style table is a collection of plot styles assigned to a layout or the Model
tab. There are two types of plot style tables: color-dependent plot style tables
and named plot style tables.
Color-dependent plot style tables (CTB) use an object's color to determine
characteristics such as lineweight. Every red object in a drawing is plotted the
same way. While you can edit plot styles in a color-dependent plot style table,
you cannot add or delete plot styles. There are 256 plot styles in a
color-dependent plot style table, one for each color.
Named plot style tables (STB) contain user-defined plot styles. When you use a
named plot style table, objects that have the same color may be plotted
differently, based on the plot style assigned to the object. A named plot style
table can contain as many or as few plot styles as required. Named plot styles
can be assigned to objects or layers, just like any other property.
Assign Plot Style Tables to Layouts
By assigning different plot style tables to each layout in your drawing, you
can control how objects in the layout are plotted.
The plot style table affects both model space and paper space objects. To plot
the drawing without applying plot style properties, select None from the list
of plot style tables.
If you use named plot style tables, each object in the drawing either is assigned
a plot style directly or inherits a plot style from its layer.
To display the effects of a plot style table in a layout, select Print with Plot
Styles under Plot Style Table in the Page Setup dialog box.
NOTE If you insert an xref into your current drawing, all defined plot style tables
are also inserted. You can modify the appearance of your objects by editing the
attached plot style tables with the Plot Style Table Editor.
632 | Chapter 10 Plot and Publish Drawings
Manage Plot Style Tables
You can use the Plot Style Manager and Plot Style Table Editor to manage plot
style tables.
Color-dependent (CTB) and named (STB) plot style tables are stored in the
Plot Styles folder by default. This folder is also known as the Plot Style Manager.
You can use the Plot Style Manager to delete, rename, copy, and edit plot style
tables. The Plot Style Manager contains the available plot style table files and
the Plot Style Table Editor allows you to modify the properties of a plot style
table.
Use Color-Dependent Plot Style Tables
By using color-dependent plot styles to control how objects are plotted, you
ensure that all objects that share the same color are plotted the same way.
When a drawing uses color-dependent plot style tables, you cannot assign a
plot style to individual objects or layers. Instead, to assign plot style properties
to an object, you change the color of the object or layer.
You can assign color-dependent plot style tables to layouts. You can use several
predefined color-dependent plot style tables, edit existing plot style tables, or
create your own.
Color-dependent plot style tables are stored in the Plot Styles folder and have
a .ctb extension.
Use Predefined Color-Dependent Plot Style Tables
Several color-dependent plot style tables are installed in the Plot Styles folder,
also known as the Plot Style Manager.
DescriptionTable
Default plot style tableacad.ctb
Sets first 9 colors to use first 9 fill patterns, all others to use
object's fill
fillPatterns.ctb
Converts all colors to grayscale when plottedgrayscale.ctb
Print or Plot Drawings | 633
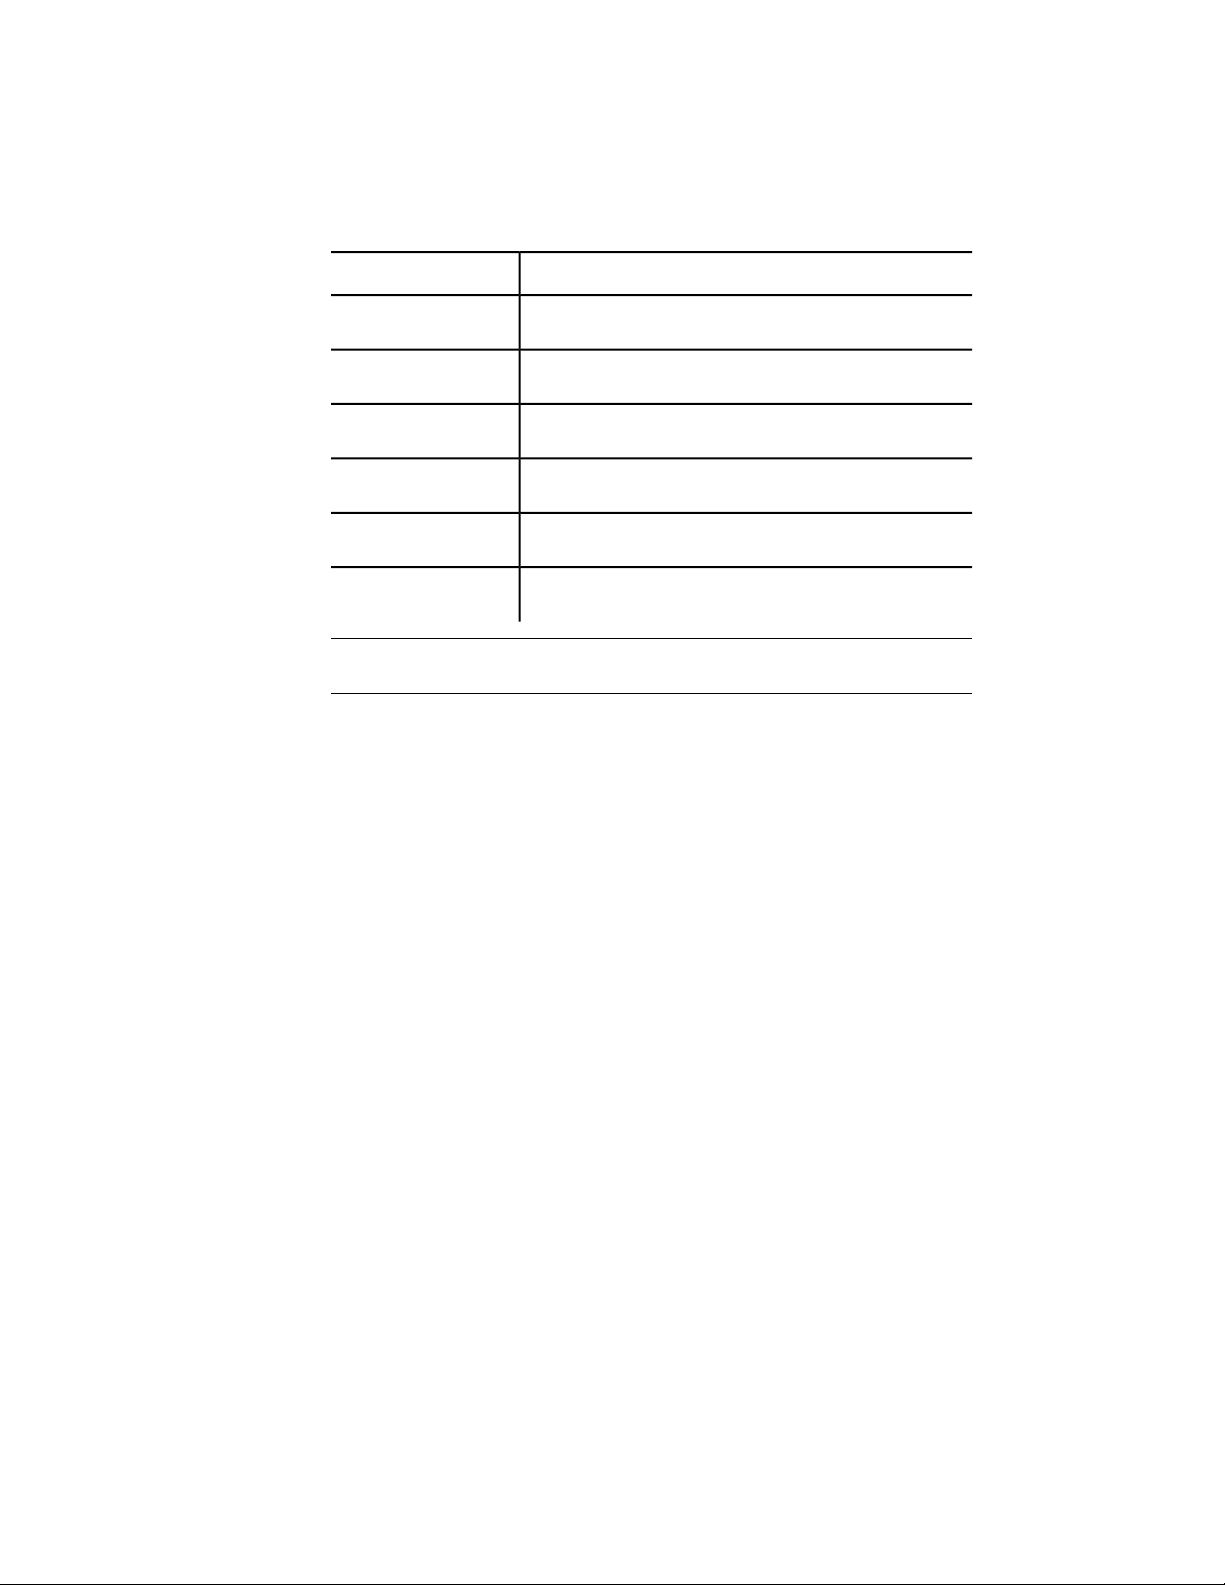
DescriptionTable
Plots all colors as blackmonochrome.ctb
Applies no plot style tableNone
Uses 100% ink for all colorsscreening 100%.ctb
Uses 75% ink for all colorsscreening 75%.ctb
Uses 50% ink for all colorsscreening 50%.ctb
Uses 25% ink for all colorsscreening 25%.ctb
NOTE You can assign a color-dependent plot style table to a layout only if the
drawing has been set to use color-dependent plot style tables.
See also:
Assign Plot Style Tables to Layouts (page 632)
Use Named Plot Style Tables
You can only create, delete, and apply plot styles in a named plot style table.
You can define as many or as few plot styles as you need in a drawing.
Use Named Plot Styles
Named plot styles are assigned to objects and layers in the same way that
linetype and color are assigned to objects.
An object whose plot style is set to BYLAYER inherits the plot style assigned
to its layer.
Use the Properties Inspector palette to change an object's plot style and the
Layers palette to change the plot style for a layer.
Because different plot style tables can be assigned to each layout and a named
plot style table can contain any number of plot styles, an object or layer may
634 | Chapter 10 Plot and Publish Drawings

have a plot style assigned to it that is not in every plot style table. In this case,
the plot style as missing in the Select Plot Style dialog box; the object's default
plotting properties are used. For example, named plot style table Style1 contains
plot styles A and B. Named plot style table Style2 contains plot styles B and
C. In a layout that uses Style1, any objects that use plot style C are listed as
having a missing plot style. Objects that are assigned plot style C in this layout
are plotted using their default settings.
Manage Named Plot Styles
You can add, delete, rename, and copy plot styles in a named plot style table
using the Plot Style Table Editor.
The Plot Style Table Editor is also used to change plot style settings for both
named and color-dependent plot style tables.
NOTE You cannot delete or edit the NORMAL plot style. Also, you cannot add,
delete, copy, or rename plot styles in a named plot style table if a color mapping
table has been attached to the plot style table. A color mapping table associates
every plot style with an ACI color.
See also:
Change Plot Style Settings (page 636)
Use Predefined Named Plot Style Tables
One additional named plot style table is installed for you to use beyond the
default plot style table. All named plot style tables have an .stb extension.
■ acad.stb : Default plot style table
■ Monochrome.stb: All colors plot as black
■ None: No plot style table applied
NOTE Named plot style tables are available only if the drawing has been set to
use named plot style tables.
See also:
Assign Plot Style Tables to Layouts (page 632)
Print or Plot Drawings | 635

Change Plot Style Settings
You can modify plot styles using the Plot Style Table Editor. Changes you
make to a plot style affect the objects to which that plot style is assigned.
Overview of Plot Style Settings
You can open the Plot Style Table Editor by double-clicking a CTB or STB file
in the Plot Styles Manager. The Plot Style Table Editor displays the plot styles
contained in the specified plot style table.
The Plot Styles list provides access to all colors or named plot styles that are
saved in the plot style file. Select a color or named plot style to list and edit
its properties.
In a named plot style table, the NORMAL plot style represents an object's
default properties (no plot style applied). You cannot modify or delete the
NORMAL style.
Set Color, Screening, Grayscale, and Dither in Plot
Style Tables
You can use a plot style to assign color, screening, grayscale, and dither
properties.
Assign Plot Style Colors
The default setting for plot style color is Use Object Color. With this setting,
the object retains its layer or individually set color. If you assign a plot style
color, the color overrides the object's color at plot time. You can specify one
of 255 ACI colors, a true color, or a color book color. The plotter must be
configured for True Color if you want to plot True Color plot styles.
NOTE If you use a plot style table saved in AutoCAD 2000 or later, the True Color
values change to the nearest match in the current release's palette.
Use Screening
You can select a color intensity setting that determines the amount of ink
placed on the paper while plotting. The valid range is 0 through 100. Selecting
636 | Chapter 10 Plot and Publish Drawings

0 reduces the color to white. Selecting 100 displays the color at its full intensity.
Screening is effective only if your plotter is configured to plot colors or
grayscale. Also, dithering must be enabled.
Use Dithering
A plotter uses dithering to approximate colors with dot patterns, giving the
impression of plotting with more colors than the ink colors available in the
plotter. If the plotter does not support dithering, the dithering setting is
ignored.
The most common reason for turning off dithering is to avoid false line typing
from dithering of thin vectors and to make dim colors more visible. When
you turn off dithering, colors are mapped to the nearest color, which limits
the range of colors used for plotting. Dithering is available whether you use
the object's color or assign a plot style color.
NOTE Dithering disables merge control.
Convert to Grayscale
When you select Grayscale, the object's colors are converted to grayscale if
the plotter supports grayscale. Light colors, such as yellow, are plotted with
light gray values. Dark colors are plotted with dark gray values. If you clear
Grayscale, the RGB values are used for the object's colors. Conversion to
grayscale is available whether you use the object's color or assign a plot style
color.
Control Plotted Lineweight and Linetype
Both lineweight and linetype can be set as an object property or controlled
when plotted by using a plot style. Lineweight or linetype settings in the plot
style override the object's lineweight or linetype at plot time.
Assign and Display Lineweights
When you select the Lineweight field in the Plot Style Table Editor, a sample
of the lineweight as well as its numeric value are displayed. The default setting
for plot style lineweight is Use Object Lineweight. You can modify an existing
lineweight if the one you need is not available.
To view plot style lineweights in a layout, select Print with Plot Styles under
Plot Style Table in the Page Setup dialog box.
Print or Plot Drawings | 637

Assign Linetypes
When you select the Linetype field in the Plot Style Table Editor, a list with
a sample and a description of each linetype are displayed. The default setting
for plot style linetype is Use Object Linetype.
Whether you choose to assign a linetype as a property of the object or as a
plot style, you can set the Adaptive option. This option adjusts the scale of
the linetype to complete the linetype pattern. If you don't select Adaptive,
the line might end in the middle of a pattern. Turn off Adaptive if linetype
scale is important. Turn on Adaptive if complete linetype patterns are more
important than correct linetype scaling.
You can apply a global scale factor to non-ISO linetypes and fill patterns in
plot styles.
See also:
Work with Linetypes (page 137)
Control Lineweights (page 141)
Assign Plotted Line End and Join Styles
You can set the line end and join styles for objects that have lineweight
assigned, either as an object property or as a plot style override.
Assign Line End Style
The program includes the following line end style options:
■ Butt
■ Square
■ Round
■ Diamond
The default setting for Line End Style is Use Object End Style, which is rounded.
Assign a line end style in a plot style to override the object's default line end
style at plot time.
NOTE SHX text plots best with the Round End and Round Join styles.
638 | Chapter 10 Plot and Publish Drawings

Assign Line Join Style
The program includes the following line join style options:
■ Miter
■ Bevel
■ Round
■ Diamond
The default setting for Line Join Style is Use Object Join Style, which is
rounded. Assign a line join style in a plot style to override the object's default
line join style at plot time.
Assign Plotted Fill Styles
You can assign a variety of fill style options when plotting wide polylines,
donuts, objects hatched with a solid fill, and solids.
The program includes the following fill style options:
■ Solid
■ Checkerboard
■ Crosshatch
■ Diamonds
■ Horizontal Bars
■ Slant Left
■ Slant Right
■ Square
■ Dots
■ Vertical Bar
The default setting for Fill Style is Use Object Fill Style. Assign a fill style in a
plot style to override the object's fill style at plot time.
You can apply a global scale factor to non-ISO linetypes and fill patterns in
plot styles.
See also:
Modify Hatches and Fills (page 512)
Print or Plot Drawings | 639

Preview a Plot
It is good practice to generate a preview of the plotted drawing before sending
the drawing to the printer or plotter. Generating a preview saves time and
material.
You can preview the drawing from the Print dialog box. The preview shows
exactly how the drawing will look when plotted, including lineweights, fill
patterns, and plot style options.
When you preview your drawing, a new window is displayed that provides
buttons to print, pan, and zoom the drawing.
Plot Files to Other Formats
You can export or plot your drawings to other formats, including PDF and
PostScript.
Plot Adobe PDF Files
You can create Adobe
®
Portable Document Format (PDF) files from drawings.
The Adobe
®
Portable Document Format (PDF) is a standard for electronic
information exchange. PDF files can be easily distributed for viewing and
printing in the Adobe Reader available from the Adobe web site without cost.
Using PDF files, you can share drawings with virtually anyone.
PDF files are generated in a vector-based format to maintain precision.
Drawings that are converted to PDF can be easily distributed for viewing and
printing in Adobe Acrobat Reader, versions 7 or later.
Publish Drawings
You can publish a set of drawings as a single, electronic, multi-sheet PDF file
or as a hardcopy using the printer assigned to a page setup.
Publishing provides a streamlined alternative to opening and plotting multiple
drawings. An electronic drawing set published as a PDF file saves time and
increases productivity by providing accurate, compressed representations of
drawings in a file that's easy to distribute and view.
640 | Chapter 10 Plot and Publish Drawings

Overview of Publishing
Publishing provides an easy way to create a paper or an electronic drawing
set.
An electronic drawing set is the digital equivalent of a set of printed drawings.
You create an electronic drawing set by publishing drawings to a PDF file. You
can create a paper drawing set by publishing the layouts to the printer named
in its page setup.
Using the Publish dialog box, you can assemble a collection of drawings to
publish. Once you have created a list of layouts in the Publish dialog box, you
can publish the drawings to any of the following:
■ The printer named in each layouts page setup
■ A single, multi-sheet PDF file containing 2D content
■ Multiple single-sheet PDF files containing 2D content
See also:
Specify Page Setup Settings (page 617)
Create a Drawing Set for Publishing
You can assemble a collection of drawing sheets to publish to a printer, or to
a single or multi-sheet PDF file.
You can customize your drawing set by adding layouts from the drawings that
are currently open or from saved drawing files. When adding layouts from
saved drawings, you can choose to add Model layouts only, named layouts
only, or both. Once layouts are added to the Sheet list, you can reorder the
layouts in the order you want them to appear in the drawing set.
NOTE You must remove the drawing sheets that you do not want to become a
part of the drawing set. Layouts must be initialized before they can be published.
(A layout is initialized if its paper size is defined in the page setup to any size other
than 0 x 0.)
Publish Drawings | 641

Publish a Project
From the Project Manager, you can easily publish an entire project, a group
of a layouts, or a single layout. It is quicker to publish a project in the Project
Manager rather than using the Batch Publish dialog box to add drawings
individually and then publish them as a single set.
When you publish from the Project Manager, you can publish an electronic
sheet set by publishing to a PDF file, or you can publish a paper set by
publishing to the plotter named in the page setup that is associated with each
layout. You can also publish your projects using a page setup that is saved in
the page setup overrides drawing template (DWT) file associated with the
project. This page setup overrides the current page setup settings for the
individual publish job.
See also:
Use Named Page Setups with Projects (page 621)
Work with Layouts in a Project (page 102)
642 | Chapter 10 Plot and Publish Drawings

Share Data Between Files
Reference Other Drawing Files
Attached xrefs are linked to, but not actually inserted in, another drawing.
Therefore, with xrefs you can build drawings without significantly increasing
the drawing file size.
See also:
Reference Manager Palette
Overview of Referenced Drawings (Xrefs)
You can attach an entire drawing file to the current drawing as a referenced
drawing (xref). With xrefs, changes made in the referenced drawing are reflected
in the current drawing. Attached xrefs are linked to, but not actually inserted
in, another drawing. Therefore, with xrefs you can build drawings without
significantly increasing the drawing file size.
By using referenced drawings, you can
■ Coordinate your work with the work of others by referencing other drawings
in your drawing to keep up with the changes being made by other designers.
You can also assemble a master drawing from component drawings that
may undergo changes as a project develops.
■ Ensure that the most recent version of the referenced drawing is displayed.
When you open your drawing, each referenced drawing is automatically
reloaded, so it reflects the latest state of the referenced drawing file.
■ Keep the names of layers, dimensioning styles, text styles, and other named
elements in your drawing separate from those in referenced drawings.
11
643

■ Merge (bind) attached referenced drawings permanently with your current
drawing when the project is complete and ready to be archived.
NOTE Like a block reference, an xref appears in the current drawing as a single
object. However, you cannot explode an xref without binding it first.
See also:
Reference Manager Palette
Attach and Detach Referenced Drawings
You can perform several operations on referenced drawing files (xrefs).
Attach Drawing References (Xrefs)
You can insert any drawing file as an external reference or xref in the current
drawing.
When you attach a drawing file as an xref, you link that referenced drawing
to the current drawing. Any changes to the referenced drawing are displayed
in the current drawing when it is opened or reloaded.
A drawing file can be attached as an xref to multiple drawings at the same
time. Conversely, multiple drawings can be attached as referenced drawings
to a single drawing.
Tools for Attaching Xrefs
You can use several methods to attach an xref:
■ On the Mac OS menu bar, click Tools ➤ Palettes ➤ Reference Manager
■ At the Command prompt, enter externalreferences
■ At the Command prompt, enter xattach
The saved path used to locate the xref can be a relative (partially specified)
path, the full path, or no path.
If an xref contains any variable block attributes, they are ignored.
644 | Chapter 11 Share Data Between Files

Receive Notification of Attached Xrefs
When one or more xrefs are not found or if any of the xrefs need reloading,
a balloon message is displayed near the lower-left corner of the drawing area.
Click the link in the balloon message to display the External References palette.
Highlight External References in a Drawing
To find an external reference in a complex drawing, select an item in the
Reference Manager palette to highlight all visible instances in the drawing.
Conversely, select an external reference in the drawing to highlight its name
in the Reference Manager palette.
NOTE The ERHIGHLIGHT system variable controls whether referenced objects are
highlighted. You can turn highlighting off to improve performance.
Control the Properties of Referenced Layers
You can control the visibility, color, linetype, and other properties of an xref's
layers and make these changes temporary or permanent. If the VISRETAIN
system variable is set to 0, these changes apply only to the current drawing
session. They are discarded when you end the drawing session, or when you
reload or detach the xref.
You can also control the fade display of the DWG xref. The XDWGFADECTL
system variable defines the fade percentage for all DWG xrefs.
Xref Clipping Boundaries
Drawings can include xrefs that are clipped. If you want to see the clipping
boundary, you can turn on the XCLIPFRAME system variable.
Attachments from Educational Products
If you open, insert, or attach an xref from an Autodesk Educational Product,
the drawings you plot contain the following banner: “PRODUCED BY AN
AUTODESK EDUCATIONAL PRODUCT.”
See also:
Nest and Overlay Referenced Drawings (page 646)
Clip External References and Blocks (page 653)
Set Paths to Referenced Drawings (page 647)
Reference Other Drawing Files | 645
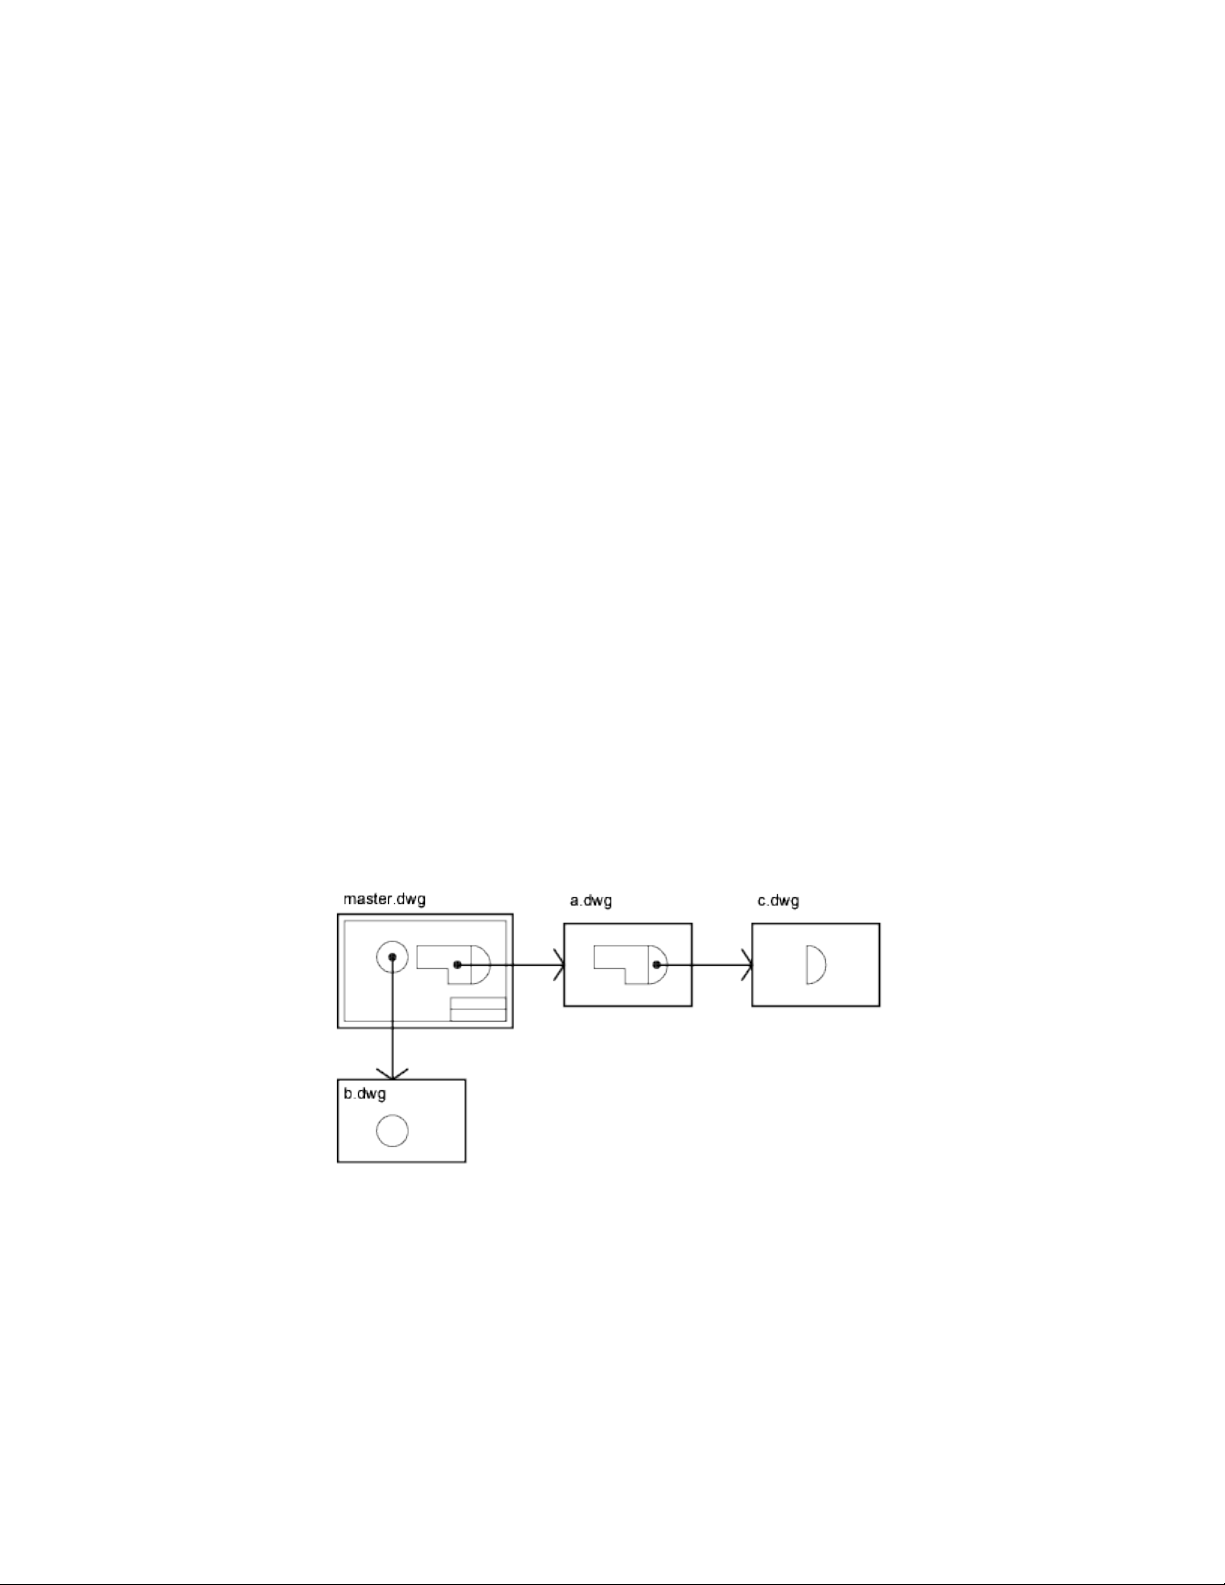
Attach Drawing References (Xrefs)
To attach an xref
1 On the Mac OS menu bar, click Tools ➤ Palettes ➤ Reference
Manager .
2 In the Reference Manager, click the Attach Reference button.
3 In the Select Reference File dialog box, locate and click the file to be
referenced. Click Open.
4 In the Attach External Reference dialog box, select any desired options
and then click OK.
5 If necessary, specify the location in the drawing and any other options.
Nest and Overlay Referenced Drawings
Attached DWG references (xrefs) can be nested: that is, you can attach an xref
that contains another xref.
Xrefs can be nested within other xrefs: that is, you can attach an xref that
contains another xref. You can attach as many copies of an xref as you want,
and each copy can have a different position, scale, and rotation.
In the following illustration, master.dwg references a.dwg and b.dwg. Drawing
a.dwg references c.dwg. In master.dwg, c.dwg is a nested xref.
You can also overlay an xref on your drawing. Unlike an attached xref, an
overlaid xref is not included when the drawing is itself attached or overlaid as
an xref to another drawing. Overlaid xrefs are designed for data sharing in a
646 | Chapter 11 Share Data Between Files
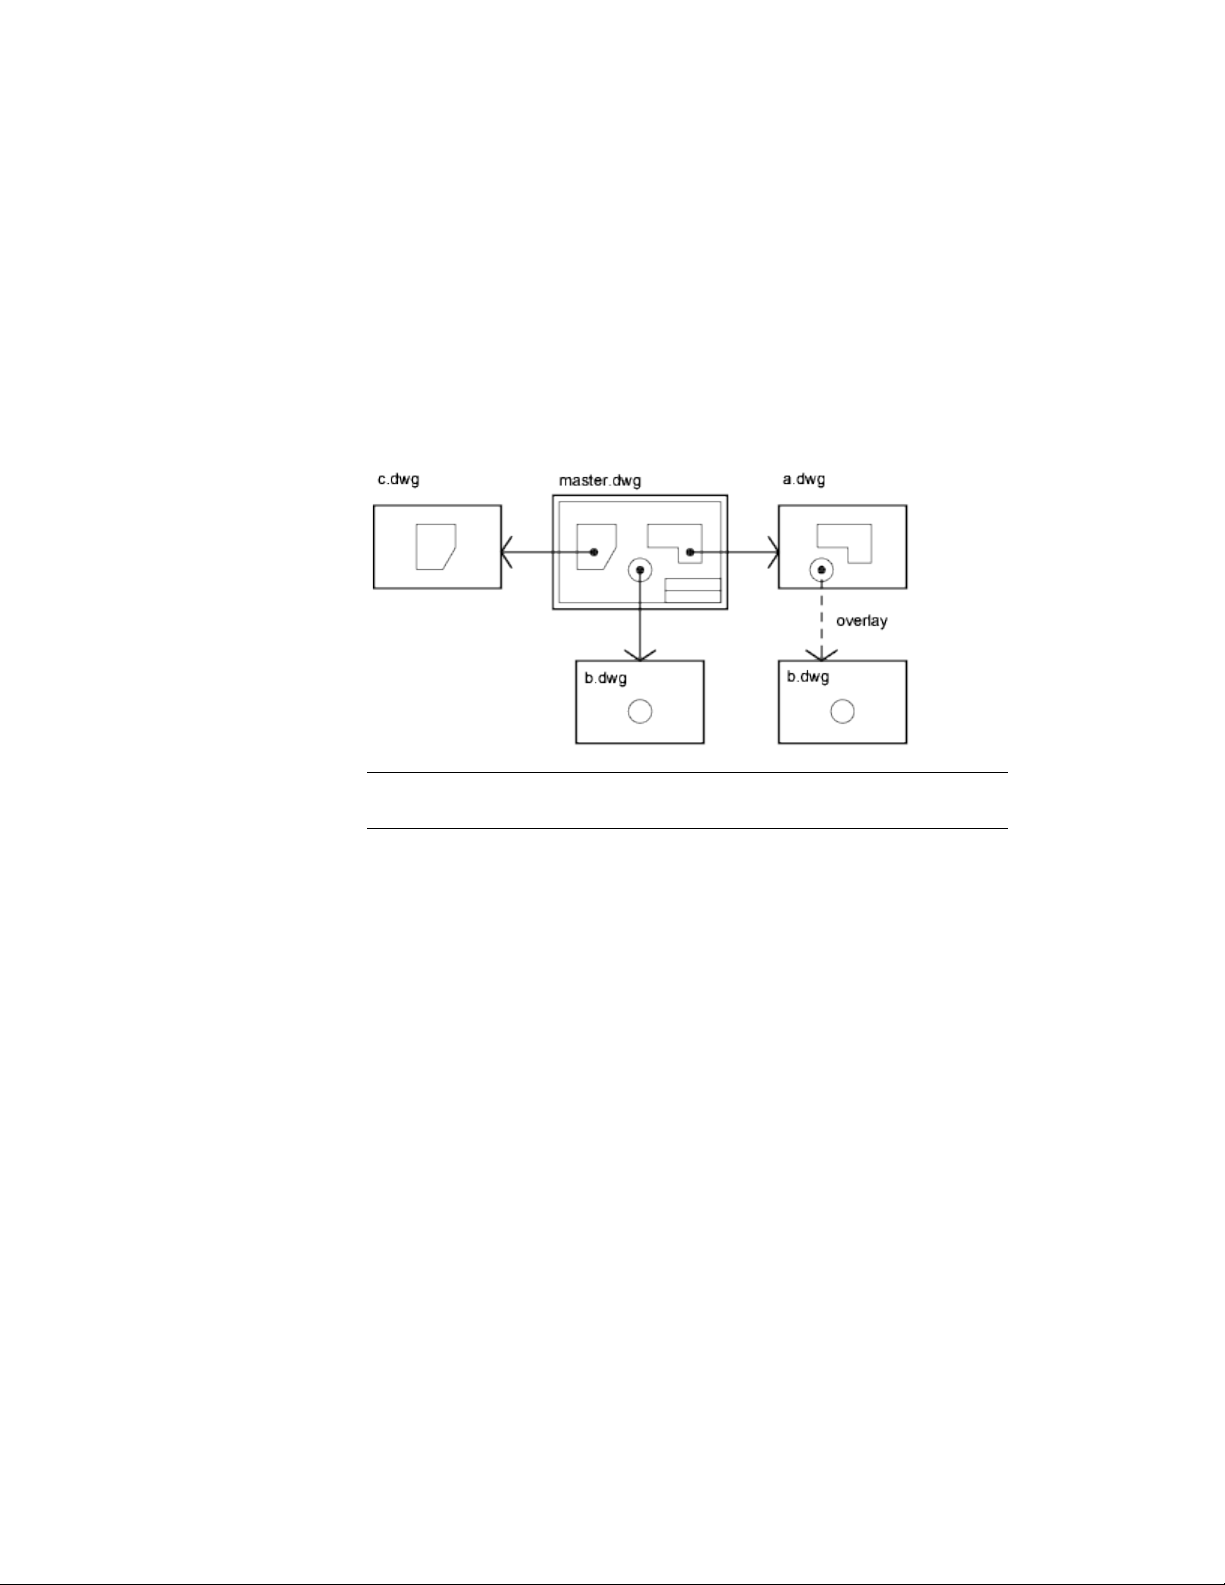
network environment. By overlaying an xref, you can see how your drawing
relates to the drawings of other groups without changing your drawing by
attaching an xref.
In the following illustration, several people are working on drawings referenced
by master.dwg. The person working on a.dwg needs to see the work being
completed by the person working on b.dwg, but does not want to xref b.dwg
because it would then appear twice in master.dwg. Instead, the person overlays
b.dwg, which is not included when a.dwg is referenced by master.dwg.
NOTE When using the parametric drawing feature, you can only constrain objects
in the drawing to the insertion point of an Xref, and not its nested objects.
Relative Saved Paths and Nested Xrefs
The saved path for an xref can be a full path, a relative (partially specified)
path, or no path. For a nested xref, a relative path always references the
location of its immediate host and not necessarily the currently open drawing.
See also:
Set Paths to Referenced Drawings (page 647)
Set Paths to Referenced Drawings
You can view and edit the file name and path used when locating a particular
drawing reference (xref). Use this option if the referenced file has been moved
to a different folder or renamed since it was first attached.
Reference Other Drawing Files | 647

You can choose from three types of folder path information to save with an
attached reference: a full path, a relative path, and no path.
Specify a Full (Absolute) Path
A full path is a fully specified hierarchy of folders that locates the file reference.
For example, a fully specified path to a different volume will look something
like this:
smb://hostname/directorypath/resource
Instead of smb:, you could use afp: , ftp: , or other protocol.
This is the most specific but least flexible option.
Specify a Relative Path
Relative paths are partially specified folder paths that assume the current folder
of the host drawing. This is the most flexible option, and enables you to move
a set of drawings from one folder to a different one that contains the same
folder structure.
If the file that is being referenced is located on a network server, the relative
path option is not available.
The conventions for specifying a relative folder path are as follows:
/ Look in the root folder of the host drawing's drive
path From the folder of the host drawing, follow the specified path
/path From the root folder, follow the specified path
. /path From the folder of the host drawing, follow the specified path
../path From the folder of the host drawing, move up one folder level and
follow the specified path
../../path From the folder of the host drawing, move up two folder levels and
follow the specified path
NOTE If a drawing that contains referenced files is moved or saved to a different
path, or to a different network server, you must edit any relative paths to
accommodate the host drawing's new location or you must relocate the referenced
files.
648 | Chapter 11 Share Data Between Files

Specify No Path
When no path information is saved with the attached external reference, the
following search is initiated in the order shown:
■ Current folder of the host drawing
■ Project search paths defined in the Project Files Search Path item on the
Application tab in the Application Preferences dialog box
■ Search paths defined in the Support File Search Paths item on the
Application tab in the Application Preferences dialog box
Specifying the No Path option is useful when moving a set of drawings to a
different folder hierarchy or to an unknown folder hierarchy.
Know when a Referenced Drawing has been Relocated
If the drawing you are working on contains an xref that has been moved to
a different folder, a message is displayed at the site of the xref when you load
the drawing. The message indicates that the xref cannot be loaded using the
old path. When you specify the new path, the xref is reloaded into your
drawing.
Detach Referenced Drawings
To completely remove DWG references (xrefs) from your drawing, you need
to detach them rather than erase them.
Erasing xrefs does not remove, for example, layer definitions associated with
those xrefs. Using the Detach option removes the xrefs and all associated
information.
Detach Referenced Drawings
To detach an xref
1 On the Mac OS menu bar, click Tools ➤ Palettes ➤ Reference
Manager .
2 In the Reference Manager, click a DWG reference.
Reference Other Drawing Files | 649
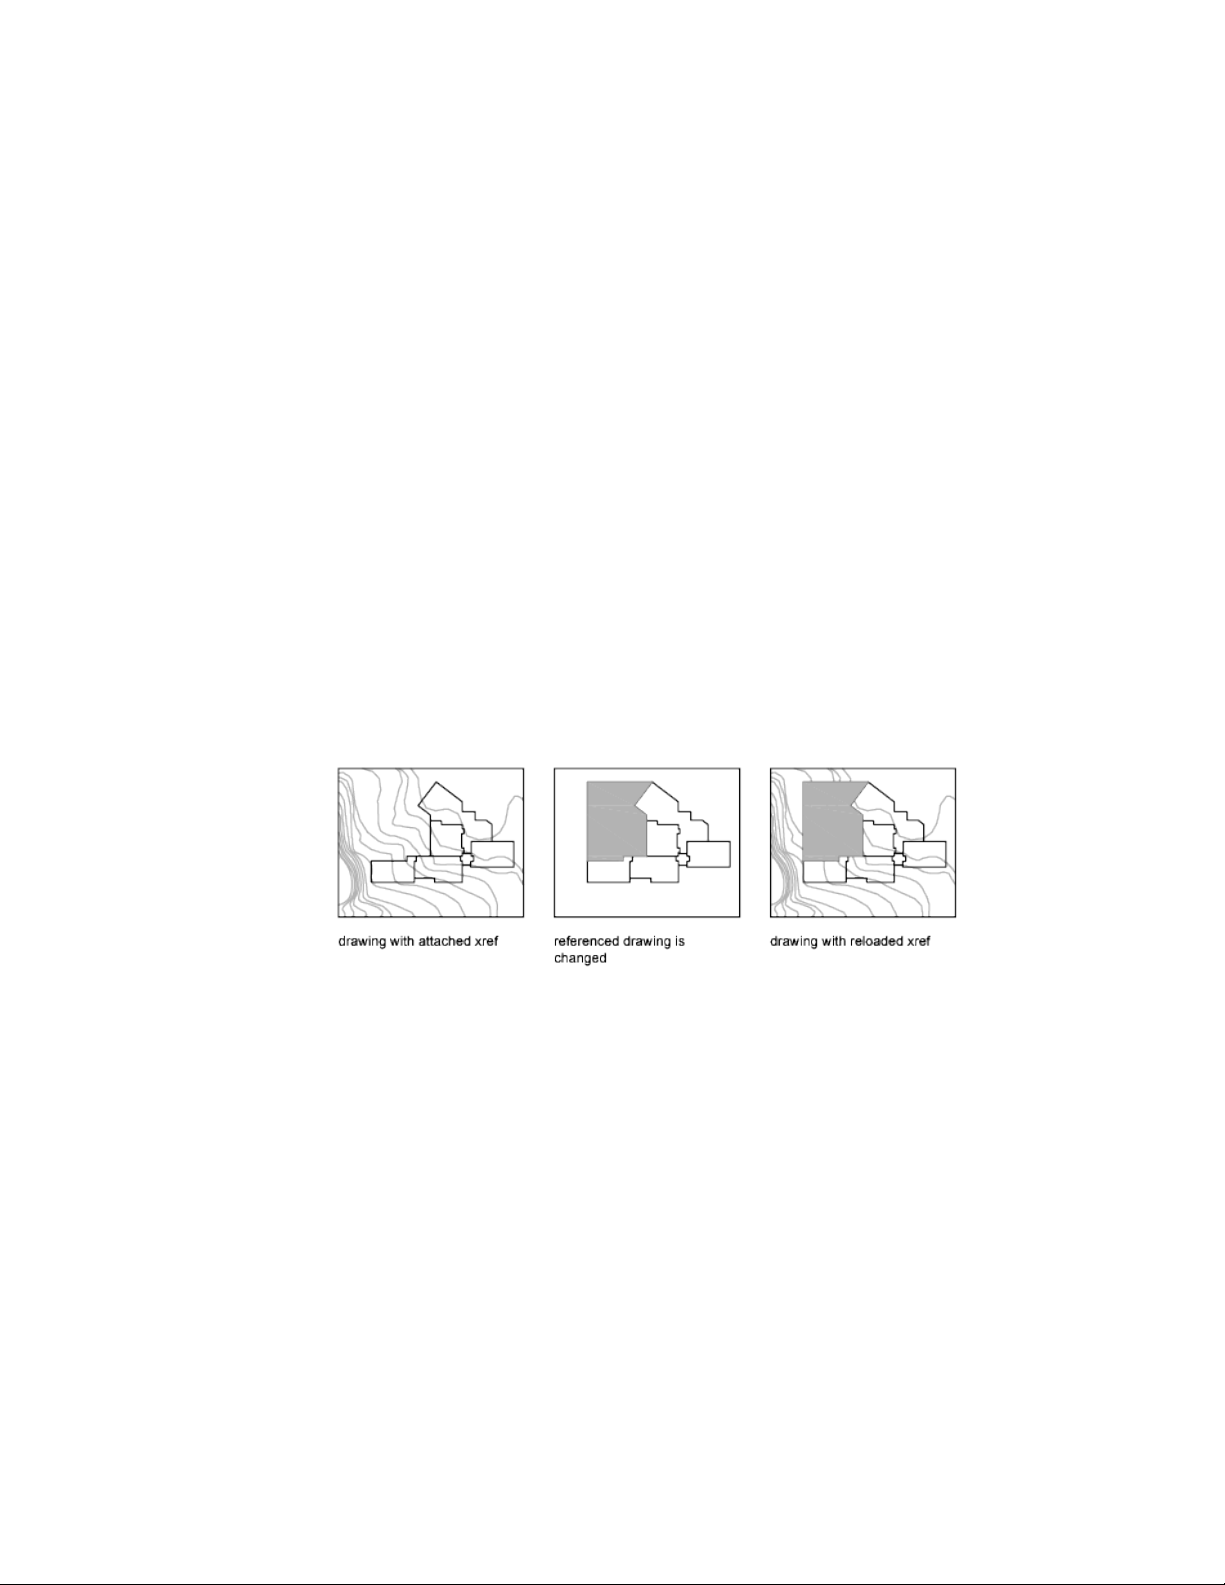
3 Right-click the selected DWG reference and select Detach from the
shortcut menu. Alternatively, you can click the Detach button in the
top row of buttons in the Reference Manager.
Update and Archive Referenced Drawings
You can update referenced drawings (xrefs) to make sure that they are current,
and you can choose how xrefs are treated when a drawing is archived.
Update Referenced Drawing Attachments
When you open a drawing, all drawing references (xrefs) update automatically.
You can also update xrefs whenever you want to ensure that the most current
versions are displayed in your drawing.
When you open a drawing, all xrefs update automatically. Use the Refresh
Content (Reload) option from the Reference Manager to update xrefs whenever
you want to ensure that the most current versions are displayed in your
drawing.
Whenever you modify and save an externally referenced drawing in a network
environment, other people can access your changes immediately by reloading
the xrefs in their open drawings.
Receive Notification of Changed Xrefs
When you attach xrefs to a drawing, the program periodically checks whether
the referenced files have changed since the last time the xrefs were loaded or
reloaded. The XREFNOTIFY system variable controls xref notification.
650 | Chapter 11 Share Data Between Files

By default, if a referenced file has changed, a balloon message is displayed
near the lower-left corner of the drawing window. Click the link in the balloon
to reload all changed xrefs.
By default, the program checks for changed xrefs every five minutes. You can
change the number of minutes between checks by setting the XNOTIFYTIME
system environment variable using (setenv "XNOTIFYTIME" "n") where n
is a number of minutes between 1 and 10080 (seven days).
NOTE When changing the value of XNOTIFYTIME, you must enter
XNOTIFYTIME with the capitalization as shown.
Update Xrefs with Demand Loading Turned On
If demand loading is turned on when you load or reload an xref
■ With the XLOADCTL system variable set to 1, the referenced drawing is
kept open and locked. No one else can modify the referenced drawing.
■ With XLOADCTL set to 2, a temporary copy of the most recently saved
version of the referenced file is opened and locked. Others can open and
modify the referenced drawing.
For information about demand loading, see Increase Performance with Large
Referenced Drawings (page 666).
Update Referenced Drawing Attachments
To update an attached xref
1 On the menu bar, click Tools ➤ Palettes ➤ Reference Manager .
2 In the Reference Manager, click a DWG reference.
3 Right-click the selected DWG reference and select Reload from the
shortcut menu. Alternatively, you can click the Refresh Content button
in the top row of buttons in the Reference Manager.
NOTE If the drawing you selected has been changed since you opened your
drawing, the xref is reloaded.
Reference Other Drawing Files | 651

Archive Drawings That Contain Referenced Drawings
(Bind)
When you archive final drawings that contain xrefs, you can choose how you
store the xrefs in the drawings.
When you archive final drawings that contain xrefs, you have two choices:
■ Store the xref drawings along with the final drawing
■ Bind the xref drawings to the final drawing
Storing an xref drawing along with the final drawing requires that the drawings
always remain together. Any change to the referenced drawing will continue
to be reflected in the final drawing.
To prevent unintentional updating of archived drawings by later changes to
referenced drawings, bind the xrefs to the final drawing.
Binding an xref to a drawing makes the xref a permanent part of the drawing
and no longer an externally referenced file. You can bind the entire database
of the xref drawing, including all its xref-dependent named objects (blocks,
dimension styles, layers, linetypes, and text styles), by using the XREF Bind
option. For more information, see Resolve Name Conflicts in External Refer-
ences (page 662).
Binding xrefs to a drawing is also an easy way to send a drawing to reviewers.
Rather than sending a master drawing plus each of the drawings it references,
you can use the Bind option to merge the xrefs into the master drawing.
NOTE You cannot bind xrefs that contain proxy objects. For more information,
see Work with Custom and Proxy Objects (page 702).
Archive Drawings That Contain Referenced Drawings
(Bind)
To bind an xref to the current drawing
1 On the Mac OS menu bar, click Tools ➤ Palettes ➤ Reference
Manager .
2 In the Reference Manager, click a DWG reference.
652 | Chapter 11 Share Data Between Files
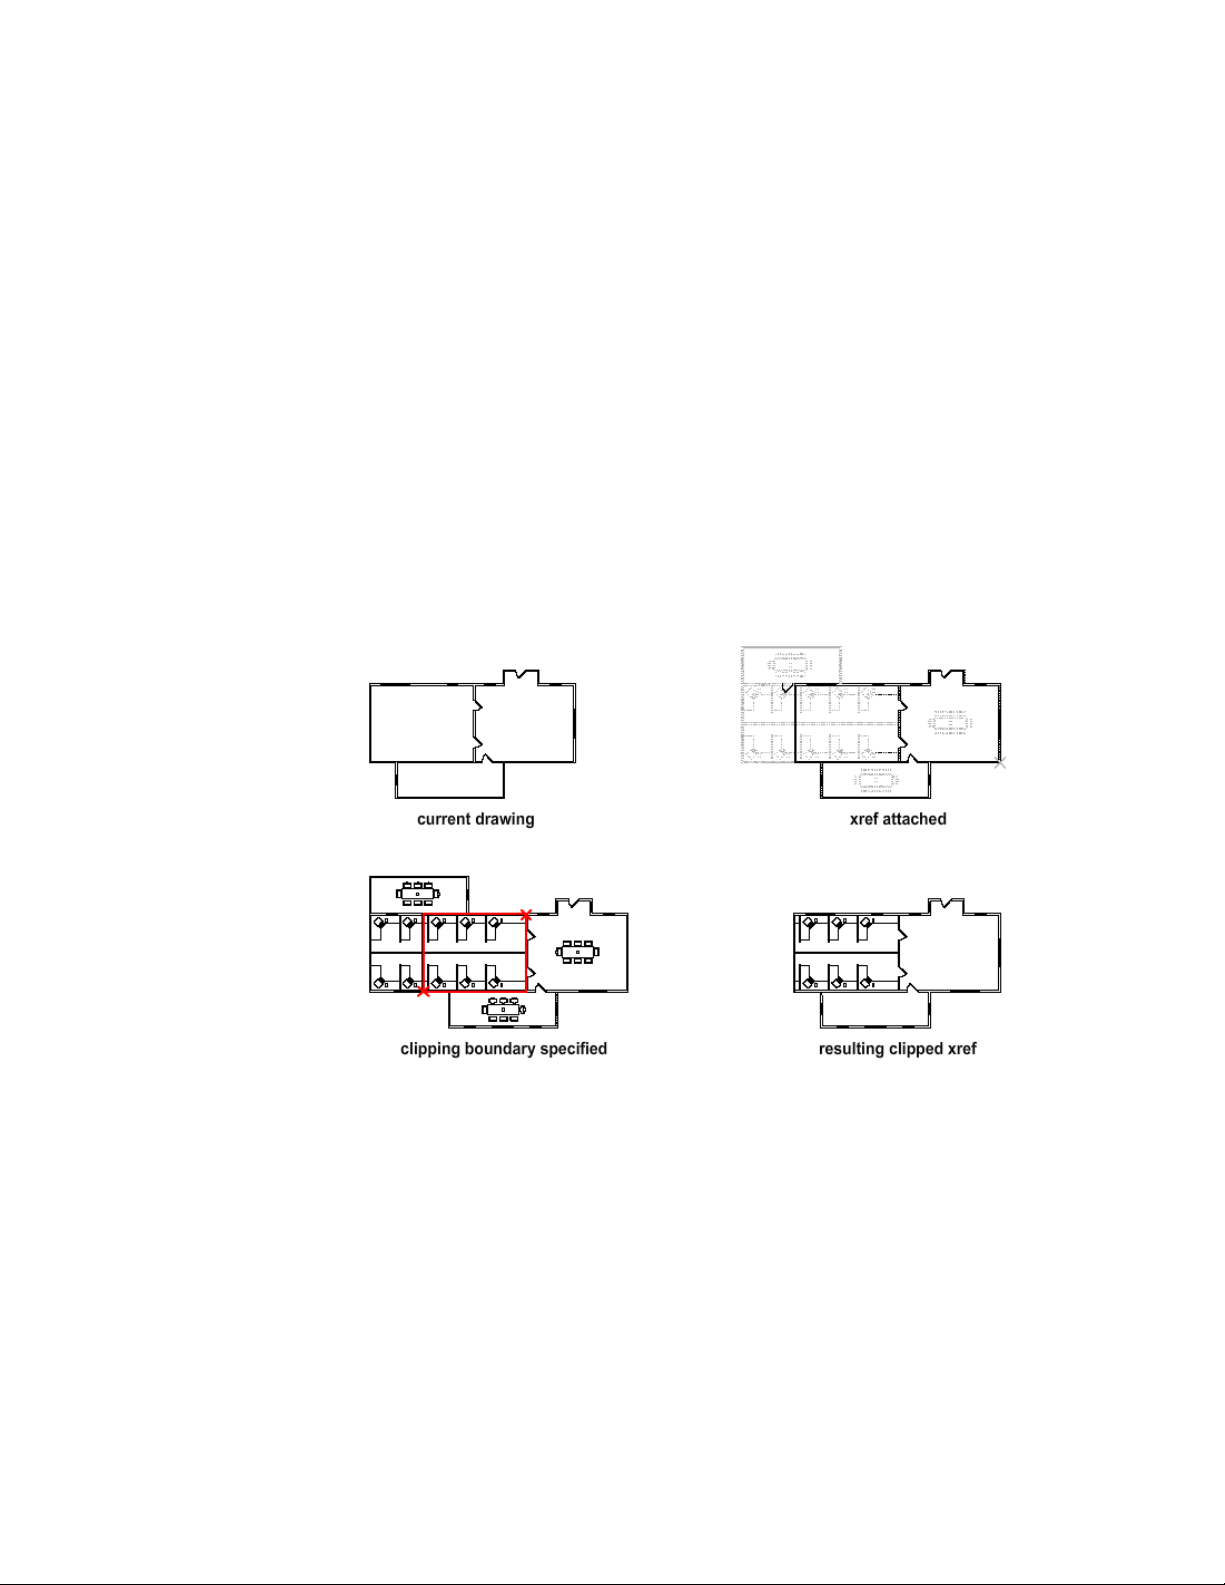
3 Right-click the selected DWG reference and select Bind from the shortcut
menu.
The objects in the xref are converted into a block reference. Named object
definitions are added to the current drawing with a prefix of blockname
$n$, where n is a number starting at 0.
Clip External References and Blocks
You can specify clipping boundaries to display a limited portion of an external
reference drawing or block reference.
You can clip external references such as raster images, PDF underlays, or block
references. With a clipping boundary, you can determine the portions of an
external reference or block reference that you want to display by hiding the
redundant parts of the reference inside or outside the boundary.
The clipping boundary can be a polyline, rectangle, or a polygon with vertices
within the boundaries of the image. You can change the boundary of a clipped
image. When you clip a boundary, the objects in the external reference or
block are not altered; only their display is changed.
With the XCLIP, PDFCLIP, and IMAGECLIP commands, you can control the
following viewing options:
Reference Other Drawing Files | 653
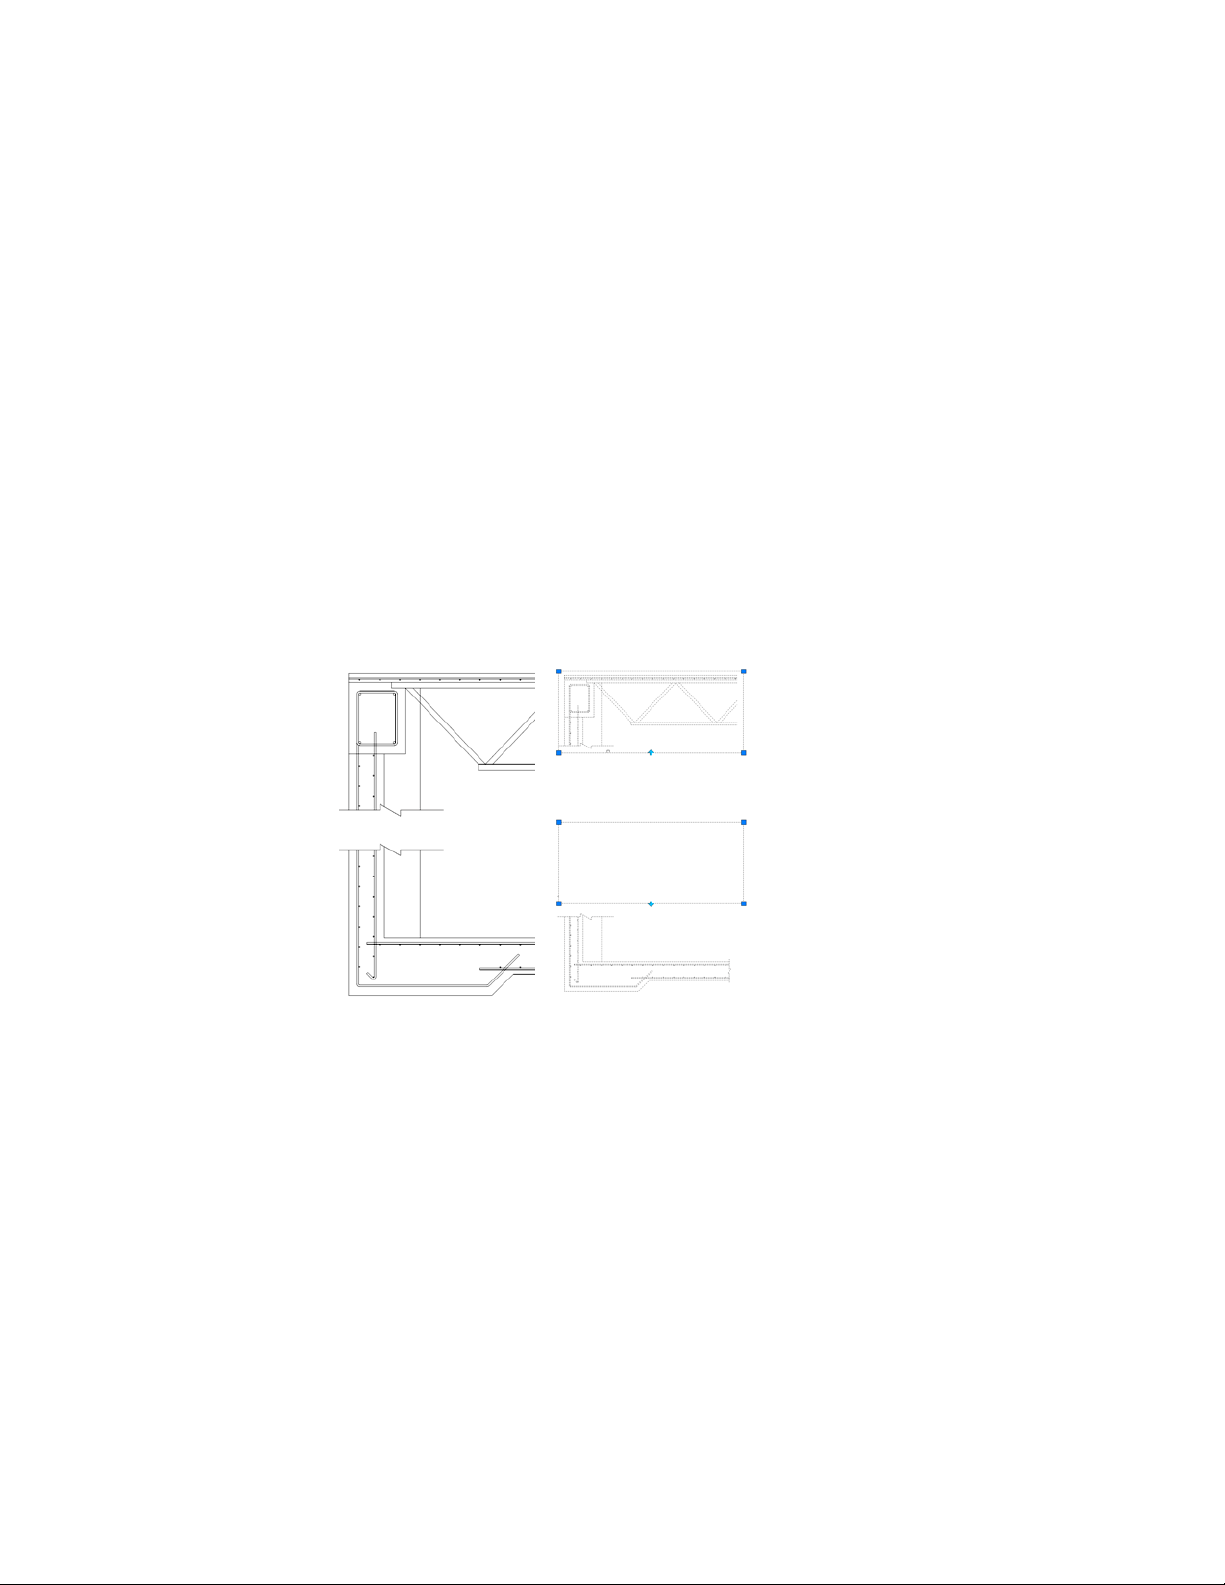
Control the visibility of the clipped area of the external reference or block
reference. When clipping is turned off, the boundary is not displayed and
the entire external reference or block is visible, provided that the objects are
on layers that are turned on and thawed.
Clipping results can be turned on or off using the clipping commands. This
controls whether the clipped area is hidden or displayed.
Control the visibility of clipping boundaries. You can control the display
of the clipping boundary with a clipping frame. The clipping system variable
for XREF, images, and PDF underlays are XCLIPFRAME, PDFFRAME, and
IMAGEFRAME respectively.
Invert the area to be hidden, inside or outside the clipping boundary When
you want the hidden parts of the clipped reference displayed or vice versa,
use the grips to alter the display of the external reference or blocks. With grips
located at the midpoint on the first edge of the clipping boundary, you can
invert the display of the clipped reference inside or outside the boundary.
The grips are visible and can be used when the clipping system variable is
turned on, the reference is selected, and clipped.
Editing Options
After an external reference or block reference has been clipped, it can be
moved, copied, or rotated just like an unclipped external reference or block
reference. The clipping boundary moves with the reference. If an xref contains
654 | Chapter 11 Share Data Between Files

nested clipped xrefs, they appear clipped in the drawing. If the parent xref is
clipped, the nested xrefs are also clipped.
Resize Clipping Boundaries
If you want to change the shape or size of a clipping boundary for external
references and block references, you can use grips to edit the vertices just as
you edit any object with grips.
In case of rectangular grip editing, you can maintain the closed four-sided
rectangle or square shape of the rectangular clipping boundary because two
vertices of the same side of the rectangular clipping boundary are edited
together.
NOTE With Clipping boundaries, you cannot display self-intersecting polygonal
boundaries. An error message is displayed and the boundary reverts to the last
boundary.
Limitations for Clipping Boundaries
When clipping an referenced drawing or block the following limitations apply:
■ A clipping boundary can be specified anywhere in 3D space, but it is always
applied planar to the current UCS.
■ If a polyline is selected, the clipping boundary is applied in the plane of
that polyline.
■ Images in external references or blocks are always clipped within the
rectangular extents of the reference. When you apply polygonal clipping
to images in externally referenced drawings, the clipping boundary is
applied to the rectangular extents of the polygonal boundary, rather than
to the polygon itself.
See also:
Clip Raster Images (page 686)
Clip Underlays (page 675)
Edit Referenced Drawings
Referenced drawings can be edited by opening them directly, or you can edit
the xref in place from within the current drawing. You can edit a block
definition directly from any selected block reference.
Reference Other Drawing Files | 655

Edit a Referenced Drawing in a Separate Window
While the simplest and most direct method for editing xrefs is to open the
source file for the referenced drawing, there is an alternative that can be more
convenient.
If you need to edit the model space objects in an xref, you can access the xref
or a nested xref directly from the Reference Manager or with the XOPEN
command. Select the xref, and then using the shortcut menu in the Reference
Manager, open the xref’ s source file. After you save the edits, close the drawing.
In your original drawing, click the Refresh Content button in the Reference
Manager, and resume working.
NOTE Make sure you know whether the referenced drawing is also referenced by
other drawings, and the changes you make are appropriate in other instances.
See also:
Edit Selected Objects in Referenced Drawings and Blocks (page 656)
Edit Selected Objects in Referenced Drawings and
Blocks
You can modify external references and redefine block definitions from within
the current drawing by using in-place reference editing. Both blocks and xrefs
are considered references.
By editing the reference in place, you can modify the reference within the
visual context of your current drawing.
Often, a drawing contains one or more xrefs as well as multiple block
references. When working with block references, you can select a block, modify
it, view and edit its properties, and update the block definition.
When working with xrefs, you can select the reference you want to work with,
modify its objects, and save back the changes to the reference drawing. You
can make minor changes without having to go back and forth between
drawings.
Understand the Working Set
The objects that you select from the selected xref or block are temporarily
extracted and made available for editing in the current drawing. The set of
656 | Chapter 11 Share Data Between Files
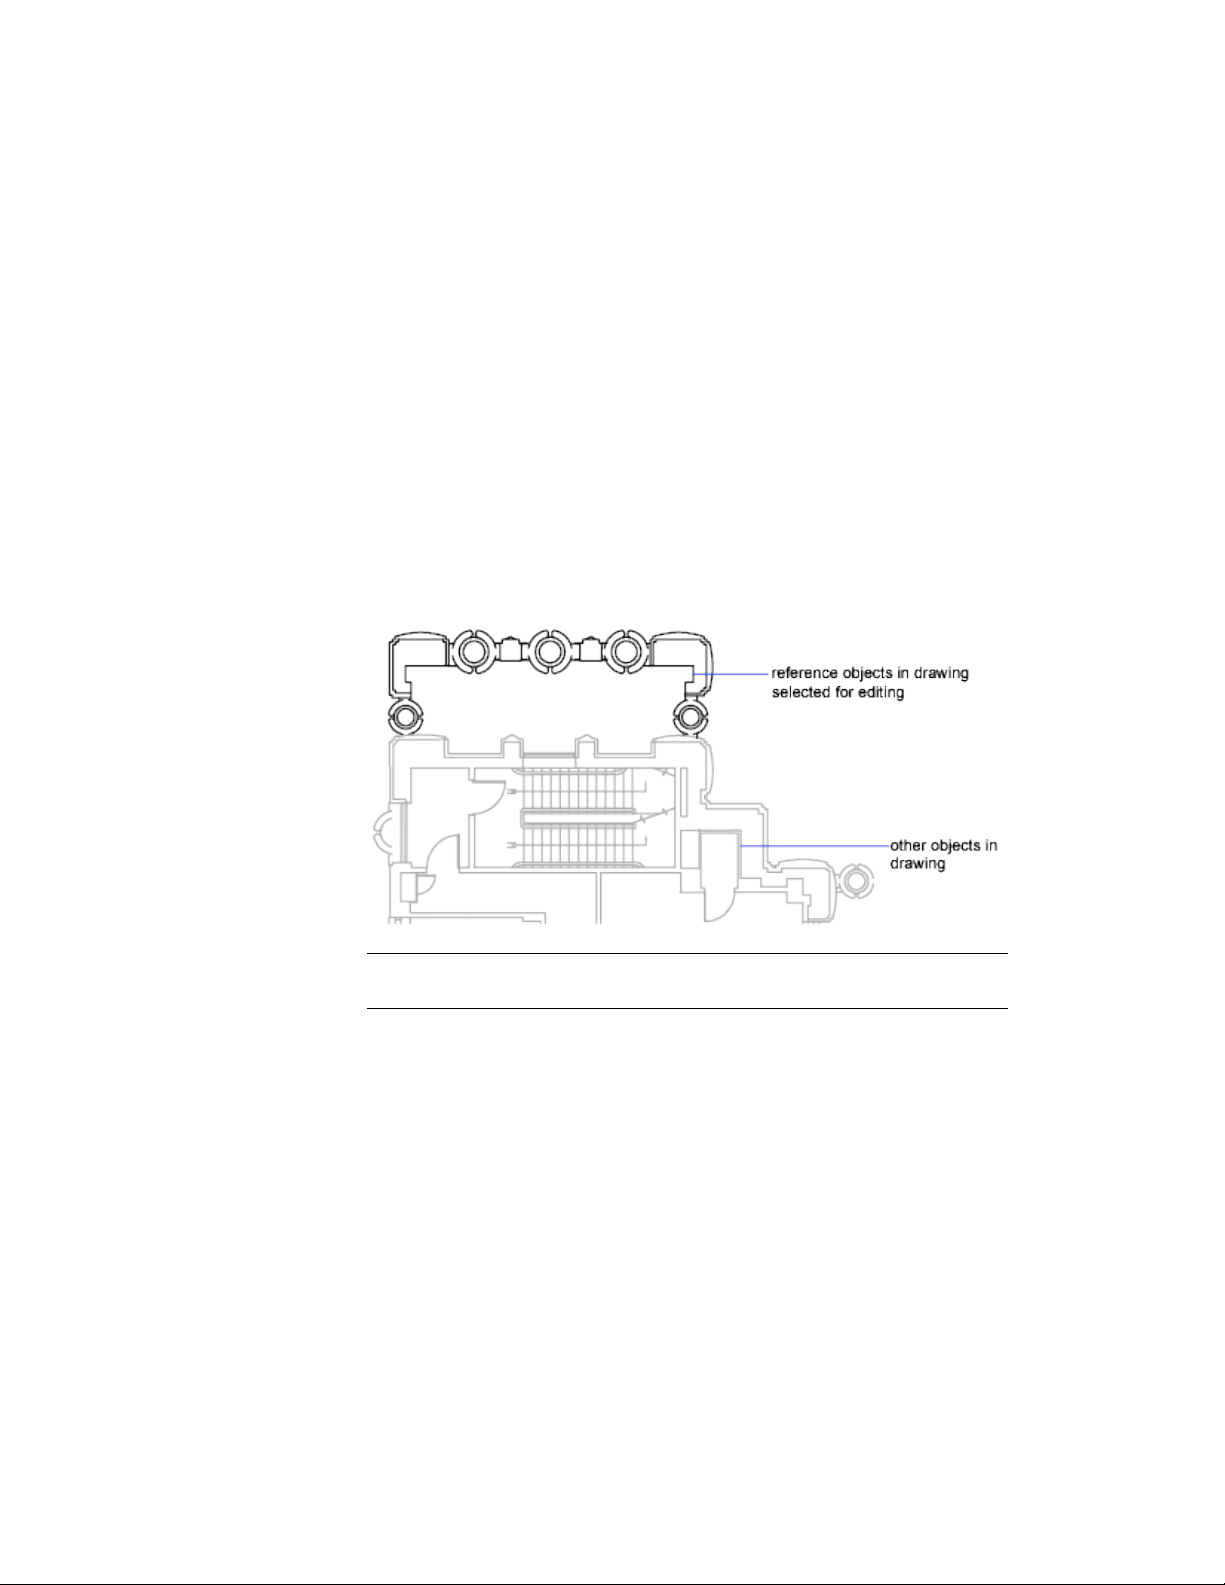
extracted objects is called the working set, which can be modified and then
saved back to update the xref or block definition.
Objects that make up the working set are visually distinct from other objects
in the drawing. All objects in the current drawing, except objects in the
working set, are faded.
Control the Fading of Objects
The XFADECTL system variable controls how objects are displayed while a
reference is edited in place. The set of objects extracted from the reference are
displayed normally. All other objects in the drawing, including objects in the
current drawing and in any references not belonging to the working set, are
faded. The value indicates the intensity of display for objects not in the
working set. The larger the value is for XFADECTL, the more the objects are
faded.
NOTE Objects outside the working set are not faded during in-place reference
editing unless VSCURRENT is set to a value of 2D wireframe.
Reference Editor Visor
The Reference Editor visor is displayed and activated after you select which
nested objects to edit. Using the buttons on the Reference Editor visor, you
can add objects to or remove objects from the working set, and you can discard
or save back changes to the reference. The Reference Editor visor is
automatically dismissed after you save back or discard changes made to the
working set.
Reference Other Drawing Files | 657

NOTE If you plan to make major changes to a reference, open the reference
drawing and edit directly within the file. Using in-place reference editing to make
major changes can increase the size of your current drawing file significantly during
the in-place reference editing session.
See also:
Edit a Referenced Drawing in a Separate Window (page 656)
Use the Working Set to Edit Referenced Drawings and
Blocks
To edit a referenced drawing from within the current drawing, you use the
working set to identify objects that belong to the xref or block definition rather
than the current drawing.
While editing a reference in place, you can add or remove objects from the
working set. If you create a new object while editing a reference in place, it is
almost always added to the working set automatically. Objects that are not
in the working set are displayed as faded in the drawing.
If a new object is created because of changes made to objects outside the
working set, the new object is not added to the working set. For example, your
drawing contains two lines that are not a part of the working set. If you edit
the lines by using FILLET, a new arc is created between the two lines. The arc
is not added to the working set.
When a reference object is part of the working set, you can select the object
for editing even if it is drawn on a locked layer in the reference file. You can
unlock the object's layer and make changes to the object. Changes made to
the object can be saved, but the layer state remains the same in the reference
file, whether it is locked or unlocked.
An object that is removed from the working set is added to the host drawing
and removed from the reference when changes are saved back. An object that
is added to the working set is removed from the host drawing, and is restored
to the reference when the changes are saved back.
Reference Editor Visor
If you select a reference to edit in-place, the Reference Editor visor is displayed.
The buttons on the visor (Add to Working Set, Remove from Working Set,
Discard Changes, and Save) are active only during in-place reference editing.
658 | Chapter 11 Share Data Between Files

The visor is dismissed automatically after changes made to the reference are
saved back or discarded.
Save Back Edited Referenced Drawings and Blocks
While editing a referenced drawing or a block definition in place, you can
save back or discard changes.
While editing a block reference in place, you either can save back or discard
changes made to the reference. If you save back changes to a reference, the
drawing is regenerated.
When the changes are saved back, the block definition is redefined and all
instances of the block are regenerated to reflect the changes. If you choose to
discard the changes, the working set is deleted and the block reference returns
to its original state.
Similarly, while editing an xref in place, you can save back or discard changes.
Objects in the working set that inherit properties not originally defined in the
xref retain those new properties. For example, an xref contains layers A, B,
and C, and the drawing that references it contains layer D. If new objects are
drawn on layer D during in-place reference editing and changes are saved back
to the reference, layer D is copied to the xref drawing.
If you remove objects from the working set and save changes, the objects are
removed from the reference and added to the current drawing. Any changes
you make to objects in the current drawing (not in the xref or block) are not
discarded. If you delete any object that is not in the working set, the object
is not restored even if you choose to discard changes. You can return the
drawing to its original state by using UNDO. If you make unwanted changes
to an xref and use REFCLOSE to save back the changes, you must use UNDO
to undo any changes made during the reference editing session. After you
have undone any unwanted changes, use REFCLOSE to save changes to restore
the xref file to its original state.
WARNING While editing a reference in place, if you delete an object that is not
in the working set, the object is not restored if you discard changes at the closing
of the reference editing session.
Objects in the current drawing that inherit properties defined by the xref
retain those new properties. Properties taken from the xref drawing are bound
to the current drawing. The xref layer named SITE, for example, appears in
the current drawing as $#$SITE when assigned to an object not in the working
set.
Reference Other Drawing Files | 659

If BINDTYPE is set to 0, a prefix of $#$ is added to the reference name in the
current drawing. If BINDTYPE is set to 1, reference names remain unchanged
in the current drawing, similar to names of inserted objects.
NOTE When you edit and save an xref in place, the original drawing preview is
no longer available unless you open and save the referenced drawing.
Edit Referenced Drawings and Blocks with Nesting or
Attributes
If the reference you select for editing has attached xrefs or block definitions,
the reference and its nested references are displayed and available for selection
in the Reference Edit dialog box.
Nested references are displayed only if the object chosen for selection is part
of a nested reference. Only one reference at a time can be selected for editing.
If a block reference with attributes is selected for editing, you can choose to
display the attribute definitions in the reference and make them available for
editing. The attributes are made invisible and the attribute definitions are
available for editing along with the selected reference geometry. When changes
are saved back to the block reference, the attributes of the original reference
remain unchanged. The new or altered attribute definitions only affect
subsequent insertions of the block; the attributes in existing block instances
are not affected.
See also:
Edit a Referenced Drawing in a Separate Window (page 656)
Edit Selected Objects in Referenced Drawings and Blocks (page 656)
Resolve Referenced Drawing Errors
If a referenced drawing cannot be loaded when you open a drawing, an error
message is displayed.
660 | Chapter 11 Share Data Between Files

Resolve Missing External References
If a referenced drawing cannot be located when you open a drawing, several
options available to you.
The program stores the folder path of the referenced drawing. Each time you
open or plot the drawing, or use the Reload option in the Reference Manager
to update the xref, the program checks the folder path to determine the name
and location of the referenced drawing file.
IIf the name or location of the drawing file has changed, the program cannot
locate or reload the xref, and it displays an error message that displays the
folder path and name of the missing drawing file.
In the drawing, at each insertion of the missing xref, the program displays
text that displays the folder path of the missing xref. You can use the XREF
Path option to update or correct the path.
Along with error messages being displayed at the Command prompt, a task
dialog box might be displayed that allows you to ignore all missing xrefs or
update their folder locations. You can use the Reference Manager palette to
update the locations of the unresolved references.
To avoid these errors make sure that when you transfer or distribute drawing
files that have xrefs attached, you also include all the referenced files.
Change Nested Xref Paths
When a drawing is opened and a nested xref is loaded, the program attempts
to find the xref in the original xref path first. If the xref is not found, the
following search is initiated in the order shown:
■ Current folder of the host drawing
■ Project search paths defined in the Project Files Search Path item on the
Application tab in the Application Preferences dialog box
■ Search paths defined in the Support File Search Paths item on the
Application tab in the Application Preferences dialog box
This search order helps ensure that revisions made to the xref are reflected in
the current drawing, and also makes it possible for the xref to be found if its
folder path has changed.
See also:
Update Referenced Drawing Attachments (page 650)
Reference Other Drawing Files | 661

Resolve Circular External References
If a referenced drawing contains a sequence of nested references that refers
back to itself, an error message is displayed.
A drawing that contains a sequence of nested references that refers back to
itself is considered a circular reference. For example, if drawing A attaches
drawing B, which attaches drawing C, which attaches drawing A, the reference
sequence A>B>C>A is a circular reference.
If the program detects a circular reference while attaching an xref, a warning
is displayed asking you if you want to continue. If you respond with yes, the
program reads in the xref and any nested xrefs to the point where it detects
the circularity. If you respond with no, the process is halted and the xref is
not attached.
If a circular reference is encountered while loading a drawing, an error message
is displayed and the circular reference for the current session is broken. For
example, if you have the circular reference A>B>C>A, and you open a.dwg,
the program detects and breaks the circularity between c.dwg and a.dwg. The
following error message is displayed:
Breaking circular reference from C to current drawing.
Resolve Name Conflicts in External References
When you attach an xref, the names of its blocks, dimension styles, layers,
linetypes, and text styles are differentiated from those in the current drawing.
A typical xref definition includes objects, such as lines or arcs. It also includes
xref-dependent definitions of blocks, dimension styles, layers, linetypes, and
text styles. When you attach an xref, the program differentiates the names of
these xref-dependent named objects from those in the current drawing by
preceding their names with the name of the referenced drawing and a vertical
bar character ( | ). For example, the xref-dependent named object that is a
layer named STEEL in a referenced drawing called stair.dwg is listed as
STAIR|STEEL.
When you attach an xref, the definitions of its dependent named objects are
not added to your drawing permanently. Instead, these definitions are loaded
from the referenced drawing file each time you reload it.
662 | Chapter 11 Share Data Between Files

Bind Xref-Dependent Definitions
An xref-dependent named object's definition can change if the referenced
drawing file is modified. For example, a layer name from a referenced drawing
can change if the referenced drawing is modified. The layer name can even
disappear if it is purged from the referenced drawing. This is why the program
does not allow you to use an xref-dependent layer or other named object
directly. For example, you cannot insert an xref-dependent block or make an
xref-dependent layer the current layer and begin creating new objects on it.
To avoid the restrictions on xref-dependent named objects, you can bind them
to your current drawing. Binding makes the xref-dependent named objects
that you select become a permanent part of your current drawing.
When xref-dependent named objects are merged into a drawing through
binding, you can use them the same way you use the drawing's own named
objects. After you bind an xref-dependent named object, the vertical bar
character ( | ) is removed from the name and replaced with two dollar signs
($$) separated by a number (usually zero): for example, the referenced layer,
STAIR|STEEL, becomes STAIR$0$STEEL. You can then use the RENAME
command to change STAIR$0$STEEL to STEEL.
If you specify a layer whose associated linetype is not CONTINUOUS, the
referenced linetype is also bound. If you apply XBIND to a block, all named
objects that are referenced by the objects in the block are also bound. If the
block contains a reference to an xref, that xref and all of its dependent
definitions are bound.
Track External Reference Operations (Log File)
You can maintain a record of actions while attaching, detaching, and reloading
xrefs, and while loading a drawing containing xrefs.
This log is maintained only if the XREFCTL system variable is set to 1. The
default setting is 0.
The log file is an ordinary ASCII text file with the same name as the current
drawing and the file extension .xlg. If you load a drawing with the file name
sample.dwg, for example, the program searches for a log file named sample.xlg
in the current folder. If the file does not exist, a new file is created with that
name.
Once a log file has been created for a drawing, the program continues to
append information to it. The program writes a title section to the log file
Reference Other Drawing Files | 663

each time the file is opened. If the log file becomes too large, you can delete
it.
Example: A Sample Title Section from an Xref Log File
This title section contains the name of the current drawing, the date and time,
and the operation being performed.
=============================
Drawing: detail
Date/Time: 09/28/99 10:45:20
Operation: Attach Xref
=============================
During a detaching or reloading operation, the program includes the nesting
level of all affected xrefs immediately following the title section. To see a
reference tree for a set of xrefs in your current drawing, use Detach or Reload
and check the resulting entries in the log file.
Example: A Sample Log File Entry Showing Nested Xrefs
In the following example, the xref ENTRY_DR contains two nested xrefs:
HARDWARE and PANELS. The xrefs HARDWARE and PANELS also each contain
two xrefs.
==============================
Drawing: detail
Date/Time: 10/05/99 15:47:39
Operation: Reload Xref
=============================
Reference tree for ENTRY_DR:
ENTRY_DR Xref
-HARDWARE Xref
--LOCKSET Xref
--HINGES Xref
-PANELS Xref
--UPPER Xref
--LOWER Xref
The program writes an entry in the log file for each xref-dependent named
object temporarily added to the current drawing and for any errors that occur.
Most error messages are written both to the screen and to the log file.
664 | Chapter 11 Share Data Between Files

Example: A Sample Log File That Shows the Results of Attaching an Xref
The following example shows a partial listing of the log file entries generated
when the external reference STAIR is attached to the working drawing test.dwg.
The log file lists the definition (symbol) table affected and the name of the
definition added, along with a status message.
==============================
Drawing: test
Date/Time: 12/18/99 14:06:34
Operation: Attach Xref
=============================
Attach Xref STAIR: \ACAD\DWGS\STAIR.dwg
Searching in ACAD search path
Update block symbol table:
Appending symbol: STAIR|BOLT
Appending symbol: STAIR|BOLT-HALF
...
block update complete.
Update Ltype symbol table:
Appending symbol: STAIR|DASHED
Appending symbol: STAIR|CENTER
Appending symbol: STAIR|PHANTOM
Ltype update complete.
Update Layer symbol table:
Appending symbol: STAIR|STEEL-HIDDEN
Appending symbol: STAIR|OAK
...
Layer update complete.
STAIR loaded.
Track External Reference Operations (Log File)
To use the xref log file
1 At the Command prompt, enter xrefctl.
2 Enter 1 to turn logging on or 0 to turn logging off.
3 Press Enter.
Logging is off by default.
Reference Other Drawing Files | 665

Increase Performance with Large Referenced
Drawings
There are several features that can improve performance when dealing with
large referenced drawings.
Overview of Demand Loading
The program uses demand loading and saving drawings with internal indexes
to increase performance with large referenced drawings that have been clipped,
or that have many objects on frozen layers. With demand loading, only the
data from the reference drawing that is necessary to regenerate the current
drawing is loaded into memory. In other words, referenced data is read in “on
demand.”
Demand loading works in conjunction with the INDEXCTL, XLOADCTL, and
XLOADPATH system variables.
Unload Xrefs in Large Drawings
When a referenced drawing (xref) is unloaded from the current drawing, the
drawing opens much faster and uses less memory.
The xref definition is unloaded from the drawing file, but the internal pointer
to the referenced drawing remains. The xref is not displayed, and nongraphical
object information does not appear in the drawing. However, you can restore
all the information by reloading the xref. If XLOADCTL (demand loading) is
set to 1, unloading the drawing unlocks the original file.
You should unload a reference file if it is not needed in the current drawing
session but may be used later for plotting. You can maintain a working list of
unloaded xrefs in the drawing file that you can load as needed.
Work with Demand Loading in Large Drawings
With demand loading, only the data from the referenced drawing that is
necessary to regenerate the current drawing is loaded into memory.
666 | Chapter 11 Share Data Between Files

To realize the maximum benefits of demand loading, you need to save the
referenced drawings with layer and spatial indexes. The performance benefits
of demand loading are most noticeable when you do one of the following:
■ Clip the xref with the program to display a small fraction of it. A spatial
index is saved in the externally referenced drawing.
■ Freeze several layers of the xref. The externally referenced drawing is saved
with a layer index.
If demand loading is turned on, and you have clipped xrefs that were saved
with spatial indexes, objects in the referenced drawing database that are
contained within the clip volume comprise the majority of the objects read
into the drawing. If the clip volume is modified, more objects are loaded as
required from the reference drawing. Similarly, if you have xrefs with many
layers frozen that were saved with layer indexes, only the objects on those
thawed layers are read into the current drawing. If those xref-dependent layers
are thawed, the program reads in that geometry from the reference drawing
as required.
When demand loading is turned on, the program places a lock on all reference
drawings so that it can read in any geometry it needs to on demand. Other
users can open those reference drawings, but they cannot save changes to
them. If you want other users to be able to modify an xref that is being demand
loaded into another drawing, use demand loading with the Copy option.
If you turn on demand loading with the Enable with Copy option, the program
makes a temporary copy of the referenced drawing and demand loads the
temporary file. You can then demand load the xref while allowing the original
reference drawing to be available for modification. When you turn off demand
loading, the program reads in the entire reference drawing regardless of layer
visibility or clip instances.
Layer and spatial indexes were added in AutoCAD Release 14 and AutoCAD
LT 97. If you externally reference a drawing saved in a release previous to this,
you do not see the same performance benefit as drawings saved with the
indexes. For maximum performance, use demand loading with referenced
drawings saved with layer and spatial indexes turned on in AutoCAD Release
14, AutoCAD LT 97, or more recent versions.
Work with Layer and Spatial Indexes
To receive the maximum benefit of demand loading, it is recommended that
you save any drawings that are used as xrefs with layer and spatial indexes.
Reference Other Drawing Files | 667

A layer index is a list showing which objects are on which layers. This list is
used when the program is referencing the drawing in conjunction with demand
loading to determine which objects need to be read in and displayed. Objects
on frozen layers in a referenced drawing are not read in if the referenced
drawing has a layer index and is being demand loaded.
The spatial index organizes objects based on their location in 3D space. This
organization is used to efficiently determine which objects need to be read in
when the drawing is being demand loaded and clipped as an xref. If demand
loading is turned on, and the drawing is attached as an xref and clipped, the
program uses the spatial index in the externally referenced drawing to
determine which objects lie within the clip boundary. The program then reads
only those objects into the current session.
Spatial and layer indexes are best used in drawings that will be used as xrefs
in other drawings where demand loading is enabled. Drawings that are not
going to be used as xrefs or partially opened will not benefit from layer and
spatial indexing or demand loading.
Set Paths for Temporary Xref File Copies
When you turn on demand loading with copy, you can control where copies
of externally referenced drawings are to be placed.
When you turn on demand loading with copy, the XLOADPATH system
variable can be used to indicate the path where copies of externally referenced
drawings are to be placed. The path you specify remains in effect for all drawing
sessions until you indicate a different path. If no value for XLOADPATH is
specified, the temporary file copies are placed in the standard folder for
temporary files.
If you find that referencing drawings over a network is slow, it is recommended
that you set XLOADPATH to reference a local folder, and set XLOADCTL to
2 so that the externally referenced files are demand loaded from your local
machine. Conversely, to minimize the number of temporary files created by
multiple users referencing the same drawing, those users can set XLOADPATH
to point to a common folder. In this manner, multiple sessions of the program
can share the same temporary copies of reference drawings.
You can set XLOADPATH in the Application Preferences dialog box,
Application tab, Temporary External Reference File Location, and indicate the
folder path where copies of externally referenced files are to be placed.
668 | Chapter 11 Share Data Between Files

Work with Data in Other Formats
You can work with many different types of files, including files created with
other applications and files created in earlier releases of the program. You can
also specify search paths for drawing and support files.
See also:
Repair a Damaged Drawing File (page 52)
Import Other File Formats
You can import files, other than DWG files, that were created with other
applications into your drawings.
Import ACIS SAT Files
You can import geometry objects stored in SA (ASCII) files using the ASCISIN
command.
ACISIN converts the model to a body object or to 3D solids and regions if the
body is a true solid or a true region.
Convert DXF and DXB Files to DWG Format
DXF and DXB files are two types of drawing interchange files used to transfer
data between various applications.
A DXF (drawing interchange format) file is either a binary or an ASCII
representation of a drawing file. It is often used to share drawing data between
other CAD programs.
A DXB (drawing interchange binary) file is a specially coded binary version
of a DXF file used for plotting, and can be used to “flatten” 3D wireframe
drawings into 2D vectors.
You can convert a DXF or DXB file to DWG format by opening the file and
saving it in DWG format. You can then work with the resulting drawing file
as you would with any other drawing file.
Work with Data in Other Formats | 669
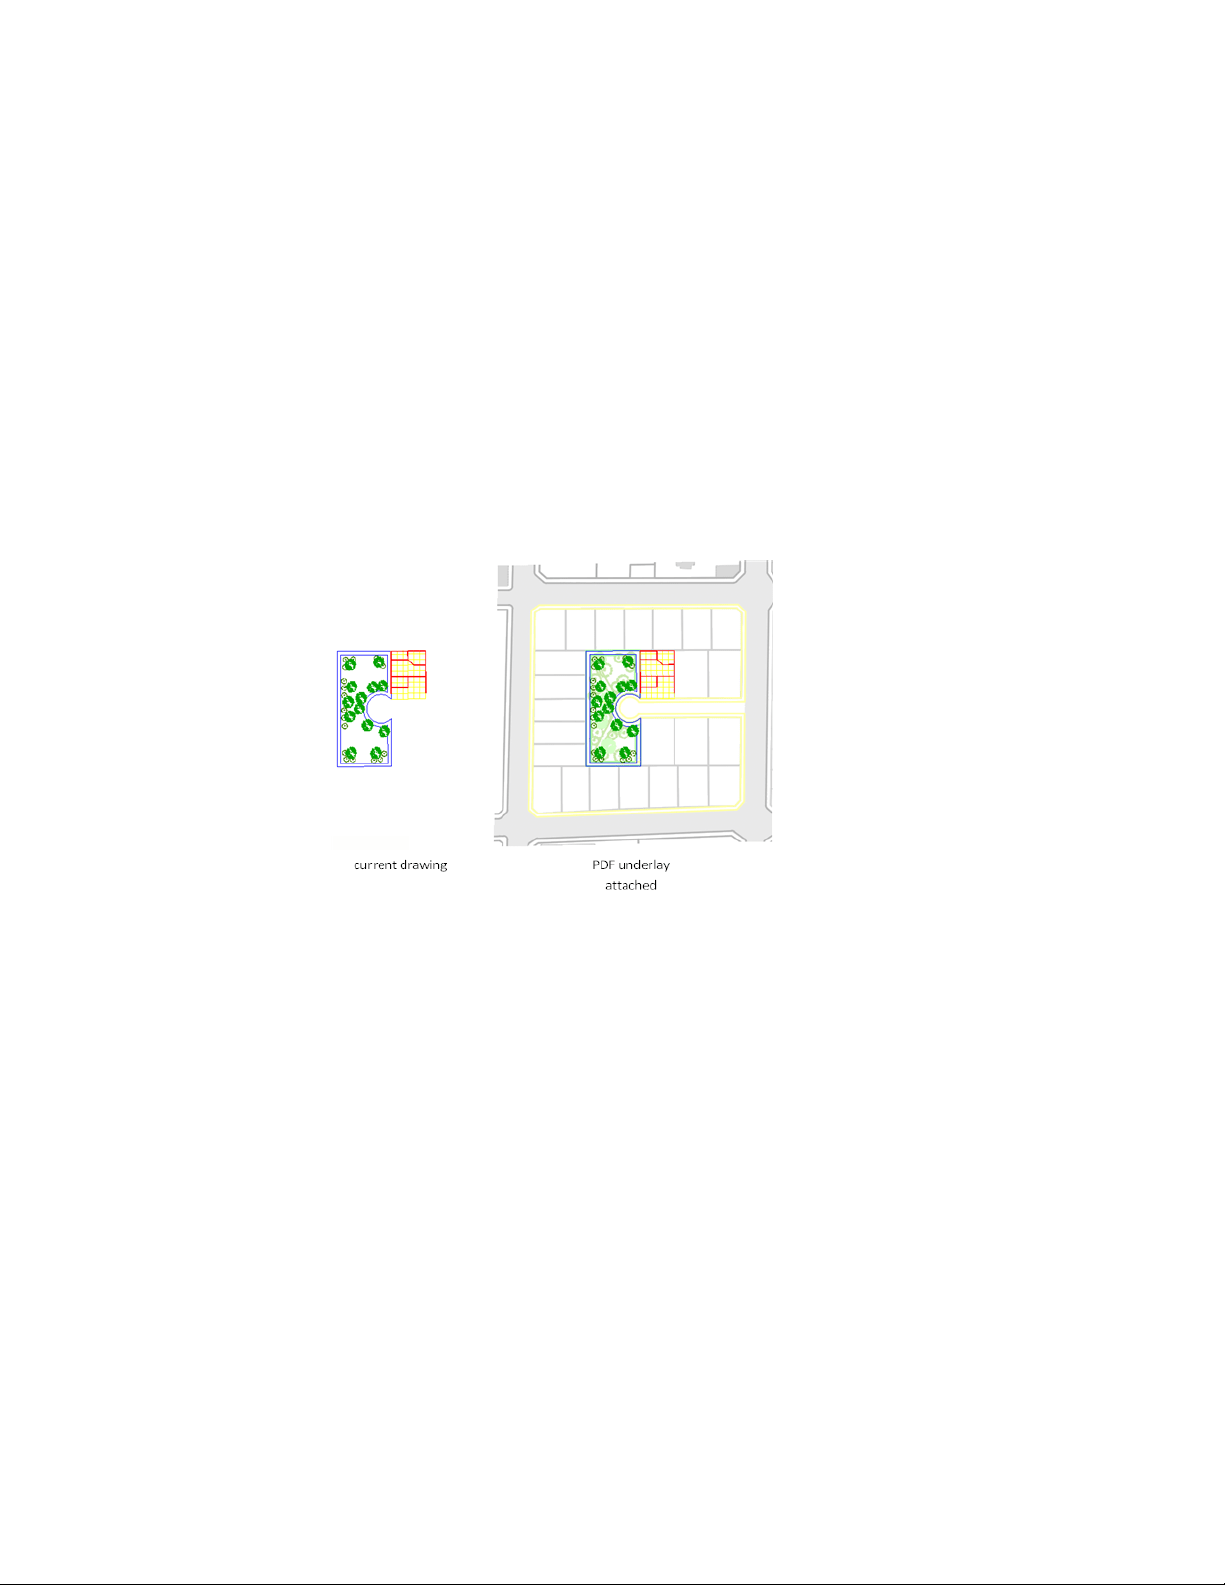
Attach PDF Files as Underlays
You can display PDF files as underlays in your drawing.
Overview of PDF Underlays
You can underlay and snap to 2D geometry stored in PDF files.
Underlays are similar to attached raster images in that they provide visual
content but also support object snapping and clipping. Unlike external
references, underlays cannot be bound to the drawing.
Use the Visor to Work with Underlays
If you select an underlay the PDF Underlay visor is displayed. The visor
contains options for adjusting, clipping and displaying underlays. The visor
is dismissed automatically after the underlay is deselected.
Attach, Scale, and Detach PDF Underlays
You can add or remove references to underlays within drawing files, or you
can change their relative size.
670 | Chapter 11 Share Data Between Files

Attach PDF Files as Underlays
You can attach a PDF file as an underlay to a drawing file.
You reference and place underlay files in drawing files the same as you do
raster image files; they are not actually part of the drawing file. Like raster
files, the underlay is linked to the drawing file through a path name. The path
to the file can be changed or removed at any time.
NOTE Although underlay files are reproductions of their source drawing, they are
not as precise as drawing files. Underlays will show slight discrepancies in precision.
By attaching underlays this way, you can use files in your drawing without
greatly increasing the drawing file size. You can only view PDF underlays in
the 2D Wireframe visual style.
Attach PDF Files
There are a few things specific to PDF files that you need consider. PDF files
with more than one page are attached one page at a time. Also, hypertext
links from PDF files are converted to straight text and digital signatures are
ignored supported.
Attaching an Underlay Multiple Times
You can reattach an underlay multiple times, treating it as a block. Each
underlay has its own clip boundary and settings for contrast, fade, and
monochrome. However, you cannot bind an underlay to a drawing and you
cannot edit or modify the underlay’s content.
Layers in Underlay Files
If the underlay file contains layers, you can control how the layers display
after attaching the file. If the file does not contain layer information, the
Underlay Layers dialog box does not display any layer information.
Underlay Files in Xrefs
DWG file references (xrefs), in a drawing can include an underlay. In this
situation, objects in the underlay are visible in the parent DWG file.
For example, drawing A includes a PDF underlay showing some mechanical
details. You need the content of drawing A attached to your current drawing,
Work with Data in Other Formats | 671

drawing B. If you attach drawing A as an external reference to drawing B, the
PDF underlay that was already attached to drawing A is also be present.
All of the property settings made to the underlay in the external reference,
such as clipping boundaries, appear as they do in the parent drawing.
See also:
Attach and Detach Referenced Drawings (page 644)
Detach PDF Underlays
Underlays that are no longer needed can be detached from a drawing file.
When you detach an underlay, all instances of the underlay are removed from
the drawing, and the linking path to the file is removed.
To hide the display of an underlay temporarily, you can unload it rather than
detach it. This action preserves the underlay location for reloading later.
NOTE Erasing an individual instance of an underlay is not the same as detaching
it. An underlay must be detached to remove the link from your drawing to the
file.
Unload PDF Underlays
To improve performance, you can unload underlays from a drawing file.
When you do not need an underlay in the current drawing session, you can
improve performance by temporarily unloading it. Unloaded underlays are
not displayed or plotted. Unloading an underlay does not remove its link. If
you do not have sufficient memory to open multiple underlays in a drawing,
underlays are automatically unloaded.
Work with PDF Underlays
You can control the display of layers, use object snaps, and adjust display
settings with attached underlays.
672 | Chapter 11 Share Data Between Files

Control the Display of Layers in a PDF Underlay
You can turn layers on and off in a PDF underlay.
By default, all visible layers of an underlay are turned on when you attach the
file. It is usually convenient to turn off any unneeded layers to reduce the
visual complexity of your work.
Use the PDFLAYERS or ULAYERS command, Underlay Layers button on the
PDF Underlay visor, or right-click a selected underlay and click View PDF
Layers.
NOTE If the Underlay Layers dialog box is empty, there are no layers in the
underlay.
You can use the Properties Inspector to determine whether any layers are
turned off in an underlay.
■ If no layers are turned off, the Layer Display Override property is set to
None.
■ If at least one layer is turned off, the Layer Display Override property is
set to Applied.
Modify the Position, Scale, or Rotation of a PDF Under-
lay
You specify a PDF underlay’s position, scale, or rotation when you attach an
underlay file. You can also modify these settings later during the drafting
process.
By default, the insertion point of a file is 0,0,0, its scale factor is 1, and its
rotation angle is 0. You can use general modify commands such as MOVE,
SCALE, ROTATE, MIRROR, ARRAY, and so on.
Use Grips with Underlays
While underlay behavior generally mimics raster image behavior, one exception
is the way that grips work. In this case, the behavior more closely parallels
block behavior. Normally, an underlay displays only a base grip. You can use
a base grip to reposition an underlay in a drawing. If you create a clipping
boundary, additional grips display for each corner of the boundary. See Clip
Underlays (page 675).
Work with Data in Other Formats | 673
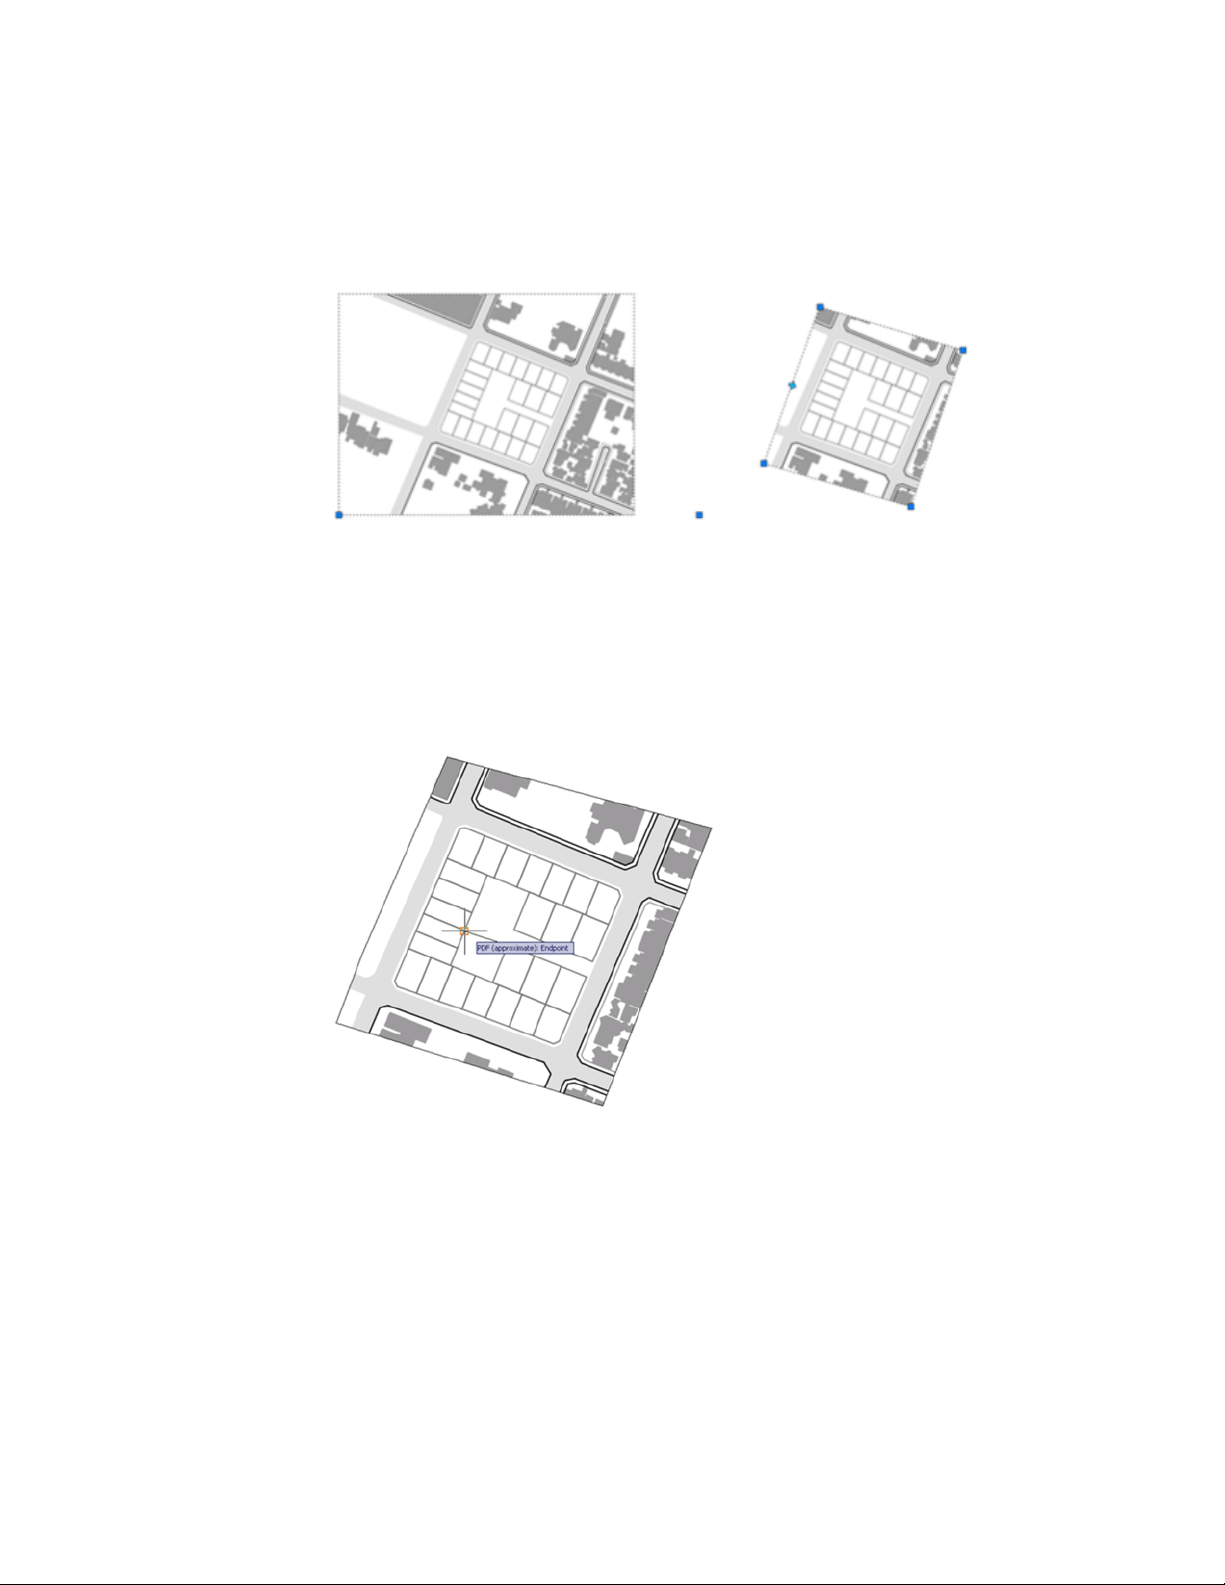
The grip for the base point is the lower-left corner of the underlay.
Use Object Snaps with PDF Underlays
Use object snaps to draw or edit objects relative to a precise location.
PDF underlay object snaps are similar to regular object snaps except that they
can be turned on and off separately from regular object snaps, and that they
apply only to the objects in the attached file.
Object snapping to PDF underlays is similar to object snapping to drawing
geometry. However, object snapping might not behave as expected, depending
on how the PDF was created. For example, if the PDF was made from scanned
architectural plans, the PDF is a raster image, not a vector-based image.
Therefore, object snapping does not work. Also, geometry from PDF’s that
674 | Chapter 11 Share Data Between Files

were created outside of AutoCAD may contain nonstandard snapping points,
such as circles with no center points.
Use the PDFOSNAP and UOSNAP system variables to turn object snapping on
and off.
Object snapping can also be turned on and off by a shortcut menu. Select an
underlay and right-click to display the object snap menu option.
Adjust PDF Underlay Contrast, Fade, Monochrome,
and Colors for the Background
You can modify the contrast, fade, and monochrome settings of a PDF
underlay. Also, so that the underlay is visible, you can adjust the underlay
colors based on the current background color of the drawing window.
Adjusting these settings does not alter the original file and does not affect
other instances of the underlay in the drawing. You can change the contrast,
fade, monochrome, and colors in the Properties Inspector or on the PDF
Underlay visor when an underlay is selected. You can also use the PDFADJUST
command.
If you change contrast, fade, and monochrome values, plotted output is
affected.
Adjust Colors for Background
Adjust Colors for Background controls whether the underlay colors are visible
against the drawing background color. The default setting of Yes indicates
that the background colors of the underlay and the drawing environment are
analyzed to see if they are both light or both dark, or is one dark and the other
light. When one background is light and the other dark, the colors of the
underlay are inverted so the underlay is displayed. If the setting is changed
to No or Off, the original colors of the underlay are used. Depending on the
background colors, the underlay might not be visible.
Clip PDF Underlays
You can use a clipping boundary to clip a PDF underlay.
You can define part of an underlay that you want to display and plot by setting
up a clipping boundary with PDFCLIP, IMAGECLIP, VPCLIP, and XCLIP. The
Work with Data in Other Formats | 675
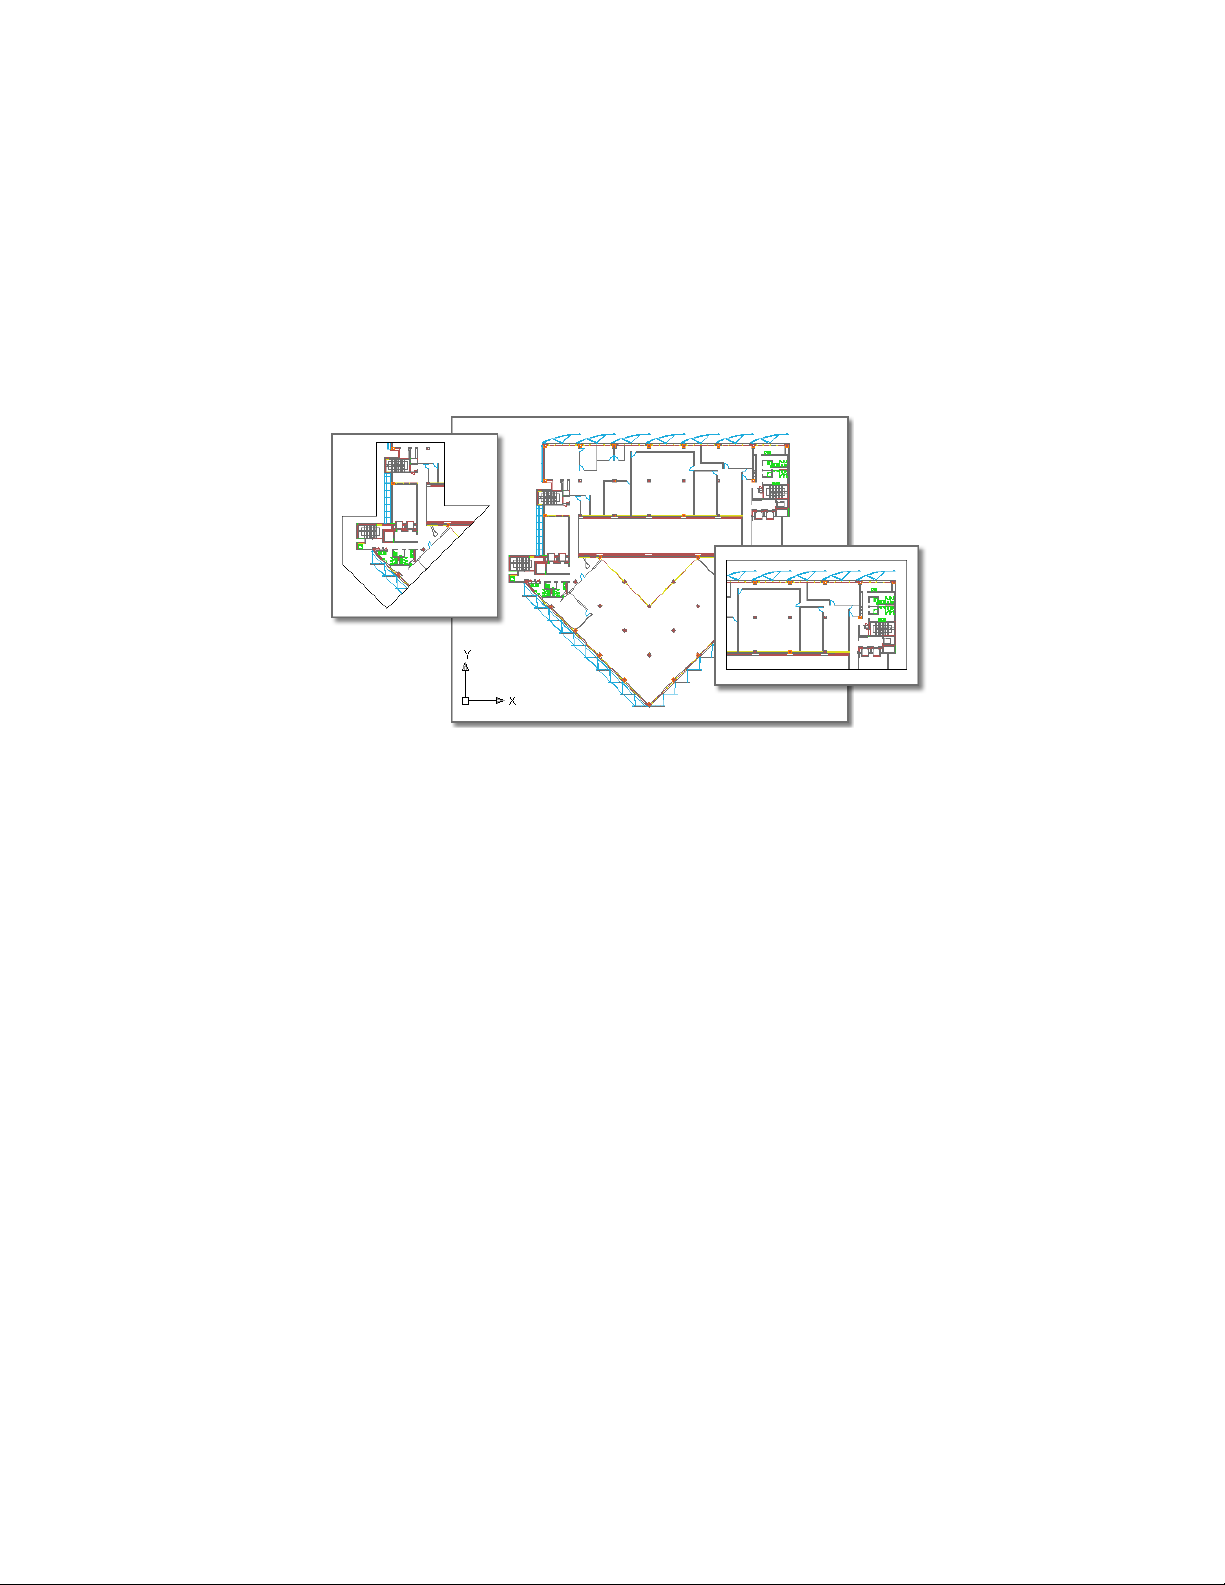
clipping boundary can be a closed polyline, rectangle or a polygon with vertices
within the overall extents of the underlay. Each instance of an underlay can
only have one clipped boundary. Multiple instances of the same underlay can
have different boundaries.
Following is an example of an underlay with insets showing polygonal (l) and
rectangular (r) clipping boundaries:
When the clipping boundary is no longer needed, you can delete the clipped
boundary from the underlay and the underlay is displayed with its original
boundary. You can also invert the area to be hidden inside or outside the
clipping boundary. With grips located at the midpoint on the first edge of the
clipping boundary, you can invert the display of the clipped reference inside
or outside the boundary.
676 | Chapter 11 Share Data Between Files
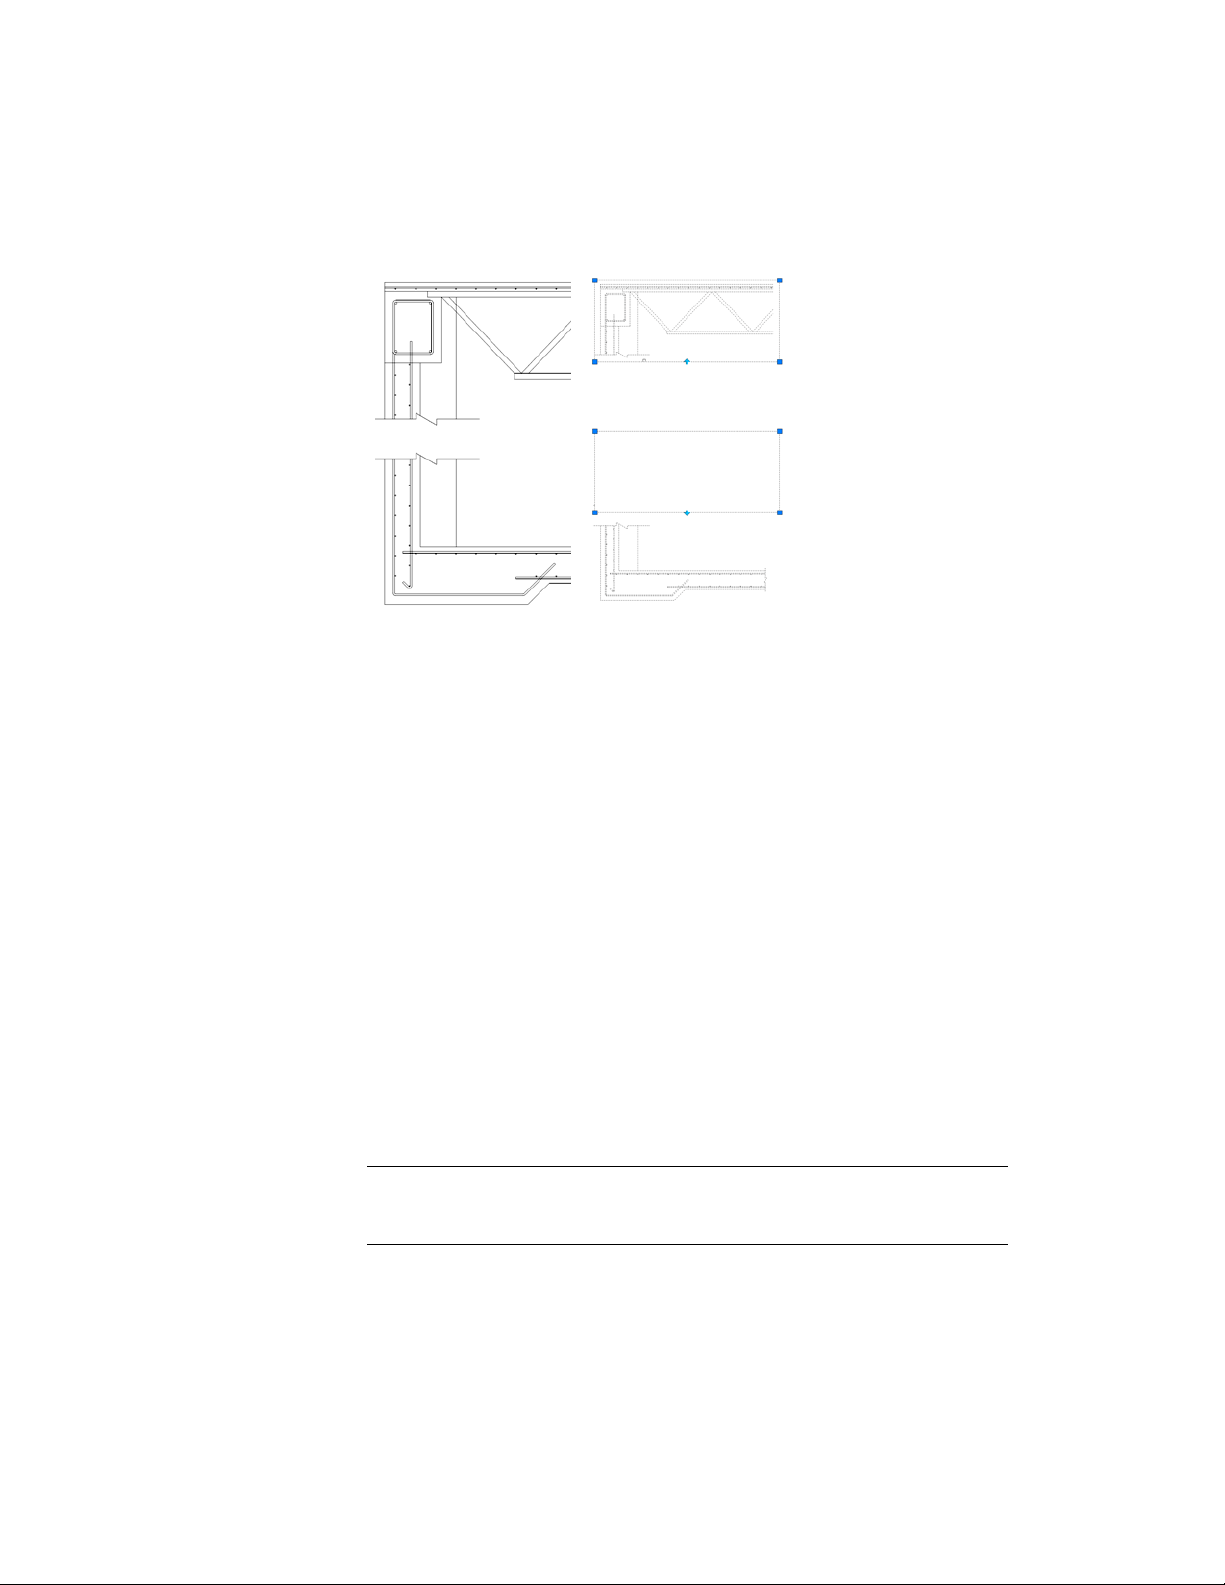
You can control the way clipping boundaries and grips display with the
clipping frame system variables. The clipping frame system variable are FRAME,
PDFFRAME, XCLIPFRAME, and IMAGEFRAME.
See also:
Clip External References and Blocks (page 653)
Clip Raster Images (page 686)
Hide and Show PDF Underlay Frames
You can display and plot a border around the PDF underlay or the clipping
boundary.
A frame is a visual border that shows the extents of the underlay, or the clipped
boundary of the underlay. When underlay frames are hidden, clipped underlays
are still displayed to their specified boundary limits; only the boundary is
affected.
Use the PDFFRAME or FRAME system variables to not only display frames,
but also to specify whether or not to plot them.
NOTE Underlays can be selected if they are not on a locked layer; for example, if
the underlay is part of a named selection set made with the All option when
selecting objects.
Work with Data in Other Formats | 677
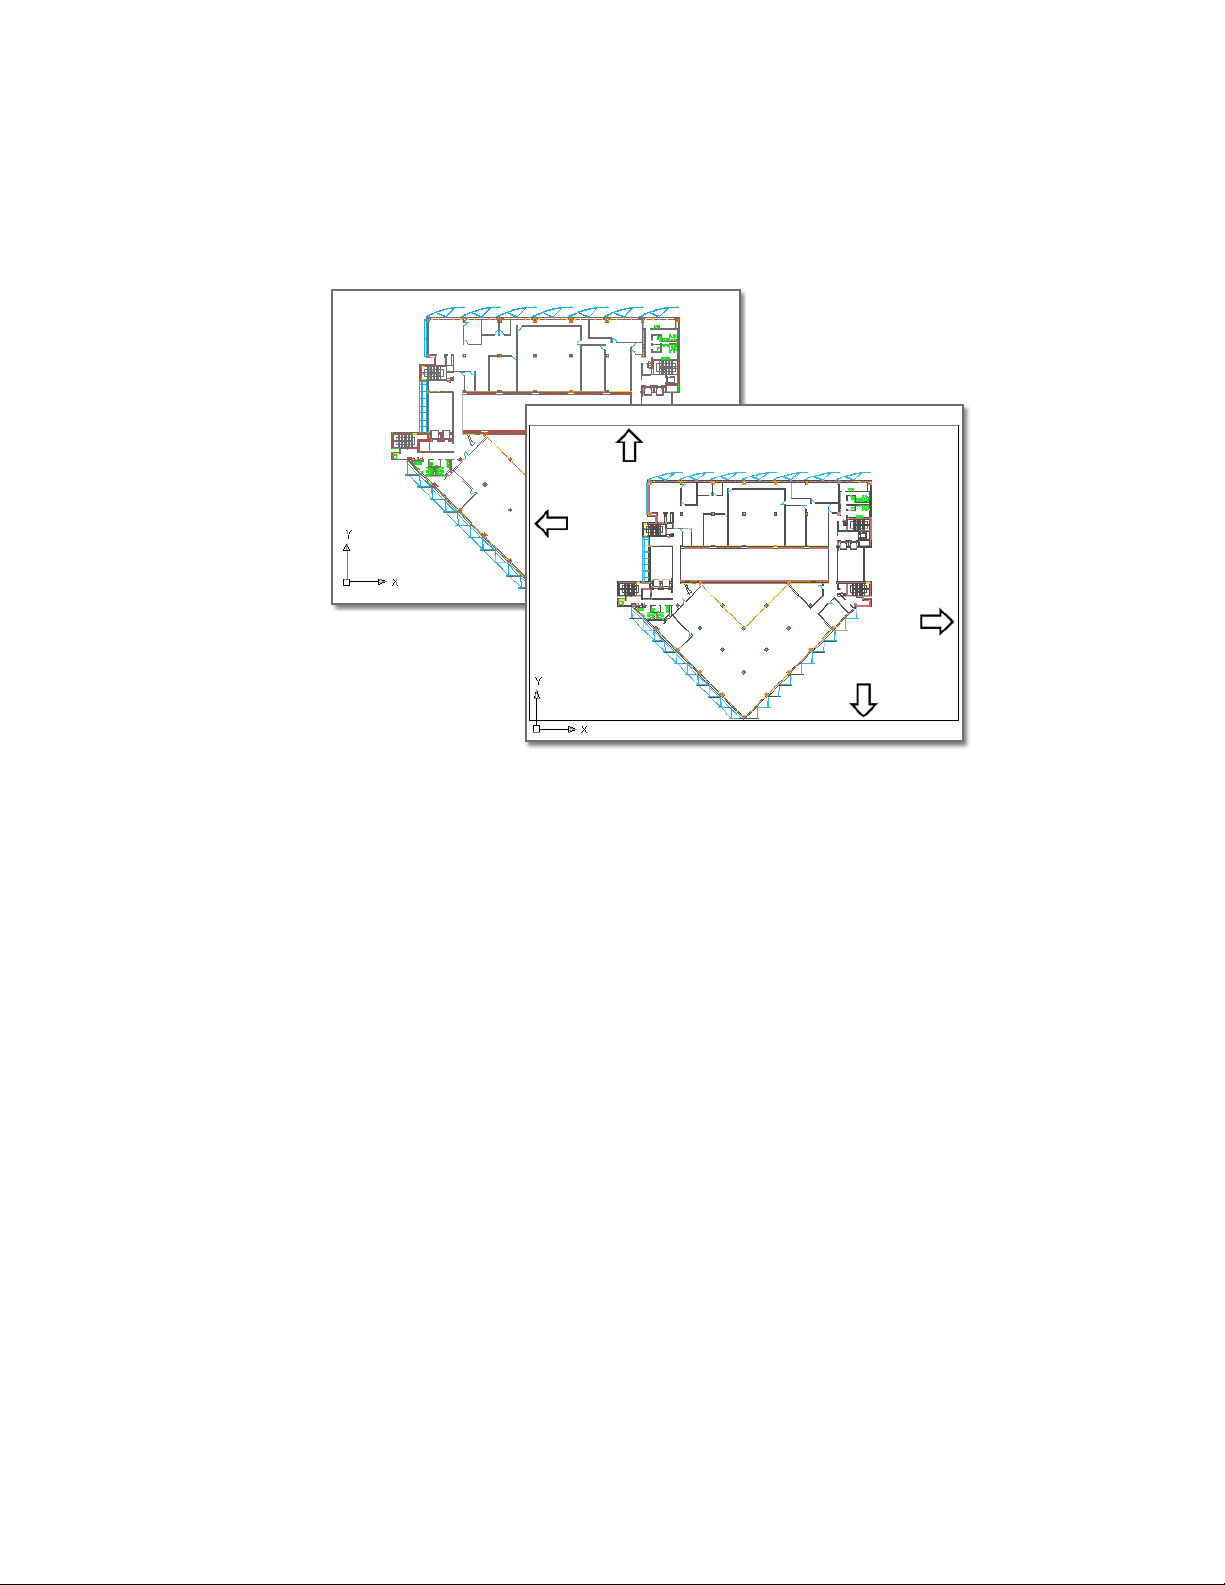
The following foreground example shows the underlay with a visible frame:
The foreground example shows the underlay with a visible frame.
Manage and Publish Drawings Containing PDF Under-
lays
You can view and manipulate underlays and change paths to underlays in
the Reference Manager palette.
View PDF Underlay Information
You can view file-specific information about the PDF underlays that are
attached to a drawing in the Reference Manager palette. You can also load
and unload PDF underlays and perform other operations there.
In the Reference Manager palette, you can view information about all the
underlays in the drawing in the File References or Details panels. The Show
Details button in the upper-right corner of the Reference Manager palette to
control the display of the Details panel. The Details panel displays the name
678 | Chapter 11 Share Data Between Files

of the selected underlay, its loading status, file size, date last modified, and
found at path.
View Underlay File Details
You can preview a selected underlay and view file details, including
■ Reference name
■ Status
■ File size
■ File type
■ File last modified date
■ Saved path
■ Found At path
■ Thumbnail
If the program cannot find an underlay, its status is listed as Not Found. If
the underlay is unreferenced, no instances are attached for the underlay. If
the underlay is not loaded, its status is Unloaded. Underlays with a status of
Unloaded or Not Found are not displayed in the drawing.
Change File Paths of PDF Underlays
You can change the file path to a referenced PDF file or search for an underlay
when it is reported as not found.
When you open a drawing with an attached PDF file, the path of the selected
underlay is displayed in the Reference Manager palette under Found At in the
Details panel. The displayed path is the actual path where the source file was
found. The path where the source file was originally attached is displayed
under Saved Path.
To locate the file, the program searches the following paths and folders in the
following order:
■ Path specified when the underlay was attached
■ Folder containing the current drawing file
■ Project search paths specified on the Applications tab of the Application
Preferences dialog box
■ Support search paths specified on the Applications tab of the Application
Preferences dialog box
Work with Data in Other Formats | 679

■ Start In folder specified in the program shortcut
If you open a drawing that contains a PDF file that is not in the saved path
location or in any of the defined search paths, the Reference Manager palette
displays Not Found in the Status field and the Found At entry is blank in
the Details panel.
For more information about using full paths, relative paths, and project names,
see Set Paths to Referenced Drawings (page 647).
Publish and Save Drawings Containing PDF Underlays
When you publish or save a drawing that contains PDF underlays, there are
some things to consider.
Plot and Publish
When a drawing file containing an underlay is plotted or published, any visible
geometry is included in the output file. Use the PDFCLIP, PDFADJUST, and
ULAYERS commands to control the output of the geometry in a PDF underlay.
Save to a Previous DWG Format
If you save a drawing that contains underlays to a previous DWG format, PDF
underlays are not supported in releases earlier than AutoCAD 2010 (unless
you have a Bonus Pack installed).
Attach Raster Image Files
You can view and manipulate raster images and associated file paths in
drawings.
You can add raster images to your vector-based drawings, and then view and
plot the resulting file. There are a number of reasons for combining raster
images with vector files, including scanning documents, faxes, or microfilm
drawings; using aerial and satellite photographs; using digital photographs;
creating effects such as watermarks and logos; and adding computer-rendered
images.
680 | Chapter 11 Share Data Between Files
Overview of Raster Images
Raster images consist of a rectangular grid of small squares or dots known as
pixels. For example, a photograph of a house is made up of a series of pixels
colorized to represent the appearance of a house. A raster image references
the pixels in a specific grid.
Raster images, like many other drawing objects, can be copied, moved, or
clipped. You can modify an image with grip modes, adjust an image for
contrast, clip the image with a rectangle or polygon, or use an image as a
cutting edge for a trim.
The image file formats supported by the program include the most common
formats used in major technical imaging application areas: computer graphics,
document management, engineering, mapping, and geographic information
systems (GIS). Images can be bitonal, 8-bit gray, 8-bit color, or 24-bit color.
Images with 16-bit color depth are not supported.
Several image file formats support images with transparent pixels. When image
transparency is set to on, the program recognizes those transparent pixels and
allows graphics in the drawing area to “show through” those pixels. (In bitonal
images, background pixels are treated as transparent.) Transparent images can
be gray-scale or color.
NOTE Although the file name extension is listed in the following table, the file
format is determined from the file contents, not from the file extension.
Supported image file formats
File extensionDescription and versionsType
.bmp, .dib, .rleWindows and OS/2 bitmap formatBMP
Work with Data in Other Formats | 681
Supported image file formats
File extensionDescription and versionsType
.gp4, .mil, .rst, .cg4, .calMil-R-Raster ICALS-I
.ddsMicrosoft DirectDraw SurfaceDDS
.doqUSGS Digital Orthophoto QuadsDOQ
.ecwEnhanced Compression WaveletECW
.flc, .fliFLIC Autodesk Animator AnimationFLIC
.bilGeoSPOT (BIL files must be accompanied
with HDR and PAL files with correlation
data, in the same directory)
GeoSPOT
.hdrHigh Dynamic Range ImageHDR
.ig4Image Systems Group 4IG4
.jp2, .j2kWavelet-based compression standard
created by the Joint Photographics Ex-
pert Group
JPEG2000
.jpg, .jpegJoint Photographics Expert GroupJFIF or JPEG
.sidMultiresolution Seamless Image DatabaseMrSID
.nitfNational Imagery Transmission Format
NOTE NITF files containing elevation
data require AutoCAD Raster Design
NITF
.exrIndustrial Light & Magic High-Dynamic
Range image
OpenEXR
682 | Chapter 11 Share Data Between Files
Supported image file formats
File extensionDescription and versionsType
.pcxPicture PC Paintbrush PicturePCX
.pctPicture Macintosh PicturePICT
.pngPortable Network GraphicPNG
.psdAdobe Photoshop DocumentPSD
.rlcRun-Length CompressedRLC
.tgaTrue Vision Raster-Based Data FormatTARGA
.tif, .tiffTagged Image File FormatTIFF
Attach, Scale, and Detach Raster Images
You can add or remove references to raster images within drawing files, or
you can change their relative size.
Attach Raster Images
You can attach a reference to a raster image file to a drawing file using a linked
image path. The image file can be accessed from the Internet.
Images can be referenced and placed in drawing files, but like external
references (xrefs), they are not actually part of the drawing file. The image is
linked to the drawing file through a path name. Linked image paths can be
changed or removed at any time.
Once you've attached an image, you can reattach it multiple times, treating
it as if it were a block. Each insertion has its own clip boundary and its own
settings for brightness, contrast, fade, and transparency.
Work with Data in Other Formats | 683

NOTE AutoCAD 2000 and later releases do not support LZW-compressed TIFF
files, with the exception of English language versions sold in the US and Canada.
If you have TIFF files that were created using LZW compression and want to insert
them into a drawing, you must resave the TIFF files with LZW compression disabled.
For information on identifying referenced images, see Highlight External
References in a Drawing in Attach and Detach Referenced Drawings (page 644).
Access Raster Images Using the Internet
Designers and manufacturers store images of their designs or products on the
Internet. You can easily access image files from the Internet. URL image file
names are stored in the drawing.
Accessing images from the Internet saves time and provides for rapid
distribution of designs. For example, an architect who needs to show a client
what custom cabinets will look like has the manufacturer create a rendered
image of the cabinets, post it to a website, and then attach the image to the
drawing file as a URL; any design changes can be updated immediately. For
more information, see Reference Other Drawing Files (page 643).
Scale Raster Images
You can control the size of a raster image in a drawing to match the scale of
the drawing.
You can specify the raster image scale factor when you attach the image so
that the scale of the geometry in the image matches the scale of the geometry
in the drawing. The default image scale factor is 1, and the default unit for all
images is “Unitless.” The image file can contain resolution information
defining the dots per inch (DPI), relating to how the image was scanned.
If an image has resolution information, the program combines this information
with the scale factor and the unit of measurement of the drawing to scale the
image in your drawing. For example, if your raster image is a scanned blueprint
on which the scale is 1 inch equals 50 feet, or 1:600, and your drawing is set
up so that 1 unit represents 1 inch, then in the Attach Image dialog box under
Scale, select Specify On-Screen. To scale the image, you clear Specify On-Screen,
and then enter 600 in Scale. The image is then attached at a scale that brings
the geometry in the image into alignment with the geometry in the drawing.
If no resolution information is defined with the attached image file, the width
of the raster image is set to one unit. Thus, when the image file is attached,
the image width in units is equal to the raster image scale factor.
684 | Chapter 11 Share Data Between Files

Detach Raster Images
You can detach the reference to an image file in a drawing.
You can detach images that are no longer needed in a drawing. When you
detach an image, all instances of the image are removed from the drawing,
the image definition is purged, and the link to the image is removed. The
image file itself is not affected.
NOTE Erasing an individual instance of an image is not the same as detaching an
image. An image must be detached to remove the link from your drawing to the
image file.
Modify Raster Images and Image Boundaries
You can control the clipping boundaries and image display properties of a
raster image.
Show and Hide Raster Image Boundaries
You can control whether the clipping boundaries of a raster image are displayed
or hidden in a drawing.
You can hide image boundaries. Hiding the image boundary prevents the
boundary from being plotted or displayed. Also, hiding the image boundary
prevents you from selecting the image with the pointing device, ensuring that
the image cannot accidentally be moved or modified. However, images can
still be selected if they are not on a locked layer, for example, if the image is
part of a named selection set made with the All option. When image
boundaries are hidden, clipped images are still displayed to their specified
boundary limits; only the boundary is affected. Showing and hiding image
boundaries affects all images attached to your drawing.
Work with Data in Other Formats | 685
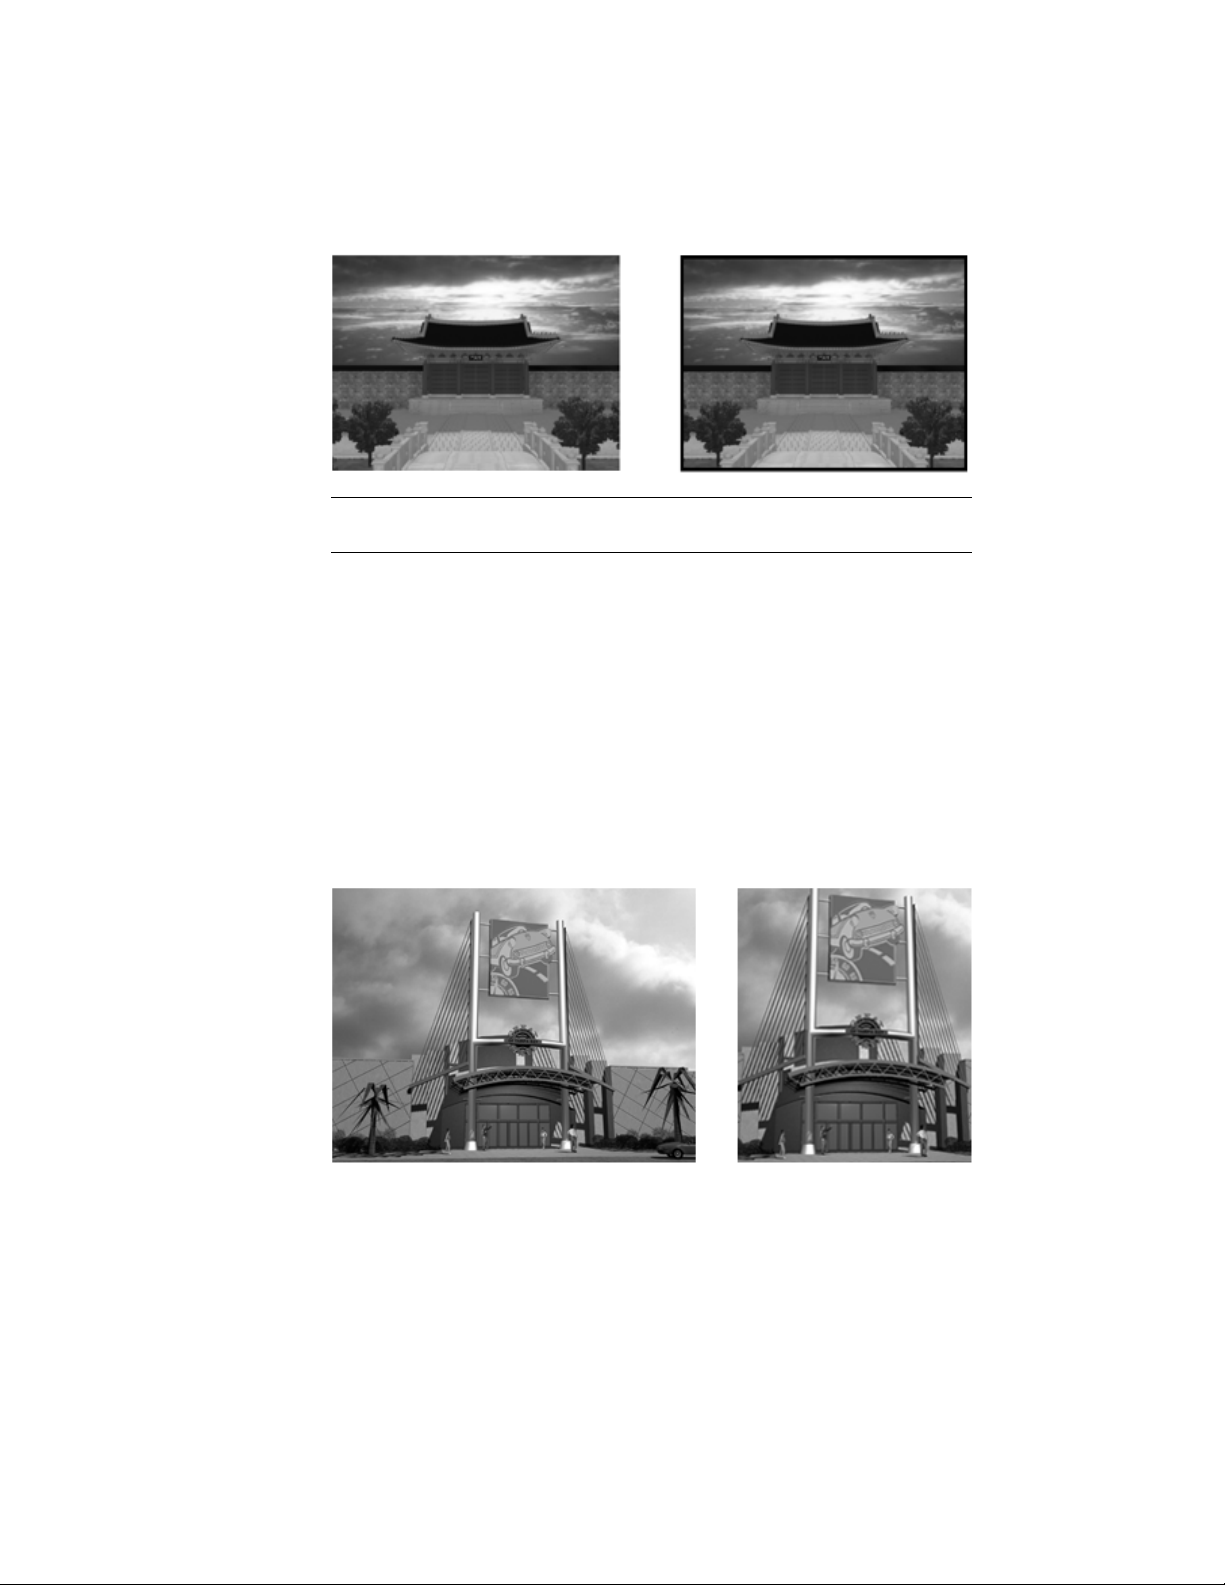
NOTE When an image frame is turned off, you cannot select images using the
Pick or Window options of SELECT.
Clip Raster Images
You can clip and display specific portions of a raster image in a drawing with
a clipping boundary.
With a clipping boundary, only the parts of the image that you want visible
are displayed. You can define the part of an image that you want to display
and plot by clipping the image with IMAGECLIP. The clipping boundary can
be a polyline, rectangle, or a polygon with vertices within the boundaries of
the image. You can change the boundary of a clipped image. You can also
delete the clipped boundary of an image. When you delete a clipping boundary,
the original image is displayed.
You can invert the area to be hidden, inside or outside the clipping boundary.
With grips located at the midpoint on the first edge of the clipping boundary,
686 | Chapter 11 Share Data Between Files
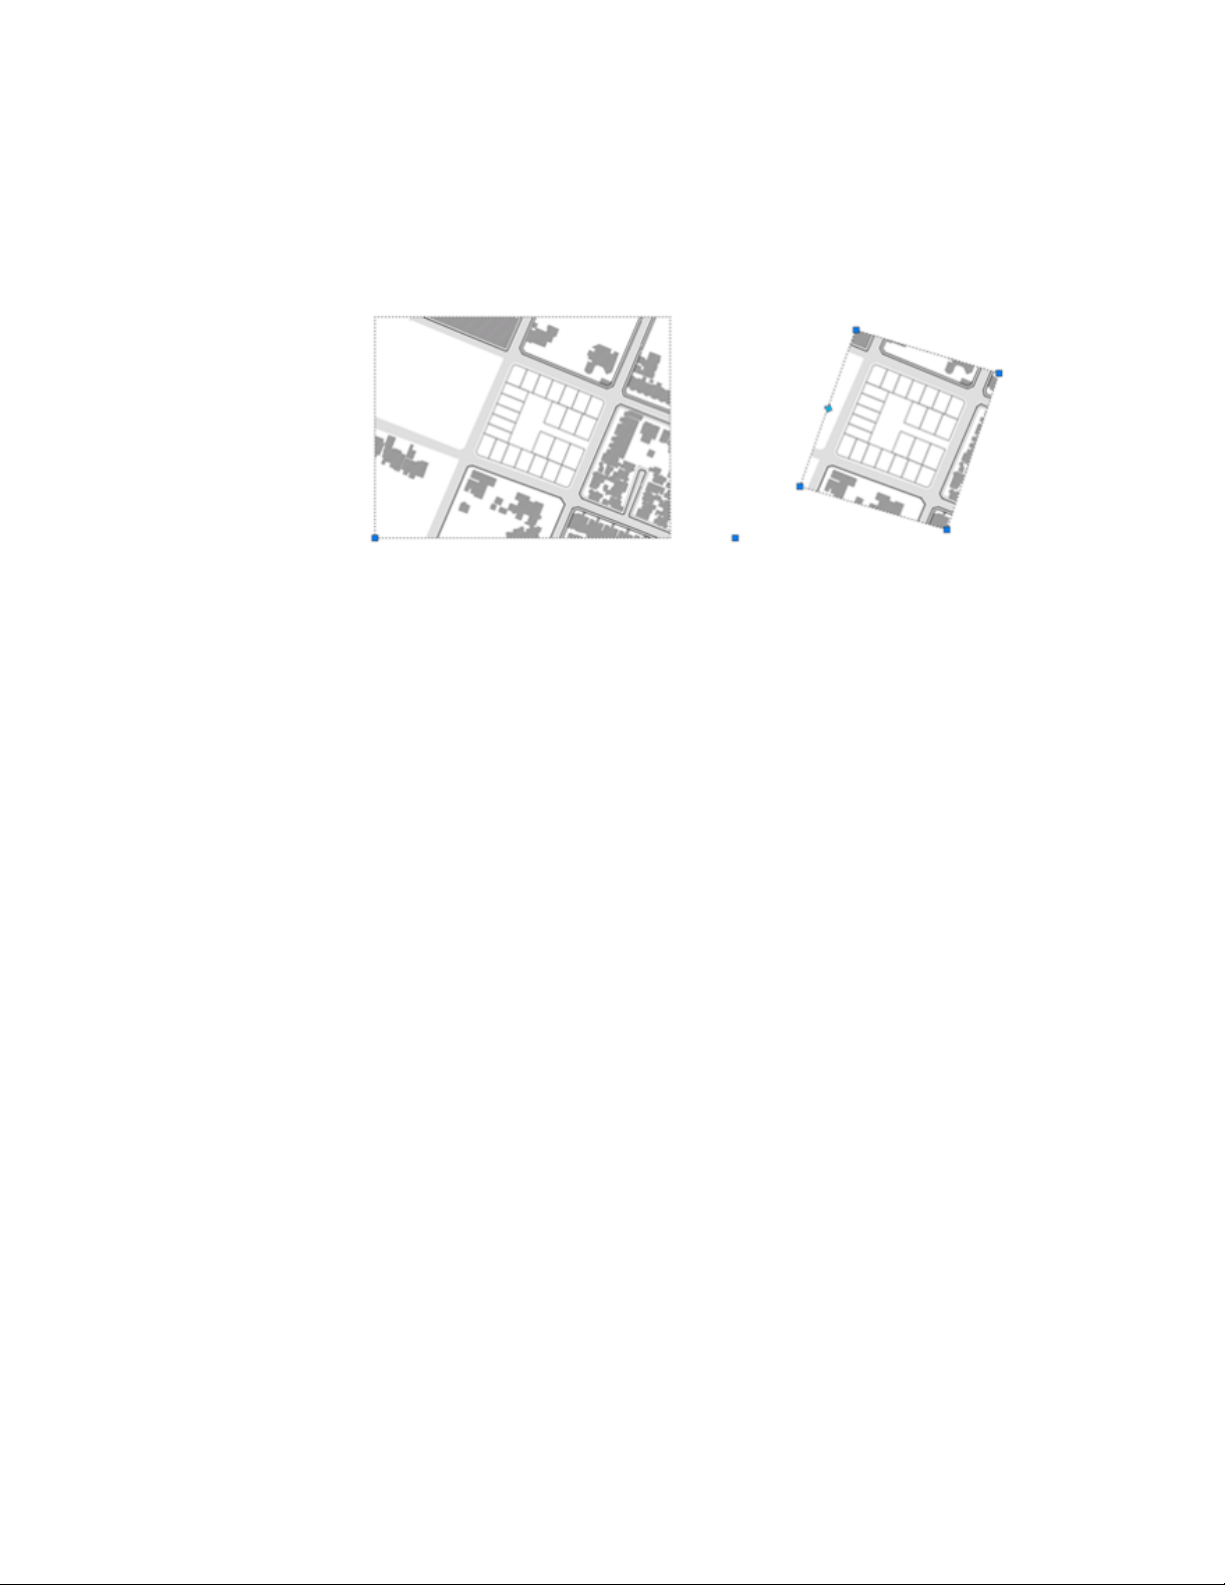
you can invert the display of the clipped reference inside or outside the
boundary.
With IMAGEFRAME system variable, you can control the visibility of the
clipping boundary.
See also:
Clip External References and Blocks (page 653)
Change Raster Image Brightness, Contrast, and Fade
You can change several display properties of raster images in a drawing for
easier viewing or special effects.
You can adjust brightness, contrast, and fade for the display of an image as
well as for plotted output without affecting the original raster image file and
without affecting other instances of the image in the drawing. Adjust brightness
to darken or lighten an image. Adjust contrast to make poor-quality images
easier to read. Adjust fade to make drawing geometry easier to see over images
and to create a watermark effect in your plotted output.
Bitonal images cannot be adjusted for brightness, contrast, or fade. Images
fade to the current screen background when displayed, and they fade to white
when plotted.
Work with Data in Other Formats | 687

Modify Color and Transparency for Bitonal Raster Im-
ages
Bitonal images are images that consist only of a foreground color and a
background color. You can change the foreground color and turn the
transparency of the background color on and off.
Bitonal raster images are images consisting only of a foreground color and a
background color. When you attach a bitonal image, the foreground pixels
in the image inherit the current settings for color. In addition to the
modifications you make to any attached image, you can modify bitonal images
by changing the foreground color and by turning on and off the transparency
of the background.
NOTE Bitonal images and their boundaries are always the same color.
Manage Raster Images
You can view and manipulate raster images and change paths to image files
using the Reference Manager palette.
View Raster Image Information
You can view file-specific information about the raster images that are attached
to a drawing. You can also load and unload the images and perform other
operations using the Reference Manager palette.
In the Reference Manager palette, you can also view information about each
of the attached images.
The following information is displayed:
■ Name of the image or selected external reference
■ Status (loaded, unloaded, or not found)
■ File size
■ File type
■ Date and time file was last saved
■ Name of the saved path
688 | Chapter 11 Share Data Between Files

If an image cannot be found, its status is listed as Not Found. A Not Found
image is displayed as an image boundary in the drawing even if the
IMAGEFRAME system variable is set to off. If the image is unreferenced, no
instances are attached for the image. If the image is not loaded, its status is
Unloaded. Images with a status of Unloaded or Not Found are not displayed
in the drawing.
Use the Tree View
The top level of the tree view lists referenced files in the order that they were
attached. In most cases an image file is linked directly to the drawing and
listed at the top level. However, if a DWG file reference or a block contains a
linked image, additional levels are displayed.
View Image File Details
In the lower area of the Reference Manager palette, you can preview a selected
image or view image file details, including
■ Image name
■ Saved path
■ Active path (where the image is found)
■ File creation date
■ File size
■ File type
■ Color
■ Color depth
■ Image size (pixel width and height, resolution and default size)
Assign Descriptive Names to Raster Images
When the name of a raster image file is not sufficient to identify an image,
you can add a descriptive name using the Reference Manager palette.
Image names are not necessarily the same as image file names. When you
attach an image to a drawing, the program uses the file name without the file
extension as the image name. Image names are stored in a symbol table; thus
you can change the image name without affecting the name of the file. Up
to 255 characters are accepted for image file names. In addition to letters and
Work with Data in Other Formats | 689

numbers, names can have spaces and any special characters not used by the
operating system or AutoCAD for other purposes.
If you attach and place images with the same name but from two different
directories, numbers are appended to the image names.
Change File Paths of Raster Images
With the External References palette, you can change the file path to a
referenced raster image file or search for a referenced image when it is reported
as not found.
When you open a drawing with an attached image, the path of the selected
image is displayed in the Reference Manager palette in the Details Pane under
Found At. The path displayed is the actual path where the image file was
found. The path where the image file was originally attached is displayed
under Saved Path.
To locate the image file, the program searches the following paths and folders
in the following order:
■ Path specified when the image was attached
■ Folder containing the current drawing file
■ Project search paths specified on the Application tab in the Application
Preferences dialog box
■ Support search paths specified on the Application tab in the Application
Preferences dialog box
If you open a drawing that contains an image that is not in the saved path
location or in any of the defined search paths, the Reference Manager palette
displays Not Found in the image list, and the Found At properties is blank.
You can remove the path from the file name or specify a relative path by
editing the path in the Found At properties and then clicking Open in the
Open dialog box.
For more information about using full paths, relative paths, and project names,
see Set Paths to Referenced Drawings (page 647).
Tune Raster Image Performance
You can reduce the demands on system performance when manipulating large
or many small raster images.
690 | Chapter 11 Share Data Between Files

See also:
Detach Raster Images (page 685)
Load and Unload Raster Images
You can improve performance by unloading images when you do not need
them in the current drawing session.
Unloaded images are not displayed or plotted; only the image boundary is
displayed. Unloading an image does not alter its link. If memory is not
sufficient to open multiple attached images in a drawing, images are
automatically unloaded.
In the Reference Manager palette, you can use Reload to reload an unloaded
image or to update a loaded image by reloading the image from the specified
directory path. If a drawing is closed after an image is unloaded, the image
file is not loaded when the drawing is next opened; you must reload it.
Improve the Display Speed of Raster Images
To increase the display speed of images, you can change image display quality,
hide images not currently needed, use image tiling, or suppress image selection
highlighting.
To increase the display speed of images, you can change image display quality
from the default high quality to draft quality. Draft-quality images appear
more grainy (depending on the image file type), but they are displayed more
quickly than high-quality images. Use the IMAGEQUALITY system variable
to control image quality.
You can improve the image quality when using True Color (24 or 32 bits per
pixel) for raster images by setting certain drafting environment options. When
images are displayed at optimum quality, regeneration time increases
significantly. To improve performance, decrease the number of colors for the
system display setting while working in a drawing.
You can increase redrawing speed by hiding images you do not need in the
current drawing session. Hidden images are not displayed or plotted; only the
drawing boundary is displayed. You can choose to hide an image regardless
of the user coordinate system (UCS) in the current viewport.
Work with Data in Other Formats | 691

Use Tiled Images
Tiled images are small portions (a series of tiles) of large images that load much
faster than non-tiled images. If you edit or change any properties of an image,
only the modified portion is regenerated, thus improving the regeneration
time. TIFF (Tagged Image File Format) is the only tiled format that the program
supports. The TIFF reader supports all image types:
■ Bitonal (1 bit per pixel)
■ Gray scale and indexed color (8 bits per pixel)
■ True Color (24 or 32 bits per pixel)
You can save tiled TIFF images with most image scanning tools. The image
tiles should be no smaller than 64 x 64 pixels and no larger than 512 x 512
pixels. Additional file readers that support other tiled formats, such as CALS
Type II, are available from third-party developers.
Suppress Highlighting When Selecting Images
You can turn on or off the highlighting that identifies the selection of a raster
image or the image frame by toggling the value of IMAGEHLT system variable.
By default, IMAGEHLT is set to 0, to highlight only the raster image frame.
Turning off highlighting of the entire image improves performance.
Export Drawings to Other File Formats
If you need to use the information from a drawing file in another application,
you can convert it to a specific format by exporting it.
Export PDF Files
You can export a drawing as a PDF file to facilitate sharing information with
other design groups.
Sets of drawings are the primary deliverable for most design groups. Creating
a drawing set to distribute for review can be complicated and time consuming.
Electronic drawing sets are saved as PDF files.
To output a single drawing as a PDF, use the Print dialog box or EXPORT
command.
692 | Chapter 11 Share Data Between Files

Export DXF Files
You can export a drawing as a DXF file, which contains drawing information
that can be read by other CAD systems.
You can export a drawing as a DXF (drawing interchange format) file. DXF
files are text or binary files that contain drawing information that can be read
by other CAD programs. If you are working with consultants who use a CAD
program that accepts DXF files, you can share a drawing by saving it as a DXF
file.
You can control floating-point precision of the DXF format up to 16 decimal
places and save the drawing in either ASCII or binary format. ASCII format
results in a text file that you can read and edit; binary format results in a
significantly smaller file that is faster to work with.
If you do not want to save the entire drawing, you can choose to export
selected objects only. You can use this option to remove extraneous material
from drawing files.
Export Raster Files
You can create a device-independent raster image of the objects in your
drawing.
Several commands can be used to export objects into device-independent
raster images in the bitmap, JPEG, TIFF, and PNG formats.
Objects are displayed in the raster image as they appear on the screen,
including objects in shaded and rendered viewports.
File formats such as JPEG are compressed as they are created. Compressed files
take up less disk space, but they might not be readable by certain applications.
Export PostScript Files
You can convert a drawing file to a PostScript file, a format that is used by
many desktop publishing applications.
The PostScript file format type is used by many desktop publishing
applications. Its high-resolution print capabilities make it preferable to raster
formats, such as GIF, PCX, and TIFF. By converting the drawing to a PostScript
format, you can also use PostScript fonts.
Work with Data in Other Formats | 693

Export in PostScript Format
When you export a file in PostScript format as an EPS file, some objects are
handled specially.
■ Thickened text, text control codes. If text has a thickness greater
than 0 or contains control codes (such as %%O or %%D), it is not plotted
as PostScript text, although the text is accurately plotted. International
and special symbols (such as %%213) are output as PostScript text.
■ ISO 8859 Latin/1 character set. When text uses character codes in the
127 to 255 range, the text is interpreted according to the ISO 8859 Latin/1
character set. If such a character appears in text that is mapped to
PostScript, a version of the font is generated with an encoding vector
remapped to represent the ISO character set. The resulting text is output
in PostScript in a form compatible with the font.
■ Circles, arcs, ellipses, elliptical arcs. Except when they have thickness,
arcs and circles are translated into the equivalent PostScript path objects.
■ Filled solids. A solid fill is plotted as a PostScript filled path.
■ Two-dimensional polylines. A 2D (planar) polyline with uniform width
is output as a PostScript stroked path. The PostScript end cap and miter
limit variables are set to approximate the segment joining.
Export ACIS SAT Files
You can export certain object types to an ACIS file in ASCII (SAT) format.
You can export trimmed NURBS surfaces, regions, and 3D solids to an ACIS
file in ASCII (SAT) format. Other objects, such as lines and arcs, are ignored.
Use ACISOUT to export 3D objects to a SAT file.
Export Stereolithography STL Files
You can export 3D solid objects in the STL file format compatible with
stereolithography or 3D printing.
Stereolithography or 3D printing is used in rapid prototyping, rapid
manufacturing, and other applications to create physical parts and models.
The 3D solid data is translated to a faceted mesh representation consisting of
a set of triangles and saved to an STL file. Use the FACETRES system variable
to adjust the facet density to an appropriate detail level.
694 | Chapter 11 Share Data Between Files

NOTE Setting the resolution too high slows down the fabrication process without
improving the output quality of the stereolithography device.
The STL data is used to create an object by depositing a succession of thin
layers of plastics, metals, or composite materials. The resulting parts and
models are commonly used for the following:
■ Visualize design concepts
■ Create product mockups, architectural models, and terrain models
■ Test form, fit, and function
■ Identify design problems
■ Create masters for vacuum forming applications
■ Create Marketing tools
Use Drawings from Different Versions and Ap-
plications
You can share drawing files from AutoCAD and AutoCAD LT, drawing files
from previous versions, and drawing files that contain custom objects. In some
cases there are limitations.
Work with Drawings in Earlier Releases
When you work with drawings created in AutoCAD 2008 (and later releases)
in AutoCAD 2007 (and earlier releases), you should be aware of the following
visual fidelity issues.
Visual Fidelity for Annotative Objects in Previous Releases
You can specify that objects maintain visual fidelity when they are viewed
in AutoCAD 2007 (and earlier releases) with the SAVEFIDELITY system variable.
If you work primarily in model space, it is recommended that you turn off
visual fidelity (set SAVEFIDELITY to 0). However, if you need to exchange
drawings with other users, and layout fidelity is most important, then visual
fidelity should be turned on (SAVEFIDELITY set to 1).
Annotative objects may have multiple . When visual fidelity is on, annotative
objects are decomposed and scale representations are saved (in an ) to separate
layers. These layers are named based on their original layer and appended
Work with Data in Other Formats | 695

with a number. If you explode the block in AutoCAD 2007 (or earlier releases),
and then open the drawing in AutoCAD 2008 (or later releases), each scale
representation becomes a separate annotative object, each with one annotation
scale. It is recommended that you do not edit or create objects on these layers
when working with a drawing created in AutoCAD 2008 (and later releases)
in AutoCAD 2007 (and earlier releases).
When visual fidelity for annotative objects is not selected, a single model
space representation is displayed on the Model layout. Depending on the
setting of the ANNOALLVISIBLE system variable, more annotation objects
may be displayed on the Model layout, and more objects may be displayed
in paper space viewports at different sizes than in AutoCAD 2008 and later
releases.
Annotative Object Properties in Previous Releases
In an AutoCAD 2008 drawing, when an annotative block does not have its
paper orientation set to match the layout, and the block contains multiline
attributes that are based on a text style that is not set to match the orientation
of the layout, the attributes may shift positions if you open this drawing in
AutoCAD 2007 (and earlier releases).
Layer Property Overrides in Previous Releases
When you open an AutoCAD 2008 drawing containing layer property
overrides, overrides are not visible. The property override settings are retained
when the drawing is saved in a previous release, and are visible again when
the drawing is opened in AutoCAD 2008.
If a viewport containing layer property overrides is deleted when the drawing
is opened in a previous release, the override settings are not retained and are
not available when the drawing is opened in AutoCAD 2008.
When the VISRETAIN system variable is set to 0 when the drawing is opened
in a previous release, xref layers containing viewport property overrides are
not retained.
If you open an AutoCAD 2008 drawing in a previous release, property overrides
may display in a thumbnail image. When the drawing is saved with a layout
tab, and then opened in the previous release, those property overrides do not
display.
696 | Chapter 11 Share Data Between Files

Dimension Enhancements in Previous Releases
AutoCAD 2008 dimension enhancements are lost when they are edited in
earlier releases. If you don’t change these dimensions, they are restored when
you open the drawing in AutoCAD 2008.
The following dimension enhancements do not lose visual fidelity in previous
releases if they are not edited:
■ Dimension breaks
■ Jogged linear dimensions
■ Inspection dimensions
■ Angular dimensions that are dimensioned using the quadrant option
■ Arc extension lines for radial and diameter dimensions
Multileader Objects in Previous Releases
Multileaders display as proxy objects in releases prior to AutoCAD 2008. The
PROXYSHOW system variable controls the display of proxy objects in a
drawing.
MTEXT Paragraph and Paragraph Line Spacing in Previous Releases
Some of the new paragraph spacing and paragraph line spacing options are
not supported when an AutoCAD 2008 mtext object is opened in AutoCAD
2007 (and earlier releases).
The following mtext formatting features have no visual fidelity in previous
releases:
■ Paragraphs with justified alignment
■ Paragraphs with distributed alignment
■ Fields that wrap across columns
■ Fields that wrap across lines that have new paragraph alignments
■ Paragraphs with non-default alignments in mtext without left object-level
justification
The following mtext formatting features have some visual fidelity in previous
releases (when it’s possible to add white spaces or replace text with white
spaces):
■ Paragraphs with non-default alignments (other than justified or distributed)
in mtext that has left object-level justification
Work with Data in Other Formats | 697

■ Paragraphs with tabs using new tab alignments (center, right, or decimal
alignment applied)
■ Paragraphs with new line spacing that can be "approximated" with "tall"
spaces
Mtext with new formatting that is edited and saved in previous releases loses
the new formatting when re-opened in AutoCAD 2008.
Tables in Previous Releases
Editing AutoCAD 2008 tables in previous releases removes AutoCAD 2008
table formatting. Also, AutoCAD 2008 table cells with long block and text
strings may extend outside of cell borders when opened in previous releases.
Multiple-Language Support in Previous Releases
Drawing properties in AutoCAD 2008 are saved with Unicode characters. For
instance, if you save the latest format drawing containing multiple language
drawing properties to a 2004-format drawing, the drawing properties are
converted to the native characters of the current Windows language. If text
cannot be converted to the native characters, it is saved to CIF codes
(\U+nnnn) or MIF codes (\M+nxxxx).
When saving the latest format drawing to a 2004-format drawing, any new
symbol or dictionary names (for example, layout name, text style name,
dimension style name) created in AutoCAD 2008 are saved in the language
that was used when the symbol names were created.
Text styles for Asian languages that use SHX and Big Font can support
characters only from the same code page. For example, text styles that use a
Japanese Big Font cannot support German or Korean characters. (English
characters, which are part of every code page, are supported.) Multiple-language
support for non-Asian languages is supported for text styles that use SHX fonts
with Big Fonts disabled. (The SHX font must define the required characters.)
Multiple-language support does not exist in some earlier releases of AutoCAD.
For example, when you save a file to AutoCAD 2000 format, the contents of
multiple-language multiline text may be corrupted. This problem is more
likely to happen when you open and save a drawing on an operating system
with a system language setting that differs from the system in which the
drawing was last saved.
NOTE Drawings that include external references (xrefs) to drawing files saved in
earlier releases also have the limitations described above.
698 | Chapter 11 Share Data Between Files

Save Drawings to Previous Drawing File Formats
You can save a drawing in a format compatible with previous versions of the
product.
You can save a drawing created with the current release of the program in a
format compatible with previous versions. This process creates a drawing with
information specific to the current release stripped out or converted to another
object type.
If you use the current release to open a drawing created with a previous release,
and you do not add any information specific to the current release, you can
then save the drawing in the format of the previous release without loss of
data.
NOTE To use files with AutoCAD Release 12 or AutoCAD LT Release 2, save the
drawing using the AutoCAD R12/LT2 DXF option.
If you need to keep a drawing created in a previous release in its original
format, either mark the file as read-only, or open it in the current release and
use the File Type options in the Save As dialog box to save it in its original
format.
Because saving a drawing in an earlier release format may cause some data
loss, be sure to assign a different name to avoid overwriting the current
drawing. If you overwrite the current drawing, you can restore the overwritten
version from the backup file (filename.bak) that is created during the saving
process.
Maintain Associativity in Dimensions
Associative dimensions created in AutoCAD 2002 or later generally maintain
their associativity when saved to a previous release and then reopened in the
current release. However, if you modify dimensioned objects using a previous
release to the extent that new objects are formed, the dimension associations
change when the drawing is loaded into the current release. For example, if
a line that was dimensioned is trimmed so that an interior portion of the line
is removed, two line objects result and the associated dimension applies to
only one of the line objects.
Dimension associativity is not maintained when a drawing is saved as an
AutoCAD R12/LT 2 DXF file and then reopened in the current release.
Work with Data in Other Formats | 699

Save Drawings with Large Objects
Drawings saved to a legacy drawing file format (AutoCAD 2007 or earlier) do
not support objects greater than 256MB. For more information about saving
drawings that contain large objects to a previous release, see Maintain Com-
patibility with Large Object Limits (page 50).
Limitations of Saving to Earlier Versions
Saving a drawing in Release 2000/LT 2000 format is subject to the following
limitations:
■ File size can increase.
Saving a drawing in Release 12/LT 2 DXF format is subject to the following
limitations:
■ Lightweight polylines and hatch patterns are converted to Release 12
polylines and hatch patterns.
■ All solids, bodies, regions, ellipses, leaders, multilines, rays, tolerances, and
xlines are converted to lines, arcs, and circles as appropriate.
■ Groups, complex linetypes, and preview images are not displayed.
■ Many objects are lost if you save a drawing as Release 12 and open it in
Release 2000/LT 2000 or later.
■ Multiple layouts and layout names are lost. Only the Model layout and
the current named layout are saved.
■ Spaces in the names of layers and other objects are converted to
underscores, and their maximum length is 32 characters.
■ The status of external references as unloaded is lost.
Work with AutoCAD Drawings in AutoCAD LT
AutoCAD LT offers full compatibility when working with AutoCAD drawings.
However, you should understand how AutoCAD LT handles AutoCAD-only
features.
Work with Fields
In AutoCAD, you can insert LispVariables fields, which are not available in
AutoCAD LT. However, the drawings created in AutoCAD that contain
700 | Chapter 11 Share Data Between Files
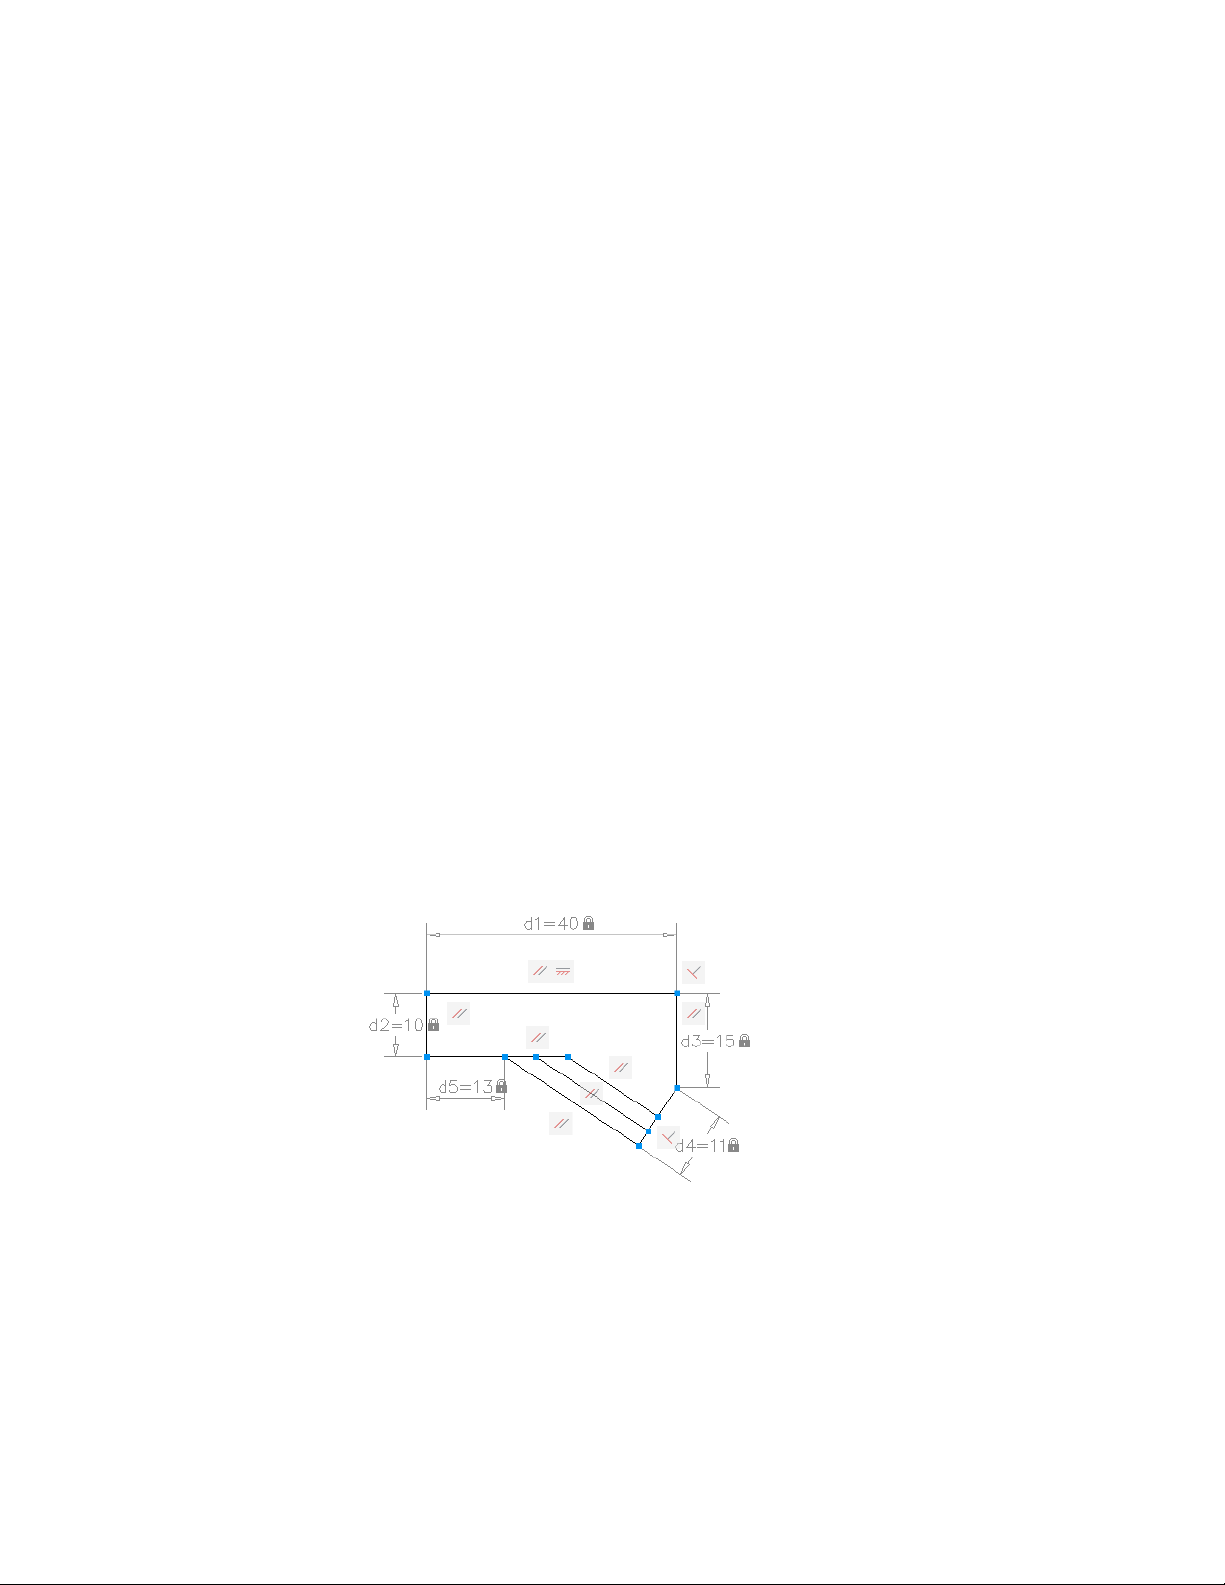
LispVariables can be opened without errors in AutoCAD LT, and the cached
value is displayed.
Work with Multiple User Coordinate Systems
In AutoCAD, you can choose to use a different user coordinate system (UCS)
in each viewport in a single drawing file. In AutoCAD LT, you can use only
one UCS in each drawing file. The AutoCAD LT behavior is the same as it was
in previous releases.
When you open an AutoCAD drawing file in AutoCAD LT, AutoCAD LT uses
only the UCS from the current viewport. If you edit the drawing in AutoCAD
LT, and then save it and reopen it in AutoCAD, you may notice some
discrepancies in UCS usage. User coordinate systems that were set individually
in AutoCAD will probably change if the viewports that use them were activated
in the AutoCAD LT session.
Work with AutoCAD 2D and 3D Solid Object Shading
In AutoCAD, visual styles provide shading and wireframe options for objects
in the current viewport. AutoCAD LT does not support visual styles. The
SHADEMODE command in AutoCAD LT provides only the 2D Wireframe and
Hidden options. You can use SHADEMODE in AutoCAD LT to turn off visual
styles in viewports that were created in AutoCAD. This exposes the underlying
geometry so you can easily edit drawings and use the geometry with precision
drawing tools such as object snaps.
Work with Constraints
Some of the drawings that you work with will contain design requirements
enforced within the drawing itself through the use of constraints. Using
Work with Data in Other Formats | 701

constraints, you can enforce requirements while experimenting with different
designs.
A constrained object will move in a predictable manner when edited or moved.
A single variable change can cause all related objects to change automatically,
enabling you to run through design iterations simply and effectively.
There are two general types of constraints supported: Geometric and
Dimensional.
■ Geometric constraints determine the relationships between 2D geometric
objects or points on objects relative to each other.
Use constraint bars to view the geometric constraints applied to objects.
Constraint bars are visible only when you place your cursor over the
highlighted nodes.
■ Dimensional constraints control distances or angles between 2D geometric
objects in a drawing.
The main dimensional constraints are: dynamic, annotational, and
reference constraints.
■ Dynamic constraints (default) - Used to constrain objects and are
displayed on demand.
■ Annotational constraints - Used to create associative variables, offset
distances, and so on.
■ Reference constraints (read-only) - Read-only dimensional constraints
(either dynamic or annotational).
When you place your cursor over a constrained object, you will see a glyph
denoting the object is constrained.
With AutoCAD LT, you can do the following:
■ View drawings containing constraints created using AutoCAD.
■ View and edit the geometric and dimensional constraints.
NOTE You cannot create constraints within AutoCAD LT.
Work with Custom and Proxy Objects
Custom objects provide additional capabilities to the program and related
products. When the application that created the custom object is not available,
a proxy object is substituted in its place.
702 | Chapter 11 Share Data Between Files

A custom object is a type of object created by an ObjectARX
®
(AutoCAD
Run-Time Extension) application, which typically has more specialized
capabilities than standard AutoCAD objects. Custom objects include parametric
solids (AutoCAD
®
Mechanical), intelligently interactive door symbols
(AutoCAD
®
Architecture), polygon objects (AutoCAD
®
Map 3D), and associative
dimension objects (AutoCAD and AutoCAD LT).
In addition to Autodesk, many software vendors use ObjectARX to write
programs that create graphical and nongraphical custom objects that are useful
in their AutoCAD based applications.
Proxy Objects
A proxy object is a substitute for a custom object when the ObjectARX
application that created the custom object is not available to AutoCAD or
other host applications. Later, when the application is available, the proxy
object is replaced by the custom object.
Proxy objects have significantly reduced capabilities compared to their
corresponding custom objects. The extent to which proxy objects can be edited
is determined by the parent ObjectARX application. For example, operations
such as erasing and moving an object, or changing object properties, may or
may not be possible on a proxy object, depending on the application that
created it.
When you open a drawing, you might see a message listing the total number
of proxy objects in the drawing (both graphical and nongraphical) and the
name of the missing application and provides additional information about
the proxy object type and display state. You can use the dialog box to control
the display of proxy objects.
Object Enablers
An object enabler is a tool that provides specific viewing and standard editing
access to a custom object in the host applications when the application that
created the custom object is not present.
Object Enablers allow custom objects in a drawing to behave with more
intelligence than proxy graphics. Object enablers also facilitate workgroup
collaboration when using other Autodesk products.
If the ObjectARX application is not installed on your system, you can check
for available Object Enablers on the Web. For example, if you receive a drawing
that contains objects that were created in AutoCAD Architecture, but you
don't have that application installed on your system, the AEC Object Enabler
is downloaded so you can view those drawings as they were intended.
Work with Data in Other Formats | 703


Collaborate with Others
Use the Internet for Collaboration
You can access and store drawings and related files on the Internet.
Get Started with Internet Access
Before you can transfer or save files to an Internet or an intranet location, you
have to get access permissions and take security precautions.
In this topic and others, the term Internet is used to refer to both the Internet
and an intranet. An intranet is a private network that uses the same standards
as the Internet.
To save files to an Internet location, you must have sufficient access rights to
the directory where the files are stored. Contact your network administrator or
Internet service provider (ISP) to receive access rights for you and anyone else
who needs to work with the files.
If you connect to the Internet through your company's network, you might
have to set up a proxy server configuration. Proxy servers act as security barriers
by shielding information on your company's network from potential security
risks due to external Internet access.
Contact your network administrator for details about how to configure a proxy
server in your network environment.
12
705

Work with Drawing Files over the Internet
You can open and save drawings to an Internet location, attach externally
referenced drawings stored on the Internet, and review files online using
AutoCAD WS.
Open and Save Drawing Files from the Internet
The file input and output commands recognize any valid Uniform Resource
Locator (URL) path to a DWG file.
You can use AutoCAD to open and save files from the Internet. The AutoCAD
file input and output commands (OPEN, EXPORT, and so on) recognize any
valid URL path to an AutoCAD file. The drawing file that you specify is
downloaded to your computer and opened in the AutoCAD drawing area.
You can then edit the drawing and save it, either locally or back to any Internet
or intranet location for which you have sufficient access privileges.
If you know the URL to the file you want to open, you can enter it directly in
the Select File dialog box. You can also browse defined FTP sites or web folders
in the Select File dialog box.
Share Drawing Files Internationally
Beginning with AutoCAD 2007-based products, drawing files and most files
associated with drawing files use the Unicode standard. This lets you maintain
both the visual fidelity and data integrity of international characters when
you save and open drawing files.
NOTE AutoCAD 2006-based products and prior releases were not Unicode
applications. When sharing drawings with earlier, non-Unicode, versions, use ASCII
characters to ensure compatibility when you save files, insert xrefs, and specify
folder paths.
Overview of Unicode
All characters are processed numerically by the computer operating system,
which assigns a number to each character. Various numeric encoding systems
have been used in the past, however these encoding systems often conflicted.
As a result, operating systems and applications relied on code pages with specific
character sets and numbering assigned to countries or regions.
706 | Chapter 12 Collaborate with Others

To facilitate international compatibility, the Unicode standard was adopted
by major industry leaders and is being maintained by the Unicode Consortium.
Drawing File Impact
Language-specific characters can be used in file names and text within drawing
files, or files associated with drawing files. The following are common
examples:
■ Drawing file names
■ Folder path names
■ Named objects such as layers and blocks within a drawing
■ Linetype and hatch pattern file names and their contents
■ Text used in notes and dimensions within a drawing
This means that drawings can be opened, worked on, and saved worldwide
regardless of language-specific characters. The only requirement is that the
appropriate language pack must be installed first.
When you save text files such as linetype (LIN), hatch pattern (PAT), and script
(SCR) files using an ASCII text editor, it is recommended that you specify
Unicode encoding to ensure compatibility.
Limitations
Most international drawing projects can be completed within the current
product environment. However, there are several file types and features that
are not supported yet between countries and regions that use different
Windows code pages. These features include the following:
■ Round trip file and data compatibility with non-Unicode products
■ Block attributes
Use AutoCAD WS for Drawing File Collaboration
Use AutoCAD
®
WS to share, edit, and manage AutoCAD drawings on the
Web.
AutoCAD WS is an application that interfaces directly with AutoCAD. Changes
to your local AutoCAD drawings are synchronized with the online copies that
you have stored on the AutoCAD WS server.
Use the Internet for Collaboration | 707

The AutoCAD WS Editor allows you to access and edit the online copies from
any computer with a web browser. Multiple users can work on the same
drawing file online and in real time.
Access and Share Drawings in AutoCAD WS
Log in to your AutoCAD WS account to access and manage your uploaded
files from any computer with a web browser and Internet access.
Share your drawings and other files online with other users. Users can view,
edit, or download a shared drawing without having to install CAD software
or a DWG viewer. They can also download other shared files, such as PDFs,
ZIPs, raster images, and any other files.
Collaborate in Real Time
After sharing your online drawing, collaborate with other users in real time
by inviting them to simultaneously view and edit the drawing.
Use the Timeline
The timeline allows you to track the history of an online drawing. Use the
timeline to view previous versions of the drawing, including versions resulting
from real-time collaborations. All comments made over the progress of a
drawing are displayed.
While viewing a past version of the drawing, you cannot make changes. Save
a copy of the drawing to continue working on the selected version.
For additional information and tutorials on how to use AutoCAD WS, see the
AutoCAD WS website.
Work with Xrefs over the Internet
You can attach externally referenced drawings stored on the Internet or an
intranet to drawings stored locally on your system.
For example, you might have a set of construction drawings that are modified
daily by a number of contractors. These drawings are stored in a project
directory on the Internet. You can maintain a master drawing on your
computer, and attach the Internet drawings to the master drawing as external
references (xrefs). When any of the Internet drawings are modified, the changes
are included in your master drawing the next time you open it. This is a
708 | Chapter 12 Collaborate with Others

powerful mechanism for developing accurate, up-to-date composite drawings
that can be shared by a design team.
NOTE If you have a slow Internet connection or are working with a master drawing
that has many xrefs attached, the download of the xrefs to your system might
take a long time.
Use the Internet for Collaboration | 709

710

Render Drawings
Draw 2D Isometric Views
The Isometric Snap/Grid mode helps you create 2D isometric images that
represent 3D objects.
The Isometric Snap/Grid mode helps you create 2D images that represent 3D
objects. By setting the Isometric Snap/Grid, you can easily align objects along
one of three isometric planes; however, although the isometric drawing appears
to be 3D, it is actually a 2D representation. Therefore, you cannot expect to
extract 3D distances and areas, display objects from different viewpoints, or
remove hidden lines automatically.
Set Isometric Grid and Snap
Simulate a 3D object from a particular viewpoint by aligning along three major
axes.
Isometric drawings simulate a 3D object from a particular viewpoint by aligning
along three major axes.
By setting the Isometric Snap/Grid, you can easily align objects along one of
three isometric planes; however, although the isometric drawing appears to be
3D, it is actually a 2D representation. Therefore, you cannot expect to extract
3D distances and areas, display objects from different viewpoints, or remove
hidden lines automatically.
If the snap angle is 0, the axes of the isometric planes are 30 degrees, 90 degrees,
and 150 degrees. Once you set the snap style to Isometric, you can work on any
of three planes, each with an associated pair of axes:
■ Left. Aligns snap and grid along 90- and 150-degree axes.
13
711
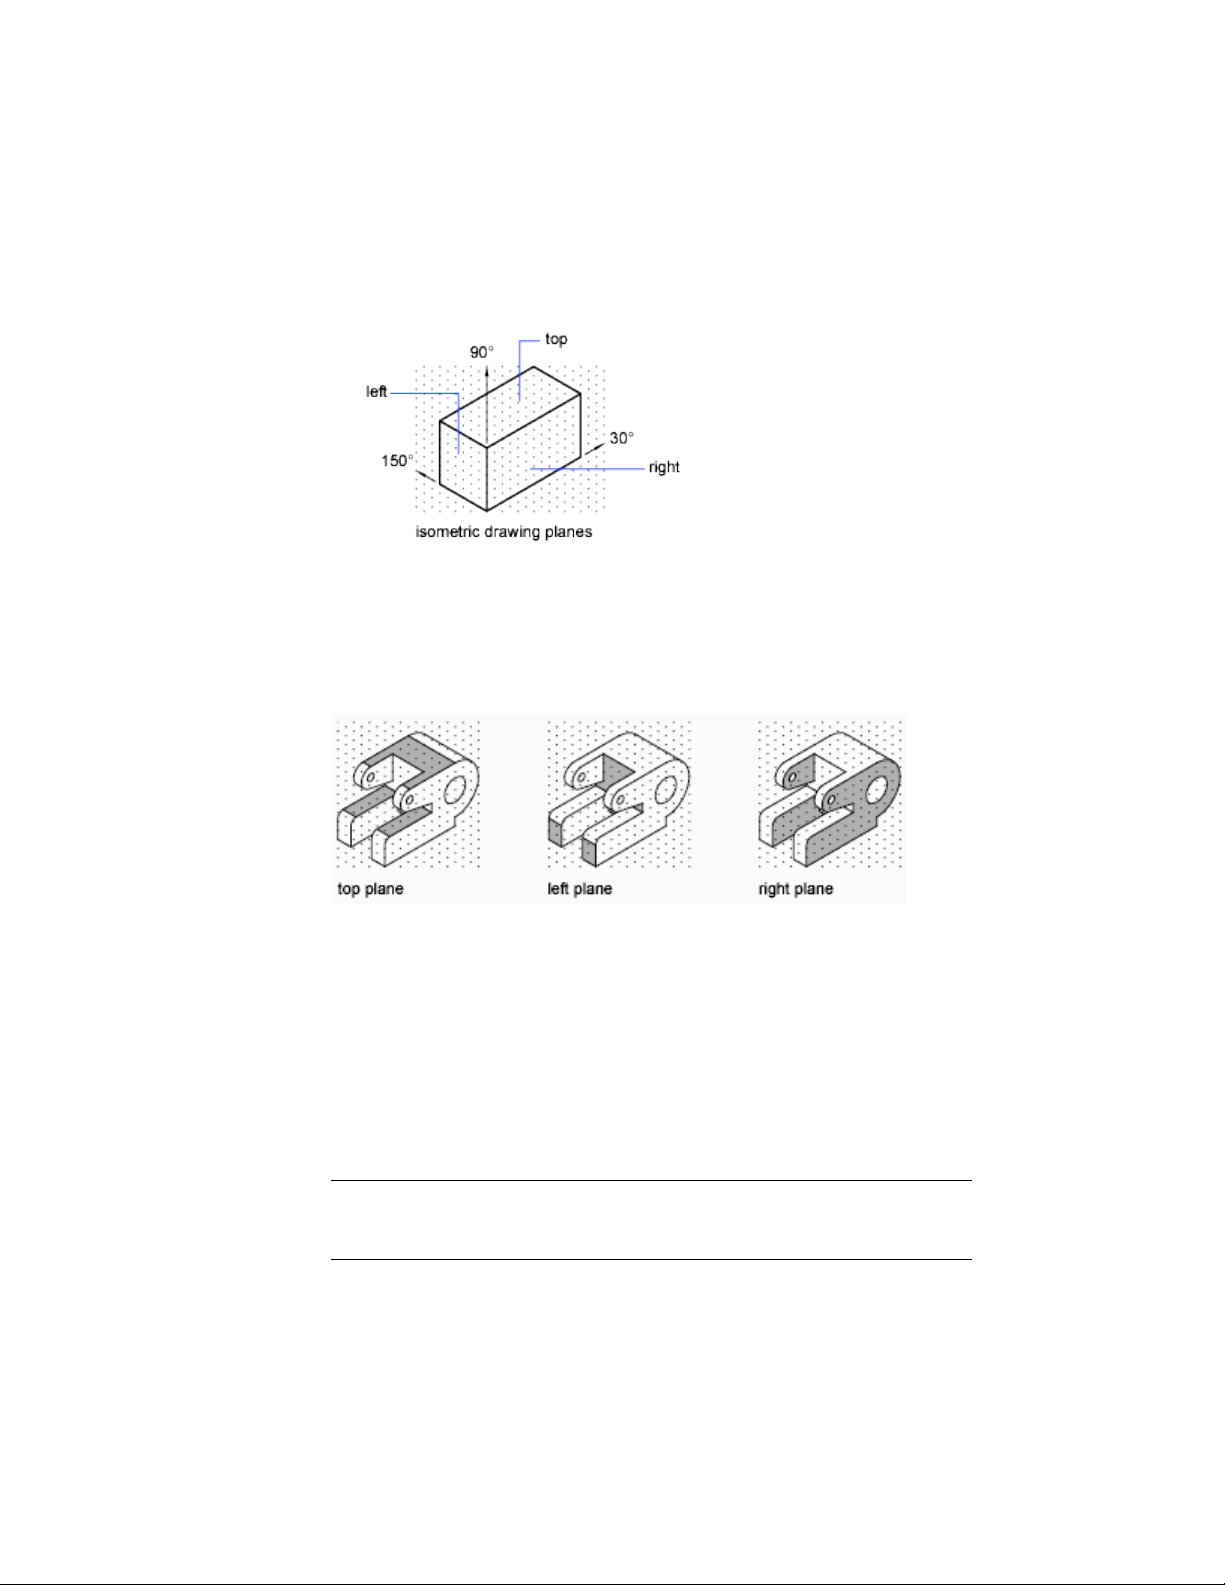
■ Top. Aligns snap and grid along 30- and 150-degree axes.
■ Right. Aligns snap and grid along 30- and 90-degree axes.
Choosing one of the three isometric planes causes Ortho and the crosshairs
to be aligned along the corresponding isometric axes. For example, when
Ortho is on, the points you specify align along the simulated plane you are
drawing on. Therefore, you can draw the top plane, switch to the left plane
to draw another side, and switch to the right plane to complete the drawing.
Draw Isometric Circles
Represent circles on isometric planes using ellipses.
If you are drawing on isometric planes, use an ellipse to represent a circle
viewed from an oblique angle. The easiest way to draw an ellipse with the
correct shape is to use the Isocircle option of ELLIPSE. The Isocircle option is
available only when the Style option of Snap mode is set to Isometric (see
DSETTINGS).
NOTE To represent concentric circles, draw another ellipse with the same center
rather than offsetting the original ellipse. Offsetting produces an oval-shaped spline
that does not represent foreshortened distances as you would expect.
712 | Chapter 13 Render Drawings

Add Lighting to Your Model
Lighting can be added to a scene to create a more realistic rendering.
Overview of Lighting
Lighting adds the finishing touch to the scene.
Default Lighting
When there are no lights in a scene, the scene is shaded with default lighting.
Default lighting is derived from two distant sources that follow the viewpoint
as you move around the model. All faces in the model are illuminated so that
they are visually discernible. You can control brightness and contrast, but you
do not need to create or place lights yourself.
When you insert custom lights or add sunlight, you can disable the default
lighting. You can apply default lighting to the viewport only; at the same
time, you can apply custom lights to the rendering.
Standard Lighting Workflow
You add lights to give the scene a realistic appearance. Lighting enhances the
clarity and three-dimensionality of a scene. You can create point lights,
spotlights, and distant lights to achieve the effects you want. You can move
or rotate them with grip tools, turn them on and off, and change properties
such as color and attenuation. The effects of changes are visible in the viewport
in real time.
Spotlights and point lights are each represented by a different light glyph (a
symbol in the drawing showing the location of the light). Distant lights and
the sun are not represented by glyphs in the drawing because they do not
have a discrete position and affect the entire scene. You can turn the display
of light glyphs on or off while you work. By default, light glyphs are not
plotted.
Photometric Lighting Workflow
For more precise control over lighting, you can use photometric lights to
illuminate your model. Photometric lights use photometric (light energy)
values that enable you to define lights more accurately as they would be in
the real world. You can create lights with various distribution and color
Add Lighting to Your Model | 713
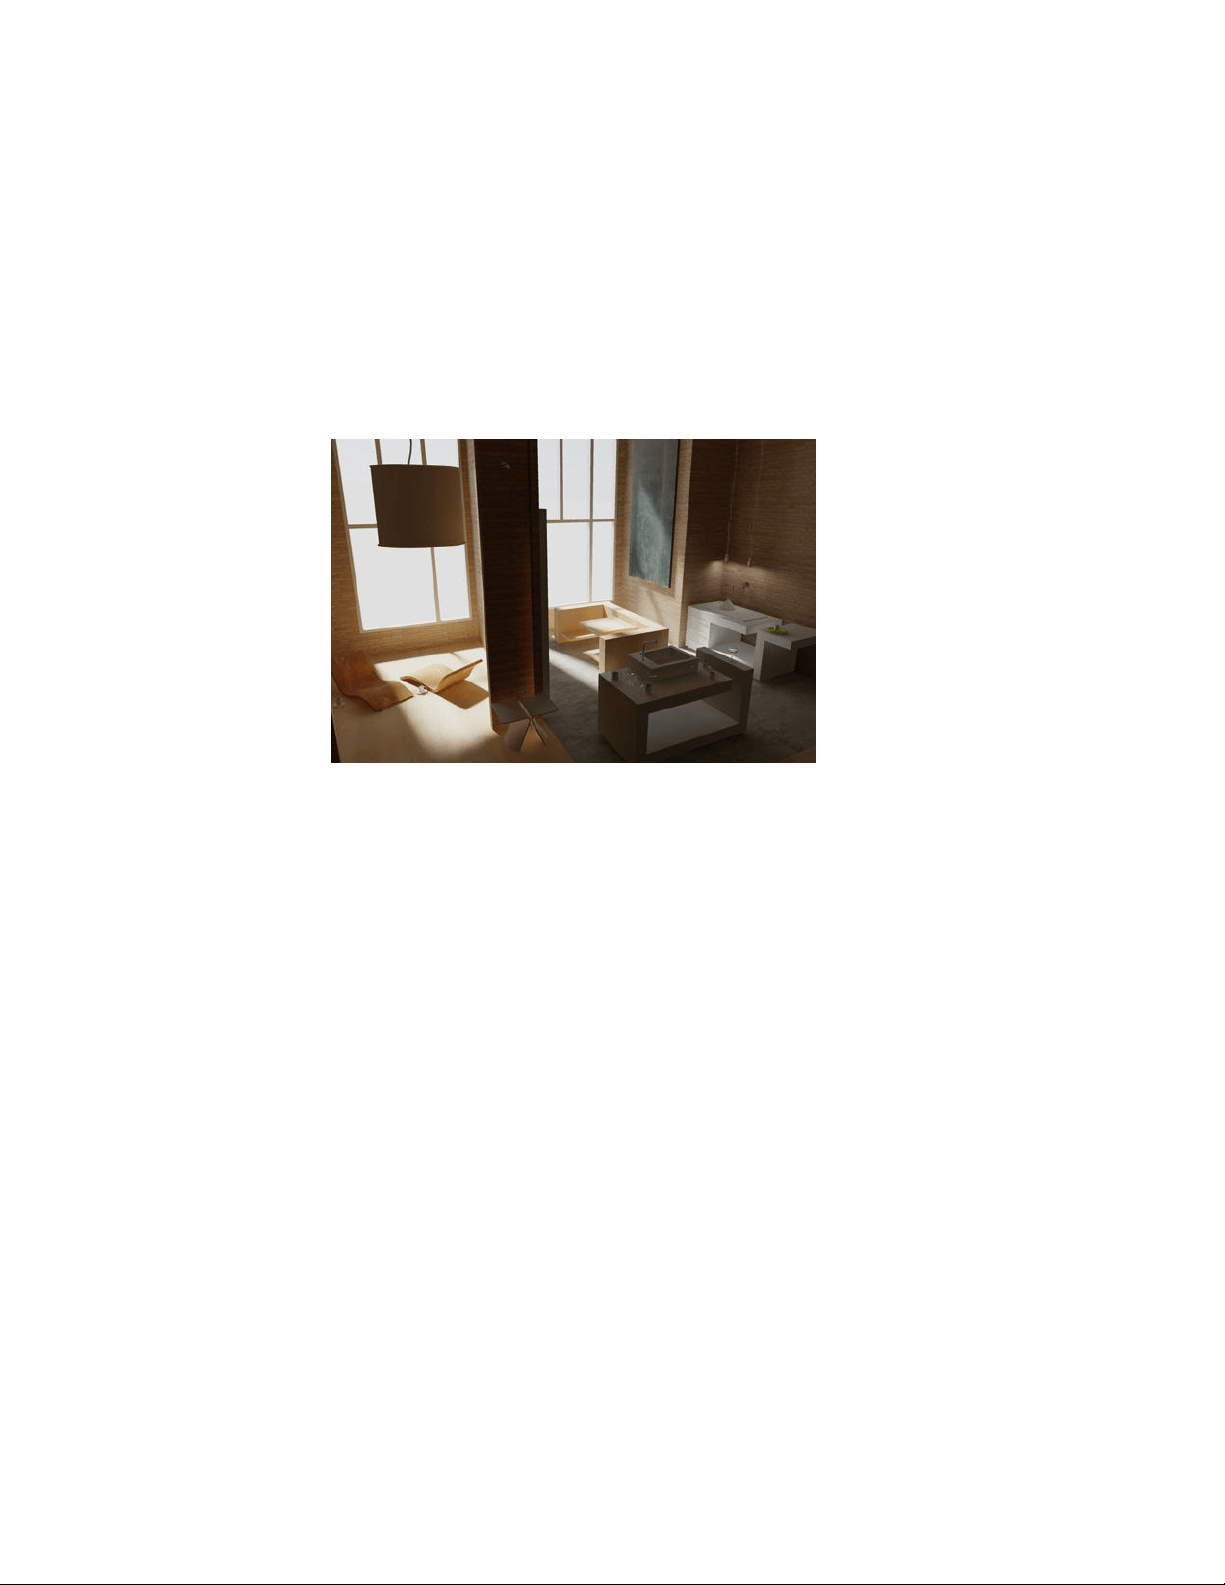
characteristics, or import specific photometric files available from lighting
manufacturers.
Photometric lights can use manufacturers' IES standard file format. By using
manufacturers’ lighting data, you can visualize commercially available lighting
in your model. Then you can experiment with different fixtures, and by varying
the light intensity and color temperature, you can design a lighting system
that produces the results you want.
Sun and Sky
The sun is a special light similar to a distant light. The angle of the sun is
defined by the geographic location that you specify for the model and by the
date and time of day that you specify. You can change the intensity of the
sun and the color of its light. The sun and sky are the primary sources of
natural illumination. With the sun and sky simulation (page 735), you can
adjust their properties.
In the photometric workflow, the sun follows a more physically accurate
lighting model in both the viewport and the rendered output. In the
photometric workflow, you can also enable sky illumination (through the sky
background feature), which adds soft, subtle lighting effects caused by the
lighting interactions between the sun and the atmosphere.
Luminaire Objects
Light fixtures can be represented by embedding photometric lights in blocks
that also contain geometry. A luminary assembles a set of light objects into a
light fixture.
714 | Chapter 13 Render Drawings
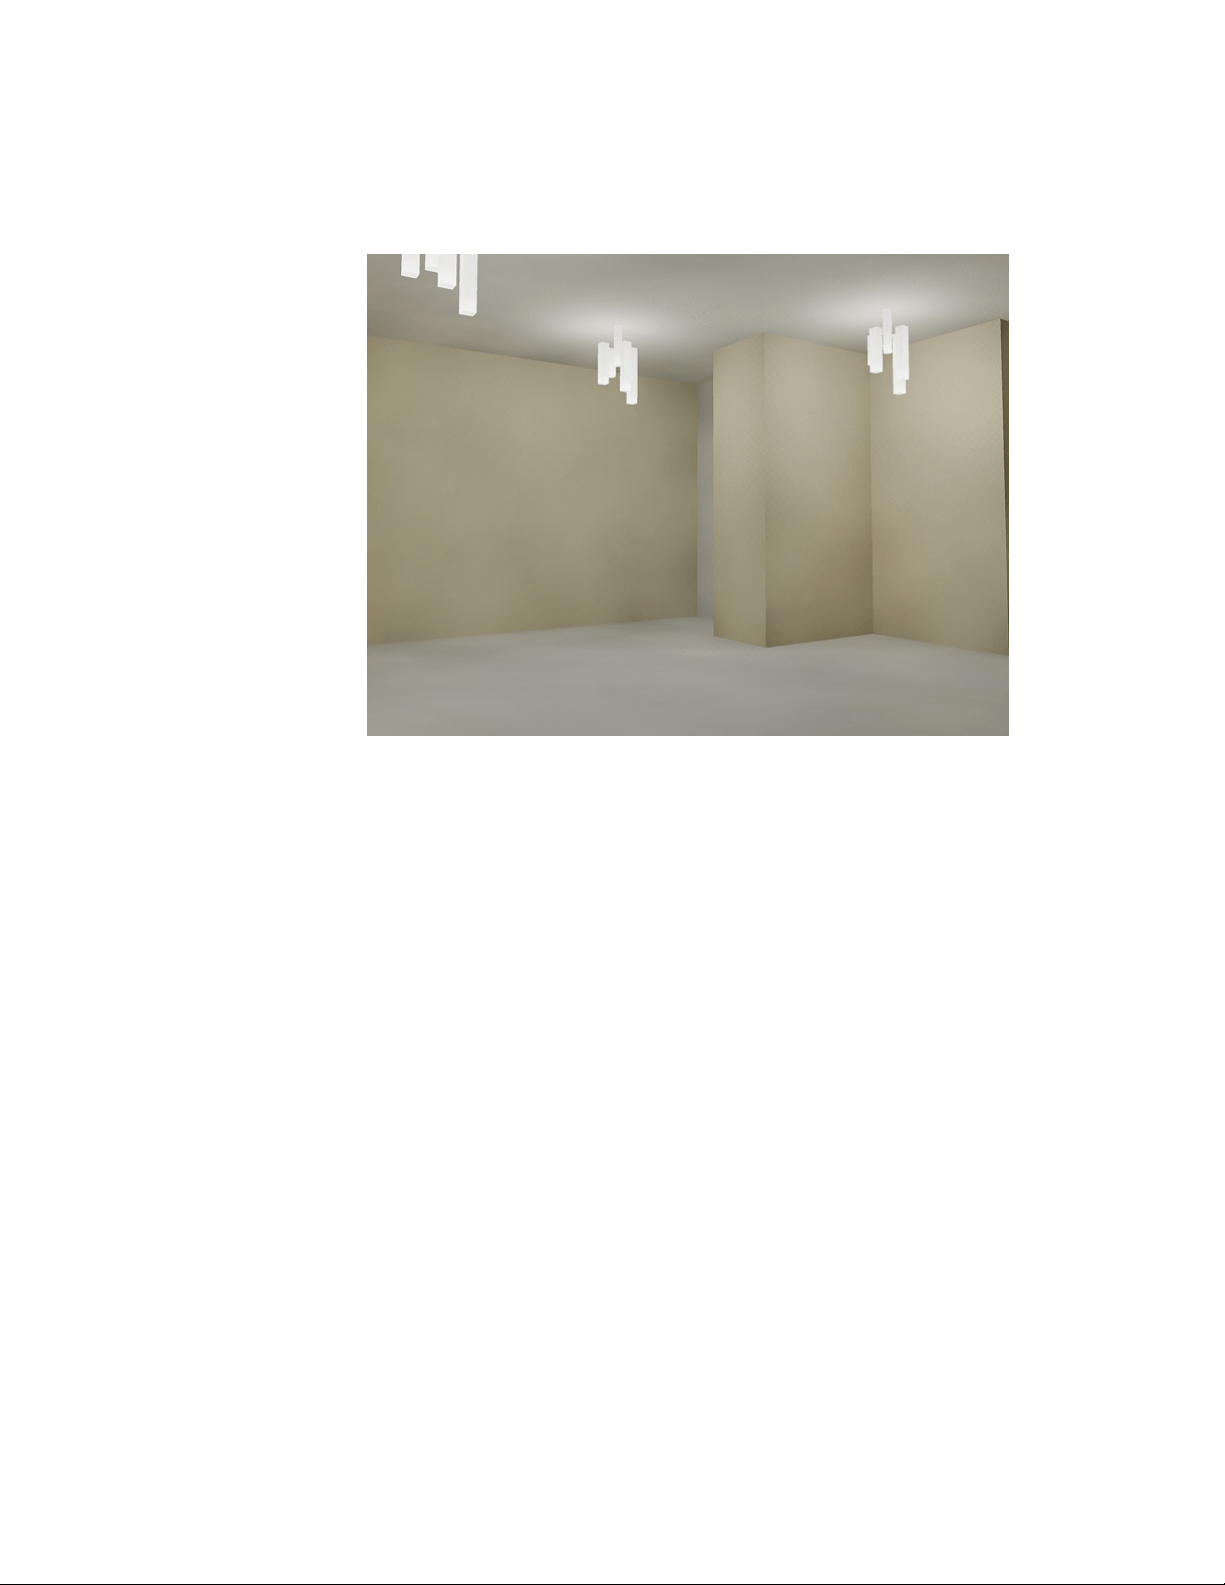
Standard and Photometric Lighting Workflow
Types of lighting selected globally affect a drawing.
Set the Type of Lighting
AutoCAD offers three choices for lighting units: standard (generic),
International (SI), and American. The standard (generic) lighting workflow is
equivalent to the lighting workflow in AutoCAD prior to AutoCAD 2008. The
default lighting workflow for drawings created in AutoCAD 2008 and later is
a photometric workflow based on International (SI) lighting units. This choice
results in physically correct lighting. The American lighting unit provides
another option. American differs from International in that illuminance values
are formatted in foot-candles rather than lux.
In previous versions of AutoCAD, standard lighting was the default. You can
change the type of lighting with the LIGHTINGUNITS system variable. The
LIGHTINGUNITS system variable set to 0 represents standard (generic) lighting;
set to 1 represents photometric lighting in American units; set to 2 represents
photometric lighting in International SI units.
Add Lighting to Your Model | 715

Photometric Lights
Photometric lights are physically correct lights. Physically correct lights
attenuate as the square of the distance.
Photometric properties can be added to both artificial lights and natural lights.
Natural lights are the sun and the sky. The natural lighting is represented
interactively by a viewport background type.
You can create lights with various distribution and color characteristics, or
import specific photometric files available from lighting manufacturers.
Photometric lights always attenuate using an inverse-square falloff, and rely
on your scene to use realistic units.
Illuminate a Scene
You can add point lights, spotlights, and distant lights and set the location
and photometric properties of each.
You can use a command to create a light, or you can use a button on the
Lights toolbar or the Lights panel on the ribbon. You can use the Properties
Inspector palette to change the color of a selected light or other properties.
You can also store a light and its properties on a tool palette and use it again
in the same drawing or another drawing.
Guidelines for Lighting
The guidelines for lighting used by photographers, filmmakers, and stage
designers can help you set up the lighting for scenes.
Your choice of lighting depends on whether your scene simulates natural or
artificial illumination. Naturally lit scenes, such as daylight or moonlight, get
their most important illumination from a single light source. Artificially lit
scenes, on the other hand, often have multiple light sources of similar
intensity.
Natural Light
For practical purposes at ground level, sunlight has parallel rays coming from
a single direction. The direction and angle vary depending on the time of day,
the latitude, and the season.
716 | Chapter 13 Render Drawings

In clear weather, the color of sunlight is a pale yellow: for example, RGB values
of 250, 255, 175 (HSV 45, 80, 255). Cloudy weather can tint sunlight blue,
shading into dark gray for stormy weather. Particles in the air can give sunlight
an orange or brownish tint. At sunrise and sunset, the color can be more
orange or red than yellow.
Shadows are more distinct the clearer the day is, and can be essential for
bringing out the three-dimensionality of a naturally lit scene.
A directional light can also simulate moonlight, which is white but dim
compared to the sun.
Artificial Light
A scene illuminated by point lights, spotlights, or distant lights is artificially
illuminated. Therefore, it can be helpful to know how light behaves.
When light rays strike a surface, the surface reflects them, or at least some of
them, enabling us to see the surface. The appearance of a surface depends on
the light that strikes it combined with the properties of the surface material,
such as color, smoothness, and opacity.
Other factors, such as a light’s color, intensity, attenuation, and angle of
incidence also play a role in how objects in a scene appear.
Use Point Lights
A point light radiates light in all directions from its location.
Point Lights
A point light radiates light in all directions from its location. A point light
does not target an object. Use point lights for general lighting effects. You can
create a point light by entering the POINTLIGHT command or by selecting a
point light from the Lights panel on the ribbon.
You create a target point light with the TARGETPOINT command. The
difference between the target point light and a point light is the additional
target properties that are available. A target light can be pointed to an object.
A target point light can also be created from a point light by changing the
target property of the point light from No to Yes.
In the standard lighting workflow, you can set a point light manually so its
intensity diminishes with respect to distance either linearly, according to the
Add Lighting to Your Model | 717
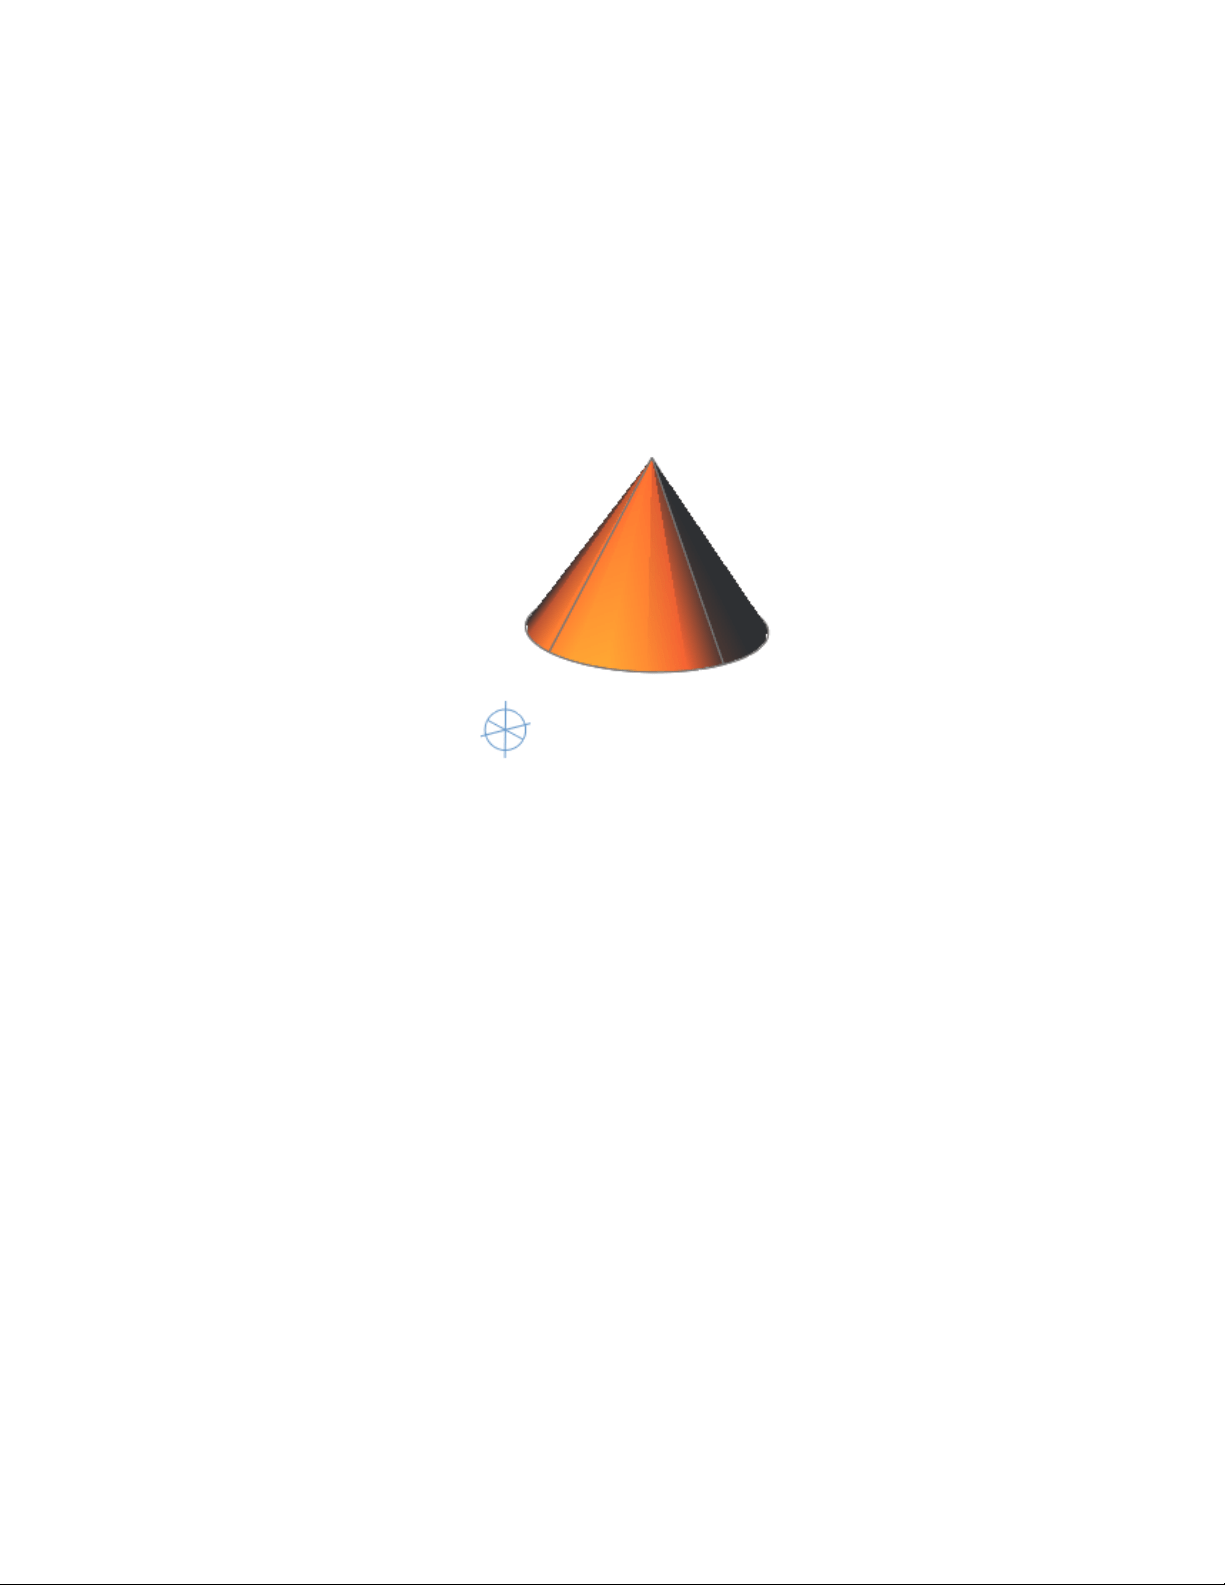
inverse square of the distance, or not at all. By default, the attenuation is set
to None.
Point Lights in Photometric Workflow
A free point light can have photometric distribution properties. The attenuation
for a photometric point light is always set to inverse square.
When the LIGHTINGUNITS system variable is set to 1 (American units) or 2
(International SI units) for photometric lighting, additional properties are
available for a point light. On the Properties Inspector palette, photometric
properties are
■ Lamp Intensity. Specifies the inherent brightness of the light. Specifies
the intensity, flux or illuminance of the lamp.
■ Resulting Intensity. Gives the final brightness of the light. (Product of
lamp intensity and intensity factor. Read-only.)
■ Lamp Color. Specifies the inherent color of the light in Kelvin temperature
or standard.
718 | Chapter 13 Render Drawings

■ Resulting Color. Gives the final color of the light. This is determined
by a combination of the lamp color and the filter color. (Product of lamp
color and filter color. Read-only.)
NOTE When the drawing lighting units are photometric, the attenuation type
property becomes disabled. Photometric lights have fixed, inverse-square
attenuation.
Use Spotlights
A spotlight can be directed towards an object.
Spotlights
A spotlight distribution casts a focused beam of light like a flashlight, a follow
spot in a theater, or a headlight. A spotlight emits a directional cone of light.
You can control the direction of the light and the size of the cone. Like a point
light, a spot light can be manually set to attenuate its intensity with distance.
However, a spotlight's intensity will also always attenuate based on the angle
relative to the spot's target vector. This attenuation is controlled by the hotspot
and falloff angles of the spotlight. Spotlights are useful for highlighting specific
features and areas in your model. A free spotlight (FREESPOT) is similar to
spotlight. A spotlight has target properties.
Add Lighting to Your Model | 719
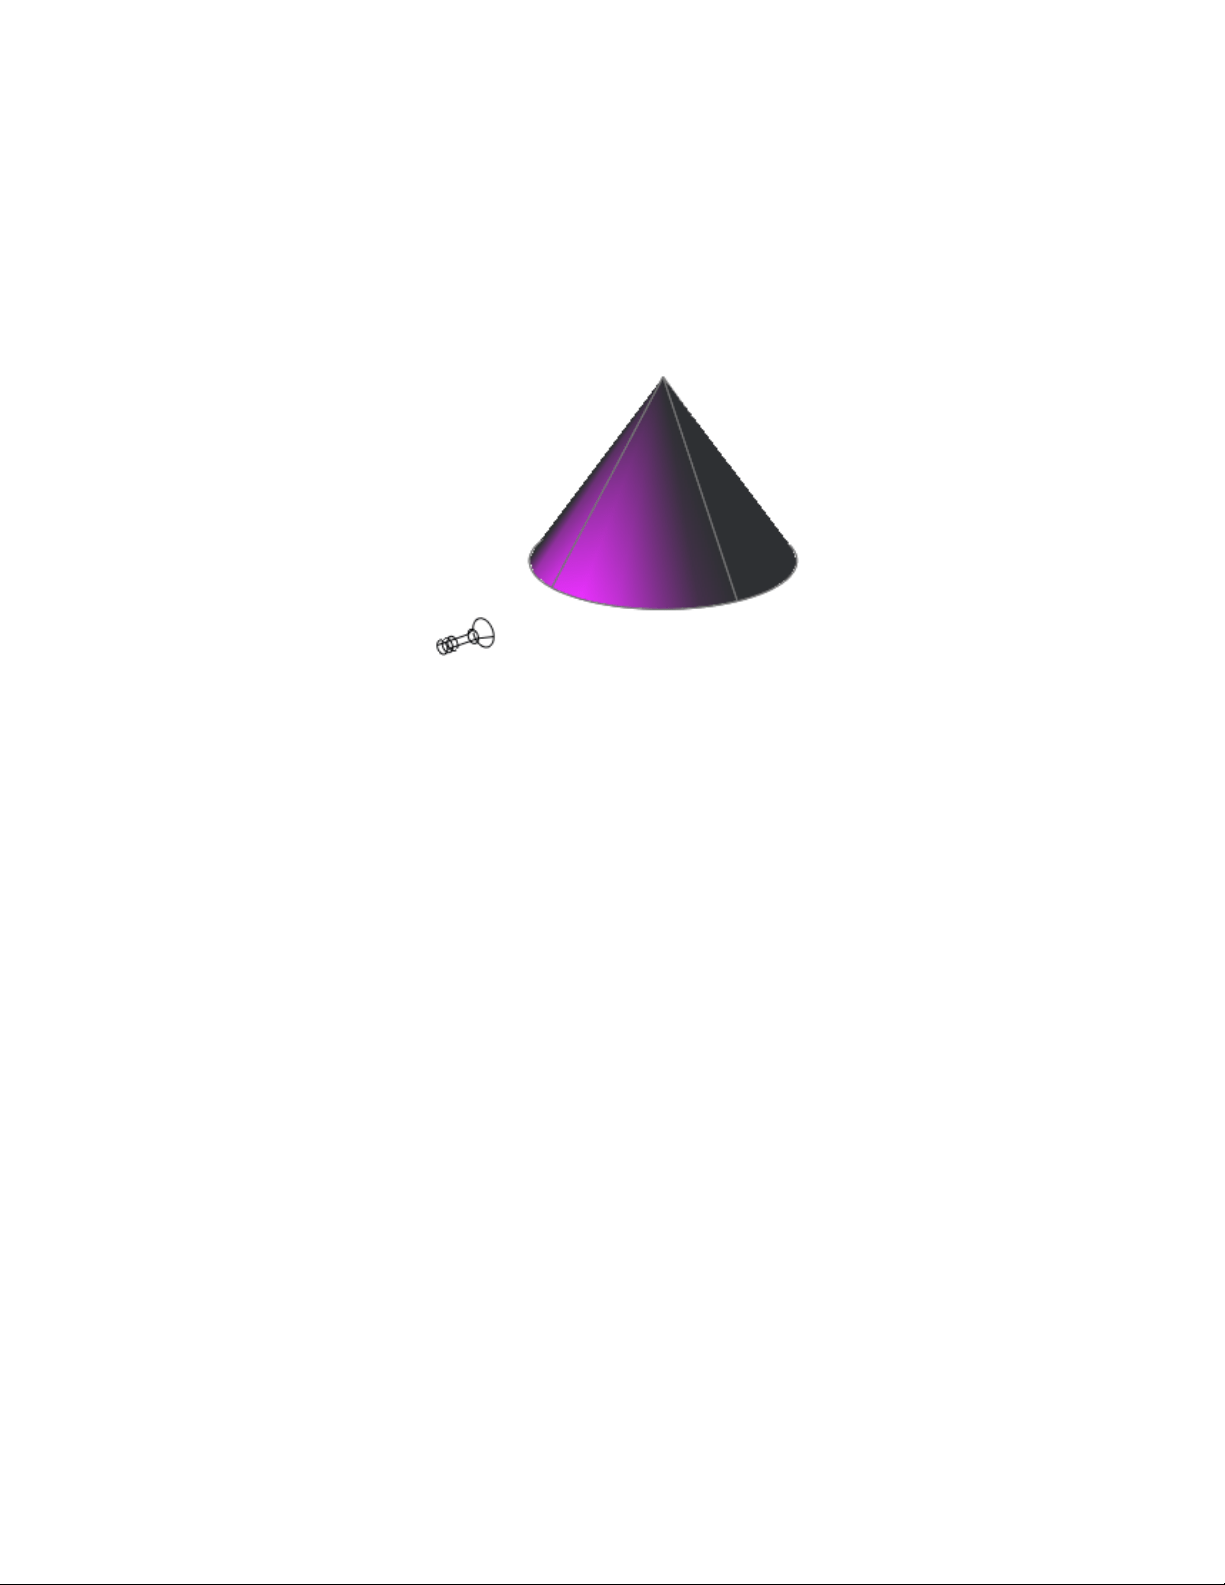
Spotlights in Photometric Workflow
In photometric workflow, the hotspot intensity falls to 50 percent. The hotspot
for standard lighting is at 100 percent. At its falloff angle, intensity of the
spotlight falls to zero. Additional properties become available for a point light
when LIGHTINGUNITS is set to 1 (American units) or 2 (International SI units)
for photometric lighting:
■ Lamp Intensity. Specifies the inherent brightness of the light. Specifies
the intensity, flux, or illuminance of the lamp.
■ Resulting Intensity. Gives the final brightness of the light. (Product of
lamp intensity and intensity factor. Read-only.)
■ Lamp Color. Specifies the inherent color of the light in Kelvin temperature
or standard.
■ Resulting Color. Gives the final color of the light. This is determined
by a combination of the lamp color and the filter color. (Product of lamp
color and filter color. Read-only.)
720 | Chapter 13 Render Drawings

NOTE When the drawing lighting units are photometric, the attenuation type
property becomes disabled. Photometric lights have fixed, inverse-square
attenuation. The hotspot falloff attenuation in the rendered image varies from
standard lighting, as it uses a different mathematical basis.
Use Weblights
Weblights are photometric lights with customized, real-world light
distributions.
Overview of Weblights
Weblights are photometric lights with customized, real-world light
distributions.
A weblight (web) is a 3D representation of the light intensity distribution of
a light source. Weblights can be used to represent anisotropic (non-uniform)
light distributions derived from data provided by manufacturers of real-world
lights. This gives a far more precise representation of the rendered light than
either spot or point lights are capable of.
This directional light distribution information is stored in a photometric data
file in the IES format using the IES LM-63-1991 standard file format for
photometric data. You can load photometric data files provided by various
manufacturers under the Photometric Web panel in the Properties Inspector
palette for the light. The light icon represents the photometric web you select.
A light that uses a photometric web can be added to a drawing by entering
the commands WEBLIGHT and FREEWEB at the command prompt. The
WEBLIGHT command creates a targeted weblight, whereas the FREEWEB
command creates a weblight without an explicit target.
To describe the directional distribution of the light emitted by a source,
AutoCAD approximates the source by a point light placed at its photometric
center. With this approximation, the distribution is characterized as a function
of the outgoing direction only. The luminous intensity of the source for a
predetermined set of horizontal and vertical angles is provided, and the system
can compute the luminous intensity along an arbitrary direction by
interpolation.
NOTE Web distribution is used only in rendered images. Weblights are
approximated as point lights in the viewport.
Add Lighting to Your Model | 721
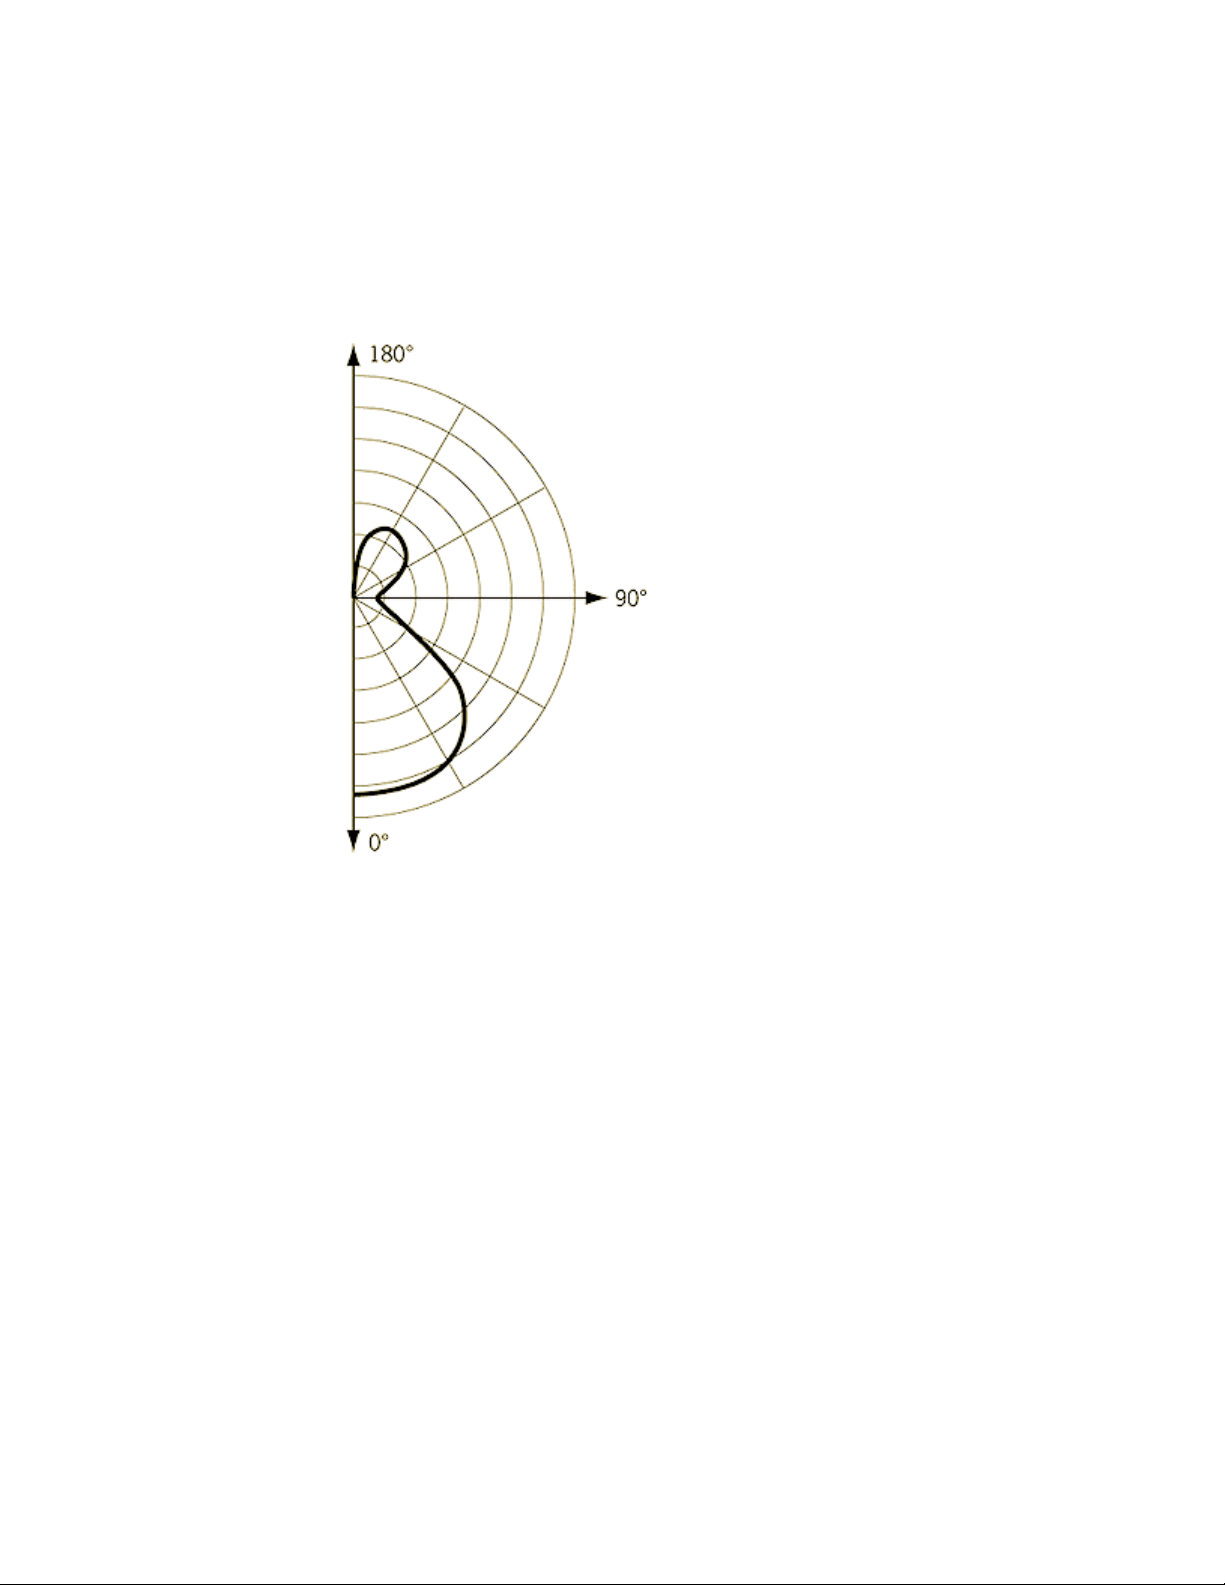
Goniometric Diagrams
Photometric data is often depicted using a goniometric diagram.
Goniometric diagram of a web distribution
This type of diagram visually represents how the luminous intensity of a source
varies with the vertical angle. However, the horizontal angle is fixed and,
unless the distribution is axially symmetric, more than one goniometric
diagram may be needed to describe the complete distribution.
Photometric Webs
The photometric web is a three dimensional representation of the light
distribution. It extends the goniometric diagram to three dimensions, so that
the dependencies of the luminous intensity on both the vertical and horizontal
angles can be examined simultaneously. The center of the photometric web
represents the center of the light object.
722 | Chapter 13 Render Drawings
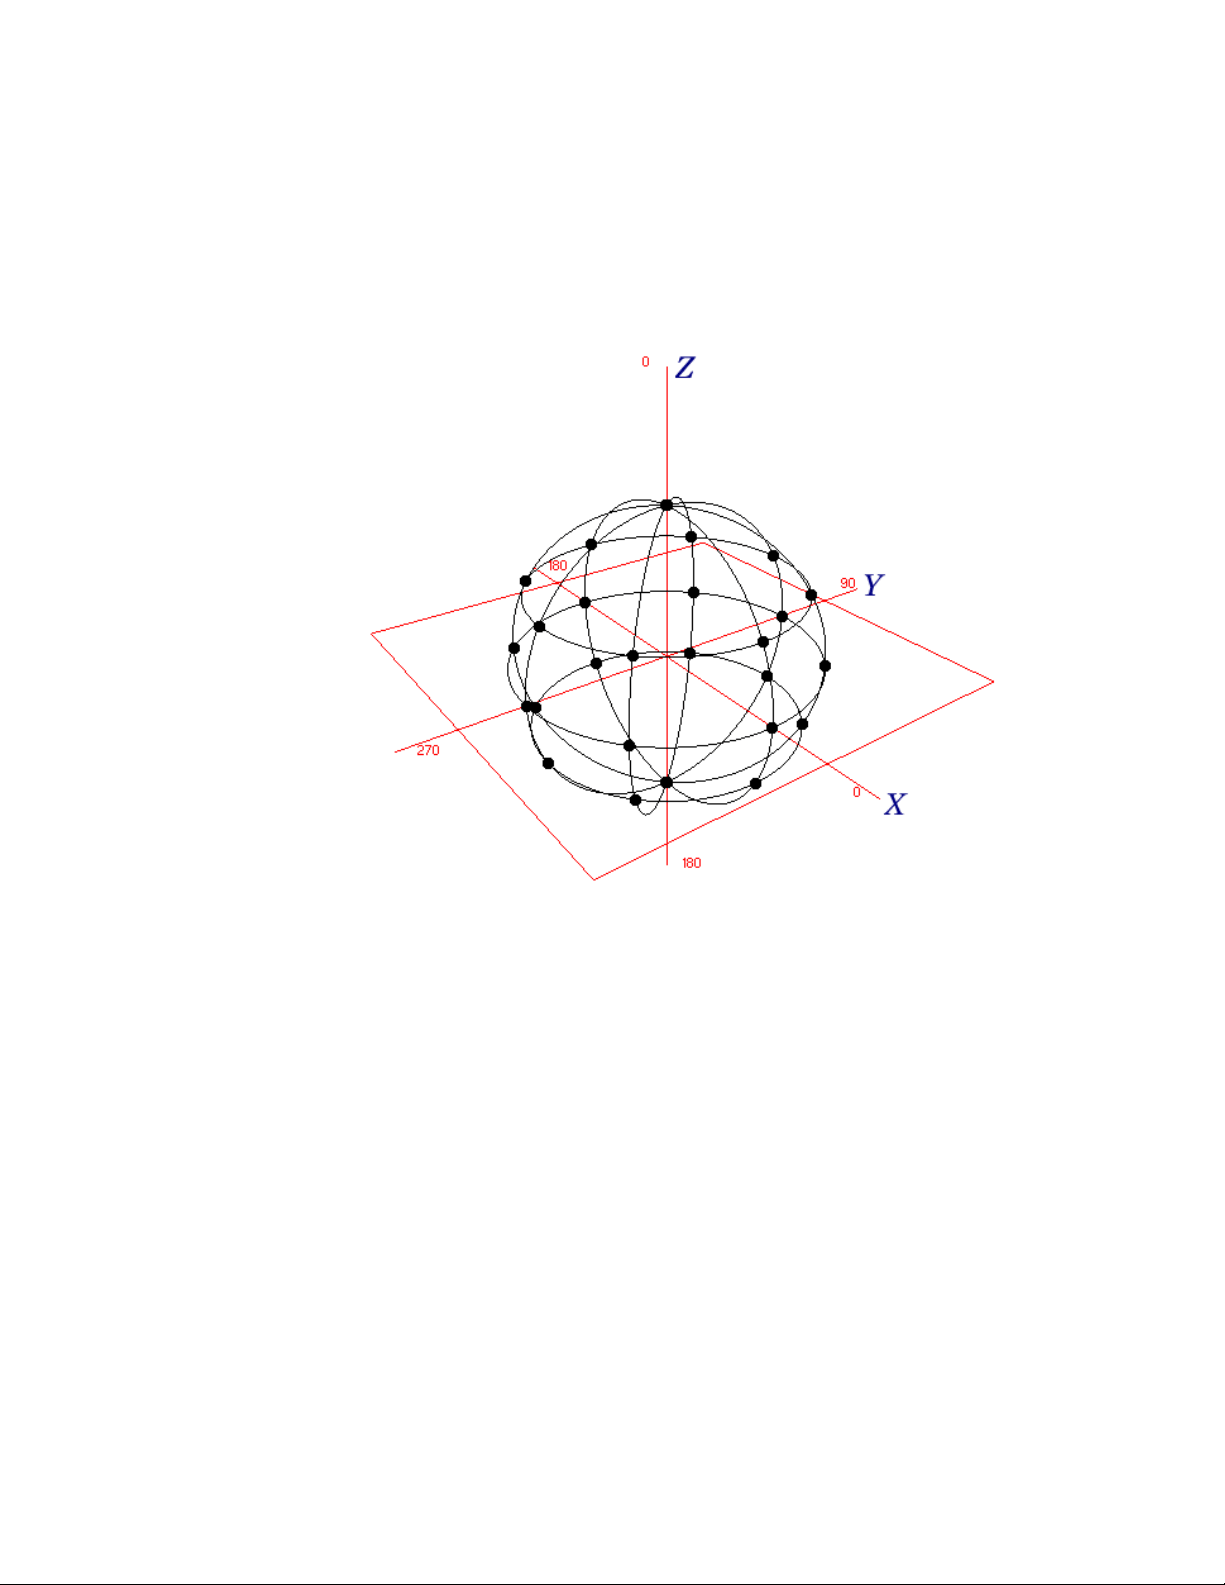
The luminous intensity in any given direction is proportional to the distance
between this web and the photometric center, measured along a line leaving
the center in the specified direction.
Example of Isotropic distribution
A sphere centered around the origin is a representation of an isotropic
distribution. All the points in the diagram are equidistant from the center and
therefore light is emitted equally in all directions.
Add Lighting to Your Model | 723
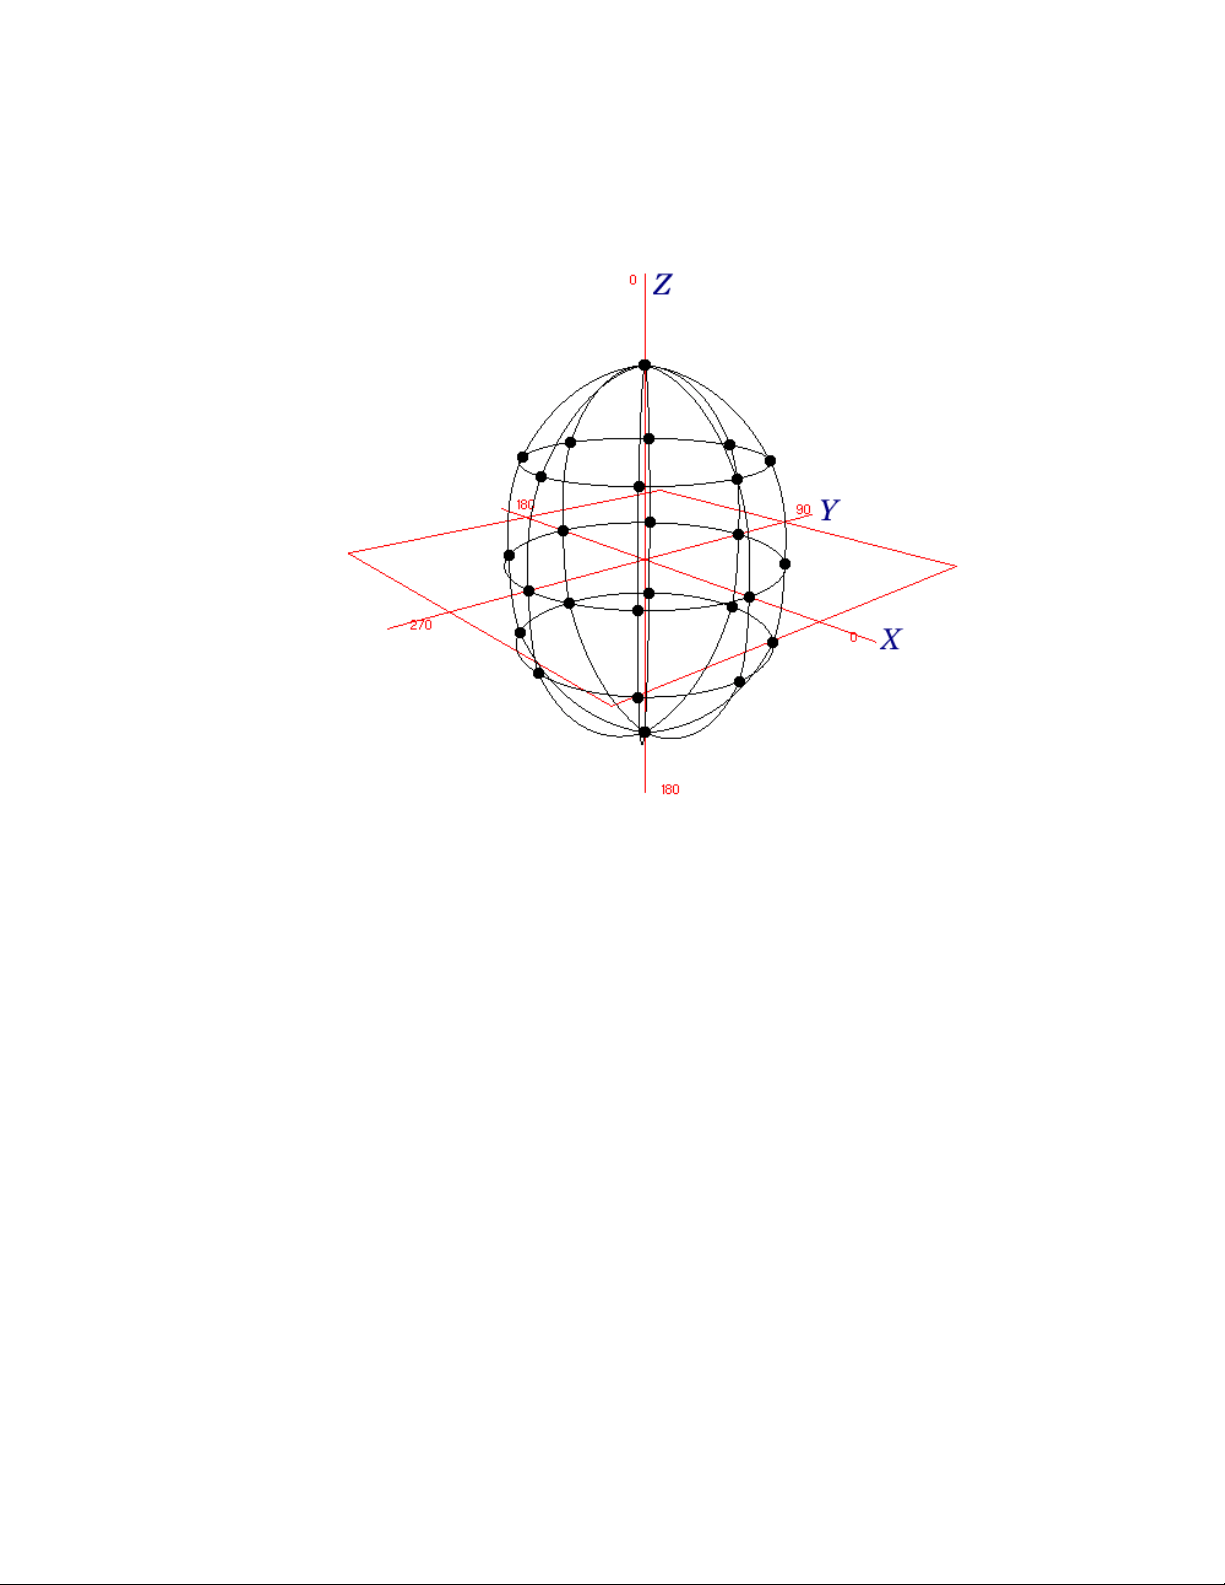
Example of Ellipsoidal distribution
In this example, the points in the negative Z direction are the same distance
from the origin as the corresponding points in the positive Z direction, so the
same amount of light shines upward and downward. No point has a very large
X or Y component, either positive or negative, so less light is cast laterally
from the light source.
IES Standard File Format
IES standard file formats can be created and modified.
You can create a photometric data file in the IES format using the IES
LM-63-1991 standard file format for photometric data. (IES stands for
Illuminating Engineering Society.) However, only the information relevant
to AutoCAD is described here. For a complete description of the IES standard
file format, see IES Standard File Format for Electronic Transfer of Photometric
724 | Chapter 13 Render Drawings

Data and Related Information, prepared by the IES Computer Committee
(http://www.iesna.org).
The luminous intensity distribution (LID) of a luminaire is measured at the
nodes of a photometric web for a fixed set of horizontal and vertical angles.
The poles of the web lie along the vertical axis, with the nadir corresponding
to a vertical angle of zero degrees. The horizontal axis corresponds to a
horizontal angle of zero degrees and is oriented parallel to the length of the
luminaire. This type of photometric web is generated by a Type C goniometer
and is the most popular in North America; other types of goniometry are
supported by the IES standard file format but are not discussed here.
The photometric data is stored in an ASCII file. Each line in the file must be
less than 132 characters long and must be terminated by a carriage
return/line-feed character sequence. Longer lines can be continued by inserting
a carriage return/line-feed character sequence.
Each field in the file must begin on a new line and must appear exactly in the
following sequence:
1 IESNA91
2 [TEST] The test report number of your data
3 [MANUFAC] The manufacturer of the luminaire
4 TILT=NONE
5 1
6 The initial rated lumens for the lamp used in the test or -1 if absolute
photometry is used and the intensity values do not depend on different
lamp ratings.
7 A multiplying factor for all the candela values in the file. This makes it
possible to easily scale all the candela values in the file when the
measuring device operates in unusual units—for example, when you
obtain the photometric values from a catalog using a ruler on a
goniometric diagram. Normally the multiplying factor is 1.
8 The number of vertical angles in the photometric web.
9 The number of horizontal angles in the photometric web.
10 1
11 The type of unit used to measure the dimensions of the luminous
opening. Use 1 for feet or 2 for meters.
12 The width, length, and height of the luminous opening. It is normally
given as 0 0 0.
13 1.0 1.0 0.0
Add Lighting to Your Model | 725
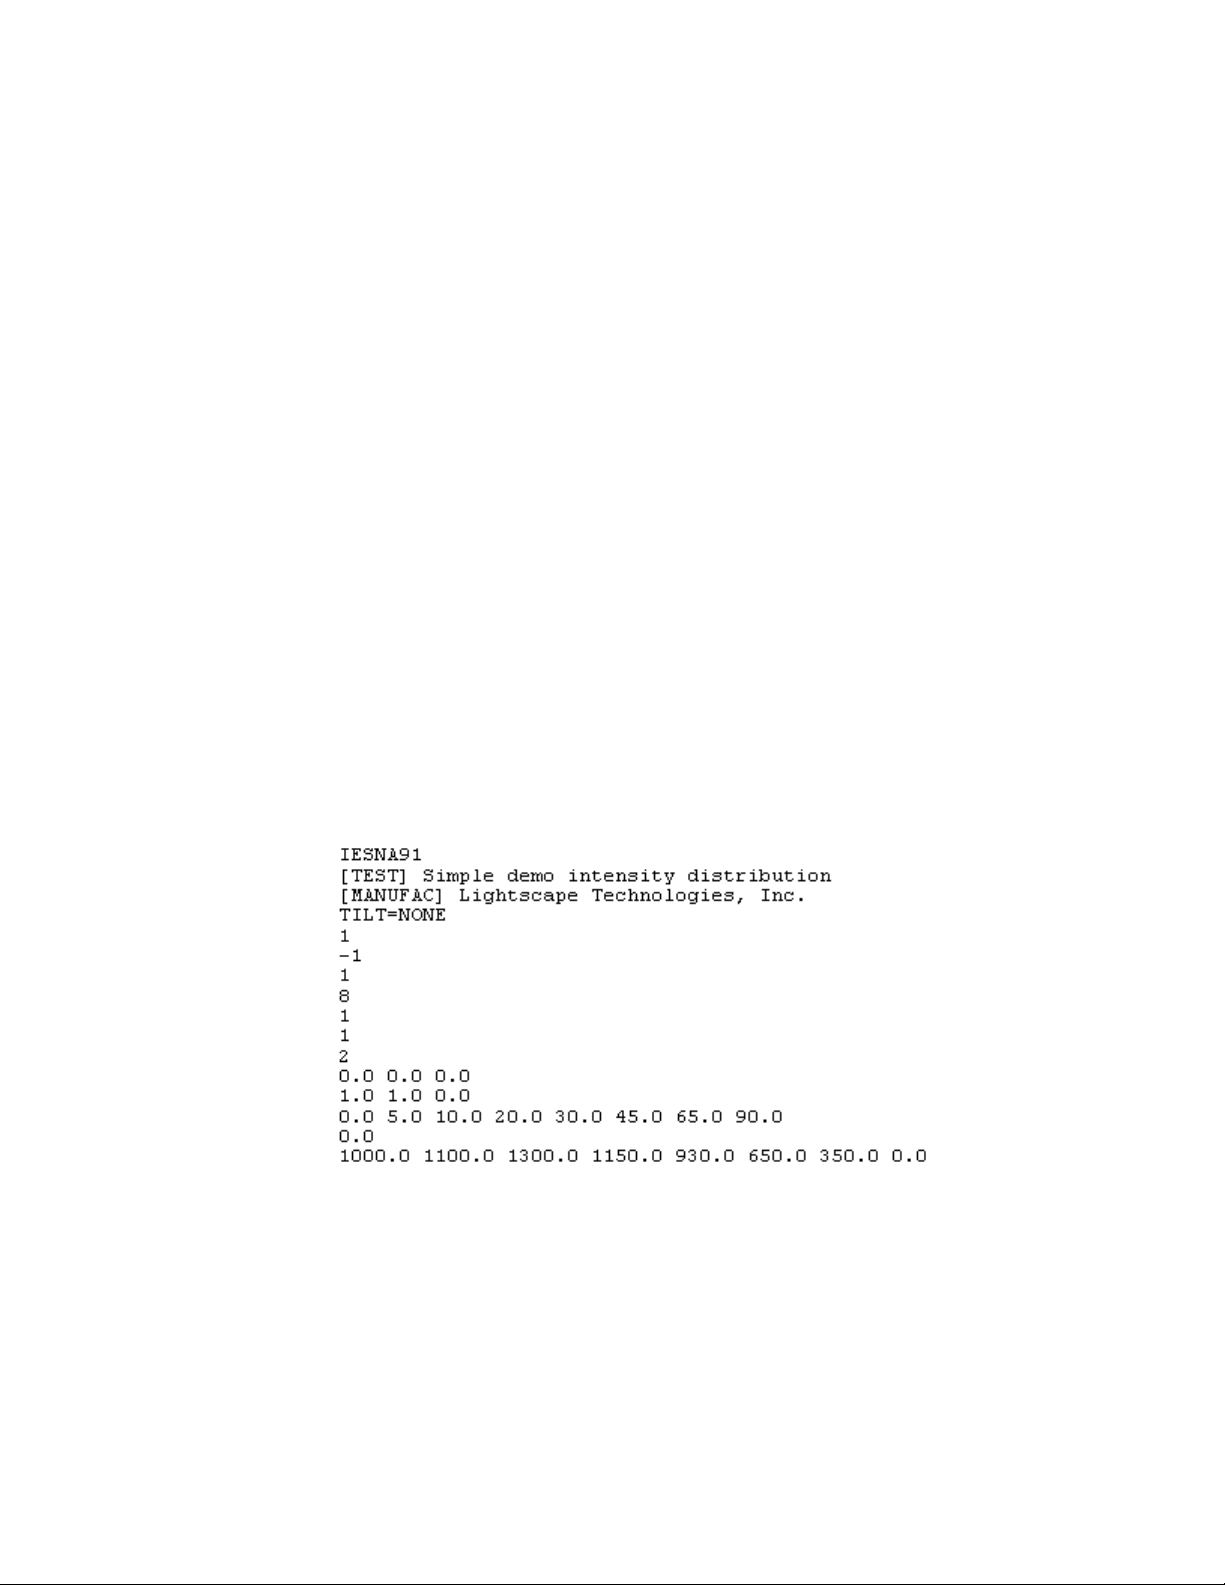
14 The set of vertical angles, listed in increasing order. If the distribution
lies completely in the bottom hemisphere, the first and last angles must
be 0° and 90°, respectively. If the distribution lies completely in the top
hemisphere, the first and last angles must be 90° and 180°, respectively.
Otherwise, they must be 0° and 180°, respectively.
15 The set of horizontal angles, listed in increasing order. The first angle
must be 0°. The last angle determines the degree of lateral symmetry
displayed by the intensity distribution. If it is 0°, the distribution is axially
symmetric. If it is 90°, the distribution is symmetric in each quadrant.
If it is 180°, the distribution is symmetric about a vertical plane. If it is
greater than 180° and less than or equal to 360°, the distribution exhibits
no lateral symmetries. All other values are invalid.
16 The set of candela values. First, all the candela values corresponding to
the first horizontal angle are listed, starting with the value corresponding
to the smallest vertical angle and moving up the associated vertical plane.
Then, the candela values corresponding to the vertical plane through
the second horizontal angle are listed, and so on until the last horizontal
angle. Each vertical slice of values must start on a new line. Long lines
may be broken between values as needed by following the instructions
given earlier.
Example of Photometric Data File
The following is an example of a photometric data file.
726 | Chapter 13 Render Drawings

Use Distant Lights
Distant lights are useful for lighting objects or as a backdrop.
Distant Lights in Standard Lighting Workflow
A distant light emits uniform parallel light rays in one direction only. You
specify a FROM point and a TO point anywhere in the viewport to define the
direction of the light. Spotlights and point lights are each represented by a
different light glyph. Distant lights are not represented by glyphs in the
drawing because they do not have a discrete position and affect the entire
scene.
The intensity of a distant light does not diminish over distance; it is as bright
at each face it strikes as it is at the source. Distant lights are useful for lighting
objects or for lighting a backdrop uniformly.
NOTE It is recommended that you do not use distant lights in blocks.
Distant Lights in Photometric Workflow
Distant lights are not physically accurate. It is recommended that you do not
use them in a photometric workflow.
Assigning a Shape to a Light
Assigning a shape to a light modifies the illumination of a scene.
Area and Linear Lights
The Area parameter on the light is a property of a light. Just as a light can have
a color, it can also be assigned a shape. For example, you can shape it like a
rectangle so that it acts like panel lighting in a ceiling. Or you can shape it
like a line, so it acts like a narrow fluorescent light tube. The area light is a
way to assign a shape to the light. The shape affects the rendering and shadows
in the same way that a panel light casts different light than a tube light in the
real world.
Add Lighting to Your Model | 727

The Shape Property
The Shape property is available in the Properties Inspector. Under
ShadowDetail, there is a Type property. Whether the Shape property is
displayed depends on the Type property that is selected.
The following types are available: Soft (shadow) map, Sharp (default), Soft
(sampled). By selecting the Soft (sampled) option, the Shape property becomes
available.
The available shapes depend on the type of light. You can select the Type
property for the light distribution under the General panel in the Lighting
category. If Spotlight and Soft (sampled) are selected, then the Shape types
available are Rectangular and Disk. If Point and Soft (sampled) are selected,
then the following shapes are available: Linear, Rectangular, Disk, Cylinder,
and Sphere. If Web and Soft (sampled) are selected, then the following shapes
are available: Linear, Rectangular, Disk, Cylinder, and Sphere. You can use the
samples property on the area light to control the trade-off between rendering
time and shadow accuracy.
The Visible in Render option is also displayed under ShadowDetail and controls
the visibility of the shape when the scene is rendered.
Adjust and Manipulate Lights
You can add point lights, spotlights, and distant lights and set the location
and properties of each.
Control the Display of Lights
The display of lights can be turned on and off in the drawing.
A light glyph is a graphic representation of a light. Point lights and spotlights
can be placed in a drawing with a light glyph. Distant lights, such as sunlight,
are not represented with a light glyph.
The display of lights can be controlled several ways. On the Command Line,
the LIGHTGLYPHDISPLAY system variable controls the display of light glyphs
in the drawing.
Displaying light glyphs in the plotted drawing is optional; light glyph display
is controlled with the plot glyph property setting. With the plot glyph property,
728 | Chapter 13 Render Drawings
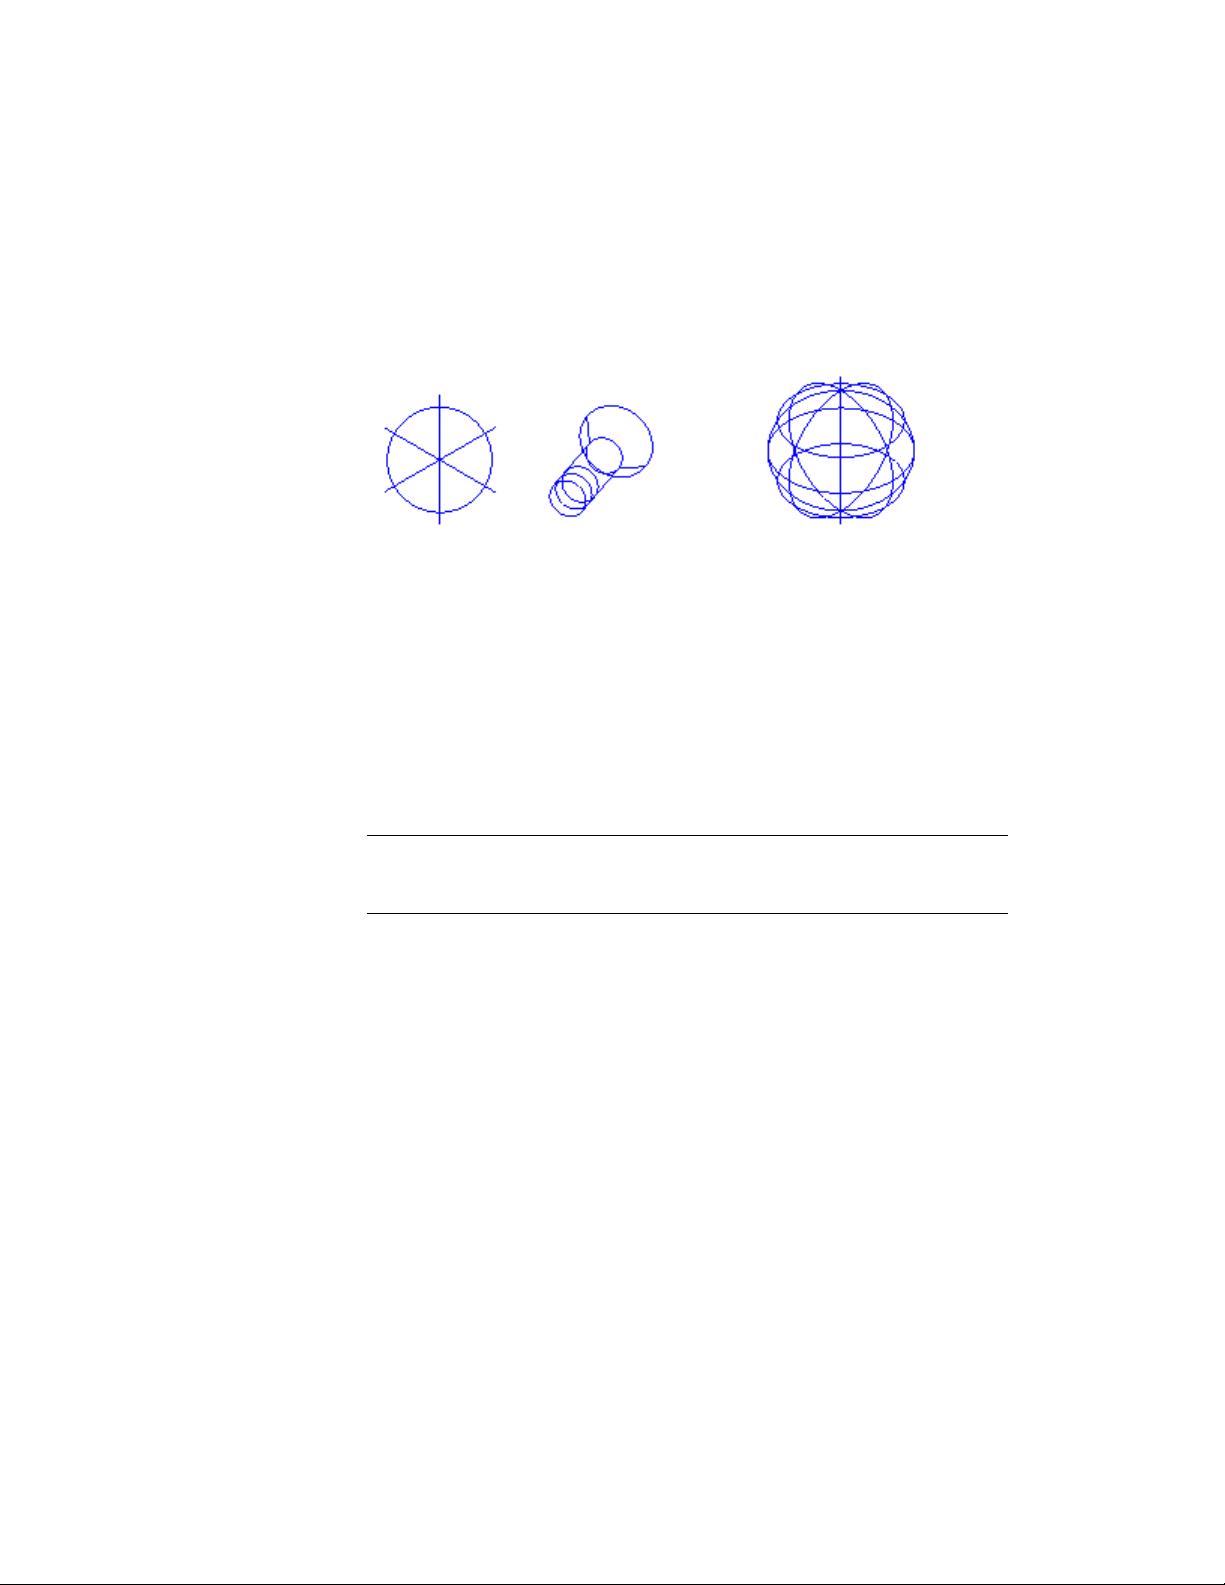
you specify light glyph to display one light at a time. The plot glyph setting
for a viewport affects all the lights globally.
Adjust Light Placement
After a light has been placed in a scene the position and target can be modified.
The light, which is represented by a light glyph, can be repositioned after it
is placed in the drawing. The light can be moved and rotated; the target can
be modified. When the light glyph is selected, several grips are displayed.
NOTE Rotating a targeted light is useful for aligning the area shadow region
appropriately. Also, the orientation of the area shadow light is reset when the
position or the target of the light is changed.
Location (Point Lights and Spotlights)
You can use the grip labeled Position to move a point light or a spotlight, or
you can set the location in the Properties Inspector. The Position grip moves
the light but does not change the target. To move both the light and its target,
drag the light glyph itself.
Add Lighting to Your Model | 729
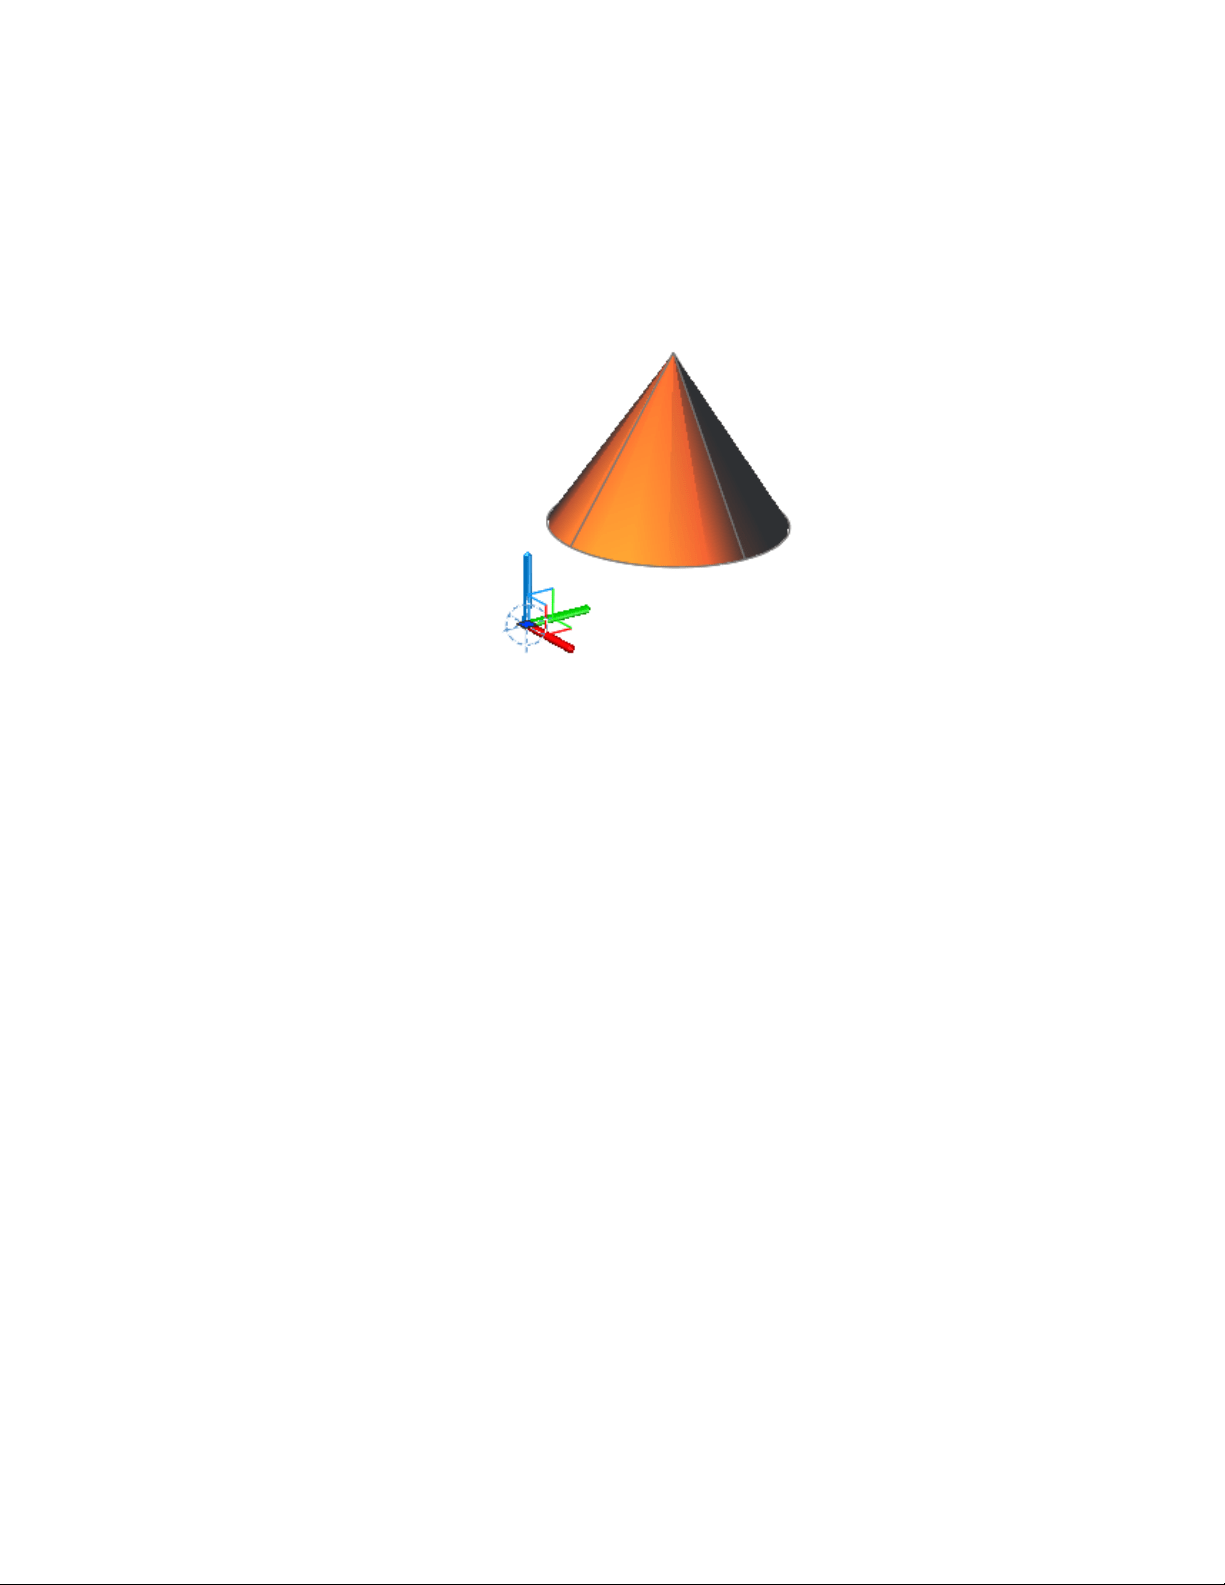
Control Light Properties
Every light in the drawing has general and specific lighting properties that
can be changed after the light is placed.
When a light is selected, its properties can be changed in the Properties
Inspector.
You can use grip tools to move or rotate a selected light and change other
properties such as the hotspot and falloff cone in spotlights. You can see the
effect on the model as you change the properties of a light.
General Properties
The following properties are common to all lights. Full descriptions of the
controls are located under the Properties command in Lighting Properties:
■ Name. Specifies the name assigned to the light.
730 | Chapter 13 Render Drawings

■ Type. Specifies the type of light: point light, spotlight, distant light, or
web.
■ On/Off Status. Controls whether the light is turned on or off.
■ Shadows. Controls whether the light casts shadows. To be displayed,
shadows must be turned on in the visual style applied to the current
viewport. Turn shadows off to increase performance.
■ Intensity factor. Sets a multiplier that controls brightness. Intensity is
not related to attenuation.
■ Filter color. Sets the color of the light emitted.
■ Plot glyph. Allows the ability to plot the drawing with the light glyphs
on.
Spotlight Hotspot and Falloff Under General Properties
When light from a spotlight falls on a surface, the area of maximum
illumination is surrounded by an area of lesser intensity.
Add Lighting to Your Model | 731
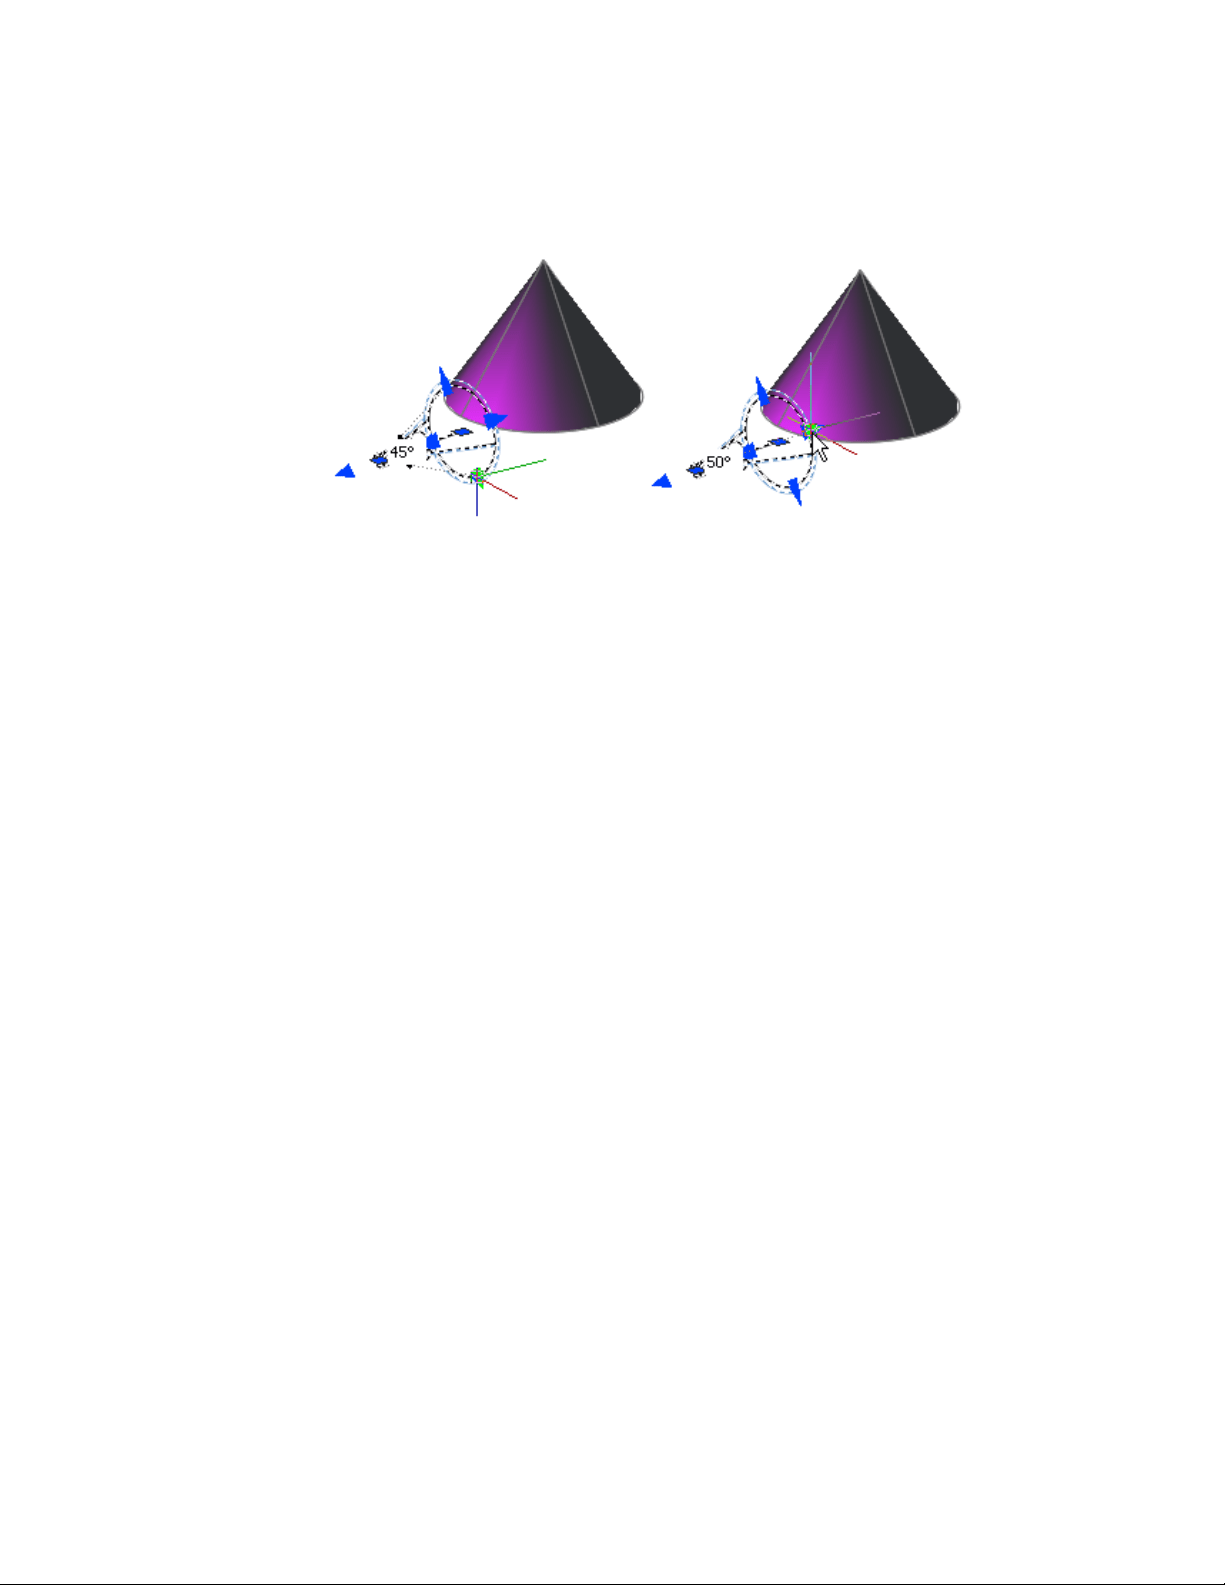
■ Hotspot cone angle. Defines the brightest part of a light beam. Also
known as the beam angle.
■ Falloff cone angle. Defines the full cone of light. Also known as the
field angle.
■ Rapid decay area. Consists of the region between the hotspot and falloff
angles.
The greater the difference between the hotspot and falloff angles, the softer
the edge of the light beam. If the hotspot and falloff angles are near equal,
the edge of the light beam is sharp. Both values can range from 0 to 160
degrees. You can adjust these values directly with the Hotspot and Falloff
grips.
732 | Chapter 13 Render Drawings

Photometric Properties
Photometric lighting offers additional properties that make the lighting
different than standard lighting. The following properties are under the
Photometric properties panel:
■ Lamp intensity. Specifies the inherent brightness of the light. Specifies
the intensity, flux, or illuminance of the lamp.
■ Resulting intensity. Gives the final brightness of the light. (Product of
lamp intensity and intensity factor. Read-only.)
■ Lamp color. Specifies the inherent color of the light in Kelvin temperature
or standard.
■ Resulting color. Gives the final color of the light. This is determined by
a combination of the lamp color and the filter color. (Product of lamp
color and filter color. Read-only.)
If you select Web in the Type property for a photometric light, additional
properties are offered in the Photometric Web and Web offsets panel in the
Lighting category.
■ Web file. Specifies the data file describing the intensity distribution of
the light.
■ Web preview. Displays a 2D slice through goniometric data.
■ Rotation of X. Specifies a rotational offset of the web about the optical
X axis.
■ Rotation of Y. Specifies a rotational offset of the web about the optical
Y axis.
■ Rotation of Z. Specifies a rotational offset of the web about the optical
Z axis.
Geometry Properties
The Geometry properties control for the location and target point of the light.
If the light is a target point light, spotlight, or weblight, additional target point
properties are available. The Target property of a light can also be turned on
an off.
Attenuation Properties (Point Lights and Spotlights)
Attenuation controls how light diminishes over distance. The farther away
an object is from a light, the darker the object appears. You can specify no
Add Lighting to Your Model | 733
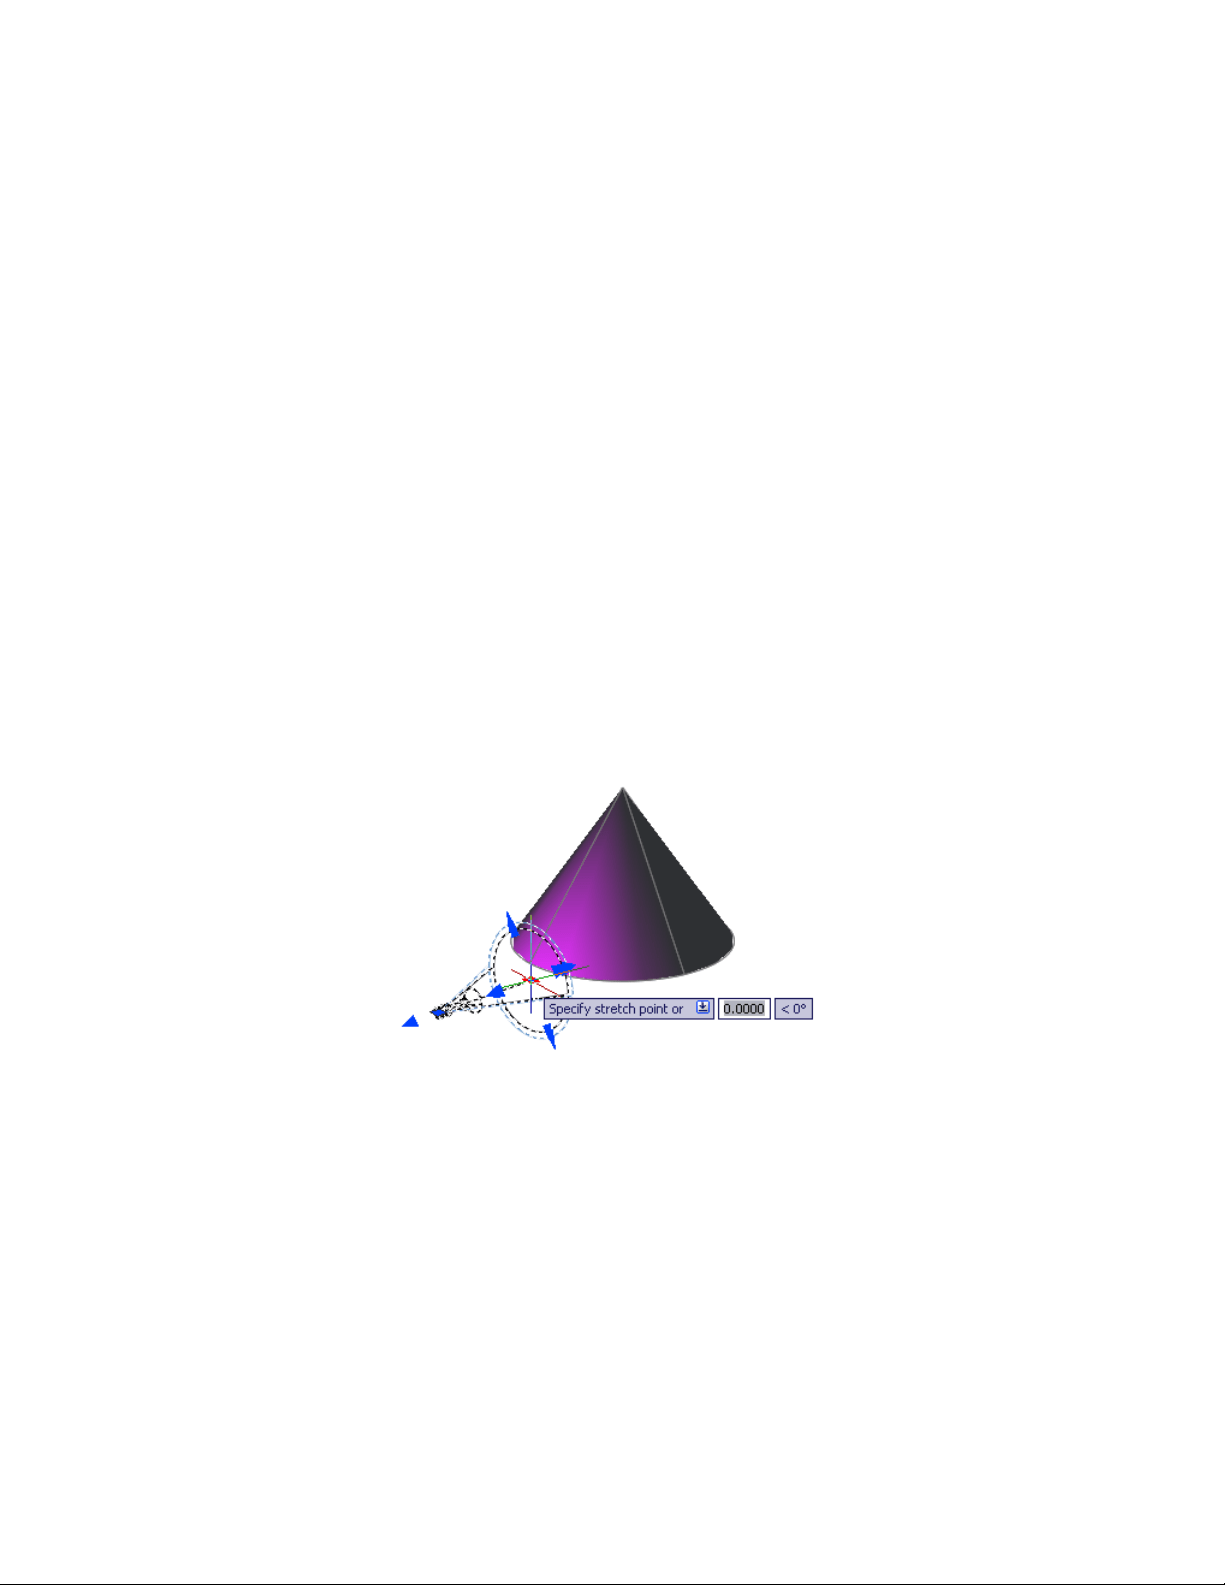
attenuation, inverse linear, or inverse squared (POINTLIGHT, SPOTLIGHT).
Attenuation is not active for photometric lights.
■ None. Sets no attenuation. Objects far from the point light are as bright
as objects close to the light.
■ Inverse Linear. Sets attenuation to be the inverse of the linear distance
from the light. For example, at a distance of 2 units, light is half as strong
as at the point light; at a distance of 4 units, light is one quarter as strong.
The default value for inverse linear is half the maximum intensity.
■ Inverse Square. Sets attenuation to be the inverse of the square of the
distance from the light. For example, at a distance of 2 units, light is one
quarter as strong as at the point light; at a distance of 4 units, light is one
sixteenth as strong.
Another way to control the start point and end point of light is to use limits.
Limits work like clipping planes to control where light is first emitted and
where it stops. Using limits can increase performance by removing the need
for the program to calculate light levels where the light is already practically
invisible.
734 | Chapter 13 Render Drawings

Sun and Sky Simulation
The sun is a light that simulates the effect of sunlight and can be used to show
how the shadows cast by a structure affect the surrounding area.
Sun and sky are the primary sources of natural illumination in AutoCAD.
Whereas the rays of the sun are parallel and of a yellowish hue, the light cast
from the atmosphere comes from all directions and is distinctly bluish in
color. When the LIGHTINGUNITS system variable is set to photometric, more
sun properties are available.
When the workflow is photometric (the LIGHTINGUNITS system variable is
set to 1 or 2) the sun properties have more properties available and are rendered
using a more physically accurate sunlight model. The sun color is disabled for
the photometric sun; the color is computed automatically based on the time,
date, and location specified in the drawing. The color is determined based on
the position in the sky. When the workflow is generic or standard lighting
(the LIGHTINGUNITS system variable is set to 0), the additional sun and sky
properties are unavailable.
The properties of the sun can be modified by using the Properties Inspector
(PROPERTIES command).
The rays of the sun are parallel and have the same intensity at any distance.
Shadows can be on or off. To improve performance, turn off shadows when
you don’t need them. All settings for the sun except geographic location are
saved per viewport, not per drawing. Geographic location is saved per drawing.
The angle of the light from the sun is controlled by the geographic location
you specify for your model and by the date and time of day. These are
properties of the sun and can be changed in the Properties Inspector. The time
zone used is based on the location, but you can adjust it independently
(TIMEZONE system variable).
Incorporate Luminaire Objects
A luminaire object is a helper object that assembles a set of objects into a light
fixture.
A luminaire object groups and manages the components of a light as a whole.
Light fixtures can be represented by embedding photometric lights in blocks
that also contain geometry. A luminaire object assembles a set of light objects
into a light fixture.
Add Lighting to Your Model | 735
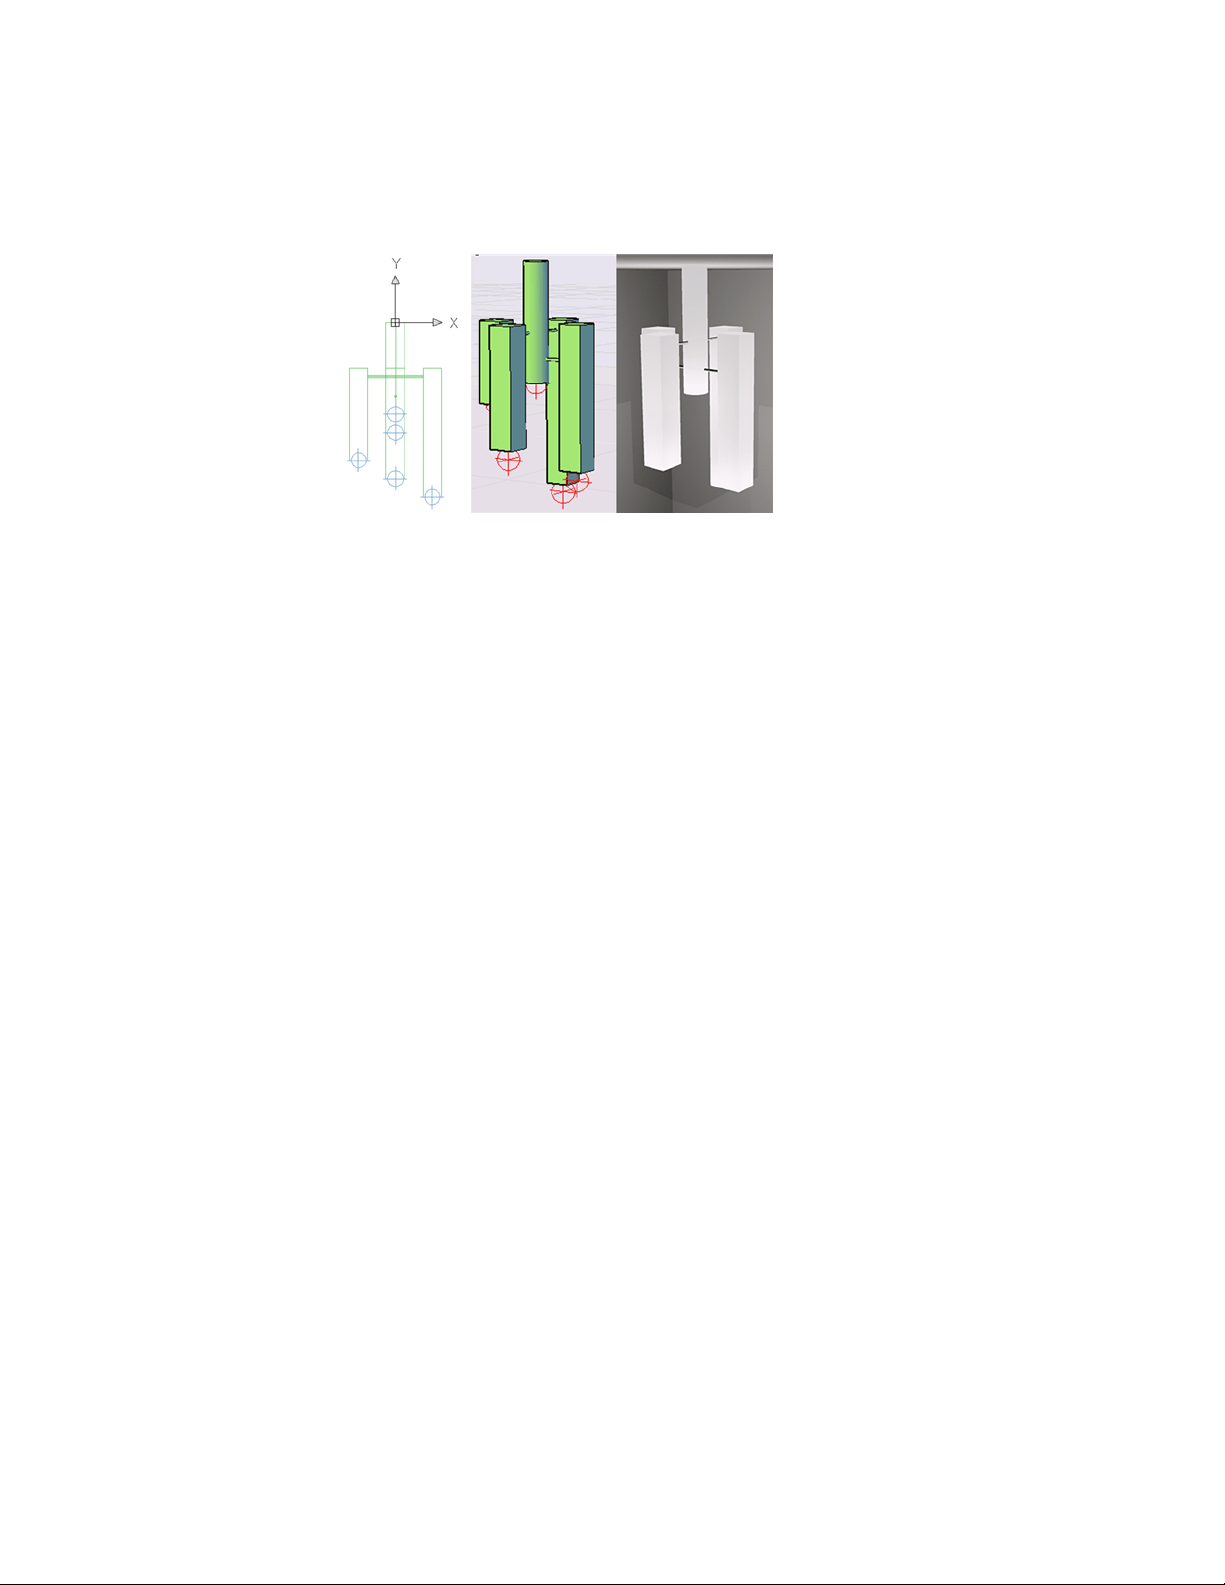
An example of a luminaire object.
Materials and Textures
Materials define the shininess, bumpiness, and transparency of object’ s surfaces
to give them a realistic appearance.
Overview of Materials
Add materials to objects in your drawings to provide a realistic effect in any
rendered view.
Autodesk provides a large library of predefined materials for you to use. Use
the Materials Browser to browse materials and apply them to objects in your
drawing.
Textures add complexity and realism to a material. For example, to replicate
the bumps in a paved road, you could apply a Noise texture to an object
representing a road in a drawing. To replicate a brick and mortar pattern, you
could use a Tile texture.
Browse Material Library
You can browse and attach materials from the Materials Browser.
736 | Chapter 13 Render Drawings
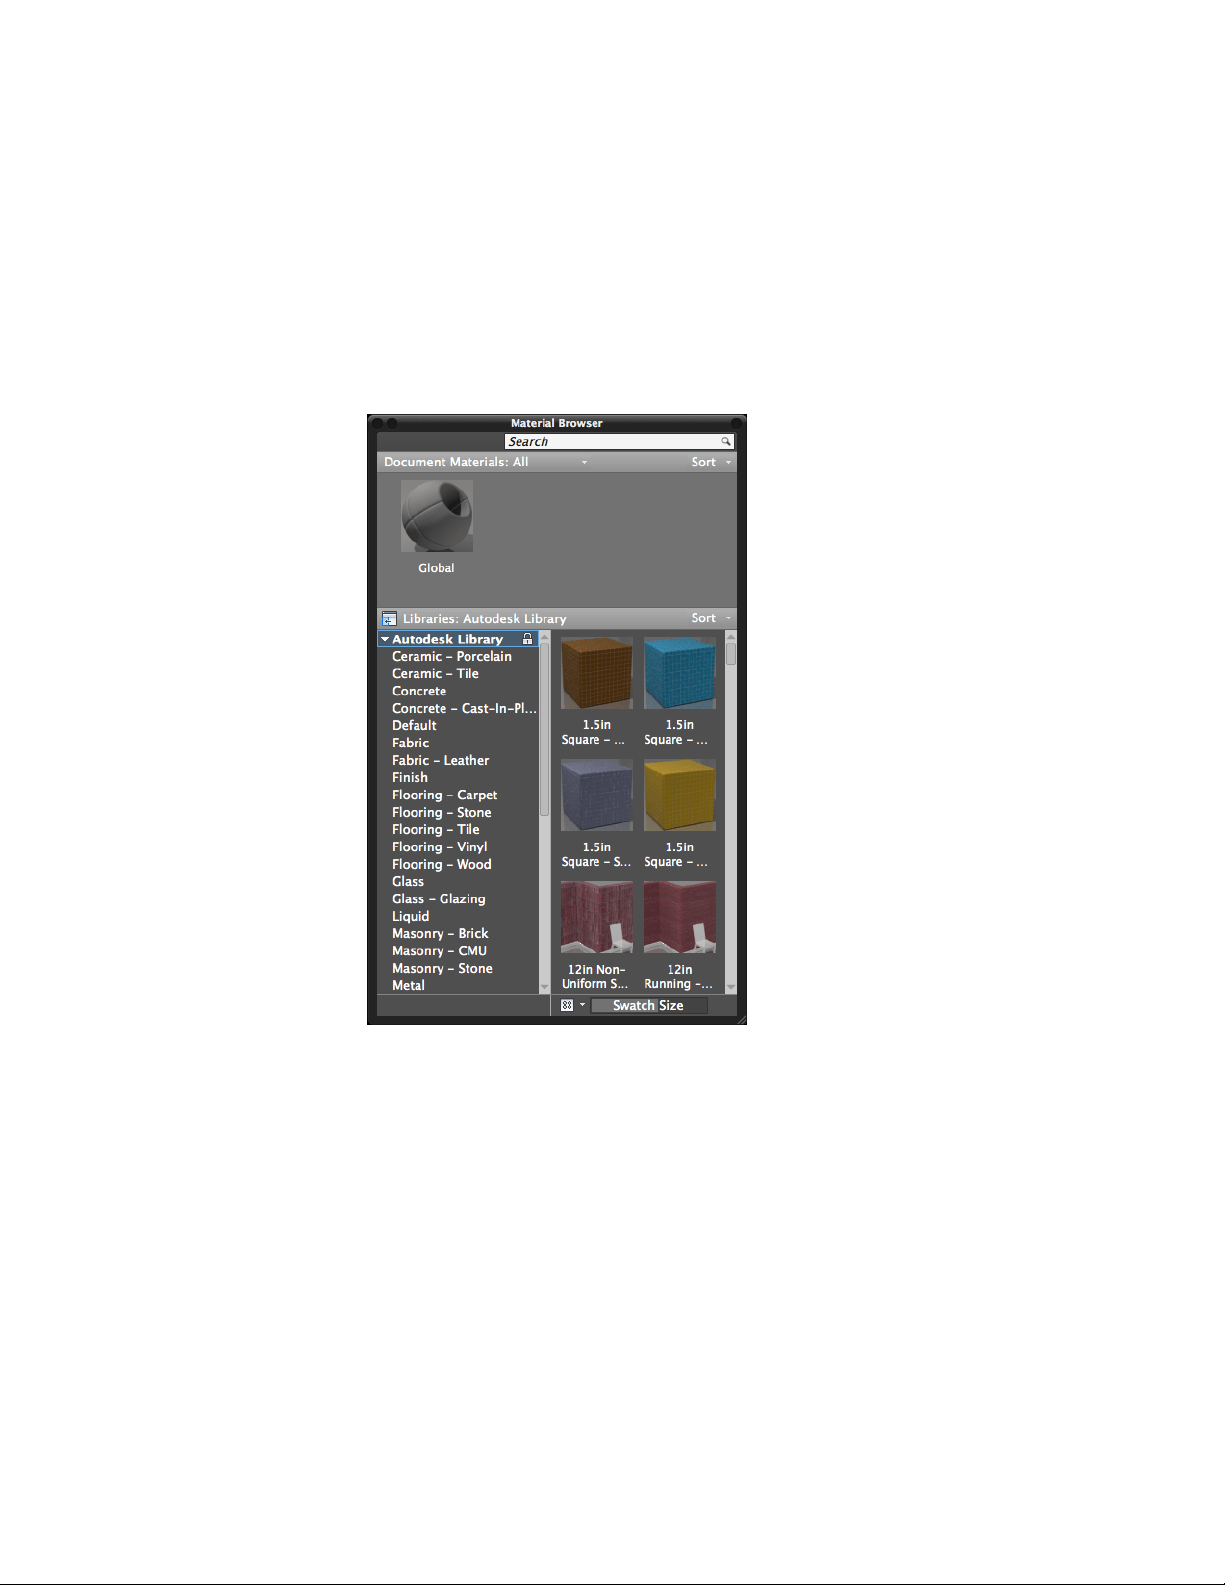
Materials Browser
Use the Materials Browser to navigate, sort, search, select materials for use in
your drawing, and attach a material to an object.
The standard Autodesk materials library is are accessible from the Materials
Browser.
The Materials Browser contains the following main components:
■ Search. Allows you to locate a material in the library without navigating
through the library's organized structure.
■ Document materials.Displays a set of display options for the materials
saved in the current drawing. You can sort the document materials by
name, type, and color.
■ Autodesk library. Displays the Autodesk library, which contains the
predefined materials that come with the product. It also contains a button
Materials and Textures | 737

for controlling the display of libraries and library categories. You can sort
the materials in the library by name, category, type, and color.
■ Library details. Displays previews of the materials in the selected
categories.
■ View options. Contains controls that allow you to control the display
style and size of the material previews.
Autodesk Library
The Autodesk library, with over 700 materials and over 1000 textures, is
included with the product. The library is read-only and cannot be modified.
Render 3D Objects for Realism
A realistic rendering of a model can often give a product team or prospective
client a clearer vision of a conceptual design than a plotted drawing.
Overview of Rendering
Rendering creates a 2D image based on your 3D scene. It shades the scene's
geometry using the lighting you've set up, the materials you've applied, and
environmental settings such as background and fog.
738 | Chapter 13 Render Drawings
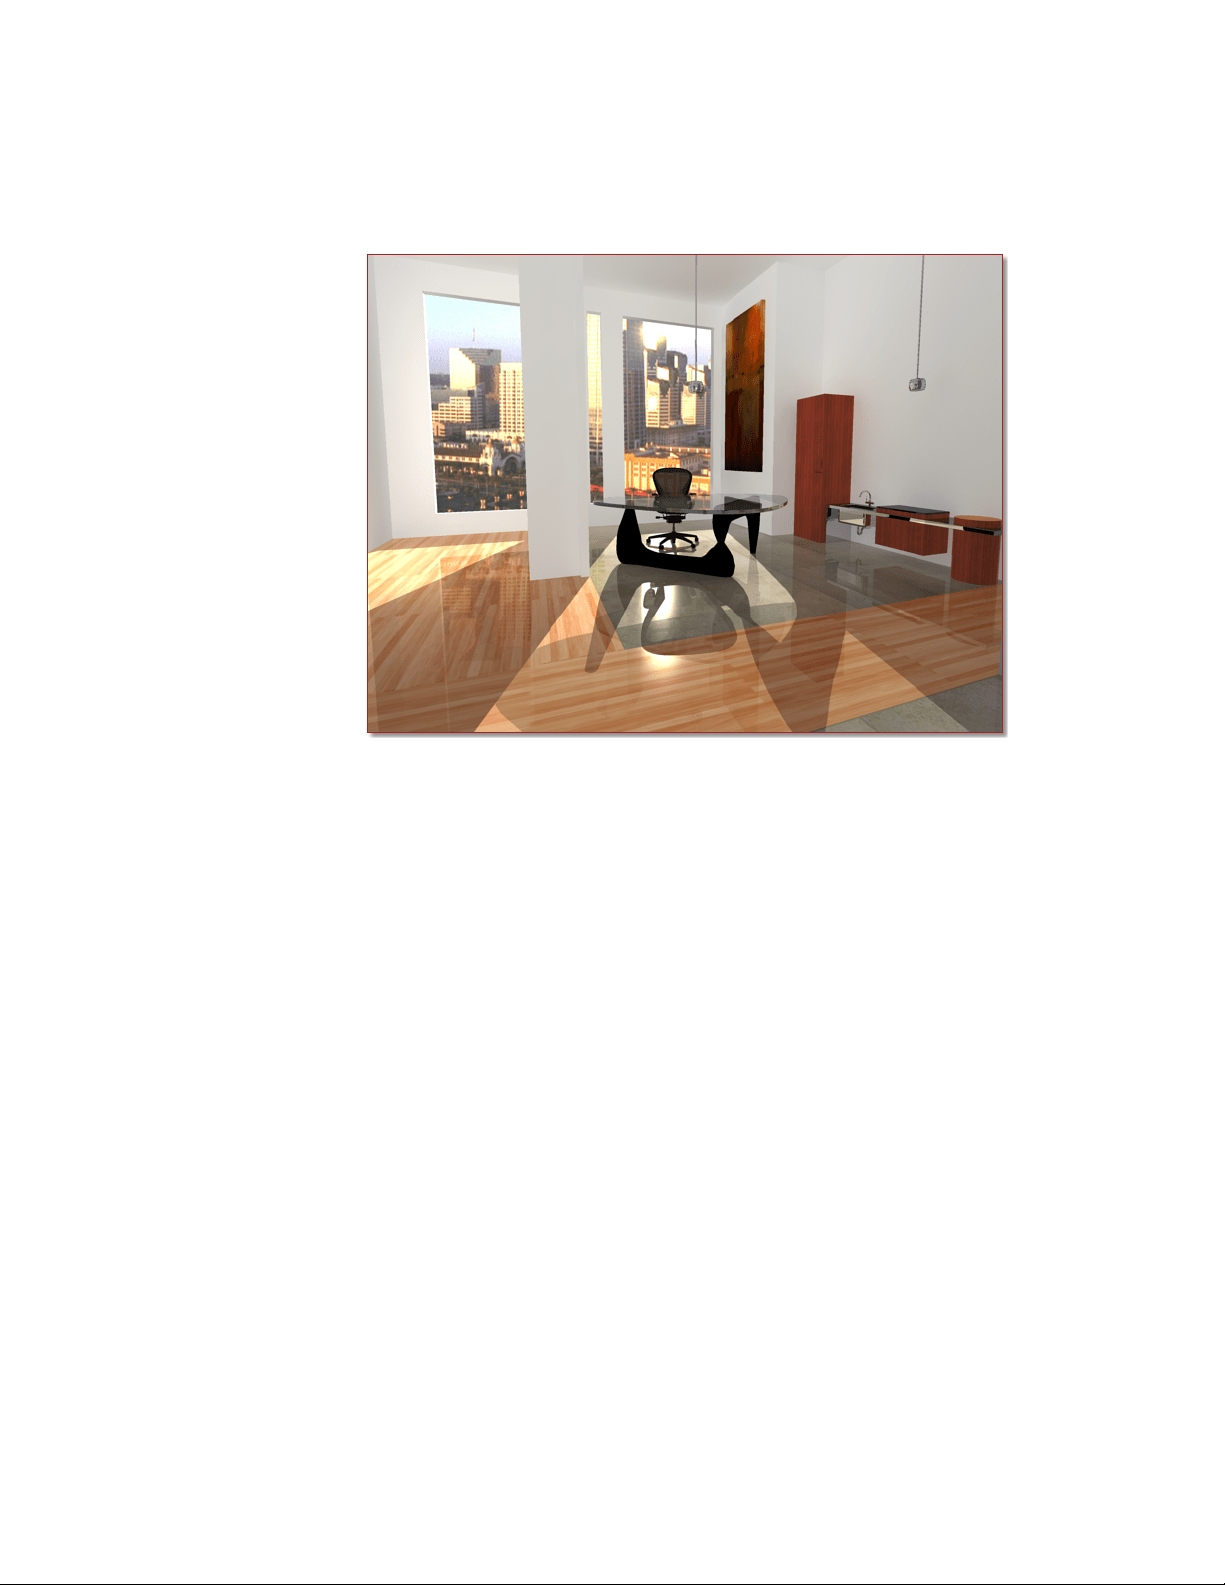
The renderer is a general-purpose renderer that generates physically correct
simulations of lighting effects, including ray-traced reflections and refractions,
and global illumination.
A range of standard rendering presets, reusable rendering parameters, are
available. Some of the presets are tailored for relatively quick preview
renderings while others are for higher quality renderings.
Prepare a Model for Rendering
The way a model is built plays an important role in optimizing rendering
performance and image quality.
Understand Face Normals and Hidden Surfaces
There are several steps commonly taken to speed up the rendering process.
In order to minimize the time it takes to render a model, it is common practice
to remove hidden surfaces or hide objects that are positioned off-camera.
Render 3D Objects for Realism | 739
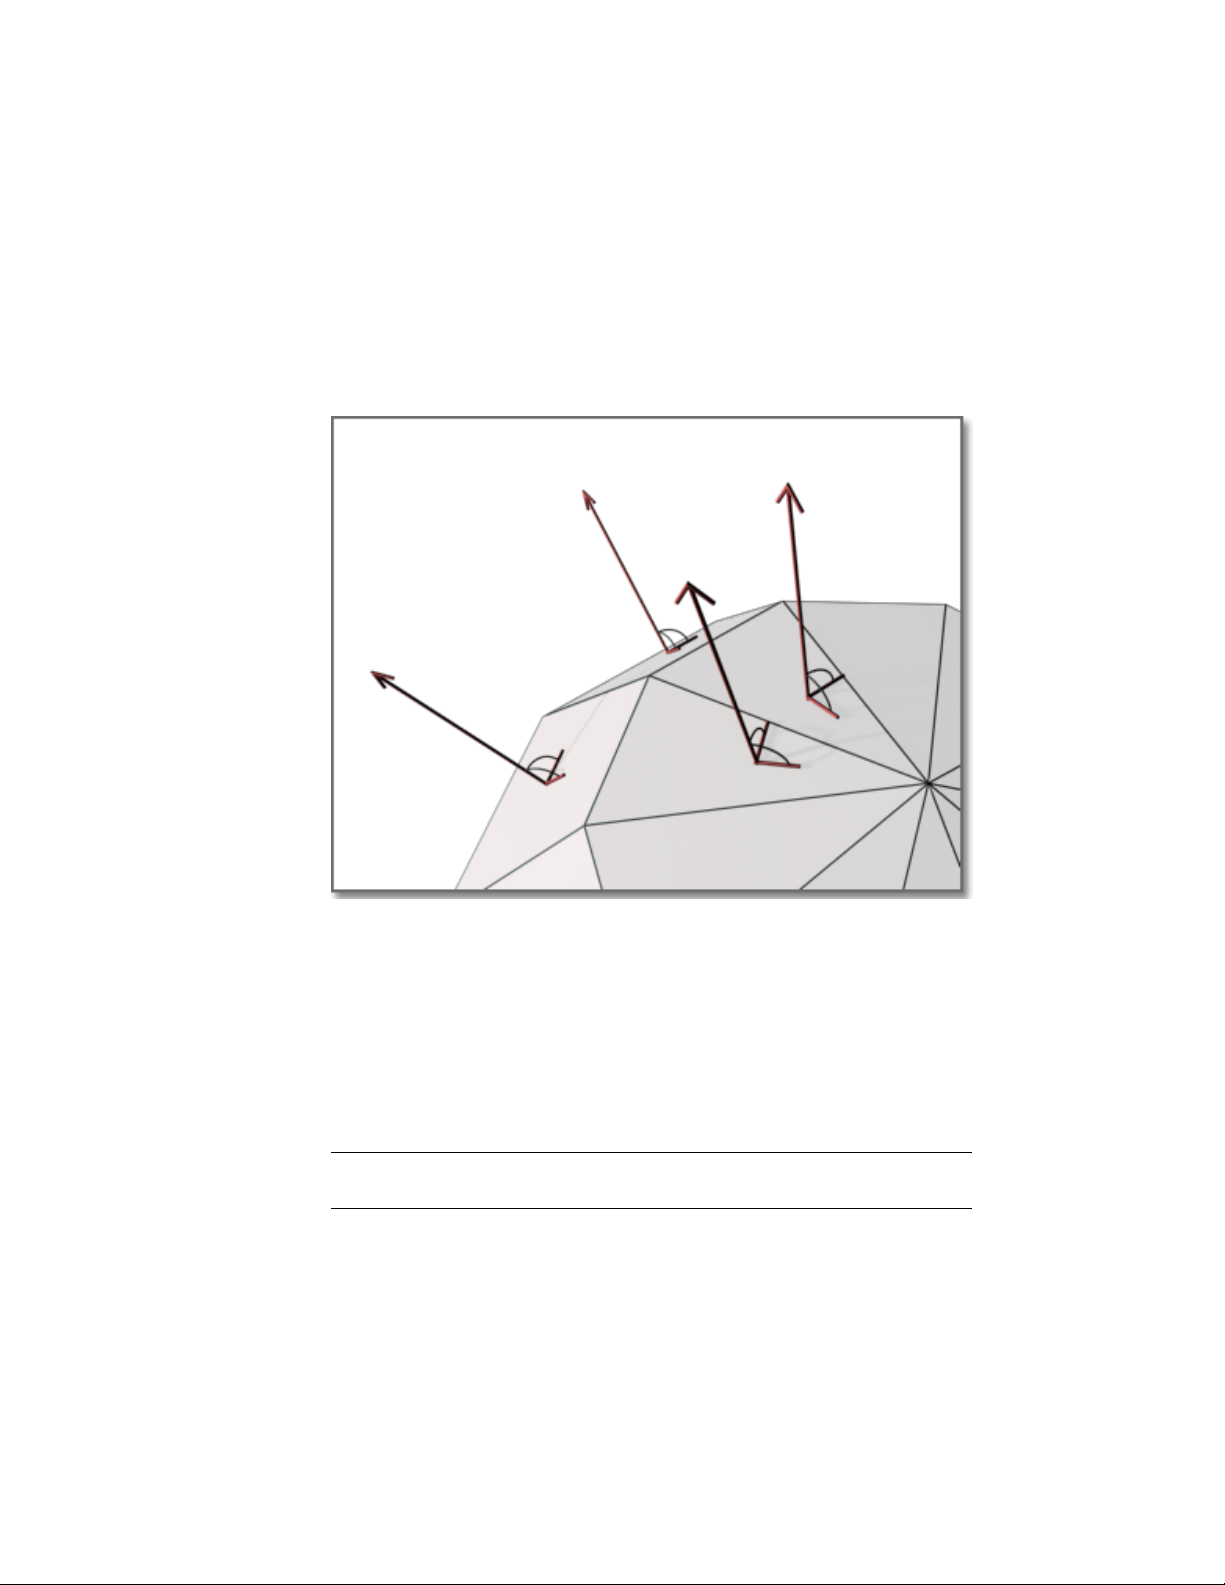
Furthermore, ensuring that all face normals orient in the same direction can
also speed up the rendering process.
Every surface that you model is made up of faces. Faces are either triangular
or quadrilateral and each face has an inward and outward oriented side. The
direction in which a face is pointing is defined by a vector called a normal.
The direction of the normal indicates the front, or outer surface of the face.
When normals are unified and point in the same outward direction, the
renderer processes each face and renders the model. If any normals are flipped,
facing inward, the renderer skips them and leaves triangular or quadrilateral
“holes” in the rendered image.
If a face is missing, you’ll need to manually reconstruct it. The direction of
normals is determined by the way a face is drawn in a right-handed coordinate
system: if you draw the face counter-clockwise, the normals point outward;
if you draw the face clockwise, the normals point inward. You should draw
faces consistently.
NOTE Solid objects have meshes and normals correctly oriented, which can be
an aid to creating models for rendering.
740 | Chapter 13 Render Drawings
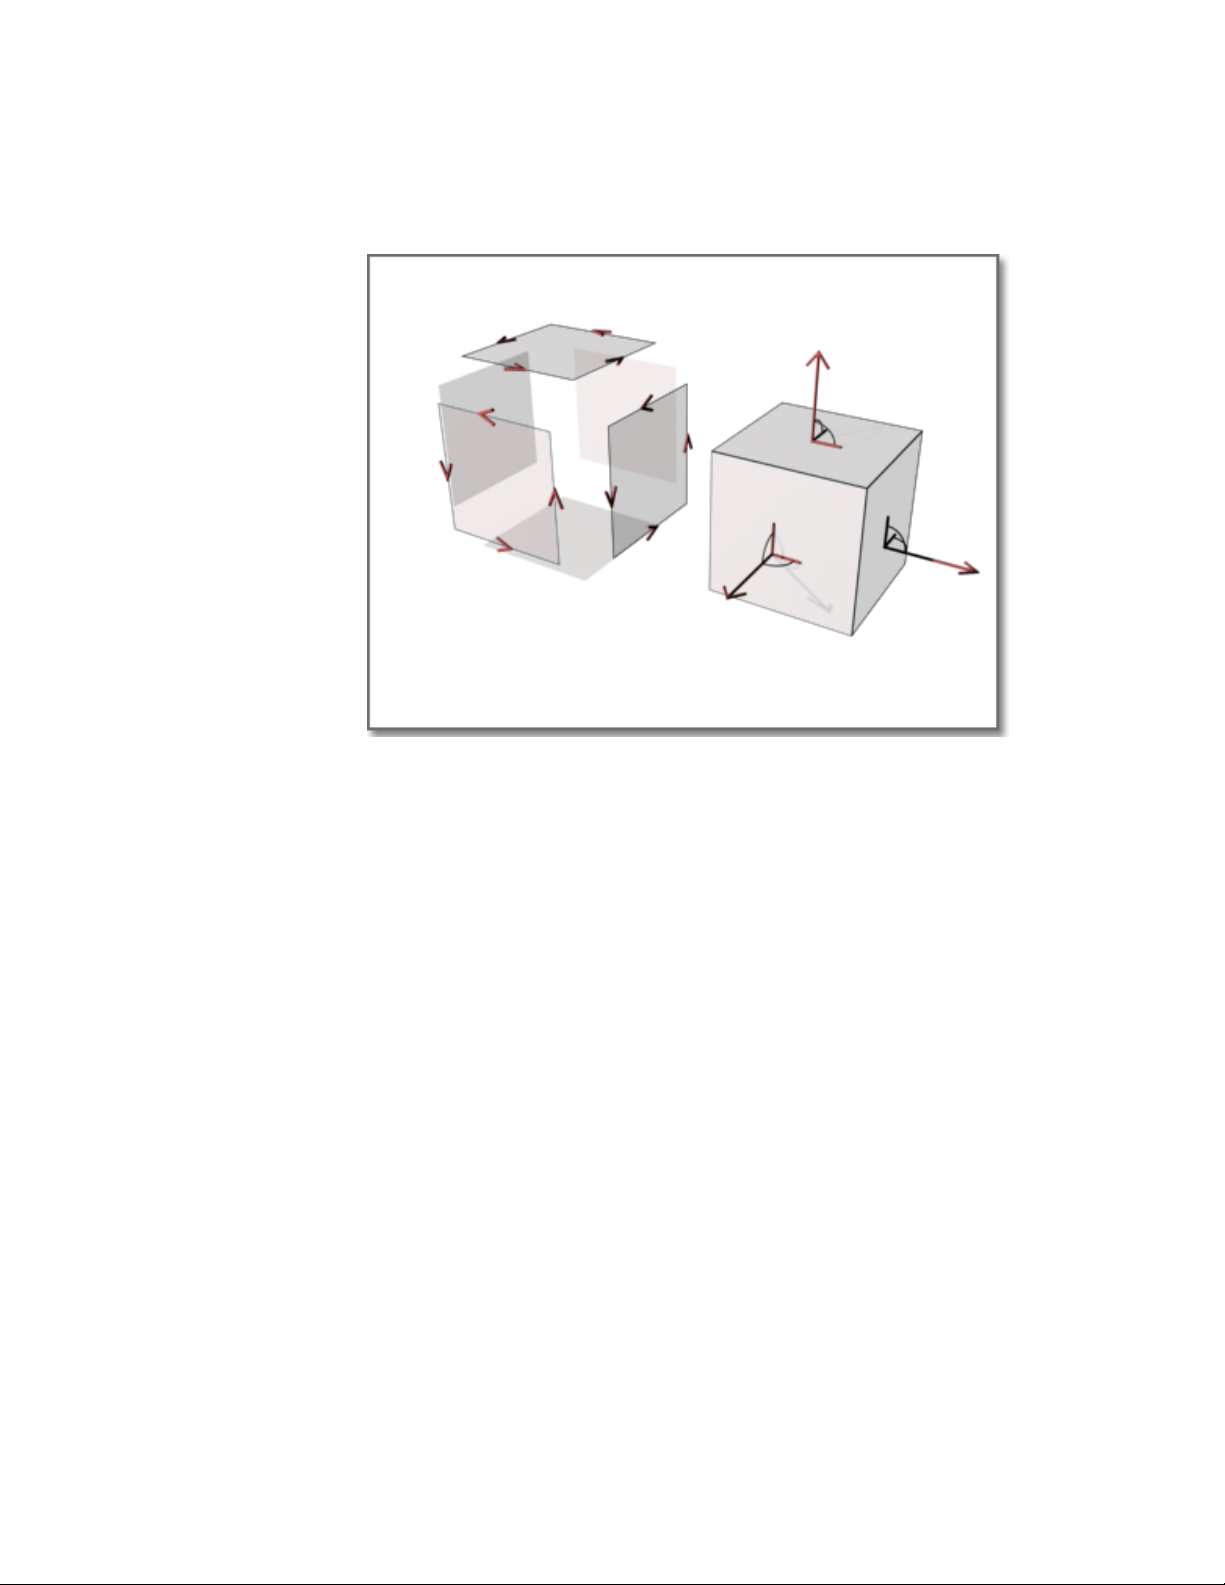
After the back faces have been removed, the renderer uses a Z buffer to compare
relative distances along the Z axis. If the Z buffer indicates that one face
overlaps another, the renderer removes the face that would be hidden.
The time saved is in proportion to the number of faces discarded out of the
total number of faces.
Every object in a scene is processed by the renderer, even objects that are off
camera and are not going to be present in the rendered view. A model that is
built with the intent of rendering will benefit from good layer management.
By turning off layers containing objects that are not in the view, you can
increase rendering speed substantially.
See also:
Use Models with Other Applications (page 750)
Use a Visual Style to Display Your Model (page 63)
Minimize Intersecting and Coplanar Faces
Certain kinds of geometry create special rendering problems.
Render 3D Objects for Realism | 741
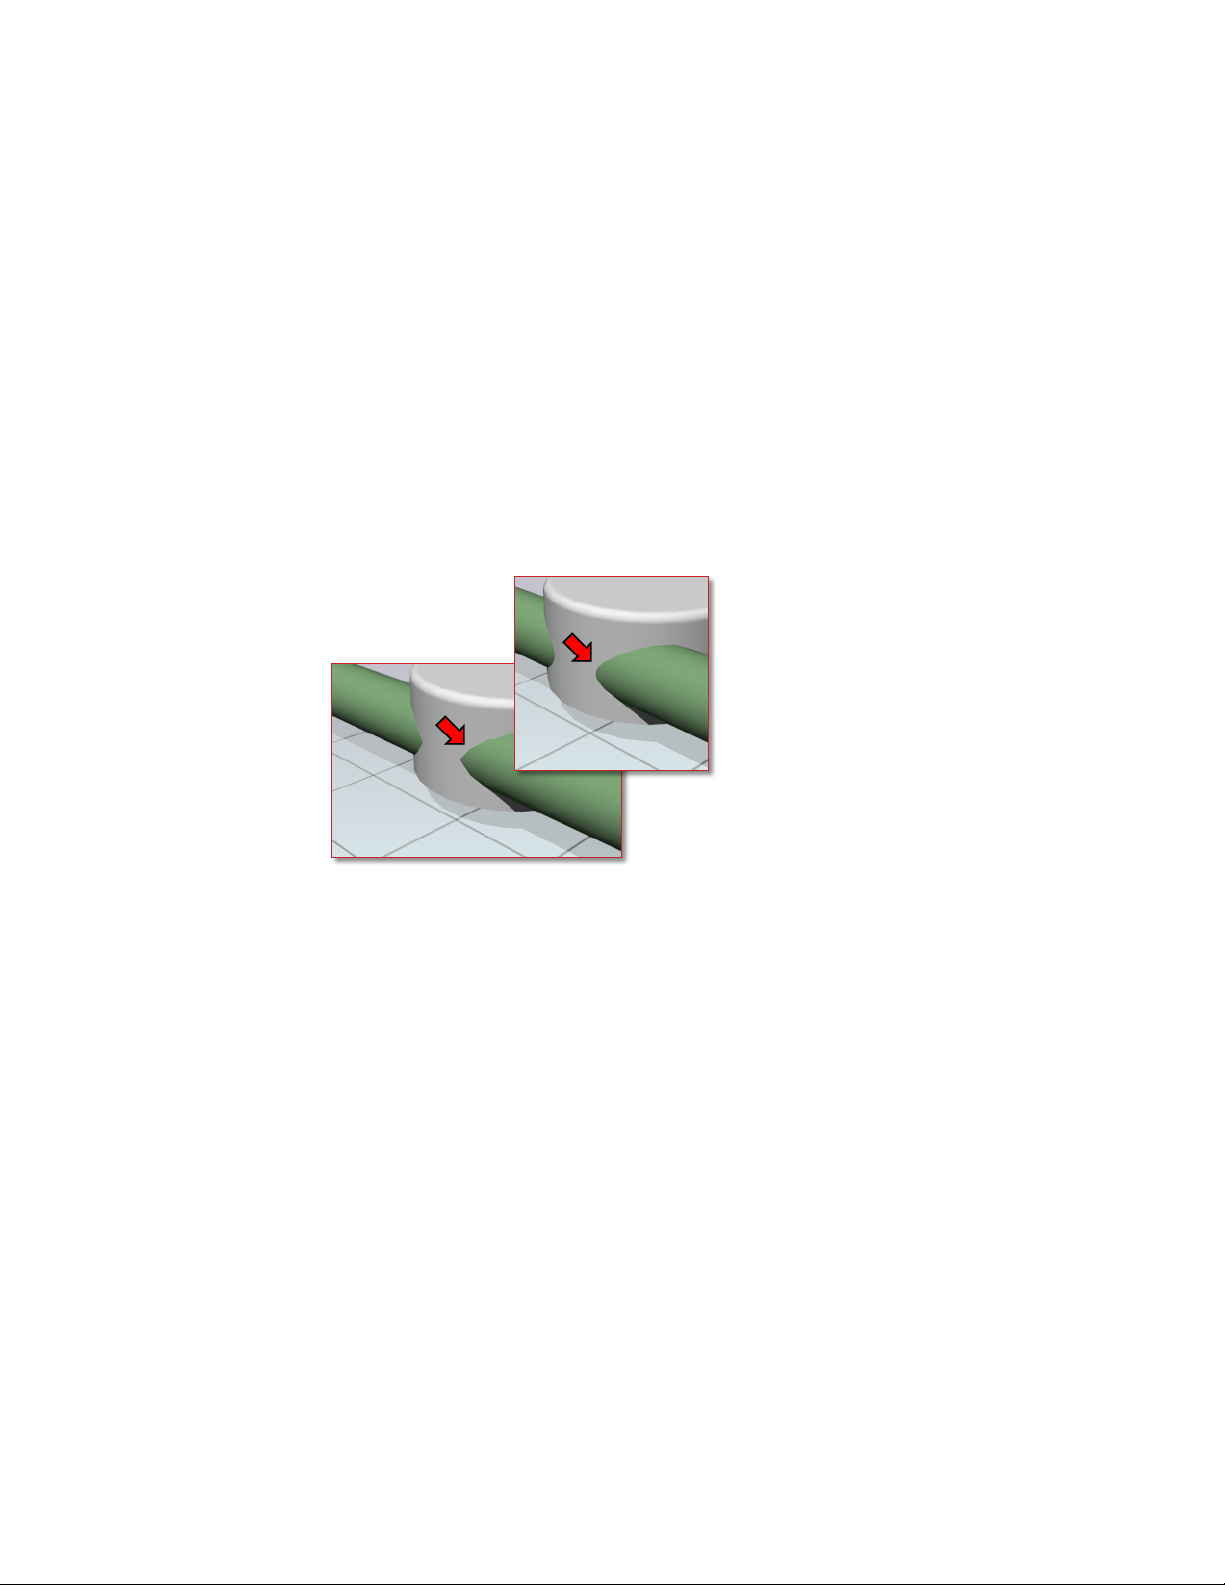
The complexity of an object relates to the number of its vertices and faces.
The more faces a model has, the longer it takes to render. Keep the geometry
of your drawing simple to keep rendering time to a minimum. Use the fewest
faces possible to describe a surface.
Intersecting Faces
Intersecting faces in a model occur when two objects pass through one other.
For conceptual design situations, simply placing one object through another
is a fast way to visualize how something will look. However, the edge created
where the two objects intersect can exhibit a rippled appearance.
In the following example, the edge appears rippled in the left image and much
cleaner after a Boolean union.
When edges do not appear to be as precise as you want, use Boolean operations
like union, intersect, and subtract. A much cleaner and precise edge is created
to better reflect the object’s appearance.
Coplanar Faces
Faces that overlap and lie in the same plane, coplanar faces, can produce
ambiguous results, especially if the materials applied to the two faces differ.
In the following example, artifacts appear when faces occupy the same location.
742 | Chapter 13 Render Drawings
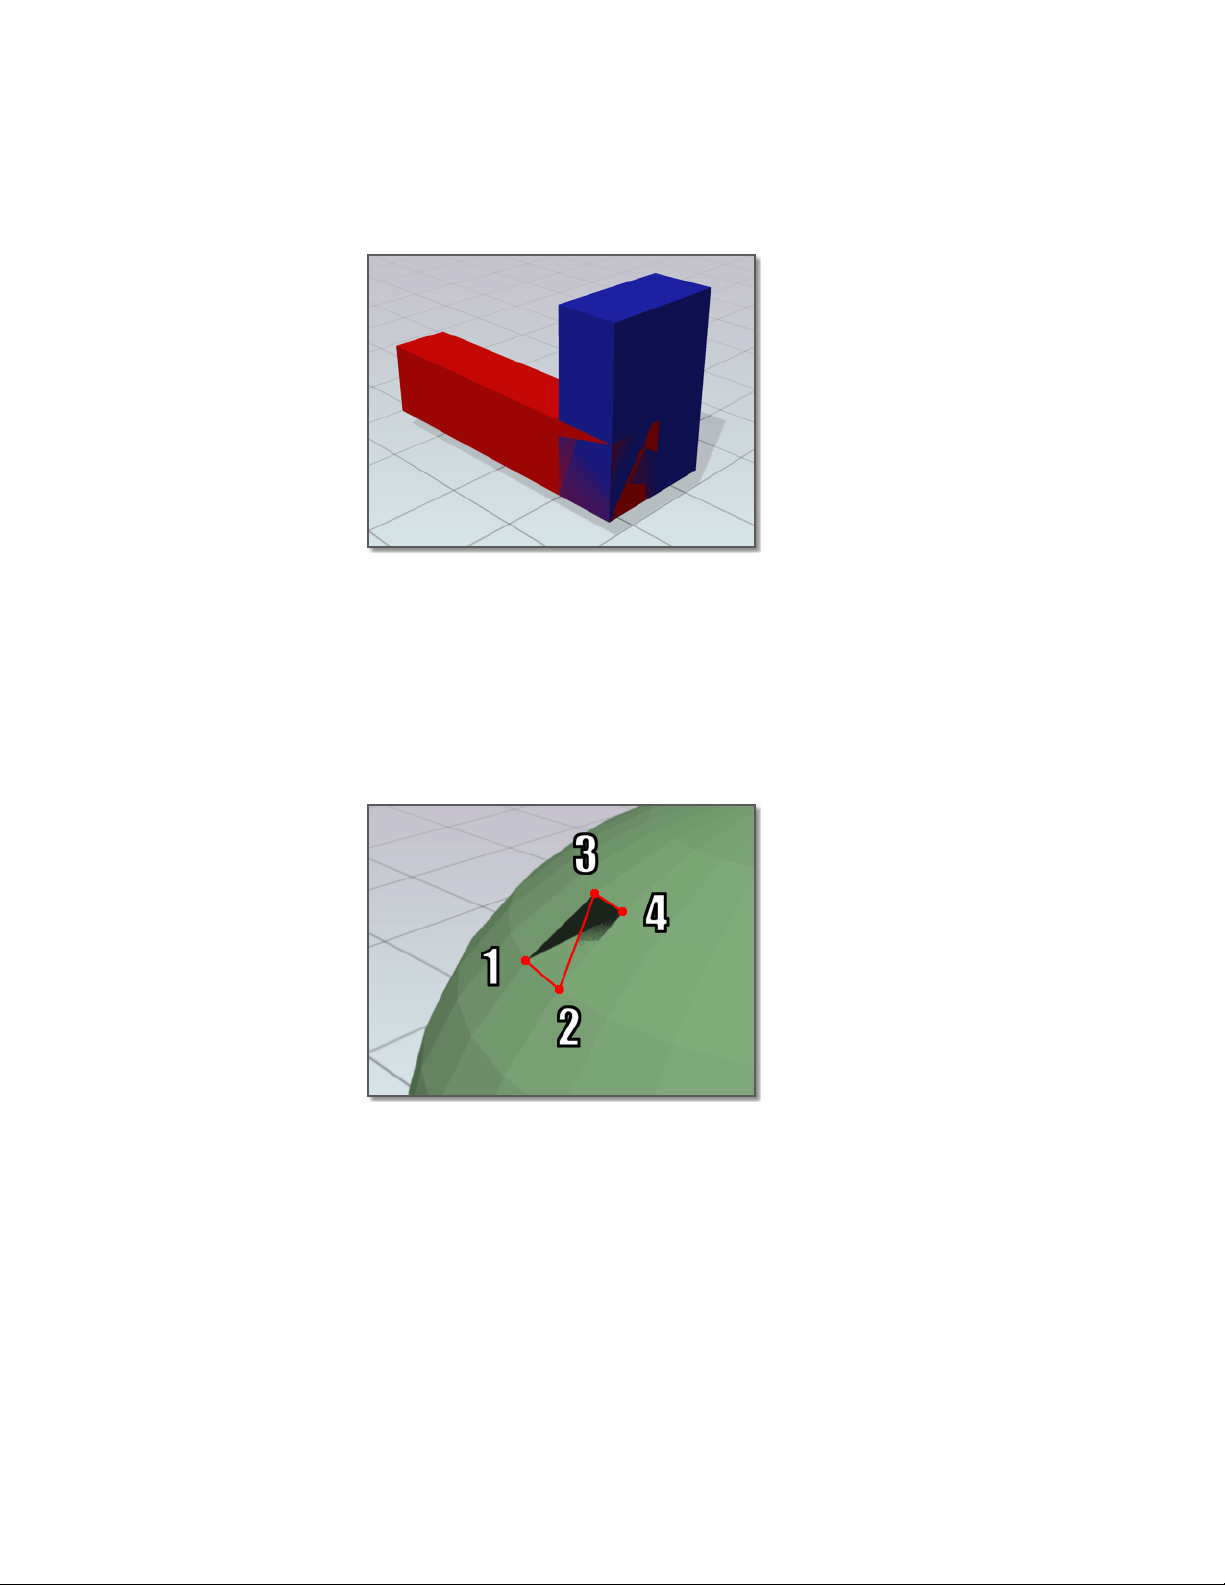
Moving an object so its faces no longer occupy the same plane as another
object will fix this situation.
Twisted Faces
Faces that self-overlap due to a 180-degree twist can also produce ambiguous
results, because the normal for the face is not well defined.
In the following example, artifacts appear where the face is twisted due to
crossing the second and third corner points.
This situation is often encountered when trying to fix a model that has a hole
in its surface. For example, when corner points are selected for the new face,
the points are crossed instead of being placed around the hole in a
counter-clockwise direction. Avoid this problem by choosing corner points
in the proper order.
Render 3D Objects for Realism | 743

Balance Mesh Density for Smooth Geometry
When you render a model, the density of the mesh affects the smoothness of
surfaces.
Mesh components are comprised of vertices, faces, polygons, and edges.
■ A vertex is a point that forms the corner of a face or polygon.
■ A face is a triangular portion of a surface object.
■ A polygon is a quadrilateral portion of a surface object.
■ An edge is the boundary of a face or polygon.
In a drawing, all faces have three vertices, except faces in polyface meshes,
which are treated as adjoining triangles. For rendering purposes, each
quadrilateral face is a pair of triangular faces that share one edge.
Smoothing of an object is handled automatically by the renderer. Two types
of smoothing occur during the rendering process. One smoothing operation
interpolates the face normals across a surface. The other operation takes into
account the number of faces, the face count, that make up the geometry; greater
face counts result in smoother surfaces but longer processing times.
While you cannot control the interpolation of face normals, you can control
the display accuracy of curved objects by using the VIEWRES command and
the FACETRES system variable.
Control Display of Circles and Arcs
The VIEWRES command controls the display accuracy of curved 2D linework
like circles and arcs in the current viewport.
In the following example, line segments are more apparent as VIEWRES
decreases - Upper left = 1000, Middle = 100, Lower right = 10.
744 | Chapter 13 Render Drawings
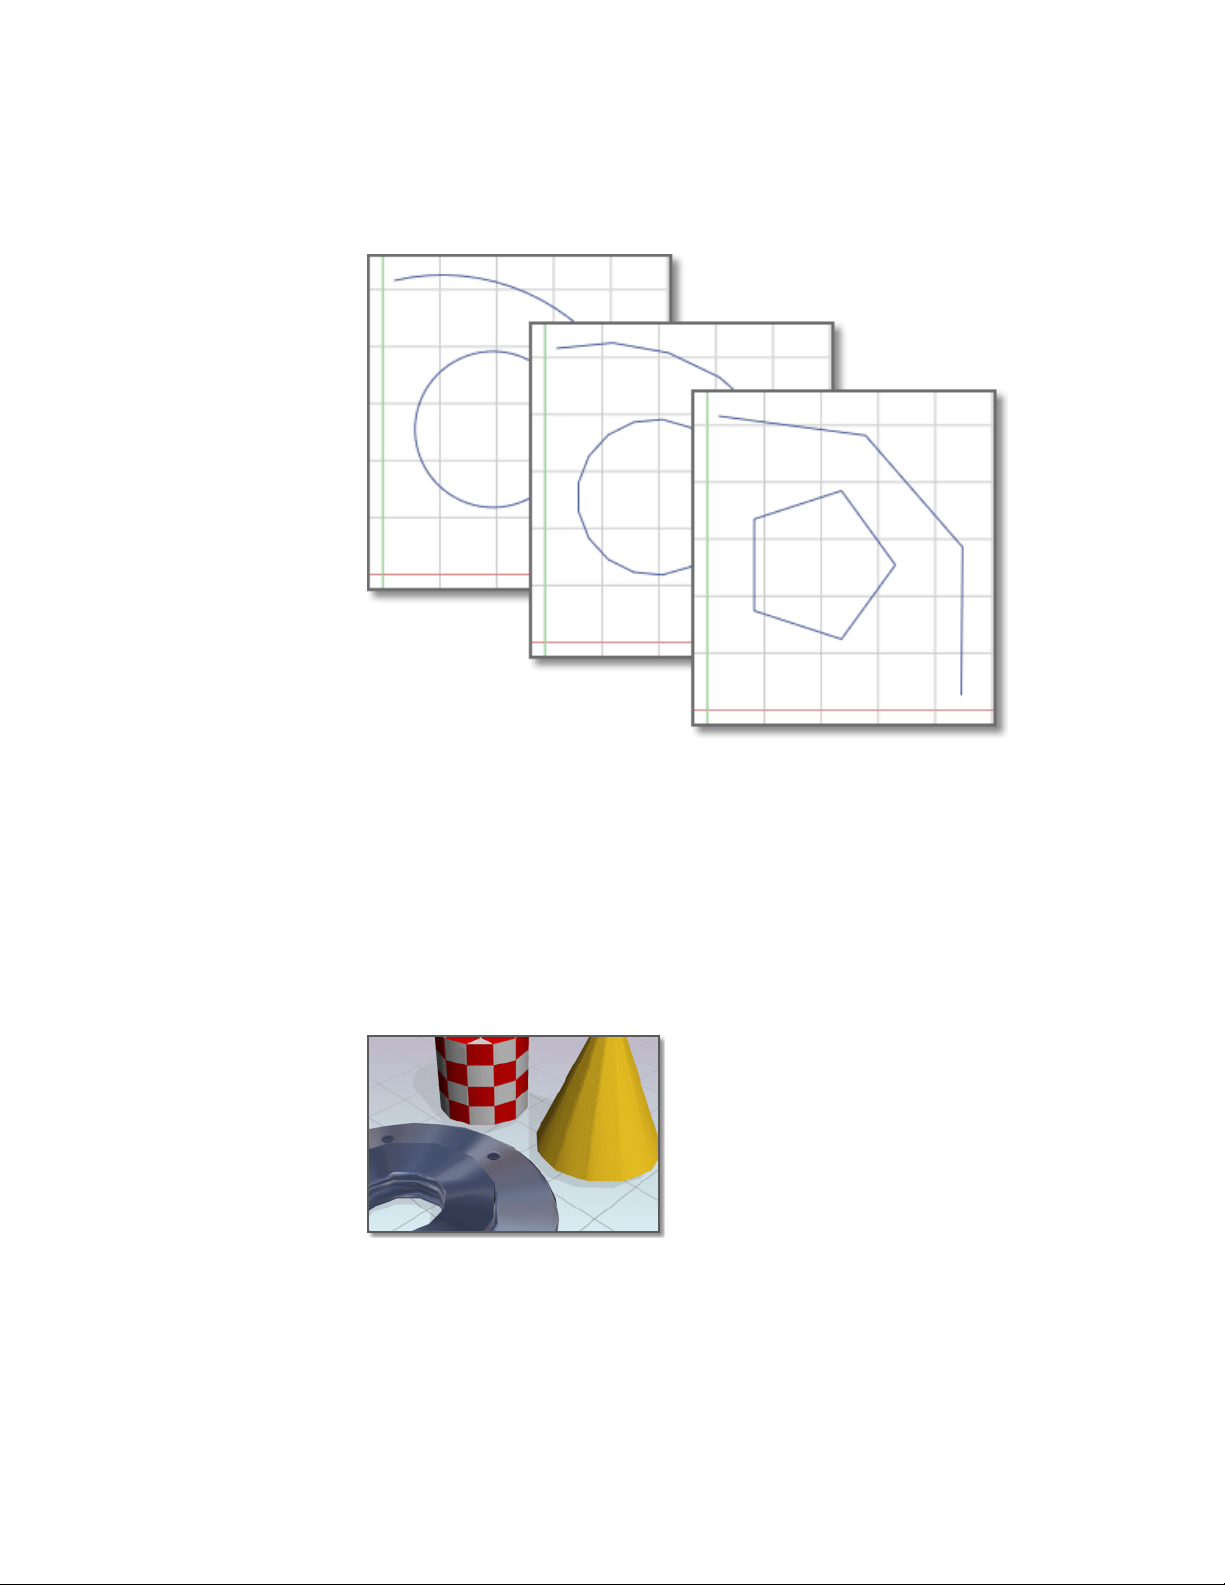
These objects are drawn on the screen using many short straight line segments.
Smoother arcs and circles display with higher VIEWRES settings, but they take
longer to regenerate. To increase performance while you're drawing, set a low
VIEWRES value.
Control Display of Curved Solids
FACETRES controls the mesh density and smoothness of shaded and rendered
curved solids.
In the following example, facets display on curved geometry when FACETRES
is low. FACETRES = .25.
Render 3D Objects for Realism | 745
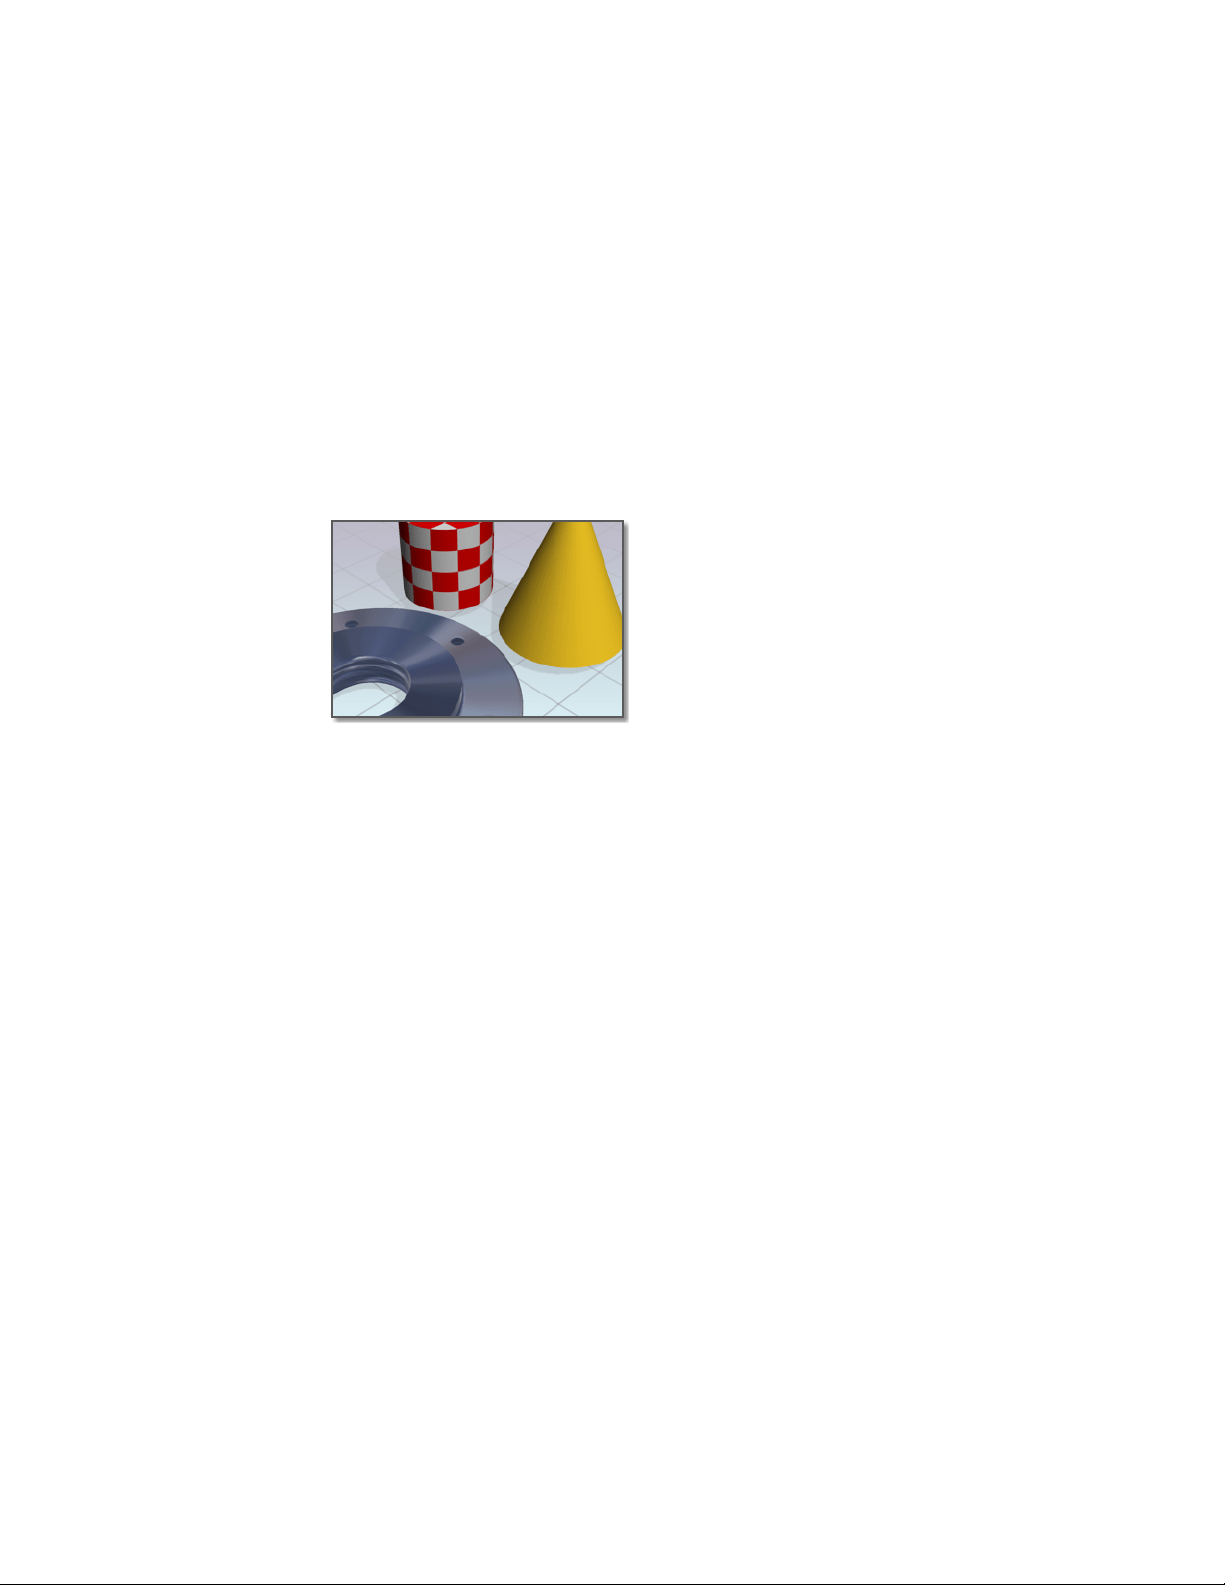
When FACETRES is set to 1, there is a one-to-one correlation between the
viewing resolution of circles and arcs and the tessellation, a means of
subdividing the faces of solid objects. For example, when FACETRES is set to
2, the tessellation will be twice the tessellation set by VIEWRES. The default
value of FACETRES is 0.5. The range of possible values is 0.01 to 10.
When you raise and lower the value of VIEWRES, objects controlled by both
VIEWRES and FACETRES are affected. When you raise and lower the value of
FACETRES, only solid objects are affected.
In the following example, smoother geometry is displayed when FACETRES
is set to higher values. FACETRES = 5.
See also:
Create Meshes (page 382)
Balance Mesh Density for Smooth Geometry
To alter the render resolution of solid geometry
1 At the Command prompt, enter facetres.
2 Do one of the following:
■ Enter a value greater than .5 to increase the smoothness of curved
surfaces.
■ Enter a value lower than .5 to decrease the smoothness of curved
surfaces.
To alter the display resolution of arcs and circles
1 At the Command prompt, enter viewres.
746 | Chapter 13 Render Drawings
2 Ignore the prompt about fast zooms if you only want to make circles
and arcs in the drawing look better for your rendering.
3 At the Circle Zoom Percent prompt, do one of the following:
■ Enter a value greater than 1000 to increase the smoothness of arcs
and circles.
■ Enter a value lower than 1000 to decrease the smoothness of arcs
and circles.
Set Up the Renderer
You can control many of the settings that affect how the renderer processes
a rendering task, especially when rendering higher quality images.
Control the Rendering Environment
You can use environmental features to set up atmospheric effects or
background images.
You can enhance a rendered image by means of atmospheric effects like fog
and depth cueing or by adding a bitmap image as a background.
Fog / Depth Cue Effects
Fog and depth cueing are very similar atmospheric effects that cause objects
to appear to fade as they increase in distance from the camera. Fog uses a
white color while depth cueing uses black.
Render 3D Objects for Realism | 747

The RENDERENVIRONMENT command is used to set up fog or depth cue
parameters. The key parameters you’ll set are the color of the fog or depth
cueing, the near and far distances, and the near and far fog percentages.
Fog and depth cueing are based on the front or back clipping planes of your
camera coupled with the near and far distance settings on the Render
Environment dialog box. For example, the back clipping plane of a camera is
active and located 30 feet from the camera location. If you want fog to start
15 feet from the camera and spread away indefinitely, you set the Near Distance
to 50 and the Far Distance to 100.
The density of the fog or depth cueing is controlled by the Near and Far Fog
Percentages. These settings have a range of 0.0001 to 100. Higher values mean
the fog or depth cueing is more opaque.
TIP For smaller scale models, the Near and Far Fog Percentage setting may need
to be set below 1.0 to see the desired effect.
Basics of Rendering
While the final goal is to create a photorealistic, presentation-quality image
that illustrates your vision, you create many renderings before you reach that
goal.
At a basic level, you can use the RENDER command to render your model
without applying any materials, adding any lights, or setting up a scene. When
you render a new model, the renderer automatically uses a virtual
“over-the-shoulder” distant light. You cannot move or adjust this light.
Render Views
You render the view displayed in the current vewport.
When rendering, all objects in the current viewport are rendered. If you have
not set a named view current, the current view is rendered. While the rendering
process is faster when you render smaller portions of a view, rendering the
entire view lets you see how all objects are oriented to one another.
If your current drawing contains named views, you can quickly display them
by using the VIEW command.
The following example shows a rendering of a named view.
748 | Chapter 13 Render Drawings
For a complete description of the Render Window, see RENDER in the
Command Reference.
Save and Redisplay Rendered Images
You can save a rendering and then redisplay it later. Redisplaying is much
faster than rendering again.
Save a Rendered Image
You can save an image of a model rendered to a viewport or a render window,
or you can render the image directly to a file.
Depending on the render settings you have chosen, rendering can be a
time-consuming process. However, redisplaying a previously rendered image
is instantaneous.
Once rendering is complete, you can save the image or save a copy of the
image to one of the following file formats: BMP, TGA, TIF, PCX, JPG, or PNG.
Redisplay a Rendered Image
Having saved your rendered image, you can view that rendering at any time.
If you do not want to use an external program, you can also view the image
by inserting it into the drawing with the IMAGEATTACH command.
Render 3D Objects for Realism | 749

Use Models with Other Applications
You can use other Autodesk products to further enhance the quality of your
models.
Autodesk
®
products continually improve their ability to share drawings and
models, including 3ds Max
®
, Autodesk
®
VIZ, and AutoCAD
®
Architecture.
3ds Max or Autodesk VIZ
With these products, you can make greater improvements on your models.
You have the option of opening DWG or DXF files without converting or you
can use the File Link Manager to create a live link with a drawing file. 3ds Max
or Autodesk VIZ offers expanded animation, lighting, material, and rendering
capabilities that add further polish to your presentation graphics.
AutoCAD Architecture
AutoCAD geometry can be opened in AutoCAD Architecture, no conversion
is necessary. Once the model is open you can use architectural related features,
such as architectural objects, schedules or integrated rendering, to streamline
your architectural design and documentation process.
750 | Chapter 13 Render Drawings

Glossary
Commands associated with definitions are shown in parentheses at the end of the
definition.
3D mesh primitive
Basic mesh forms such as boxes, cones, cylinders, pyramids, wedges, spheres,
and tori.
3D view
Any view where the UCS icon appears in rendered colored form; current visual
style is not 2D Wireframe, and the model is being viewed from an isometric
view.
absolute coordinates
Coordinate values measured from a coordinate system's origin point. See also
origin, relative coordinates, user coordinate system (UCS), world coordinates,
and world coordinate system (WCS).
acquired point
In the tracking or object snap tracking methods of locating a point, an
intermediate location used as a reference.
acquisition marker
During tracking or object snap tracking, the temporary plus sign displayed at
the location of an acquired point.
activate
Part of the Autodesk software registration process. It allows you to run a
product in compliance with the product's end-user license agreement.
adaptive degradation
A method of controlling performance that turns off features in a certain order
when performance falls below a specified level.
Glossary | 751

adaptive sampling
A method to accelerate the anti-aliasing process within the bounds of the
sample matrix size. See also anti-aliasing.
adjacent cell selection
A selection of table cells that share at least one boundary with another cell in
the same selection.
alias
A shortcut for a command. For example, CP is an alias for COPY, and Z is an
alias for ZOOM. You define aliases in the acad.pgp file.
aliasing
The effect of discrete picture elements, or pixels, aligned as a straight or curved
edge on a fixed grid appearing to be jagged or stepped. See also anti-aliasing.
aligned dimension
A dimension that measures the distance between two points at any angle. The
dimension line is parallel to the line connecting the dimension's definition
points. (DIMALIGNED)
alpha channel
Alpha is a type of data, found in 32-bit bitmap files, that assigns transparency
to the pixels in the image.
A 24-bit truecolor file contains three channels of color information: red, green,
and blue, or RGB. Each channel of a truecolor bitmap file is defined by 8 bits,
providing 256 levels of intensity. The intensity of each channel determines
the color of the pixel in the image. Thus, an RGB file is 24-bit with 256 levels
each of red, green, and blue.
By adding a fourth, alpha channel, the file can specify the transparency, or
opacity, of each of the pixels. An alpha value of 0 is transparent, an alpha
value of 255 is opaque, and values in between are semi-transparent. An RGBA
file (red, green, blue, alpha) is 32-bit, with the extra 8 bits of alpha providing
256 levels of transparency.
To output a rendered image with alpha, save in an alpha-compatible format
such as PNG, TIFF, or Targa.
752 | Glossary

ambient color
A color produced only by ambient light. Ambient color is the color of an
object where it is in shadow. This color is what the object reflects when
illuminated by ambient light rather than direct light.
ambient light
Light that illuminates all surfaces of a model with equal intensity. Ambient
light has no single source or direction and does not diminish in intensity over
distance.
angular dimension
A dimension that measures angles or arc segments and consists of text,
extension lines, and leaders. (DIMANGULAR)
angular unit
The unit of measurement for an angle. Angular units can be measured in
decimal degrees, degrees/minutes/seconds, grads, and radians.
annotational constraint
Dimensional constraint used to control the size of the geometry as well as
annotate the drawing.
See also parameter constraint, and dynamic constraint
annotations
Text, dimensions, tolerances, symbols, notes, and other types of explanatory
symbols or objects that are used to add information to your model.
annotation scale
A setting that is saved with model space, layout viewports, and model views.
When you create annotative objects, they are scaled based on the current
annotation scale setting and automatically displayed at the correct size.
annotative
A property that belongs to objects that are commonly used to annotate
drawings. This property allows you to automate the process of scaling
annotations. Annotative objects are defined at a paper height and display in
layout viewports and model space at the size determined by the annotation
scale set for those spaces.
Glossary | 753
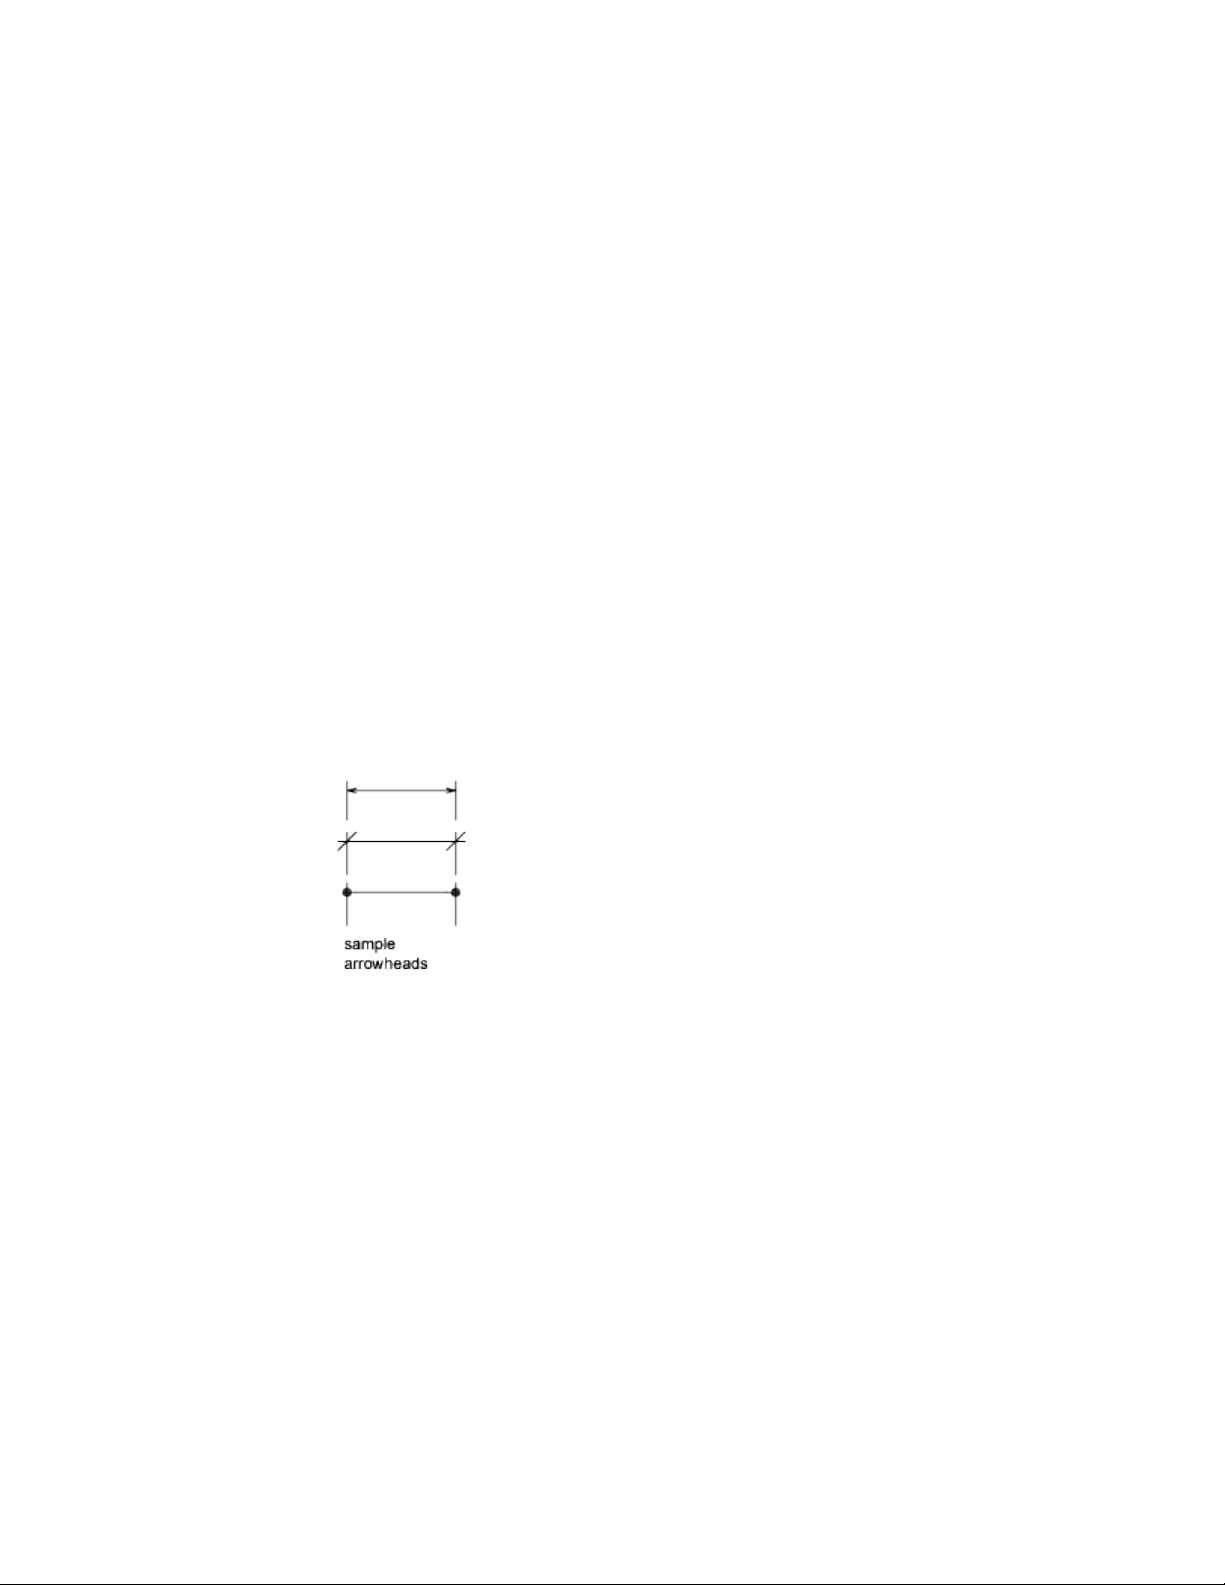
anonymous block
An unnamed block created by a number of features, including associative and
nonassociative dimensions.
anti-aliasing
A method that reduces aliasing by shading the pixels adjacent to the main
pixels that define a line or boundary. See also aliasing.
approximation points
Point locations that a B-spline must pass near, within a fit tolerance. See also
fit points and interpolation points.
array
1. Multiple copies of selected objects in a rectangular or polar (radial) pattern.
(ARRAY) 2. A collection of data items, each identified by a subscript or key,
arranged so a computer can examine the collection and retrieve data with the
key.
arrowhead
A terminator, such as an arrowhead, slash, or dot, at the end of a dimension
line showing where a dimension begins and ends.
aspect ratio
Ratio of display width to height.
associative dimension
A dimension that automatically adapts as the associated geometry is modified.
Controlled by the DIMASSOC system variable. See also nonassociative
dimension and exploded dimension.
754 | Glossary

associative hatch
Hatching that conforms to its bounding objects such that modifying the
bounding objects automatically adjusts the hatch. (BHATCH)
associative surfaces
Associative surfaces automatically adjust their location and shape when the
geometric objects associated with them are modified. Controlled by the
SURFACEASSOCIATIVITY system variable.
attenuation
The diminishing of light intensity over distance.
attribute definition
An object that is included in a block definition to store alphanumeric data.
Attribute values can be predefined or specified when the block is inserted.
Attribute data can be extracted from a drawing and inserted into external files.
(ATTDEF)
attribute extraction file
A text file to which extracted attribute data is written. The contents and format
are determined by the attribute extraction template file. See also attribute
extraction template file.
attribute extraction template file
A text file that determines which attributes are extracted and how they are
formatted when written to an attribute extraction file. See also attribute
extraction file.
attribute prompt
The text string displayed when you insert a block with an attribute whose
value is undefined. See also attribute definition, attribute tag, and attribute
value.
attribute tag
A text string associated with an attribute that identifies a particular attribute
during extraction from the drawing database. See also attribute definition,
attribute prompt, and attribute value.
attribute value
The alphanumeric information associated with an attribute tag. See also attribute
definition, attribute prompt, and attribute tag.
Glossary | 755

axis tripod
Icon with X, Y, and Z coordinates that is used to visualize the viewpoint (view
direction) of a drawing without displaying the drawing. (VPOINT)
back face
The opposite side of a front face. Back faces are not visible in a rendered image.
See also front faces.
baseline
An imaginary line on which text characters appear to rest. Individual characters
can have descenders that drop below the baseline. See also baseline dimension.
baseline dimension
Multiple dimensions measured from the same baseline. Also called parallel
dimensions. See also baseline.
base point
1. In the context of editing grips, the grip that changes to a solid color when
selected to specify the focus of the subsequent editing operation. 2. A point
for relative distance and angle when copying, moving, and rotating objects.
3. The insertion base point of the current drawing. (BASE) 4. The insertion
base point for a block definition. (BLOCK)
basic tooltip
Displays a brief description for the tooltip.
Bezier curve
A polynomial curve defined by a set of control points, representing an equation
of an order one less than the number of points being considered. A Bezier
curve is a special case of a B-spline curve. See also B-spline curve.
bitmap
The digital representation of an image having bits referenced to pixels. In
color graphics, a different value represents each red, green, and blue component
of a pixel.
blips
Temporary screen markers displayed in the drawing area when you specify a
point or select objects. (BLIPMODE)
756 | Glossary

block
A generic term for one or more objects that are combined to create a single
object. Commonly used for either block definition or block reference. See also
block definition and block reference. (BLOCK)
block definition
The name, base point, and set of objects that are combined and stored in the
symbol table of a drawing. See also block and block reference.
block definition table
The nongraphical data area of a drawing file that stores block definitions. See
also named object.
block instance
See block reference.
block reference
A compound object that is inserted in a drawing and displays the data stored
in a block definition. Also called instance. See also block and block definition.
(INSERT)
bounded area
A closed area that consists of a single object (such as a circle) or of multiple,
coplanar objects that overlap. You can insert hatch fills within bounded areas.
Bounded areas are also used to create 3D objects through extrusion by using
the PRESSPULL command.
B-spline curve
A blended piecewise polynomial curve passing near a given set of control
points. See also Bezier curve. (SPLINE)
bulge magnitude
The amount of curvature where two surfaces meet. This only applies to surfaces
that have G1 or G2 continuity.
bump map
A map in which brightness values are translated into apparent changes in the
height of the surface of an object.
Glossary | 757

BYBLOCK
A special object property used to specify that the object inherits the color or
linetype of any block containing it. See also BYLAYER.
BYLAYER
A special object property used to specify that the object inherits the color or
linetype associated with its layer. See also BYBLOCK.
camera target
Defines the point you are viewing by specifying the coordinate at the center
of the view.
candela
The SI unit of luminous intensity (perceived power emitted by a light source
in a particular direction) (Symbol: cd). Cd/Sr
canvas
The visible area of an application where objects are displayed. In AutoCAD,
the canvas is also known as the drawing area.
category
See view category.
cell
The smallest available table selection.
cell boundary
The four gridlines surrounding a table cell. An adjacent cell selection can be
surrounded with a cell boundary.
cell style
A style that contains specific formatting for table cells.
circular external reference
An externally referenced drawing (xref) that references itself directly or
indirectly. The xref that creates the circular condition is ignored.
clamp curve
A smooth, closed curve such as a circle. Because it has a vertex that is tangent
to the object, if the curve is reshaped, it may create kinks. See also periodic
curve.
758 | Glossary

clamp surface
A smooth, closed surface such as a cylinder. Because as a vertex that is tangent
to the object, if the surface is reshaped, it may create kinks. See also periodic
surface.
clipping planes
The boundaries that define or clip the field of view.
CMYK
For cyan, magenta, yellow, and key color. A system of defining colors by specifying
the percentages of cyan, magenta, yellow, and the key color, which is typically
black.
coincident grip
Grip shared by multiple objects.
Color bleed scale
Increases or decreases the saturation of the reflected color from the material.
color map
A table defining the intensity of red, green, and blue (RGB) for each displayed
color.
column
A vertically adjacent table cell selection spanning the height of the table. A
single column is one cell in width.
command line
A text area reserved for keyboard input, prompts, and messages.
compass
A visual aid that indicates the directions North, South, East, and West in the
current model.
composite solid
A solid created from two or more individual solids. (UNION, SUBTRACT,
INTERSECT)
constraint bar
Displays the geometric constraints associated with objects or with points on
objects.
Glossary | 759

constraint point
Point on an object that can be geometrically and/or dimensionally constrained
(for example, an endpoint or an insertion point).
constraints
Form of parametric design.
Rules that govern the position, slope, tangency, dimensions, and relationships
among objects in a geometry.
construction plane
See work plane.
continued dimension
A type of linear dimension that uses the second extension line origin of a
selected dimension as its first extension line origin, breaking one long
dimension into shorter segments that add up to the total measurement. Also
called chain dimension. (DIMCONTINUE)
continuity
A measure of how smoothly two curves or surfaces flow into each other where
they are joined. Continuity is measured as G0-Position, G1-Tangency, and
G2-Curvature.
■ G0 (Position) - The curves or surfaces join in the same location (position
only); they touch. But the tangency and curvature do not match.
■ G1 (Tangent) - The position and tangency between the surfaces match.
This indicates G1 (position + tangency) continuity between the surfaces.
■ G2 (Curvature) - The position, tangency, and curvature between the
surfaces match. This indicates G2 (position + tangency + curvature)
continuity between the two surfaces.
control frame
A series of point locations used as a mechanism to control the shape of a
B-spline. These points are connected by a series of line segments for visual
clarity and to distinguish the control frame from fit points. The CVSHOW
and CVHIDE commands must be turned on to display and hide control frames.
control point
See control frame.
760 | Glossary
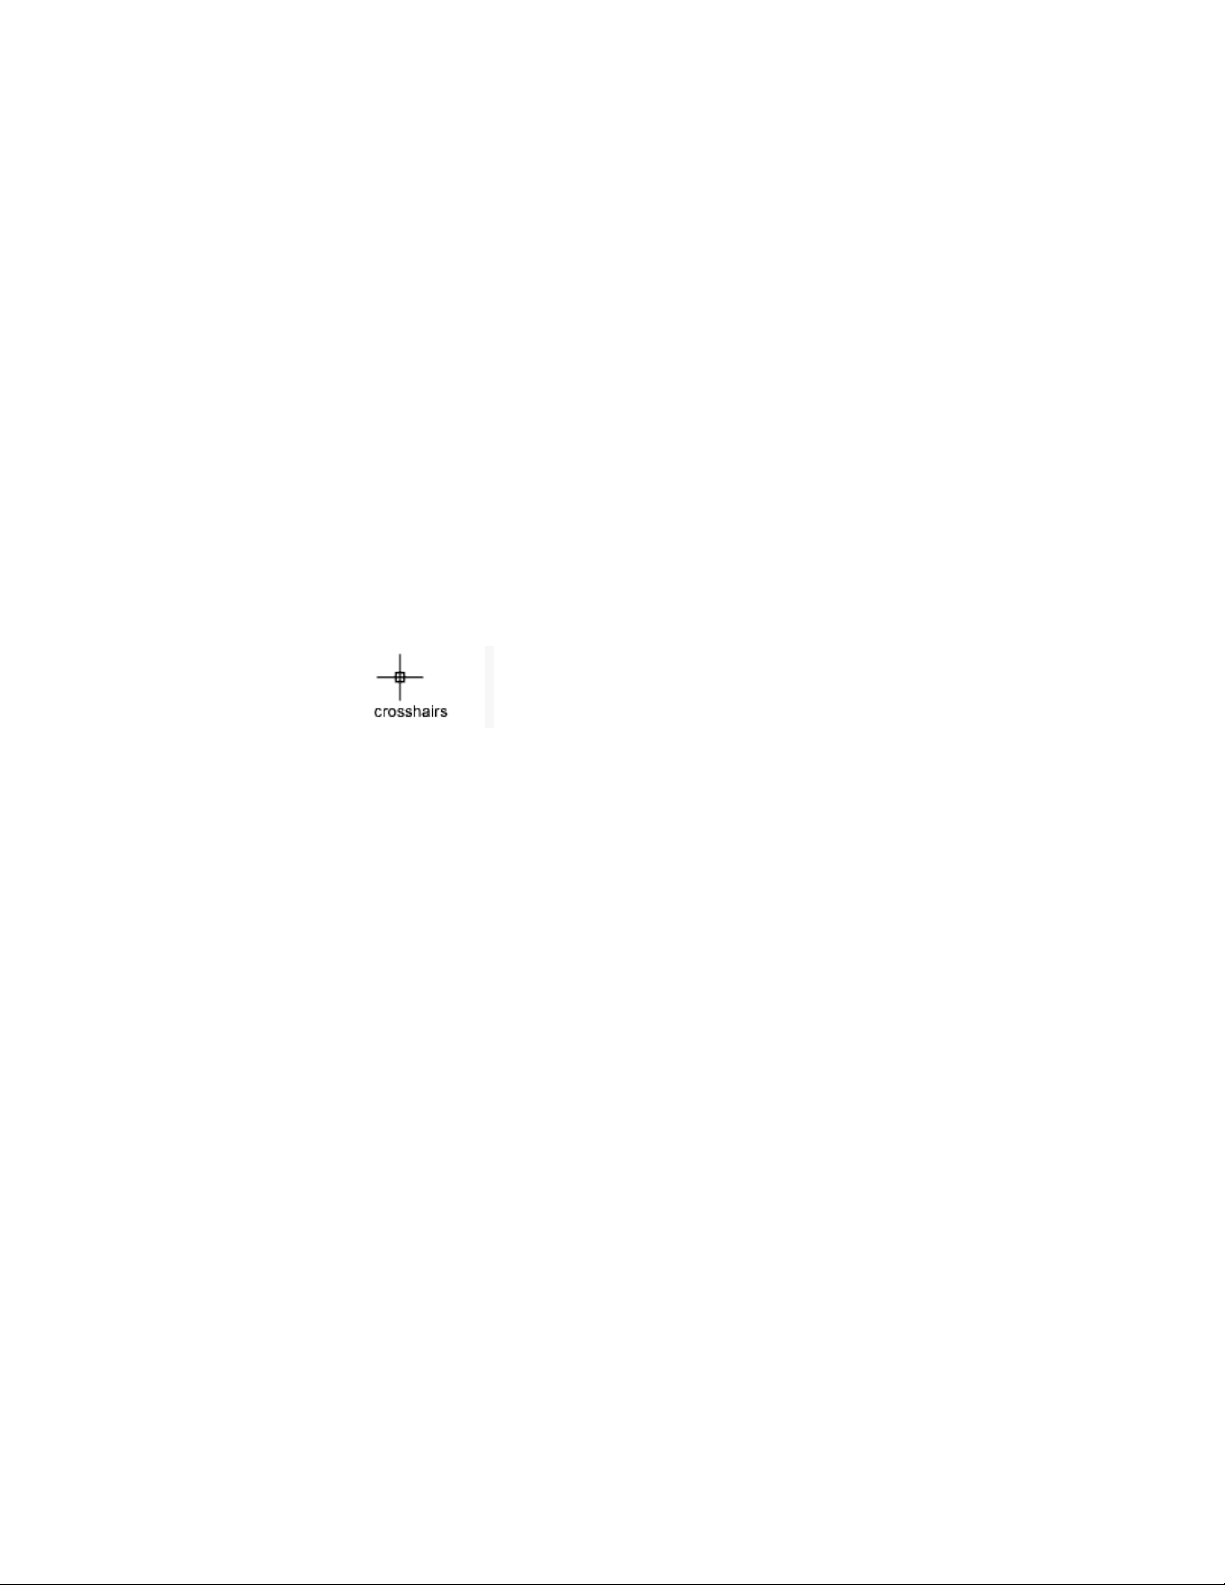
control vertices (CVs)
The most basic way to shape a NURBS surface or spline. These points act as
grips that can be dragged to reshape the object.
Coons patch
coordinate filters
Functions that extract individual X, Y, and Z coordinate values from different
points to create a new, composite point. Also called X,Y,Z point filters.
crease
A sharpened ridge that defines one or more edges of a mesh face subobject.
(MESHCREASE)
crosshairs
A type of cursor consisting of two lines that intersect.
crossing selection
A rectangular area drawn to select objects fully or partly within its borders.
cross sections
Generally, curves or lines that define the profile (shape) of a lofted solid or
surface. Cross sections can be open or closed. A lofted solid or surface is drawn
in the space between the cross sections. (LOFT)
CTB file
SA color-dependent plot style table.
ctrl-cycle
Method for cycling between different behaviors while editing geometry, either
in a command or when grip-editing. Pressing and releasing the Ctrl key cycles
the behavior. For constrained geometry, Ctrl-cycling switches between
enforcing and relaxing constraints.
current drawing
A drawing file that is open in the program, and receives any command or
action that you enter.
Glossary | 761

cursor
See pointer and crosshairs.
cursor menu
See shortcut menu.
curve-fit
A smooth curve consisting of arcs joining each pair of vertices. The curve
passes through all vertices of the polyline and uses any tangent direction you
specify.
custom grips
In a dynamic block reference, used to manipulate the geometry and custom
properties.
customization (CUIx) file
An XML-based file that stores customization data for the user interface. You
modify a customization file through the Customize dialog box.
custom object
A type of object that is created by an ObjectARX application and that typically
has more specialized capabilities than standard objects. Custom objects include
parametric solids (AutoCAD Mechanical Desktop), intelligently interactive
door symbols (AutoCAD Architecture), polygon objects (AutoCAD Map 3D),
and associative dimension objects (AutoCAD and AutoCAD LT). See also proxy
object and object enabler.
CV hull
A NURBS surface is modified through its control vertices (CV) hull. It consists
of the control vertices and the lines that connect them in the U and V
directions The hull sits outside of (not on) the surface. NURBS curves do not
have a CV hull; they only have control vertices.
decimal degrees
A notation for specifying latitude and longitude. For example, 35.1234°,
100.5678°.
Latitude always precedes longitude
762 | Glossary

default
A predefined value for a program input or parameter. Default values and
options for commands are denoted by angle brackets (<>). See also default
value.
default drawing
See initial environment.
default lighting
The lighting in a shaded viewport when the sun and user lights are turned
off. Faces are lighted by two distant light sources that follow the viewpoint
as you move around the model.
default value
The value that is accepted when you press Enter at a sub-prompt. The default
value is displayed in angle brackets <>. See also default.
definition points
Points for creating a dimension. The program refers to the points to modify
the appearance and value of a nonassociative dimension when the
dimensioned object is modified. Also called defpoints and stored on the special
layer DEFPOINTS.
definition table
The nongraphical data area of a drawing file that stores block definitions.
degree
A mathematical property of a curve or a surface that controls how many
control vertices per span are available for modeling.
The higher the degree, the more control points and the more complex shape.
But it is also harder to use, because each control point still influences the
entire curve.
dependency highlighting
In a dynamic block definition, how associated objects are displayed when you
select a parameter, grip, or action.
dependent named objects (in xrefs)
Named objects brought into a drawing by an external reference. See also named
object and symbol table.
Glossary | 763

dependent symbols
See dependent named objects (in xrefs).
DIESEL
For Direct Interpretively Evaluated String Expression Language.
diffuse color
An object's predominant color.
dimensional constraint
Parametric dimensions that control the size, angle, or position of geometry
relative to the drawing or other objects. When dimensions are changed, the
object resizes.
dimension line arc
An arc (usually with arrows at each end) spanning the angle formed by the
extension lines of an angle being measured. The dimension text near this arc
sometimes divides it into two arcs. See also angular dimension.
dimension style
A named group of dimension settings that determines the appearance of the
dimension and simplifies the setting of dimension system variables.
(DIMSTYLE)
dimension text
The measurement value of dimensioned objects.
dimension variables
A set of numeric values, text strings, and settings that control dimensioning
features. (DIMSTYLE)
direct distance entry
A method to specify a second point by first moving the cursor to indicate
direction and then entering a distance.
dithering
Combining color dots to give the impression of displaying more colors than
are actually available.
drawing area
The area in which your drawings are displayed and modified. The size of the
drawing area varies, depending on the size of the AutoCAD window and on
764 | Glossary
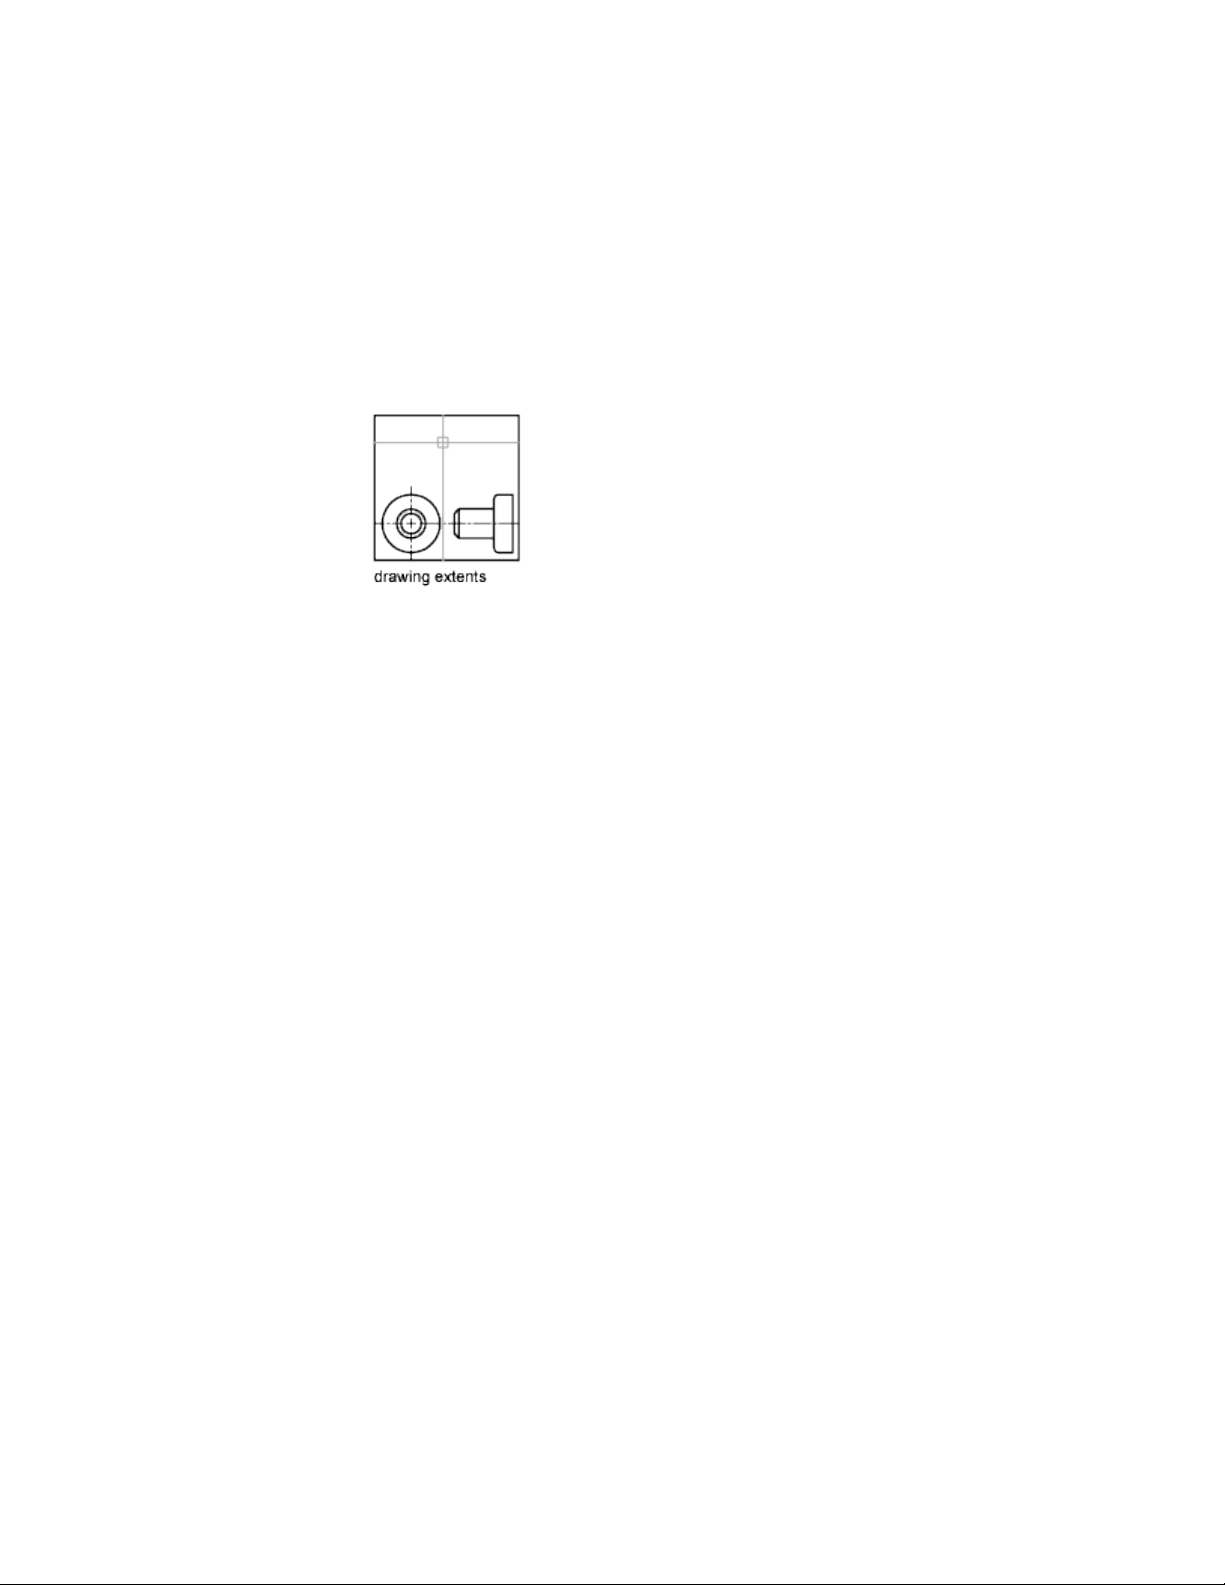
how many toolbars and other elements are displayed. See also AutoCAD
window.
drawing extents
The smallest rectangle that contains all objects in a drawing, positioned on
the screen to display the largest possible view of all objects. (ZOOM)
drawing limits
See grid limits.
drawing template
A drawing file with preestablished settings for new drawings such as
acad.dwtand acadiso.dwt however, any drawing can be used as a template. See
also initial environment.
driven constraint
A non-parametric dimension enclosed in parentheses that shows the current
value of geometry. The value is updated when the geometry changes size, but
it does not control geometry.
driving dimension
A parametric dimension that determines the size of geometry and resizes the
object when its value changes.
driving property
A lookup property is considered invertible when a manual change in the
lookup value for a block reference causes other properties values change.
DWG
Standard file format for saving vector graphics.
Glossary | 765
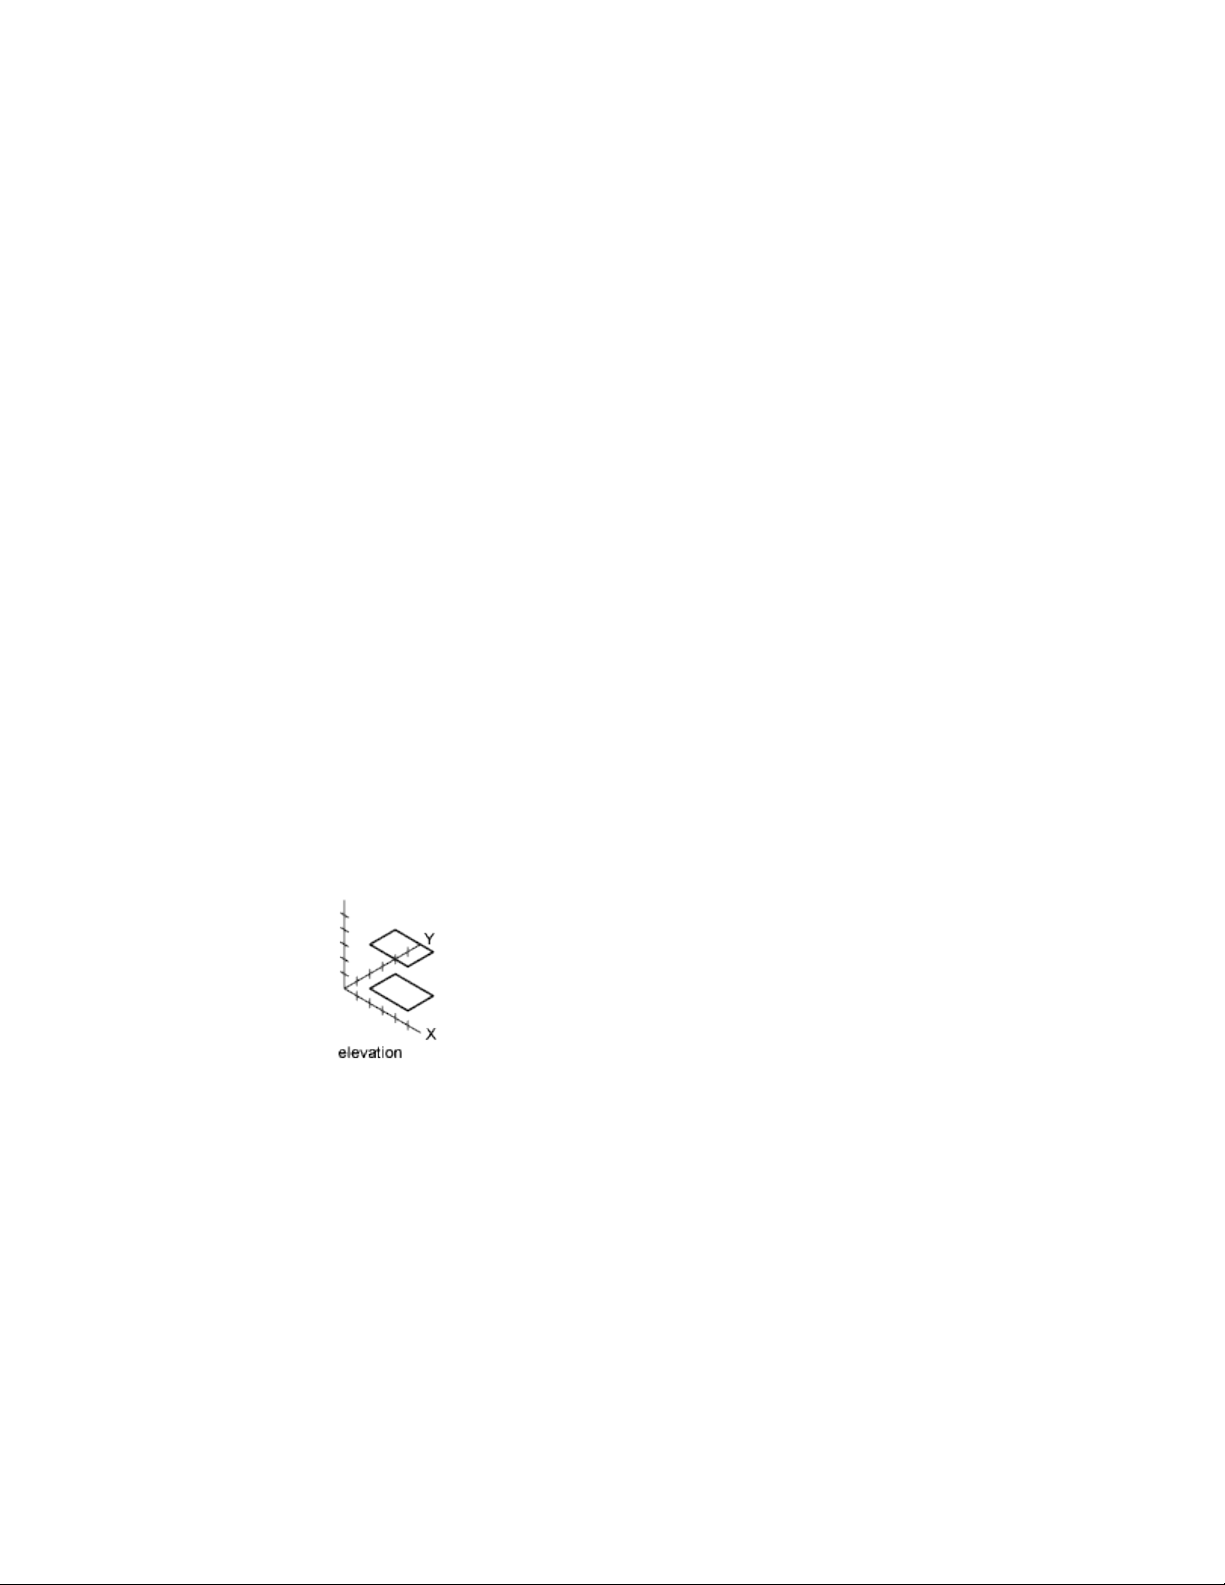
DXF
For drawing interchange format. An ASCII or binary file format of a drawing file
for exporting drawings to other applications or for importing drawings from
other applications.
dynamic constraint
Dimensional constraint (Constraint Form property = "dynamic") that displays
the constraints only when you select the constrained object.
See also: parameter constraint
See also: annotational constraint
dynamic dimension
Temporary dimensions that appear on objects, including dynamic block
references, when they are grip edited.
edge
The boundary of a face.
edge modifiers
Effects such as overhang and jitter that control how edges are displayed in a
shaded model.
elevation
The default Z value above or below the XY plane of the current user coordinate
system, which is used for entering coordinates and digitizing locations. (ELEV)
empty selection set
A selection set that contains no objects.
environment map
A bitmap that is used to simulate reflections in materials that have reflective
properties. The map is “wrapped” around the scene and any reflective object
766 | Glossary

will show the appropriate portion of the map in the reflective parts of its
material.
environment variable
A setting stored in the operating system that controls the operation of a
program.
explode
To disassemble a complex object, such as a block, dimension, solid, or polyline,
into simpler objects. In the case of a block, the block definition is unchanged.
The block reference is replaced by the components of the block. See also block,
block definition, and block reference. (EXPLODE)
exploded dimension
Independent objects that have the appearance of a dimension but are not
associated with the dimensioned object or each other. Controlled by the
DIMASSOC system variable. See also associative dimension, nonassociative
dimension, and explode. (EXPLODE)
extents
See drawing extents.
external reference (xref)
A drawing file referenced by another drawing. (XREF)
extrusion
A 3D solid created by sweeping an object that encloses an area along a linear
path.
face
A triangular or quadrilateral portion of a solid or surface object.
face color mode
A setting in the visual style that controls how color is displayed on a face.
face style
A setting in the visual style that defines the shading on a face.
facet
A triangular or quadrilateral portion of a 3D mesh object. Smoothing a mesh
object increases the number of facets.
Glossary | 767

feature control frame
The tolerance that applies to specific features or patterns of features. Feature
control frames always contain at least a geometric characteristic symbol to
indicate the type of control and a tolerance value to indicate the amount of
acceptable variation.
fence
A multi-segmented line specified to select objects it passes through.
field
A specialized text object set up to display data that may change during the
life cycle of the drawing. When the field is updated, the latest value of the
field is displayed. (FIELD)
fill
A solid color covering an area bounded by lines or curves. (FILL)
filters
See coordinate filters.
final gathering
Final gathering is an optional, additional step to calculating global
illumination. Using a photon map to calculate global illumination can cause
rendering artifacts such as dark corners and low-frequency variations in the
lighting. You can reduce or eliminate these artifacts by turning on final
gathering, which increases the number of rays used to calculate global
illumination.
Final gathering can greatly increase rendering time. It is most useful for scenes
with overall diffuse lighting, less useful for scenes with bright spots of indirect
illumination.
You turn on final gathering on the Advanced Render Settings palette. See also
global illumination.
fit points
Locations that a B-spline must pass through exactly or within a fit tolerance.
See also interpolation points and approximation points.
fit tolerance
The setting for the maximum distance that a B-spline can pass for each of the
fit points that define it.
768 | Glossary

floating viewports
See layout viewports.
font
A character set, made up of letters, numbers, punctuation marks, and symbols
of a distinctive proportion and design.
footcandle
The American unit of illuminance (symbol: fc). Lm/ft^2.
footcandle
The American unit of illuminance (symbol: fc). Lm/ft^2
frame
An individual, static image in an animated sequence. See also motion path.
freeze
A setting that suppresses the display of objects on selected layers. Objects on
frozen layers are not displayed, regenerated, or plotted. Freezing layers shortens
regenerating time. See also thaw. (LAYER)
front faces
Faces with their normals pointed outward.
G0 continuity
See continuity (page 760).
G1 continuity
See continuity (page 760).
G2 continuity
See continuity (page 760).
general property
Properties that are common between a selection of objects. These include
Color, Layer, Linetype, Linetype scale, Plot style, Lineweight, Transparency,
and Thickness.
generic surface
A 3D surface object with no control vertices, history, or analytic information.
Generic surfaces cannot be associative and they are created when associative
Glossary | 769

analytic surfaces are separated or by using the BREP command. See also
procedural surface and NURBS surface.
geometric constraint
Rules that define the geometric relationships of objects (or points of objects)
elements and control how an object can change shape or size.
Geometric constraints are coincident, collinear, concentric, equal, fix,
horizontal, parallel, perpendicular, tangent, and vertical.
geometry
All graphical objects such as lines, circles, arcs, polylines, and dimensions.
Nongraphical objects, such as linetypes, lineweights, text styles, and layers
are not considered geometry. See also named object.
gizmo
A tool that permits you to manipulate a 3D object uniformly or along a
specified axis or plane. Examples of gizmos include the 3D Move, 3D Rotate,
and 3D Scale gizmos. They are displayed when you select a 3D object.
global illumination
An indirect illumination technique that allows for effects such as color
bleeding. As light hits a colored object in the model, photons bounce to
adjacent objects and tint them with the color of the original object.
Gooch shading
A type of shading that uses a transition from cool to warm colors rather than
from dark to light.
graphics area
See drawing area.
graphics window
See AutoCAD window and drawing area.
grid
An area covered with regularly spaced dots or lines to aid drawing. The grid
spacing is adjustable. The grid dots are never plotted. See also grid limits.
(GRID)
grid limits
The user-defined rectangular boundary of the drawing area covered by dots
when the grid is turned on. Also called drawing limits. (LIMITS)
770 | Glossary
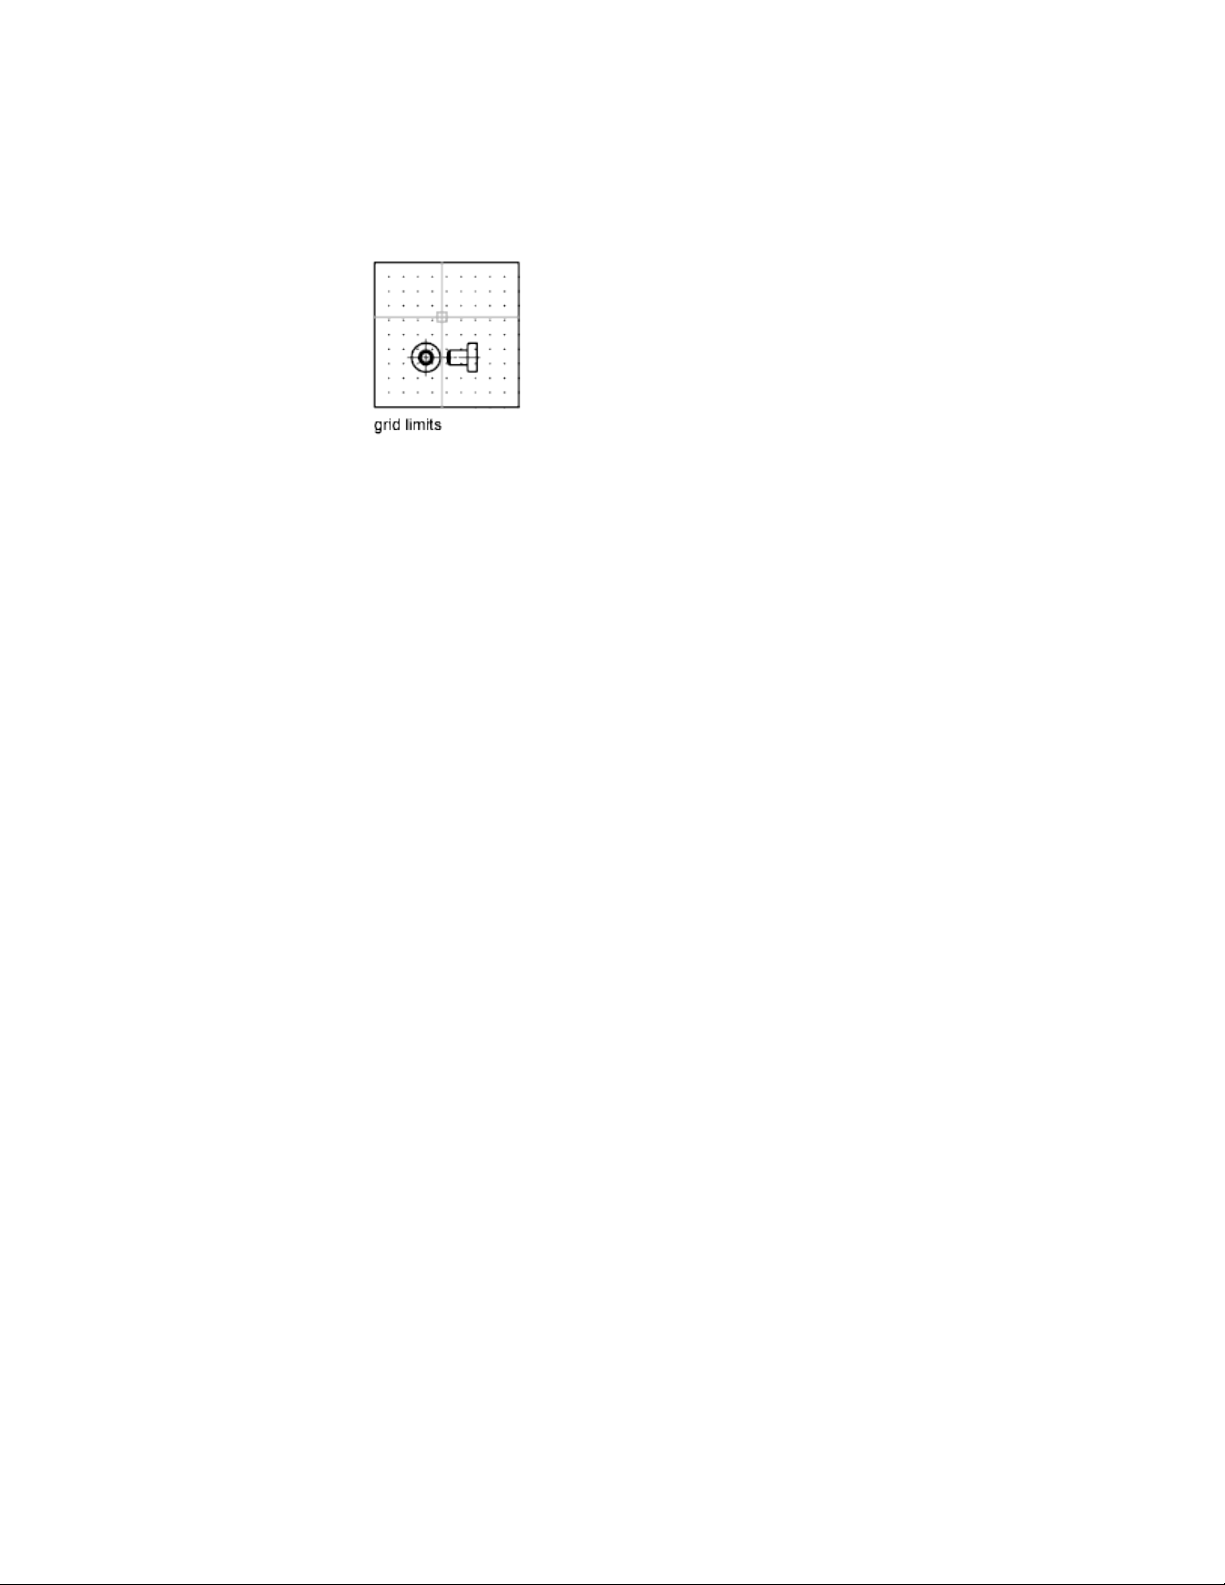
grip menu options
See multi-functional grip menu options.
grip modes
The editing options you can access from selected grips on selected objects:
stretching, moving, rotating, scaling, and mirroring.
grips
Small squares and triangles that appear on objects you select. After selecting
the grip, you edit the object by dragging it with the pointing device instead
of entering commands.
grip tool
An icon that you use in a 3D view to easily constrain the movement or rotation
of a selection set of objects to an axis or a plane. (3DMOVE, 3DROTATE)
ground plane
The XY plane of the user coordinate system when perspective projection is
turned on. The ground plane displays with a color gradient between the ground
horizon (nearest to the horizon) and the ground origin (opposite the horizon).
See also sky and underground.
guide curves
Lines or curves that intersect each cross section of a lofted solid or surface and
that define the form by adding additional wireframe information to the object.
(LOFT)
handle
A unique alphanumeric tag for an object in the program's database.
Glossary | 771

heads-up display (HUD)
The process of transparently displaying user interface elements on top of or
over the drawing area without obscuring the view of the objects drawn on
the drawing area.
helix
An open 2D or 3D spiral. (HELIX)
Help menu
In AutoCAD, you can find Help on the Mac OS menu bar or by pressing Fn-F1.
HLS
For hue, lightness, and saturation. A system of defining color by specifying the
amount of hue, lightness, and saturation.
Home view
A special view saved with the drawing that is controlled through the ViewCube
tool. The Home view is similar in concept to the default, initial view presented
when a drawing is first opened.
horizontal landing
An optional line segment connecting the tail of a leader line with the leader
content.
hot grip
A selected grip.
Illuminance
In photometry, illuminance is the total luminous flux incident on a surface
per unit area.
indirect bump scale
Scales the effect of the base material’s bump mapping in areas lit by indirect
light.
indirect illumination
Illumination techniques such as global illumination and final gathering, that
enhance the realism of a scene by simulating radiosity, or the interreflection
of light between objects in a scene.
772 | Glossary

initial environment
The variables and settings for new drawings as defined by the default drawing
template, such as acad.dwt or acadiso.dwt. See also template drawing.
interface element
A user interface object that can be customized, such as a pull-down menu or
tool set.
interpolation points
Defining points that a B-spline passes through. See also approximation points
and fit points.
island
An enclosed area within another enclosed area. Islands may be detected as
part of the process of creating hatches, polylines, and regions. (BHATCH,
BOUNDARY)
ISO
For International Standards Organization. The organization that sets international
standards in all fields except electrical and electronics. Headquarters are in
Geneva, Switzerland.
isoline
Gridlines that appear on regular and NURBS surfaces. They show the shape
of the surface.
isometric snap style
A drafting option that aligns the cursor with two of three isometric axes and
displays grid, making 2D isometric drawings easier to create.
isoparm
Lines of constant U or V values that run along a NURBS surface. They show
the shape of the surface as defined by the control vertices.
key point
In a dynamic block definition, the point on a parameter that drives its
associated action when edited in the block reference.
knot
The knot parameterization setting affects the shape of a fit point spline. The
different settings affect the shape of the curve as it passes through the fit
points.
Glossary | 773

label block
landing
The portion of a leader object that acts as a pointer to the object being called
out. A landing can either be a straight line or a spline curve.
landing gap
An optional space between a leader tail and the leader content.
layer
A logical grouping of data that are like transparent acetate overlays on a
drawing. You can view layers individually or in combination. (LAYER)
layer index
A list showing the objects on each layer. A layer index is used to locate what
portion of the drawing is read when you partially open a drawing. Saving a
layer index with a drawing also enhances performance when you work with
external references. The INDEXCTL system variable controls whether layer
and spatial indexes are saved with a drawing.
layout
The environment in which you create and design paper space layout viewports
to be plotted. Multiple layouts can be created for each drawing.
layout viewports
Objects that are created in paper space that display views. See also paper space.
(VPORTS)
leader tail
The portion of a leader line that is connected to the annotation.
lens length
Defines the magnification properties of a camera's lens. The greater the lens
length, the narrower the field of view.
level of smoothness
The property assigned to a mesh object to control how much the edges of the
object are smoothed. Level 0 (zero) represents the least rounded shape for a
specified mesh object. Higher levels result in increased smoothness.
light glyph
The graphic representation of a point light or a spotlight.
774 | Glossary

limits
See drawing limits.
line font
See linetype.
linetype
How a line or type of curve is displayed. For example, a continuous line has
a different linetype than a dashed line. Also called line font. (LINETYPE)
lineweight
A width value that can be assigned to all graphical objects except TrueType
®
fonts and raster images.
LL84 coordinate system
Common latitude longitudinal-based coordinate system where latitude and
longitude are both measured from -90 to 90 degrees.
Longitude begins at 0 degrees at the Prime Meridian in Greenwich, England
and is measured from -180 to 180.
Latitude is 0 degrees at the equator and is measured from -90 to 90.
lofted solid/surface
A solid or surface that is drawn through a set of two or more cross-section
curves. The cross sections define the profile (shape) of the resulting solid or
surface. Cross sections (generally, curves or lines) can be open or closed. (LOFT)
lumen
The SI unit of luminous flux (Symbol: lm). Cd * Sr
luminaire
This refers to the aggregation of a lamp or lamps and its fixture. The fixture
may be a simple can or a complex armature with constrained joints.
luminance
Luminance is the value of light reflected off a surface. It is a measure of how
bright or dark we perceive the surface.
luminous flux
The perceived power in per unit of solid angle. The total luminous flux for a
lamp is the perceived power emitted in all directions.
Glossary | 775

lux
The SI unit of illuminance (symbol: lx). Lm/m^2
magnitude
See bulge magnitude.
main customization file
A writable CUIx file that defines most of the user interface elements (including
the pull-down menus and tool sets).
merge
In tables, an adjacent cell selection that has been combined into a single cell.
mesh
A tessellated, or subdivided object type that is defined by faces, edges, and
vertices. Mesh can be smoothed to achieve a more rounded appearance and
creased to introduce ridges. Before AutoCAD 2010, only the less modifiable
polygon and polyface mesh was available.
mirror
To create a new version of an existing object by reflecting it symmetrically
with respect to a prescribed line or plane. (MIRROR)
mode
A software setting or operating state.
model
A two- or three-dimensional representation of an object.
model space
One of the two primary spaces in which objects reside. Typically, a geometric
model is placed in a three-dimensional coordinate space called model space.
A final layout of specific views and annotations of this model is placed in
paper space. See also paper space. (MSPACE)
model viewports
A type of display that splits the drawing area into one or more adjacent
rectangular viewing areas. See also layout viewports, TILEMODE, and viewport.
(VPORTS)
776 | Glossary

multi-functional grip menu options
Editing options you can access from the grip menu that appears when you
hover over an object grip (not available for all object types).
multileader
A leader object that creates annotations with multiple leader lines.
named object
Describes the various types of nongraphical information, such as styles and
definitions, stored with a drawing. Named objects include linetypes, layers,
dimension styles, text styles, block definitions, layouts, views, and viewport
configurations. Named objects are stored in definition (symbol) tables.
named objects, dependent
See dependent named objects (in xrefs).
named view
A view saved for restoration later. (VIEW)
node
An object snap specification to locate points, dimension definition points,
and dimension text origins.
non-associative dimension
A dimension that does not automatically change as the associated geometry
is modified. Controlled by the DIMASSOC system variable. See also associative
dimension and exploded dimension.
normal
A normal is a vector that defines which way a face is pointing. The direction
of the normal indicates the front, or outer surface of the face.
noun-verb selection
Selecting an object first and then performing an operation on it rather than
entering a command first and then selecting the object.
NURBS
For nonuniform rational B-spline curve. A B-spline curve or surface defined by a
series of weighted control points and one or more knot vectors. See also B-spline
curve.
Glossary | 777

NURBS surface
Surfaces that are have control vertices in the U and V directions. NURBS
surfaces cannot be associative. See also procedural surface and generic surface.
object
One or more graphical elements, such as text, dimensions, lines, circles, or
polylines, treated as a single element for creation, manipulation, and
modification. Formerly called entity.
ObjectARX (AutoCAD Runtime Extension)
A compiled-language programming environment for developing custom
applications.
object enabler
A tool that provides specific viewing and standard editing access to a custom
object when the ObjectARX application that created the custom object is not
present. See also custom object and proxy object.
Object Snap mode
Methods for selecting commonly needed points on an object while you create
or edit a drawing. See also running object snap and object snap override.
object snap override
Turning off or changing a running Object Snap mode for input of a single
point. See also Object Snap mode and running object snap.
opacity map
Projection of opaque and transparent areas onto objects, creating the effect
of a solid surface with holes or gaps.
origin
The point where coordinate axes intersect. For example, the origin of a
Cartesian coordinate system is where the X, Y, and Z axes meet at 0,0,0.
orthogonal
Having perpendicular slopes or tangents at the point of intersection.
Ortho mode
A setting that limits pointing device input to horizontal or vertical (relative
to the current snap angle and the user coordinate system). See also snap angle
and user coordinate system (UCS).
778 | Glossary

page setup
A collection of plot device and other settings that affect the appearance and
format of the final output. These settings can be modified and applied to other
layouts.
palette
A user interface element that can be either docked, anchored, or floating in
the drawing area. Dockable windows include the command line, status bar,
Properties Inspector, and so on.
pan
To shift the view of a drawing without changing magnification. See also zoom.
(PAN)
paper space
One of two primary spaces in which objects reside. Paper space is used for
creating a finished layout for printing or plotting, as opposed to doing drafting
or design work. You design your model using the Model tab. See also model
space and viewport. (PSPACE)
parametric design
Ability to establish relationships between objects, to drive the size and
orientation of geometry with model and user-defined parameters.
parametric drawing
Feature in AutoCAD that assigns constraints to objects, establishing the
distance, location, and orientation of objects with respect to other objects.
path curve
Defines the direction and length that a profile curve is lofted, swept, or
extruded to create a solid or surface. (SWEEP, LOFT, EXTRUDE)
PC3 file
Partial plotter configuration file. PC3 files contain plot settings information
such as the device driver and model, the output port to which the device is
connected, and various device-specific settings, but do not include any custom
plotter calibration or custom paper size information. See also PMP file, STB
file, and CTB file.
Glossary | 779

periodic curve
A smooth, closed curve such as a circle. Because its control vertices are not
tangent to the object, if the curve is reshaped, it stays smooth and does not
create kinks. See also clamp curve.
periodic surface
A smooth, closed surface such as a cylinder. Because its control vertices are
not tangent to the object, if the surface is reshaped, it stays smooth and does
not create kinks. See also clamp surface.
perspective view
Objects in 3D seen by an observer positioned at the viewpoint looking at the
view center. Objects appear smaller when the distance from the observer (at
the view point) to the view center increases. Although a perspective view
appears realistic, it does not preserve the shapes of objects. Parallel lines
seemingly converge in the view. The program has perspective view settings
for VPORTS table entries as well as viewport objects.
photometric lights
Photometric lights are physically-correct lights. Physically correct lights
attenuate as the square of the distance. Photometry is the science of
measurement of visible light in terms of its perceived brightness.
photon map
A technique to generate the indirect illumination effects of global illumination
used by the renderer. When it calculates indirect illumination, the renderer
traces photons emitted from a light. The photon is traced through the model,
being reflected or transmitted by objects, until it strikes a diffuse surface. When
it strikes a surface, the photon is stored in the photon map.
photorealistic rendering
Rendering that resembles a photograph.
pick button
The button on a pointing device that is used to select objects or specify points
on the screen. For example, on a two-button mouse, it is the left button by
default.
780 | Glossary
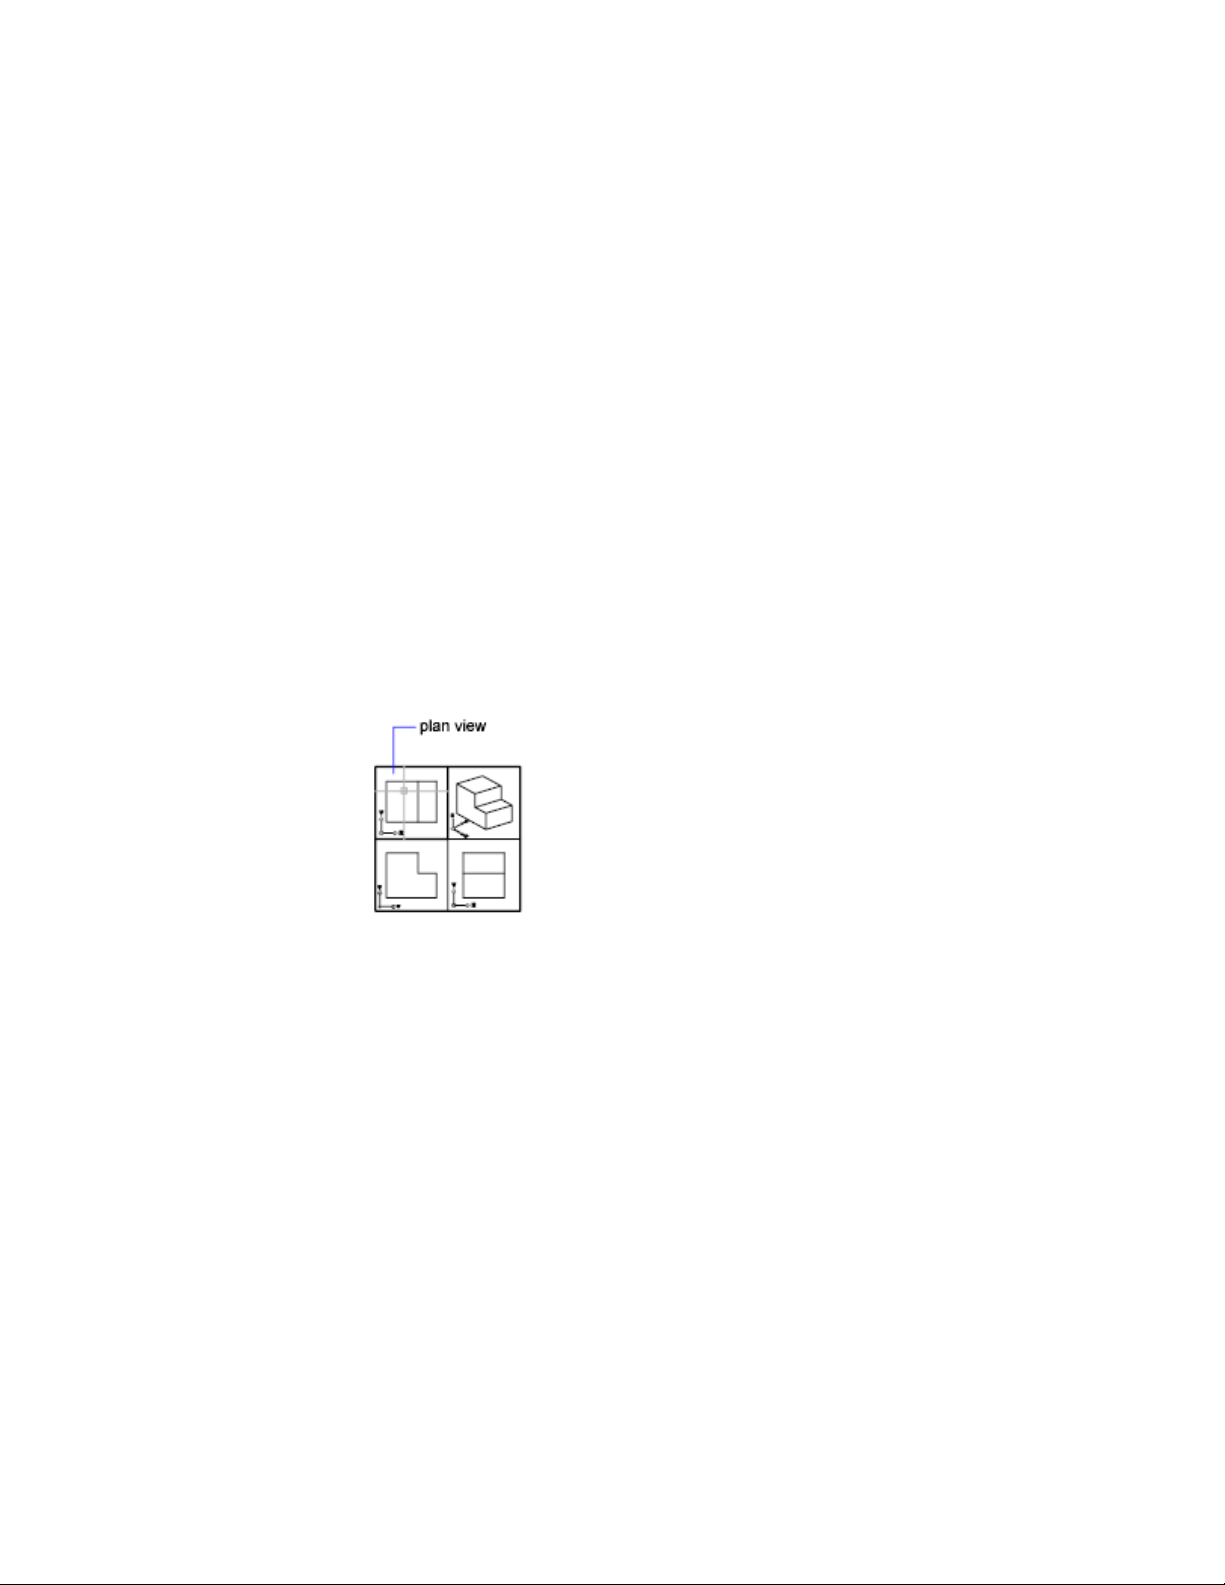
pick-first
pick-first set
pick points
Clicking and acquiring a point on an object in the drawing.
planar face
A flat face that can be located anywhere in 3D space.
planar projection
Mapping of objects or images onto a plane.
planar surface
A flat surface that can be located anywhere in 3D space. (PLANESURF)
plan view
A view orientation from a point on the positive Z axis toward the origin (0,0,0).
(PLAN)
pline
See polyline.
plot style
An object property that specifies a set of overrides for color, dithering, gray
scale, pen assignments, screening, linetype, lineweight, endstyles, joinstyles,
and fill styles. Plot styles are applied at plot time.
plot style table
A set of plot styles. Plot styles are defined in plot style tables and apply to
objects only when the plot style table is attached to a layout or viewport.
Glossary | 781

PMP file
Plot Model Parameter. File containing custom plotter calibration and custom
paper size information associated with plotter configuration file.
point
1. A location in three-dimensional space specified by X, Y, and Z coordinate
values. 2. An object consisting of a single coordinate location. (POINT)
pointer
A cursor on a video display screen that can be moved around to place textual
or graphical information. See also crosshairs.
point filters
See coordinate filters.
polar array
Objects copied around a specified center point a specified number of times.
(ARRAY)
Polar Snap
A precision drawing tool used to snap to incremental distances along the polar
tracking alignment path. See also polar tracking (page 782).
polar tracking
A precision drawing tool that displays temporary alignment paths defined by
user-specified polar angles. See also Polar Snap.
polyface and polygon mesh
Legacy mesh types that were available before AutoCAD 2010. Although you
can continue to create polygonal and polyface mesh (for example, by setting
MESHTYPE to 0), the newer, more modifiable mesh type is recommended.
polygon window selection
A multisided area specified to select objects in groups. See also crossing selection
and window selection.
polyline
An object composed of one or more connected line segments or circular arcs
treated as a single object. Also called pline. (PLINE, PEDIT)
782 | Glossary

polysolid
A swept solid that is drawn the same way you draw a polyline or that is based
on an existing line. By default, a polysolid always has a rectangular profile.
You can specify the height and width of the profile. (POLYSOLID)
primary table fragment
The fragment of a broken table that contains the beginning set of rows up to
the first table break.
primitive
Basic 3D forms such as boxes, cones, cylinders, pyramids, wedges, spheres,
and tori. You can create primitive meshes and primitive 3D solid objects.
procedural materials
procedural surface
A 3D surface object that has history and analytic information, but no control
vertices. Procedural surfaces are the only type of surface that can be associative.
See also generic surface and NURBS surface.
profile curve
An object that is swept, extruded, or revolved and defines the shape of the
resulting solid or surface. (SWEEP, EXTRUDE, REVOLVE)
project
An organized and named collection of layouts from several drawing files.
(SHEETSET)
prompt
A message on the command line or in a tooltip that asks for information or
requests action such as specifying a point.
proxy object
A substitute for a custom object when the ObjectARX application that created
the custom object is not available. See also custom object and object enabler.
QuickView
A tool to preview and switch between open drawings and layouts in a drawing.
Glossary | 783

ray-traced shadows
A way that the renderer can generate shadows. Ray tracing traces the path of
rays sampled from the light source. Shadows appear where rays have been
blocked by objects. Ray-traced shadows have sharp edges.
ray tracing
The renderer can generate reflections and refractions. Ray tracing traces the
path of rays sampled from the light source. Reflections and refractions
generated this way are physically accurate.
rectangular break
To break a table into multiple parts that are evenly spaced and set at a
user-specified height using the table breaking grips.
redraw
To quickly refresh or clean up blip marks in the current viewport without
updating the drawing's database. See also regenerate. (REDRAW)
reference
A definition, known as an external reference or block reference, that is used
and stored in the drawing. See also block (BLOCK) and external reference (xref).
(XREF)
refine
To quadruple the number of faces in a mesh object as you reset the baseline
level of smoothness. (You cannot make a mesh courser than its baseline level.)
You can also refine specified mesh faces without resetting the baseline level
of smoothness for the object. (MESHREFINE)
reflectance scale
Increases or decreases the amount of energy the material reflects.
reflection color
The color of a highlight on shiny material. Also called specular color.
reflection line
In a dynamic block reference, the axis about which a flip action's selection
set flips when the associated parameter is edited through a grip or the Properties
Inspector palette.
reflection mapping
Creates the effect of a scene reflected on the surface of a shiny object.
784 | Glossary

refraction
How light distorts through an object.
regenerate
To update a drawing's screen display by recomputing the screen coordinates
from the database. See also redraw. (REGEN)
region
Two-dimensional enclosed areas that have physical properties such as centroids
or centers of mass. You can create regions from objects that form closed loops.
They area commonly created in order to apply hatching and shading. (REGION)
relative coordinates
Coordinates specified in relation to previous coordinates.
relax constraints
Ability to temporarily ignore constraints while editing geometry. After the
geometry is edited, the constraints are either removed or retained based on
whether the constraint is still valid for the edited geometry.
RGB
For red, green, and blue. A system of defining colors by specifying percentages
of red, green, and blue.
roll arrows
Curved arrows located above the ViewCube tool with which you can rotate
the current view 90 degrees clockwise or counterclockwise.
roughness
Value to simulate how light hitting a face is reflected back to the user. A high
roughness value simulates a non-shiny or rough object (sandpaper/carpet). A
low roughness value simulates a very shiny object (metals, some plastics.)
row
A horizontally adjacent table cell selection spanning the width of the table.
A single row is one cell in height.
rubber-band line
A line that stretches dynamically on the screen with the movement of the
cursor. One endpoint of the line is attached to a point in your drawing, and
the other is attached to the moving cursor.
Glossary | 785

running object snap
Setting an Object Snap mode so it continues for subsequent selections. See
also Object Snap mode and object snap override. (OSNAP)
sampling
save back
To update the objects in the original reference (external or block reference)
with changes made to objects in a working set during in-place reference editing.
scale representation
The display of an annotative object based on the annotation scales that the
object supports. For example, if an annotative object supports two annotations
scales, it has two scale representations
script file
A set of commands executed sequentially with a single SCRIPT command.
Script files are created outside the program using a text editor, saved in text
format, and stored in an external file with the file extension .scr.
secondary table fragment
Any fragment of a broken table that does not contain the beginning set of
rows.
selection node
A specific type of action tree node that is used to handle selection activities.
selection sensitivity
The ability to define the pivot point for reorienting a model based on the
current selection.
selection set
One or more selected objects that a command can act upon at the same time.
In a dynamic block definition, the geometry associated with an action.
shadow maps
A shadow map is a bitmap that the renderer generates during a pre-rendering
pass of the scene. Shadow maps do not show the color cast by transparent or
translucent objects. On the other hand, shadow maps can have soft-edged
shadows, which ray-traced shadows cannot.
786 | Glossary

ShapeManager
shortcut keys
Keys and key combinations that start commands; for example, Cmd-S saves
a file. The function keys (Fn-F1, Fn-F2, and so on) are also shortcut keys. Also
known as accelerator keys.
shortcut menu
The menu displayed at your cursor location when you right-click your pointing
device. The shortcut menu and the options it provides depend on the pointer
location and other conditions, such as whether an object is selected or a
command is in progress.
sky
The background color of the drawing area when perspective projection is
turned on. The sky displays with a color gradient between the sky horizon
(nearest to the horizon) and the sky zenith (opposite the horizon). See also
ground plane.
smoothness
A property of mesh objects that controls the roundness of the object. Objects
with higher levels of smoothness have more faces, or tessellations.
smooth shading
Smoothing of the edges between polygon faces.
snap angle
The angle that the snap grid is rotated.
snap grid
The invisible grid that locks the pointer into alignment with the grid points
according to the spacing set by Snap. Snap grid does not necessarily correspond
to the visible grid, which is controlled separately by GRID. (SNAP)
Snap mode
A mode for locking a pointing device into alignment with an invisible
rectangular grid. When Snap mode is on, the screen crosshairs and all input
coordinates are snapped to the nearest point on the grid. The snap resolution
defines the spacing of this grid. See also Object Snap mode. (SNAP)
snap resolution
The spacing between points of the snap grid.
Glossary | 787

solid history
A property of a solid that allows you to see and modify the original forms of
the solid.
solid object
An object that represents the entire volume of an object, for example a box.
solid primitive
A basic solid form. Solid primitives include: box, wedge, cone, cylinder, sphere,
torus, and pyramid.
spatial index
A list that organizes objects based on their location in space. A spatial index
is used to locate what portion of the drawing is read when you partially open
a drawing. Saving a spatial index with a drawing also enhances performance
when working with external references. The INDEXCTL system variable
controls whether layer and spatial indexes are saved with a drawing.
specular reflection
The light in a narrow cone where the angle of the incoming beam equals the
angle of the reflected beam.
spline-fit
Uses the vertices of the selected polyline as the control points, or frame, of a
curve approximating a B-spline. This curve, called a spline-fit polyline, passes
through the first and last control points unless the original polyline was closed.
split face
A mesh face that has been subdivided along a specified vector.
STB file
For plot style table file. Contains plot styles and their characteristics.
stretch frame
In a dynamic block definition that contains a stretch action or a polar stretch
action, determines how the objects within or crossed by the frame are edited
in the block reference.
subdivision
A division, or tessellation in a mesh object. As a mesh object is smoothed, the
number of subdivisions increases.
788 | Glossary

subobject
A part of a composite object.
sub-prompt
A command prompt that instructs for a form of input to complete a command
or alter a property.
surface
A surface is a 3D object that is an infinitely thin shell. There are 3 types of
surfaces: analytic, generic, and NURBS.
surface associativity
See associative surfaces
surface normal
Positive direction perpendicular to the surface of an object.
swept solid/surface
A solid or surface created in the shape of the specified profile (the swept object)
swept along the specified path. (SWEEP)
symbol
A representation of an item commonly used in drawings. Symbols are inserted
in drawings as blocks.
symbol library
A collection of block definitions stored in a single drawing file.
symbol table
See definition table and block definition table.
system variable
A name that is recognized as a mode, size, or limit. Read-only system variables,
such as DWGNAME, cannot be modified directly by the user.
table
A rectangular array of cells that contain annotation, primarily text but also
blocks. In the AEC industry, tables are often referred to as “schedules” and
contain information about the materials needed for the construction of the
building being designed. In the manufacturing industry, they are often referred
to as “BOM” (bills of materials). (TABLE)
Glossary | 789
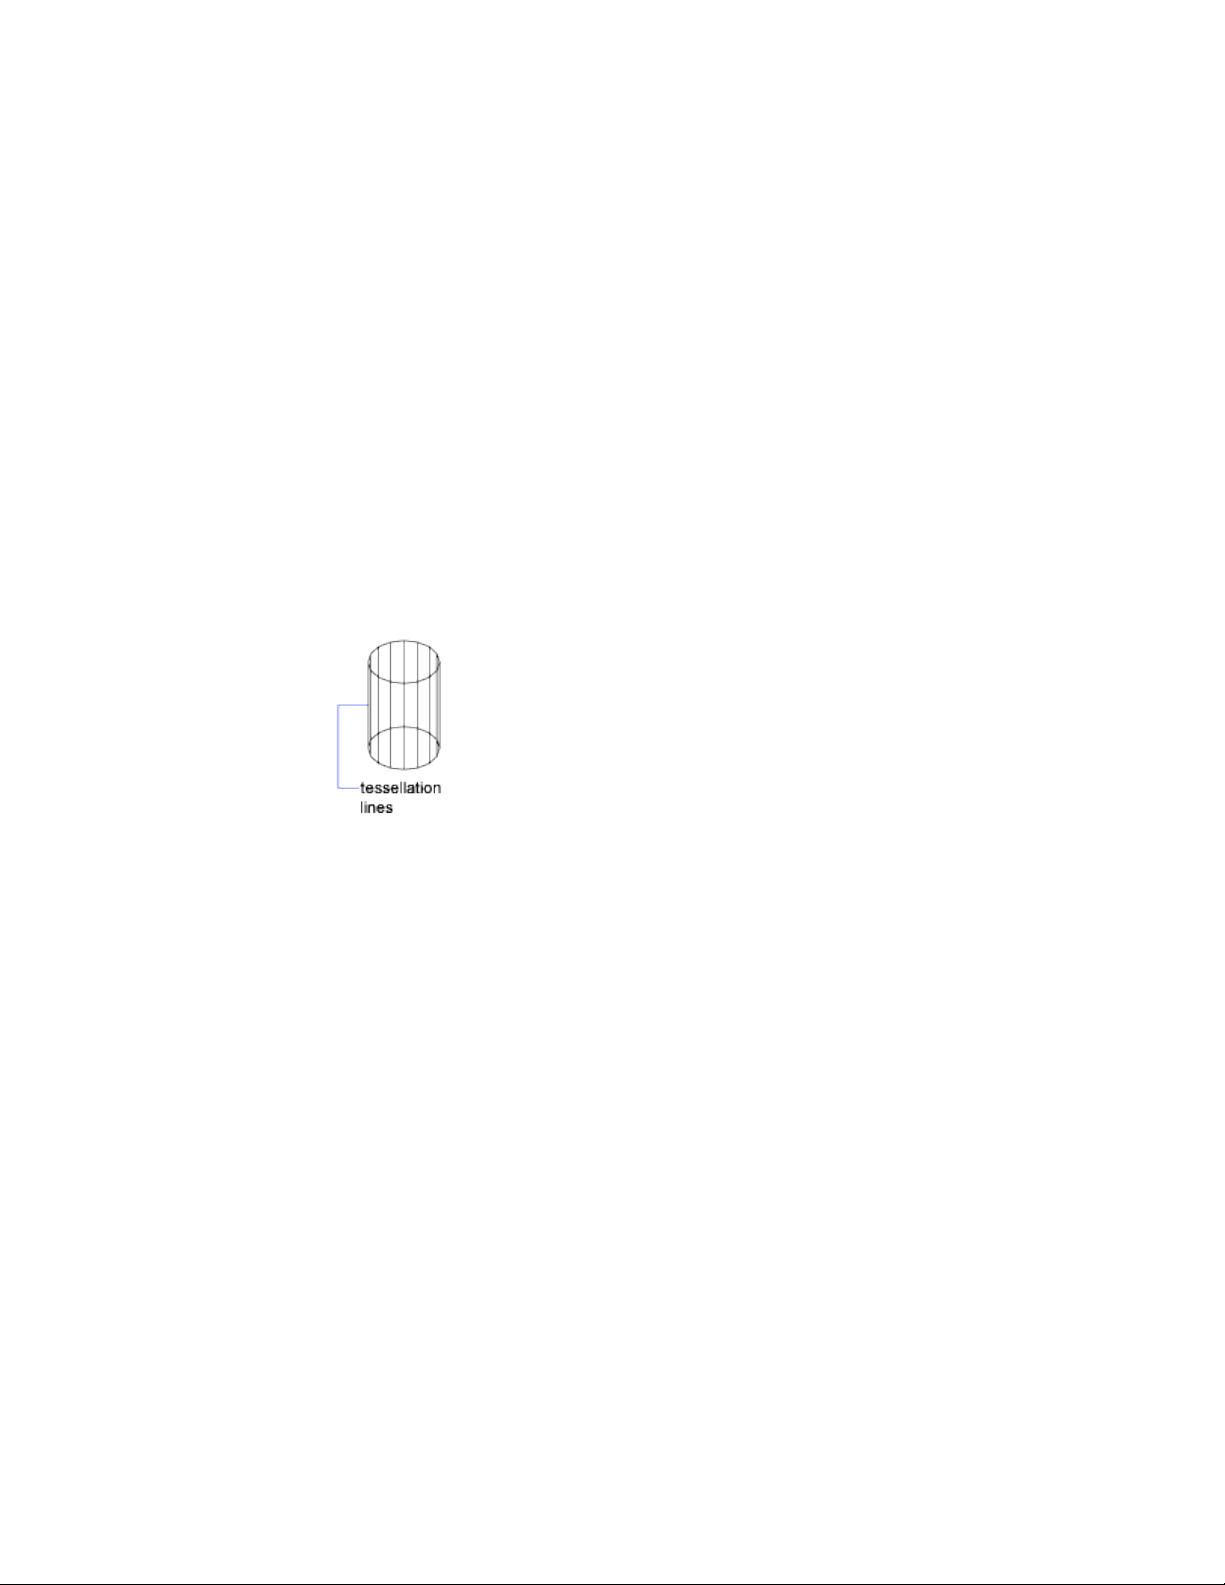
table break
The point at the bottom of a table row where the table will be split into a
supplementary table fragment.
table style
A style that contains a specific table format and structure. A table style contains
at least 3 cell styles.
temporary files
Data files created during an program session. The files are deleted by the time
you end the session. If the session ends abnormally, such as during a power
outage, temporary files might be left on the disk.
tessellation lines
Lines that help you visualize a curved surface.
In a 3D mesh object, tessellations indicate the boundaries of the mesh faces.
text style
A named, saved collection of settings that determines the appearance of text
characters—for example, stretched, compressed, oblique, mirrored, or set in
a vertical column.
texture map
The projection of an image (such as a tile pattern) onto an object (such as a
chair).
thaw
A setting that displays previously frozen layers. See also freeze. (LAYER)
thickness
The distance certain objects are extruded to give them a 3D appearance.
(PROPERTIES, CHPROP, ELEV, THICKNESS)
790 | Glossary

tiled viewports
See model viewports.
TILEMODE
A system variable that controls whether viewports can be created as movable,
resizable objects (layout viewports), or as nonoverlapping display elements
that appear side-by-side (model viewports). See also viewport.
tooltip
A small box of text that identifies or explains an object or interface element
when the cursor hovers near or over it.
tracking
A way to locate a point relative to other points on the drawing.
translucency
How light is scattered through an object.
transmittance scale
Increases or decreases the amount of energy a transparent material transmits
out to the scene.
transparency
A quantity defining how much light is let through an object.
transparent command
A command started while another is in progress. Precede transparent
commands with an apostrophe.
two sided material
The positive and negative normal of the material will be considered during
the rendering process.
UCS
See user coordinate system (UCS).
UCS definition
Each UCS definition can have its own origin and X, Y, and Z axes. Create and
save as many UCS definitions as you need.
Glossary | 791
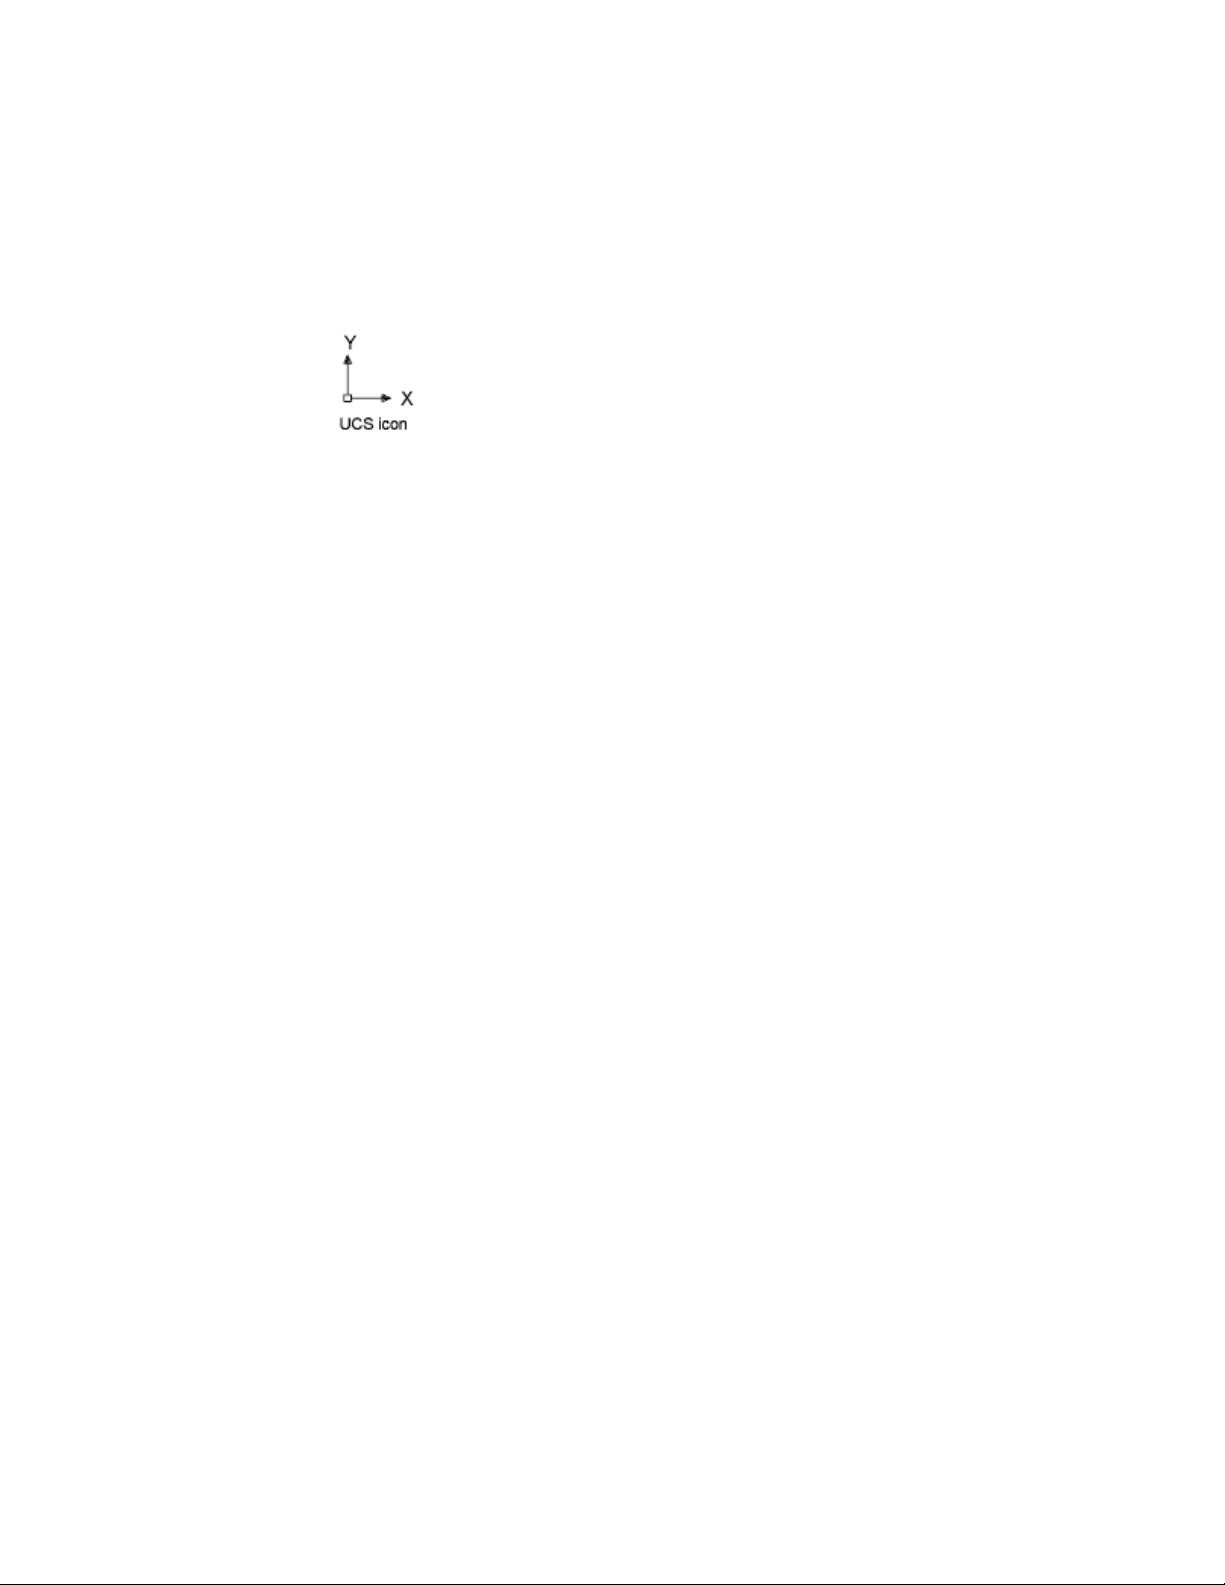
UCS icon
An icon that indicates the orientation of the UCS axes. (UCSICON)
underconstrained geometry
Objects with unsolved degrees of freedom are underconstrained.
underground
The XY plane of the user coordinate system when perspective projection is
turned on and when viewed from below ground. The underground plane
displays with a color gradient between the earth horizon (nearest to the
horizon) and the earth azimuth (opposite the horizon). See also ground plane
and sky.
up direction
A vector defining what direction is Up. By default this is the positive Z – axis
(0,0,+1).
The up direction and the north direction are always constrained such that
they are perpendicular to each other.
user coordinate system (UCS)
The active coordinate system that establishes the XY plane (work plane) and
Z-axis direction for drawing and modeling. You can set the UCS origin and
its X, Y, and Z axes to suit your needs. See also world coordinate system (WCS).
user parameter
Named user-defined variable (real number or an expression) that can be used
in expressions for dimensional constraints or other user parameters.
UVW
The material’s coordinate space. Used instead of XYZ because that is usually
reserved for the world coordinate system (WCS). Most material maps are a 2D
plane assigned to a 3D surface. The U, V, and W coordinates parallel the relative
directions of X, Y, and Z coordinates. If you look at a 2D map image, U is the
equivalent of X, and represents the horizontal direction of the map. V is the
equivalent of Y, and represents the vertical direction of the map. W is the
792 | Glossary

equivalent of Z and represents a direction perpendicular to the UV plane of
the map.
vector
A mathematical object with precise direction and length but without specific
location.
vertex
A location where edges or polyline segments meet.
view
A graphical representation of a model from a specific location (viewpoint) in
space. See also viewpoint and viewport. (3DORBIT, VPOINT, DVIEW, VIEW)
view category
A named collection of views in a sheet set that is often organized by function.
See also subset.
ViewCube
User interface element that displays the current orientation of a model, and
allows you to interactively rotate the current view or restore a preset view.
viewpoint
The location in 3D model space from which you are viewing a model. See also
view and viewport. (3DORBIT, DVIEW, VPOINT)
viewport
A bounded area that displays some portion of the model space of a drawing.
The TILEMODE system variable determines the type of viewport created. 1.
When TILEMODE is off (0), viewports are objects that can be moved and
resized on a layout. (MVIEW) 2. When TILEMODE is on (1), the entire drawing
area is divided into non-overlapping model viewports. See also TILEMODE,
view, and viewpoint. (VPORTS)
viewport configuration
A named collection of model viewports that can be saved and restored.
(VPORTS)
virtual screen display
The area in which the program can pan and zoom without regenerating the
drawing.
Glossary | 793

visual style
A collection of settings that control the display of edges and shading in a
viewport.
volumetric shadows
A photorealistically rendered volume of space cast by the shadow of an object.
watertight
A closed 3D solid or mesh that has no gaps.
WCS
See world coordinate system (WCS).
window selection
A rectangular area specified in the drawing area to select multiple objects at
the same time. See also crossing selection, polygon window selection.
wipeout object
A polygonal area that masks underlying objects with the current background
color. This area is bounded by the wipeout frame, which you can turn on for
editing and turn off for printing.
wireframe model
The representation of an object using lines and curves to represent its
boundaries.
working drawing
A drawing for manufacturing or building purposes.
working set
A group of objects selected for in-place reference editing.
work plane
Another name for the XY plane of the user coordinate system. See also elevation
and user coordinate system (UCS).
world coordinates
Coordinates expressed in relation to the world coordinate system (WCS).
794 | Glossary

world coordinate system (WCS)
The fixed coordinate system used as the basis for defining all objects and other
coordinate systems. See also user coordinate system (UCS).
X,Y,Z point filters
See coordinate filters.
xref
See external reference (xref).
zoom
To reduce or increase the apparent magnification of the drawing area. (ZOOM)
Glossary | 795

796

Index
2D Cartesian coordinates
coordinate filters 180
entering 157
x and y values 156
2D coordinates
Cartesian 156
entering 157
polar 156
2D isometric views 711
2D objects
flattened views of 3D objects 486
multi-functional grips 234
sectioning 483
simplified display 145
simulating 3D 711
2D polar coordinates 156, 159
2D UCS icon 154
2D wireframe visual style 64
3D Cartesian coordinates
coordinate filters 180
defining 3D views 62
entering 162
3D coordinates
Cartesian coordinates 162
cylindrical coordinates 163
entering 161
spherical coordinates 165
3D meshes
about 382
best practices 468
converting objects to 397
converting to 3D solids 471
creases 462, 469
creating 382
creating from other objects 393
custom meshes 399
density 459
editing 454
extruding 463, 471
faces 455
facets 455
gizmos 470
grip editing 456
legacy meshes 399
merging faces 456
mesh modeling 456
predefined meshes 403
primitives 385
properties 443
refining 460, 461, 469
repairing holes 456
selection filters 470
self-intersections 472
smoothness 457
spinning edges 456
splitting faces 463, 469
tessellation 383, 457
types of 393
3D models
3D solids 352
3D surfaces 369
3D views 72
about 339, 408
advantages 342
backgrounds 68
converting to meshes 408
converting to objects 408
cross sections 474
dynamic views 74
edge display 69
editing 408
flattened views of 486
gizmos 418
grips 418
history 441
interference problems in 368
live sectioning 480
meshes 454, 468
navigating views 73
parallel views 60
performance issues and 71, 72
perspective views 60
properties 441
rendering 738
797 | Index

shadows 68
subobjects 423
sun and sky 735
thickness 406
types of 339
viewing 409
visual styles 63
weblights 721
wireframes 404
3D Move gizmo 410, 412
3D objects
aligning 242
AutoCAD LT functionality 701
coordinates 161
edge display 69
exporting 694
extending 260
flattened views of 486
live sectioning 480
lofting 422
modifying 408
rendering 738
rotating 241
shadows 68
simulating in 2D 711
smoothness 745
subobjects 423
surfaces 369
sweeping 421
thickness 406
trimming 260
visual styles 63
wireframes 404
3D Orbit tool 73
3D printing 622, 694
3D Rotate gizmo 410, 414
3D Scale gizmo 416
3D solid edges
imprinting objects on 440
modifying 423, 429
redundant edges 437
3D solid faces
imprinting objects on 440
modifying 423, 426
redundant faces 437
rendering 740
3D solid vertices
modifying 423, 432
redundant vertices 437
3D solids
calculating geometric data for 190
chamfering 431
cleaning 437
colors 428
composite solids 366, 433
converting meshes to 471
converting objects to 342, 363
converting surfaces to 365
converting to objects 408
coordinates 161
creating 352
edges on 69, 423
exporting 694
extruding 346, 421
faces 423
filleting 431
flattened views of 486
gizmos 418
grips 418, 421
history 434, 441
imprinting objects on 440
interferences 368
lofting 350, 422
mass properties 193
meshes 393, 403
modifying 408
multi-functional grips 234
polysolids 361
pressing or pulling areas 438
primitives 441
properties 441
revolving 352, 422
separating into original shapes 436
shells 437
slicing 368
smoothness 745
solid primitives 353, 354
subobjects 423
surfaces 369
sweeping 348, 421
types 354
types of 343
798 | Index

validating 437
vertices 423
wireframes 404
3D space
3D models 339
coordinates 161
object snaps 170
UCSs 149
workplanes 148
3D surfaces 369, 408
composite solids 433
composite surfaces 435
edges 429, 440
editing 445
extending 447
faces and 426
filletting 448
modifying 423
NURBS surfaces 448
properties 442
reconstructing 449
separating into original shapes 436
surface analysis 450
trimming 446
vertices 432
3D UCS icon 154
3D views
architectural design conventions 62
changing viewpoints 63
defining 62
dynamic viewing 74
gizmos in 410
interactive 3D views 73
isometric views 62
mechanical design conventions 62
moving objects in 412
multiple UCSs 151
navigation tools 73
preset views 62
rotating 62
rotating objects in 414
scaling objects in 416
UCS orientation 63
3ds Max 750
A
absolute coordinates
2D coordinates 157
3D coordinates 163
entering 156
absolute xref paths 648
ACB files 137
ACI colors 134
ACIS files 669, 694
Acrobat PDF files
layers and 673
plotting 640
underlays 670, 671
action parameters 313
actions (user)
redoing 230
undoing 230
adaptive grid display 175
adaptive plot style adjustments 638
adding
layouts into a project 107
Adjust Distance tool 73
ADN (Autodesk Developer Network) 3
Adobe Acrobat PDF files
layers and 673
plotting 640
underlays 670, 671
aligned constraints 295
aligned dimensions 586
alignment
AutoTrack feature 183
dimension text 573, 602
dimensions 608
displaying paths for 177
equal intervals 187, 188
hatches 510, 513
isometric planes 711
lateral tolerances 581
multileaders 531
multiline text 522
object snaps 169
objects 241
previous release formats and 697
single-line text 519
text 534
Index | 799

viewport objects 100
alignment grips 313
allocating memory 71, 72
alternative fonts 545
American lighting units 715
angles
angle overrides 179
calculating 189
constraints 295
defining 3D views with 62
polar angles 178
polar coordinates 159
rotating objects by 240
snap angle 176
spotlights 731
sunlight 735
unit types 157
angular constraints 295
angular dimensions
breaks in 605
creating 592
definition points 598
spacing between 608
angular units 41
anisotropic light distributions 721
annotation objects
annotative styles 494
blocks as 497
creating 492
defined 490
dimensions as 496, 583
hatches as 499
leaders as 497
model space and 86
multi-functional grips 234
multileaders as 497
orientation 503
previous release formats and 696
scale representations 501
scaling 87, 490, 491
text 495, 517
tolerances as 496
types of 489
updating 491
updating scale 501
visibility 500
visual fidelity 49, 493, 695
annotational constraints 297, 299
annotative dimensions 583
Annotative property 490, 492
aperture box (AutoSnap) 171
append extend surfaces 447
application window
settings 34
applications
exporting files to 692
importing files from 669
ObjectARX 703
opening attribute extraction
files 332
rendered images and 750
arc length dimensions 596, 605
archiving
drawings with xrefs 652
arcs
dimensioning 589, 593, 596
drawing 201
fillet arcs 266
joining to polylines 274
linetypes 137
modifying 220
polyline arcs 207
PostScript rendering 694
rendering 744
revision cloud segments 220
tangent to lines 205
areas
calculating 189, 217
combining calculations 191
subtracting 192
array objects 245
arrays of objects
associativity 245, 248
creating 244
editing 248
limitations 251
path arrays 246
polar 247
properties 248
rectangular 245
arrow grips 482
800 | Index

arrowheads
customizing 570
dimension arrowheads 562, 570
leader styles 533
artifical lighting 717
Asian fonts 544, 549
Asian set 543
association points of dimensions 601
associative arrays 245, 248
associative dimensions
about 563
annotation objects and 496
association points 601
changing associativity 601
leader objects and 532
limitations 564
modifying 597, 600
previous release formats and 699
updating 564
associative hatches
creating 506
defined 504
exploding 271
extents 514
associative surfaces
about 370
creating 345, 380
associative text 530
atmospheric rendering effects 747
attached xrefs
demand loading and 651
Internet-based xrefs 708
notification of 645
relocated xrefs 649
updating 650
attaching
block attributes 324, 326
files to drawings 669
PDF underlays 671
raster images 683
xrefs 644, 646
attenuation of lights 733
attribute definitions 325
attribute extraction templates 328
attribute tags 325
attributes of blocks 324
auditing drawings
examples 53
Auto-list feature 524
AutoCAD
previous releases 695
working in AutoCAD and AutoCAD
LT 700
Autodesk 3ds Max 750
Autodesk Architecture 750
Autodesk Authorized Training Centers 2
Autodesk Consulting 3
Autodesk Developer Network (ADN) 3
Autodesk e-learning program 3
Autodesk Official Training Courseware 2
Autodesk products
information resources 2
late-breaking information about 3
Autodesk VIZ 750
AutoFill feature 560
automatic saves 54
AutoSnap 169, 171
AutoStack feature 527
AutoTrack feature 183
axes
coloring 35
constraining movement to 413
constraining rotation to 415
constraining scale to 416
positive direction of 149
right-hand rule 149
WCS 148
B
B-splines 378
back faces of 3D solids 740
back, moving objects to 147
background colors
drawings 35
hatches 509
text 521
backgrounds
rendering effects 747
underlays 675
visual styles and 68
Index | 801

backup files
project data 106
restoring drawings from 54
saving 48
base grips 481
base points
snap base point 176
splines 276
baseline dimensions 586
basic dimensions 580
beam angle (spotlights) 731
beveled corners 266
Big Fonts
properties 544
bills of materials (BOM) 556
binding
dependent named objects to
drawings 663
object definitions 663
xrefs to drawings 652
bisecting objects with construction
lines 216
bitmaps (BMP images)
exporting 693
importing 680
bitonal raster images 688
blank text objects 231
blending surfaces 375
Block Attribute Manager
duplicate tags 335
reordering prompts 326
block attributes
about 324
annotative 492
attaching 326
attribute definitions 325
attribute extraction templates 328
attribute tags 325, 329, 335
attribute values 335
constant 324
definitions 335
editing 326
error handling 332
exporting data 327
extracting data from 327
invisible 324
modifying 334
nested blocks 332
removing 336
stand-alone 327
updating 335
variable 324
block definitions
about 307, 317
annotations 489, 497
base points 317
block attributes 324
block libraries 323
colors 320
copying 323
creating 317
cross sections as 483
drawing files as 309, 318
fields in 538
in-place editing 656
inserting blocks 309
linetypes 320
lineweights 320
model space settings 87
modifying 333, 656
object properties 320
removing 316
updating 333
block libraries
creating 323
inserting blocks 310
updating block definitions 334
block references
about 307
action parameters 313
annotations and 497
associative dimensions and 564
block attributes 324
clipping 653
colors 321
editing 333, 656
exploding 271, 337
grips 237
groups compared to 227
inserting 309
layers and 308
leader objects and 534
802 | Index

linetypes 321
model space settings 87
nested 322
orientation 503
paper space and 319
pasted text as 529
properties 320
saving changes to 659
scaling 309
table cells and 559
updating 336
visibility 314
xrefs vs. 319
blocks 307, 316
BMP files (bitmaps)
exporting 693
importing 680
BOM (bills of materials) 556
borders (table cells) 559
boundaries
boundary edges 256
gaps in 219, 508
layout viewports 94
polylines 198, 208
recreating 515
regions 218
zooming to 58
boundary sets
defined 198
hatches 507
polylines 208
bounded areas 438
bounded hatches 504
boxes
3D solids 354
mesh boxes 385
modifying 441
breaking
objects 270
breaks in dimensions 605
brightness 687
bringing objects to front 147
bulge magnitude 372
bulleted lists 523
bullets 523
BYBLOCK setting
block definitions 320
C
calculating
angles 189
areas 189
circumferences 190
command prompt calculator 193
distances 189
model space scale factors 88
perimeters 190
point coordinates 189
calculators
command prompt calculator 193
callout blocks
annotations 489, 497
projects 108
CALS files 680
cameras
section objects and 483
canceling commands 230
candelas 725
caps 596
Cartesian coordinates 156, 157, 162
CDF files (comma delimited) 331
cells (tables)
address format 560
AutoFill feature 560
blocks in 559
cell ranges 560
formulas in 560
merging 558
modifying 557
text in 559
center location overrides 591
center marks in dimensions 563, 590
centerlines in dimensions 563, 590
centers of gravity 193
chamfering
3D solids 431
hatch boundaries 267
objects 266
characters
formatting 523, 541
Index | 803

height 547
international 543
PostScript rendering 694
stacking 527
Unicode text 706
checking interferences 368
checking spelling 553
CIP (Customer Involvement Program) 3
circles
calculating geometric data for 190
dimensioning 590, 593
donuts 209
drawing 205
grips on 235
isometric circles 210, 712
modifying 220
PostScript rendering 694
rendering 744
circular references between xrefs 662
circumferences 190
clamp curves 379
cleaning
3D solids 437
clearing screen 35
screen display 231
clearing screen 35
Clipboard (Windows) 231
clipping
blocks 653
layout viewport boundaries 94
underlays 677
xrefs 653, 667
clipping boundaries
blocks 653
layout viewports 94
raster images 685, 686
underlays 677
xrefs 645, 653
clipping planes
3D views and 74
closed areas 438
closed curves 379
closed meshes 400
closed polylines 207
code pages 706
coincident grips 234
collaborative project use 112
collaborative web sites 708
collected leader lines 531
color books 137
color libraries 134
color palettes 134
color-dependent plot style tables
about 633
object color and 623
plot styles in 632
color-dependent plot styles 632
colors
3D solids 428
ACI colors 134
application window elements 35
applying 134
backgrounds 675
blocks 320, 321
changing 136
color books 137
color intensity 636
color palettes 134
converting to grayscale 637
current color 134, 135
defaults 121
DIC color guide 135
dimension elements 566
display speed and 691
dithering 637
edges 431
fills 504
filtering selection sets by 224
grips 313
hatches 504
layer property overrides 127
layers and 119, 121, 124
lighting 717, 718, 720, 730, 733
masking objects with 516
names 134
NURBS surfaces 453
Pantone color books 135
plot styles 636
RAL color sets 135
raster images 681, 688
screening 98, 636
shades 509
804 | Index

table elements 559
tints 509
True Colors 135
underlays 675
visual styles and 67
xref layer properties 645
columns (multiline text) 528
columns (tables)
formatting 559
modifying 556
combining
regions 218
solids 366, 433
comma-delimited files (CDF) 331
command line
colors in 35
switches 37
syntax 37
command line switches
customizing program startup 37
command prompt calculator 193
commands
canceling 230
command prompt calculator 193
Dynamic Input and 166
compass (ViewCube) 75
composite regions 218
composite solids
3D solids 366, 433
history 434
modifying 435
modifying original components 435
selecting subobjects 419
separating into original shapes 436
composite surfaces 435
composite tolerances 613
compound objects 271
compression
JPEG files 693
Conceptual visual style 64
cones
3D solids 356
mesh cones 386
modifying 441
configuring
Render 747
conflicting xref names 662
conical helixes 215
constant block attributes 324
Constrained Orbit tool 73
constraining
object movement 413
object rotation 415
object scaling 416
constraint bars 290
constraint icons 289
constraint parameters
blocks 315
constraint points 287
constraints
annotational constraints 297
applying 296
applying automatically 293
AutoCAD LT functionality 701
constraint bars 290
contraint points 287
dimensional constraints 295
displaying 289, 299
dynamic blocks 315
dynamic constraints 297
editing 289, 299
editing constrained objects 291, 300
fix constraints 288
formulas 301
fully constrained drawings 283
geometric constraints 284, 285
inferring 293
multiple constraints 288
object snaps and 293
parameters 301, 302
Parameters Manager 315
parametric constraints 282
reference parameters 298
relaxing 284
removing 284
surfaces 381
unconstrained drawings 283
underconstrained drawings 283
construction lines
drawing 216
modifying 220
Index | 805

Content palette
inserting blocks from 310
contextual fields 538
continued dimensions 586
continuity (surfaces) 372, 450, 451
contrast in raster images 675, 687
control points on splines 212, 275, 379
control vertices 211, 448, 449
converting
3D models to objects 408
colors to grayscale 637
dimension units 578
dimensions to annotations 496
drawing units 40
drawings to other formats 692
files to AutoCAD LT 700
fonts 546
meshes to 3D solids 471
nonassociative dimensions to
associative 601
objects to 3D solids 363
objects to meshes 397
objects to surfaces 377
surfaces to 3D solids 365
text to annotations 495
Coons surface patch meshes 397
coordinate filters 180
coordinate systems
origin 156
types of 148
WCS (world coordinate system) 148
coordinates
2D coordinates 157
3D coordinates 161
absolute values 156
calculating 189
coordinate filters 180
Dynamic Input and 167
entering 156
relative values 156
types of 148
unit types 157
coplanar faces 742
copying
arrays of objects 244
block definitions 323
demand loading and 668
edges 431
faces 427
formulas to table cells 560
grip modes and 236
hatch properties 513
multiple copies of objects 243
object properties 119
objects 232, 242
objects to other drawings 47
offsetting objects 251
corners
beveled 266
chamfering 266
filleting 263
correcting
mistakes 230
spelling 553
CPolygon selection 223
crashes, recovering from 55
creases
limiting distortion 469
mesh objects 462
cross sectioning
2D and 3D sections 483
live sectioning 480
lofting objects and 350, 422
section objects 474
crosshairs
coloring 35
crossing polygon selection 223
crossing selections 223
CTB files 623, 632, 633
current viewports 83
cursor
Dynamic Input and 167
locking movement 179
moving in tables 559
polar tracking 177
restricting movement 173
rubber-band line 177, 185
curved objects
analyzing 453
clamp curves 379
closed curves 379
drawing 201
806 | Index

modifying 220
open curves 379
rendering 744
custom grips 313
custom objects 703
custom properties
grips and 313
layouts and projects 110
Customer Involvement Program 3
customizing
arrowheads 570
dimension text 576
drawing environment 34
hatches 509
object selection 225
visual styles 65
cutaway views 74
cutting
cutting edges 256
objects 231
slicing 368
cutting edges 256
cutting planes
live sectioning 480
section objects 474
slicing solids 368
cylinders
3D solids 357
mesh cylinders 387
modifying 441
cylindrical coordinates 163
cylindrical helixes 215
D
damaged drawing files 52
data extraction
block attributes and 327
data types in tables 559
databases
block attribute data in 328
dates
angle of sun and 735
datum
composite tolerances 613
geometric tolerances 612
ordinate dimensions 594
deleting
3D solid history 434
back faces 740
block attributes 336
block definitions 316
clipping boundaries 687
constraints 284
creases 463
dimension breaks 606
duplicate objects 231
edges 430
faces 428
fillets 265
geometric constraints 285
group definitions 229
hidden surfaces 740
layer property overrides 127
layers 124, 125
layouts 107
linetypes 138
multiline vertices 280
objects 231
objects from groups 229
text styles 541
unused named objects 231
vertices 433
demand loading (xrefs)
about 666
saving xrefs with indexes 667, 668
temporary xref file copies 668
updating xrefs 651
density of mesh objects 459
depth cueing 747
deselecting objects 221, 223
DesignCenter
copying block definitions 334
detaching
raster images 685
underlays 670, 672
xrefs 649
deviation tolerances 580
diameter constraints 295
diameter dimensions 588
creating 588
definition points 598
Index | 807

text 572
DIC color guide 135
dimension lines
angular dimensions 593
defined 562
leader objects vs. 530
linear dimensions 585
Dimension Style Manager
creating styles 565
dimension values 578
fractions 583
text options 571
text styles 576
dimension styles
about 565
applying 609
listing 565
modifying 566
overriding 609
system variables 565
dimension text 571
dimensional constraints
about 295
annotational constraints 297
applying 296
displaying 299
dynamic constraints 297
editing 299
editing constrained objects 300
illustrated 282
parameters 302
reference parameters 298
surfaces 381
dimensional input 167
dimensions
about 561
alignment 573, 608
angular 592
annotations 489, 496, 583
arc length 596
arrowheads 562
associative 563, 597, 600
basic 580
breaks in 605
creating 561, 584
customizing contents 576
dimension lines 562, 566
dimensional constraints 295
elements of 562
exploded 271, 563, 599, 600, 603
extension lines 562
grips 597
inspection 604
jog lines 604
lateral 580
linear 584
model space settings 87
modifying 596, 597
nonassociative 563, 598, 601
ordinate 594
previous release formats and 697,
699
radial 588
scale 583
spacing between 608
styles 565, 609
text 562, 571, 602
text styles 576
types 561, 584
units of measurement 576, 577
values 577
direct distance entry 157, 185
direction
axes 149
direction grips 482
disassociated dimensions 598
disassociating compound objects 271
discontinuities 449
display drivers 71
display performance 145, 691
displaying
3D solid history 434
alignment paths 184
annotative objects 500
constraints 289
dimensional constraints 299
draw order 147
drawing properties 43
drawing units 87
gizmos 410
grid 174
grip tools (gizmos) 410
808 | Index

grips 235
isolated objects 148
layers 121, 128
lights 728
linetypes 141
lineweights 143
originals in composite solids 434
overlapping objects 147
plot areas 618
plot styles 636
Quick View images 46
raster images 691
rendered images 749
shadows 68
simplifying 145
underlay frames 677
distances
calculating 189
equal intervals 186
fuzz distance 274
polar distances 179
specifying 185
distant lights 717, 727, 748
distributing
dimensions 608
items in arrays 247
leader lines 531
dithering 637
dividing
objects into equal segments 187,
188
objects into original shapes 436
docked palettes 36
document materials 737
doglegs 530, 588
donuts
drawing 209
exploding 271
simplified display 145
double click actions
editing 232
downloading
AutoCAD WS files 708
draft analysis 450, 453
draft quality display of raster images 691
draw order
changing 147
hatches 512
drawing
3D solids 354
arcs 201
boxes 354
circles 205
cones 356
construction lines 216
curved objects 201
cylinders 357
direct distance entry 185
donuts 209
ellipses 210
helixes and spirals 214
isometric circles 210, 712
layout viewports and 92
lines 196
multilines 199
object properties 117
objects 195
Ortho mode 177
parametric drawing 282
polygons 198, 207
polyline arcs 207
polylines 196
polysolids 361
precision 148
pyramids 359
rays 216
rectangles 198
reference points 216
revision clouds 219
spheres 358
splines 211
squares 198
tangent arcs and lines 205
tori 360
triangles 199
viewports and 84
wedges 355
wide polylines 207
drawing extents 58, 618, 624
drawing files (DWG)
backups 54
Index | 809

converting other files to 669
file locations 52
finding 43, 51
inserting as blocks 309
opening 43
previous release formats 695
repairing 52
saving 48
drawing interchange format (DXF files)
converting to DWG 669
exporting 693
drawing orientation 618, 627
drawing properties
displaying 43
finding files with 43
Drawing Recovery Manager
recovering work 55
drawing sets
publishing 641
drawing templates
creating 42
opening 42
saving 48
starting drawings with 42
startup routines and 37
drawing units
about 40
angular units 41
converting 40
linear units 41
model space settings 86
precision 42
rounding off 42
drawings
2D sections of 3D models 474
3D views 73
annotations in 489
archiving 652
background colors 35
colors 134
converting to AutoCAD LT 700
copying between 47
cross sectioning 474
exporting 692
extents 58
file formats 48
file locations 46, 52
finding 43, 51
fitting on paper 625, 628
fully constrained drawings 283
importing files into 669
incremental saves 49
information about 5
inserting as blocks 318
international files 50
Internet-based 706
layers 119
layouts 89, 90, 102
lighting 713
measurement units 40
model space 85
multiple open drawings 46
naming 50
object properties 117
opening 43, 706
orientation 618, 627
page setups 615
partial saves 48
plot settings 615
plotting 621
previewing 46, 640
previous release formats 699
projects 102
publishing 640
rendering 738
repairing damaged drawings 52
saving 48, 706
saving as templates 42
scaling 86
sharing 705, 707
starting 39
switching between 47
templates 42
text in 517
unconstrained drawings 283
underconstrained drawings 283
underlays 670, 671
viewports 81
views 57
xrefs 643
DST files (project data)
creating 105
810 | Index

team member access to 112
duplicates, removing 231
duplicating objects 242
DWG files
saving underlays as 680
DWG to PDF driver 640
DWT files
layout creation templates 111
saving layouts as 101
starting drawings 42
DXB files
converting to DWG 669
DXF files (drawing interchange format)
converting to DWG 669
exporting 693
exporting block attribute data 331
saving 48
DXX files 331
dynamic block definitions
about 311
block attributes 324
inserting blocks 309
dynamic block references
about 311
block attributes 324
grips 313
modifying 315
restoring 315
dynamic blocks
action parameters 313
dynamic constraints 297, 299
Dynamic Input feature 166
dynamic panning 57
dynamic prompts 168
dynamic UCSs 152
dynamic viewing 74
E
e-learning program (Autodesk) 3
earlier versions of AutoCAD 699
edge-defined meshes 397
edges
3D solid edges 423
boundary edges 256
colors 431
copying 431
creases 462
customizing 69
cutting edges 256
deleting 430
imprinting objects on 440
mesh edges 397
modifying 429
redundant edges 437
rendering 744
surfaces 440
trimming to 446
editing
3D models 408
3D solids 408, 426, 432
associative arrays 248
AutoCAD WS files 707
block attribute definitions 326
block attributes 334, 335
block definitions 333, 656
block references 333, 656
columns of text 528
composite solids 435
constrained objects 291, 300
constraints 289, 299
custom objects 703
dimension styles 566
dimensions 596, 597
dynamic blocks 315
edges 429
faces 426
fields in text 537
fills 512
gizmos 410
grip modes 233
grip tools (gizmos) 410
groups 229
hatches 512
helixes 279
layer objects 122
layers 124
layout and project properties 110
layouts in a project 107
leader objects 530
meshes 454
multilines 280
Index | 811

objects 220, 232
plot style tables 633, 635
plot styles 636
polylines 272
revision clouds 220
separating solids into shapes 436
spirals 279
splines 274
surfaces 408, 423, 426, 435, 445
tables 556, 559
text 549
text styles 541
underlays 674
vertices 432
visual styles 65
xrefs 656
educational products 645
electronic drawing sets
publishing 641
ellipses
calculating geometric data for 190
drawing 210
grips on 235
modifying 220
PostScript rendering 694
elliptical arcs
modifying 220
PostScript rendering 694
empty text objects 231
EPS files
exporting 694
equations
parametric constraints 301
erasing objects 231
errors
block attribute extraction files 332
correcting 230
reporting 55
xref error messages 661
evaluating new layers in drawings 131
Excel spreadsheets
opening attribute extraction
files 332
exploded dimensions 563, 600
exploding
block references 271
blocks 337
compound objects 271
objects 271
xrefs 272
exporting
3D solids 694
ACIS SAT files 694
block attribute data 327, 328
drawings 692
DXF files 693
export file formats 692
layer states 133
PDF files 692
plot files 640
PostScript files 693
raster files 693
rendered images 749
STL files 694
expressions 193
Parameters Manager 302
parametric constraints 301
extending
3D objects 260
chamfered objects 268
filleted objects 264
objects 258
splines 277
extension lines
angular dimensions 593
appearance 567
arc length dimensions 596
arcs and 589
breaks in 605
defined 562
oblique 588
origins of 585
properties 567
text on 571, 574
external references (xrefs)
about 643
archiving drawings with 652
attaching 644, 646
Autodesk Educational Products 645
binding 652, 659
blocks and 310, 319
circular references 662
812 | Index

clipping 653, 667
copying 667
defined 643
demand loading 651, 667, 668
detaching 649
editing 656
error messages 661
exploding 272
External References palette 645
fields in 538
freezing layers of 667
Internet-based xrefs 708
layer properties 645
log files 663
missing 44, 661
name conflicts 662
nested 646
notifications about 645, 649, 650
overlays 646
paths 647, 648, 668
projects and 107
properties 659
reloading 650
relocated xrefs 649
saving changes to 659
saving with indexes 667, 668
temporary file copies 668
underlays as 670, 671
unloading 666
updating 643, 650
External References palette
displaying 645
raster image information 688
externally referenced dimension
styles 566
extracting
block attribute data 327, 328
geometric data 188
extruding
faces 471
mesh faces 463
objects 421, 438
extruding objects 346
F
face counts 744
face edges
offsetting 253
face normals 740
face views 78
faces of 3D solids
colors 428
coplanar faces 742
copying 427
creases 462
edge display 69
extruding 463, 471
face styles 65
imprinting objects on 440
intersecting faces 742
mesh faces 461, 744
mesh objects 455
modifying 423, 426
redundant faces 437
rendering 740
splitting 463, 469
facet edges 69
faceted lighting 66
faceted mesh objects 455
faceted surfaces 393
fade settings
raster images 687
underlays 675
xref objects 657
falloff angle of spotlights 731
field angle of spotlights 731
fields (databases)
attribute extraction and 328
fields (text)
about 536
AutoCAD LT functionality 700
previous releases of AutoCAD
and 539
file formats
attribute extraction files 330
export file formats 692
importable files 669
pasted objects 232
plot files 640
Index | 813

plottable formats 640
PostScript formats 693
raster formats 681, 693
rendered images 749
saving drawings 48
saving in older formats 699
file input and output commands 706
files
backups 54
block attribute data 327
default locations 46
exporting 692
finding 43
importing 669
large objects in 45
layouts and projects 102
opening 43
publishing 640
repairing damaged files 52
saving 48
search paths 52
Fill mode 145
filleting
3D solids 431
objects 263
splines 277
surfaces 448
fills
about 504
boundaries 505, 515
gradient fills 509
modifying 512
plot styles 639
PostScript rendering 694
properties 511
solid fills 505, 509
turning off display 145
wipeout objects 516
filter colors of lighting 730
filtering
layers 123
object selection 224
subobject selection filters 420, 470
finding
drawing files 43, 51
Help topics 2
raster images 690
text 551
underlay files 679
fit points in splines 275
fit points on splines 213, 379
fitting
dimension text 571
Fix constraints 288
fixed-length extension lines 569
fixtures (lighting) 714, 735
flat lighting 66
flatshot objects 486
flattened views of 3D objects 486
FLIC files 680
flip grips 313
flipping
arrowheads 570
lights 729
objects 254
floating palettes 36
floating properties 320
FMP files (font mapping) 546
fog effects 747
folders
file locations 46
font mapping files 546
fonts
alternative fonts 545
Asian set 543
assigning 542
Big Fonts 544
converting 546
file locations 52
international sets 543
mapping 546
PostScript 545
previous release file formats and 698
proxy fonts 543, 545
substitute fonts 545
TrueType 543
types of 542
Unicode 543
forcing internal lines 572
foreshortened radius dimensions 591
form tolerances 611
814 | Index

formatting text
character formatting 541
fields 537
multiline text 521, 523
stacked text 526
table cells 559
formulas
copying 560
inserting in table cells 560
parametric constraints 301
fractions 521, 526, 583
frames
underlay frames 677
Free Orbit tool 73
free weblights 721
freezing
layers 121
layers in layout viewports 96
xref layers 667
front views 62
front, moving objects to 147
FTP sites
opening Internet drawings 706
saving drawings to 706
full xref paths 648
fully constrained drawings 283
functions 303
fuzz distance 274
G
G0 and G1 continuity 372, 451
G2 curvature 373, 452
gaps between objects 270
gaps in boundaries 508
Gaussian curvature 453
Geo SPOT files 680
geographic locations
angle of sun 735
geometric constraints
about 284
applying 285
applying automatically 293
constraint points 287
displaying 289
editing 289
editing constrained objects 291
fix constraints 288
illustrated 282
inferring 293
multiple constraints 288
relaxing 284
removing 284, 285
surfaces 381
geometric tolerances
about 610
composite tolerances 613
datum reference frames 612
lateral tolerances 580
material conditions 612
projected tolerances 613
geometry
object geometric data 188
projecting 447
rendering 742
trimming edges with 447
gizmos
3D meshes 457
3D models 418
about 410
displaying 410
mesh objects and 470
moving objects with 412
rotating objects with 414
scaling objects with 416
settings 412
switching 411
global linetype scale factor 140
goniometers 725
goniometric diagrams 722
Gooch face style 65
gradient fills
creating 509
simplified display 145
graphics cards 71
grayscale 637
grid
displaying 173
snapping to 173
grid limits
calculating 88
overriding 174
Index | 815

zooming to 58
grip modes 233
grip tools (gizmos) 410
grips
3D meshes 456
3D solids 418, 421
blocks 237
coincident 234
constrained objects 291, 300
copying objects with 236
dimension lines 599
dimension text 602, 603
dimensional input 167
dimensions 597
display options 235
editing objects with 233
gizmos 410
grip tools (gizmos) 410
hatches 514
helixes 279
jog lines 604
leader objects 532
multi-functional 234, 272
non-associative hatch objects 233
polylines 233
quadrant grips 235
section objects 481
selecting 235
splines 233, 274
surfaces 418, 421
tables 557
text objects 528, 550, 551
tolerances 611
types of 313, 418
underlay files 674
grouping
layers 128
grouping layers
viewport overrides and 126
groups
about 227
adding objects to 229
creating 227, 228
deleting 229
editing groups 229
editing objects 229
layer 128
names 228
removing group definition 229
removing objects from 229
reordering objects in 229
selecting 228
selecting objects in 228
ungrouping 229
groups of projects 110
guide curves 344, 422
gutters between text columns 529
H
handdrawn effects 69
hanging indents 525
hardware
acceleration 71
linetypes and 137
hatches
about 504
alignment 513
annotations and 489, 499
applying 504
associative 504, 506
background colors 509
boundaries 505, 515
bounded hatches 504
chamfering boundaries 267
customizing 509
density 511
draw order 512
exploding 271
file locations 52
filleting boundaries 263
gradient fills 509
islands within 505, 506
ISO patterns 509
large or complex drawings and 507
model space settings 87
modifying 512
nonassociative 506
orientation 503
origin point 510
pattern libraries 509
pre-defined 509
816 | Index

properties 511, 513
rotating 513
scaling patterns 510, 513
simplified display 145
solid fills 505
styles 505, 506
transparency 511
unbounded hatches 504, 511
hats 596
height
table rows 556
text 523
helixes
drawing 214
modifying 279
Help
displaying 1
late-breaking product information 3
Readme topic 3
searching 2
hexagons 199
hidden objects 621, 629
hidden surfaces 740
Hidden visual style 64
hiding
annotative objects 501
hatch boundaries 511
image boundaries 685
isolating objects 148
layers 121
paper space objects 630
raster images 691
underlay frames 677
highlighting
objects 226
suppressing 692
visual styles and 66
histories of 3D solids 434, 441
history of online files 708
holes in 3D solids 438
holes in meshes 456
hollow objects 437
Home view 80
hook lines 530, 588
horizontal dimension text 574
horizontal dimensions 585
horizontal text 549
hotspot angle of spotlights 731
I
IES photometric data files 721, 724
IG4 files 680
imperial units
converting to metric 40
linetype definition file for 138
importing
ACIS SAT files 669
files into drawings 669
layer states 133
layouts into a project 107
named page setups 616
text 529
imprinting objects on 3D solids 440
in-place reference editing
about 658
inheritance and 659
saving changes 659
undoing changes 659
In-Place Text Editor
columns 528
fonts in 543
indents and 525
multiline text 520
table text and 558, 560
incremental saves 49
indenting paragraphs 525
inferring constraints 293
infinite lines 216
inheritance
blocks 320
in-place reference editing and 659
joined objects 274
initializing layouts 622
inserting
blocks 309, 559
drawing files as blocks 309
fields in text 536
formulas 560
objects at equal intervals 187
inspection dimensions 604
inspection rates 605
Index | 817

installation
color books 137
intensity of light 730
interface
customizing 34
interferences 368
International (SI) lighting units 715
international character sets 50, 543, 706
Internet
attaching xrefs from 708
FTP sites 706
network access 705
opening drawings from 706
raster images from 684
saving drawings to 706
sharing drawings on 705
Internet-based drawings 706
intersecting objects
composite solids and 367
dimension breaks 607
edges 69
interferences 368
multilines 281
regions 218
rendering intersecting objects 742
self-intersections 472
trimming 256
intervals on objects 186, 187, 188
intranets 705
inverting
layer groups 129
invisible block attributes 324
islands
hatch patterns and 505
island detection styles 506
ISO 8859 Latin 1 character set 694
ISO hatch patterns 509
ISO pen widths 138
isolating objects 148
isoline edges 69
isometric circles 210, 712
isometric drawings 711
isometric planes 711
Isometric Snap/Grid mode 711
isometric views
2D views 711
3D views 62
Isotropic distribution of lights 722
J
JFIF files 680
jitter edge effect 69
jog lines in dimensions 604
jogged radius dimensions 591
jogged segments in section objects 479
joining
line join styles 639
objects 270
polylines 274
JPEG files
attaching 680
exporting 693
justified text
defined 521
dimension text 573
settings 522
K
kinks in splines 276
knots on splines 276
L
L symbol (least material condition) 612
label blocks
annotations 489, 495
projects 108
labels (text) 517
lamp color 718, 720, 733
lamp intensity 718, 720, 733
landings
dimension text 588
multileader leader lines 530, 531
landscape orientation 618, 627
languages
previous release file formats 698
Unicode text 706
working internationally 706
large objects 45, 50
818 | Index

LAS files (layer states) 133
lateral tolerances
displaying 580
stacked text in 526
layer group rules 129
layer grouping
unreconciled new layers 131
layer groups 128
layer indexes 667, 668
layer properties
blocks and 320
xref properties 645
Layer Properties Manager
layer names 123
property overrides 126
layer rules
dynamic group 129
layer states 132, 133
Layer States Manager
restoring layer states 132
layers
about 119
block elements and 308
colors 121, 124, 136
creating 123
current 123
default properties 121
deleting 124, 125
displaying 128
exporting layer states 133
filtering 123
freezing 96, 121
grouping 128
hiding 121
importing layer states 133
inverting groups 129
LAS files 133
layer 0 120
layer states 132
layout viewports and 96
linetypes 121, 124, 139, 645
lineweights 121, 124, 142, 144
live sectioning and 481
locking 120
modifying 124
modifying objects on 122
moving objects to another 124,
136, 139, 144
naming 123, 124
overriding properties 122, 126
plot styles 121, 634
preventing selection 224
previous release formats and 696
properties 124
reconciled 131
referenced 124
restoring layer states 132
saving 132
selecting 123
settings 124
sorting 128
thawing 121
transparency 121, 147
turning on or off 121
underlays and 671, 673
undoing changes 124
unlocking 120
unreconciled 131
unused 124
visibility 92, 121
xrefs and 645, 667
Layers palette
grouping layers 128
sorting layers 128
unreconciled new layers and 131
layout creation templates 111
layout templates 101
layout viewports
about 89
accessing model space from 92
aligning views in 100
annotations and 490, 491
creating 93
drawing in 92
freezing layers in 96
linetypes in 99
magnifying 92
modifying views in 92
multiple 93
plotting 620
resizing 94
rotating views in 101
Index | 819

scale 93
screening objects in 98
shaded 620
turning on or off 98
views in 94
visibility in 96
layouts
adding 91
dimensioning in 584
initializing 616, 622
layer visibility 92, 121
layout tabs 89
layout templates 101
layout viewports 89
lineweights in 143, 620
named layouts 91
opening 46
orientation 503, 618, 627
page setups 615
paper size 617
plot scale 620
plot settings 615, 624, 627
plot style tables 632
plotting 621
previewing 46
projects and 105, 107
shaded viewports 628
switching to model space 47
work process 91
layouts in projects
modifying 107
named page setups and 621
names and numbers 107
opening 107
page setups 111
placeholder fields in 536
Project Manager 103
properties 110
status 113
subsets 109
templates 105, 111
working with 107
leaders (leader lines)
annotations 489, 497
associativity and 530, 532
automatically creating 572
blocks in 534
breaks in 605
creating 530
defined 530
grips 532
landings 531
modifying 530
multileaders 530, 532
multiline text in 534
ordinate dimensions and 595
styles 533
leading (line spacing) 526
least material condition values 612
legacy mesh types 397, 399
lengthening objects 260
lettered lists 523
LID (luminous intensity
distribution) 725
light glyphs
displaying 713
plotting 730
settings 728
lighting
about 713
assigning shapes to 727
colors 717, 718, 720, 730, 733
default 713
display options 728
distant lights 727, 733
distribution 724, 733
face styles and 66
fixtures 714
guidelines 716
highlights 66
illuminating scenes 716
light glyphs 713, 728
light intensity 721
luminaire objects 735
luminous intensity distribution
(LID) 725
photometric lighting 713, 715
placement and location 729
point lights 717
properties 730
sky and 735
spotlights 719
820 | Index

Standard lighting 713, 715
sunlight 735
visual styles and 64
weblights 721
workflow 715
limits
arrays 251
lighting 734
tolerances 581
LIN files (linetype library) 138
line end styles 638
line spacing
dimension text 602
previous release formats and 697
text 521, 526
linear constraints 295
linear dimensions
breaks in 605
creating 585
definition points 598
jog lines 604
spacing between 608
types of 585
linear grips 313
linear units 41
lines
dimension lines 566
direct distance entry 185
drawing 196
end styles 638
extension lines 567
filleting 265
freehand lines 201
join styles 639
joining to polylines 274
linear constraints 295
linetypes 137
linetypes on short segments 141
lineweights 141
modifying 220
multilines 199
occluded 70
Ortho mode 177
polyline arcs 207
table gridlines 559
tangent to arcs 205
Linetype Manager
scale settings 140
linetypes
about 137
applying 139
blocks 320, 321
current 139
defaults 121
deleting 138
displaying on short segments 141
file locations 52
filtering selection sets by 224
freehand sketches 201
hardware linetypes 137
layers and 119, 124, 139
layout viewports and 99
loading 138
model space settings 87
plot style linetypes 638
polylines 141
reapplying 139
scaling 99, 140, 638
lineweights
about 141
applying 142
block properties 320
current 144
defaults 121
dimension elements 566
displaying 143
filtering selection sets by 224
layers and 119, 124, 144
model space and 142
objects not displaying 142
overriding 145
plot style lineweights 637
plotting 142, 630
previous releases and 144
reassigning 144
regenerating drawings and 143
scale 142, 620
turning on or off 143, 146
listing
dimension styles 565
dimension system variables 565
layers 128
Index | 821

raster images 688
xrefs 663
lists in multiline text 523
live sectioning
about 474, 480
cameras and 483
LMC symbol (least material
condition) 612
loading
color books 137
linetypes 138
raster images 691
location
default drawing folder 46
locking
cursor movements 177, 179
layers 120
layout viewport scale 93, 95
layouts and projects 112
lofting objects
3D objects 350, 422
surfaces 422
log files
xrefs 663
logo startup screen 37
lookup grips 313
lumens 725
luminaire objects 714, 725, 735
luminous intensity distribution
(LID) 725
LZW compression 684
M
M symbol (maximum material
condition) 612
magnifying views 57
major grid lines 174
manufacturer data
IES lighting data files 721, 724
lighting fixtures 714
mapping
fonts 546
markers
equal segments on objects 187, 188
object snaps 171
point markers 187, 188
tracking points 183
markups
revision clouds 219
masking objects 516
mass properties 193
master drawings 643
material condition symbols 612
materials
about 736
Materials Browser 737
materials libraries 738
Materials Browser
browsing materials 737
materials libraries 738
MaxArray system registry variable 251
maximum material condition values 612
measurement units
about 40
coordinates 157
dimension text 576
dimensions 577
model space 86
plot scale 627
measurements
dimensions 561
equal intervals 187, 188
tolerances 610
memory (RAM)
allocating 71
memory tuning 72
menu grips 481
merge extend surfaces 447
merging
cells in tables 558
mesh faces 456
mesh models 341
meshes
about 382, 393
best practices 468
boxes 385
cones 386
converting objects to 397, 408
converting to 3D solids 363, 408,
471
creases 462, 469
822 | Index

creating 383, 393
custom 399
cylinders 387
density 459
editing 454
extruding 471
extruding faces 463
faces 455
facets 455
gizmos 470
grip editing 456
legacy mesh types 397, 399
merging faces 456
mesh modeling 456
predefined meshes 403
primitives 385
properties 443
pyramids 388
refining 460, 461, 469
rendering 744
repairing holes 456
selection filters 470
self-intersections 472
smoothness 457
spheres 390
splitting faces 463, 469
tessellation 383, 457
tori 392
types 393
wedges 391
metric units
converting to imperial 40
linetype definition file for 138
Microsoft Excel spreadsheets
opening attribute extraction
files 332
Microsoft Windows Clipboard 231
minor grid lines 174
mirroring
grip methods for 234
lights 729
objects 234, 254
text 254, 550
misspellings 553
MMC symbol (maximum material
condition) 612
model space
accessing from layout viewports 92
annotations and 86, 490, 491
defined 89
dimensioning in 583
drawing process in 85, 91
layer visibility settings 92
lineweight display in 142, 143
live sectioning and 480
moving objects to paper space 91
plot scale 627
plotting from 87, 625, 630
switching to layouts 47
viewports 81
model space viewports
assigning UCSs to 151
creating 81
modifying
3D models 408
3D solids 408, 426, 432
AutoCAD WS files 707
block attribute definitions 326
block attributes 334, 335
block definitions 333, 656
block references 333, 656
colors 136
columns of text 528
composite solids 435
constrained objects 291, 300
constraints 299
dimension styles 566
dimensions 596, 597
dynamic blocks 315
edges 429
faces 426
fields in text 537
fills 512
gizmos 410
grip tools (gizmos) 410
hatches 512
helixes and spirals 279
layer objects 122
layers 124
layout and project properties 110
layout viewports 93, 94
layouts in a project 107
Index | 823

leader objects 530
lineweights 144
meshes 454
multilines 280
objects 220, 232
plot style tables 633, 635
plot styles 636
polylines 272
revision clouds 220
separating objects into shapes 436
splines 274
surfaces 408, 423, 426, 435, 445
tables 556, 559
text 549
text styles 541
vertices 432
visual styles 65
xrefs 656
molds 453
moments of inertia 193
monochrome settings
underlays 675
moonlight 717
moving
3D Move gizmo 410, 412
3D subobjects 423
constraining movement 413
dimension text 602
edges 429
faces 426
grip methods for 234
jog lines 604
layer objects to other layers 124
layouts to other projects 107
lights 729
objects 234, 238, 251
objects between model and paper
space 91
referenced drawings 649
stretch-moves 239
text 550, 551
UCSs 148
vertices 432
mtext (multiline text) 520
mtext objects 520
multi-functional dimension grips 599,
603
multi-functional grips 234, 272, 274
multi-functional grips, leaders 532
multileaders (leader lines)
annotations 489, 497
blocks in 534
breaks in 605
creating 530, 532
landings 531
modifying 530
previous release file formats and 697
styles 533
text in 534
multiline text
about 520
aligning 522
annotations 489
columns 528
creating 520
editing 551
finding 551
formatting 523
grips 528
height 523, 547
indenting 525
justification 522
leader objects and 530
line spacing 526
lists in 523
obliquing angle 548
orientation 549
previous release file formats and 697
properties 521
replacing 551
stacked 526
styles 523, 540
tabs 525
text wrap 521
multilines
drawing 199
editing commands 281
intersections 281
modifying 280
styles 200
vertices 280
824 | Index

multiple drawings
opening 46
switching between 47
multiple users 708
multiple-view drawing layouts 89
My Documents folder 46, 52
N
named layer states
saving 132
named layouts 91
named objects
xref name conflicts 662
named page setups
applying 615
creating 616
projects and 621
named plot style tables
about 623, 632
Plot Style Table Editor 635
plot styles in 634
named plot styles
about 632, 634
creating 635
predefined styles 635
named UCS definitions 150
named views
saving 59
section objects and 483
naming
groups 228
layer states 132
layers 123, 124
lights 730
raster images 689
selection filters 224
text styles 541
viewports 84
views 59
naming conventions
international 50
natural lighting 716
navigating
3D views 73
ViewCube 75
nested blocks
block attributes 332
clipped 654
creating 322
nested xrefs
clipped 654
defined 646
editing 660
paths 647, 661
network surfaces 374, 375
non-associative arrays 245
Non-Uniform Rational B-Splines surfaces
(NURBS) 378
nonassociative dimensions 563, 598,
601
nonassociative hatches 506, 515
nonrectangular layout viewports 93
nonsystem plotter drivers
PDF output 640
nonuniform rational B-spline curves 211
normals of 3D faces
about 740
Not Found raster images 689
notes
about 517
annotations 489, 495
creating text 517
notification
attached xrefs 645
changed xrefs 650
relocated xrefs 649
nudging objects 239
numbered lists 523
numeric values
block attribute data 330
dimensions 577
rounding 579
suppressing zeros 579
NURBS curves 211, 449, 450
NURBS surfaces
about 370
analyzing 453
creating 340, 378
editing 445, 448
rebuilding 449
Index | 825

O
object enablers 703
object properties
about 117
assigning 117
blocks 320
colors 134, 136
copying 119
inheritance 659
layer defaults 121
linetypes 137
lineweights 142
xrefs 659
object snap tracking 183
object snaps
3D space 170
about 168, 169
angles of 176
AutoSnap 171
base points 176
constraints and 293
grid snap 173
isometric drawings 711
object snap tracking 183
overriding 171
PolarSnap feature 177
running object snaps 169
shortcut menu 169, 170
underlays 674
ObjectARX applications
custom and proxy objects 703
objects
3D objects 339
aligning 241
arrays of 244
assigning to other layers 136, 139,
144
blocks 307
breaking 270
chamfering 266
colors 134
converting to meshes 397
converting to revision clouds 220
copying 232, 236, 242
creating 3D solids from 363
creating meshes from 393
creating solids or surfaces from 342,
377
cross sectioning 474
custom objects 703
cutting 231
deleting 231
deleting duplicates 231
deselecting 221, 223
draw order 147
drawing 195
editing 220, 232
equal intervals on 186
erasing 231
filleting 263
filtering 224
geometric data 188
grouping 227
highlighting 226
isolating 148
joining 270
large objects 45, 50
layers 119
layout viewports and 92
linetypes 137
lineweights 141
magnifying 58
masking 516
mass properties 193
materials 736
mirroring 254
moving 238
offsetting 236, 251
overlapping 147
paper space and 91
pasting 232
plotting 630
proxy objects 703
reshaping 260
resizing 260
rotating 240
saving 48
scaling 261
section objects 474
selecting 220
separating into original shapes 436
826 | Index

simplified display 145
snapping 168
stretching 261
subobjects 423
textures 736
transparency 147
visibility 96
oblique extension lines 588
oblique text 548
obscured edges 69
occluded lines 70
offset snaps 236
offsetting
construction lines 217
copying objects 236
objects 251
plot offsets 619, 626
surfaces 375
temporary reference points 186
online copies of files 707
online Help 1
opacity
transparency settings 147
visual styles 67
open curves 379
open meshes 400
opening
attribute extraction files 332
drawings 43, 706
files in other formats 669
files with large objects 45, 50
layouts 46
layouts and projects 107
multiple drawings 46
older files 695
operators
Parameters Manager 302
ordinate dimensions 594, 598, 605
orientation
annotations 503
drawings 618, 627
text 549
origin
coordinate systems 148, 156
displaying UCS icon at 154
hatches 510
ordinate dimensions 594
Ortho mode 177
orthographic projection view 79
orthographic sectioning 477
orthographic views 62
overhang edge effect 69
overlapping objects
3D solids 368
draw order 147
rendering 742
selecting 221, 419
overlaying xrefs 646
overlays 119
overrides
angle overrides 179
array properties 249
center locations of dimensions 591
dimension styles 565, 609
grid spacing 176
identifying 127
layer property overrides 122, 126,
132
layout page setups 111
linetypes 139
lineweights 145
object snaps 171
previous release formats and 696
project page setups 105
removing 127
snap spacing 176
overshoot of extension lines 567
P
Page Setup Manager
creating page setups 615
page setup override files 105, 111
page setups
named page setups 615, 616
overriding 105, 111
Page Setup Manager 615
plot settings 624
projects 105, 111, 621
settings 615
pages
layouts in projects 102
Index | 827

page setups 615
palettes
displaying 36
docking 36
floating 36
icons 36
resizing 36
Pan tool 73
panning
3D views 73
about 57
dynamic 57
layout viewports 92
Pantone color books 135
paper size
fitting drawings on 628
layout settings 617
plot scale and 627
scaling drawings to fit 620
settings 625
paper space
about 89
blocks and 319
dimensioning in 584
drawing in 89
hiding objects 630
layout work process 91
lineweight display in 143
moving objects to model space 91
object visibility 96
plotting options 630
UCS limitations 150
paper-saving features 626
paragraphs (multiline text) 520
parallel dimensions 608
parallel lines
construction lines 217
filleting 266
parallel projections
about 60
creating 61
parameters
constraints 302
parametric constraints 301
Parameters Manager 315
parametric constraints
about 282
annotational constraints 297
applying 296
dimensional constraints 295
displaying 289, 299
dynamic constraints 297
editing constrained objects 291, 300
formulas 301
geometric constraints 284, 285
parameters 301
reference parameters 298
relaxing 284
removing 284
parametric drawing
about 282
parametric constraints 282
partial saves 48
Partner Products and Services
(Autodesk) 3
parts
inspection dimensions 604
parts lists 328
pasting
lists 525
objects 232
objects from other drawings 47
text 529
patching surfaces 375
path arrays 246
paths
default file locations 46
extruding 421
lofting 422
path arrays 246
raster image files 690
support files 52
sweeping 348
underlay files 679
patterns
hatches 504, 509, 510
libraries 509
PCX files
attaching 680
PDF files
exporting 692
828 | Index

layers and 673
plotting 640
underlays 670, 671
performance improvement
3D display and 71
arrays and 251
demand loading xrefs 667, 668
fills display 145
groups and 228
hardware acceleration 71
incremental saves 49
layers and 120
lineweights and 143, 146
memory and 71, 72
performance tuning 71
raster image display 690
resolution 744
shadow display and 68, 730
software acceleration 71
text display 145
perimeters 190
perpendicular lines 177
perspective view 79
perspective views
about 60
defining 61
photometric lights
distant lights and 727
goniometric diagrams 722
IES data files 721, 724
luminous intensity distribution
(LID) 725
overview 715
point lights 718
properties 718, 733
spotlights 720
sun properties and 735
weblights 721, 733
workflow 713
photorealistic rendering 738
pickbox cursor 221
PICT files 680
pixels
raster images 681
removing strays on display 231
placeholder fields 536
plan views
changing viewpoints 63
defined 62
planar closed spline curves 190
planar surfaces 374
planes
constraining movement to 414
constraining scale to 417
workplanes 156
plot areas
setting 618, 624
plot settings
objects 630
orientation 627
page setups and 624
scale 627
transparency 630
plot stamps
about 623
turning on 631
Plot Style Manager 633
Plot Style Table Editor 633
editing plot styles 636
managing plot style tables 635
plot style tables
assigning to layouts 620, 632
creating 633
editing 636
modifying 633
Plot Style Manager 633
Plot Style Table Editor 635
predefined 633, 635
shaded viewport plotting options
and 629
types 623, 632, 633, 634
plot styles
about 631
layers and 121, 124
modifying 636
NORMAL style 635
object plot styles 634
plot style tables 620, 632
selecting 630
settings 636
types 623, 631
Index | 829

Plotter Configuration Editor
paper size 617
plotters
offsetting plots 626
paper size 625
paper-saving features 626
selecting 617, 624
plotting
draw order and 147
exporting files 640
file formats 640
fit options 620
hardware linetypes 137
layout process and 90
light glyphs 730
lineweights 142, 143, 630
model space settings 87
offsets 619
orientation 618, 627
page setups 615, 624
paper size 625
paper space objects 630
plot scale 627
plot style tables 620
plot styles 630, 631
positioning image on paper 625
previewing 640
publishing 640
resolution 630
scaling drawings for 620
screened objects 98
section objects 485
selecting output devices 624
test plot performance 145
text frames 146
transparent objects 147, 630
underlays 680
wipeout objects 516
PNG files (Portable Network Graphics)
exporting 693
importing 680
point lights
artifical lighting 717
attenuation rates 733
location 729
overview 717
target points 717
point markers 187, 188
pointer input 167
points
block base points 317
control points 275
coordinates 189
direct distance entry 186
drawing 216
equal intervals between 187, 188
fit points 275
geometric data 189
offsetting objects from 186
point markers 187, 188
specifying 185
tracking points 183
polar angles 178
polar arrays 247
polar coordinates
2D coordinates 159
about 156
cylindrical coordinates 163
spherical coordinates 165
polar tracking 177, 183
PolarSnap feature 177
polyface meshes
about 399
creating 402
rendering 744
polygon meshes 399, 402
polygons
calculating geometric data for 190
drawing 199, 207
polyface meshes 402
rendering 744
polyline arcs 207
polylines
calculating geometric data for 190
chamfering 268
closed 207
drawing 196
exploding 271
filleting 265
grips 233, 272
joining 274
linetypes 141
830 | Index

modifying 220, 272
offsetting 252
polyline arcs 207
PostScript rendering 694
revision clouds 219
simplifying display 145
subobjects 273
wide polylines 197, 207
polysolids
drawing 361
portrait orientation 618, 627
PostScript files
exporting 693
PostScript fonts 545
precision
calculators 193
coordinate systems 148
cursor movements 173
distances 185
drawing units 42
Dynamic Input 166
geometric data 188
numeric values 579
object snaps 168
offset locations 180
point locations 180
predefined 3D meshes 403
preset 3D views 62
pressing areas of 3D solids 438
previewing
drawings 46, 51
layouts 46
object selections 226
plotted drawings 640
weblights 733
previous releases
converting files 695
fields and 539
lineweights and 144
saving drawings as 699
underlays and 680
primitive solids
about 354
grips 421
modifying 441
spheres 358
primitives
mesh primitives 385
solids 354
printable areas 615, 617, 619, 624, 626
printers
offsetting plots 626
selecting 617, 624
printing
page setups 615
plotting 622
publishing 640
procedural surfaces
about 370
converting objects to 377
creating 340, 374
editing 445
profile tolerances 611
profiles (objects)
extruding 421
geometric objects used as 344
lofting 350
project creation templates 105
project lines 567
Project Manager
features 103
locking and unlocking layouts 112
shortcut menus 104
team collaboration 112
projected geometry 447
projected tolerances 613
projects
backing up and recovering 106
blank 106
creating and modifying layouts 107
creating projects 105
creation from existing DST 106
creation from template 106
DST files 105
label and callout blocks 108
layout names and numbers 107
layouts and 105
locking and unlocking 112
named page setups and 621
opening drawings within 107
organizing 109
overrides 111
Index | 831

page setups 105, 111
placeholder fields in 536
Project Manager 103
properties 110
publishing 111
reassociating moved layouts 107
saving 113
status 113
sub-groups 109
team collaboration 112
updating 112
working without Project
Manager 113
prompts
dynamic prompts 168
properties
3D solids 441
arrays 248
blocks 320
colors 134
copying 119
dimension lines 566
fills 511
floating properties 320
hatches 511, 513
layer groups 128
layers 119, 124
layouts and projects 110
lighting 730
linetypes 137
lineweights 141
mass properties 193
meshes 385, 443
multiline properties 200
objects 117
overriding 126
plot styles 631
section objects 483
selecting objects by filtering 224
simplifying display 145
surfaces 373, 442
tables 556
text 521, 551
views 60
Properties Inspector palette
object properties 118
Properties palette
table properties 556
proxy fonts 543
proxy objects 703
proxy servers 705
PS files (PostScript)
exporting 693
publishing
about 640
drawing sets 641
page setups 615
plotting vs. 622
projects 111
section objects 485
underlays and 680
pulling areas of 3D solids 438
purging
block definitions 316
named objects 231
unreferenced linetypes 138
unused layers 124
pyramids
3D solids 359
mesh pyramids 388
modifying 441
Q
quadrant grips 235
quadrants in dimensioning 593
Quick Text mode 146
Quick View tools 46
R
radial dimensions 588, 605
radius (fillet) 263
radius dimensions 588, 598
RAL color sets 135
RAM
allocating 71
memory tuning 72
rapid decay area of spotlights 731
Rapid prototyping 694
raster images
about 680
832 | Index

attaching 683
bitonal 688
clipping boundaries 685
display options 687
display speed 690, 691
file formats 681
file paths 683
finding files 690
hiding 691
image information 688
Internet-based files 684
loading 691
missing 690
naming 689
pixels 681
preview images 51
resolution 684
scaling 684
tiled images 692
transparency 681
unloading 691
rays
drawing 216
filleting 266
modifying 220
Readme help topic 3
Real face style 65
realistic rendering 738
Realistic visual style 64
realtime panning 57
realtime zooming 58
rearranging
objects in groups 229
reassociating dimensions 601
rebuilding surfaces 449
reconciled layers
about 131
reconstructing surfaces 449
recording
history of composite solids 434
recovering
after system failures 55
damaged drawings 52
project data 106
recovery audits 53
rectangles
drawing 198
modifying 220
rectangular arrays 245
rectangular meshes 400
redoing actions 230
redrawing screen display 231
redundant edges 437
redundant faces 437
redundant vertices 437
Refedit visor 657
Reference Manager palette
loading or unloading images 691
underlay information 678
reference parameters 298
reference points
drawing 216
offsetting from 186
referenced layers 124
references (xrefs) 643
refinement
mesh objects 460, 469
tessellation 384
refreshing screen display 231
regardless of feature size values 612
regenerating
drawings 143
layer display 121
raster image display and 691
screen display 146
regions
calculating geometric data for 190
composite 218
creating 217
cross sections 478
relative coordinates
2D coordinates 157
3D coordinates 163
copying objects with 243
cylindrical coordinates 164
entering 156
spherical coordinates 166
relative paths
xrefs 647, 648
relaxing constraints 284
relocated xrefs 649
Index | 833

removing
3D solid history 434
back faces 740
blips 231
block attributes 336
block definitions 316
constraints 284
creases 463
dimension breaks 606
duplicate objects 231
edges 430
faces 428
fillets 265
geometric constraints 285
group definition 229
hidden surfaces 740
layer property overrides 127
layouts 107
multiline vertices 280
objects 231
objects from groups 229
objects from selections 223
stray pixels 231
text styles 541
unreferenced linetypes 138
unused named objects 231
vertices 433
renaming
groups 229
layers 124
layouts and projects 107
Render (renderer) 747
rendering
about 738
atmospheric effects 747
background effects 747
basic techniques 748
configuring Renderer 747
plotting rendered objects 629
preparing models for 739
saving images 749
section objects 485
shaded viewport objects 621, 628
simplifying geometry for 742
renumbering layouts in projects 107
repairing
damaged drawing files 52
replacing
dimension text 602
text 551
reshaping
objects 260, 438
resizing
3D solid faces 426
annotations 490, 491, 501
arrowheads 570
columns in text 529
dimension breaks 607
dimensions 583
edges 429
extending objects 258
fitting drawings on paper 620
layout viewports 94
object grips and 235
objects 260
tables 556
text 550, 551
trimming objects 256
resizing palettes 36
resolution
plotting 630
raster images 684
rendering and 744
restoring
backup files 54
damaged drawings 54
layer settings 132
previous view 57
UCSs 150
viewports 84
views 59
resulting color 718, 720, 733
resulting intensity 718, 720, 733
reversing actions 230
reviewing
revision clouds 219
revision clouds 219
revolved meshes 396
revolving
solids 422
surfaces 422
834 | Index

revolving objects 352
RFS symbol (regardless of feature
size) 612
right-hand rule 149
RLC files 680
rotated dimensions 587
rotating
3D objects 241
3D Rotate gizmo 410, 414
3D subobjects 423
3D views 62
constraining rotation 415
dimension text 602
dimensions 587
edges 429
faces 426
grip methods for 234
hatches 513
lights 729
objects 234, 240
snap angles 176
UCSs 148
underlays 674
vertices 432
views in layout viewports 101
rotation grips 313
rotation snaps 236
rounding
corners 263
edges 431
rounding off
dimension values 579
drawing units 42
rows (tables)
formatting 559
modifying 556
RTF files 529
rubber-band lines
locking 177
tracking 185
ruled meshes 395
running object snaps 169, 171
S
S (regardless of feature size symbol) 612
SAT format files 669, 694
saving
automatic saves 48, 54
backup files 48, 54
cross sections 483
drawings 48, 706
files in older formats 695, 699
files with underlays 680
incremental saves 49
layer indexes 667
layer property overrides 132
layer settings 132
layer states 132
layout templates 102
objects 48
page setups 616
partial saves 48
preview images 51
projects 113
rendered images 749
selection filters 224
spatial indexes 667
UCSs 150
viewports 84
views 59
visual fidelity and 49, 493, 695
xref editing changes 659
scale
annotations 490, 491, 501
dimensions 578, 583
drawing units 40
drawings 86
layout viewports 95
linetypes 140
multilines 199
plot scale 620, 627
scale factors 261
scale factors
layout viewports 95
model space settings 87
raster images 684
scaling objects 261
scale locking in layout viewports 93
scaling
3D Scale gizmo 410, 416
3D subobjects 423
Index | 835

annotations 490, 491, 501
arrowheads 570
blocks 309
constraining scale 416
drawings 87
drawings to fit paper 620
edges 429
faces 426
grip methods for 235
hatch patterns 510, 513
linetypes 99, 140, 638
lineweights 620
model space settings 86, 87
objects 234, 261
plot scale 627
raster images 684
scaling by reference 262
tables 556
text 550, 551
text scale ratios 88
underlays 674
vertices 432
views in layout viewports 95
scenes
lighting 716
rendering 748
schedules
tables 556
screen display
cleaning up 231
clearing 35
performance 145
quality 691
updating 146
screening
layout viewports 98
plot settings 636
scripts
customizing program startup 37
SDF files (space-delimited format) 331
search paths
default file locations 46
referenced drawings 648
specifying 52
searching
finding drawing files 43, 51
finding raster images 690
Help topics 2
text search and replace 551
underlay files 679
second grips 481
section lines 475
section objects
about 474
cameras and 483
creating 476
grips 481
jogged segments 479
live sectioning 480
object states 482
plotting 485
properties 483
publishing 485
rendering 485
saving 483
views and 483
section planes 474
sectioning
2D sections 483
3D objects 483
3D views and 74
cameras and 483
jogged segments 479
live sectioning 474, 476, 480
lofting objects and 350, 422
publishing or plotting cross
sections 485
section objects 474
views and 483
segment end grips 482
selecting
3D solid subobjects 418
classification properties and 224
CP and WP selection 223
customizing object selection 225
default options for 226
deselecting 221
groups 228
highlighted objects 226
irregularly shaped selection
areas 223
layers 123
836 | Index

methods for 223
multiple objects 222
objects 220
output devices 617, 624
overlapping objects 419
preventing object selection 224
previewing selections 226
selection fences 223
selection windows 222
subobject selection filters 420
suppressing highlighting 692
tables or table elements 558
selection fences 223
selection filters 420, 470
selection preview 221
selection windows 222
self-intersections 472
sending objects to back 147
servers
AutoCAD WS 707
proxy servers 705
setting up pages 615
shaded images
AutoCAD LT functionality 701
customizing shading 65
edge display 69
rendering 745
visual styles 63
shaded UCS icon 154
shaded viewports
plotting options 620, 628, 629, 630
resolution settings 630
Shaded visual style 64
Shaded with Edges visual style 64
shades (colors) 509
Shades of Gray visual style 64
shadows
hardware acceleration and 68
lighting and 717, 730
visual styles 68
sharing drawings 707
shelling solids 437
SHX fonts 543, 544, 545, 549
SI lighting units 715
silhouette edges 69
single-line text
creating 518
editing 550
height 547
obliquing angle 548
orientation 549
styles 540
sketching freehand lines 200
Sketchy visual style 64
sky
lighting overview 714
natural lighting and 716
slanted text 548
slicing solids 368
smooth lighting 66
smooth rendering 744
smoothing
mesh objects 457, 460, 468
tessellation 383
snapping (object snaps) 168
software acceleration 71
solid fills
creating 505, 509
defined 504
overlapping objects 147
PostScript rendering 694
turning off 145
solid primitives
about 353
boxes 354
cones 356
creating 354
cylinders 357
pyramids 359
tori 360
wedges 355
solids
3D solids 363
composite solids 366
converting objects to 342
converting to meshes 397
creating 352
extruding 346
grips 421
interferences 368
lofting 350
Index | 837

modifying 408
polysolids 361
revolving 352
separating into original shapes 436
solid modeling 339
solid primitives 354
sweeping 348
types of 343
sorting
layers 128
source vectors for distant lights 733
space-delimited format files (SDF) 331
spacing
dimension elements 566
dimensions 608
equal intervals 186
grid lines 174
previous release formats and 697
spatial indexes 667, 668
special characters
block attribute extraction files 331
bullets in lists 523
file names 50
filtering layers by 129
fractions 527
inserting 521
tolerance stacks 527
Unicode text 706
xref symbols 663
spelling check 553
spheres
3D solids 358
mesh spheres 390
modifying 441
spherical coordinates 165
spinning mesh edges 456
spirals
drawing 214
modifying 279
spline-fit polylines
extending 260
trimming 260
splines
B-splines 378
base points 276
calculating geometric data for 190
control points 275
drawing 211
editing 274
extending 277
filleting 277
grips 233, 274
knots 276
modifying 220
NURBS splines 379
offsetting 252
trimming 277
splitting
faces 469
mesh faces 463
spotlights
artifical lighting 717
attenuation rates 733
beam angle 731
falloff angle 731
field angle 731
hotspot angle 731
location 729
overview 719
rapid decay area 731
spreadsheets
attribute extraction data files 332
squares 198, 220
stacked text (multiline text) 526
standard grips 313
Standard lighting workflow
about 715
distant lights 727
starting
customizing program startup 37
drawings 39
starting tables 558
STB files 623, 632, 635
Stereolithograph (STL) files 694
Stereolithography Apparatus (SLA) 694
STL files 694
stray pixels 231
stretch-moves 239
stretching
grip methods for 235
objects 261
stretch-moves 239
838 | Index

styles
annotations 494
dimensions 565
leader objects 533
multiline styles 200
reference points 216
text 540
visual 63
subobjects 273, 423
substitute fonts 543, 545
subtracing
composite solids 366
subtracting
areas 192
objects 366
regions 218
sunlight
about 714, 735
natural lighting 716
support files
search paths 52
surface models 340
surfaces
3D surfaces 369
about 370
associative 345, 380
blending 375
bulge magnitude 372
chamfering 431
composite solids 433
composite surfaces 435
constraints 381
continuity 372
converting meshes to 471
converting objects to 342, 377
converting to 3D solids 363, 365
converting to meshes 397
creating 370
edges 429, 440
editing 445
extending 447
extruding 343, 346, 421
faces and 426
filleting 431, 448
grips 421
hidden 740
interferences 368
lighting and 717
lofting 350, 422
meshes 393
modifying 408, 423
network surfaces 374, 375
NURBS surfaces 340, 370, 378, 448
offsetting 375
patching 375
planar surfaces 374
procedural surfaces 340, 370, 374,
377
properties 373, 442
reconstructing 449
rendering 740, 744
revolving 352, 422
separating into original shapes 436
smoothness 745
surface analysis 450
surface models 340
sweeping 348, 421
trimming 446
vertices 432
swap files 72
sweeping objects 348, 421
switches
customizing startup with 37
switching
between model space and paper
space 90
drawings 47
gizmos 411
layouts 47
Swivel tool 73
symbol libraries
creating 323
inserting blocks 310
updating block definitions 334
symbols
arcs 596
block attribute extraction data 331
blocks 307
bullets in lists 523
file names 50
inserting 521
material conditions 612
Index | 839

projected tolerances 613
symbols of termination 562
tolerances 580
xref symbols 663
symmetrical tolerances 580
synchronizing
AutoCAD WS files 707
syntax
command line switches 37
T
table styles 558
Table toolbar 558
tables (inserted)
annotations 489
AutoFill feature 560
breaking into parts 557
cell styles 559
column width 556
creating 556
defined 556
editing 557
fields in 536
formatting 559
formulas in 560
gridlines 559
grips 557
inserting blocks in 559
merging cells 558
previous release formats and 698
row height 556
selecting elements 558
table styles 559
text in 559
title rows 559
tabs in text 525
tabulated meshes 396
tangential objects
arcs and lines 205
circles 206
tapering
polylines 208
TARGA files 680
target point lights 717, 733
targeted weblights 721
teams
master drawings 643
projects and 112
templates
attribute extraction templates 328
drawing templates 42
layout templates 101
project creation templates 105
projects 111
saving 48
startup routines and 37
temporary files 52
tessellation
about 383
curved solids 746
mesh objects 457
refinement 384
smoothing 383
test plots 145
testing
part dimensions 604
text
alignment 519, 534
annotations 489, 495
checking spelling 553
columns in 528
creating 517
dimension text 571, 602
editing 549
fields 536
finding and replacing 551
fonts 542
height 547
importing 529
leader objects 530
mirroring 254, 550
model space settings 87
moving 550, 551
multline text (mtext) 520
obliquing angle 548
orientation 503, 549
overlapping 147
pasting 529
plotting 146
PostScript rendering 694
previous release file formats and 697
840 | Index

properties 551
Quick Text mode 146
scale ratios 88
scaling 550, 551
simplified display 145, 146
single-line 518
tables 556, 559
text styles 540
types 517
text files
exporting block attribute data
to 328
importing 529
text styles
about 540
creating 541
dimension text 576
fields 537
fonts 542
height 547
modifying 541
multiline text 521, 523
obliquing angle 548
orientation in 549
single-line text 518
tables 559
text wrap 521
textures
about 736
thawing layers
layout viewports 96
regenerating drawings 121
thickness of objects 365, 406
tick marks for dynamic blocks 312
TIFF files
attaching 680
exporting 693
tiling 692
tiling
images 692
time
angle of sun and 735
timelines (AutoCAD WS files) 708
tints 509
titles
tables 559
tolerances
alignment 581
annotations 489, 496
composite tolerances 613
datum reference frames 612
deviation tolerances 580
geometric tolerances 610
inspection dimensions 604
lateral tolerances 580
limits 581
material conditions 612
multiline text 526
projected tolerances 613
rounding values 579
suppressing zeros 582
symbols 580
symmetrical tolerances 580
tools
precision drawing tools 148
tooltips
AutoSnap 171
Dynamic Input 166
dynamic prompts 168
settings 35
tori
3D solids 360
mesh tori 392
modifying 441
torus objects
3D solids 360
mesh tori 392
modifying 441
tracking
object snap tracking 183
polar tracking 178
specifying points 185
tracking points 183
training 2
transparency
hatches 511
layers 121, 147
objects 147
plot options 147, 630
raster images 681, 688
section planes 483
visual styles 67
Index | 841

triangles 199
trimming
3D objects 260
chamfered objects 268
filleted objects 264
hatches 511
objects 256
replacing trimmed areas 449
splines 277
surfaces 446
True Color colors 135
TrueType fonts
about 543
PostScript font equivalents 546
proxy fonts 547
text height 548
vertical text 549
twisted faces 743
TXT files
importing 529
Type C goniometers 725
typefaces 542
U
UCS (user coordinate system)
definitions
saving 150
UCS icon
coloring 35
display options 154
UCSs (user coordinate systems
ViewCube and 80
UCSs (user coordinate systems)
3D space and 149
assigning to viewports 151
AutoCAD LT functionality 701
defining 148
dynamic UCSs 152
named definitions 150
paper space and 150
preset orientations 150
restoring 150
UCS icon 154
workplanes 148
unbounded hatches 504, 511
unconstrained drawings 283
underconstrained drawings 283
underlays
about 670
backgrounds 675
clipping boundaries 677
colors 675
contrast 675
detaching 672
display settings 675
fade settings 675
finding files 679
grips 674
layers and 673
monochrome settings 675
object snaps 674
PDF files 670, 671
Reference Manager palette 678
unloading 672
visor 670
undoing actions
correcting mistakes 230
layer changes 124
ungrouping groups 229
Unicode fonts 543
Unicode text 521, 698, 706
unions
3D solids 366
regions 218
separating into original shapes 436
units of measurement
about 40
coordinate unit types 157
dimensions 576, 577
model space 86
plot scale 627
unloaded raster images 689
unloading
raster images 691
underlays 672
xrefs 666
unlocking
layers 120
unreconciled layers
about 131
unreferenced linetypes 138
842 | Index

untrimming surfaces 446
unused layers 124
updating
annotations 491, 501
associative dimensions 564
block attributes 335
block definitions 333
block references 336
display 146
fields 538
projects 112
xrefs 643, 650
uploading
AutoCAD WS files 708
URLs (Uniform Resource Locators)
opening drawings with 706
saving drawings to 706
user interface
customizing 34
users (multiple) 708
V
validating
3D solids 437
surfaces 450
values
dimension values 577
suppressing zeros 579
text fields 537
variable block attributes 324
vector expressions 193
verifying constraints 289
versions of AutoCAD 699
versions of online files 708
vertex editing 432
vertical dimension text 575
vertical dimensions 585
vertical text 549
vertices
3D solid vertices 423
creases 462
deleting 433
modifying 432
multilines 280
redundant vertices 437
rendering 744
surface control vertices 448, 449
video cards 71
ViewCube 75
viewpoints in 3D space 62, 74
Viewport Overrides filter 126
viewports
aligning views in 100
annotations in 490, 491
arranging 83, 84
backgrounds in 68
creating 81
current 83
drawing in 84
layer property overrides and 126
layers and 126
layout viewports 93
lighting modes 713
plot options 620, 628
plotting 630
rendering 748
restoring layer states and 133
shadows in 68
UCSs and 151
visual styles in 65, 127
views
2D isometric 711
3D projection styles 60
3D views 72
aligning in viewports 100
changing 57
cross sections 474
flattened 3D objects 486
layout viewports 94
live sectioning 483
model space 3D views 61
modifying 92
multiple-view drawing layouts 89
panning 57
performance issues and 71
plot options 618
plotting 624
preset 3D views 62
properties 60
rendering 748
restoring 59
Index | 843

rotating 101
saving 59
scaling 95
viewports 81
zooming 57
visibility
annotations 501
layers 92, 121
layout viewports and 96
transparency 147
xref layers 645
visors
PDF underlay 670
visual fidelity
annotative objects and 493
previous release file formats and 695
saving files and 49
visual styles
AutoCAD LT functionality 701
backgrounds 68
customizing 65
default styles 64
defined 63
edge display 69
face styles 65
layer property overrides and 127
lighting 64
modifying 65
performance issues and 71
plotting 629
shading 65
shadows 68
Visual Styles Manager 63
VIZ 750
volumes 193
W
walls
drawing 361
WCS (world coordinate system)
about 148
weather 717
web folders
opening drawings from 706
web sites
attaching xrefs from Internet
files 708
AutoCAD WS files 707
weblights
about 721
distribution in photometric
webs 722
free weblights 721
goniometric diagrams 722
luminous intensity distribution
(LID) 725
properties 733
websites
opening and saving files to 706
wedges
3D solids 355
mesh wedges 391
modifying 441
wide polylines
drawing 197, 207
extending 259
simplified display 145
tapering segments 208
trimming 259
width
table columns 556
wildcard characters
filtering layers by 129
window polygon selection 223
windows
interface options 35
selection windows 222
zooming to 58
Windows Clipboard 231
wipeout objects 516
Wireframe visual style 64
wireframes
about 404
plot options 621
plotting 629
witness lines 567
workflows
lighting 715
photometric 720
surface modeling 449
844 | Index

working sets of reference objects 656,
658
workplanes 148, 156
world coordinate system (WCS) 148
WPolygon selection 223
wrinkled surfaces 449
X
X axis 35
X-ray visual style 64
X, Y coordinates 156
xlines 216
filleting 266
modifying 220
xrefs (external references) 643
XY planes (workplanes) 63, 156
Y
Y axis 35
Z
Z axis 35
z coordinate values 162
zebra analysis 451
zero suppression
dimensions 579
tolerances 582
zero-length geometry 231
Zoom tool 73
zooming
3D views 73
about 57
controlling zooming 58
grid display and 175
layout viewports 92
lineweight display and 143
Index | 845

846