
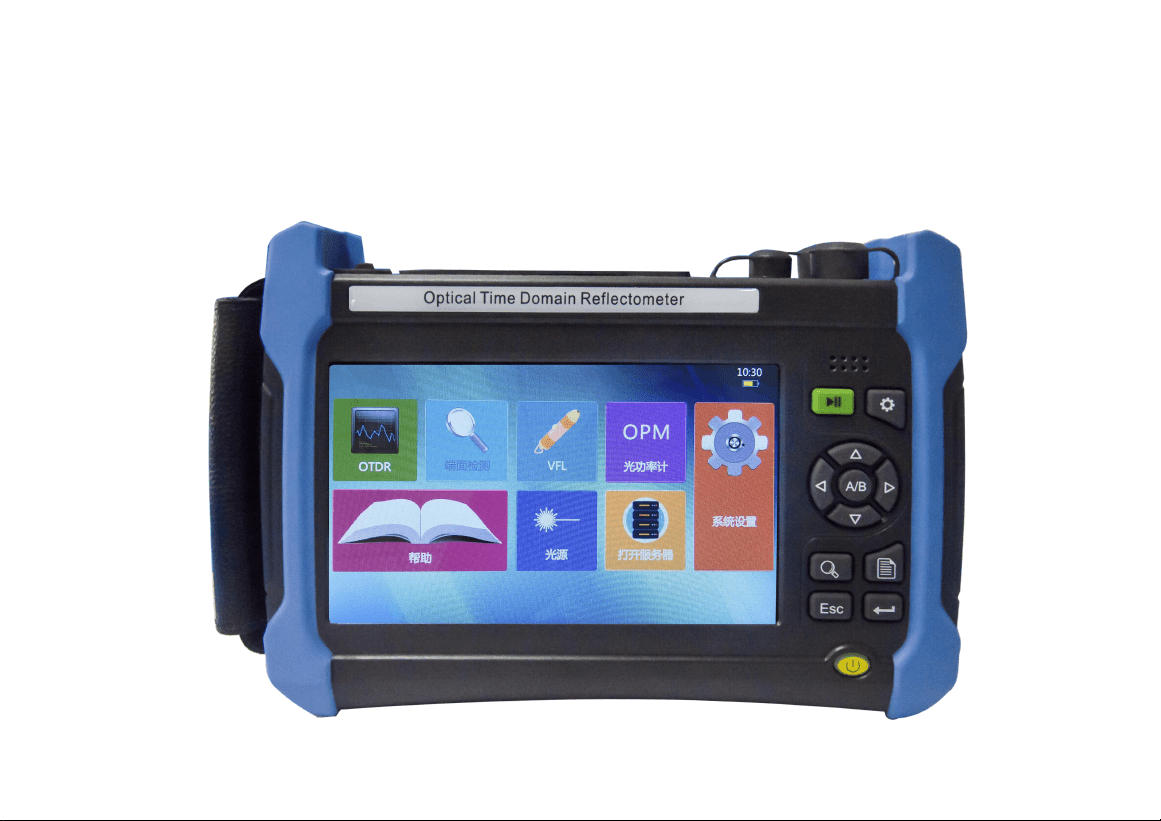
Optical Time Domain
Reflectometer
User Manual

Foreword
Thank you for choosing and using optical time domain reflectometer produced by our
company. The Company follows the ISO9000 standard always during production and
adheres to the customer-oriented and quality-first principles. Please read carefully the
manual, so as to facilitate the operation. We will spare no efforts to meet your
requirements, providing you with easy-to-use and reliable devices and considerate
after-sales services. We always adhere to the principle of “high quality and thoughtful
services”, providing customers with satisfactory products and services as well as work
convenience and shortcut. The hotline is shown below, and we are looking forward to
hear from you.

The manual introduces the application, performance and features, basic principles,
usage, maintenance and precautions of the optical time domain reflectometer,
facilitating your quick understanding the usage and key points of the meter. To operate
the product well, please read the manual carefully.
Mistakes and omissions can hardly be avoided due to time urgency and writer’s
knowledge limit. Your valuable comments and suggestions are highly welcome! We are
sorry for any inconvenience caused due to our errors.

Note:
This manual is the first edition of the optical time domain
reflectometer user manual. The version number is A.1.
The contents of this manual are subject to change without notice.
We reserves the right of interpretation for the contents and the
terms used herein.
The manual copyright belongs to our company., no modification or
manipulation can be made to the manual contents by any unit or
person without approval of the Company, or any copy or
propagation of the manual made for profit. our company. retains the
right of pursuing legal responsibilities from any infringer.
Writer
June 27, 2019

Contents
Chapter I Overview........................................................................................................................1
Chapter II Main operation interface..........................................................................................20
Chapter III Optical power meter module..................................................................................24
Chapter IV Optical source module........................................................................................... 25
Chapter V Visual fault locator module..................................................................................... 26
Chapter VI End face detection module....................................................................................27
Chapter VII Module of optical time domain reflectometer.................................................... 28
Chapter VIII Working principles................................................................................................ 78
Chapter IX Technical parameters............................................................................................. 80
Appendix A Optical output port cleaning................................................................................. 88


Safety Requirement
The following general safety measures must be taken at any stage of the instrument
operation. Failure to take these safety measures or to comply with the warnings and
cautions elsewhere in this manual will violate the safety standards for the design,
manufacture and use of the instrument. our company. will not be liable for any
consequences caused by users' violation of these requirements.
Service environment
For the working environment and storage environment of this instrument, please refer to
the description of technical parameters in Chapter IX.
Power supply
For the working power supply requirement of this instrument, please refer to the
description of technical parameters in Chapter IX. Before switching on the power supply,
make sure that a matching power voltage is set for the instrument and that all safety
measures are taken.

Do not use this instrument in explosive or flammable environment.
Do not use this instrument in the presence of flammable gases or fumes.
Do not disassemble any part of the instrument without permission.
Do not disassemble any parts of the instrument except those parts which are allowed to
be replaced by the user as stated in this manual. Replacement parts and internal
adjustment can only be carried out by our company. or by its authorized maintenance
personnel.

Warning!
Note!
Safety terms in this manual
: Alert the user to a process, operation, or similar situation. Failure to
operate properly or follow rules may result in personal injury or instrument damage.
: Alert the user to a process, operation, or similar situation. Failure to operate
properly or follow the rules may result in partial or total damage to the instrument.
: Information useful for instrument use and maintenance.
Instruction!

Chapter I Overview
1
1 Overview
Chapter I Overview
This manual is applicable to optical time domain reflectometer. The optical time domain
reflectometer is a multifunctional test instrument designed for FTTx network. It is mainly
used to measure the length, transmission loss, joint loss and other physical properties
of optical fiber, and to locate the event point and fault point in the optical fiber line. It is
widely used for engineering construction, maintenance test and emergency repair in
optical fiber communication system, as well as fiber optic cable development and
production test.
In addition to OTDR function, OTDR can also be equipped with optical power meter,
light source, visual fault location (VFL) and vibration detection function.
Main functions and features of the optical time domain reflectometer:
0.8m ultra-short event blind area, easy to test optical fiber jumper.
Minimum 2.5cm sampling resolution for accurately locating event points.

Chapter I Overview
2
50dB large dynamic range, 256k data sampling point, capable for long-distance
multi-branch communication network test.
Bidirectional analysis and macro - bending analysis function.
PON online testing function.
Single and multi - module integrated test function.
Advanced anti - reflection LCD, ensuring clear and visible display interface in field
environment.
A variety of test modes, touch screen and shortcut key operation.
Automatic communication fiber monitoring function.
Remote control function.
Dual USB interface function, external USB disk, and printer.
Bellcore GR196 and SR-4731 file formats supported.
Multilingual operation interface.
Chapter I Overview
3
Built-in optional visual red light fault location (VFL), optical power meter, light source
and end face detection function modules.
OTDR optical output connector type can be changed at will, ensuring easy end face
cleaning.
2 Product Composition
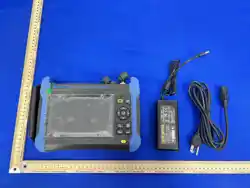
The basic components of the optical time domain reflectometer are shown in Table 1-1
and 1-2.
Table 1-1 Standard configuration of optical time domain reflectometer
No.
Name
Remarks
1
mainframe module
Display control module
2
Module of optical time domain
reflectometer
OTDR measuring module
3
Li-ion battery pack
Over 70Wh (built-in)

Chapter I Overview
4
3
Power cord assembly
Input voltage: 100-240V,50-60Hz,
2.0A
Output voltage 15V, output current
4A
4
User Manual
5
Product certification
6
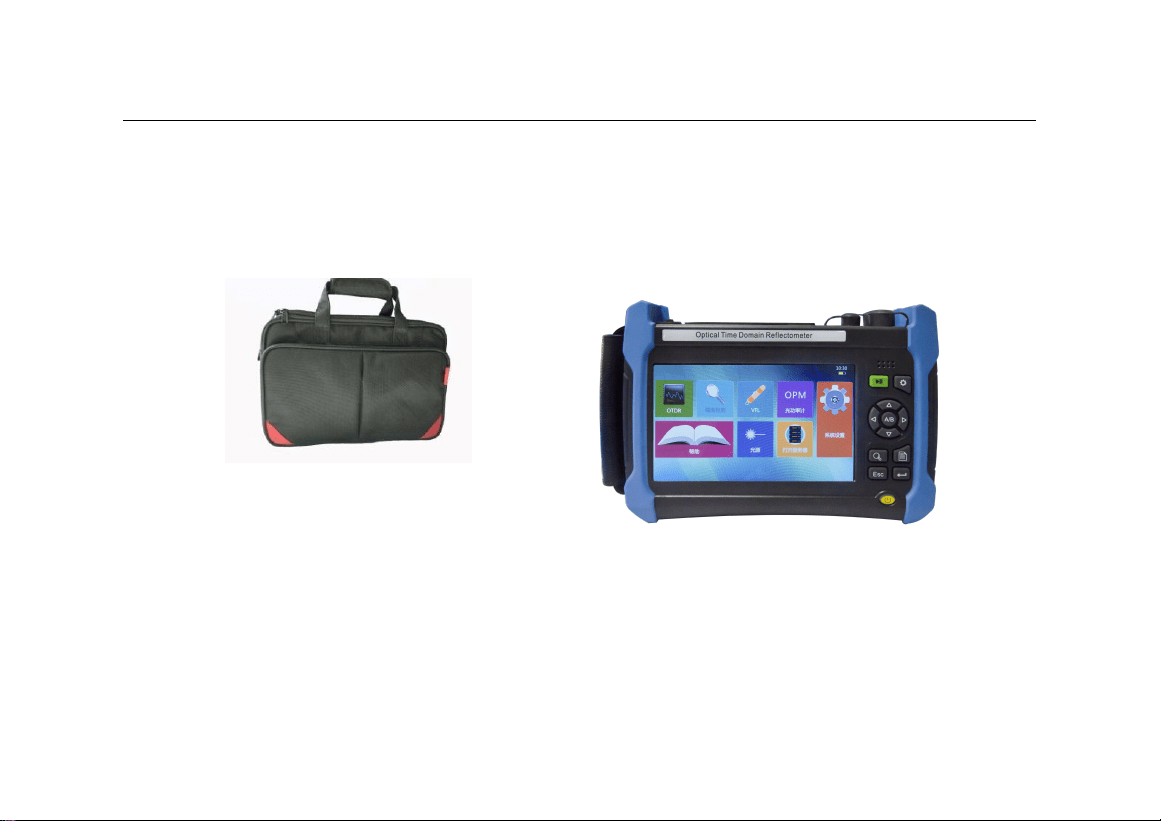
Special portable soft pack
Table 1-2 Options of optical time domain reflectometer
Option
No.
Name
Model
01
8G Usb DISK
02
USB Data cable
Chapter I Overview
5
03
Battery pack
04
SC adapter
05
VFL
Wavelength: 650nm±20nm, power: ≥2mW
06
OPM
Wavelength: 1200-1650nm, range: -70-+3dB
07
LS
Wavelength is the same as OTDR module; power: ≥
-5dB
08
Packaging box
Portable soft pack
Chapter I Overview
6
Packaging box:
Portable soft pack

Chapter I Overview
7

Chapter I Overview
8
3 Warnings for instrument operation
3.1
External DC power
External DC power supply must meet the following requirements: 14V ~ 20V and greater
than 1.5A; polarity: center is positive. Using too high a voltage will damage the
instrument.
3.2
Internal battery
(1) The internal battery is the dedicated lithium ion battery. The use of other batteries
will damage the instrument and endanger the user's personal safety.
(2) For safety reasons, do not dismantle the battery pack, so as to avoid short circuit;
do not slam the battery or put the battery into or close to the source of fire and
strong heat, so as to avoid explosion.
3.3
Laser safety
(1) The safety level of the laser used in this instrument is: CLASS1 LASER PRODUCT :
21 CFR 1040.10 or CLASS 3A LASER PRODUCT : IEC 60825-1:Ed.2:2001

Chapter I Overview
9
(2) Although the output intensity of the laser used in this instrument is within the safe
range, it may still damage the eyesight. Therefore, the output of the laser should be
avoided to shoot directly into the eye. Do not look directly at the optical output
connector of the OTDR and do not look directly at the end of the optical fiber during
testing. When the instrument's VFL function is on, do not look directly at the output
port of the VFL light source or at the end of the optical fiber connected to the VFL
output.
3.4
OTDR operation
Never connect optical fiber with any optical signal to the test port of OTDR. Otherwise,
it will lead to inaccurate measurement results and even permanent damage to the
instrument. Please ensure that all optical fibers tested by this instrument are in a state
of no signal.
4 Precautions for instrument operation
4.1
AC/DC adapter
Please use the adapter provided by our company.

Chapter I Overview
10
to power the instrument. Using other adapters may cause damage to the instrument.
4.2
Internal battery
(1) In order to give full play to the performance of the battery, at the beginning of using
the instrument, the internal battery should be used for power supply until the battery
is exhausted, and then the battery should be charged for 2-3 times.
(2) If you need to use the external power supply for a long time, please take out the
internal battery and store it properly. Charging a battery for too long can reduce
battery life and even cause battery damage.
(3) When the battery is stored for a long time (more than 6 months), the temperature
range shall be -20℃ ~ 45℃. For short-term storage (storage time less than or
equal to 6 months), the temperature range of the battery shall be -20℃ ~ 60℃.
(4) The charging temperature range of the battery in the instrument is 5℃ ~ 40℃.
When the ambient temperature is too high or too low, the charging will automatically
terminate, which will lead to the battery charging is not satisfied.
4.3
LCD display screen

Chapter I Overview
11
(1) Do not use sharp objects to click on the LCD screen, do not impact the LCD screen
with force. Otherwise, the LCD screen will be damaged.
(2) Do not drip or splash organic solvents or pollutants on the LCD screen, such as
acetone, oil, antifreeze, ointment, or it will cause the LCD screen to work
abnormally.
(3) Wipe and clean the LCD screen with a silk cloth or a soft fabric. Do not wipe the
LCD screen with organic solvent, otherwise the LCD screen may be damaged.
4.4
OTDR operation
(1) The standard optical interface of this product is of FC/UPC type. When connecting
the tested fiber, please check whether the fiber connector type matches before
connecting. Otherwise, the optical interface will be damaged and the test curve
cannot be normal.
(2) The optical output connector of the instrument has a precise and fragile ceramic
positioning core inside. When the optical fiber is connected, please make sure that
the optical fiber plug is inserted gently in parallel and tighten after aligning with the
positioning pin.

Chapter I Overview
12
(3) When using this instrument for measurement, it is necessary to keep the inside of
the optical output connector of the instrument and the end face of the optical output
connector of the instrument clean, so as to avoid contamination of the optical output
connector by ointment and other pollutants. Otherwise, the error of the instrument
measurement will be caused, and the instrument may be unable to test optical fiber
in serious cases.
(4) If possible, point the end of the fiber to a non-reflective object during instrument
testing.
4.5
Software upgrading for the optical time domain reflectometer
1) Upgrade U disk format to FAT format; other format may not be recognize by the
system.
2) Do not pull out the U disk during the software upgrade of the optical time
domain reflectometer, otherwise the system will not work normally.
3) Regardless of the success or failure of the optical time domain reflectometer
upgrade, please restart it, otherwise it may not work properly.

Chapter I Overview
13
5 Maintenance
(1) Please use original packing materials when this instrument is transported to avoid
severe shock and vibration.
(2) After removing the packing case of the instrument, please carefully check and
ensure that the model of the instrument is optical time domain reflectometer. After
confirming there is no obvious damage on the surface of the instrument with
complete accessories, the instrument can be used.
(3) When the instrument is stored, the ambient temperature range should be -40℃ ~
70℃ (for the storage temperature range of the battery, please refer to the above
internal battery description). Keep it ventilated and dry without direct sunlight. When
the instrument is not in use for a long time, please take out the battery inside the
instrument and electrify it regularly for inspection. At the same time, charge and
discharge the battery once every 3 months.
(4) In order to extend the battery life, when the instrument is not used for a long time,
the battery should be charged and discharged once every 3 months. Please
discharge the battery thoroughly first, and then charge the battery again.

Chapter I Overview
14
6 Calibration requirement
The validity of technical parameters is related to the operating environment of the
instrument. The period of calibration can be extended or shortened according to the
operation frequency of the instrument, the environment in which the instrument operates
and the maintenance of the instrument. Users should determine the appropriate
calibration period based on actual needs.
Under normal use of the instrument, it is recommended to calibrate the optical time
domain reflectometer once a year. For specific matters, please call the service telephone
for consultation.
7 Instrument warranty and repair
(1) The warranty of the instrument (except the battery and the following consumables)
is 36 months (unless specially required in the purchase contract), and that of the
battery is 3 months. Products offered during promotional activities are not covered
by the warranty.
(2) The optical output connector and other components of the instrument are

Chapter I Overview
15
consumables, which are not covered by the warranty.
(3) Instrument damage or performance degradation Due to force majeure and human
factors will not be covered by the warranty.
(4) As the instrument is used for a period of time, the battery performance will decline,
which is normal battery loss. This situation is not covered by the warranty.
(5) The maintenance of the instrument shall be carried out by our company. or its
designated and authorized maintenanceunit. Any other unit or individual
disassembling and repairing the instrument is illegal, and the instrument will lose its
warranty qualification. At the same time, our company. reserves the right to pursue
legal liability for violators.
(6) Once the instrument is disassembled without authorization, it will automatically lose
its warranty. Removal of fastening screws or seals will automatically disqualify the
instrument from warranty.

Chapter I Overview
16
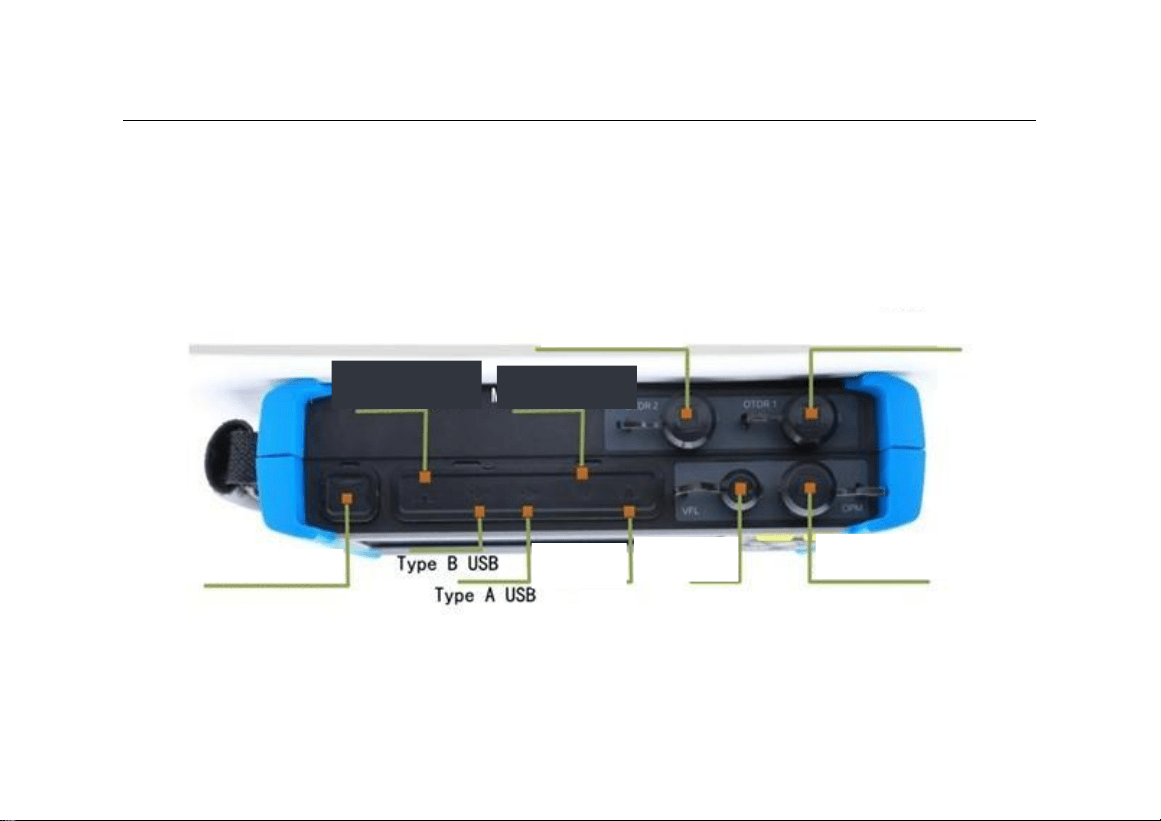
8 Instrument panel description
8.1
Instrument front panel
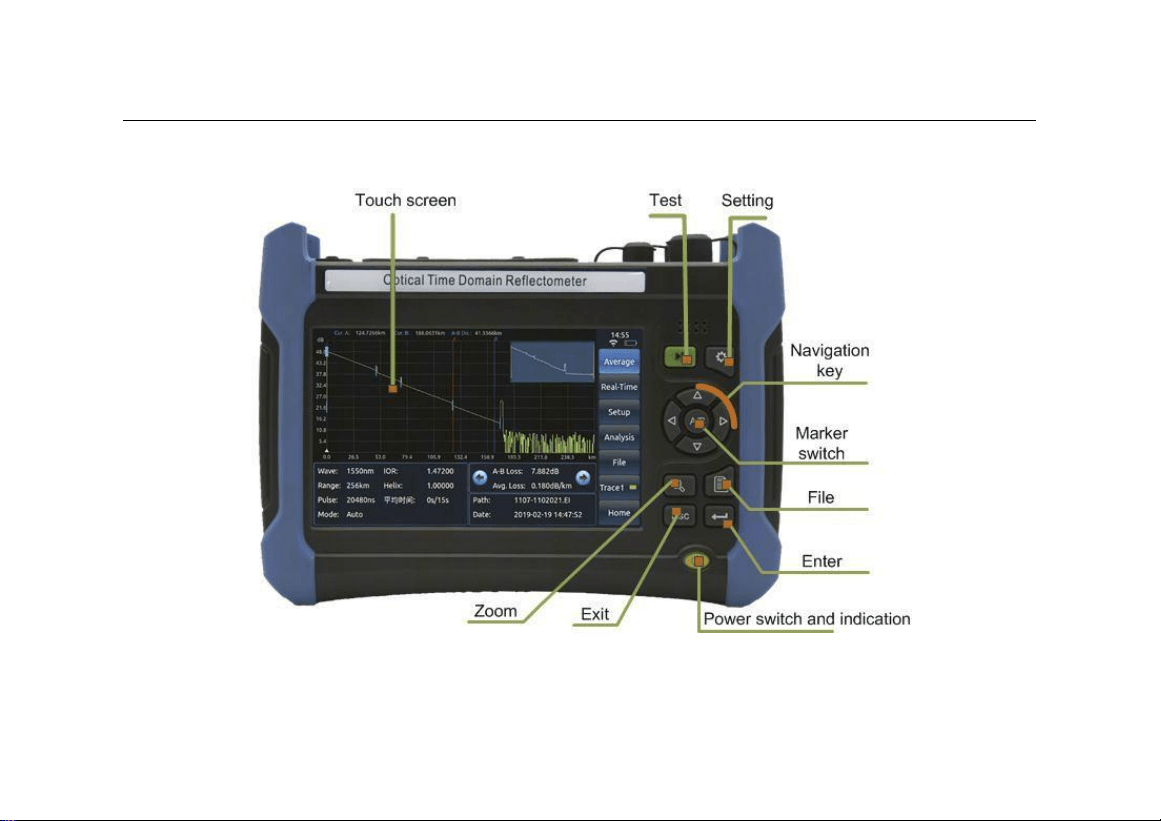
The front panel of the optical time domain reflectometer is shown in Figure 1-1:
Chapter I Overview
17
Figure 1-1 Front panel of optical time domain reflectometer
Chapter I Overview
18
OTDR2 optical interface OTDR1 optical interface
Power adapter jack
Optical power meter
interface
Red optical
interface
3.5 mm
headset
Micro SD
Cardslot
10/100MInternet
acess
8.2
Instrument side plate
The side plate of the optical time domain reflectometer is shown in Figure 1-2:
Figure 1-2 Side plate of optical time domain reflectometer

19
Part I Instructions
Part I Instructions
20
Chapter II Main operation interface
Chapter II Main operation interface
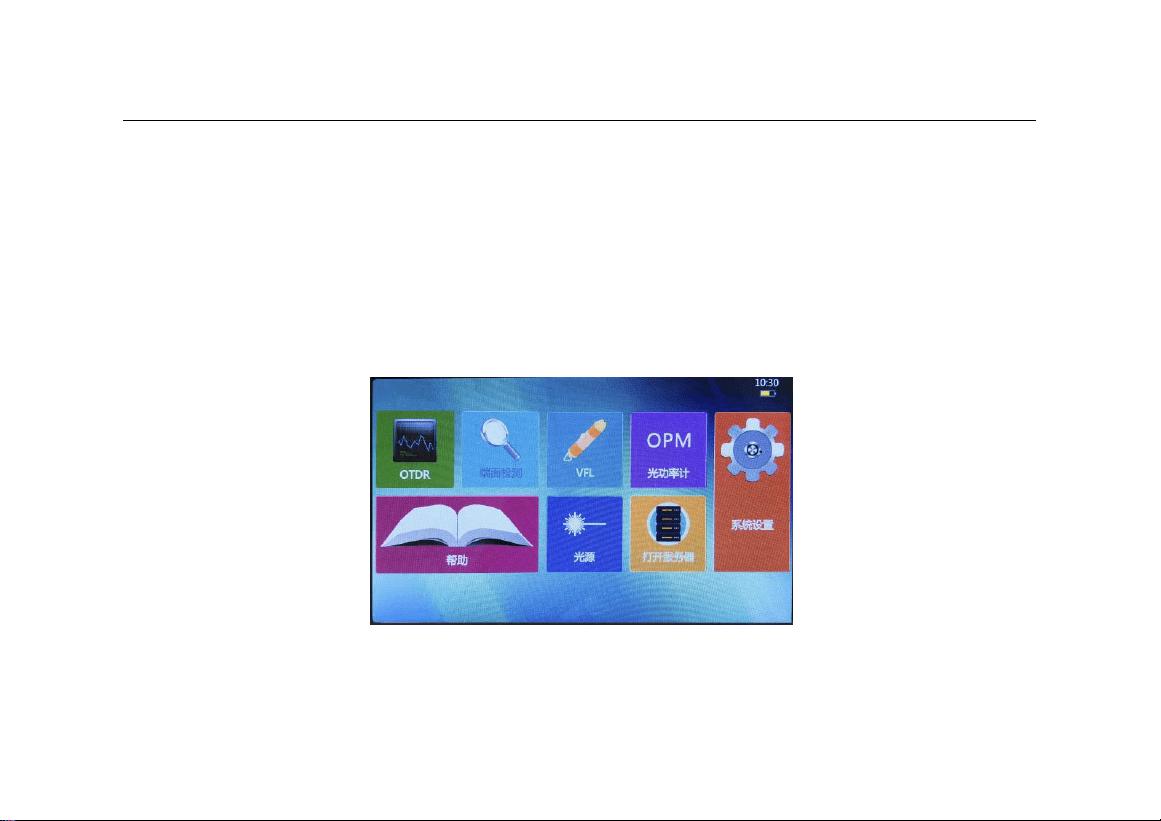
The optical time domain reflectometer can be equipped with optional functions such
as optical power meter, light source, visual fault location (VFL) and end face detection.
Select the main menu under the system menu, and the operation function module
selection interface shown in Figure 2-1 will appear.
Figure 2-1 Schematic diagram of the main operation interface

21
Chapter II Main operation interface
Click any of the six buttons of [OTDR], [Optical power meter], [Optical source], [VFL],
[End face detection] and [Help] in the interface to enter the corresponding module
operation interface and realize the corresponding functions.
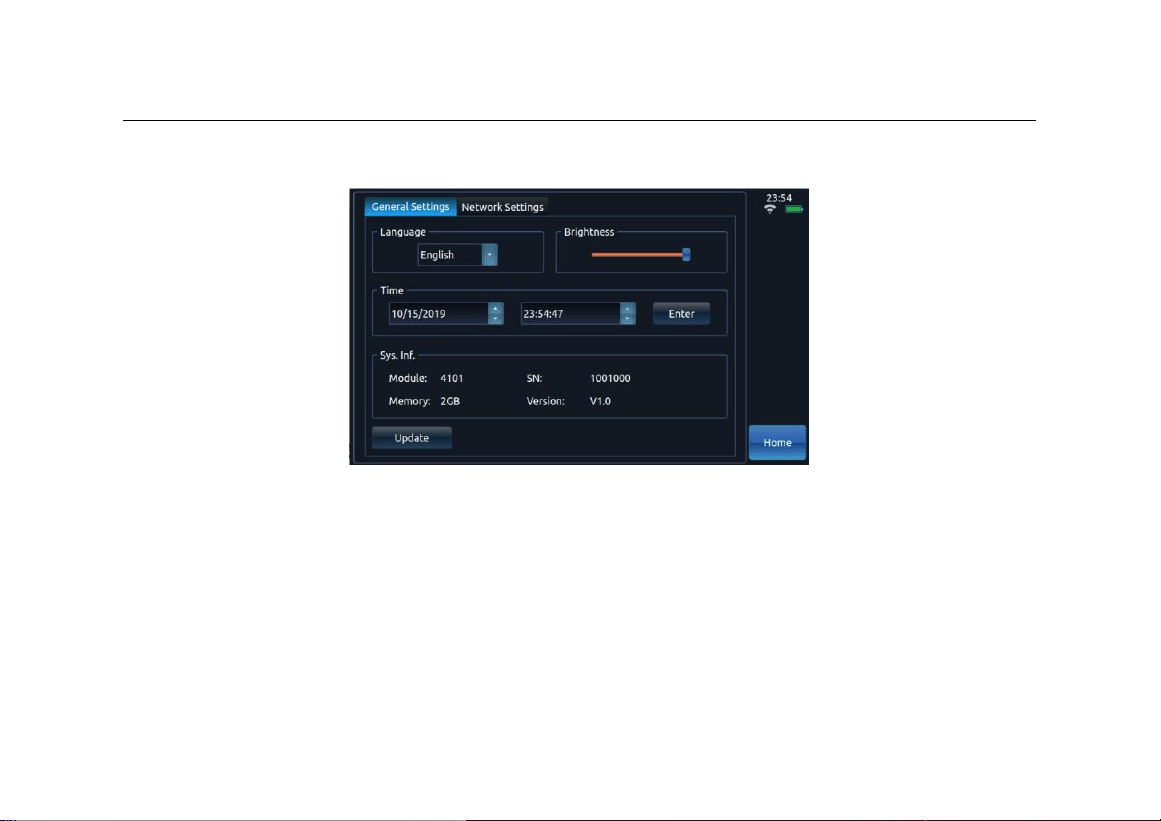
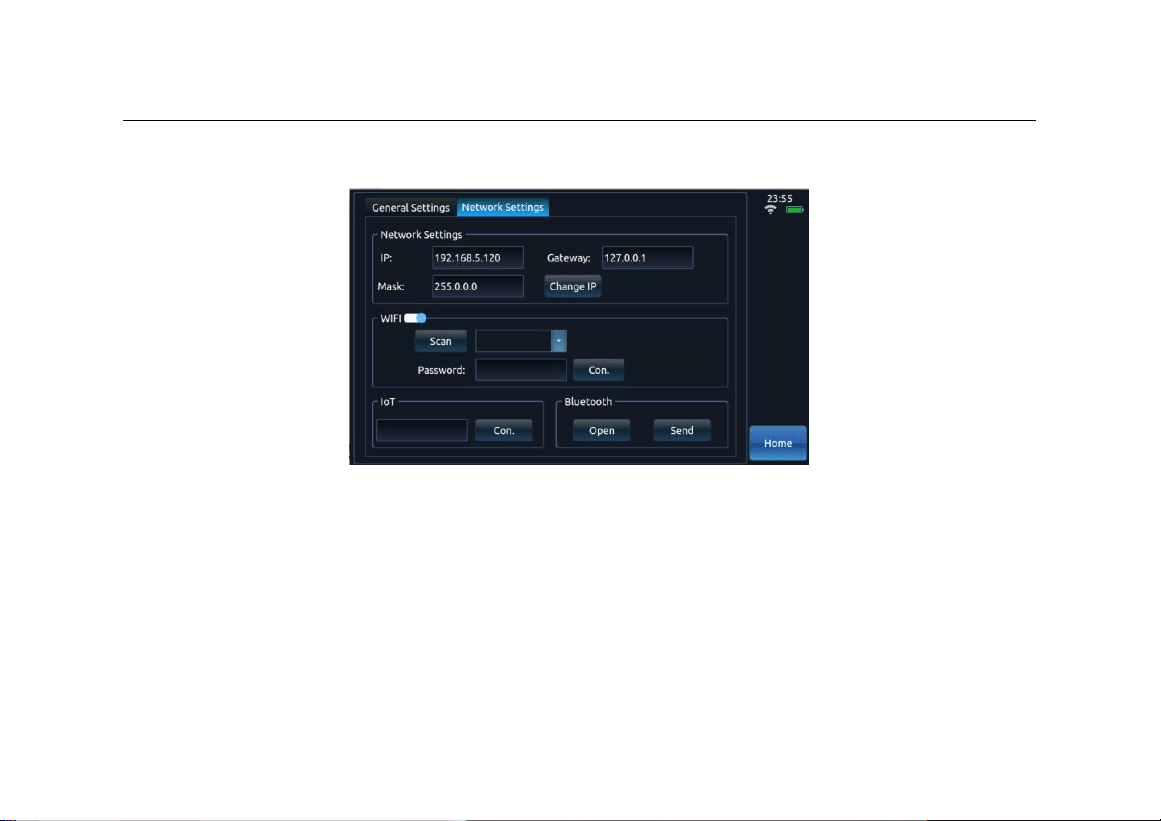
Click the [system setting] button to enter the system setting interface, and carry out
general settings and network settings respectively.
General Settings include language Settings, screen brightness settings, time settings,
system information, and system upgrades, as shown in Figure 2-2.
22
Chapter II Main operation interface
Figure 2-2 Schematic diagram of general setting interface
Network Settings include network settings, WIFI scanning and connection, Internet of
Things connection and bluetooth connection, as shown in Figure 2-3.
23
Chapter II Main operation interface
Figure 2-3 Schematic diagram of network setup interface
24
Chapter III Optical power meter module
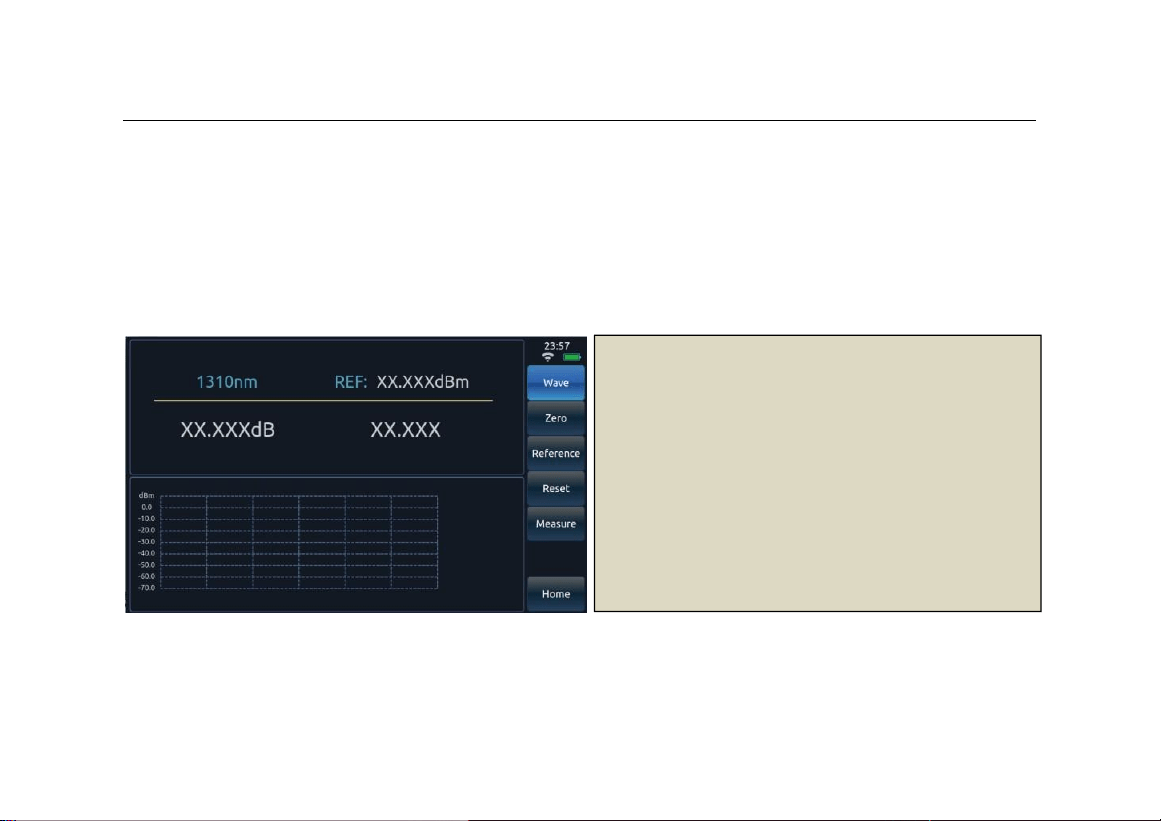
[Wavelength]: Change the test wavelength of
the power meter.
[Zero adjustment]: Adjust the zero point of the
power meter
[Ref]: Set the current test value to the
reference value
[Reset Ref] : Reset the set reference value
[Test] : Start or stop the power meter test
[Main Menu] : Exit the power meter operation
interface and return to the main operation
interface.
Chapter III Optical power meter module
If the instrument you purchased is equipped with the optical power meter function, click
the [Optical power meter] button in Figure 2-1 to enter the operation interface of the
optical power meter, as shown in Figure 3-1.
Figure 3-1 Operation interface and description of optical power meter module
25
Chapter IV Optical source module
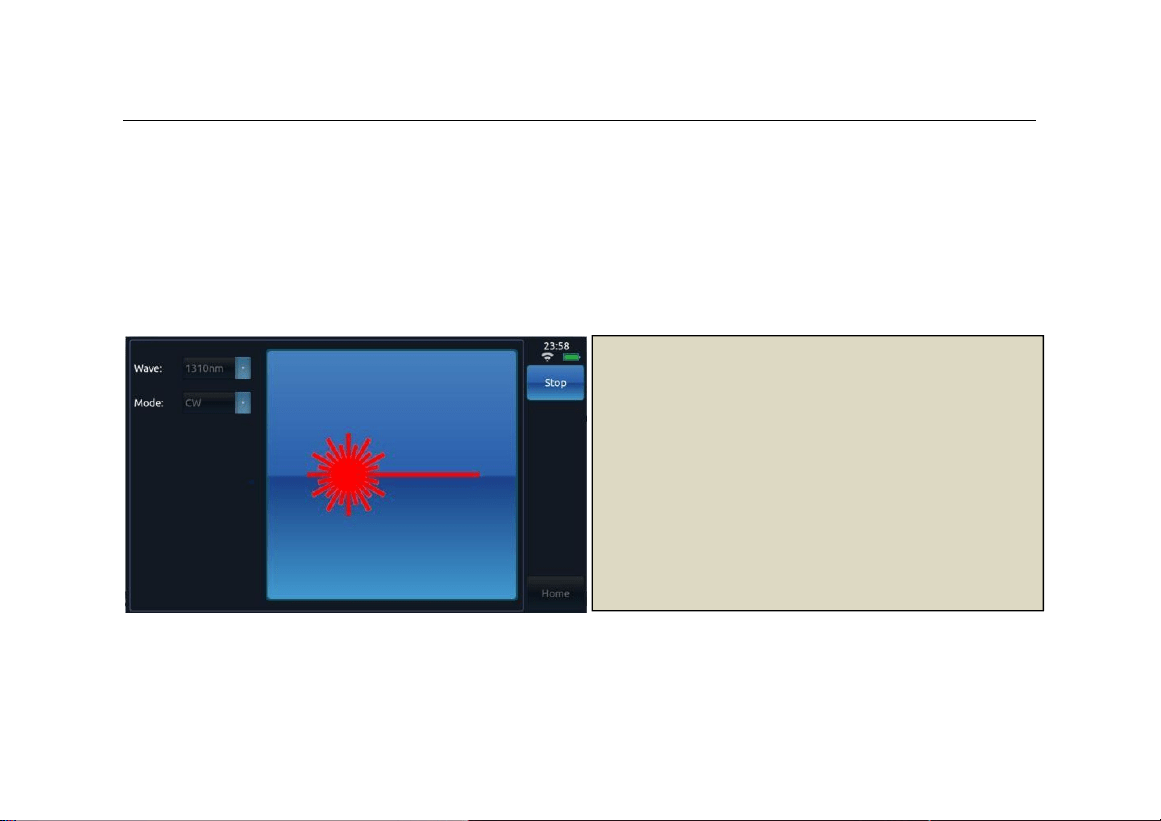
[Start]: Start or stop the optical source module
test.
[Wavelength]: Select the test wavelength of the
optical source.
[Mode]: Change the working mode of the light
source.
[Main Menu] : Exit the optical source operation
interface and return to the main operation
interface.
Chapter IV Optical source module
If the instrument you purchased is equipped with optical source function, click the
[Optical source] button in Figure 2-1 to enter the optical source operation interface, as
shown in Figure 4-1.
Figure 4-1 Operation interface and description of optical source module
26
Chapter V Visual fault locator module
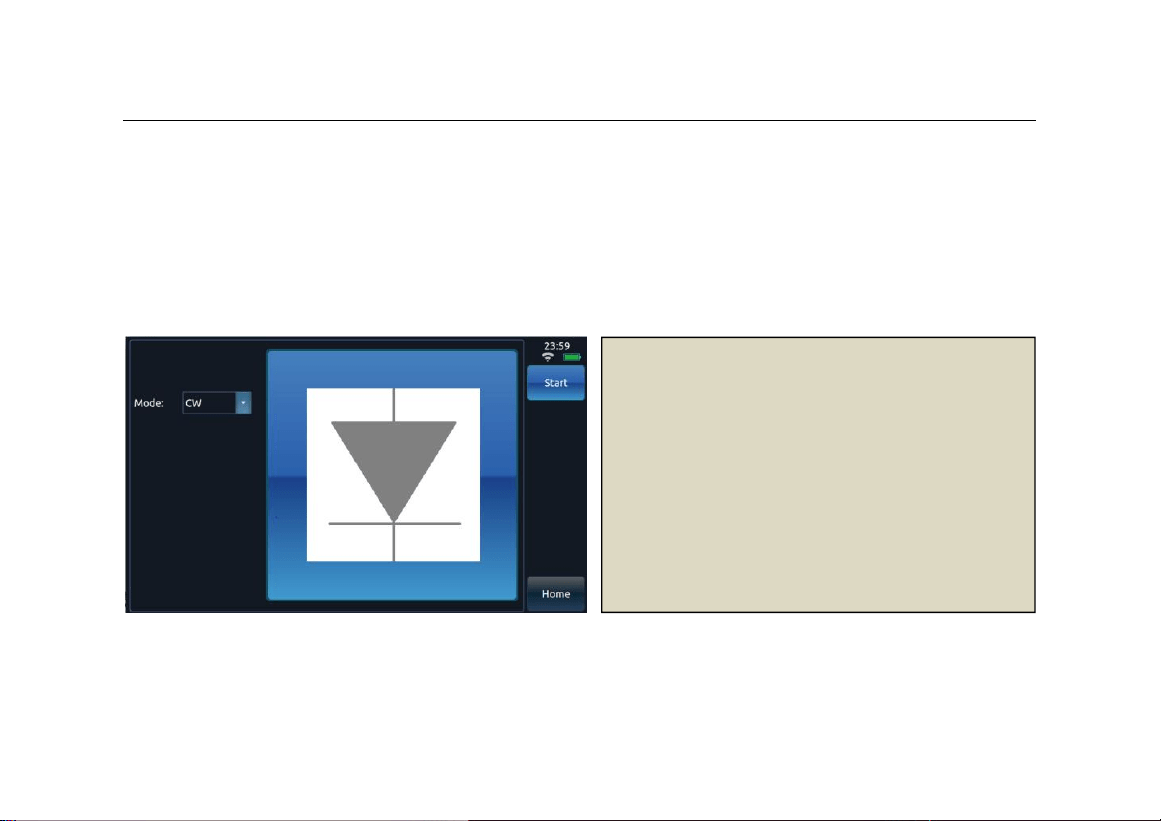
[Start]: Start or stop the VFL module test.
[Mode]: Select the VFL operating mode.
[Main Menu]: Exit the VFL interface and
return to the main operation interface.
Chapter V Visual fault locator module
If the instrument you purchased is equipped with the function of visual fault locator, click
the [VFL] button in Figure 2-1 to enter the operation interface of visual fault locator, as
shown in Figure 5-1.
Figure 5-1 Visual fault locator module operation interface and description
27
Chapter VI End face detection module
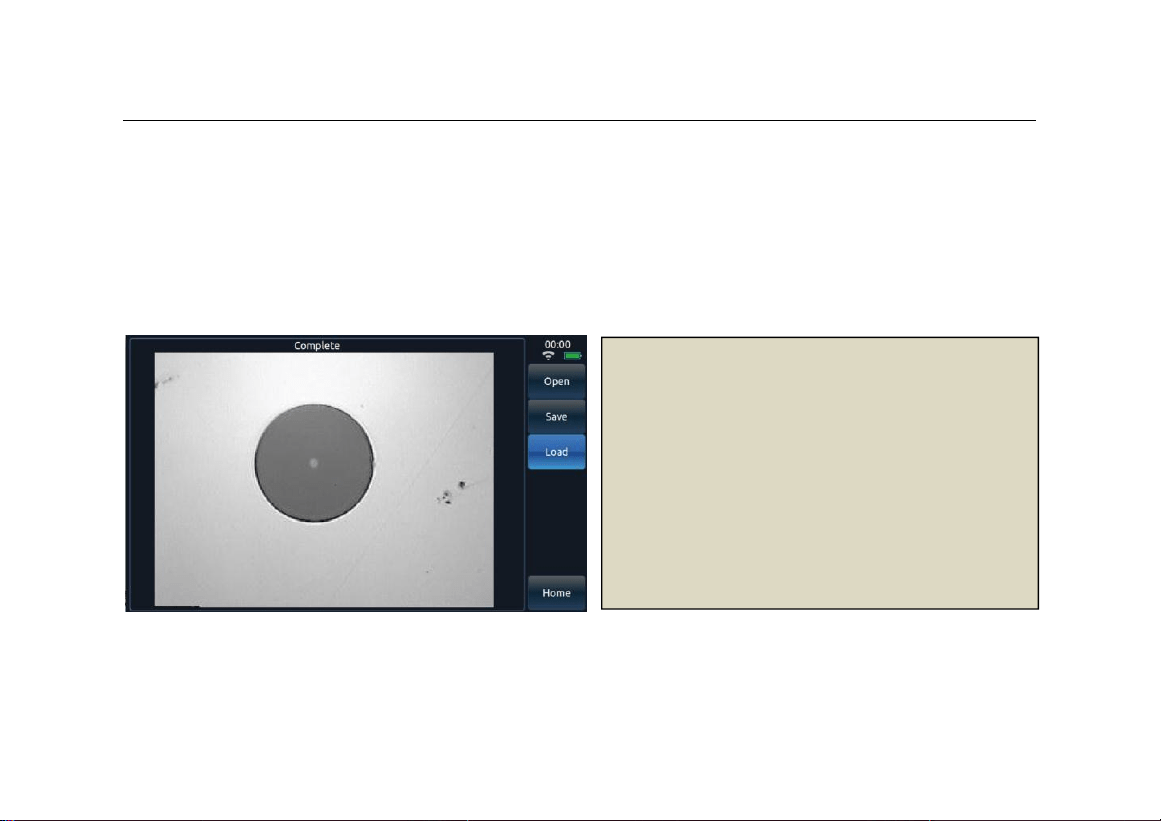
[Turn on Video]: Turn on or off the end face
detection camera
[Save Screenshot]: Save the image obtained
by the camera
[Load Screenshot]: Load and display the
saved image
[Main Menu] : Exit the end face detection
operation interface and return to the main
operation interface
Chapter VI End face detection module
If the instrument you purchased is equipped with the end face detection function, click
the "End Face Detection" button in Figure 2-1 to enter the end face detection operation
interface, as shown in Figure 6-1.
Figure 6-1 Operation interface and description of end face detection module

28
Chapter VII Module of optical time domain reflectometer
Chapter VII Module of optical time domain reflectometer
1 Main operation window description
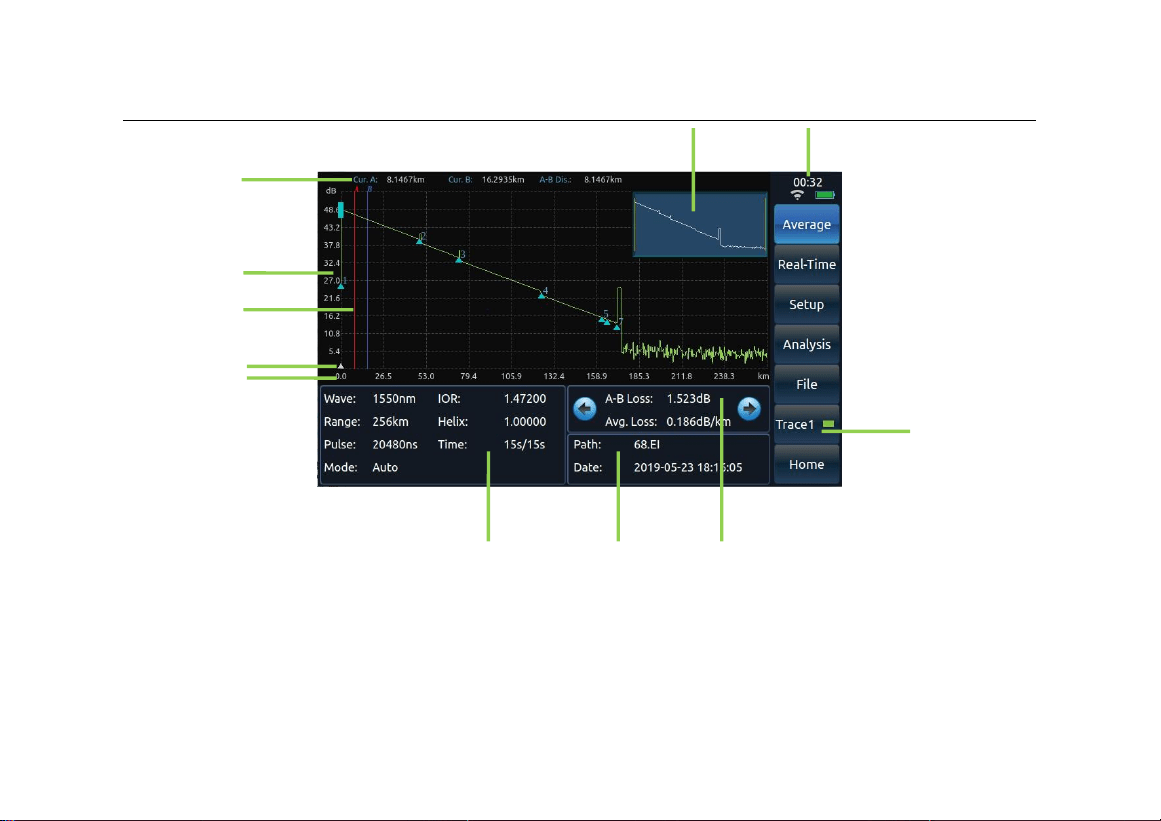
Click the [OTDR] button in Figure 2-1 to enter the operation interface of the optical time
domain reflectometer. The Testing interface of the optical time domain reflectometer
is shown in Figure 7-1:

29
Chapter VII Module of optical time domain reflectometer
30
Chapter VII Module of optical time domain reflectometer
3
1
6
11
5
4
7
12
10
8
9
2

31
Chapter VII Module of optical time domain reflectometer
Figure 7-1 Operation interface of optical time domain reflectometer

32
Chapter VII Module of optical time domain reflectometer
1) It displays the current system time, battery power and WiFi connection.
2) Test results display area. The test results are calculated based on the current
marker position. Average loss: the loss between marker A and B and the
average loss of the optical fiber segment where the cursors A and B are located;
connection loss: four cursors will be displayed in the main interface of OTDR,
and the connection loss of the connection point where marker A is displayed in
the test results; reflection loss: the test result displayed in the main interface of
OTDR is the reflection loss of the optical fiber reflection peak where markers A
and B are.
3) Display small waveforms globally. Always display a global overview of the test
curve waveform.
4) Reference origin.
5) Current active marker. The active marker is red, the position of the marker can
be changed by pressing a button or clicking the touch screen, and the other
marker is blue. The active marker can be set iteratively between the on-screen
markers by pressing a key.

33
Chapter VII Module of optical time domain reflectometer
Instruction!
6) The distance between the marker position and the reference point. The position
between the two markers.
7) Menus bar.
8) Test conditions display column. Display the current test range, wavelength,
pulse width, test mode and other test conditions.
9) The filename and saving time of the currently read file. If the current test curve
is the one saved in the file read, the file name read and the time saved are
shown here.
10) Color indication of current test curve. This icon table shows the line color of the
test curve with the current sequence number.
11) The scale in the vertical direction.
12) The scale value in the horizontal direction.
The distance of the current active marker and the distance of the event points in the

34
Chapter VII Module of optical time domain reflectometer
event table are calculated from the reference origin. The distance displayed on the
left of the reference origin is negative, while the distance displayed on the right is
positive.
When the instrument is manufactured, the default reference point is the test port of
OTDR, that is, the test origin.
If the reference origin is set, the instrument will automatically save, and the saved
reference origin will be automatically called out after the next boot.
The instrument is allowed to display four test curves at the same time, respectively
represented by curves 1, 2, 3 and 4:
The analysis, movement and calculation of the curve only focus on the current
active curve.
The line color of the current curve is the same as that of the icon on the button.
Through the curve switch button in the menu bar, you can switch between curves 1,
2, 3 and 4.
Only curves with the same test range can be displayed simultaneously.

35
Chapter VII Module of optical time domain reflectometer
2 Event list window description
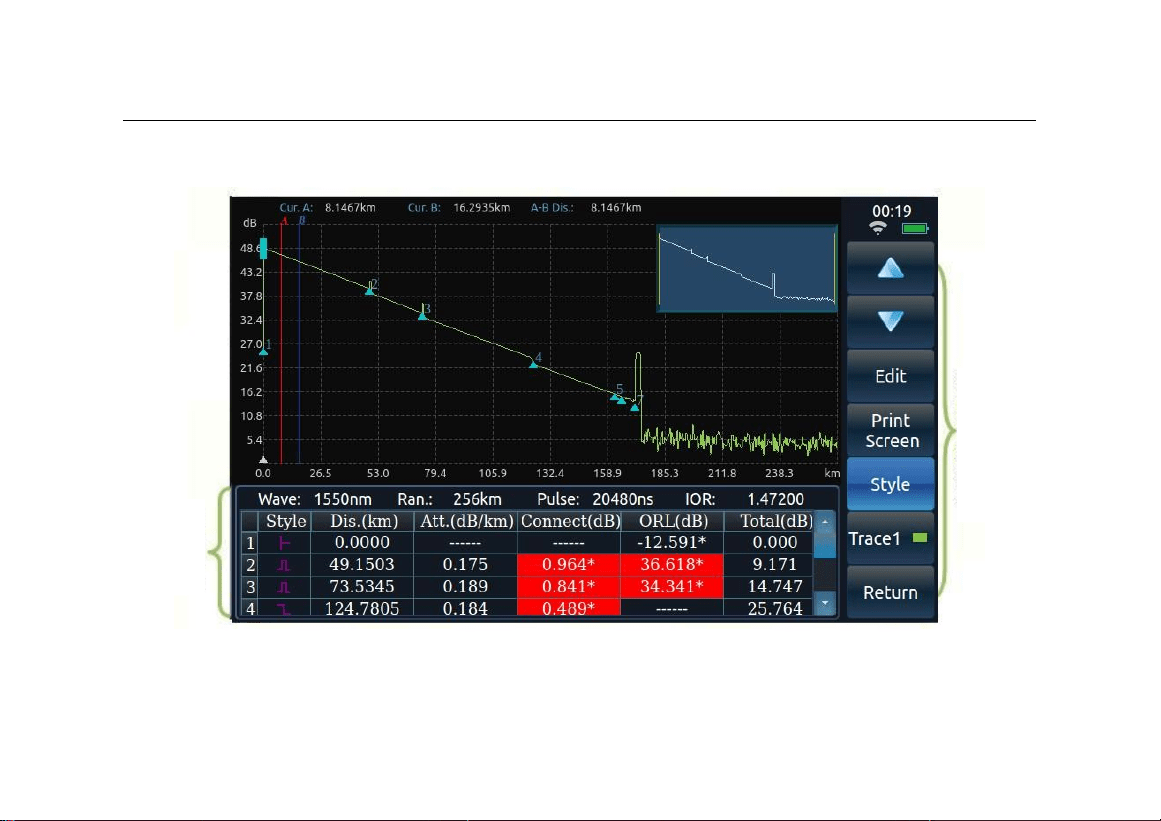
Under the main operation interface shown in Figure 7-1, click the [Analysis] button to
analyze the current trajectory curve and display the event list. The schematic diagram of
the event list window is shown in Figure 7-2.
36
Chapter VII Module of optical time domain reflectometer
Event list
submenu
Event
list
Figure 7-2 Analysis interface of optical time domain reflectometer

37
Chapter VII Module of optical time domain reflectometer
Each item in the event list is explained as follows (take the distance unit km as an
example) :
1) Event type:
: It indicates that this event point may be the starting point of the fiber.
: It indicates that this event point is a descending event point.
: It indicates that this event point is an ascending event point.
: It indicates that this event point is a reflection event point.
: It indicates that this event point may be the end of the fiber.
2) No.: The number of the current event point.
3) Distance (km): The distance from the current event point to the reference origin.
4) Attenuation (dB/km) : Average loss of the fiber before the current event point.
5) Loss (dB): Connection loss measured at the current event point. * It indicates
that the current measured connection loss is greater than the set connection

38
Chapter VII Module of optical time domain reflectometer
Instruction!
loss passage threshold.
6) Reflection (dB): Reflection loss measured at the current event point. * It
indicates that the current measured reflection loss is greater than the set
reflection loss passing threshold.
7) Total (dB): Total loss of the fiber segment between the current event point and
the reference point.
During data analysis, there will be three kinds of threshold setting: loss analysis
threshold, loss passing threshold (including the threshold of joint loss and reflection
loss), and optical fiber terminal threshold.
In the event list, only the event points whose joint loss is greater than the set loss
analysis threshold will be displayed, and the event points whose joint loss is less
than the set loss analysis threshold will be ignored.
A value marked with * indicates that the value is greater than the set loss passage
threshold.

39
Chapter VII Module of optical time domain reflectometer
If the calculated joint loss is greater than the set terminal threshold, this point is
taken as the end of the fiber, and all subsequent event points will be ignored and will
no longer be displayed.
3 Graphical analysis window description
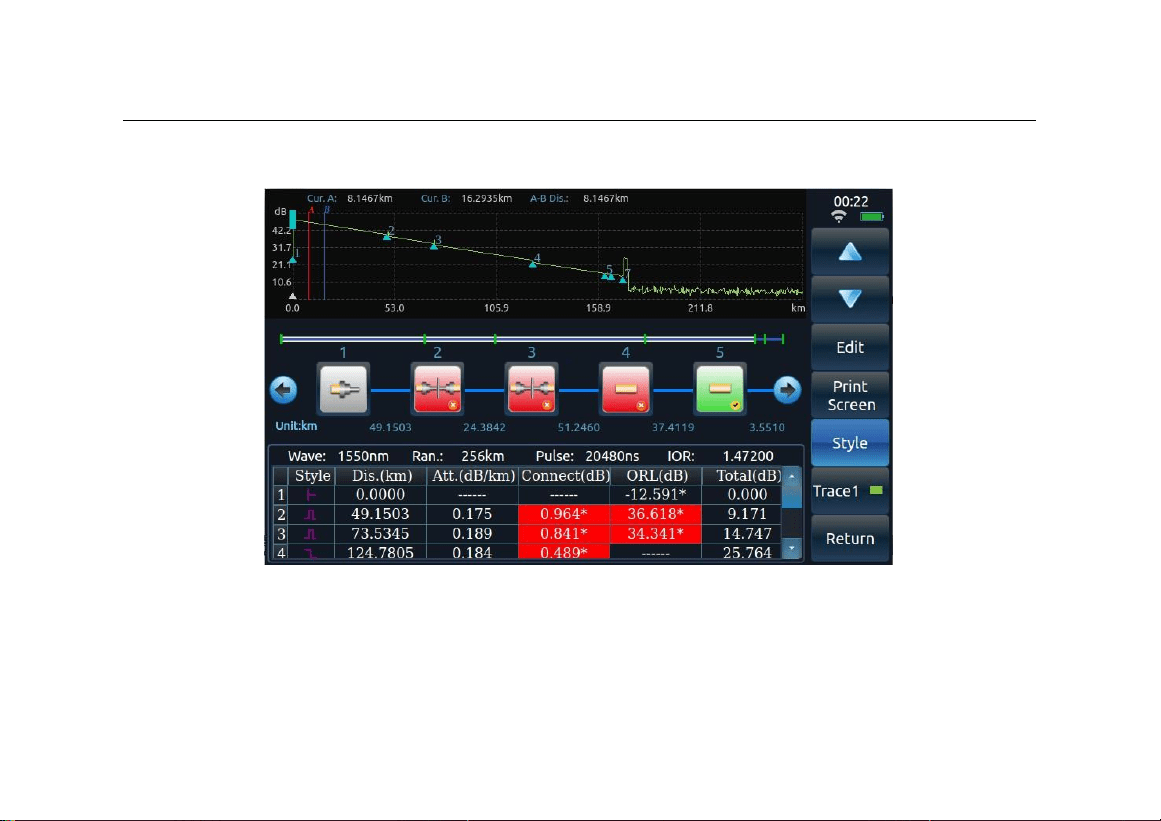
After selecting graphical analysis, click the [Switch Mode] button to perform graphical
analysis of the current trajectory curve and display the graphical analysis interface. The
schematic diagram of the graphical analysis window is shown in Figure 7-3.
40
Chapter VII Module of optical time domain reflectometer
Fig. 7-3 Graphical analysis interface I
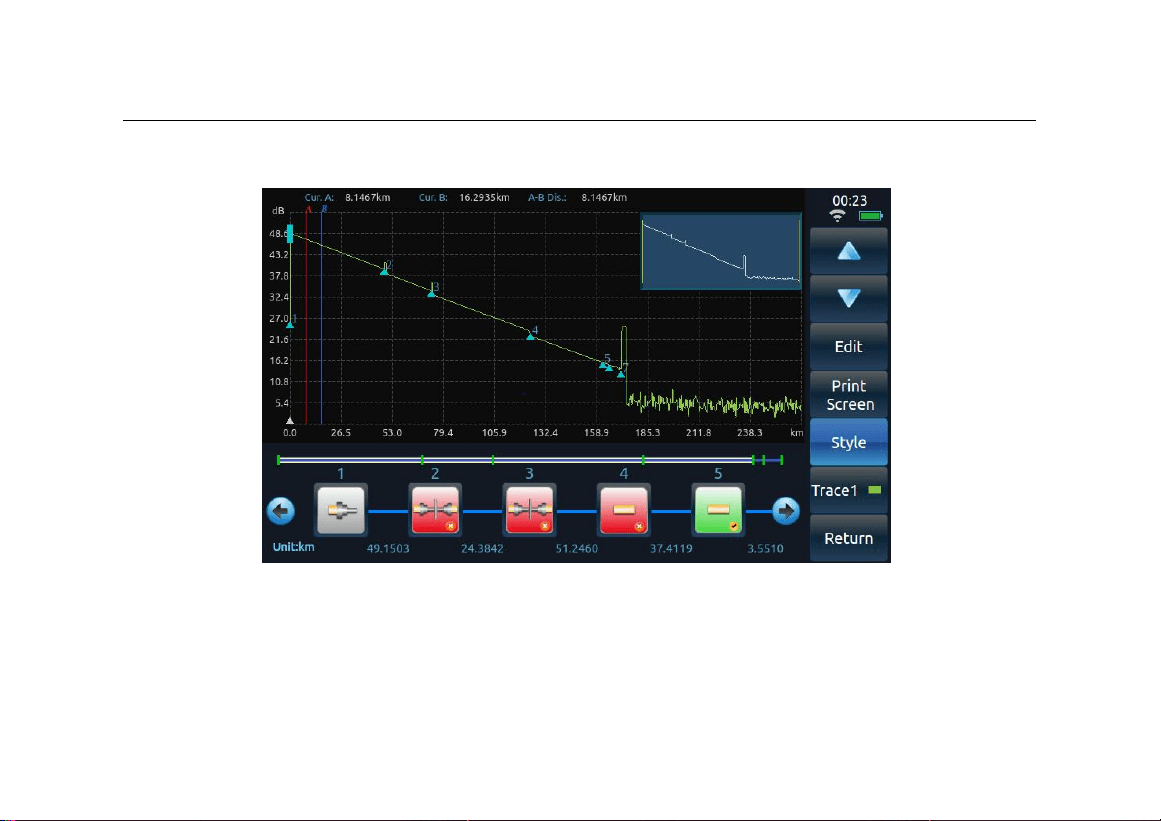
Click the [Switch Mode] button again, and the interface state will be switched, as shown
in Figure 7-4.
41
Chapter VII Module of optical time domain reflectometer
Fig. 7-4 Graphical analysis interface II
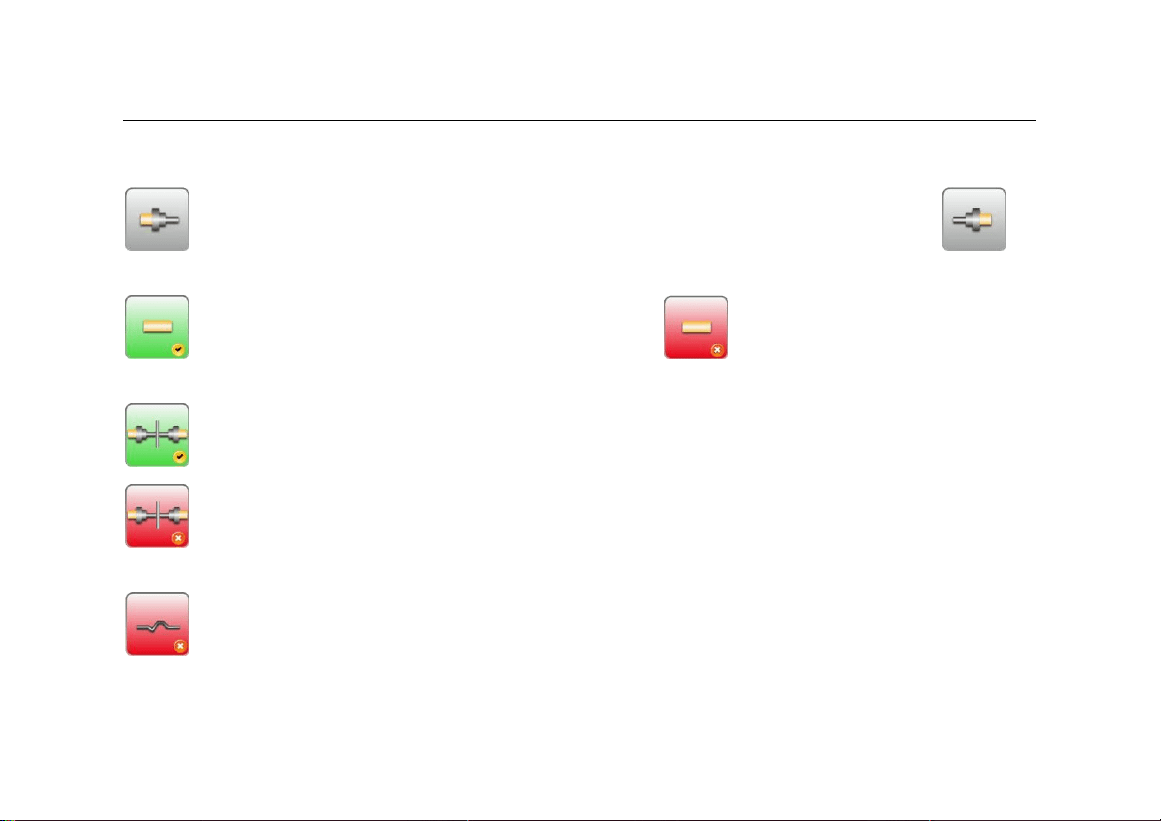
The meaning of each figure in the graphical analysis window is explained as follows:
42
Chapter VII Module of optical time domain reflectometer
: It indicates that this event point may be the starting point of the fiber. : It
indicates that this event point may be the end of the fiber.
: The junction satisfies the passing condition. : The connection loss at the
junction exceeds the threshold and the passing condition is not met.
: The connector meets the passing condition.
: The connection loss or reflection loss at the connector exceeds the threshold and
does not meet the passing condition.
: There is a macro bend.
43
Chapter VII Module of optical time domain reflectometer
Average
Real-time
Setting
Analysis
File
Curve
Main
menu
Control OTDR to refresh test or stop test in real time
Control OTDR to average progressively the loss curve of the test with the set
average time
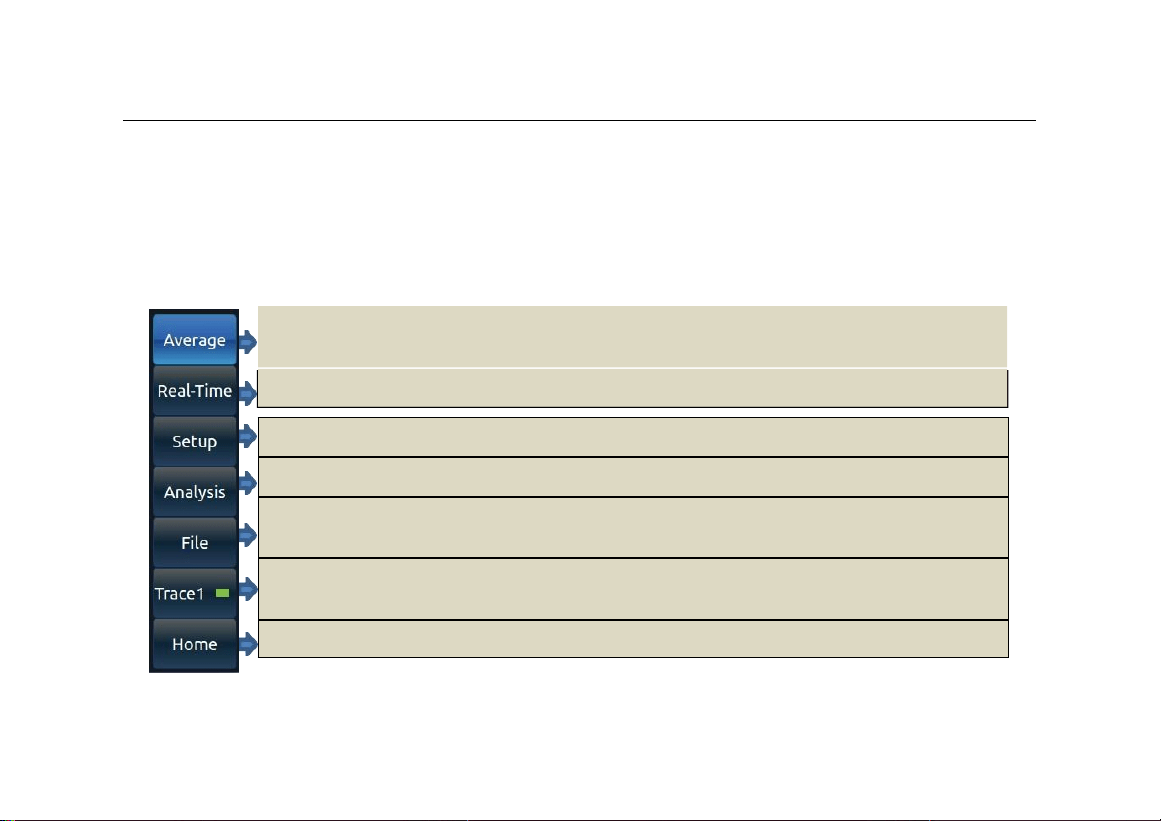
4 Main menu structure and function overview
The main menu bar is displayed by default in the main operation window, which contains
seven menu item buttons, as shown in Figure 7-5.
Enter the parameter setting sub-menu to realize OTDR test condition setting
Analyze the current test curve and give a list of events
Enter the file operations submenu. Such functions as reading files, saving files
and so on can be realized
Switch between display curves (curve 1 in green; Curve 2 in yellow; Curve 3 in
orange; Curve 4 in blue)
Return to the main instrument menu for module selection, system Settings, etc

44
Chapter VII Module of optical time domain reflectometer
Figure 7-5 Menu buttons and main functions of main menu bar of the OTDR
The functions of each button on the menu bar are detailed as follows:
1) [Average]: This button is used to control the progressive average of the
average time set by OTDR to the test loss curve. When the test is finished, the
content displayed on this button will automatically change from [Stop] to
[Average], and OTDR will stop the test.
2) [Real-time] : This button is used to control OTDR to refresh test or stop test in
real time, only available in manual test mode. In the manual test mode, click the
button, and the content displayed on the button changes to [Stop]. At this time,
OTDR will refresh the tested fiber loss curve in real time. Click this button again,
the content displayed on the button changes back to [Real-time], and OTDR
stops testing.
3) [Setting] : Enter the parameter setting sub-menu to realize OTDR testcondition
setting, reference origin setting, optical cable information setting and other
functions.
4) [Analysis] : Analyze the current test curve and give a list of events. If the event

45
Chapter VII Module of optical time domain reflectometer
point is not found, a prompt is given.
5) [File] : Enter the file operation sub-menu. It can read files, save files, delete files,
transfer files, print files and realize other functions.
6) [Curve 1] : Display the curve selection window, in which you can select the
curve serial number to make the current active curve switch between curve 1,
curve 2, curve 3 and curve 4. Curve 1 is green; Curve 2 is yellow; Curve 3 is
orange; Curve 4 is blue.
7) [Main menu]: Return to the main menu of the instrument for module selection
and system setting.
5 Application method
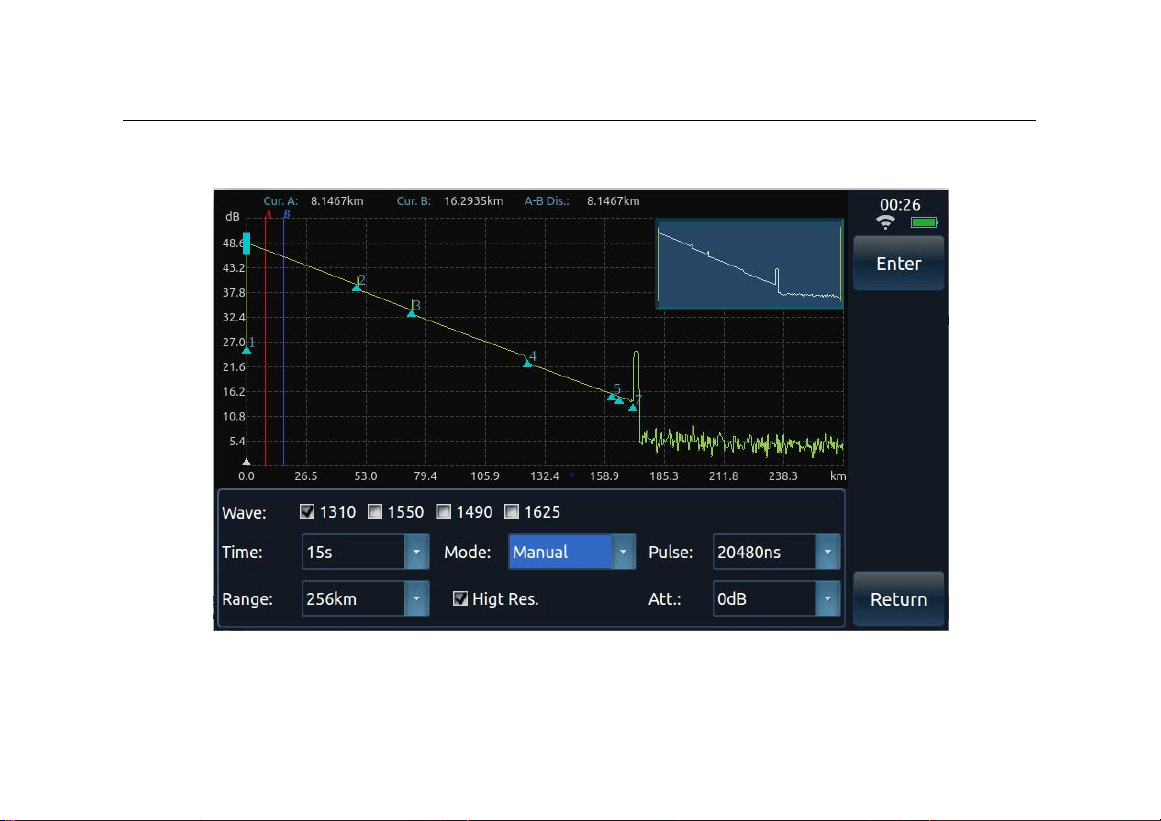
Before testing the optical fiber link, first set the OTDR test mode and various test
parameters. Click the [Set] button in Figure 7-5, and then click the [test conditions]
button to set the test conditions, as shown in Figure 7-6.
46
Chapter VII Module of optical time domain reflectometer
Figure 7-6 Test condition setting interface

47
Chapter VII Module of optical time domain reflectometer
Instruction!
Note!
Before starting the test, it is necessary to ensure that the tested fiber does not
contain any active signal; otherwise it may cause permanent damage to the
instrument.
The OTDR module of the instrument has two optical output ports. Please pay
attention to the OTDR module number selected by the instrument. During the test,
please connect the tested fiber to the correct test port; otherwise it may lead to the
failure of obtaining accurate test data.
When the test mode is selected as automatic test, the test is automatically analyzed
and a list of events is given when the test stops.
After curve analysis:
Event points where the connection loss is greater than the loss analysis threshold will be
marked. Event points where the connection loss is less than the loss analysis threshold

48
Chapter VII Module of optical time domain reflectometer
are automatically ignored.
In the event list, connection loss and reflection loss greater than the set loss through the
threshold will be marked with “*”.
When the connection loss of the event point is greater than the threshold value of the
fiber break point, the event point is considered as the fiber break point. All events after
this event point are ignored and not shown in the list.
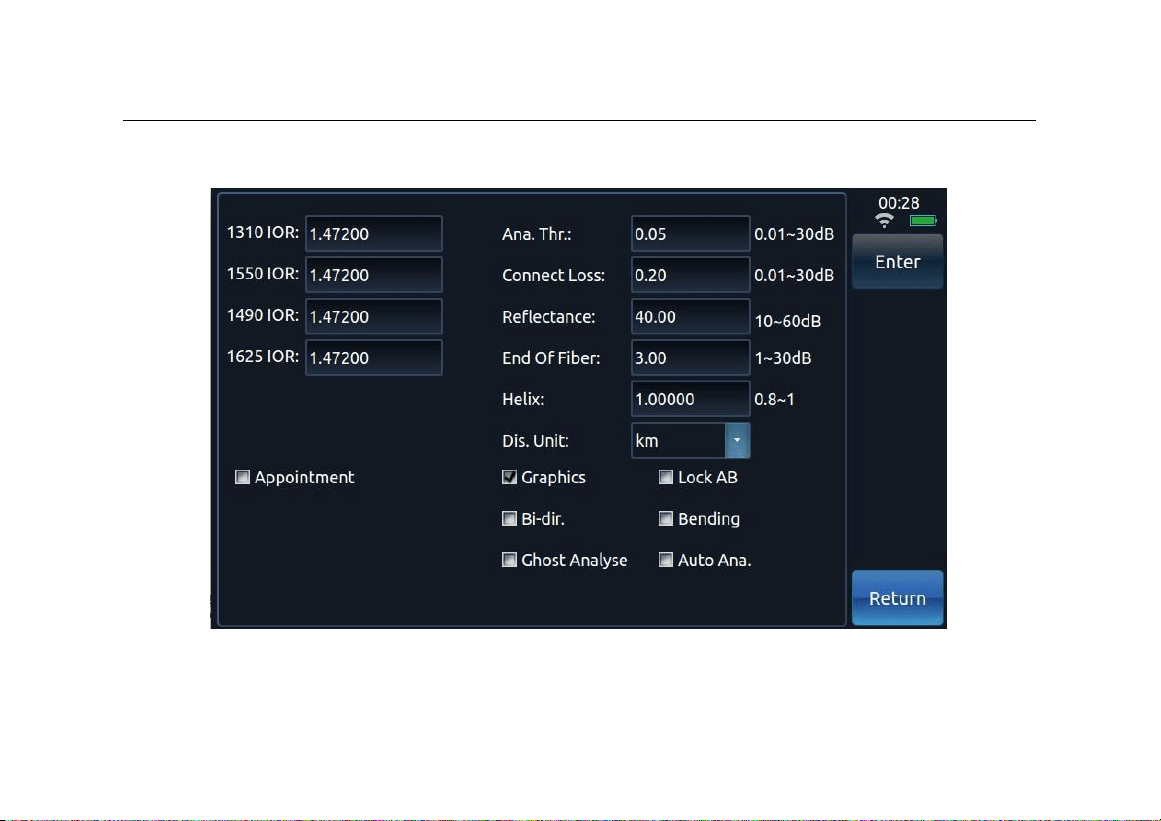
Click the [Set] button in Figure 7-5, and then click the [Link Definition] button to set the
link definition, as shown in Figure 7-7.
49
Chapter VII Module of optical time domain reflectometer
Figure 7-7 Link definition setting interface

50
Chapter VII Module of optical time domain reflectometer
5.1
Testing fiber link
The operation steps are as follows:
1) Select the test wavelength.
2) Set test conditions such as test wavelength mode.
3) Clean the fiber to be tested.
4) Connect the tested fiber to the corresponding OTDR optical input port.
5) Press the test key to obtain the waveform curve of the tested fiber.
6) After the test:
If [Auto Test] mode or [Auto Analysis after Sampling] is selected, the
instrument will automatically analyze the test curve, mark the event points
according to the set loss analysis threshold, and give the event list.
Otherwise, click the [Analysis] button in the main menu bar. The instrument
will analyze the test curve, mark the event points according to the set loss
analysis threshold, and give the event list.

51
Chapter VII Module of optical time domain reflectometer
7) After curve analysis, test results can be viewed in the event list.
5.2
Test mode of OTDR
OTDR has two test modes: automatic test and manual test.
1) Automatic test :
When OTDR test mode is set to automatic test: After the test key is pressed, OTDR
will automatically adjust the test conditions to test the tested fiber link. After the test
is completed, curve analysis will be performed automatically, and the test curve and
event list will be displayed in the main operation window.
2) Manual test:
When OTDR test mode is set to manual test: After clicking the [Real-time] button in
the main menu bar (at this time, the content on the [Real-time] menu button
changes to [Stop]), OTDR will conduct real-time scanning test on the tested fiber
link according to the currently set test conditions, and the test curve in the main
operation window will be constantly refreshed. When OTDR test mode is set to
manual test: After pressing the test key or clicking the [Average] button in the main

52
Chapter VII Module of optical time domain reflectometer
Instruction!
menu bar (at this time, the content on the [Average] menu button changes to [Stop]),
and OTDR will average the tested fiber link according to the set test conditions. The
test curves in the main operation window will be averaged continuously until the
average time displayed on the interface equals the set average time, and OTDR will
stop testing.
Manual test mode carries out single real-time or average test according to manually
or automatically set test conditions (i.e. range, pulse width and attenuation).
In the automatic test mode, the instrument will automatically set and adjust the test
conditions according to the condition of the tested fiber.
Real-time test under manual test mode can observe the fiber line under test in real
time.
The average test under manual test mode can obtain the test curve with higher SNR,
which is more smooth, and conducive to data analysis, with more accurate test
results.

53
Chapter VII Module of optical time domain reflectometer
In the automatic test mode, after the test, the instrument will analyze the test curve
and give a list of events. In other test modes, only when the [Post-test analysis]
function is selected can the instrument automatically analyze the test curve after
stopping the test. Otherwise, it must click the [Analysis] button in the main menu bar
to analyze the curve and then give a list of events.
5.3
Test parameter of OTDR
OTDR test parameters include: wavelength, range, pulse width, average time, refractive
index, fiber optic cable correction factor, etc.
1) Wavelength:
It is used to set the test wavelength of OTDR. The number of wavelengths
allowed to be selected by OTDR is determined by the module of the
instrument, and up to 4 wavelengths can be selected.
Multiple wavelengths are allowed to be selected simultaneously in average
test and automatic test mode. During the test, the instrument will test at
each selected wavelength in turn until all the selected wavelengths have
been tested. The instrument is allowed to select up to four wavelengths at
54
Chapter VII Module of optical time domain reflectometer
the same time.
When the module equipped with the instrument includes both single and
multi-mode modules, please pay attention to connect the tested fiber to the
corresponding test interface to ensure the correct test curve.
2) Measuring range (km) :
It is used to set the scan curve range. The range of the optical time
domain reflectometer is divided into the following stages: 400m, 800m,
1.6km, 3.2km, 8km, 16km, 32km, 64km, 128km, 256km and 512km (the
maximum optional range is related to the selected module).
Instruction!
The measuring range must be larger than the length of the fiber under test
(preferably larger than twice the length of the fiber under test)
3) Pulse width (ns) :
It is used to set the width of the laser pulse to be used in the test. The
larger pulse width can be used to test the longer fiber. The signal-to-noise
Chapter VII Module of optical time domain reflectometer
53
Instruction!
The pulse width that can be set depends on the selected test range
Instruction!
The longer the average time, the smoother the test curve (i.e., the higher
the SNR, especially useful for testing long distance optical fibers).
The increased SNR of the test curve is beneficial to OTDR detection of
smaller event points.
In automatic test mode, more average times will affect the speed of
automatic test.
ratio of the test curve is better, the curve is smoother, but the resolution is
poor. The smaller pulse width has a higher resolution, but the
measurement distance is shorter, and the signal-to-noise ratio the test
curve is poor.
4) Average time:
It is used to set the maximum average time for average testing and
automated testing. In the average test mode, the values are 15, 30, 45, 60,
90, 120 and 180. In the auto test mode, the values are 15, 30, 45, 60, 90,
120 and 180.
Chapter VII Module of optical time domain reflectometer
54
Note!
If the refractive index is not set accurately, the length of the fiber measured is also
inaccurate.
Note!
If cable correction is not accurate, the cable length measured is not accurate.
5) Refractive index:
The refractive index of optical fiber or cable can be obtained from the
manufacturer. The refractive index can be set to 1.00000 ~ 2.00000.
6) Cable correction:
The fiber optic cable correction factor is inserted to take into account the
error between the length of the fiber and the length of the fiber. It is
available from fiber optic cable manufacturers. Its value can be set to
0.80000 to 1.00000. The default value is 1.00000.

Chapter VII Module of optical time domain reflectometer
55
7) Lock markers A and B:
When this option is selected, the distance between marker A and marker B
is locked. When either marker is moved, the two markers move together,
keeping the distance between them the same. If this is not selected, when
one marker is moved, the other one remains in its original position.
8) High resolution test:
When this option is selected, the maximum number of sampling points of
the instrument is increased to 256k, which enhances the resolution of
events occurring within a short distance in the fiber link under test.
5.4
Test items of OTDR
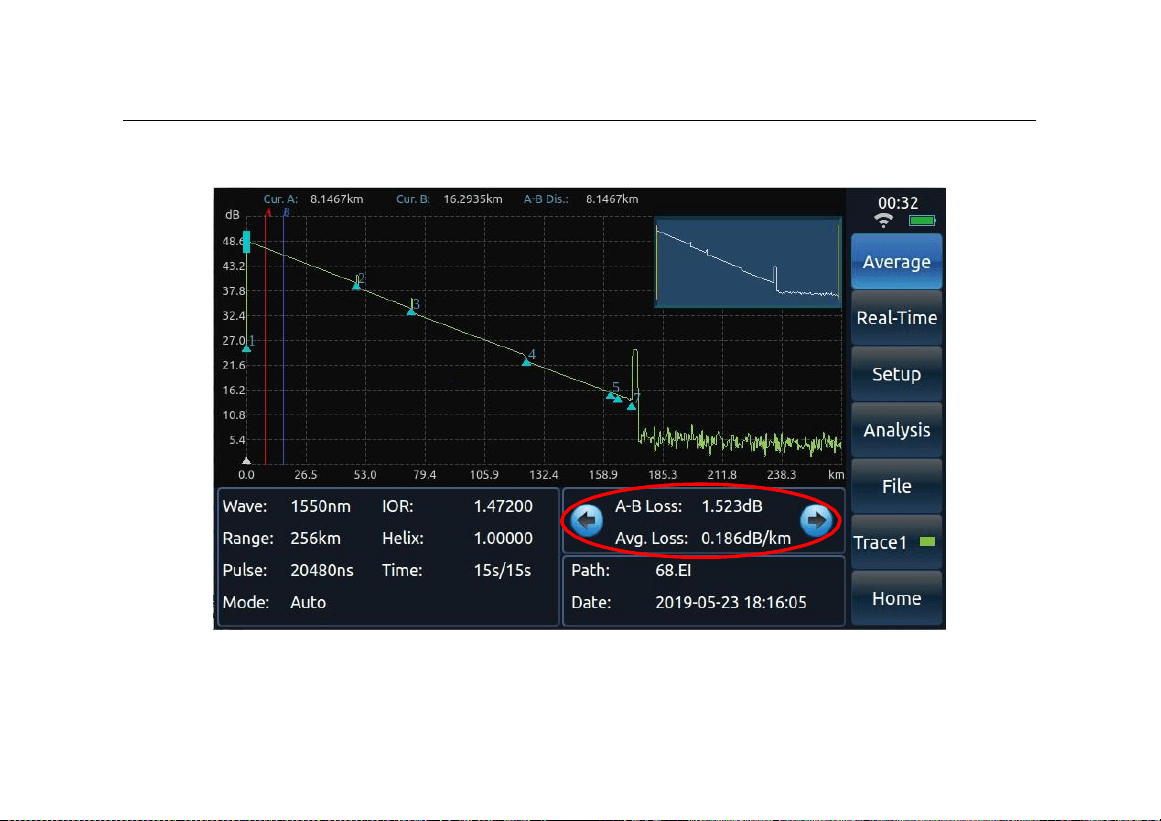
OTDR test items can be selected as follows: average loss, connection loss and
reflection loss. Click the arrow control to switch test items. It is shown in Fig. 7-8.
Chapter VII Module of optical time domain reflectometer
56
Figure 7-8 OTDR test items

Chapter VII Module of optical time domain reflectometer
57
Instruction!
1) Average loss
At this time, the test results displayed in the OTDR main interface are as
follows: loss between A and B, distance between the markers A and B, and
average loss between the optical fiber segment where markers A and B
are located.
2) Connection loss:
At this time, four markers will be displayed in the main interface of OTDR,
and the connection loss of the connection point where marker A is shown
in the test results.
3) Reflection loss:
At this time, the test results displayed in the main interface of OTDR are
the reflection loss of the optical fiber reflection peak where markers A and
B are, and the distance between two points A andB.

Chapter VII Module of optical time domain reflectometer
58
When testing the average loss, markers A and B must be set on the linear section of
the fiber curve, otherwise the calculated average loss will have a large error.
When testing connection loss, four markers appear in order: marker a, marker A,
marker B, and marker b. Set marker a and marker A on the linear segment of the
fiber curve before the connection point. Marker A is set near the join point. Set
marker B and marker b on the linear segment of the fiber curve after the connection
point.
When testing the reflection loss, set marker A in front of the reflection peak to be
tested and near the take-off point of the reflection peak. Set marker B on the top of
the reflection peak to be tested.
5.5
Event analysis and passing threshold
On the OTDR test condition setting interface, you can set the event analysis and passing
threshold.
1) Loss analysis threshold:
When analyzing the test curve data and the calculated connection loss of

Chapter VII Module of optical time domain reflectometer
59
the event point is greater than the loss analysis threshold, the event point
will be marked. Otherwise it will be automatically ignored.
2) Passing threshold of joint loss:
In the event list, when the calculated event point connection loss is greater
than the set connection loss passing threshold, the connection loss value
will be marked with “*”.
3) Reflection loss passing threshold:
In the event list, when the calculated reflection loss at the event point is
greater than the set reflection loss passing threshold, the reflection loss
value will be marked with “*”.
4) Fiber terminal threshold:
When the connection loss of the event point is greater than the threshold
value of the fiber terminal, the event point is considered as the fiber
terminal. All events after this event point are ignored and not shown in the
list.

Chapter VII Module of optical time domain reflectometer
60
5.6
Two-way analysis
To realize the bidirectional test function, the operation steps are as follows:
1) Click [Two-way Analysis] on the link definition setting interface, as shown in
Figure 7-7, and click [OK].
2) Read one of the curves in the file list that requires two-way analysis (curve 1);
3) Click [Curve] in the main menu bar, tick [Curve 2] in the curve selection box,
and click [OK];
4) Read another curve in the file list that requires two-way analysis (curve 2);
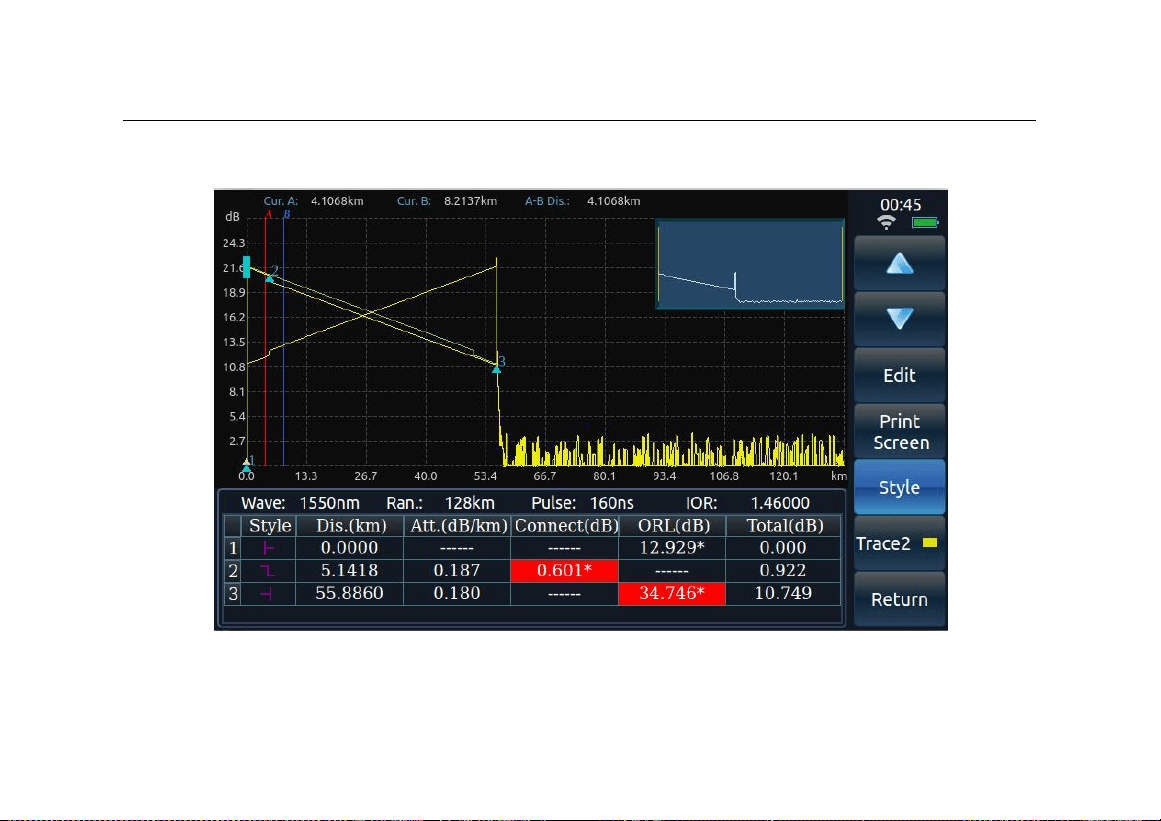
5) Click the [Analysis] button to get the Two-way analysis results, as shown in
Figure 7-9.
Chapter VII Module of optical time domain reflectometer
61
Figure 7-9 Two-way test analysis

Chapter VII Module of optical time domain reflectometer
62
5.7
Macro bending analysis
To realize the macro bending analysis function, the operation steps are as follows:
1) Click [Macro BendingAnalysis] on the link definition setting interface, as shown
in Figure 7-7, and click [OK].
2) Read one of the curves in the file list that requires macro bending analysis
(curve 1);
3) Click [Curve] in the main menu bar, tick [Curve 2] in the curve selection box,
and click [OK];
4) Read another curve in the file list that requires macro bending analysis (curve
2);
5) Click the Analysis button to get the macro bending analysis results.
5.8
Analysis of unreal peaks
To realize the unreal peak analysis function, the operation steps are as follows:
1) Click [Unreal Peak Analysis] on the link definition setting interface, as shown in

Chapter VII Module of optical time domain reflectometer
63
Figure 7-7, and click [OK].
2) Read the curve in the file list that requires unreal peak analysis;
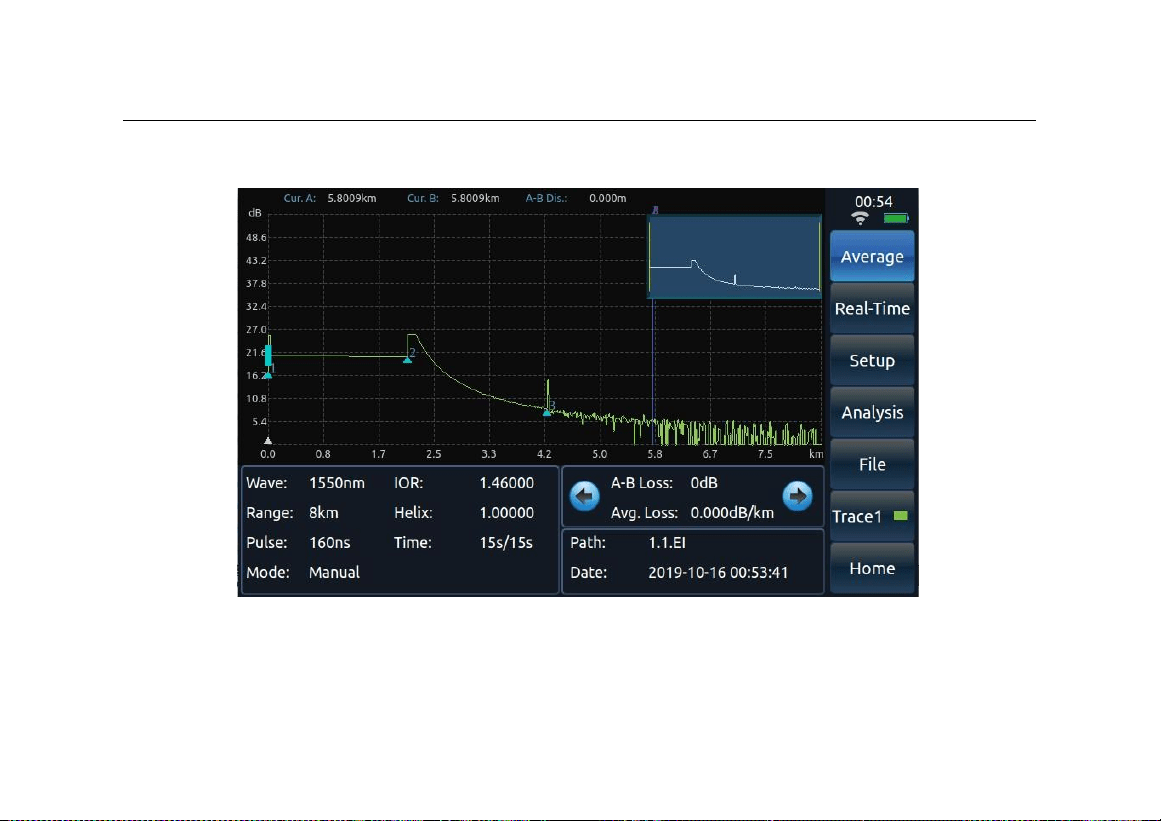
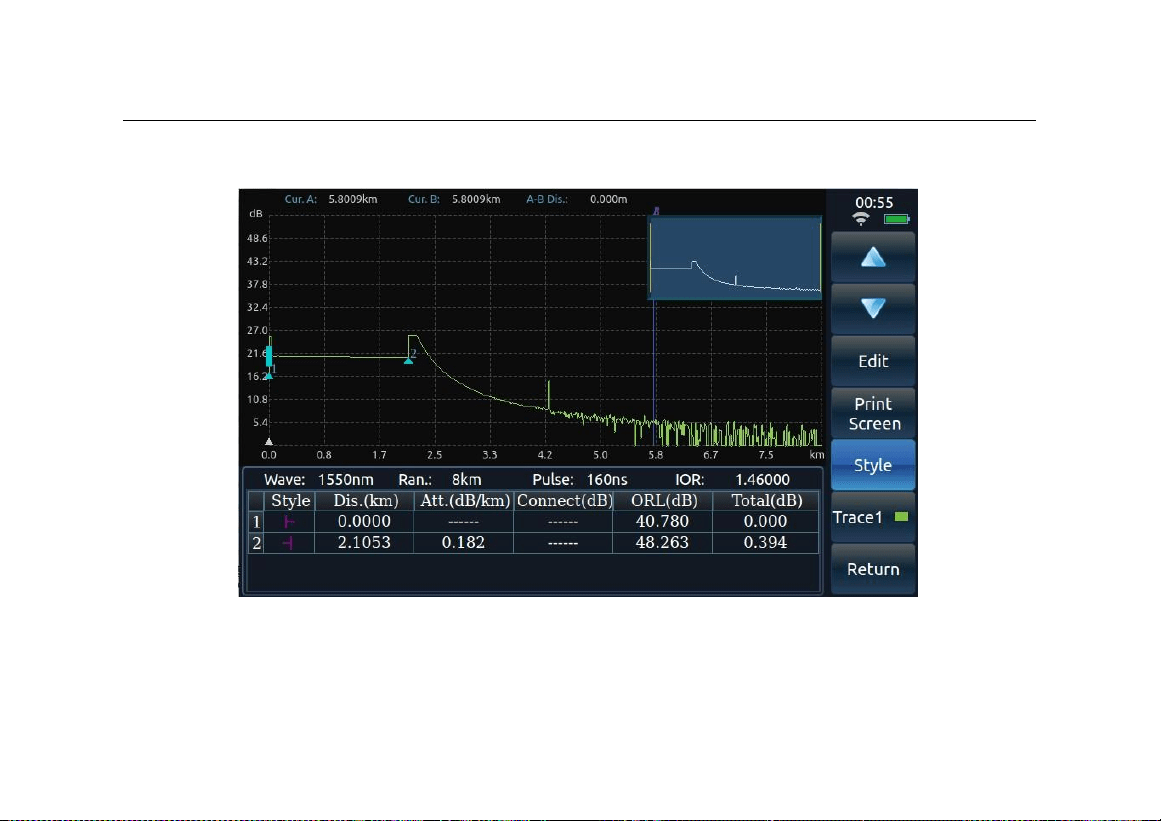
3) Click the [Analysis] button to get the unreal peak analysis results, as shown in
Figures 7-10&7-11.
Chapter VII Module of optical time domain reflectometer
64
Fig. 7-10 Checking the analysis result before unreal peak analysis
Chapter VII Module of optical time domain reflectometer
65
Fig. 7-11 Checking the analysis result after unreal peak analysis
Chapter VII Module of optical time domain reflectometer
66
5.9
Read file
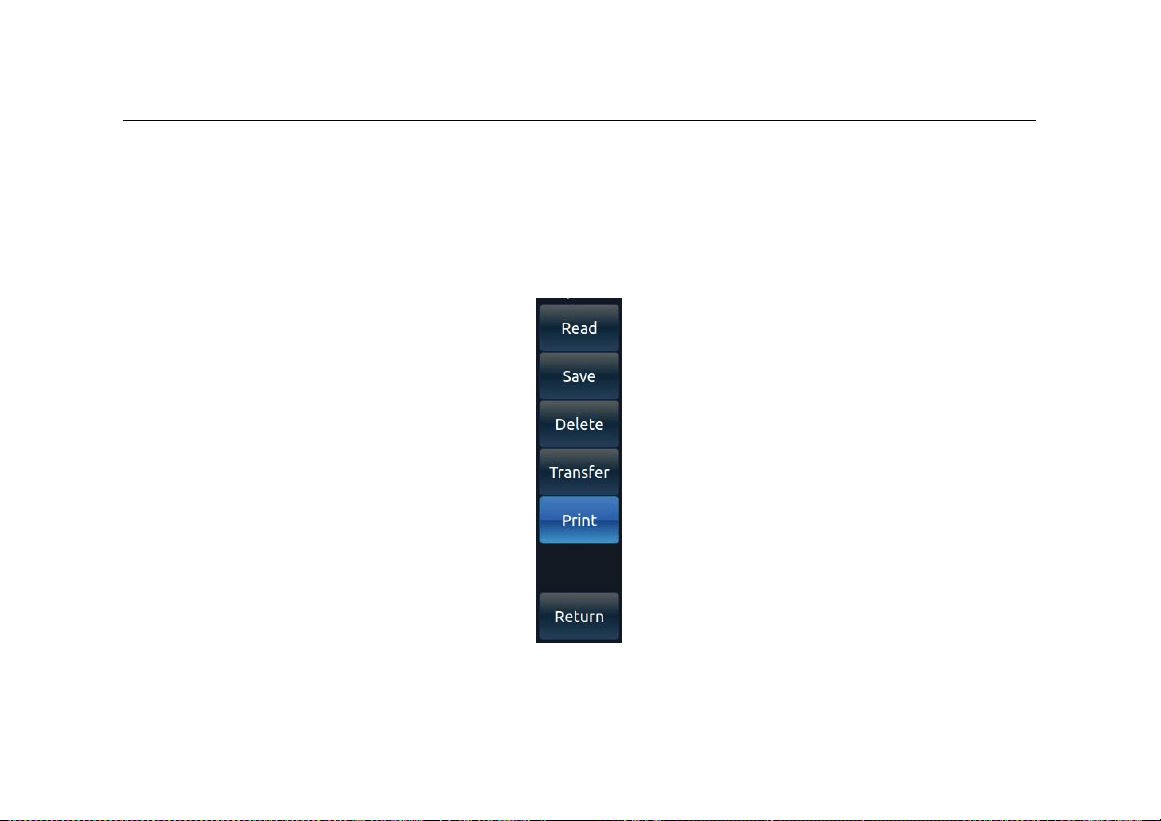
Click the [File] button in the main menu bar of Figure 7-5 to enter the sub-menu bar, as
shown in Figure 7-12.
Figure 7-12 File manage submenu bar
Chapter VII Module of optical time domain reflectometer
67
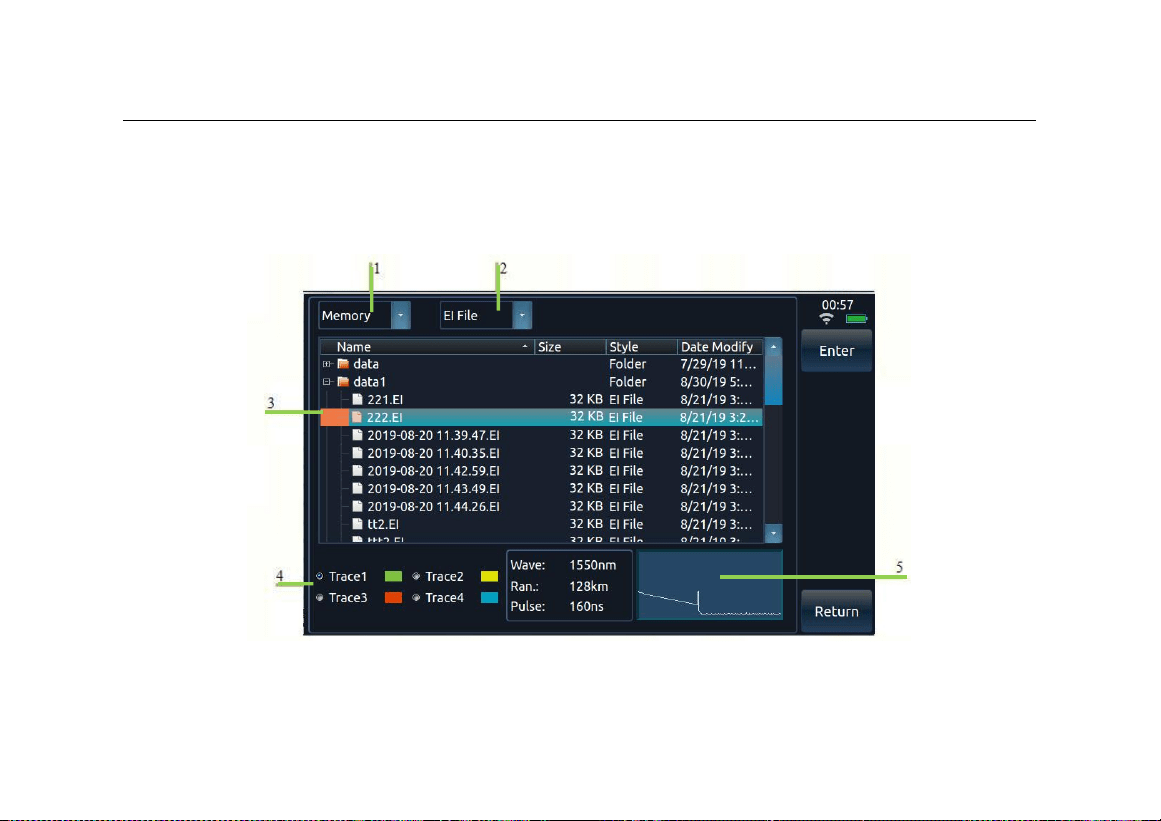
Click the [Read] button to enter the file reading operation window, as shown in Figure 7-
13.
Figure 7-13 File reading operation window

Chapter VII Module of optical time domain reflectometer
68
1) Reading path: Memory, U disk and SD card can be selected.
2) File format: EI file or SOR file can be selected.
3) File list: The list shows the curve files that conform to the file format stored
under the current path.
4) Curve selection: Select the current curve to be displayed as curve 1, 2, 3 or 4.
5) Curve preview area: Display the test curve saved in the file selected by the
current cursor bar via preview.
Select the file to be opened and click [OK] button to read and display the file.
5.10
Save file
Click the [Save] button in the sub-menu bar of file management in Figure 7-9 to enter the
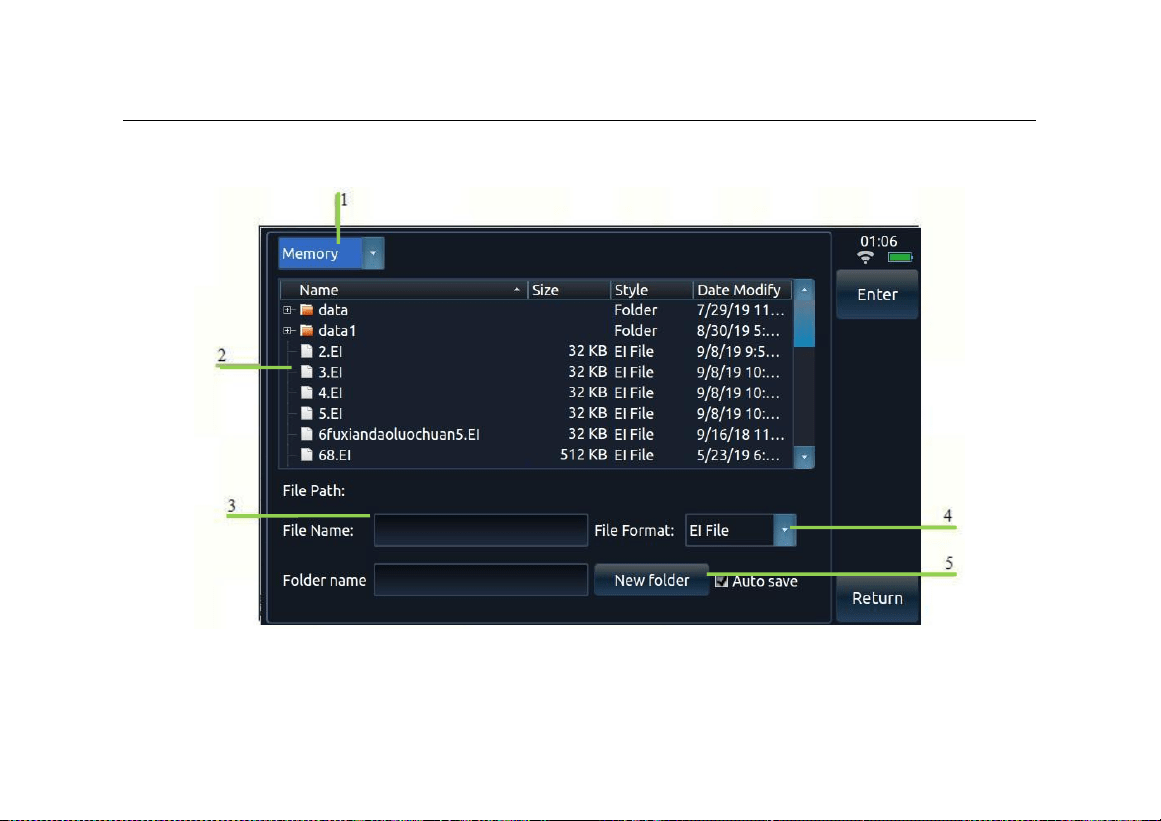
file saving operation window, as shown in Figure 7-14.
Chapter VII Module of optical time domain reflectometer
69
Figure 7-14 File saving operation window

Chapter VII Module of optical time domain reflectometer
70
1) Saving path: Memory, U disk and SD card can be selected.
2) File list: The list shows the curve files that conform to the file format stored
under the current path.
3) File name: A file name can be entered. If the edit box is empty, the default file
name is the current time.
4) Saving type: EI file or SOR file can be selected.
5) New folder: Enter the folder name and click the [New Folder] button to create a
new folder in the corresponding location.
Enter the file name, select the type of file to save, and click the [OK] button to save the
file to the appropriate location.
5.11
Common failures and troubleshooting
The following are the possible failures of the instrument and the solutions:

Chapter VII Module of optical time domain reflectometer
71
Table 8-1 Failures and troubleshooting
Failures
Cause
Troubleshooting
Instrument cannot
be started
The battery is dead.
Charge the battery.
No external power
supply
Supply power with an AC/DC
adapter.
Keys do not respond
Check whether there is
a button that keeps
pressed
Make sure that no key is pressed
down all the time.
The fiber length
measured is
inaccurate
a. Refractive index of
Optical fiber is not set
accurately
b. Cable correction
factor is not set
accurately
a. Set the refractive index of the fiber
to the index specified by the fiber
manufacturer.
b. Set the cable correction factor to
1.0000 or the cable correction factor
specified by cable manufacturer.

Chapter VII Module of optical time domain reflectometer
72
The average loss of
fiber measured is not
accurate
a. The fiber length
error measured is too
large
b. The front tail of the
test curve is too long
a. Refer to the previous item to
measure the fiber length accurately.
b. After cleaning the connector of the
fiber under test or adding a little
matching fluid, retest the curve.
The end face of optical
Wipe the end face of the fiber clean
fiber is polluted;
with anhydrous ethanol.
There is no test
waveform on the
screen, only the front
reflection peak, or the
front reflection peak
has a long tail.
The internal fiber end
face of the optical
output connector of the
instrument is
contaminated
Remove the connector at the optical
output end and wipe the fiber end
face clean with anhydrous ethanol.
The ceramic core in
the optical output
connector is damaged,
Change the flange.
cracked or broken.

Chapter VII Module of optical time domain reflectometer
73
Fiber connector type
mismatch
The end face type of the fiber
connector being tested must match
the end face type in the OTDR
optical output connector. Otherwise,
a connection must be made with a
connection wire.
5.12
Reasons for failure of curve test and analysis
If the result of curve test and analysis is quite different from the expected result, or the
expected result does not appear, it may be caused by one of the following reasons:
1) The test curve of the fiber was not obtained
If the test curve only has the front end reflection peak, and there is no linear curve
reflecting the characteristics of the fiber, please check:
Whether the end face type of the tested fiber is consistent with the end
face type of the OTDR optical output port.
Whether the end face of the fiber is contaminated.

Chapter VII Module of optical time domain reflectometer
74
Instruction!
Whether the optical output flange of OTDR is cracked.
Use the VFL function to check whether the near end of the fiber link under
test has high loss.
If the fiber link you tested is very short, such as less than 100m, the following test
method and test conditions are recommended:
Please set: average test mode, measuring range of less than 800m, pulse width of
less than 80ns, attenuation of 15dB or 20dB, and a certain average time.
If 15dB attenuation is set, a better SNR test curve can be obtained, which is
conducive to curve analysis. A smaller test blind area can be obtained by setting
20dB attenuation, but the signal-to-noise ratio of the curve is relatively low, so a
larger average time is needed to obtain a curve with a higher signal-to-noise ratio.
2) The near end of the test curve showed more serious trailing phenomenon
If a relatively serious trailing phenomenon is observed on the falling edge of the

Chapter VII Module of optical time domain reflectometer
75
reflection peak at the near end of the test curve, please try the following:
Please dip a cotton wool ball in an appropriate amount of anhydrous ethanol to
clean the end face of the tested fiber and that of the optical output end
connector of the OTDR.
Re-test the curve with a smaller pulse width (note that the average test is
selected and the average time is set).
Re-test the curve with a large attenuation at the current pulse width (note that
the average test mode is selected and the average time is set).
3) The event points in the test curve are too close together
If an adjacent event point is found missing, try the following:
Re-test the curve with a smaller pulse width (note that the average test is
selected and the average time is set).
Please set a certain average time and use the average test method to
improve the signal-to-noise ratio of the curve.

Chapter VII Module of optical time domain reflectometer
76
4) The SNR of the test curve is poor
If the signal-noise ratio of the test curve is poor, the accuracy of the curve analysis
will be affected. In this case, try the following:
In the automatic test or average test mode, please increase the average
time value appropriately.
Please use a larger pulse width to retest after setting the appropriate test
range under the average test mode.
5) The OTDR test parameters set are incorrect
If there is a big difference between the measured fiber length and the actual value,
please check:
Whether the refractive index value and optical fiber correction coefficient
value set are consistent with the nominal value of the fiber or optical fiber
measured.
If the refractive index is not consistent, the measured length of the fiber will
be seriously affected.

77
Part II Technical Description
Part II Technical
Description

78
Chapter VIII Working principles
Chapter VIII Working principles
1 Working principles
When light is transmitted in optical fiber, Rayleigh scattering is caused by slight
fluctuation of refractive index of optical fiber, and Fresnel reflection is caused by abrupt
change of refractive index of optical fiber end face or fault point. Loss distribution and
joint loss can be determined by observing Rayleigh backscattered light intensity change,
and breakpoint and fault point can be determined by observing Fresnel reflection.
2 Event point type description
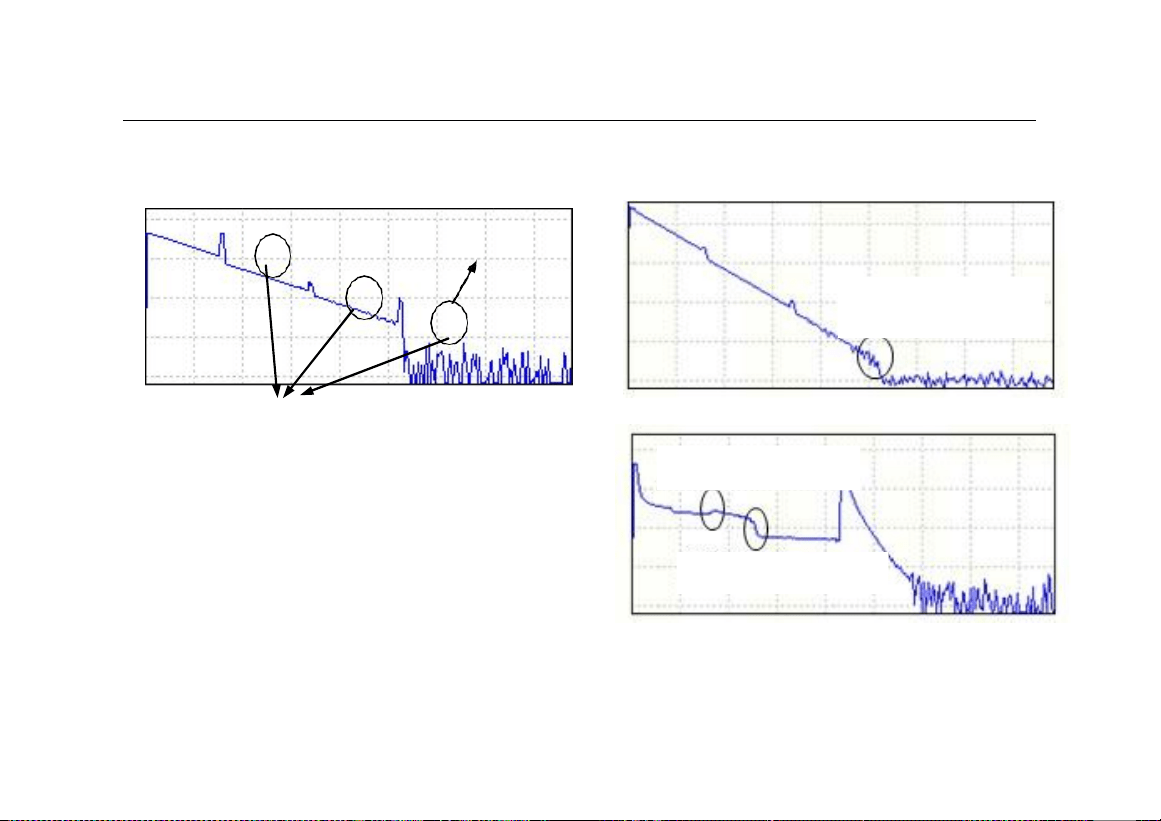
The event points on the curve of measured fiber can be divided into reflection event
points and non-reflection event points.
The reflection event point is usually caused by a fixed connector or a fractured surface at
the end of the optical fiber, representing a peak. It is shown in the figure below.
79
Chapter VIII Working principles
Reflective end of an optical fiber
Non-reflective end of
optical fiber
Reflection event point
Non-reflective events typically include :
(illustrated below)
Descending event point
Ascending event point
Non-reflective end of optical fiber
Descending event point
Ascending event point

80
Part III Appendixes
Chapter IX Technical parameters
1 Main Functions
1) Test the length and loss of optical fiber or cable, and test the connection loss
and reflection loss of connection points.
2) Automatic test function.
3) Test curve graphing function (iOLM).
4) USB port can be connected to the optical fiber end face detector.
5) Test waveform storage: Test waveform data and test conditions can be stored
in the native memory or external USB flash disk /SD card. The storage format
can be EI or BellCore GR196 standard format.
6) File copy function: The data files stored in this machine can be directly copied
to the USB flash disk /SD card.
7) Remote control function, which can be used to set the test conditions of the

81
Part III Appendixes
instrument through the computer, and test the loss distribution curve of the
fiber.
2 General feathers and technical indicators
2.1
General feathers of optical time domain reflectometer
It is shown in Table. 9-1:
Table 9-1 General characteristics of mainframe of optical time domain
reflectometer
Display screen
800×480, 7-inch TFT color LCD (standard distribution capacity touch
screen, with optional resistance touch screen)
Electrical
interface
USB port, Micro-USB port, SD card interface, and 10M/100M
Ethernet interface

82
Part III Appendixes
Power supply
AC/DC adapter: allowable range of input voltage: 100V ~ 242V
(1.5A), allowable range of frequency: 50/60Hz; Output DC: 17V±3V
(2A)
Internal lithium battery: 11.1V, 6800mAh, 75.48Wh
Battery working hours:8h
Environmental
Requirements
Operating temperature: -10℃ ~ 50℃(Battery: 5℃~40℃)
Storage temperature: -40℃ ~ 70℃(Battery: 5℃~40℃)
Relative humidity: 5% ~ 95%, no condensation
Overall
dimensions and
D×W×H: 252mm×180mm×55mm(including the OTDR module)
weight
1.8±0.2kg(including the OTDR module and lithium battery)
Interface
language
Simplified Chinese, English, Russian, or Korean (contact the office for
additional language support)
2.2
Main technical indicators of the OTDR module

83
Part III Appendixes
Table 9-2 Technical features of OTDR module
Center
wavelength
(nm)
AVAILABLE IN 850, 1300, 1490, 1310, 1550, 1625 AND 1650 (SEE
APPENDIX B FOR DETAILS)
Dynamic range
(dB)
Up to 46 dB (see Appendix B for details)
Measuring
range (km)
0.4, 0.8, 1.6, 3.2, 8, 16, 32, 64, 128, 256, and 512(single mode, and
1300nm for multimode)
0.4, 0.8, 1.6, 3.2, 8, 16 and 32(850nm for multimode)
Pulse width (ns)
3, 5, 10, 30, 80, 160, 320, 640, 1280, 5120, 10240, 20480(single
mode) 3, 5, 10, 30, 80, 160, 320, 640 and 1280 (850nm for
multimode)
Refractive index
setting range
Adjust in the range of 1.00000 ~ 1.99999

84
Part III Appendixes
Cable
correction factor
Adjust in the range of 0.80000 ~ 1.00000
Linearity
0.03dB/dB
Loss resolution
0.001dB
Optical output
connector
FC/UPC (standard configuration, Matching: LC/UPC 、 SC/UPC 、
ST/UPC)
2.3
VFL function (optional)
Table 9-3 Technical features of the VFL function
NAME
CONTENTS
Center
wavelength
(nm)
650nm±20nm

85
Part III Appendixes
Output power
mW
≥2mW (typical)
Operation mode
CW, 1Hz and 2Hz
Interface type
TOSA
2.4
Optical power meter function (optional)
Table 9-4 Technical features of broadband optical power meter
NAME
CONTENTS
Wavelength
range
1200nm ~ 1650nm
Power range
-60dBm ~ 0dBm
Uncertainty of
calibration point
power test
Better than 0.22dB (-25dBm, CW, 1310/1550nm)

86
Part III Appendixes
Uncertainty
±5% (-25dBm、CW)
Uncertainty of
power
measurement
within the
optical path
Better than ±1.5dB
2.5
Optical source function (optional)
Table 9-5 Technical features of the optical source function
NAME
CONTENTS
Output
wavelength
Same with the operation wavelength of OTDR module
Output power
≥-5dBm(23℃±2℃)
Operation mode
CW, 270Hz, 1kHz and 2kHz

87
Part III Appendixes
Part III Appendixes

88
Appendix A Optical output portcleaning
Appendix A Optical output port cleaning
1. During the use of the instrument, please note:
The optical output ports must be kept clean, and the optical output ports should be
cleaned regularly with anhydrous ethanol.
After the instrument is used, please cover the dust cap and keep it clean.
The flange connector of the light output port must be cleaned periodically. If the
ceramic core in the flange is found to crack or crack, please timely replace the
flange.
1.1
Function of cleaning optical fiber connector and optical output port:
Because the fiber core is very small, dust and particles attached to the fiber
connector and optical output port may cover part of the fiber core of the optical
output end, leading to the performance degradation of the instrument.
Dust and particles may cause wear of the end face of the optical fiber connector at
the output end, which will reduce the accuracy and repeatability of the instrument

89
Appendix A Optical output portcleaning
test.
1.2
Follow the safety principles below before cleaning:
Be sure to turn off the power supply when cleaning.
Failure to follow the prescribed control, regulation, or operating procedures may
result in dangerous radiation damage.
When cleaning any optical interface, make sure the optical source is disabled.
Do not look directly at any optical output port while the instrument is working to
avoid eye damage.
1.3
Tools for cleaning optical output interface and connector
You can use optical fiber cleaner, optical fiber cleaner rod and other tools to clean
the optical output interface and connector.
If the above professional tools are not available, please prepare the following:
Cotton wool ball, anhydrous ethanol, etc.

90
Appendix A Optical output portcleaning
1.4
Steps to clean the optical output interface and connector
Turn off the instrument power.
Unscrew the flange cap completely.
Gently pull out the flange.
Clean the end face of the optical output connector and the flange connector with a
cotton wool ball dipped in an appropriate amount of anhydrous ethanol.
After cleaning, gently connect the flange to the optical output port, and then tighten
the flange

FCC Statement
This device complies with part 15 of the FCC rules. Operation is subject to the following
two conditions: (1) this device may not cause harmful interference, and (2)
this device must accept any interference received, including interference that may cause
undesired operation.
Changes or modifications not expressly approved by the party responsible for compliance
could void the user's authority to operate the equipment.
NOTE: This equipment has been tested and found to comply with the limits for a Class B
digital device, pursuant to part 15 of the FCC Rules. These limits are
designed to provide reasonable protection against harmful interference in a residential
installation. This equipment generates uses and can radiate radio frequency
energy and, if not installed and used in accordance with the instructions, may cause
harmful interference to radio communications. However, there is no guarantee
that interference will not occur in a particular installation. If this equipment does cause
harmful interference to radio or television reception, which can be
determined by turning the equipment off and on, the user is encouraged to try to correct
the interference by one or more of the following measures:
• Reorient or relocate the receiving antenna.
• Increase the separation between the equipment and receiver.
• Connect the equipment into an outlet on a circuit different from that to which the
receiver is connected.
• Consult the dealer or an experienced radio/TV technician for help.
The device has been evaluated to meet general RF exposure requirement. The device
can be used in portable exposure condition without restriction.