

Legal Information
The information provided in this document contains general descriptions, technical
characteristics and/or recommendations related to products/solutions.
This document is not intended as a substitute for a detailed study or operational and
site-specific development or schematic plan. It is not to be used for determining
suitability or reliability of the products/solutions for specific user applications. It is the
duty of any such user to perform or have any professional expert of its choice
(integrator, specifier or the like) perform the appropriate and comprehensive risk
analysis, evaluation and testing of the products/solutions with respect to the relevant
specific application or use thereof.
The Schneider Electric brand and any trademarks of Schneider Electric and its
subsidiaries referred to in this document are the property of Schneider Electric or its
subsidiaries. All other brands may be trademarks of their respective owner.
This document and its content are protected under applicable copyright laws and
provided for informative use only. No part of this document may be reproduced or
transmitted in any form or by any means (electronic, mechanical, photocopying,
recording, or otherwise), for any purpose, without the prior written permission of
Schneider Electric.
Schneider Electric does not grant any right or license for commercial use of the
document or its content, except for a non-exclusive and personal license to consult it
on an "as is" basis.
Electrical equipment should be installed, operated, serviced, and maintained only by
qualified personnel. No responsibility is assumed by Schneider Electric for any
consequences arising out of the use of this material.
Schneider Electric reserves the right to make changes or updates with respect to or in
the content of this document or the format thereof, at any time without notice.
To the extent permitted by applicable law, no responsibility or liability is
assumed by Schneider Electric and its subsidiaries for any errors or omissions
in the informational content of this document, as well as any non-intended use
or misuse of the content thereof.
Safety information
Important information
Read these instructions carefully and look at the equipment to become familiar
with the device before trying to install, operate, service, or maintain it. The
following special messages may appear throughout this manual or on the
equipment to warn of potential hazards or to call attention to information that
clarifies or simplifies a procedure.
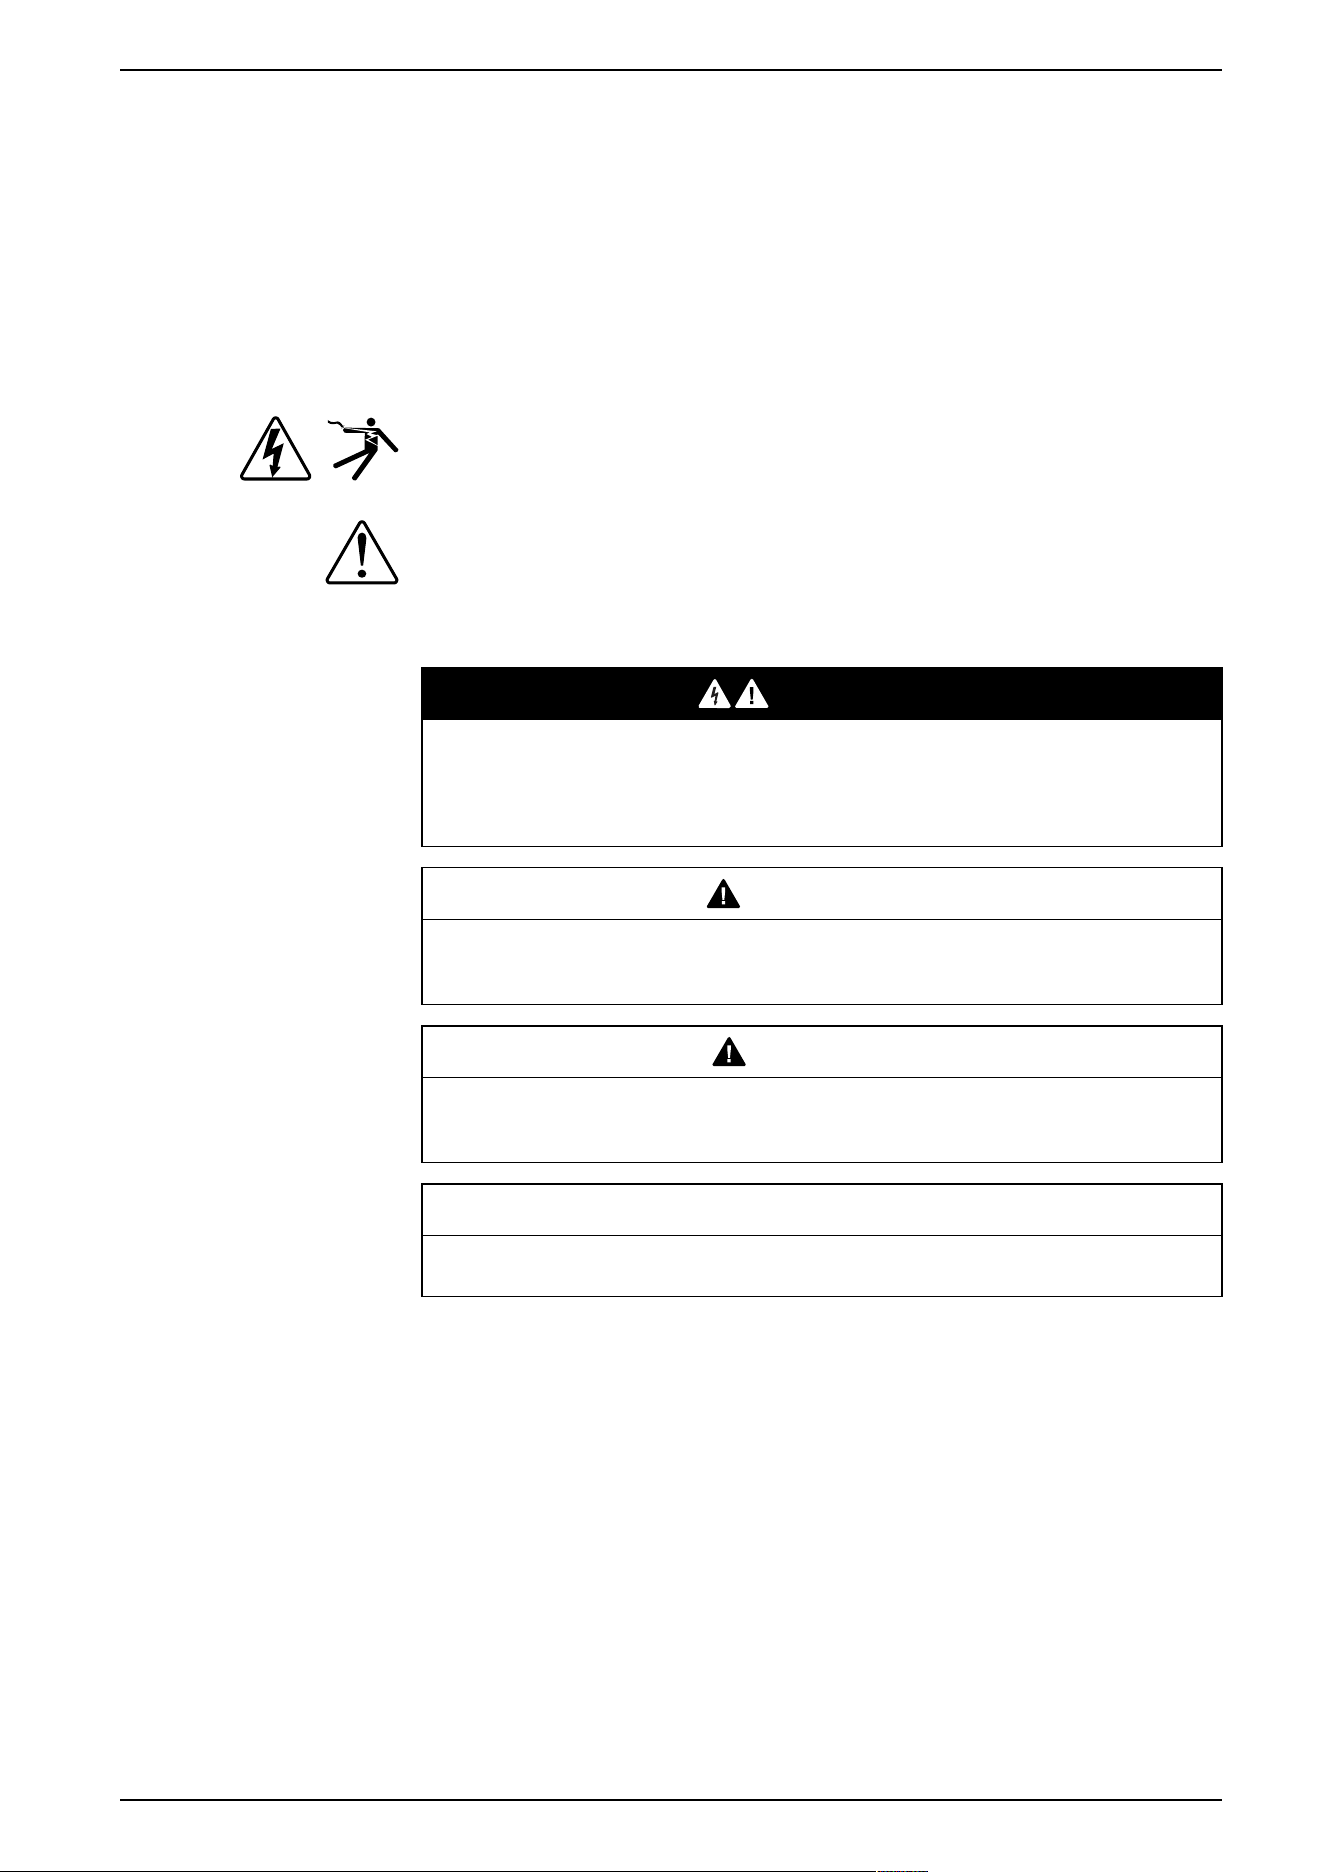
The addition of either symbol to a “Danger” or “Warning” safety label indicates
that an electrical hazard exists which will result in personal injury if the
instructions are not followed.
This is the safety alert symbol. It is used to alert you to potential personal injury
hazards. Obey all safety messages that accompany this symbol to avoid injury or
death.
DANGER
DANGER indicates a hazardous situation which, if not avoided, will result in
death or serious injury.
Failure to follow these instructions will result in death or serious injury.
WARNING
WARNING indicates a hazardous situation which, if not avoided, could result
in death or serious injury.
CAUTION
CAUTION indicates a hazardous situation which, if not avoided, could result in
minor or moderate injury.
NOTICE
NOTICE is used to address practices not related to physical injury.
Please note
Electrical equipment should be installed, operated, serviced, and maintained only
by qualified personnel. No responsibility is assumed by Schneider Electric for any
consequences arising out of the use of this equipment. A qualified person is one
who has skills and knowledge related to the construction, installation, and
operation of electrical equipment and has received safety training to recognize
and avoid the hazards involved.
7EN02-0489-00 3
PowerLogic
™
Intuitive PM7100 / PM7200 / PM7300 series
Metering equipment symbols
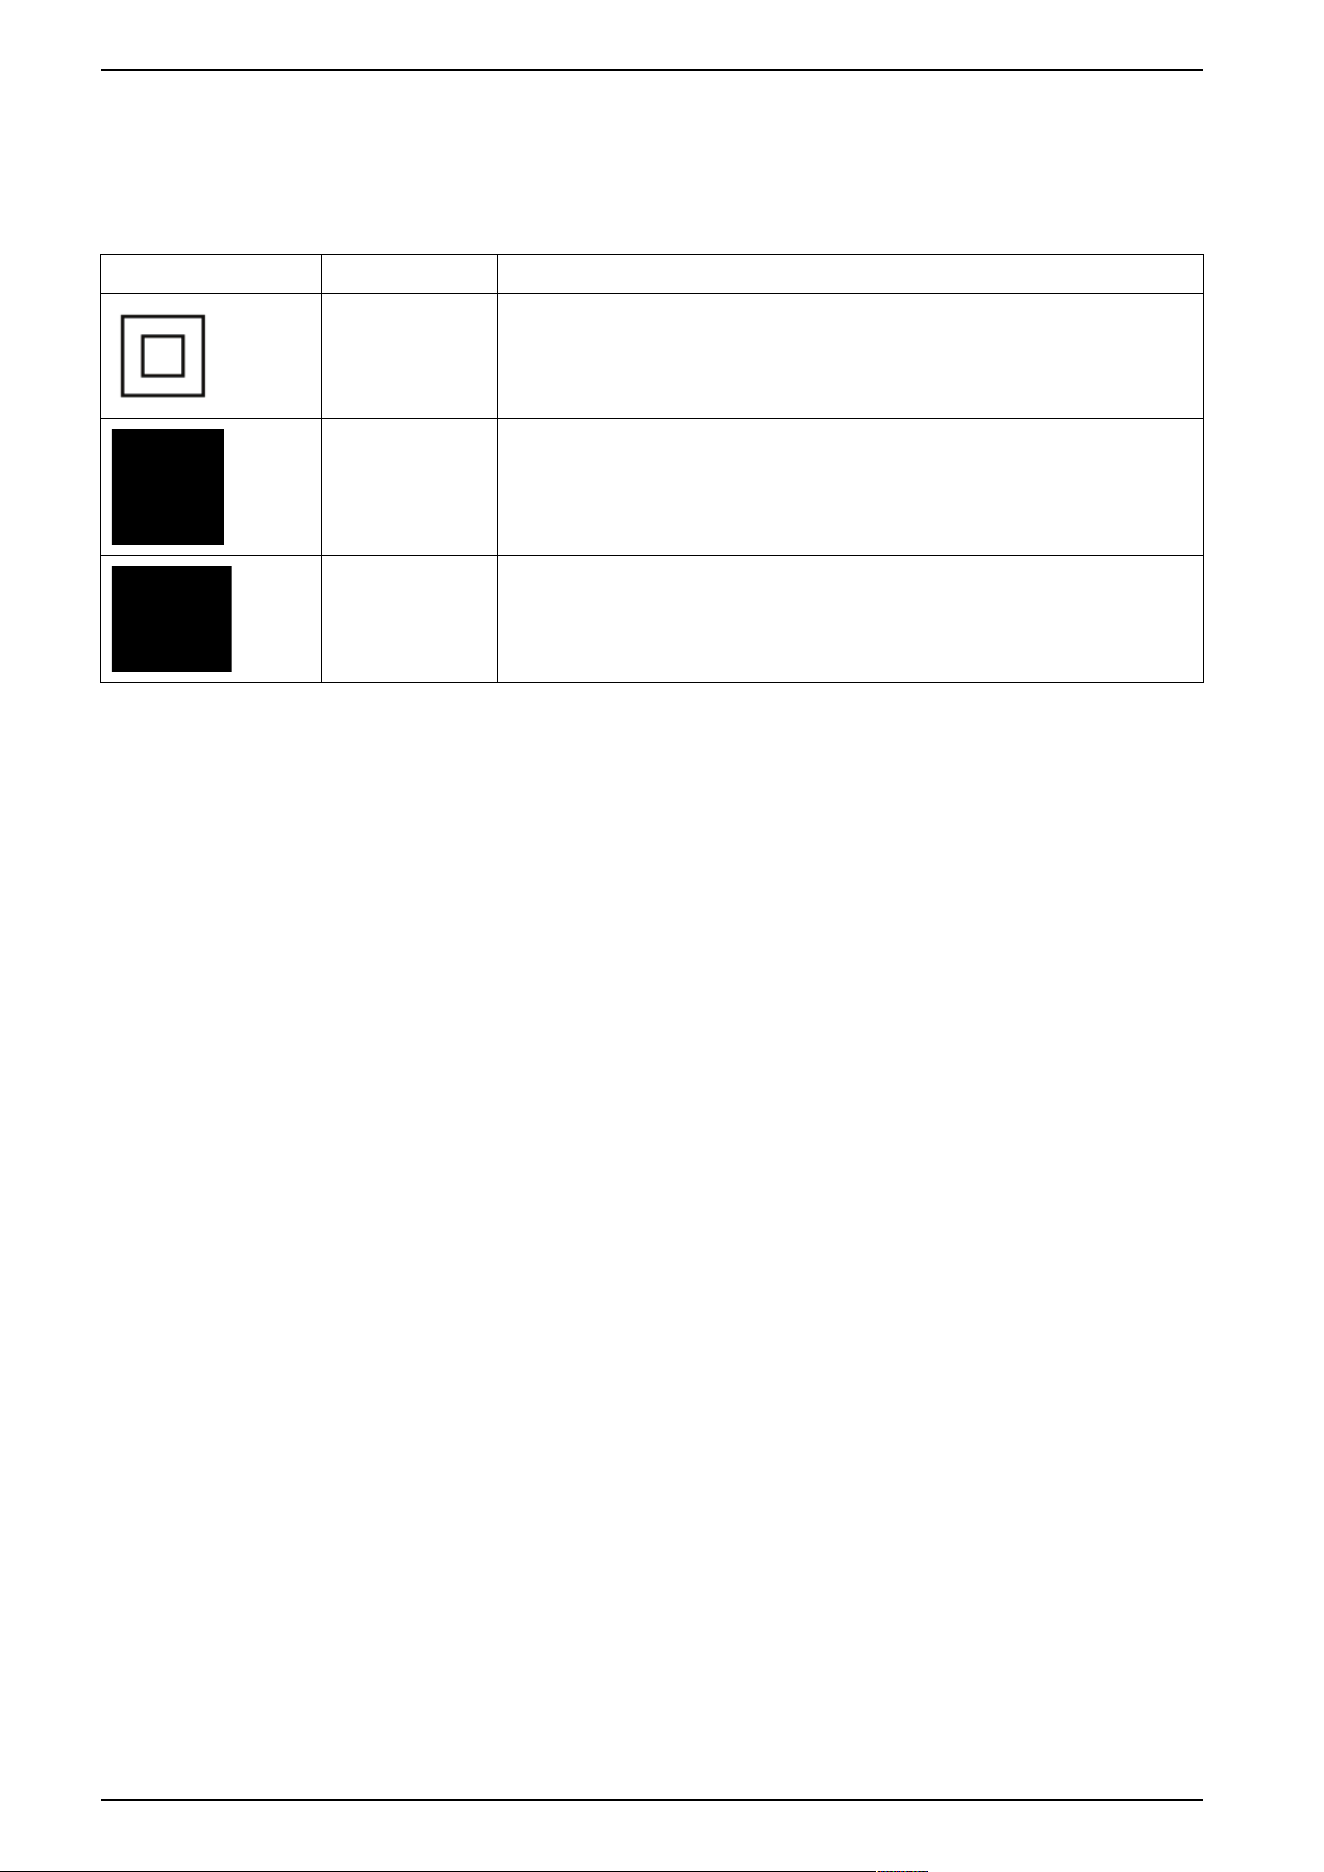
The following IEC 60417 and ISO 7000 symbols may be used on the metering
equipment:
Symbol
Reference
Description
IEC 60417-5172
Protective Class II equipment
To identify equipment meeting the safety requirements specified for Class II equipment
(double or reinforced insulation).
ISO 7000-0434B
Caution
To indicate that caution is necessary when operating the device or control close to
where the symbol is placed. To indicate that the current situation needs operator
awareness or operator action to avoid undesirable consequences.
ISO 7000-1641
Operator's manual
To identify the location where the operator's manual is stored or to identify information
that relates to the operating instructions. To indicate operating instructions should be
considered when operating the device or operating controls close to where the
symbol is placed.
4 7EN02-0489-00
PowerLogic
™
Intuitive PM7100 / PM7200 / PM7300 series

Notices
Federal Communications Commission (FCC)
FCC Interference Statement:
This device complies with Part 15 of the FCC Rules. Operation is subject to the
following two conditions:
• This device may not cause harmful interference.
• This device must accept any interference received, including interference that
may cause undesired operation.
This equipment has been tested and found to comply with the limits for a Class B
digital device, pursuant to Part 15 of the FCC Rules. These limits are designed to
provide reasonable protection against harmful interference in a residential
installation. This equipment generates, uses, and can radiate radio frequency
energy and, if not installed and used in compliance with the instructions, may
cause harmful interference to radio communications. However, there is no
guarantee that interference does not occur in a particular installation. If this
equipment does cause harmful interference to radio or television reception, which
can be determined by turning the equipment off and on, the user is encouraged to
try to correct the interference by one of the following measures:
• Reorient or relocate the receiving antenna.
• Increase the separation between the equipment and receiver.
• Connect the equipment into an outlet on a circuit different from that to which
the receiver is connected.
• Consult the dealer or an experienced radio/television (TV) technician for help.
Caution:
Any changes or modifications not expressly approved by the party responsible for
compliance could void the user’s authority to operate this equipment.
This transmitter must not be located or operating in conjunction with any other
antenna or transmitter.
Radiation Exposure Statement:
This equipment complies with FCC radiation exposure limits set forth for an
uncontrolled environment. This equipment should be installed and operated with
minimum distance 200 mm (7.87 in) between the radiator and your body.
NOTE: The country code selection is for non-US model only and is not
available to all US models. As per FCC regulation, all Wi-Fi products marketed
in US must be fixed to US operation channels only.
7EN02-0489-00 5
PowerLogic
™
Intuitive PM7100 / PM7200 / PM7300 series

Industry Canada
Industry Canada Statement:
This device complies with Innovation, Science and Economic Development
Canada (ISED) license-exempt Radio Standards Specification (RSS). Operation
is subject to the following two conditions:
• This device may not cause harmful interference.
• This device must accept any interference received, including interference that
may cause undesired operation.
Radiation Exposure Statement:
This equipment complies with ISED radiation exposure limits set forth for an
uncontrolled environment. This equipment should be installed and operated with
greater than 200 mm (7.87 in) between the radiator and your body.
6 7EN02-0489-00
PowerLogic
™
Intuitive PM7100 / PM7200 / PM7300 series

About the document
Document scope
This manual describes the features of the PowerLogic
™
Intuitive PM7100 /
PM7200 / PM7300 series power meters and provides installation and
configuration instructions.
Throughout the manual, the term “meter”, “device”, “equipment” or “product” refers
to all models of the PM7100 / PM7200 / PM7300. Any differences between the
models, such as a feature specific to one model, are indicated with the appropriate
model number or description.
This manual assumes that you understand power metering and are familiar with
the equipment and power system in which your meter is installed.
This manual does not include instructions on incorporating meter data or
performing meter configuration using energy management systems or software.
Validity note
The characteristics of the products described in this document are intended to
match the characteristics that are available on www.se.com. As part of our
corporate strategy for constant improvement, we may revise the content over time
to enhance clarity and accuracy. If you see a difference between the
characteristics in this document and the characteristics on www.se.com, consider
www.se.com to contain the latest information.
Product related information
Refer to the chapter Safety precautions, page 17 for the product related safety
messages.
General cybersecurity information
In recent years, the growing number of networked machines and production plants
has seen a corresponding increase in the potential for cyber threats, such as
unauthorized access, data breaches, and operational disruptions. You must,
therefore, consider all possible cybersecurity measures to help protect assets and
systems against such threats.
To help keep your Schneider Electric products secure and protected, it is in your
best interest to implement the cybersecurity best practices as described in the
Cybersecurity Best Practices document.
Schneider Electric provides additional information and assistance:
• Subscribe to the Schneider Electric security newsletter.
• Visit the Cybersecurity Support Portal web page to:
◦ Find Security Notifications.
◦ Report vulnerabilities and incidents.
• Visit the Schneider Electric Cybersecurity and Data Protection Posture web
page to:
◦ Access the cybersecurity posture.
◦ Learn more about cybersecurity in the cybersecurity academy.
◦ Explore the cybersecurity services from Schneider Electric.
7EN02-0489-00 7
PowerLogic
™
Intuitive PM7100 / PM7200 / PM7300 series

Product related cybersecurity information
Total protection of components (equipment/devices) systems, organizations, and
networks from cyber attack threats requires multi-layered cyber risk mitigation
measures, early detection of incidents, and appropriate response and recovery
plans when incidents occur. For more information about cybersecurity, refer to the
Cybersecurity Guidelines, page 49.
WARNING
POTENTIAL COMPROMISE OF SYSTEM AVAILABILITY, INTEGRITY, AND
CONFIDENTIALITY
• Set a display passcode to help reduce the risk of unauthorized physical
access to the meter.
• Disable unused ports/services and default accounts, where possible, to
minimize pathways for malicious attacks.
• Place networked devices behind multiple layers of cyber defenses (such as
firewalls, network segmentation, and network intrusion detection and
protection).
• Use cybersecurity best practices (for example: least privilege, separation of
duties) to help prevent unauthorized exposure, loss, modification of data and
logs, interruption of services, or unintended operation.
Failure to follow these instructions can result in death, serious injury, or
equipment damage.
Environmental data
For product compliance and environmental information, refer to the Schneider
Electric Environmental Data Program.
Available languages of the document
The document is available in these languages:
• French (7FR02-0489)
• Spanish (7ES02-0489)
• German (7DE02-0489)
• Chinese (7ZH02-0489)
Related documents
Title of documentation Reference number
PowerLogic
™
Intuitive PM7100 / PM7200 /
PM7300 instruction sheet
PKR39369
PowerLogic™ Engineering Suite configuration
guide
7EN02-0505
EcoStruxure
™
Power Device (EPD) user guide
DOCA0365
To find documents online, visit the Schneider Electric download center
(www.se.com/ww/en/download/).
8 7EN02-0489-00
PowerLogic
™
Intuitive PM7100 / PM7200 / PM7300 series

Information on non-inclusive or insensitive terminology
As a responsible, inclusive company, Schneider Electric is constantly updating its
communications and products that contain non-inclusive or insensitive
terminology. However, despite these efforts, our content may still contain terms
that are deemed inappropriate by some customers.
Trademarks
PowerLogic
™
and Schneider Electric are trademarks or registered trademarks of
Schneider Electric in France, the USA, and other countries.
The Bluetooth
®
word mark and logos are registered trademarks owned by
Bluetooth SIG, Inc. and any use of such marks by Schneider Electric is under
license.
7EN02-0489-00 9
PowerLogic
™
Intuitive PM7100 / PM7200 / PM7300 series


PowerLogic
™
Intuitive PM7100 / PM7200 / PM7300 series
Table of Contents
Table of Contents .................................................................................... 11
1. Safety precautions ..................................................................................17
2. Meter overview ........................................................................................19
2.1 Overview...........................................................................................19
2.2 Meter models.....................................................................................19
2.3 Feature summary...............................................................................20
2.4 Data display and analysis tools ...........................................................22
2.4.1 Meter configuration...................................................................22
2.4.2 Bluetooth interface ...................................................................23
2.4.3 Modbus command interface ......................................................23
2.4.4 EcoStruxure
™
Building Operation ..............................................23
2.4.5 EcoStruxure
™
Power Monitoring Expert .....................................23
3. Hardware reference................................................................................25
3.1 Supplemental information ...................................................................25
3.2 Dimensions .......................................................................................25
3.3 Mounting ...........................................................................................25
3.4 Meter description ...............................................................................26
3.5 Terminal covers .................................................................................28
3.6 LED indicators ...................................................................................28
3.6.1 Alarm/energy pulsing LED.........................................................28
3.6.2 Heartbeat/serial communications LED .......................................28
3.6.3 Ethernet communications LEDs.................................................28
3.7 Wiring ...............................................................................................29
3.7.1 Power system wiring - Voltage and current measurement
circuits.....................................................................................29
3.7.2 Control power (auxiliary power) .................................................33
3.7.3 Input, output and communications wiring....................................35
4. Display ......................................................................................................38
4.1 Display overview................................................................................38
4.2 Default data display screen.................................................................38
4.3 Display menu icons ............................................................................39
4.4 Notification icons................................................................................39
4.5 Meter display language ......................................................................40
4.6 Meter screen navigation .....................................................................40
4.7 Access counter screen .......................................................................40
4.8 Button Shortcuts ................................................................................40
4.8.1 Resetting the meter to the default language................................40
4.8.2 Enabling Bluetooth ...................................................................41
4.9 Meter screen menus overview ............................................................41
4.10 Menu tree..........................................................................................41
7EN02-0489-00 11

PowerLogic
™
Intuitive PM7100 / PM7200 / PM7300 series
4.10.1 Data display screens ................................................................43
5. Cybersecurity...........................................................................................49
5.1 Overview...........................................................................................49
5.2 Cybersecurity in Schneider Electric .....................................................49
5.3 Cybersecurity resources.....................................................................50
5.4 Product defense-in-depth ...................................................................50
5.4.1 Device security capabilities .......................................................51
5.4.2 Protected environment assumptions ..........................................52
5.4.3 Potential risks and compensating controls ..................................53
5.5 Default settings..................................................................................54
5.6 Bluetooth user account and display passcode ......................................54
5.7 Hardening .........................................................................................55
5.8 Bluetooth pairing and device recognition..............................................56
5.9 Enabling and disabling communication protocols..................................56
5.10 Reporting a security incident or vulnerability.........................................56
5.11 Firmware upgrades ............................................................................56
5.12 Secure disposal guidelines .................................................................56
5.12.1 Secure disposal checklist ..........................................................57
6. Configuring...............................................................................................58
6.1 Configuring using the display ..............................................................58
6.1.1 Enabling or disabling the display passcode during initial
startup .....................................................................................58
6.1.2 Configuring the display passcode ..............................................59
6.1.3 Resetting the display passcode using the product reset ...............59
6.1.4 Configuring the basic setup parameters .....................................60
6.1.5 Configuring the advanced setup parameters...............................62
6.1.6 Configuring the demand calculations..........................................63
6.1.7 Configuring the serial communications .......................................64
6.1.8 Configuring the Ethernet communications ..................................65
6.1.9 Configuring the BACnet/IP settings ............................................67
6.1.10 Configuring Bluetooth ...............................................................68
6.1.11 Configuring the alarm/energy pulsing LED..................................69
6.1.12 Configuring the digital inputs .....................................................70
6.1.13 Configuring the digital outputs ...................................................71
6.1.14 Configuring the relay outputs.....................................................73
6.1.15 Configuring the display settings .................................................74
6.1.16 Configuring the regional settings................................................75
6.1.17 Configuring date and time .........................................................75
6.1.18 Performing global resets ...........................................................76
6.1.19 Performing single resets ...........................................................76
6.1.20 Performing user account resets .................................................77
6.1.21 Locking or unlocking revenue meter...........................................78
6.2 Configuring using the PowerLogic™ Engineering Suite.........................79
12 7EN02-0489-00

PowerLogic
™
Intuitive PM7100 / PM7200 / PM7300 series
6.2.1 Configuring the meter settings ...................................................79
7. Operating..................................................................................................80
7.1 Viewing voltage parameters................................................................80
7.2 Viewing current parameters ................................................................81
7.3 Viewing power parameters .................................................................82
7.4 Viewing energy parameters ................................................................83
7.5 Viewing alarms ..................................................................................83
7.6 Viewing inputs/outputs status..............................................................84
7.7 Viewing diagnostics information ..........................................................85
7.8 Acknowledging the control power (auxiliary power) interruption
event ................................................................................................85
8. Maintenance ............................................................................................87
8.1 Maintenance overview........................................................................87
8.2 Meter memory ...................................................................................87
8.3 Meter battery .....................................................................................87
8.4 Diagnostics information ......................................................................87
8.5 Firmware version, model, and serial number ........................................87
8.5.1 Firmware upgrades...................................................................88
8.6 Control power (auxiliary power) interruption event ................................88
8.7 Wrench icon ......................................................................................88
8.8 Phasors ............................................................................................89
8.8.1 Phasor screens ........................................................................89
8.9 Troubleshooting.................................................................................89
8.9.2 Troubleshooting checks ............................................................90
8.9.3 Diagnostic codes......................................................................91
8.10 Technical assistance ..........................................................................92
9. Technical reference ................................................................................93
9.1 Communications................................................................................93
9.1.1 Recommended network communication metrics .........................93
9.1.2 Serial communications..............................................................93
9.1.3 Ethernet communications..........................................................94
9.1.4 BACnet/IP................................................................................96
9.2 Logging........................................................................................... 100
9.2.1 Data log................................................................................. 100
9.2.2 Alarm log ............................................................................... 100
9.2.3 Memory allocation for log files ................................................. 100
9.3 Inputs/Outputs ................................................................................. 101
9.3.1 Digital input applications ......................................................... 101
9.3.2 Digital output applications ....................................................... 101
9.3.3 Relay output applications ........................................................ 102
9.3.4 Energy pulsing ....................................................................... 102
9.3.5 Input metering ........................................................................ 102
9.4 Resets ............................................................................................ 103
7EN02-0489-00 13

PowerLogic
™
Intuitive PM7100 / PM7200 / PM7300 series
9.4.1 Meter resets........................................................................... 103
9.5 Alarms ............................................................................................ 104
9.5.1 Alarms overview..................................................................... 104
9.5.2 Available alarms ..................................................................... 104
9.5.3 Unary alarms ......................................................................... 104
9.5.4 Digital alarms ......................................................................... 104
9.5.5 Standard alarms..................................................................... 105
9.5.6 Alarm priorities ....................................................................... 109
9.5.7 Alarm setup overview ............................................................. 110
9.5.8 LED alarm indicator ................................................................ 110
9.5.9 Alarm display and notification .................................................. 110
9.5.10 Active alarms list and alarm history log ..................................... 110
9.6 Multi-tariff ........................................................................................ 112
9.6.1 Overview ............................................................................... 112
9.6.2 Multi-tariff implementation ....................................................... 112
9.6.3 Tariff setup ............................................................................. 113
9.6.4 Command mode overview....................................................... 113
9.6.5 Time-of-day mode overview .................................................... 113
9.6.6 Input mode overview............................................................... 115
9.7 Measurements................................................................................. 120
9.7.1 Instantaneous measurements ................................................. 120
9.7.2 Energy measurements............................................................ 120
9.7.3 Preset energy ........................................................................ 120
9.7.4 Min/Max values ...................................................................... 120
9.7.5 Demand measurements.......................................................... 121
9.7.6 Power and power factor .......................................................... 124
9.7.7 Timers ................................................................................... 129
9.8 Power quality................................................................................... 130
9.8.1 Power quality measurements .................................................. 130
9.8.2 Harmonics overview ............................................................... 130
9.8.3 Total harmonic distortion % ..................................................... 130
9.8.4 Total demand distortion........................................................... 130
9.8.5 Harmonic content calculations................................................. 131
9.8.6 THD% calculations ................................................................. 131
9.8.7 thd calculations ...................................................................... 131
9.8.8 TDD calculations .................................................................... 131
9.9 Verifying accuracy............................................................................ 132
9.9.1 Overview of meter accuracy .................................................... 132
9.9.2 Accuracy test requirements ..................................................... 132
9.9.3 Meter settings for accuracy testing........................................... 133
9.9.4 Verifying accuracy test ............................................................ 133
9.9.5 Accuracy verification test points............................................... 135
9.9.6 Energy pulsing considerations................................................. 136
14 7EN02-0489-00

PowerLogic
™
Intuitive PM7100 / PM7200 / PM7300 series
9.9.7 VT and CT considerations........................................................ 136
9.9.8 Example calculations .............................................................. 136
9.9.9 Typical sources of test errors ................................................... 138
9.10 Revenue (MID/MIR meter models) .................................................... 139
9.10.1 Overview ............................................................................... 139
9.10.2 Revenue metering components ............................................... 139
9.10.3 Revenue firmware security features ......................................... 139
9.10.4 Protected setup parameters and functions................................ 139
9.10.5 Revenue locking..................................................................... 140
10. Device specifications............................................................................ 142
7EN02-0489-00 15


1. Safety precautions
Installation, wiring, testing, and service must be performed in compliance with all
local and national electrical codes.
DANGER
HAZARD OF ELECTRIC SHOCK, EXPLOSION, OR ARC FLASH
• Always apply appropriate personal protective equipment (PPE) and follow
safe electrical work practices. See NFPA 70E in the USA, CSA Z462 or
applicable local standards.
• Always turn off all power supplying equipment before working on or inside
the equipment.
• Always use a properly rated voltage sensing device to confirm that all power
is off.
• Do not exceed the maximum ratings of this device.
• Do not install this product in hazardous classified locations.
• Always install products rated only for basic insulation on insulated
conductors.
• Replace all doors, covers, and protective devices before powering the
equipment.
• Treat communications and I/O wiring connected to multiple devices as
hazardous live until determined otherwise.
• Never short the secondary of a Voltage Transformer (VT).
• Never bypass external fusing.
• Never open circuit a Current Transformer (CT).
• Connect current inputs only to AC systems and only through grounded CTs.
Use UL 2808-listed energy-monitoring CTs for UL 2808-compliant
installations.
• This product has not been evaluated for retrofit (modification of a field-
installed panel) applications as per UL 2808.
• Do not install CTs in equipment where they exceed 75% of the wiring space
of any cross-sectional area in the equipment.
• Do not install CTs or meter in areas where ventilation openings may be
blocked or in areas of breaker arc venting.
• Secure CT secondary conductors to ensure they do not contact live circuits.
• Do not install CTs using Class 2 wiring methods or connect them to Class 2
equipment. See NFPA 70E in the USA or applicable local standards.
• Do not mount the meter within 50.8 mm (2 in) of any live circuits including
the primary conductors, primary terminals, and primary lugs.
• Do not allow the meter to contact the panel interior insulation inside the
enclosure.
• Do not use water or any liquid material to clean the product. Use a cleaning
cloth to remove dirt. If dirt cannot be removed, contact local Technical
Support representative.
• Before installation, verify the rating and the characteristics of the supply side
over current protection devices. Do not exceed the maximum current or
voltage rating of the meter.
Failure to follow these instructions will result in death or serious injury.
7EN02-0489-00 17
1. Safety precautions PowerLogic
™
Intuitive PM7100 / PM7200 / PM7300 series
WARNING
UNINTENDED OPERATION
• Do not use the meter for critical control or protection applications where
human or equipment safety relies on the operation of the control circuit.
• Do not use the meter if wrench icon
is displayed on the top left corner of
the display screen.
Failure to follow these instructions can result in death, serious injury, or
equipment damage.
WARNING
INACCURATE DATA RESULTS
• Do not rely solely on data displayed on the display or in software to
determine if this device is functioning correctly or complying with all
applicable standards.
• Do not use data displayed on the display or in software as a substitute for
proper workplace practices or equipment maintenance.
Failure to follow these instructions can result in death, serious injury, or
equipment damage.
WARNING
POTENTIAL COMPROMISE OF SYSTEM AVAILABILITY, INTEGRITY, AND
CONFIDENTIALITY
• Set a display passcode to help reduce the risk of unauthorized physical
access to the meter.
• Disable unused ports/services and default accounts, where possible, to
minimize pathways for malicious attacks.
• Place networked devices behind multiple layers of cyber defenses (such as
firewalls, network segmentation, and network intrusion detection and
protection).
• Use cybersecurity best practices (for example: least privilege, separation of
duties) to help prevent unauthorized exposure, loss, modification of data and
logs, interruption of services, or unintended operation.
Failure to follow these instructions can result in death, serious injury, or
equipment damage.
18 7EN02-0489-00
PowerLogic
™
Intuitive PM7100 / PM7200 / PM7300 series 1. Safety precautions

2. Meter overview
2.1 Overview
The PowerLogic
™
Intuitive PM7100 / PM7200 / PM7300 series power and energy
meters offer value for energy monitoring and cost management applications.
These meters comply with Class 0.2S or Class 0.5S accuracy standards featuring
high quality, reliability, and affordability in a compact, easy-to-install format.
The key features of the meters are:
• Intuitive color graphical display
• Power and energy metering: 3-phase voltage, current, power, demand,
energy, frequency, and power factor
• Multi-tariff controlled by internal clock, digital inputs or communication
• Power quality analysis: THD, thd, and TDD
• Harmonics: individual odd and even up to 31st
• Digital outputs/digital inputs
• Relay outputs
• Time-stamped alarms
• Data logging
• Bluetooth
®
LE communication with core specification version 5.3
NOTE: Bluetooth is available only in specific models.
• Serial port with Modbus protocol (RS-485)
• Ethernet port with Modbus TCP/IP and BACnet/IP
• IPv4, IPv6, DPWS, DHCP, BOOTP
• MID/MIR compliance
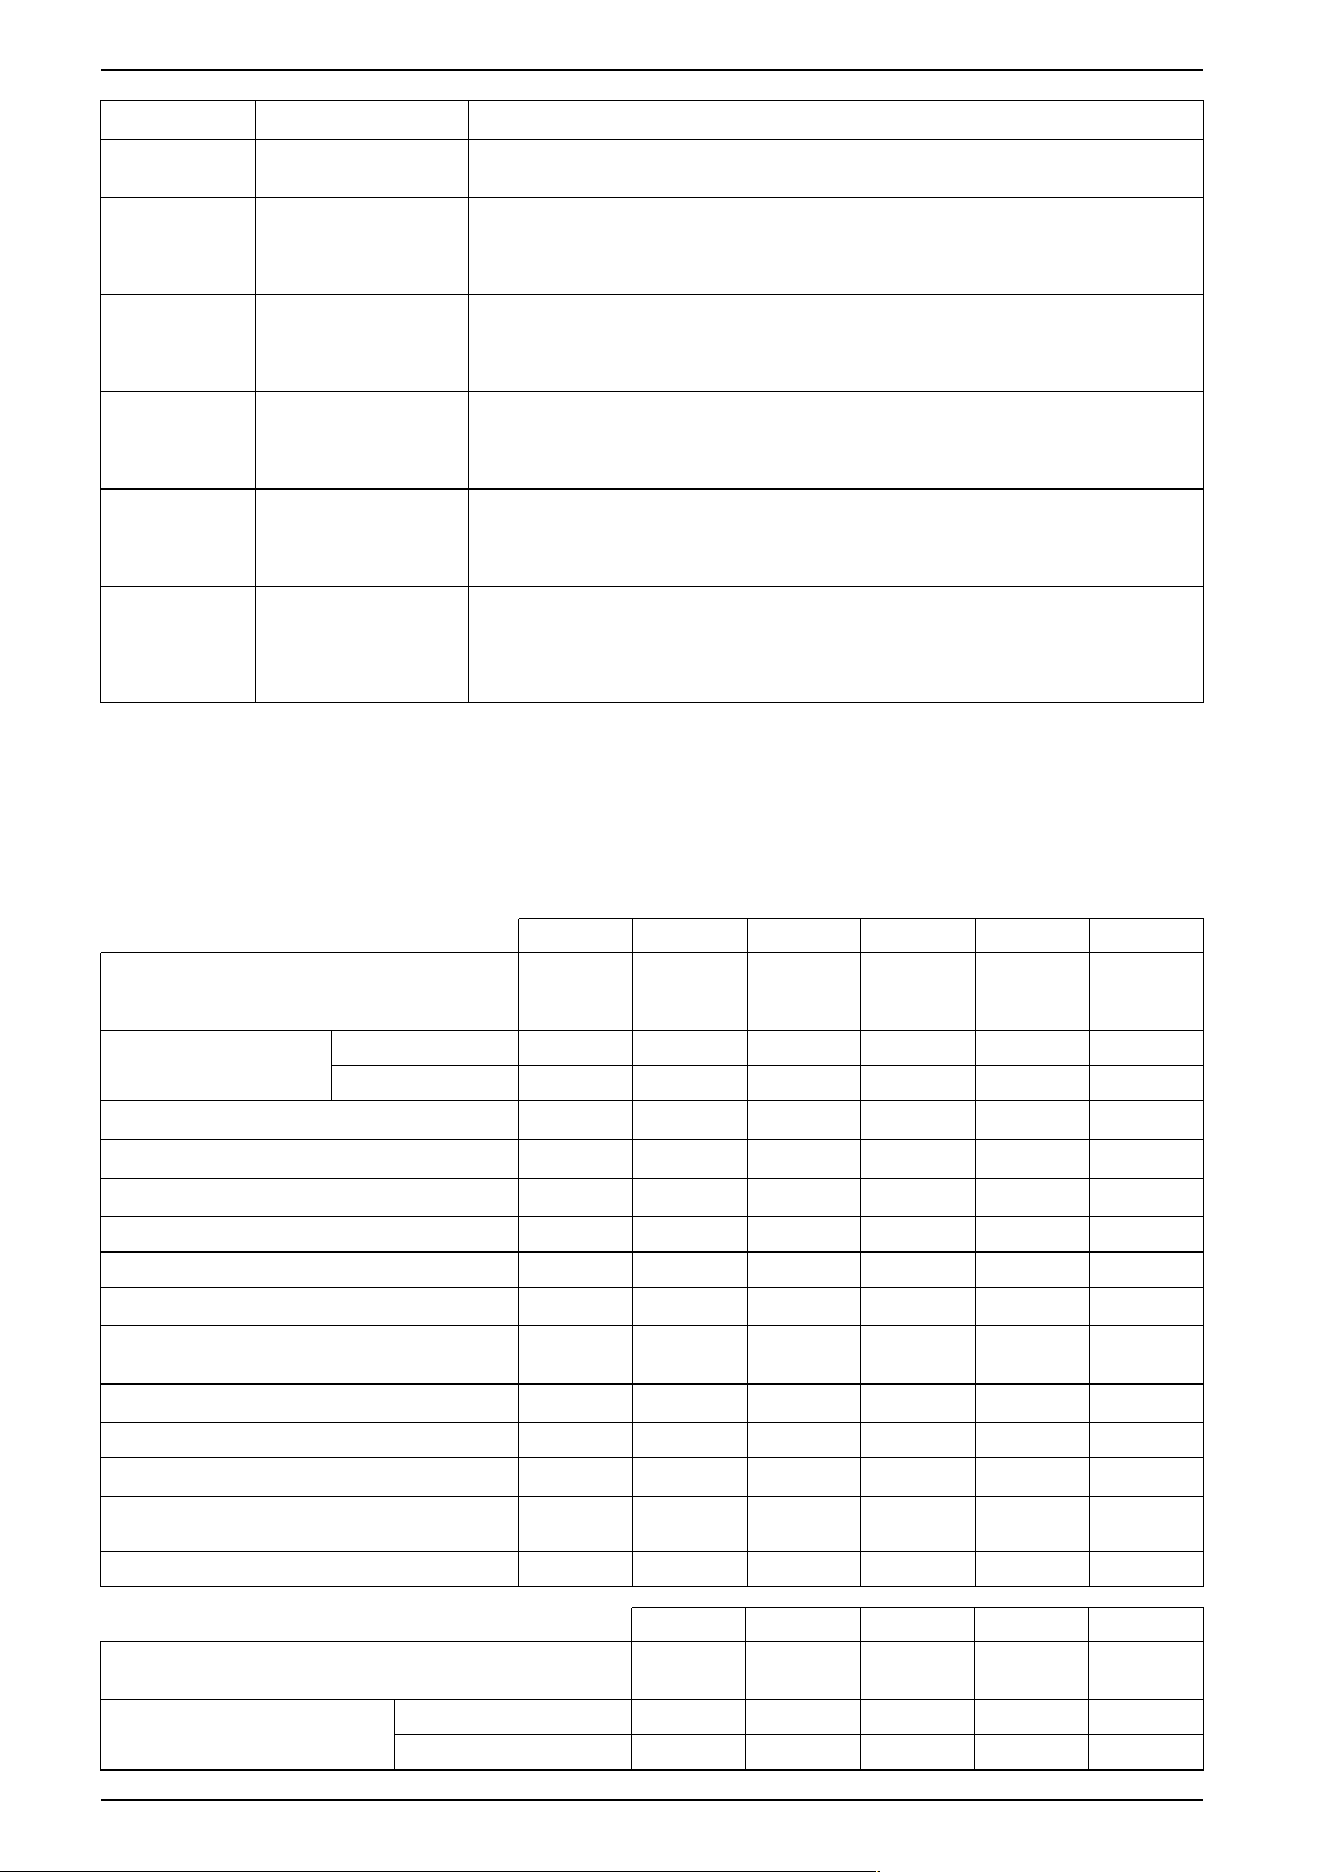
2.2 Meter models
The following table provides an overview of various meter models, highlighting
their key features and specifications:
Model Commercial reference Description
PM7112DUW METSEPM7112DUW
Front panel mount with integrated display, 96 x 96 mm form factor, RS-485 communication
port, accuracy class 0.5S (Wh) and accuracy class 2 (varh), one digital input and one digital
output, two multi-tariffs, 34 alarms, 31st harmonic, and 14 parameters x 15 minutes x 180
days data logging.
PM7142DUW METSEPM7142DUW
Front panel mount with integrated display, 96 x 96 mm form factor, TCP/IP Ethernet
communication port, accuracy class 0.5S (Wh) and accuracy class 2 (varh), one digital
input and one digital output, two multi-tariffs, 34 alarms, 31st harmonic, and 14 parameters
x 15 minutes x 180 days data logging.
PM7151DUW METSEPM7151DUW
Front panel mount with integrated display, 96 x 96 mm form factor, TCP/IP Ethernet
communication port, accuracy class 0.5S (Wh) and accuracy class 2 (varh), two digital
inputs and two digital outputs, two relay outputs, four multi-tariffs, 35 alarms, 31st harmonic,
14 parameters x 15 minutes x 180 days data logging and the meter calibrated to comply
with MID/MIR standards.
PM7211DUW METSEPM7211DUW
Front panel mount with integrated display, 96 x 96 mm form factor, RS-485 communication
port, Bluetooth, accuracy class 0.5S (Wh) and accuracy class 2 (varh), one digital input and
one digital output, two multi-tariffs, 34 alarms, 31st harmonic, 14 parameters x 15 minutes x
180 days data logging, and the meter calibrated to comply with MID/MIR standards.
PM7212DUW METSEPM7212DUW
Front panel mount with integrated display, 96 x 96 mm form factor, RS-485 communication
port, Bluetooth, accuracy class 0.5S (Wh) and accuracy class 2 (varh), one digital input and
one digital output, two multi-tariffs, 34 alarms, 31st harmonic, and 14 parameters x 15
minutes x 180 days data logging.
PM7222DUW METSEPM7222DUW
Front panel mount with integrated display, 96 x 96 mm form factor, RS-485 communication
port, Bluetooth, accuracy class 0.5S (Wh) and accuracy class 2 (varh), two digital inputs
7EN02-0489-00 19
2. Meter overview PowerLogic
™
Intuitive PM7100 / PM7200 / PM7300 series
Model Commercial reference Description
and two digital outputs, four multi-tariffs, 35 alarms, 31st harmonic, and 14 parameters x 15
minutes x 180 days data logging.
PM7231DUW METSEPM7231DUW
Front panel mount with integrated display, 96 x 96 mm form factor, RS-485 communication
port, Bluetooth, accuracy class 0.5S (Wh) and accuracy class 2 (varh), four digital inputs,
two relay outputs, 16 multi-tariffs, 37 alarms, 31st harmonic, 14 parameters x 15 minutes x
180 days data logging, and the meter calibrated to comply with MID/MIR standards.
PM7232DUW METSEPM7232DUW
Front panel mount with integrated display, 96 x 96 mm form factor, RS-485 communication
port, Bluetooth, accuracy class 0.5S (Wh) and accuracy class 2 (varh), four digital inputs,
two relay outputs, 16 multi-tariffs, 37 alarms, 31st harmonic, and 14 parameters x 15
minutes x 180 days data logging.
PM7252DUW METSEPM7252DUW
Front panel mount with integrated display, 96 x 96 mm form factor, TCP/IP Ethernet
communication port, Bluetooth, accuracy class 0.5S (Wh) and accuracy class 2 (varh), two
digital inputs and two digital outputs, two relay outputs, four multi-tariffs, 35 alarms, 31st
harmonic, and 14 parameters x 15 minutes x 180 days data logging.
PM7332DUW METSEPM7332DUW
Front panel mount with integrated display, 96 x 96 mm form factor, RS-485 communication
port, Bluetooth, accuracy class 0.2S (Wh) and accuracy class 2 (varh), four digital inputs,
two relay outputs, 16 multi-tariffs, 37 alarms, 31st harmonic, and 14 parameters x 15
minutes x 180 days data logging.
PM7351DUW METSEPM7351DUW
Front panel mount with integrated display, 96 x 96 mm form factor, TCP/IP Ethernet
communication port, Bluetooth, accuracy class 0.2S (Wh) and accuracy class 2 (varh), two
digital inputs and two digital outputs, two relay outputs, 16 multi-tariffs, 31st harmonic, 35
alarms, 14 parameters x 15 minutes x 180 days data logging, and the meter calibrated to
comply with MID/MIR standards.
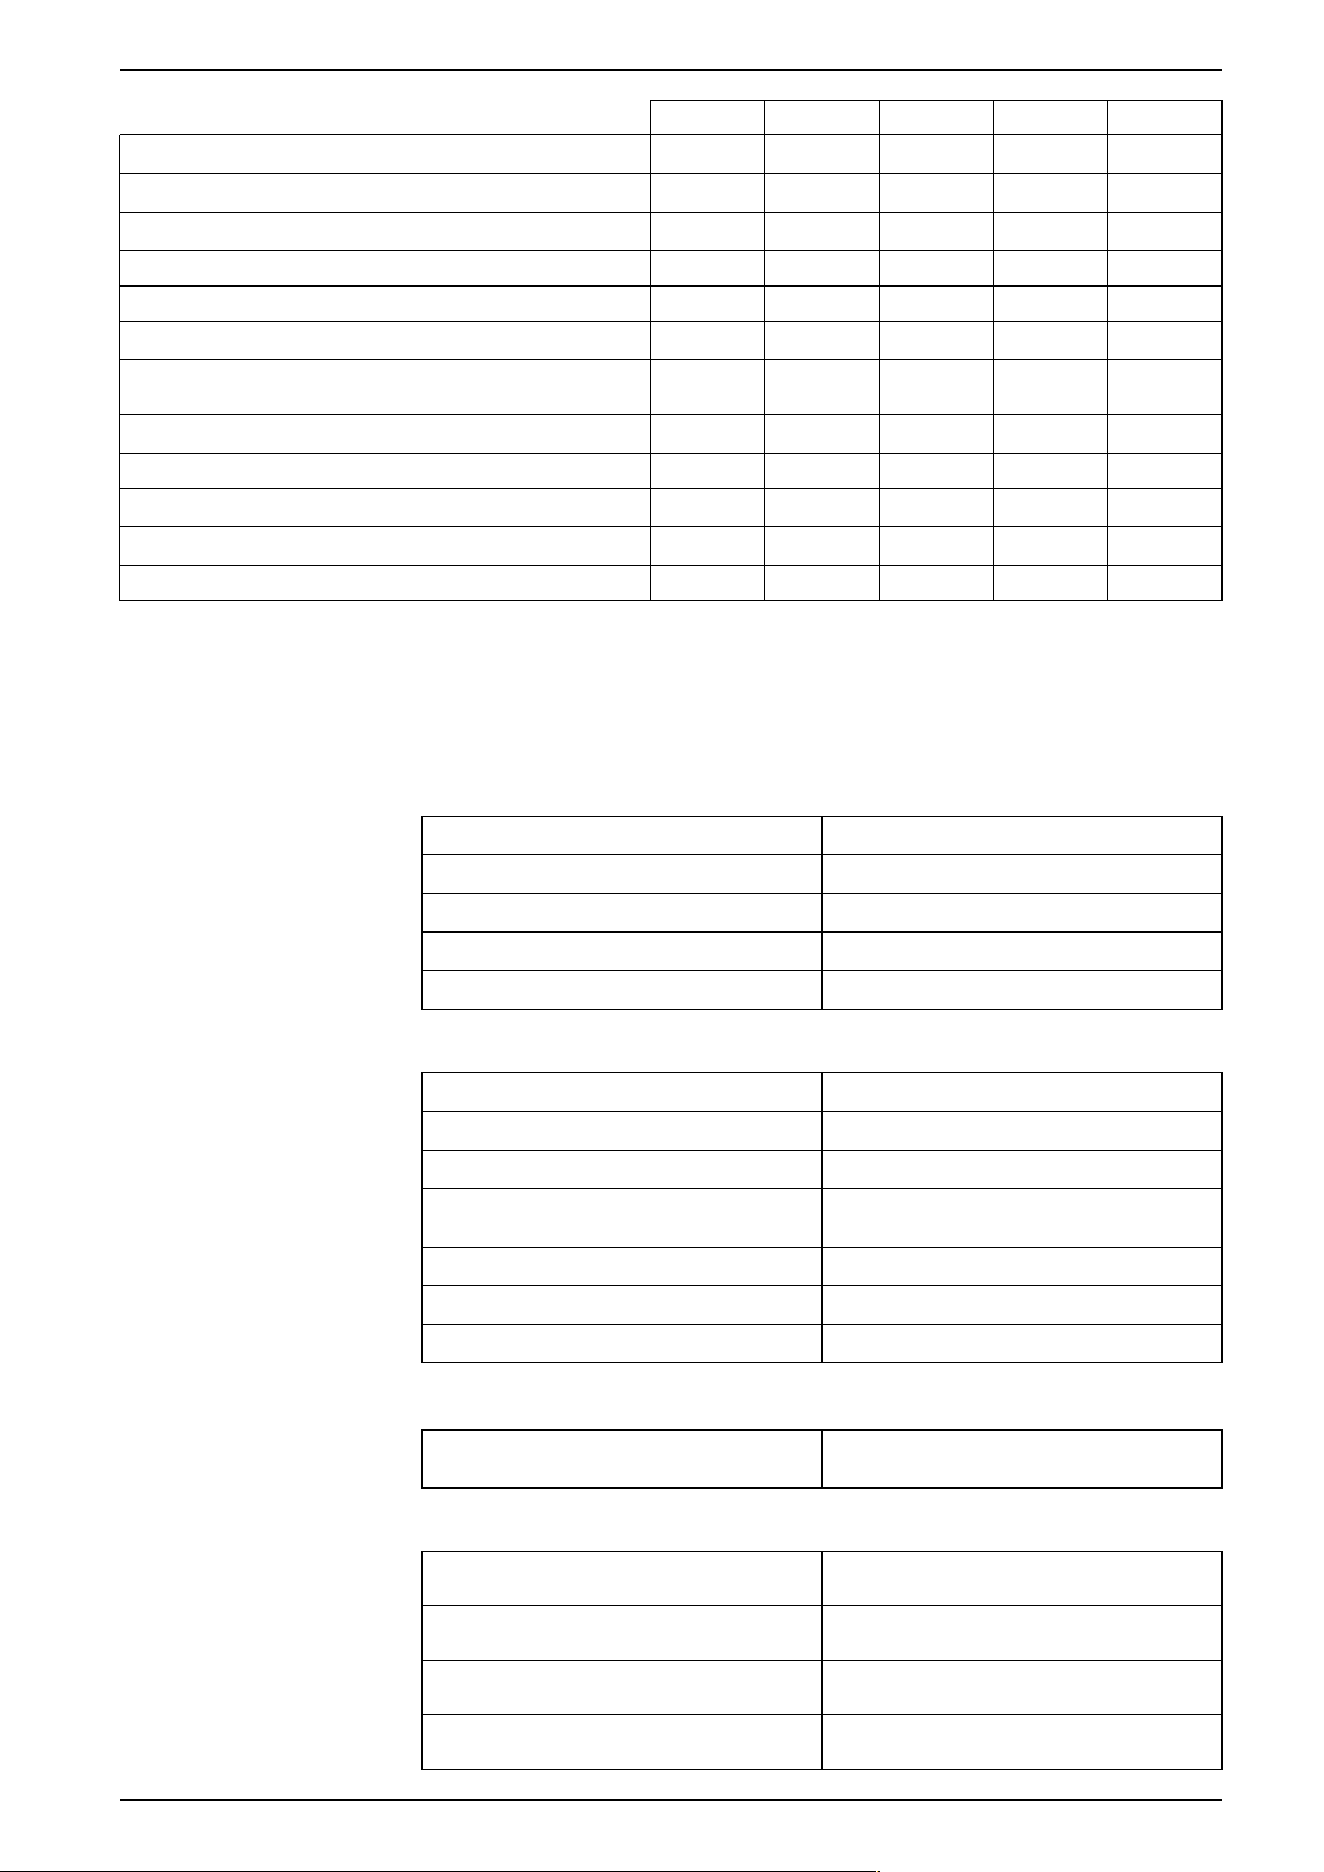
2.3 Feature summary
The following table provides an overview of the key features and functionalities of
the meter models:
PM7112DUW PM7142DUW PM7151DUW PM7211DUW PM7212DUW PM7222DUW
Power and energy metering: 3-phase voltage,
current, power, demand, energy, frequency, and
power factor
✔ ✔ ✔ ✔ ✔ ✔
Accuracy
Wh Class 0.5S Class 0.5S Class 0.5S Class 0.5S Class 0.5S Class 0.5S
varh Class 2 Class 2 Class 2 Class 2 Class 2 Class 2
Digital inputs (S1, S2, S3, S4)
1 1 2 1 1 2
Digital outputs (D1, D2)
1 1 2 1 1 2
Relay outputs (R1, R2)
— —
2
— — —
Alarms 34 34 35 34 34 35
Multi-tariffs 2 2 4 2 2 4
Power quality analysis: THD, thd, and TDD
✔ ✔ ✔ ✔ ✔ ✔
Power quality analysis: Harmonics, individual (odd
and even) up to
31st 31st 31st 31st 31st 31st
Data logging (parameters x minute interval x days)
14x15x180 14x15x180 14x15x180 14x15x180 14x15x180 14x15x180
Bluetooth communication
— — — ✔ ✔ ✔
Communications: RS-485 Modbus protocol
✔ — — ✔ ✔ ✔
Communications: Ethernet port with Modbus TCP
and BACnet/IP
— ✔ ✔ — — —
MID/MIR
— — ✔ ✔ — —
PM7231DUW PM7232DUW PM7252DUW PM7332DUW PM7351DUW
Power and energy metering: 3-phase voltage, current, power,
demand, energy, frequency, and power factor
✔ ✔ ✔ ✔ ✔
Accuracy
Wh Class 0.5S Class 0.5S Class 0.5S Class 0.2S Class 0.2S
varh Class 2 Class 2 Class 2 Class 2 Class 2
20 7EN02-0489-00
PowerLogic
™
Intuitive PM7100 / PM7200 / PM7300 series 2. Meter overview
PM7231DUW PM7232DUW PM7252DUW PM7332DUW PM7351DUW
Digital inputs (S1, S2, S3, S4)
4 4 2 4 2
Digital outputs (D1, D2)
— —
2
—
2
Relay outputs (R1, R2)
2 2 2 2 2
Alarms 37 37 35 37 35
Multi-tariffs 16 16 4 16 16
Power quality analysis: THD, thd, and TDD
✔ ✔ ✔ ✔ ✔
Power quality analysis: Harmonics, individual (odd and even) up
to
31st 31st 31st 31st 31st
Data logging (parameters x minute interval x days)
14x15x180 14x15x180 14x15x180 14x15x180 14x15x180
Bluetooth communication
✔ ✔ ✔ ✔ ✔
Communications: RS-485 Modbus protocol
✔ ✔ — ✔ —
Communications: Ethernet port with Modbus TCP and BACnet/IP
— — ✔ — ✔
MID/MIR
✔ — — — ✔
Functions and characteristics
This section details the various functions and characteristics of the meters.
Table 1 - General
Use on LV and MV systems
✔
Basic metering with THD and min/max readings
✔
Input metering
✔
Monthly auto reset for max demand, Wh
✔
CT polarity/phase sequence detections
✔
Table 2 - Instantaneous rms values
Current (Average, per phase and neutral)
✔
Voltage (Average, per phase L-L, and L-N)
✔
Frequency
✔
Real, reactive, and apparent power (Total and
per phase)
Signed, four quadrant
True power factor (Average and per phase) Signed, four quadrant
Displacement PF (Average and per phase) Signed, four quadrant
% Unbalanced I, V L-N, and V L-L
✔
Table 3 - Energy values
Partial and non-resettable accumulated active,
reactive, and apparent energy
Received/Delivered, net and absolute
Table 4 - Demand values
Current average
Present, last, predicted, peak, and peak date
time
Active power
Present, last, predicted, peak, and peak date
time
Reactive power
Present, last, predicted, peak, and peak date
time
Apparent power
Present, last, predicted, peak, and peak date
time
7EN02-0489-00 21
2. Meter overview PowerLogic
™
Intuitive PM7100 / PM7200 / PM7300 series
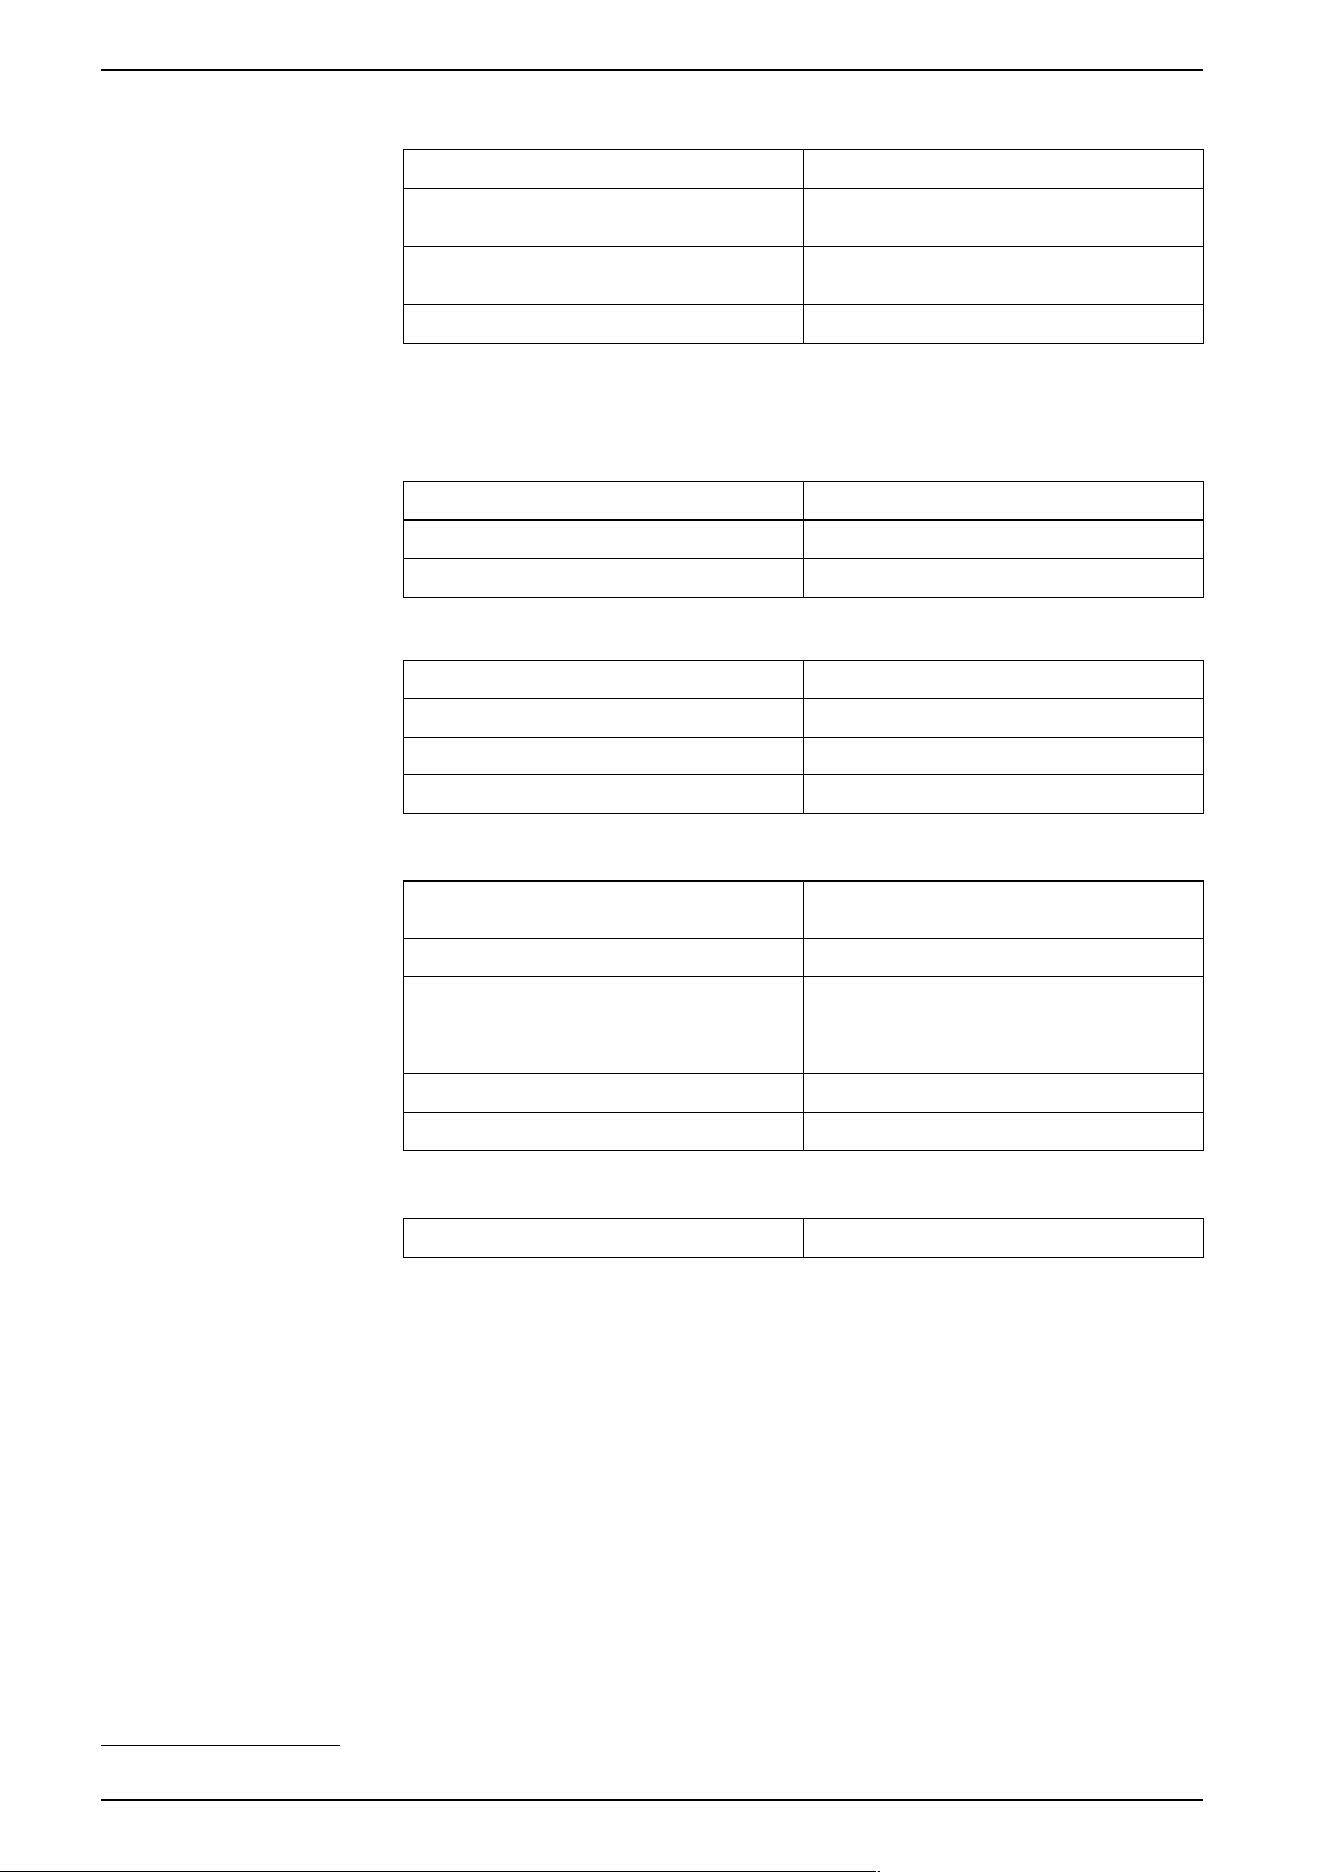
Table 4 - Demand values (Continued)
Peak demand with timestamping
✔
Demand calculation (Sliding, fixed and rolling
block, and thermal methods)
✔
Synchronization of the measurement window to
input, communication command or internal clock
✔
Configurable demand intervals
✔
NOTE: Reactive power and energy are calculated according to IEC 62053-24.
Harmonics are not included in this calculation.
Table 5 - Power quality measurements
THD (Total Harmonic Distortion), thd
I, V L-N, V L-L
TDD (Total Demand Distortion)
✔
Individual harmonics (odd and even)
✔
Table 6 - Other measurements
I/O Timers and Counters
(1)
✔
Operating timer
(1)
✔
Active load timer
(1)
✔
Alarm counters and alarm logs
✔
Table 7 - Data recording
Min/max of instantaneous values, plus phase
identification
(1)
✔
Alarms with 1 s timestamping
(1)
✔
Data logging
Data logging up to 14 parameters with
configurable interval and duration (for example,
14 parameters for 180 days at 15-minute
interval)
Maintenance, alarm, and event logs
✔
Preset energy
✔
Table 8 - Wetting voltage
Wetting voltage
✔
2.4 Data display and analysis tools
2.4.1 Meter configuration
Meter configuration can be performed through the display and PowerLogic™
Engineering Suite.
PowerLogic™ Engineering Suite is a meter configuration tool that can be
downloaded for free at www.se.com.
See the PowerLogic™ Engineering Suite online help or the PowerLogic™
Engineering Suite device configuration guide (7EN02-0505) for instructions on
how to configure your meter. To download a copy, go to www.se.com and search
for PowerLogic™ Engineering Suite device configuration guide.
22 7EN02-0489-00
PowerLogic
™
Intuitive PM7100 / PM7200 / PM7300 series 2. Meter overview
(1) Stored in non-volatile memory.

2.4.2 Bluetooth interface
Meter’s instantaneous parameters (data monitoring), device info, date and time,
and alarm information can be accessed using the Bluetooth interface from a
smartphone through the EcoStruxure
™
Power Device (EPD) application.
The EcoStruxure
™
Power Device (EPD) is a panel commissioning tool which can
be downloaded for free at www.se.com. See the EcoStruxure
™
Power Device
(EPD) user guide for instructions on how to commission your meter. To download
a copy, go to www.se.com and search for EcoStruxure
™
Power Device (EPD) user
guide (DOCA0365).
NOTE: Limited support for EPD at launch, with full features enabled later.
Data transferred over Bluetooth wireless technology is encrypted using AES 128-
bit encryption algorithm.
2.4.3 Modbus command interface
Most of the meter’s real-time and logged data, as well as basic configuration and
setup of meter features, can be accessed and programmed using a Modbus
command interface as published in the meter’s Modbus register list along with the
meter firmware.
This is an advanced procedure that should only be performed by users with
advanced knowledge of Modbus, their meter, and the power system being
monitored. For further information on the Modbus command interface, contact
Technical Support.
See your meter’s Modbus register list at www.se.com for the Modbus mapping
information and basic instructions on command interface.
2.4.4 EcoStruxure
™
Building Operation
EcoStruxure
™
Building Operation is a complete software solution for integrated
monitoring, control, and management of energy, lighting, fire safety, and HVAC.
It natively supports the major communication standards in building automation and
security management, including TCP/IP, LonWorks, BACnet, Modbus and
Ethernet.
2.4.5 EcoStruxure
™
Power Monitoring Expert
EcoStruxure
™
Power Monitoring Expert is a complete supervisory software
package for power management applications.
The software collects and organizes data gathered from your facility’s electrical
network and presents it as meaningful, actionable information using an intuitive
web interface.
EcoStruxure
™
Power Monitoring Expert communicates with devices on the
network to provide:
• Real-time monitoring through a multi-user web portal
• Trend graphing and aggregation
• Power quality analysis and compliance monitoring
• Pre-configured and custom reporting
See the EcoStruxure
™
Power Monitoring Expert online help for instructions on
how to add your device into its system for data collection and analysis.
7EN02-0489-00 23
2. Meter overview PowerLogic
™
Intuitive PM7100 / PM7200 / PM7300 series

2.4.6 EcoStruxure
™
Power Operation
EcoStruxure
™
Power Operation is a complete real-time monitoring and control
solution for large facility and critical infrastructure operations.
It communicates with your device for data acquisition and real-time control. You
can use EcoStruxure
™
Power Operation for:
• System supervision
• Real-time and historical trending, event logging
• PC-based custom alarms
See the EcoStruxure
™
Power Operation online help for instructions on how to add
your device into its system for data collection and analysis.
24 7EN02-0489-00
PowerLogic
™
Intuitive PM7100 / PM7200 / PM7300 series 2. Meter overview
3. Hardware reference
3.1 Supplemental information
This document should be used along with the instruction sheet included in the box
with your device and accessories.
See your device’s instruction sheet for information related to installation.
See your product’s catalog pages at www.se.com for information about your
device, its options, and accessories.
You can download updated documentation from www.se.com or contact your local
Schneider Electric representative for the latest information about your product.
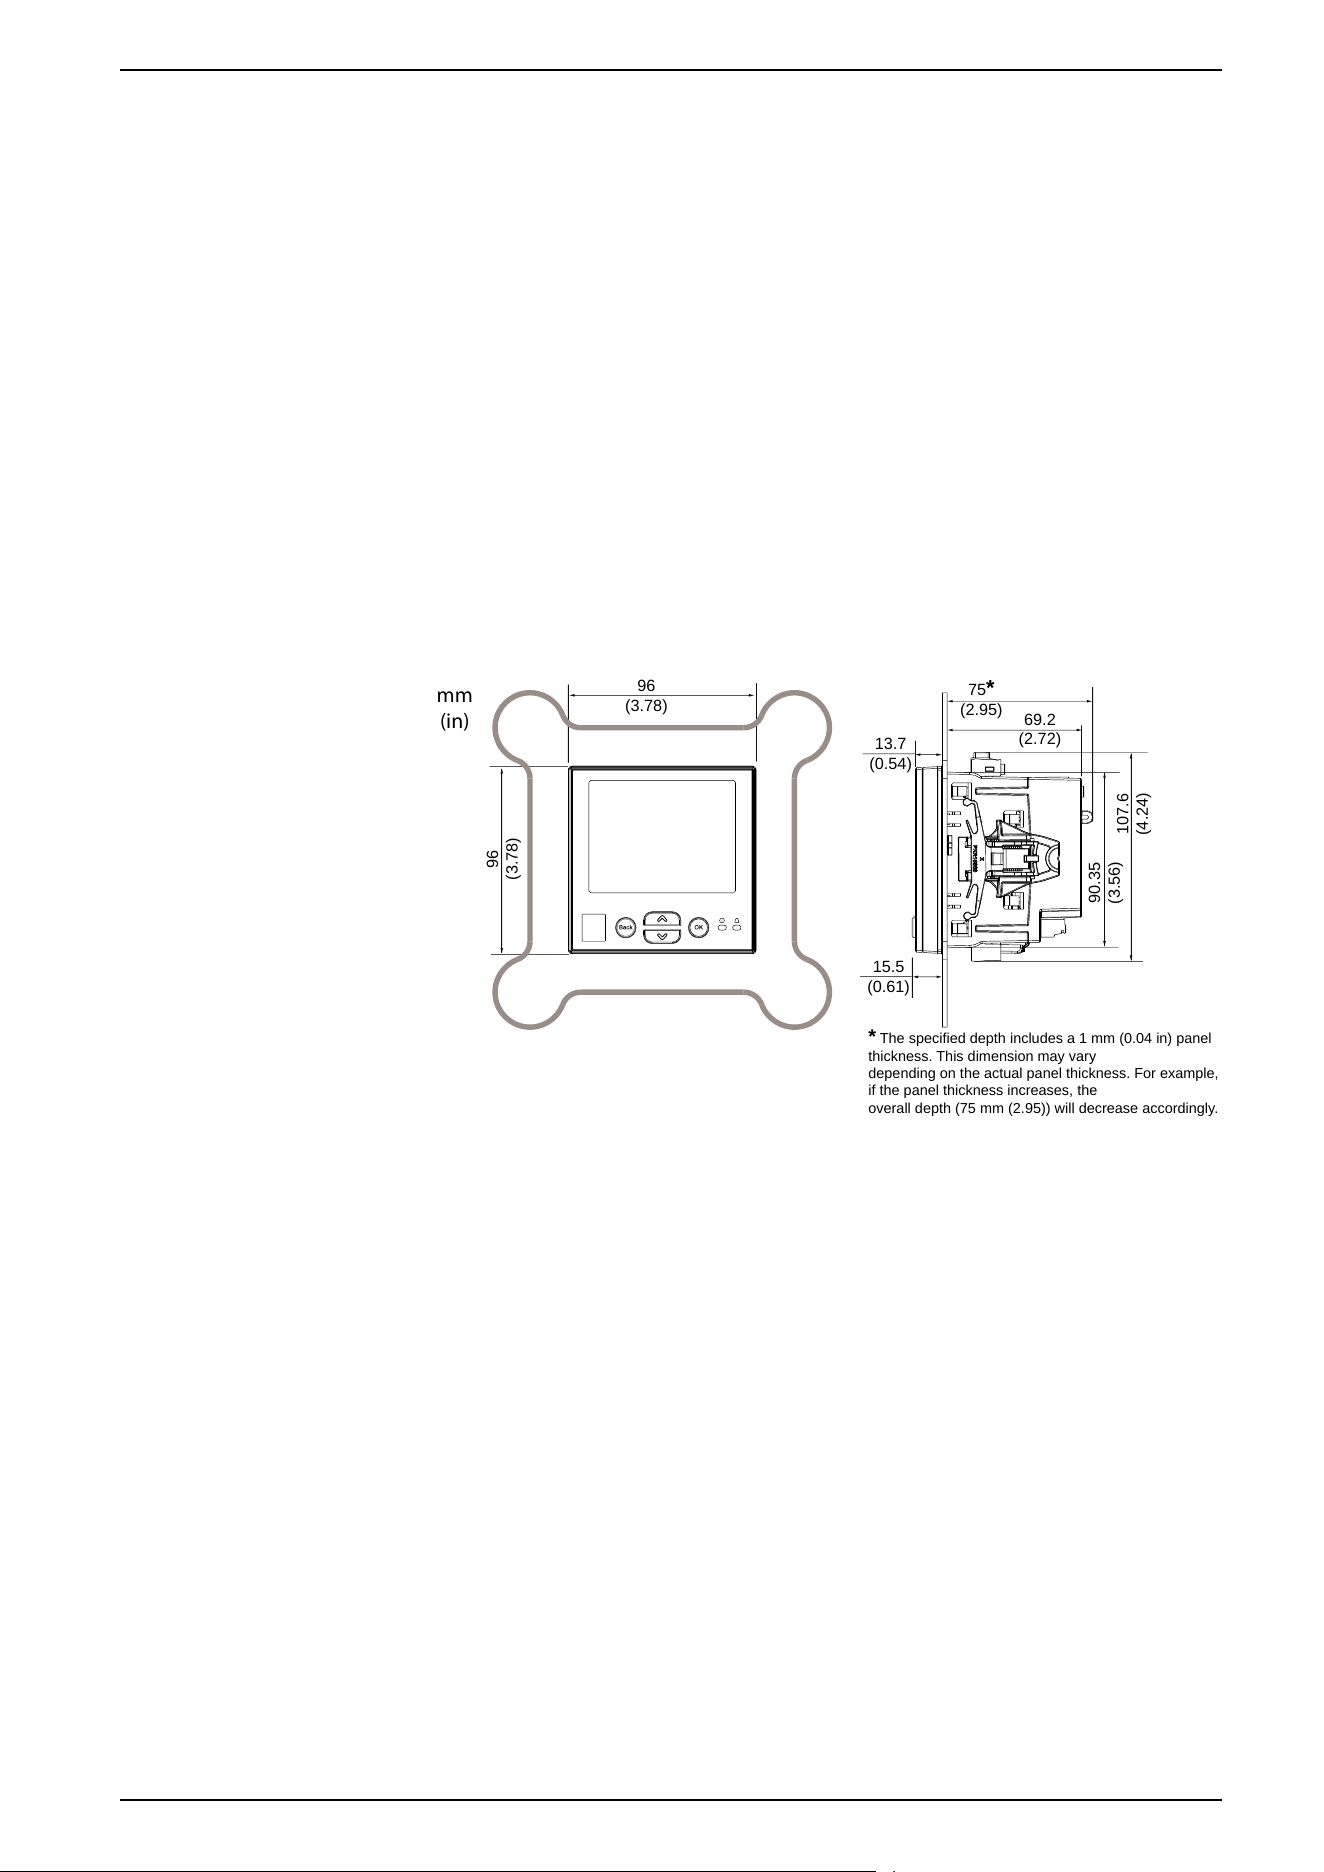
3.2 Dimensions
The following illustration shows the meter dimensions:
mm
(in)
96
(3.78)
96
(3.78)
75*
(2.95)
13.7
(0.54)
15.5
(0.61)
107.6
(4.24)
90.35
(3.56)
69.2
(2.72)
*
The specified depth includes a 1 mm (0.04 in) panel
thickness. This dimension may vary
depending on the actual panel thickness. For example,
if the panel thickness increases, the
overall depth (75 mm (2.95)) will decrease accordingly.
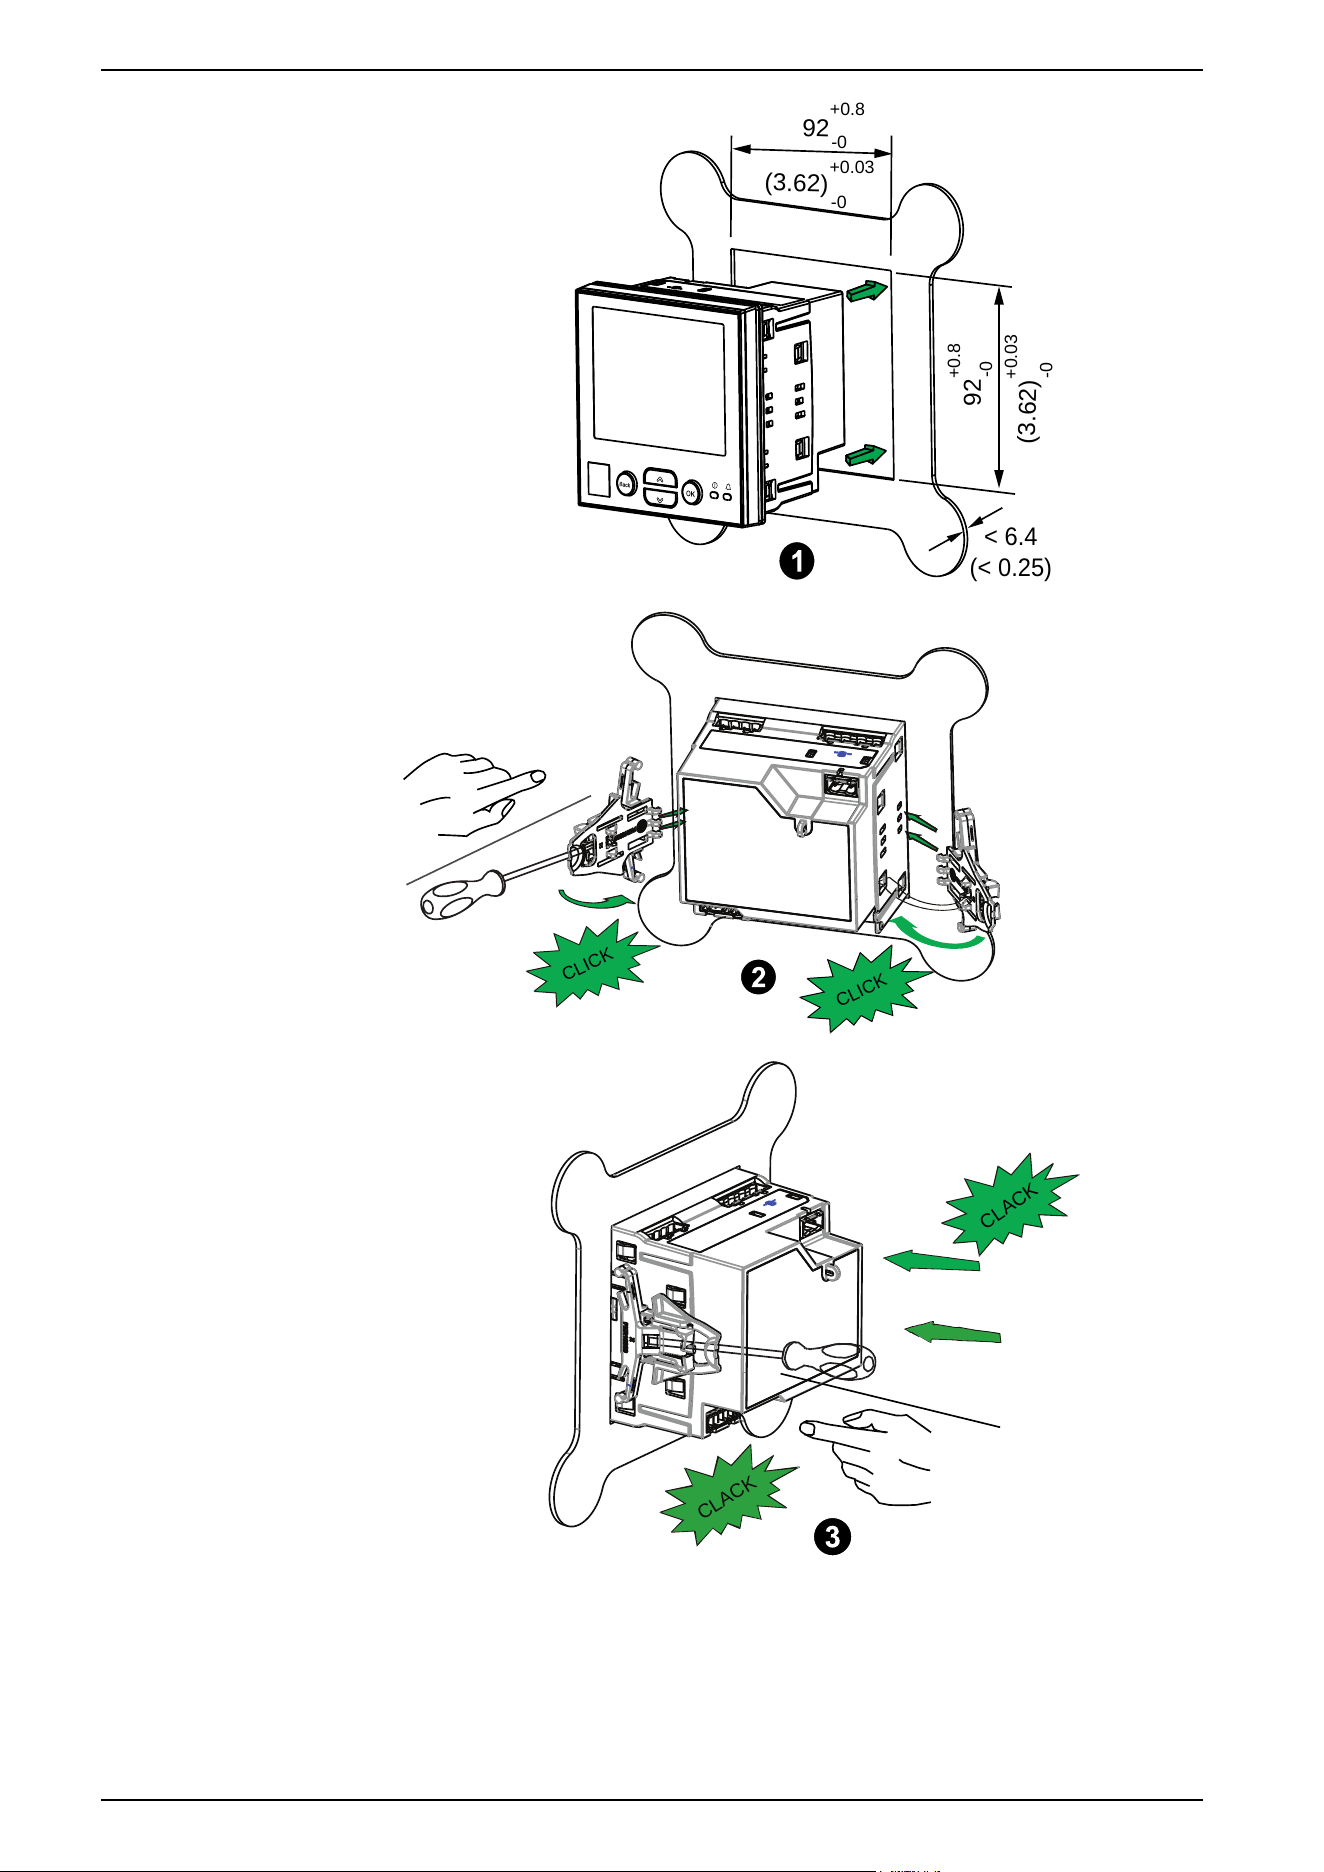
3.3 Mounting
The following illustration shows the meter’s mounting instructions:
7EN02-0489-00 25
3. Hardware reference PowerLogic
™
Intuitive PM7100 / PM7200 / PM7300 series
(8)
(9)
(70)
(71)
(73)
(74)
UL: CAT III
20...347 V L-N/35...600 V L-L
IEC: CAT III
20...400 V L-N/35...690 V L-L
MID/MIR:
3x63.5 V L-N/110 V L-L...3x400 V L-N/690 V L-L
63.5...400 V L-N
100...277 V L-N/415 V L-L ± 10%
50/60 ± 5 Hz < 13.5 VA
(CAT II)
250 V AC/8 A
30 V DC/5 A
NO
NO
RELAY1
RELAY2
V1 V2 V3 VN
L1 L2
125...250 V DC ± 20% < 3.2 W
(1)
(2)
(3)
(4)
0 V
0.01...1(2) A / 0.05...5(10) A, 50/60 Hz
D0 = Rx-, Tx-
Modbus
RS-485
24 V DC
8 mA
36 V DC
(10)
(11)
(12)
(13)
(14)
(15)
I1+
I1-
I2+
I
2-
I3+
I3-
(22)
D1
D0
0V
SHLD
(23)
(24)
(25)
+
-
C
(60)
(62)
D2+
D1+
(40)
(42)
S2+
S1+
24 V DC
8 mA
40 V DC
20 mA
36 V DC
-/C
(57)
+
(56)
(44)
(46)
S4+
S3+
(40)
(42)
S2+
S1+
-/C
(57)
+
(56)
(60)
D1+
(40)
S1+
-/C
(57)
+
(56)
24 V DC
8 mA
40 V DC
20 mA
36 V DC
D1 = Rx+, Tx+
Modbu
s TCP/IP
(30)
Act
Link
10/100
50/60 Hz
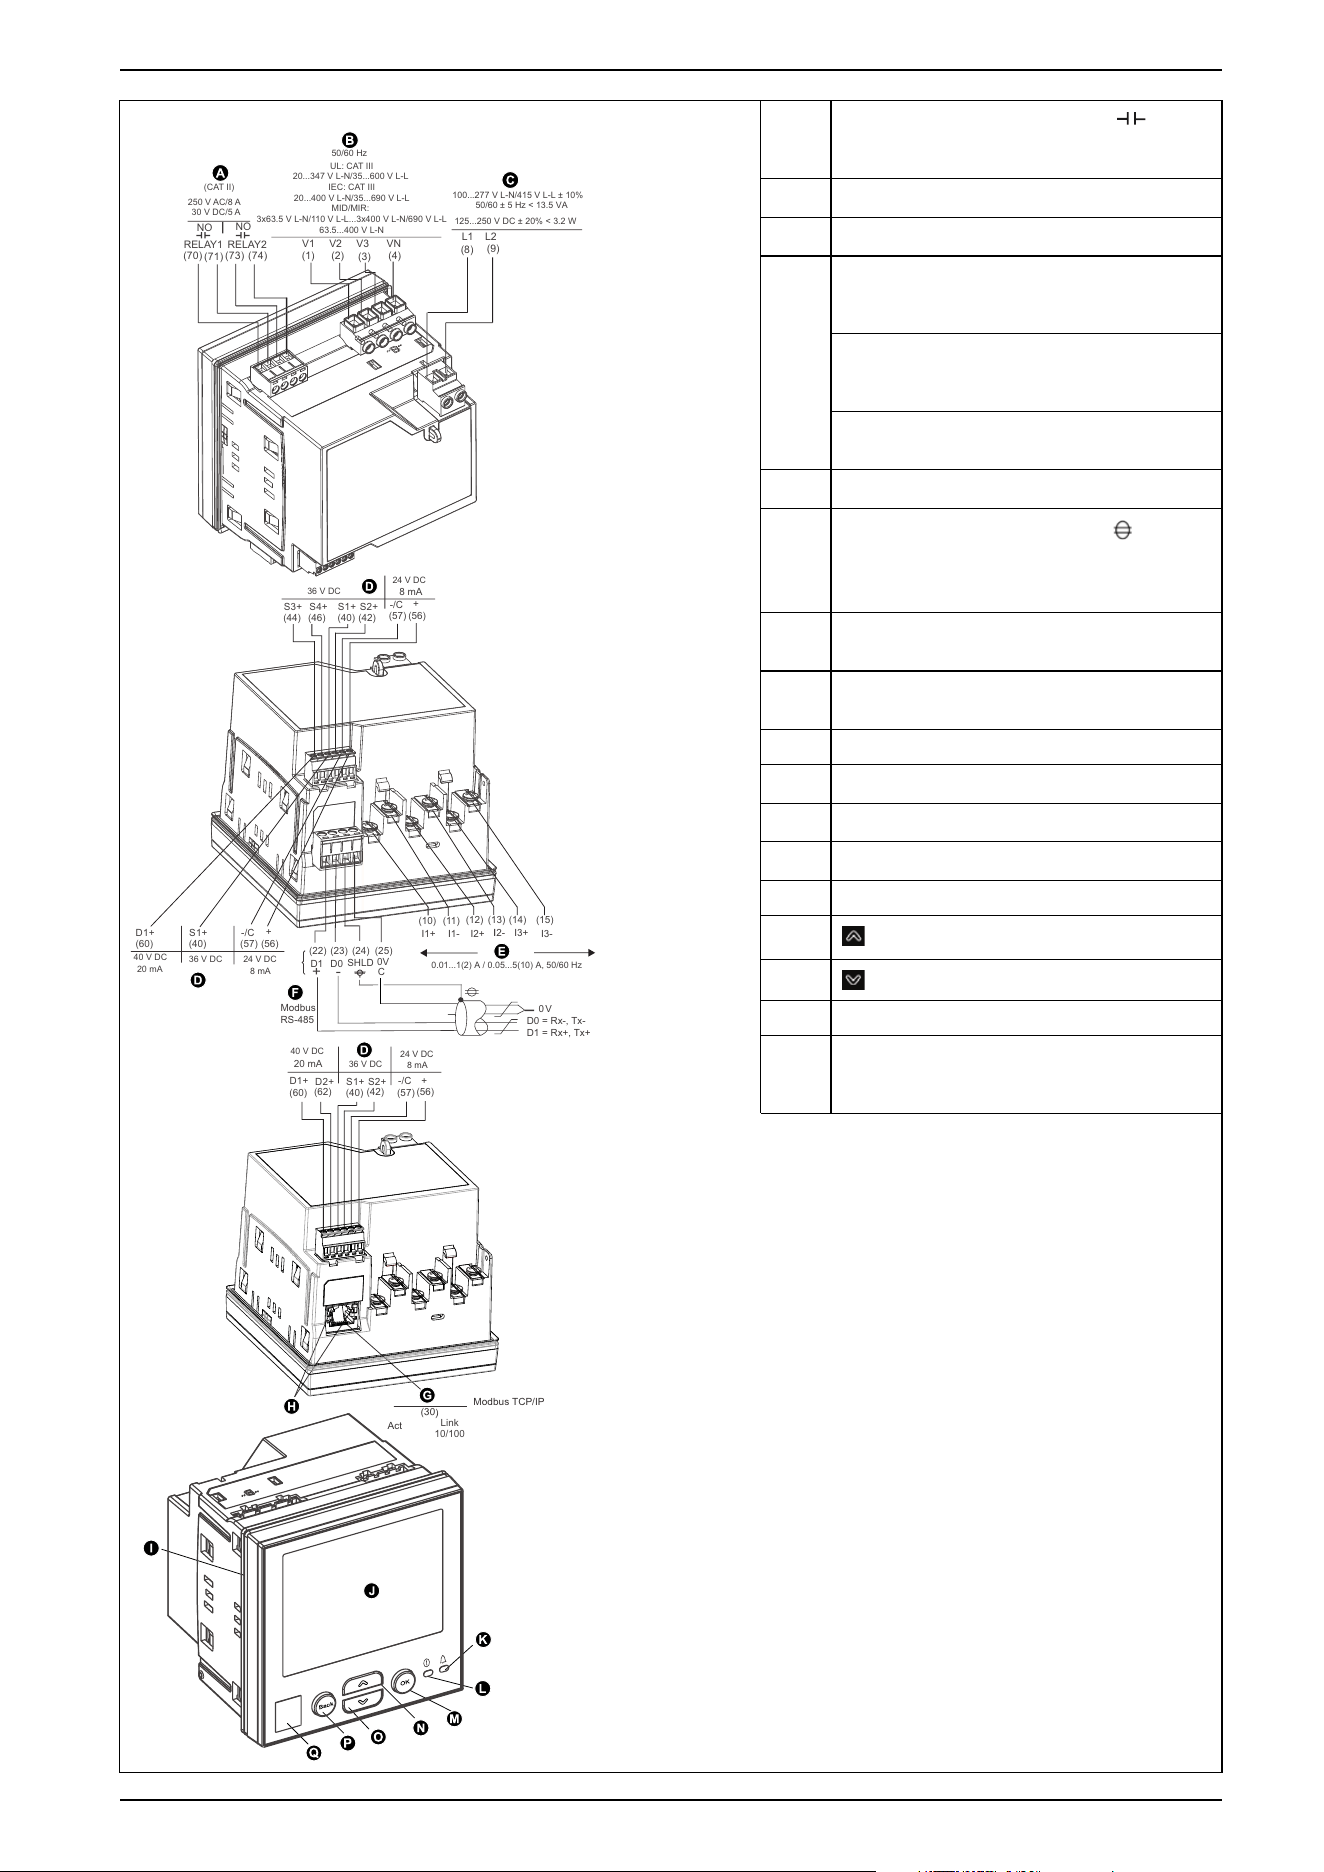
A
Relay output (Relay1, Relay2 (NO,
))
(PM7151DUW / PM7231DUW / PM7232DUW /
PM7252DUW / PM7332DUW / PM7351DUW)
B
Voltage input (V1, V2, V3, VN)
C
Control power (Auxiliary power) input (L1, L2)
D
Digital output/Digital input (D1+, S1+, -/C, +)
(PM7112DUW / PM7142DUW / PM7211DUW /
PM7212DUW)
Digital output/Digital input (D1+, D2+, S1+, S2
+, -/C, +) (PM7151DUW / PM7222DUW /
PM7252DUW / PM7351DUW)
Digital input (S3+, S4+, S1+, S2+, -/C, +)
(PM7231DUW / PM7232DUW / PM7332DUW)
E
Current input (I1+, I1-, I2+, I2-, I3+, I3-)
F
Modbus RS-485 input (D1/+, D0/-,
, 0V)
(PM7112DUW / PM7211DUW / PM7212DUW /
PM7222DUW / PM7231DUW / PM7232DUW /
PM7332DUW)
G
Ethernet port (PM7142DUW / PM7151DUW /
PM7252DUW / PM7351DUW)
H
Ethernet port LED indicators (PM7142DUW /
PM7151DUW / PM7252DUW / PM7351DUW)
I Gasket
J
Display
K
Alarm/energy pulsing LED (Amber)
L
Heartbeat/communications LED (Green)
M OK button
N
Up button
O
Down button
P Back button
Q
QR code. Scan the QR code to access product
information on the Schneider Electric landing
page.
7EN02-0489-00 27
3. Hardware reference PowerLogic
™
Intuitive PM7100 / PM7200 / PM7300 series
3.5 Terminal covers
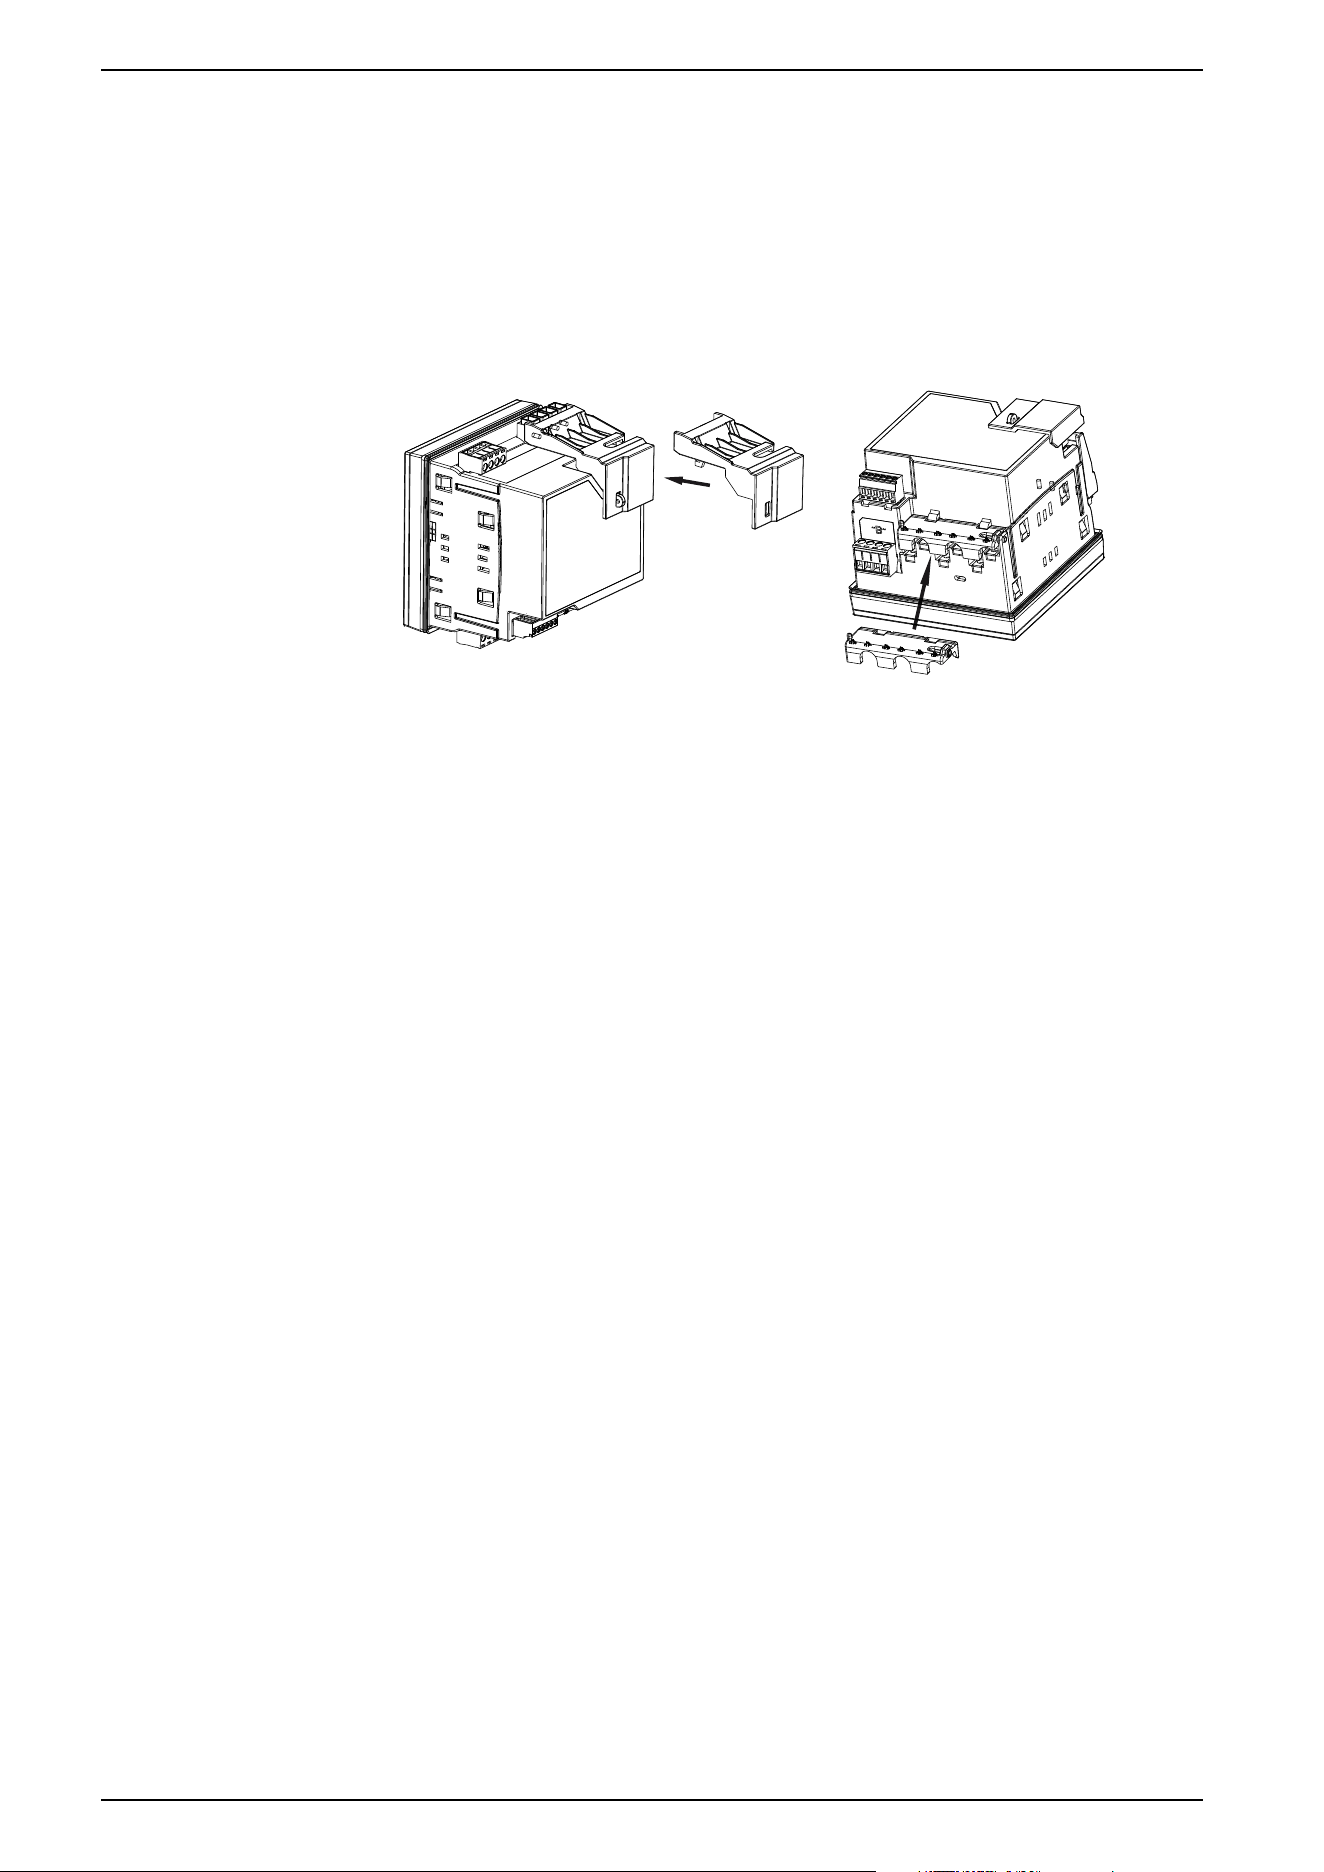
The terminal covers for voltage, current, and control/auxiliary power helps prevent
and detect tampering. They enclose the terminals, fixing screws, and part of the
external conductors and their insulation.
NOTE:
• The terminal covers must be installed and sealed.
• Use steel cable with 1.6 mm (1/16 in) diameter and 152.4 mm (6 in)
adjustable length for sealing.
3.6 LED indicators
3.6.1 Alarm/energy pulsing LED
The alarm/energy pulsing LED can be configured for alarm notification or energy
pulsing.
When configured for alarm notification, this LED flashes when a high, medium, or
low priority alarm is active indicating an active alarm condition or an inactive but
unacknowledged high priority alarm.
When configured for energy pulsing, this LED flashes at a rate proportional to the
energy consumption which is typically used to verify the power meter’s accuracy.
The alarm/energy pulsing LED on the MID/MIR meter models is permanently set
for energy pulsing and cannot be disabled or used for alarms.
3.6.2 Heartbeat/serial communications LED
The heartbeat/serial communications LED blinks to indicate the meter’s operation
and serial Modbus communication status.
The LED blinks at a slow, steady rate to indicate the meter is operational. The LED
flashes at a variable, faster rate when the meter is communicating over a Modbus
serial communications port.
NOTE:
• You cannot configure this LED for other purposes.
• If the LED remains lit without blinking or flashing, it may indicate a
technical problem. In this case, power down the meter and reapply power.
If the problem persists, contact Technical Support.
3.6.3 Ethernet communications LEDs
The meter has two LEDs per port for Ethernet communications.
28 7EN02-0489-00
PowerLogic
™
Intuitive PM7100 / PM7200 / PM7300 series 3. Hardware reference
The Link LED indicates Ethernet link status and communication speed. The LED
is off when no Ethernet link is detected. The LED is yellow when the Ethernet
communication speed is 10 Mbps and green when the Ethernet communication
speed is 100 Mbps.
The Act (activity) LED flashes when the meter transmits or receives data through
the Ethernet port.
NOTE: You cannot configure these LEDs for other purposes.
3.7 Wiring
3.7.1 Power system wiring - Voltage and current measurement
circuits
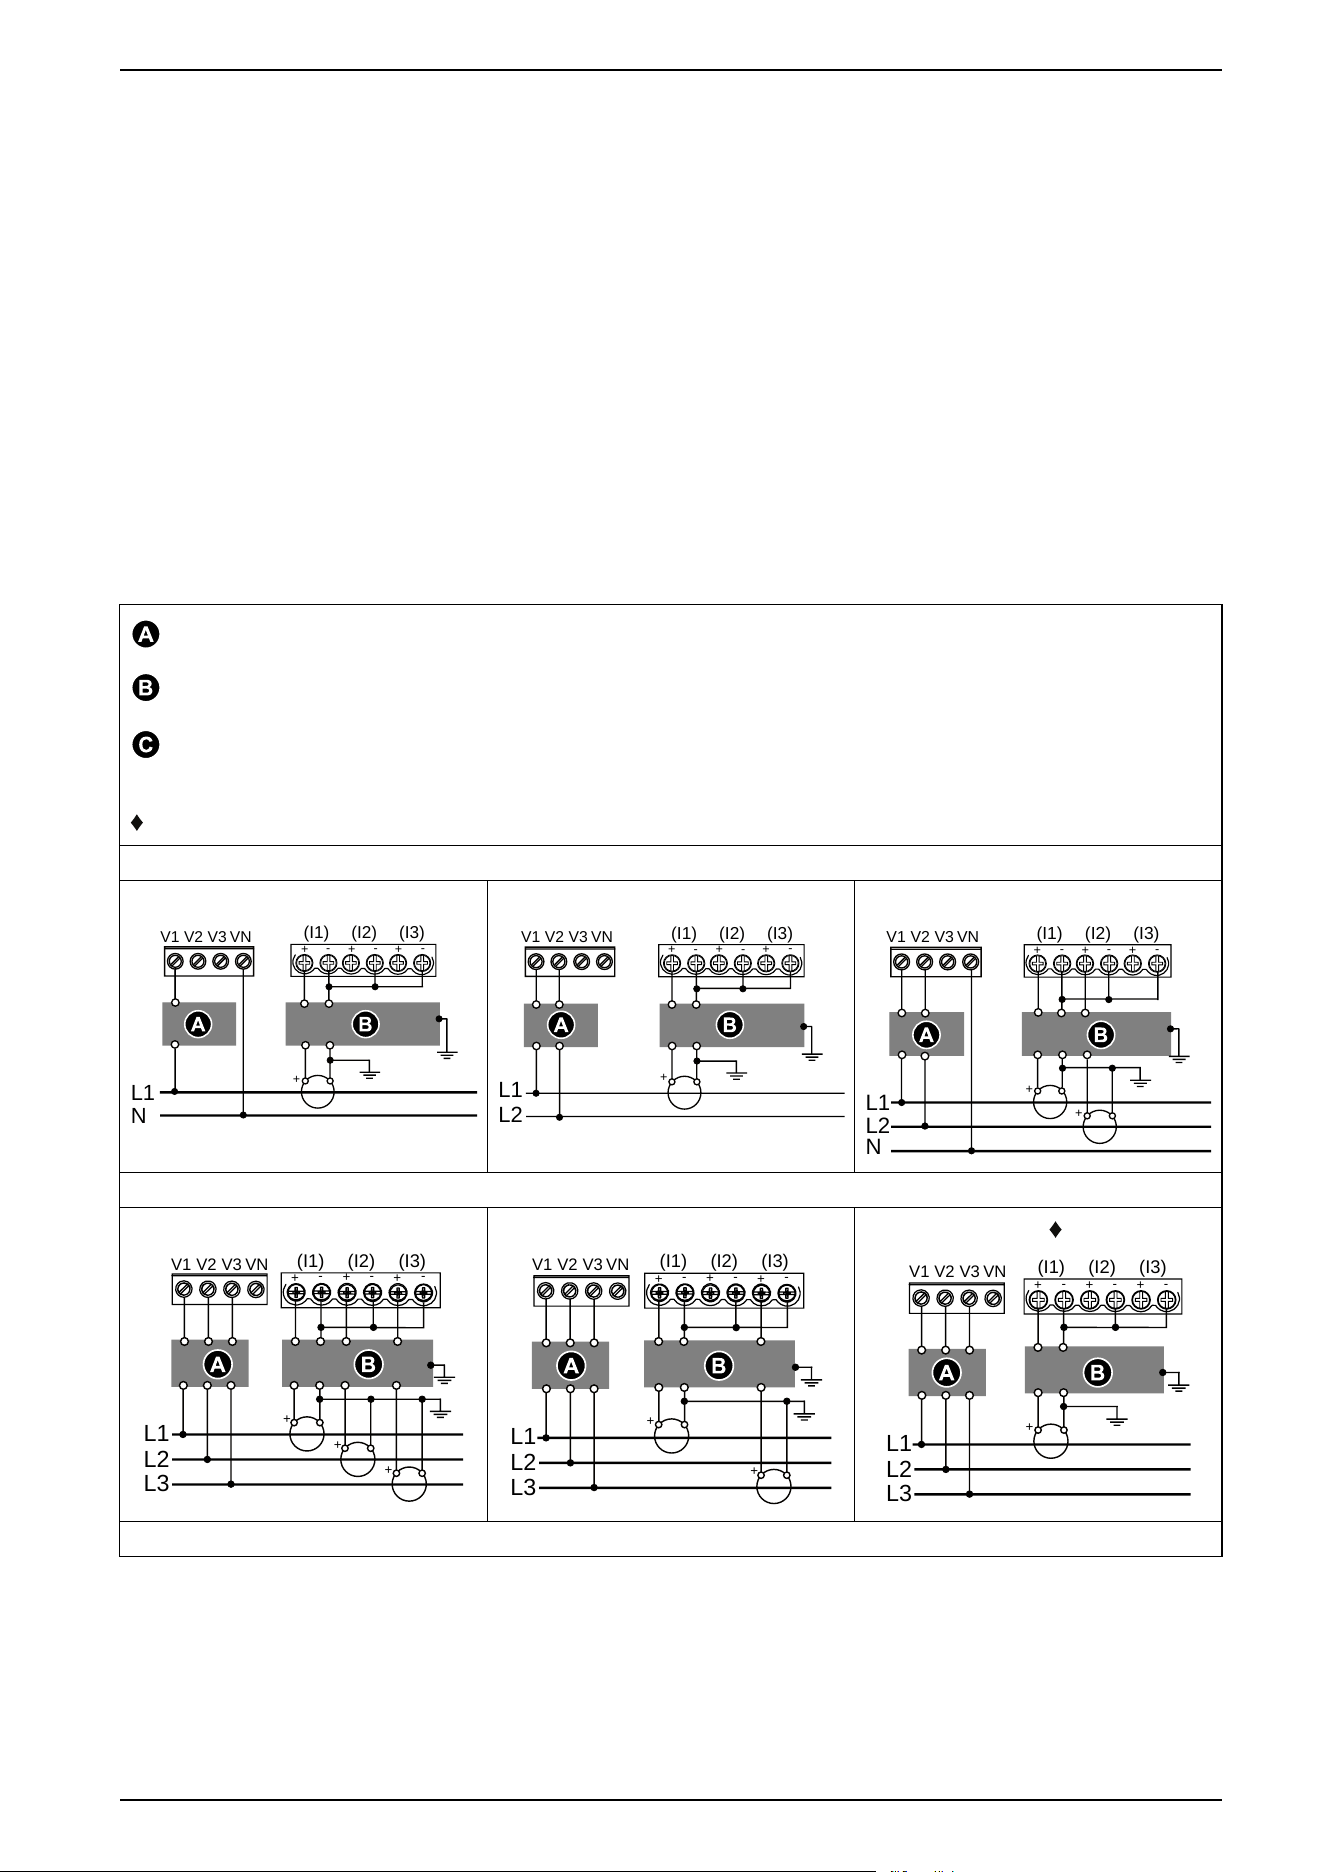
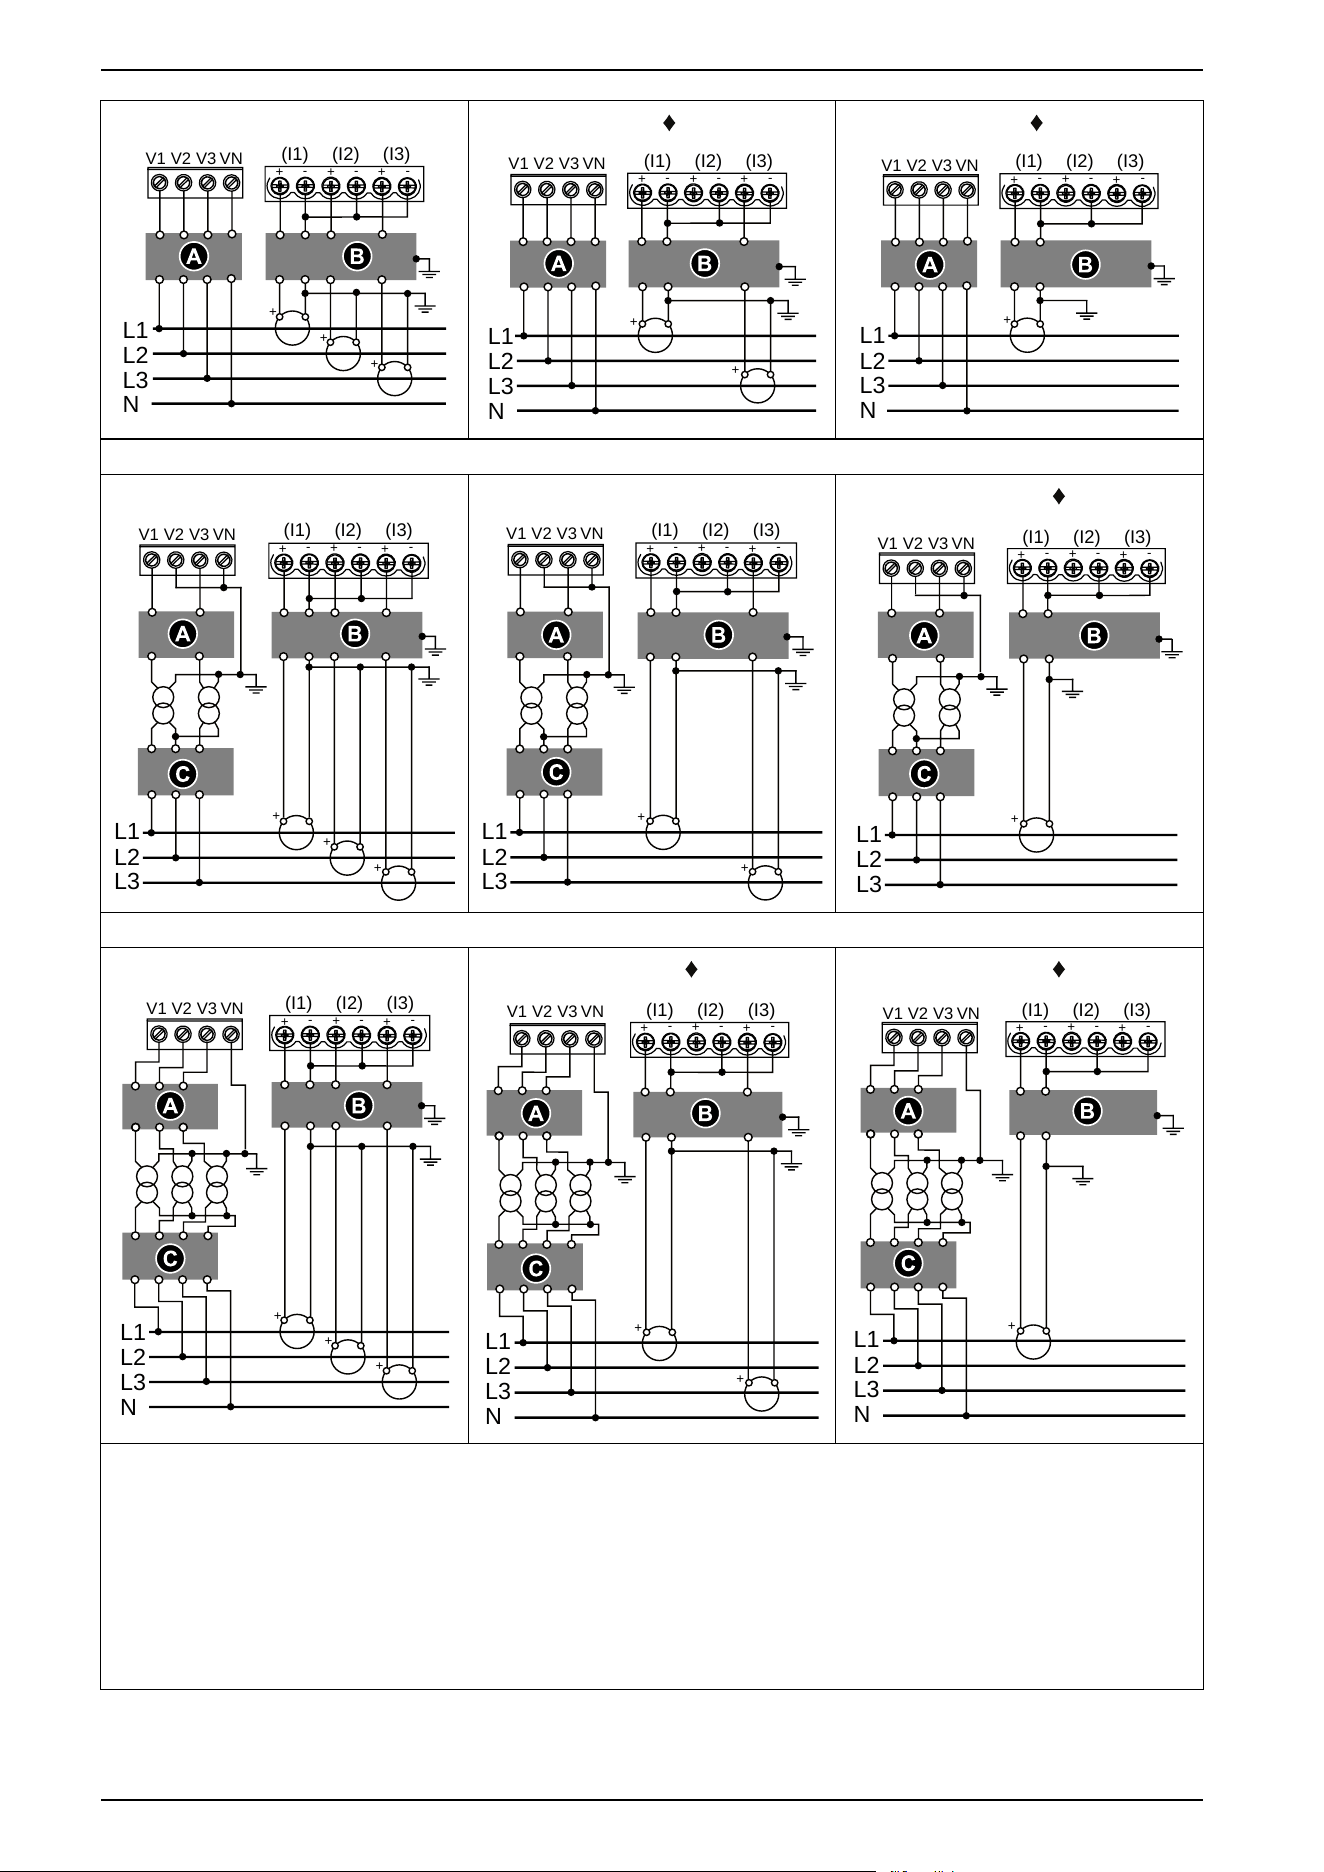
The following table lists the power system wiring configuration:
# 500 mA slow blow fuse or circuit breaker
# Shorting block
# PT primary slow blow fuses and disconnect switch
# Not supplied
indicates wiring for a balanced system
1PH
1PH2W LN
V1 V2 V3 VN
+
-
+
-
+
-
+
L1
N
(I1) (I3)(I2)
1PH2W LL
V1 V2 V3 VN
(I1)
+
+
-
+
-
+
-
(I3)(I2)
L1
L2
1PH3W LL-N
V1 V2 V3 VN
(I1) (I3)(I2)
L1
L2
N
+
-
+
-
+
-
+
+
3PH3W
3 CT
V1 V2 V3 VN
L1
L2
L3
+
-
+
-
+
-
(I1) (I3)(I2)
+
+
+
2 CT
V1 V2 V3 VN
+
-
+
-
+
-
(I1) (I3)(I2)
L1
L2
L3
+
+
1 CT
V1 V2 V3 VN
L1
L2
L3
+
(I1) (I3)(I2)
+
-
+
-
+
-
3PH4W
7EN02-0489-00 29
3. Hardware reference PowerLogic
™
Intuitive PM7100 / PM7200 / PM7300 series
3 CT
V1 V2 V3 VN
+
+
+
L1
L2
L3
N
+
-
+
-
+
-
(I1) (I3)(I2)
2 CT
V1 V2 V3 VN
L1
L2
L3
N
+
-
+
-
+
-
(I1) (I3)(I2)
+
+
1 CT
V1 V2 V3 VN
L1
L2
L3
N
+
+
-
+
-
+
-
(I1) (I3)(I2)
3PH3W
2 VT, 3 CT
V1 V2 V3 VN
L1
L2
L3
+
-
+
-
+
-
(I1) (I3)(I2)
+
+
+
2 VT, 2 CT
V1 V2 V3 VN
+
-
+
-
+
-
(I1) (I3)(I2)
L1
L2
L3
+
+
2 VT, 1 CT
V1 V2 V3 VN
L1
L2
L3
+
+
-
+
-
+
-
(I1) (I3)(I2)
3PH4W
3 VT, 3 CT
V1 V2 V3 VN
+
-
+
-
+
-
+
+
+
L1
L2
L3
N
(I1) (I3)(I2)
3 VT, 2 CT
V1 V2 V3 VN
+
-
+
-
+
-
(I1) (I3)(I2)
L1
L2
L3
N
+
+
3 VT, 1 CT
V1 V2 V3 VN
L1
L2
L3
N
+
+
-
+
-
+
-
(I1) (I3)(I2)
NOTE:
• Clearly label the device’s disconnect circuit mechanism and install it within easy reach of the operator.
• The slow blow fuses or circuit breakers must be:
◦ Installed in compliance with all local and national electrical codes and standards.
◦ Rated for the installation voltage, short-circuit or overcurrent and sized for connected loads.
• Slow blow fuse for neutral terminal is required if the source neutral is not grounded.
• Recommended wire: Copper wire with a compatible copper lug.
• Ground terminal is not available on meter, the shield should be connected to ground at the other end.
30 7EN02-0489-00
PowerLogic
™
Intuitive PM7100 / PM7200 / PM7300 series 3. Hardware reference
3.7.1.1 Direct connect voltage limits
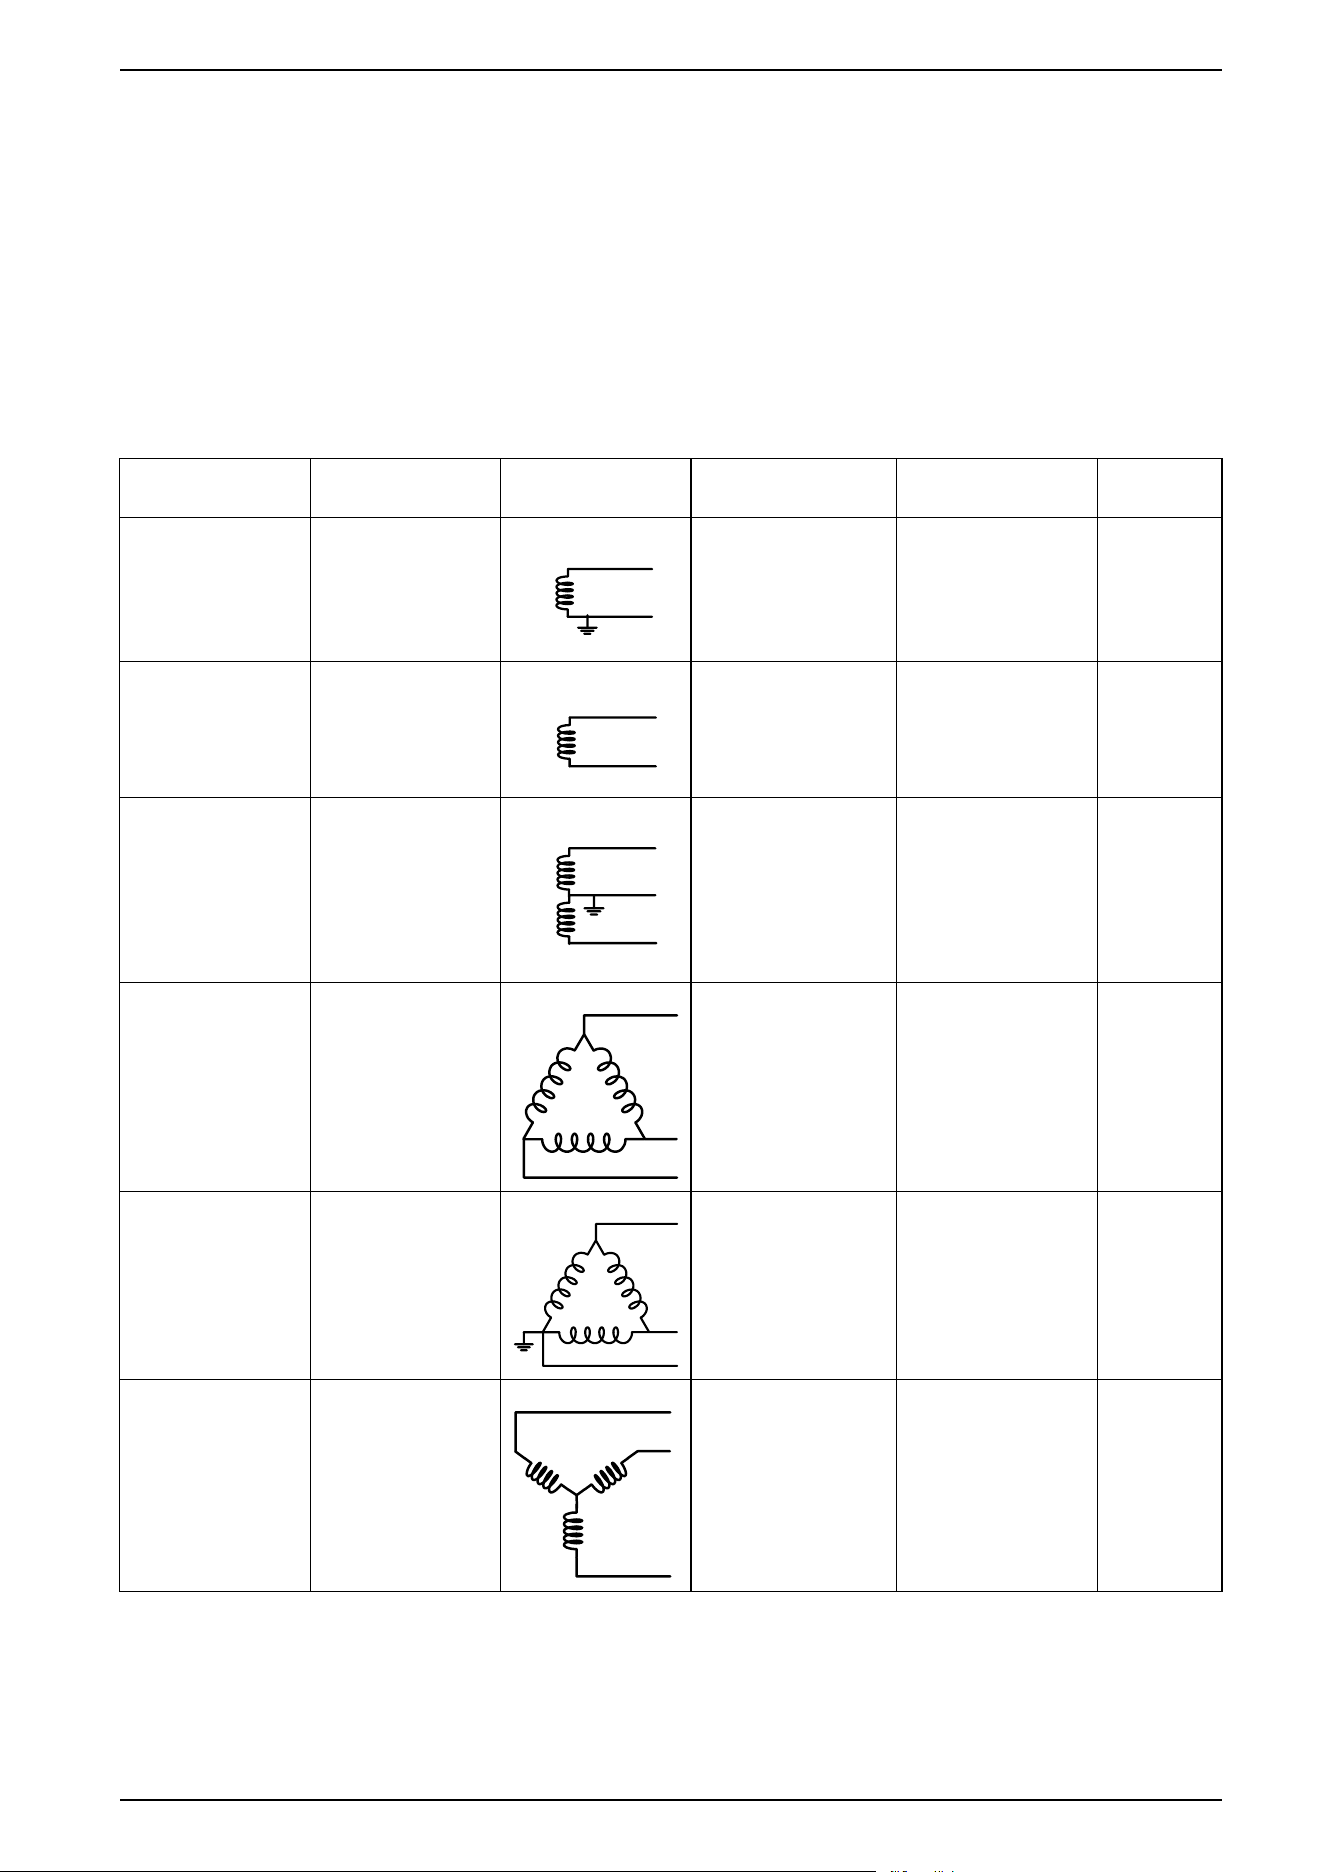
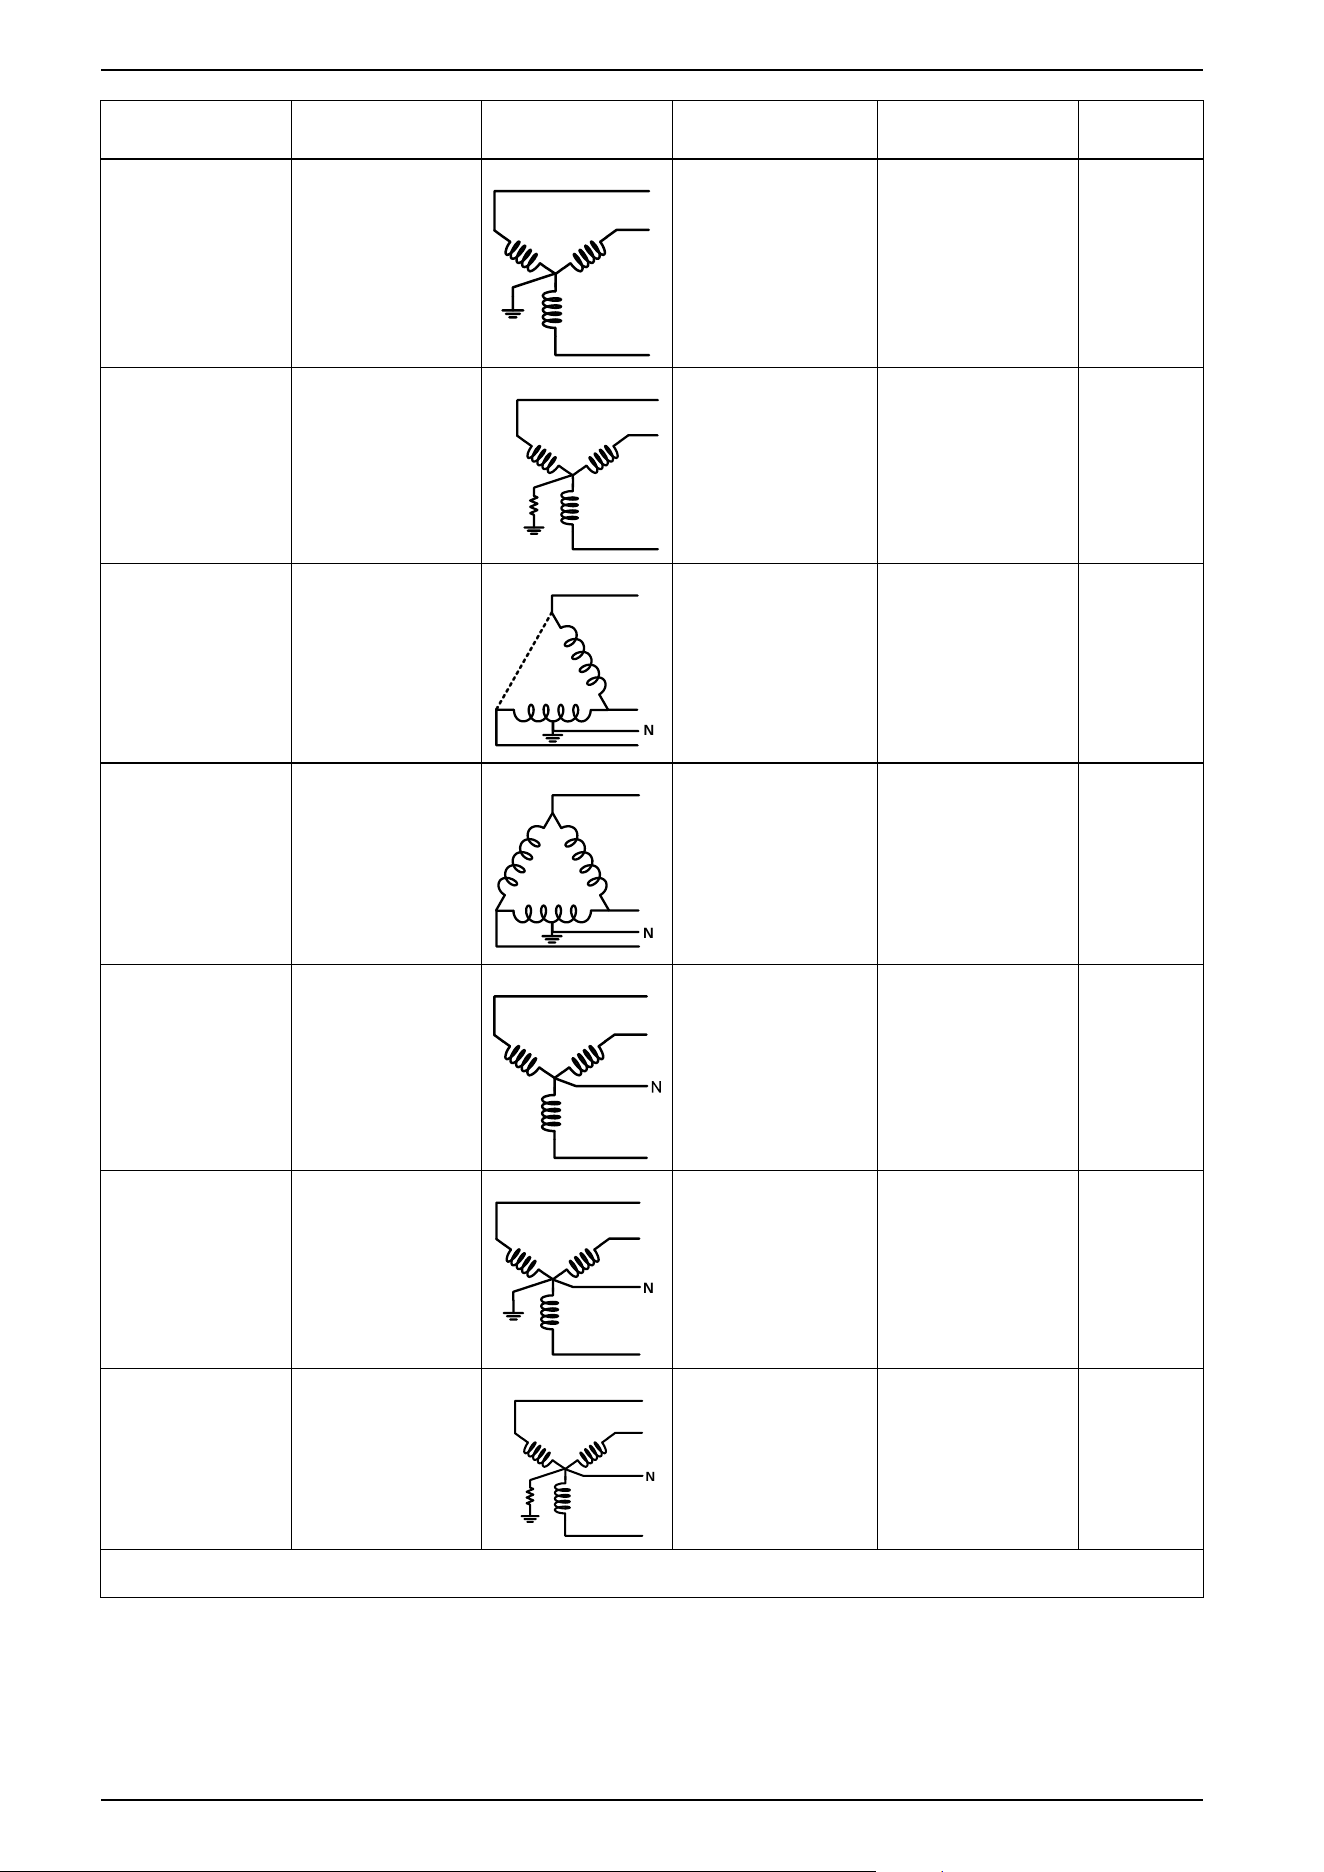
You can connect the meter’s voltage inputs directly to the phase voltage lines of
the power system if the power system’s line-to-line or line-to-neutral voltages do
not exceed the meter’s direct connect maximum voltage limits.
The meter's voltage measurement inputs are rated by the manufacturer for up to
400 V L-N/690 V L-L. However, the maximum voltage allowed for direct
connection may be lower, depending on the local electrical codes and regulations.
In US and Canada, the maximum voltage on the meter voltage measurement
inputs may not exceed 347 V L-N/600 V L-L.
If your system voltage is greater than the specified direct connect maximum
voltage, you must use VTs (voltage transformers) to step down the voltages.
Power system
description
Meter setting Symbol
Direct connect
maximum (UL)
Direct connect
maximum (IEC)
# of VTs (if
required)
Single-phase 2-wire
line-to-neutral
1PH2W LN
347 V L-N 400 V L-N 1 VT
Single-phase 2-wire
line-to-line
1PH2W LL
600 V L-L 600 V L-L 1 VT
Single-phase 3-wire
line-to-line with
neutral
1PH3W LL with N
347 V L-N/600 V L-L 400 V L-N/690 V L-L 2 VT
3-phase 3-wire Delta
ungrounded
3PH3W Dlt Ungnd
600 V L-L 600 V L-L 2 VT
3-phase 3-wire Delta
corner grounded
3PH3W Dlt Crnr Gnd
600 V L-L 600 V L-L 2 VT
3-phase 3-wire Wye
ungrounded
3PH3W Wye Ungnd
600 V L-L 600 V L-L 2 VT
7EN02-0489-00 31
3. Hardware reference PowerLogic
™
Intuitive PM7100 / PM7200 / PM7300 series
Power system
description
Meter setting Symbol
Direct connect
maximum (UL)
Direct connect
maximum (IEC)
# of VTs (if
required)
3-phase 3-wire Wye
grounded
3PH3W Wye Gnd
600 V L-L 690 V L-L 2 VT
3-phase 3-wire Wye
resistance-grounded
with insulation
monitoring *
3PH3W Wye Res
Gnd
600 V L-L 690 V L-L 2 VT
3-phase 4-wire open
Delta center-tapped
3PH4W Opn Dlt Ctr
Tp
N
600 V L-L 690 V L-L 3 VT
3-phase 4-wire Delta
center-tapped
3PH4W Dlt Ctr Tp
N
600 V L-L 690 V L-L 3 VT
3-phase 4-wire
ungrounded Wye
3PH4W Wye Ungnd
347 V L-N/600 V L-L 347 V L-N/600 V L-L 3 VT or 2 VT
3-phase 4-wire
grounded Wye
3PH4W Wye Gnd
N
347 V L-N/600 V L-L 400 V L-N/690 V L-L 3 VT or 2 VT
3-phase 4-wire
resistance-grounded
Wye with insulation
monitoring *
3PH4W Wye Res
Gnd
N
347 V L-N/600 V L-L 400 V L-N/690 V L-L 3 VT or 2 VT
NOTE: * When insulation is monitored, neutral of these systems is considered to be earthed.
32 7EN02-0489-00
PowerLogic
™
Intuitive PM7100 / PM7200 / PM7300 series 3. Hardware reference
3.7.1.2 Balanced system considerations
In situations where you are monitoring a balanced 3-phase load, you may choose
to connect only one or two CTs on the phases you want to measure, and then
configure the meter so it calculates the current on the unconnected current inputs.
NOTE: For a balanced 4-wire Wye system, the meter’s calculations assume
that there is no current flowing through the neutral conductor.
Balanced 3-phase Wye system with two CTs
The current for the unconnected current input is calculated so that the vector sum
for all three phases equal zero.
Balanced 3-phase Wye or Delta system with one CT
The currents for the unconnected current inputs are calculated so that their
magnitude and phase angle are identical and equally distributed, and the vector
sum for all three phase currents equal zero.
NOTE: You must always use 3 CTs for 3-phase 4-wire center-tapped Delta or
center-tapped open Delta systems.
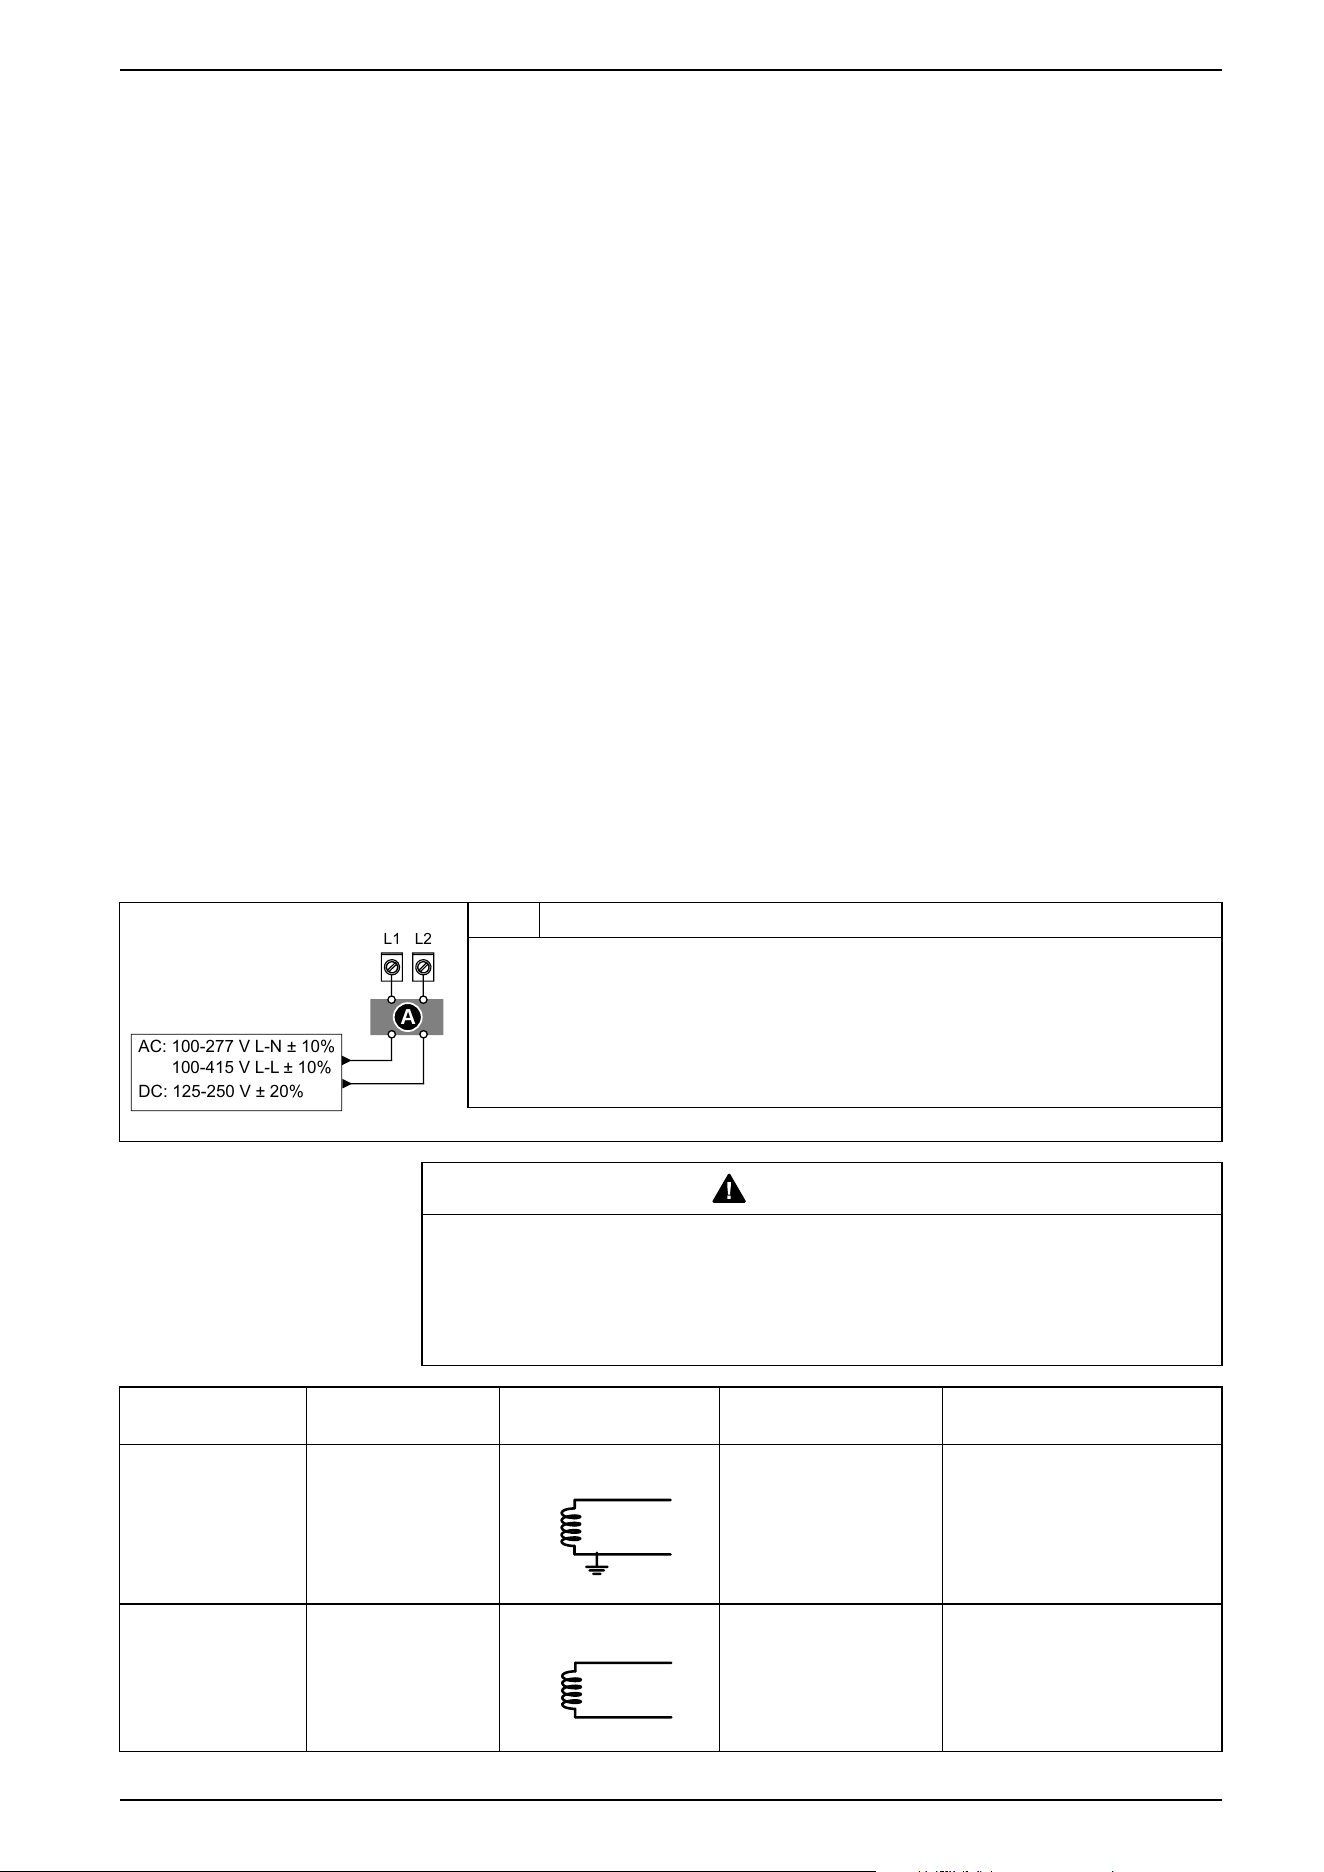
3.7.2 Control power (auxiliary power)
Wiring configuration
The following table lists the control power (auxiliary power) wiring configuration:
A
L2L1
AC: 100-277 V L-N ± 10%
100-415 V L-L ± 10%
DC: 125-250 V ± 20%
A 500 mA slow blow fuse
L1 and L2 are non-polarized. If using an AC power supply with a neutral, connect the neutral
to the meter’s L2 terminal.
Always use a slow blow fuse on L1. Use a slow blow fuse on L2 when connecting an
ungrounded neutral to the control power. If using a control power transformer, install a slow
blow fuse on the primary and secondary sides of the transformer. The slow blow fuses or
circuit breakers must be rated for the installation voltage and sized for the short-circuit or
overcurrent.
CAUTION
RISK OF INJURY OR EQUIPMENT DAMAGE
Do not exceed the maximum voltage rating of the device.
Failure to follow these instructions can result in injury or equipment
damage.
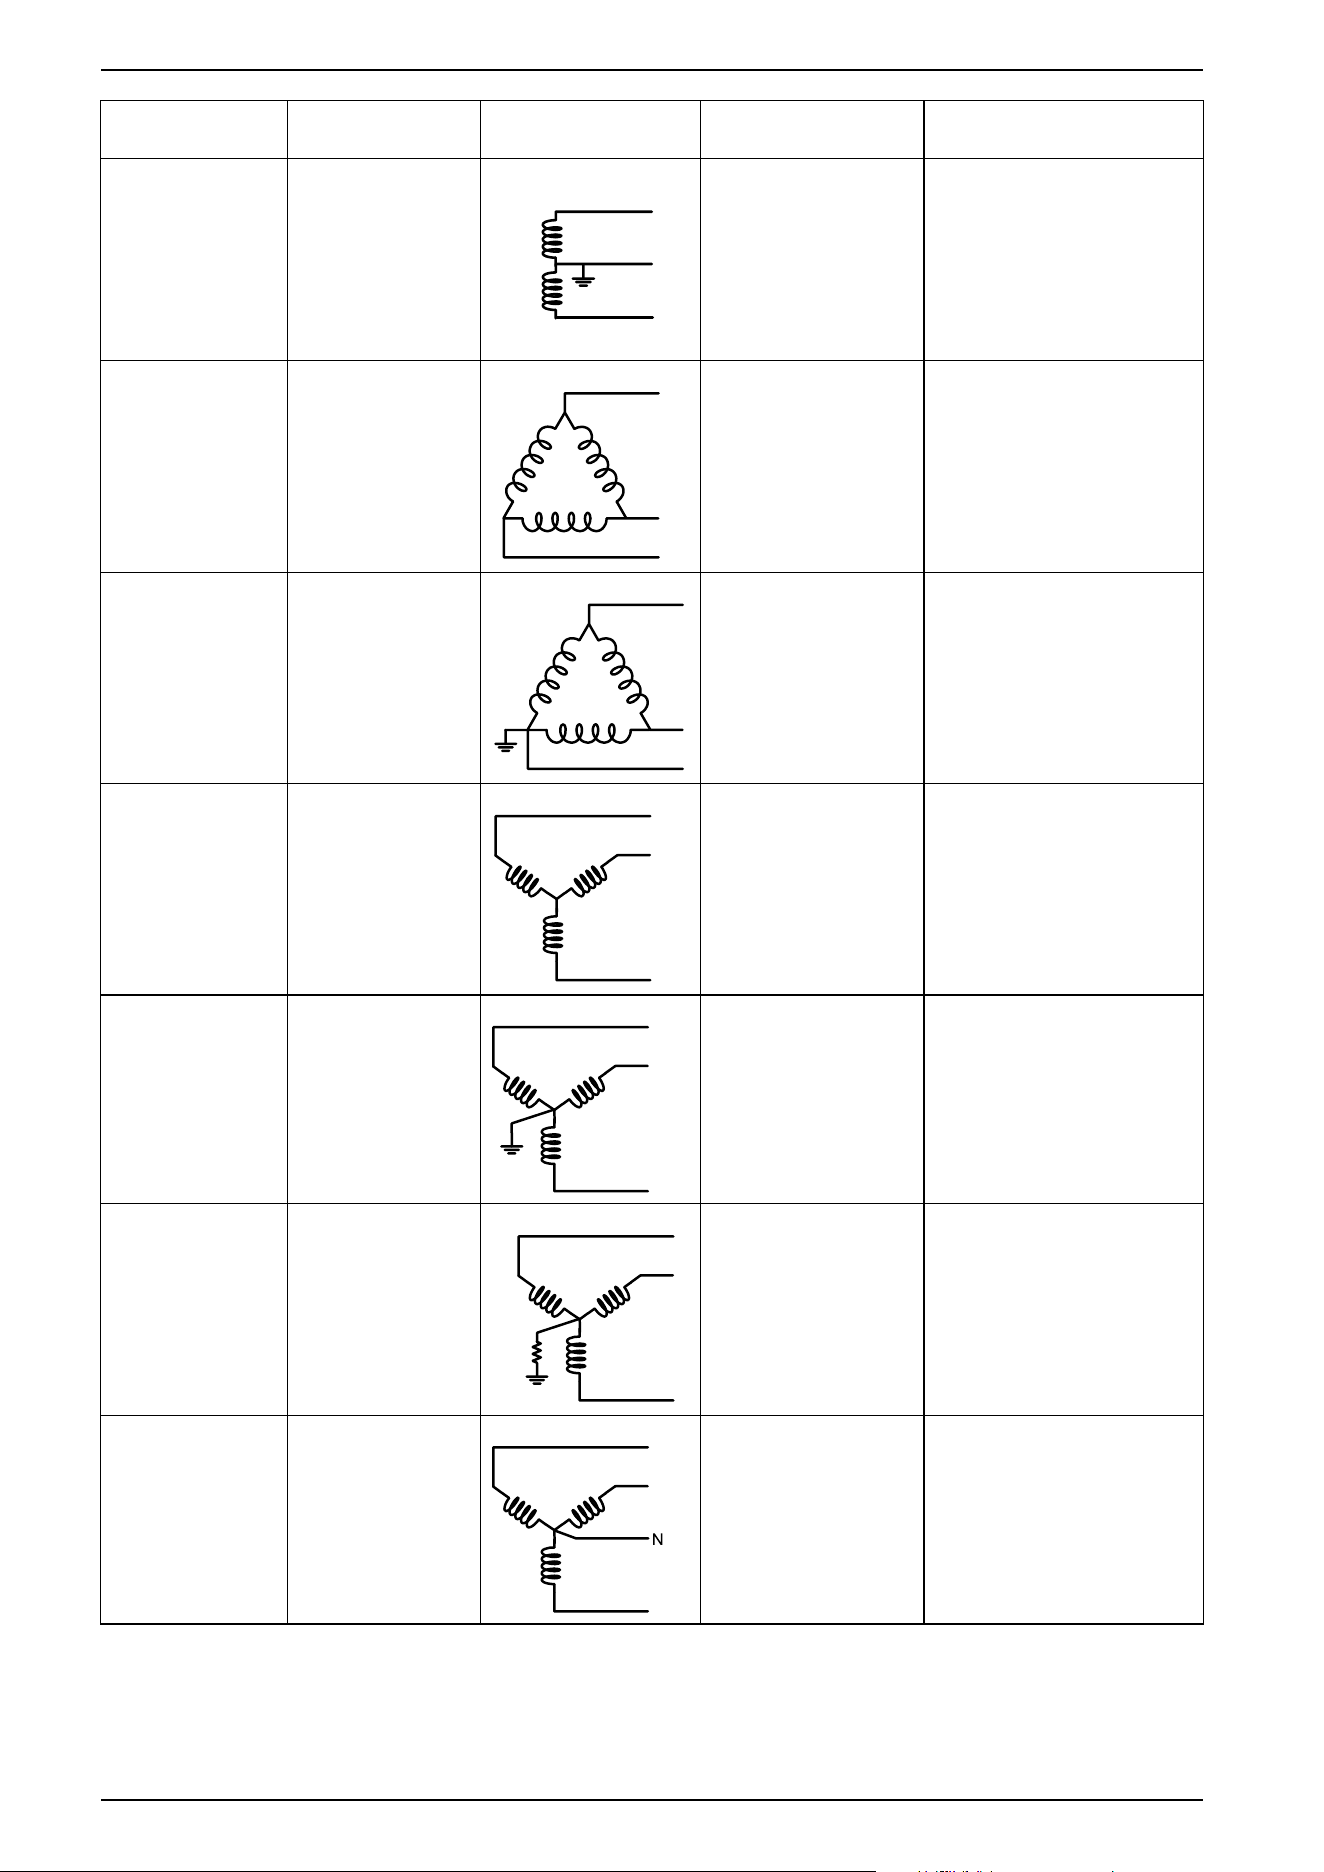
Power system
description
Meter setting Symbol Connection description Nominal voltage
Single-phase 2-wire
line-to-neutral
1PH2W LN
Connect L1 and L2
between phase and
neutral.
277 V L-N + 10%
Single-phase 2-wire
line-to-line
1PH2W LL
Connect L1 and L2
between the phases.
277 V L-L
7EN02-0489-00 33
3. Hardware reference PowerLogic
™
Intuitive PM7100 / PM7200 / PM7300 series
Power system
description
Meter setting Symbol Connection description Nominal voltage
Single-phase 3-wire
line-to-line with
neutral
1PH3W LL with N
Connect L1 and L2
between any two phases
or from any phase to
neutral.
277 V L-N + 10% /
415 V L-L + 10%
3-phase 3-wire Delta
ungrounded
3PH3W Dlt Ungnd
Connect L1 and L2
between any two phases.
277 V L-L
3-phase 3-wire Delta
corner grounded
3PH3W Dlt Crnr Gnd
Connect L1 and L2
between any two phases.
277 V L-L
3-phase 3-wire Wye
ungrounded
3PH3W Wye Ungnd
Connect L1 and L2
between any two phases.
277 V L-L
3-phase 3-wire Wye
grounded
3PH3W Wye Gnd
Connect L1 and L2
between any two phases.
415 V L-L + 10%
3-phase 3-wire Wye
resistance-grounded
with insulation
monitoring *
3PH3W Wye Res
Gnd
Connect L1 and L2
between any two phases.
415 V L-L + 10%
3-phase 4-wire
ungrounded Wye
3PH4W Wye Ungnd
Connect L1 and L2
between any two phases.
277 V L-L
34 7EN02-0489-00
PowerLogic
™
Intuitive PM7100 / PM7200 / PM7300 series 3. Hardware reference
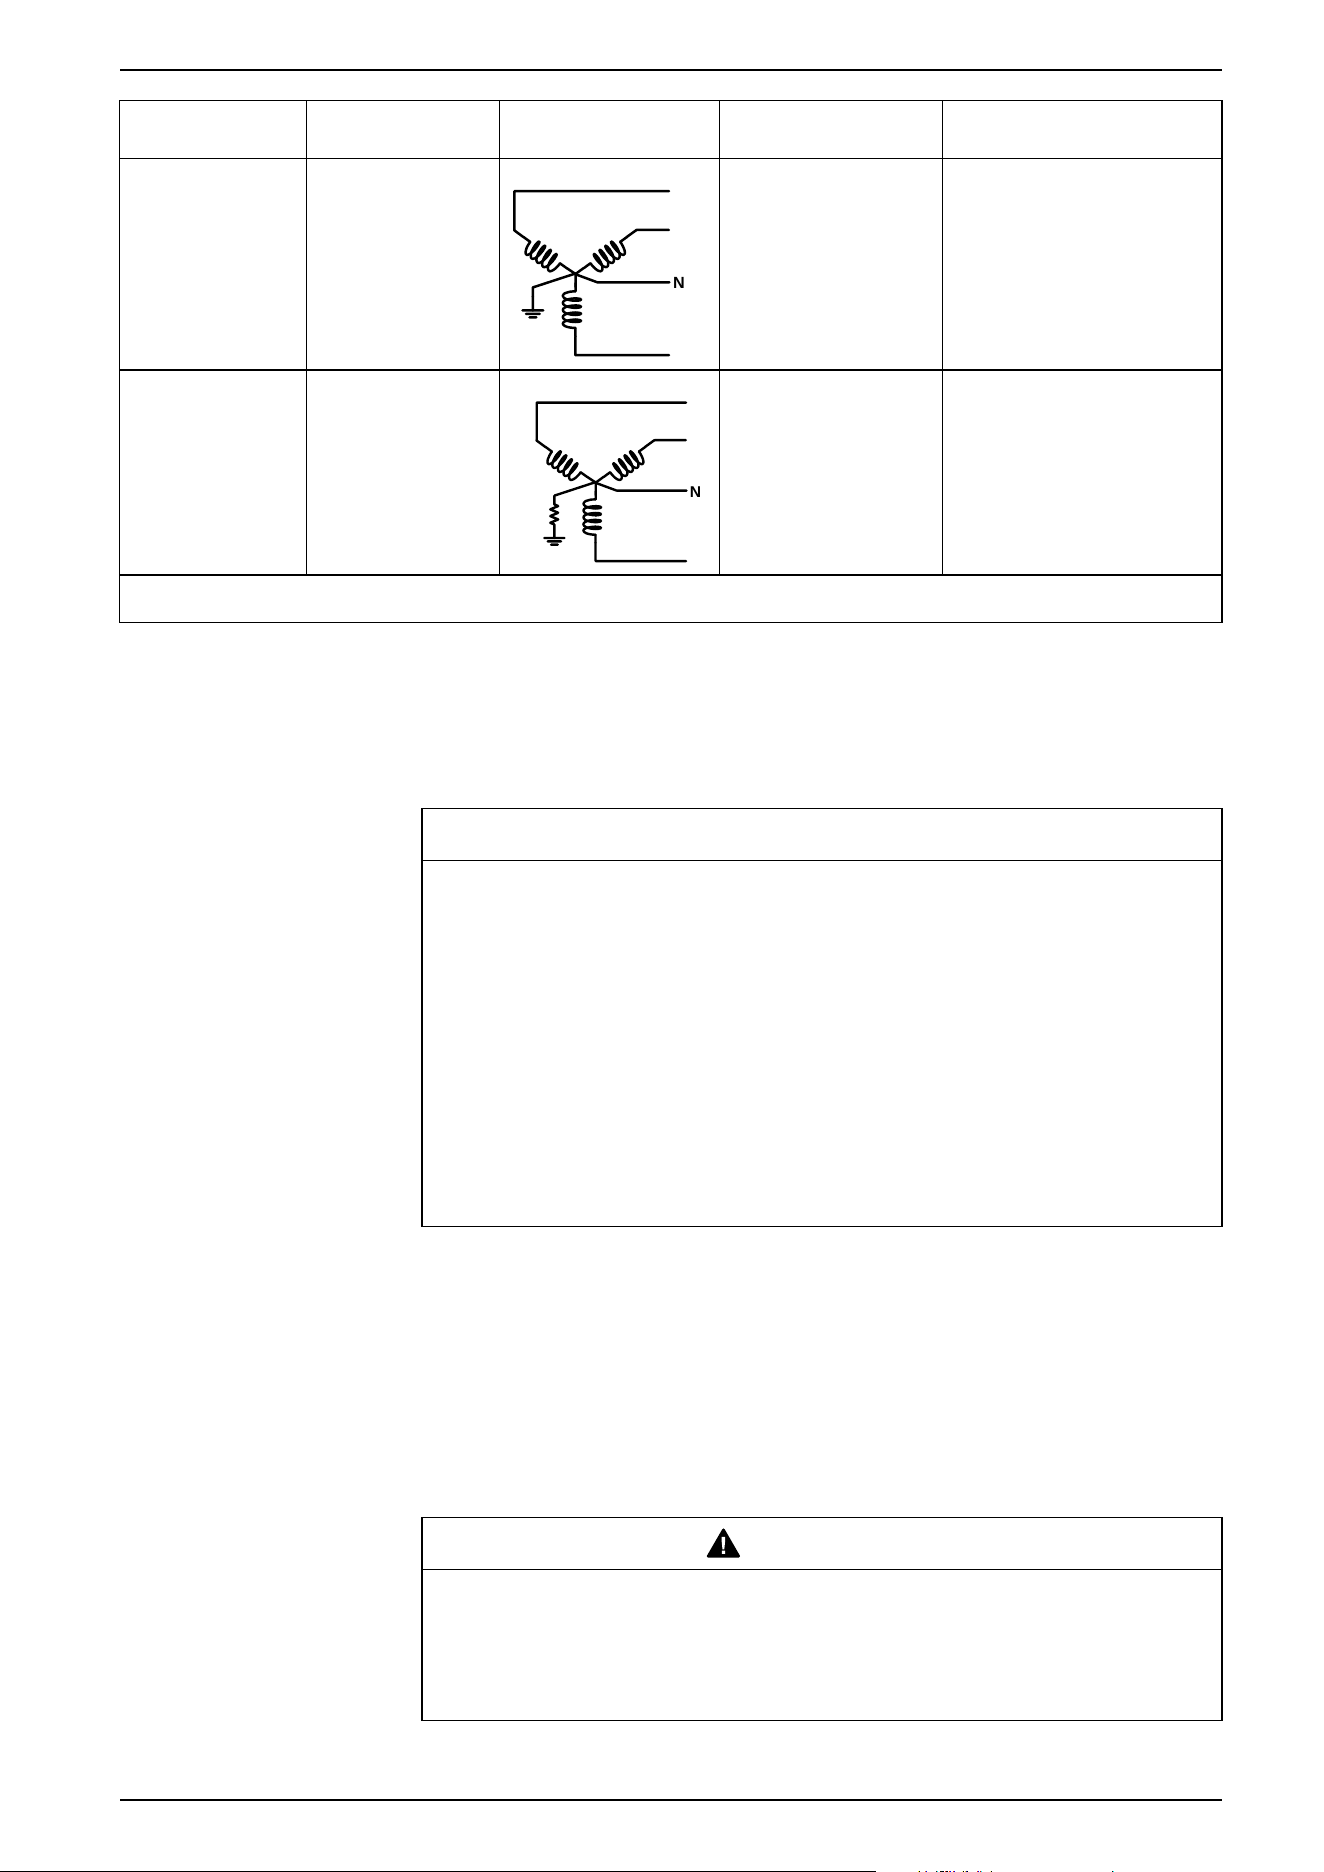
Power system
description
Meter setting Symbol Connection description Nominal voltage
3-phase 4-wire
grounded Wye
3PH4W Wye Gnd
N
Connect L1 and L2
between any two phases.
277 V L-N /
415 V L-L + 10%
3-phase 4-wire
resistance-grounded
Wye with insulation
monitoring *
3PH4W Wye Res
Gnd
N
Connect L1 and L2
between any two phases.
277 V L-N /
415 V L-L + 10%
NOTE: * When insulation is monitored, neutral of these systems is considered to be earthed.
MID/MIR control power (auxiliary power) requirements
Follow the MID/MIR control power (auxiliary power) requirements to help ensure
uninterrupted and incorrect meter operation.
NOTICE
UNINTENDED EQUIPMENT OPERATION
• Connect the auxiliary power supply of the meter to the supply (utility) side of
the measured circuit.
• Connect the auxiliary power supply in a way that ensures uninterrupted
meter operation if one or two phases of the measured circuit become de-
energized.
• Use an auxiliary power source, such as a DC station battery or UPS, to
provide a power source independent of the measured circuit.
• Use an external 3-phase power supply device as an auxiliary power source if
it is energized from all three phases on the supply (utility) side of the
measured circuit.
Failure to follow these instructions can result in incorrect meter operation.
3.7.3 Input, output and communications wiring
3.7.3.1 Relay outputs
Relay outputs can be configured to be used in switching applications, for example,
to provide on/off control signals for switching capacitor banks, generators, and
other external devices and equipment.
WARNING
RISK OF INJURY OR EQUIPMENT DAMAGE
Always apply the same power type (AC or DC) to both the relay outputs.
Failure to follow these instructions can result in death, serious injury, or
equipment damage.
7EN02-0489-00 35
3. Hardware reference PowerLogic
™
Intuitive PM7100 / PM7200 / PM7300 series
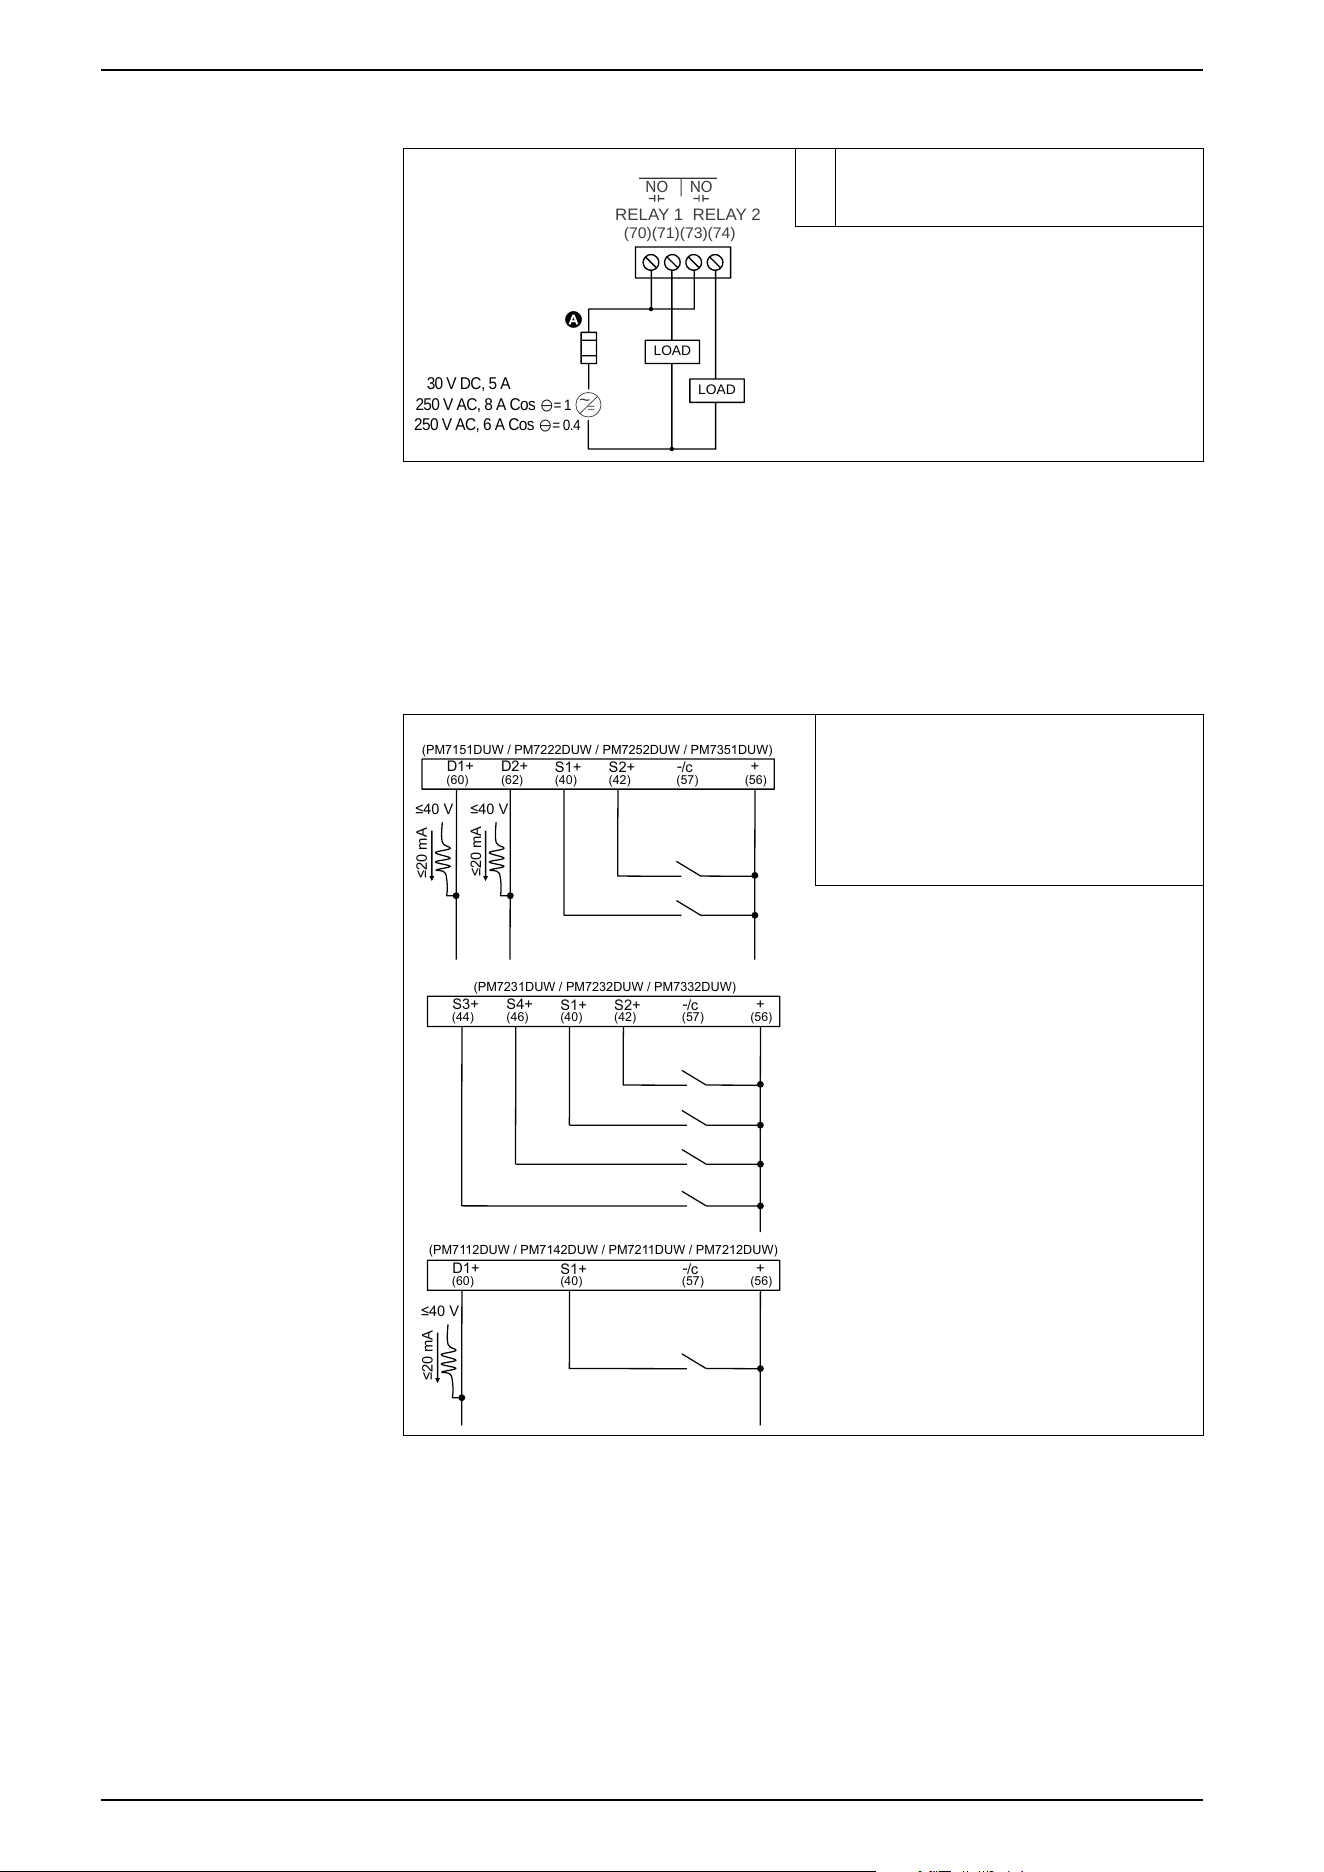
The following table lists the relay output configuration:
LOAD
LOAD
RELAY 1 RELAY 2
(70)(71)(73)(74)
NO NO
30 V DC, 5 A
250 V AC, 8 A Cos
y= 1
250 V AC, 6 A Cos
y= 0.4
~
=
A
The over current protection device must be
rated for the short-circuit current at the
connection point.
3.7.3.2 Digital inputs/digital outputs
The digital inputs are typically used for monitoring the status of external contacts
or circuit breakers. The digital outputs are typically used in switching and demand
synchronization applications.
The following table lists the digital input and digital output configuration:
D1+ D2+
S1+ S2+
-
/c
+
≤40 V
≤20 mA
≤40 V
≤20 mA
(60) (62) (40) (42) (57) (56)
S3+ S4+
S1+ S2+
-
/c
+
(44) (46) (40) (42) (57) (56)
D1+
S1+
-
/c
+
(60) (40) (57) (56)
≤40 V
≤20 mA
(PM7151DUW / PM7222DUW / PM7252DUW / PM7351DUW)
(PM7231DUW / PM7232DUW / PM7332DUW)
(PM7112DUW / PM7142DUW / PM7211DUW / PM7212DUW)
Digital input wiring shown for internal voltage
source.
Wetting voltage should not be used as a power
source for other devices.
-/c is common for digital outputs, digital inputs,
and wetting voltage.
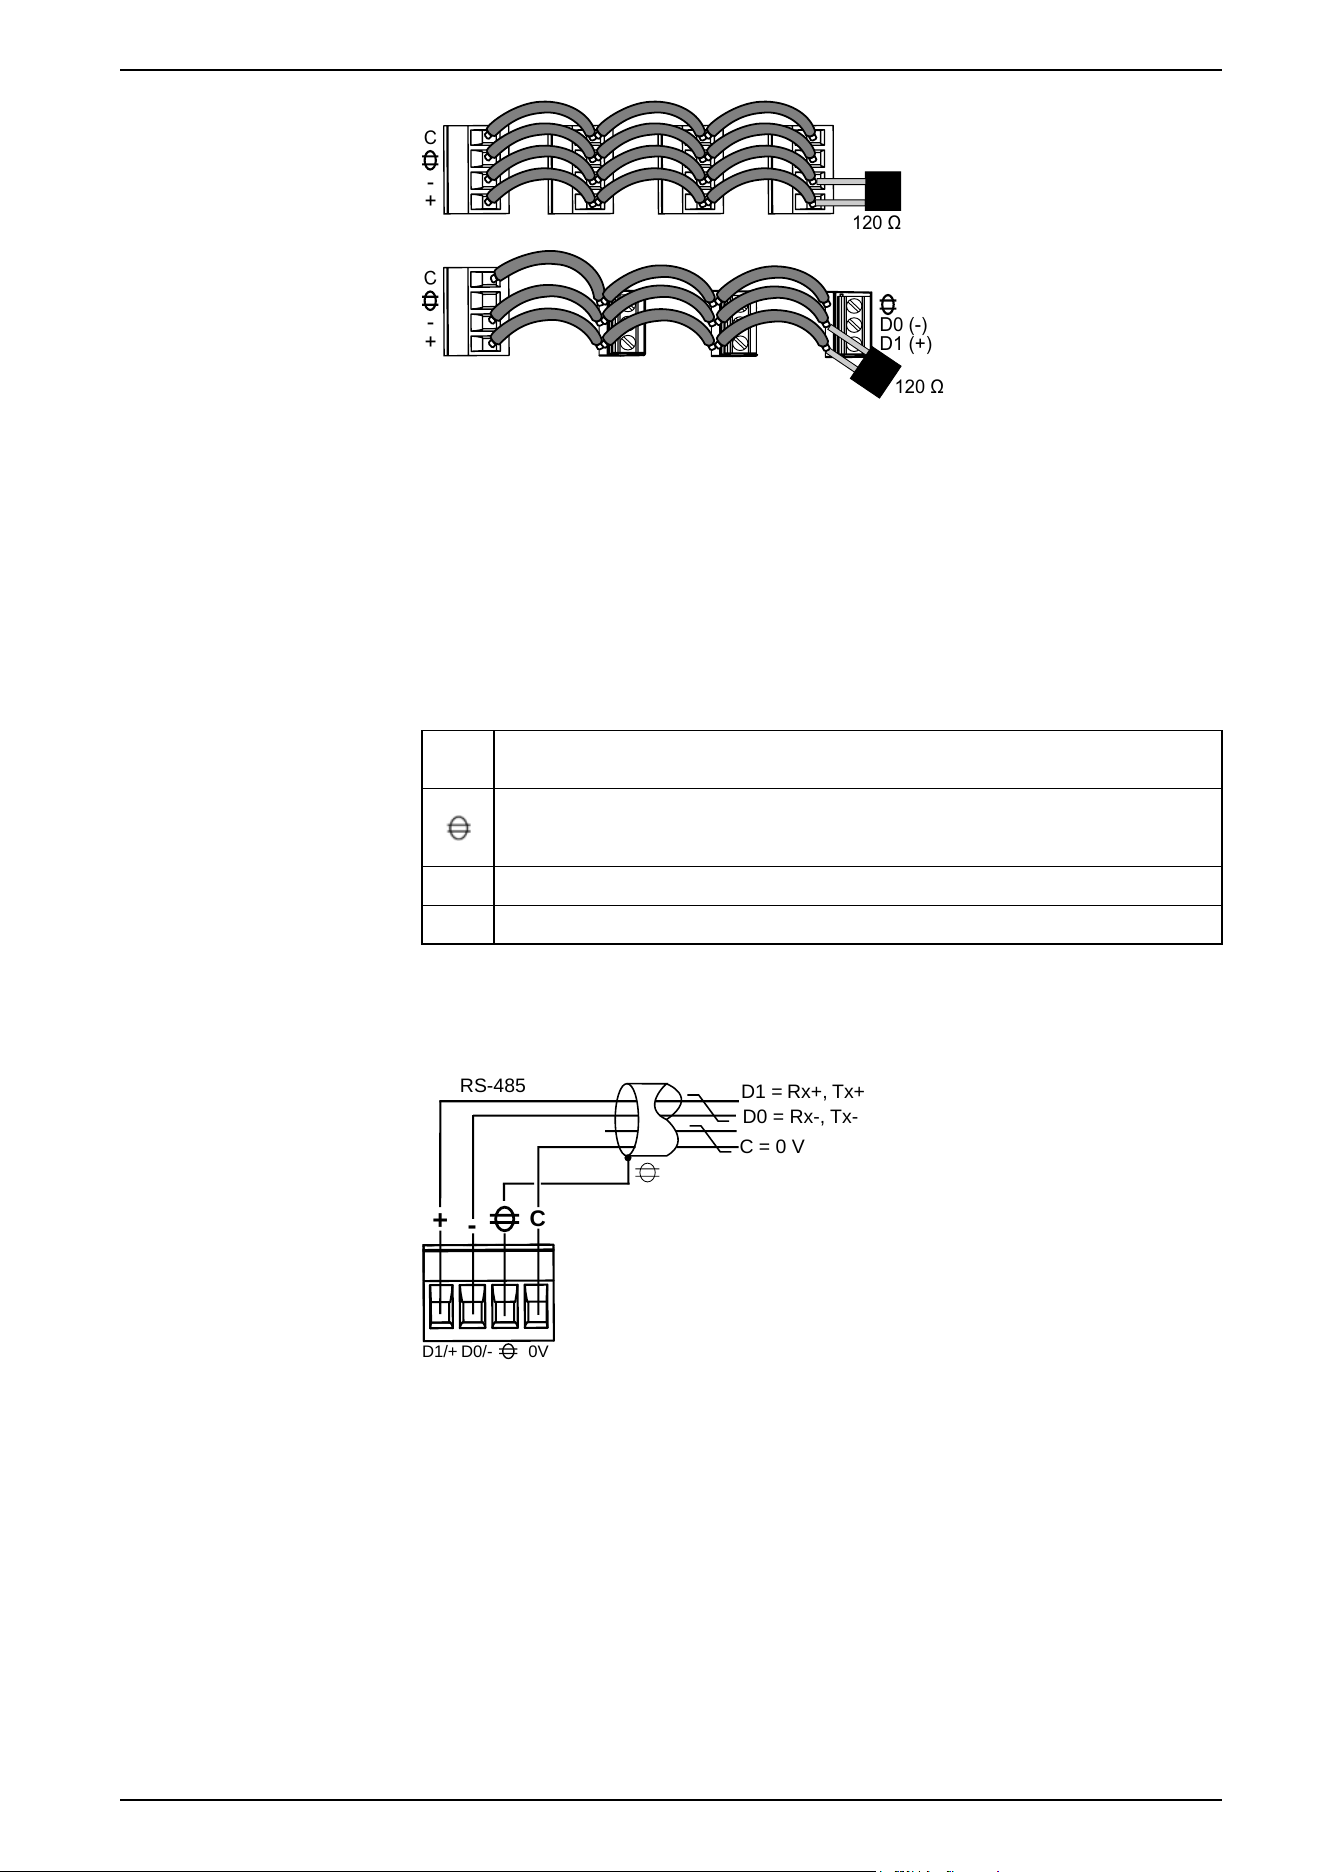
3.7.3.3 RS-485 wiring
Connect the devices on the RS-485 bus in a point-to-point configuration, with the
(+) and (-) terminals from one device connected to the corresponding (+) and (-)
terminals on the next device.
36 7EN02-0489-00
PowerLogic
™
Intuitive PM7100 / PM7200 / PM7300 series 3. Hardware reference
+
-
C
+
-
C
120 Ω
D1 (+)
D0 (-)
120 Ω
RS-485 cable
Use a shielded 2 twisted pair or 1.5 twisted pair RS-485 cable to wire the devices.
Use one twisted pair to connect the (+) and (-) terminals and use the other
insulated wire to connect the C terminals.
The total distance for devices connected on an RS-485 bus should not exceed
1200 m (4000 ft).
RS-485 terminals
C
Common. This provides the voltage reference (zero volts) for the data plus and data minus
signals
Shield. Connect the bare wire to this terminal to help suppress signal noise that may be
present. Ground the shield wiring at one end only (either at the client or the last server
device, but not both).
-
Data minus. This transmits/receives the inverting data signals.
+
Data plus. This transmits/receives the non-inverting data signals.
NOTE: If some devices in your RS-485 network do not have the Common
terminal, use the bare wire in the RS-485 cable to connect the Common
terminal from the meter to the shield terminal on the devices that do not have
the Common terminal.
C
+
-
D1 = Rx+, Tx+
D0 = Rx-, Tx-
C = 0 V
RS-485
D1/+
D0/- 0V
3.7.3.4 Ethernet communication connection
Use a shielded RJ-45 (10/100Base-TX) Ethernet cable to connect the meter’s
Ethernet port.
Your Ethernet connection source should be installed in a location that minimizes
the overall Ethernet cable routing length.
7EN02-0489-00 37
3. Hardware reference PowerLogic
™
Intuitive PM7100 / PM7200 / PM7300 series
4. Display
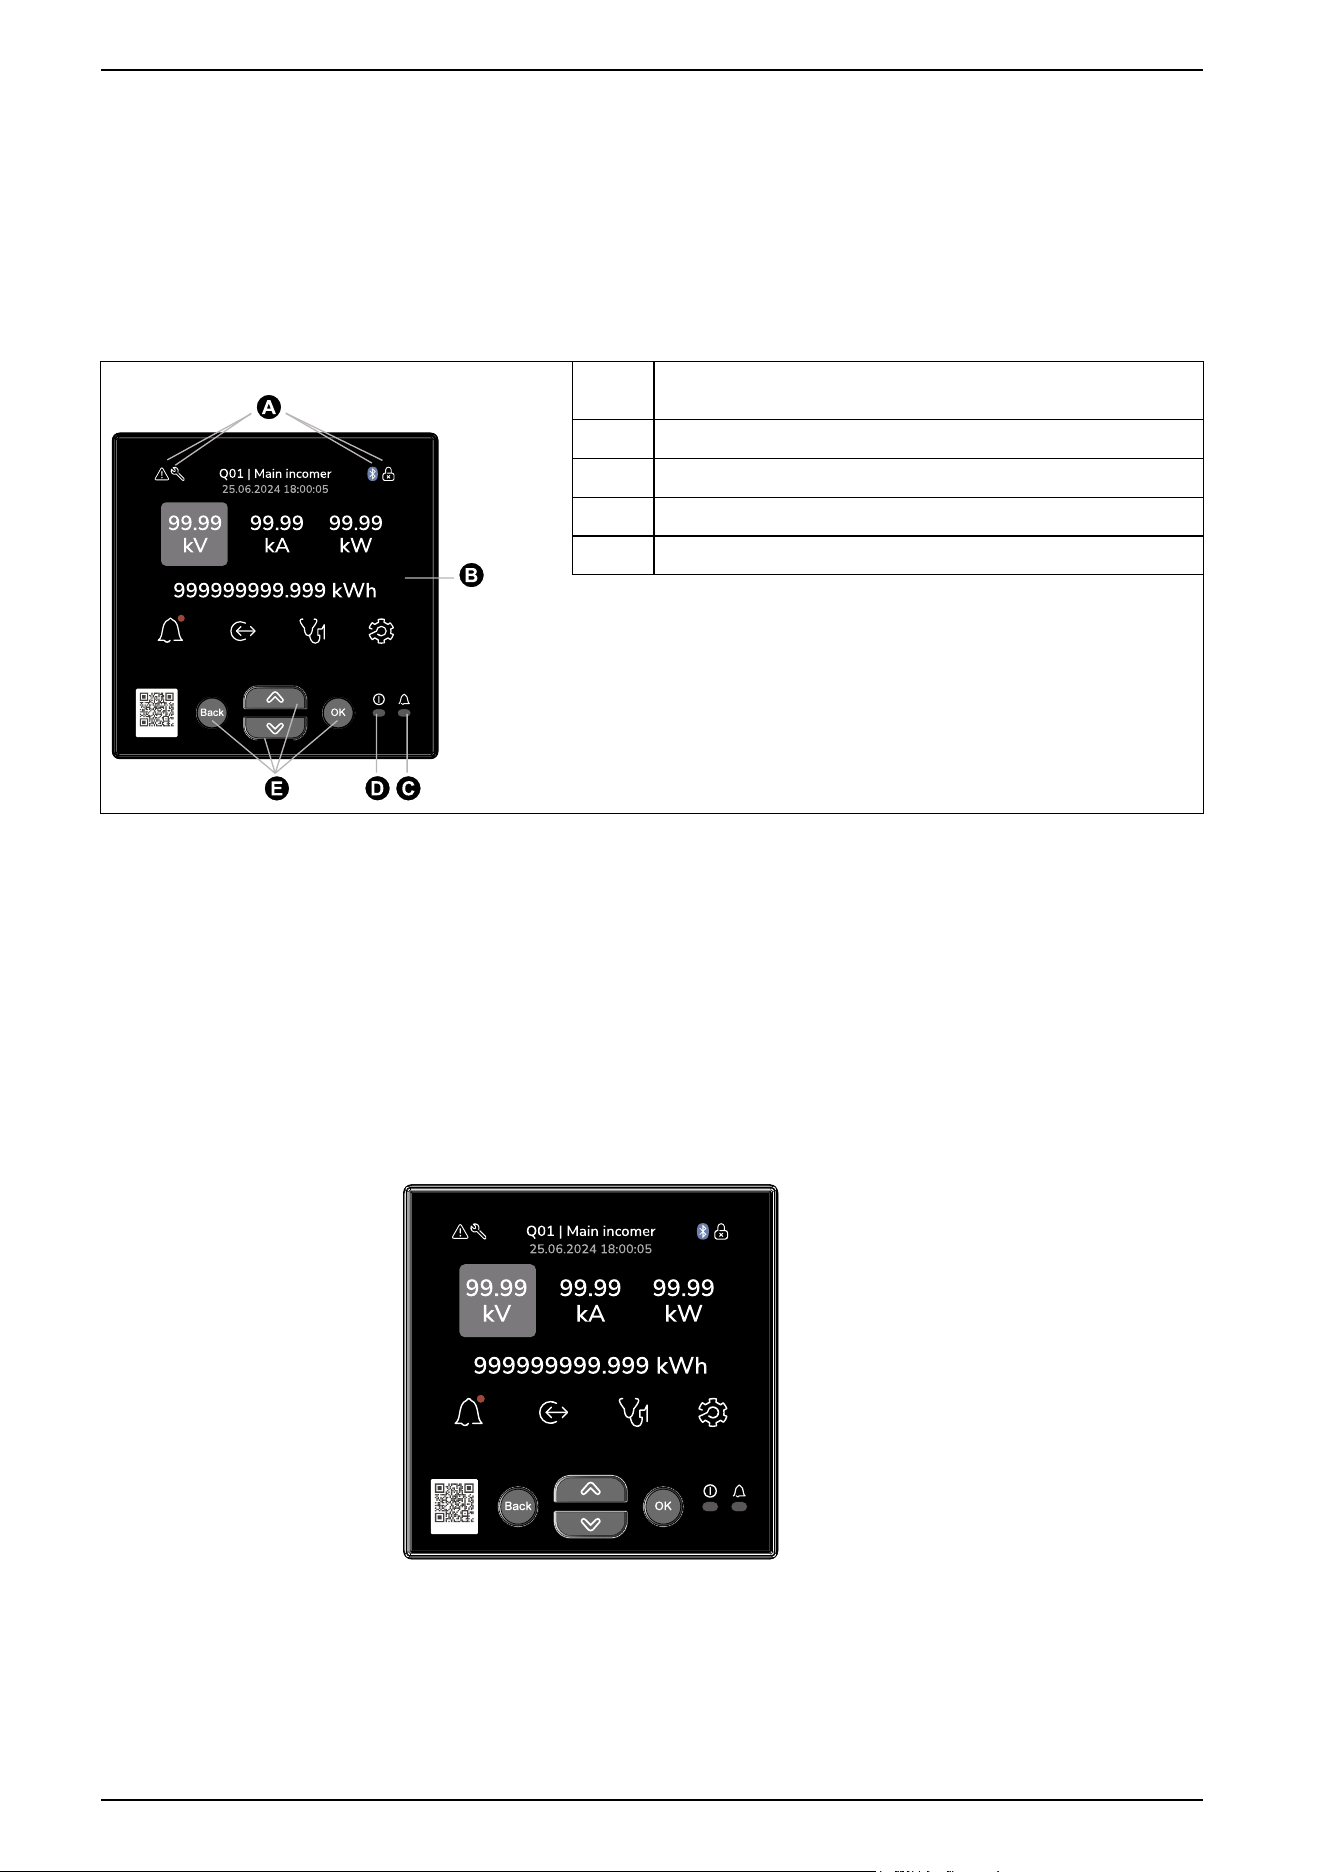
4.1 Display overview
The display with the navigation buttons on the meter allows you to perform various
tasks such as setting up the meter, displaying data screens, acknowledging
alarms, or performing resets.
A
Alarm, maintenance, power interruption, Bluetooth connection,
firmware upgrade, and lock notification area
B
Display
C
Alarm/energy pulsing LED (Amber)
D
Heartbeat/communications LED (Green)
E
Navigation buttons
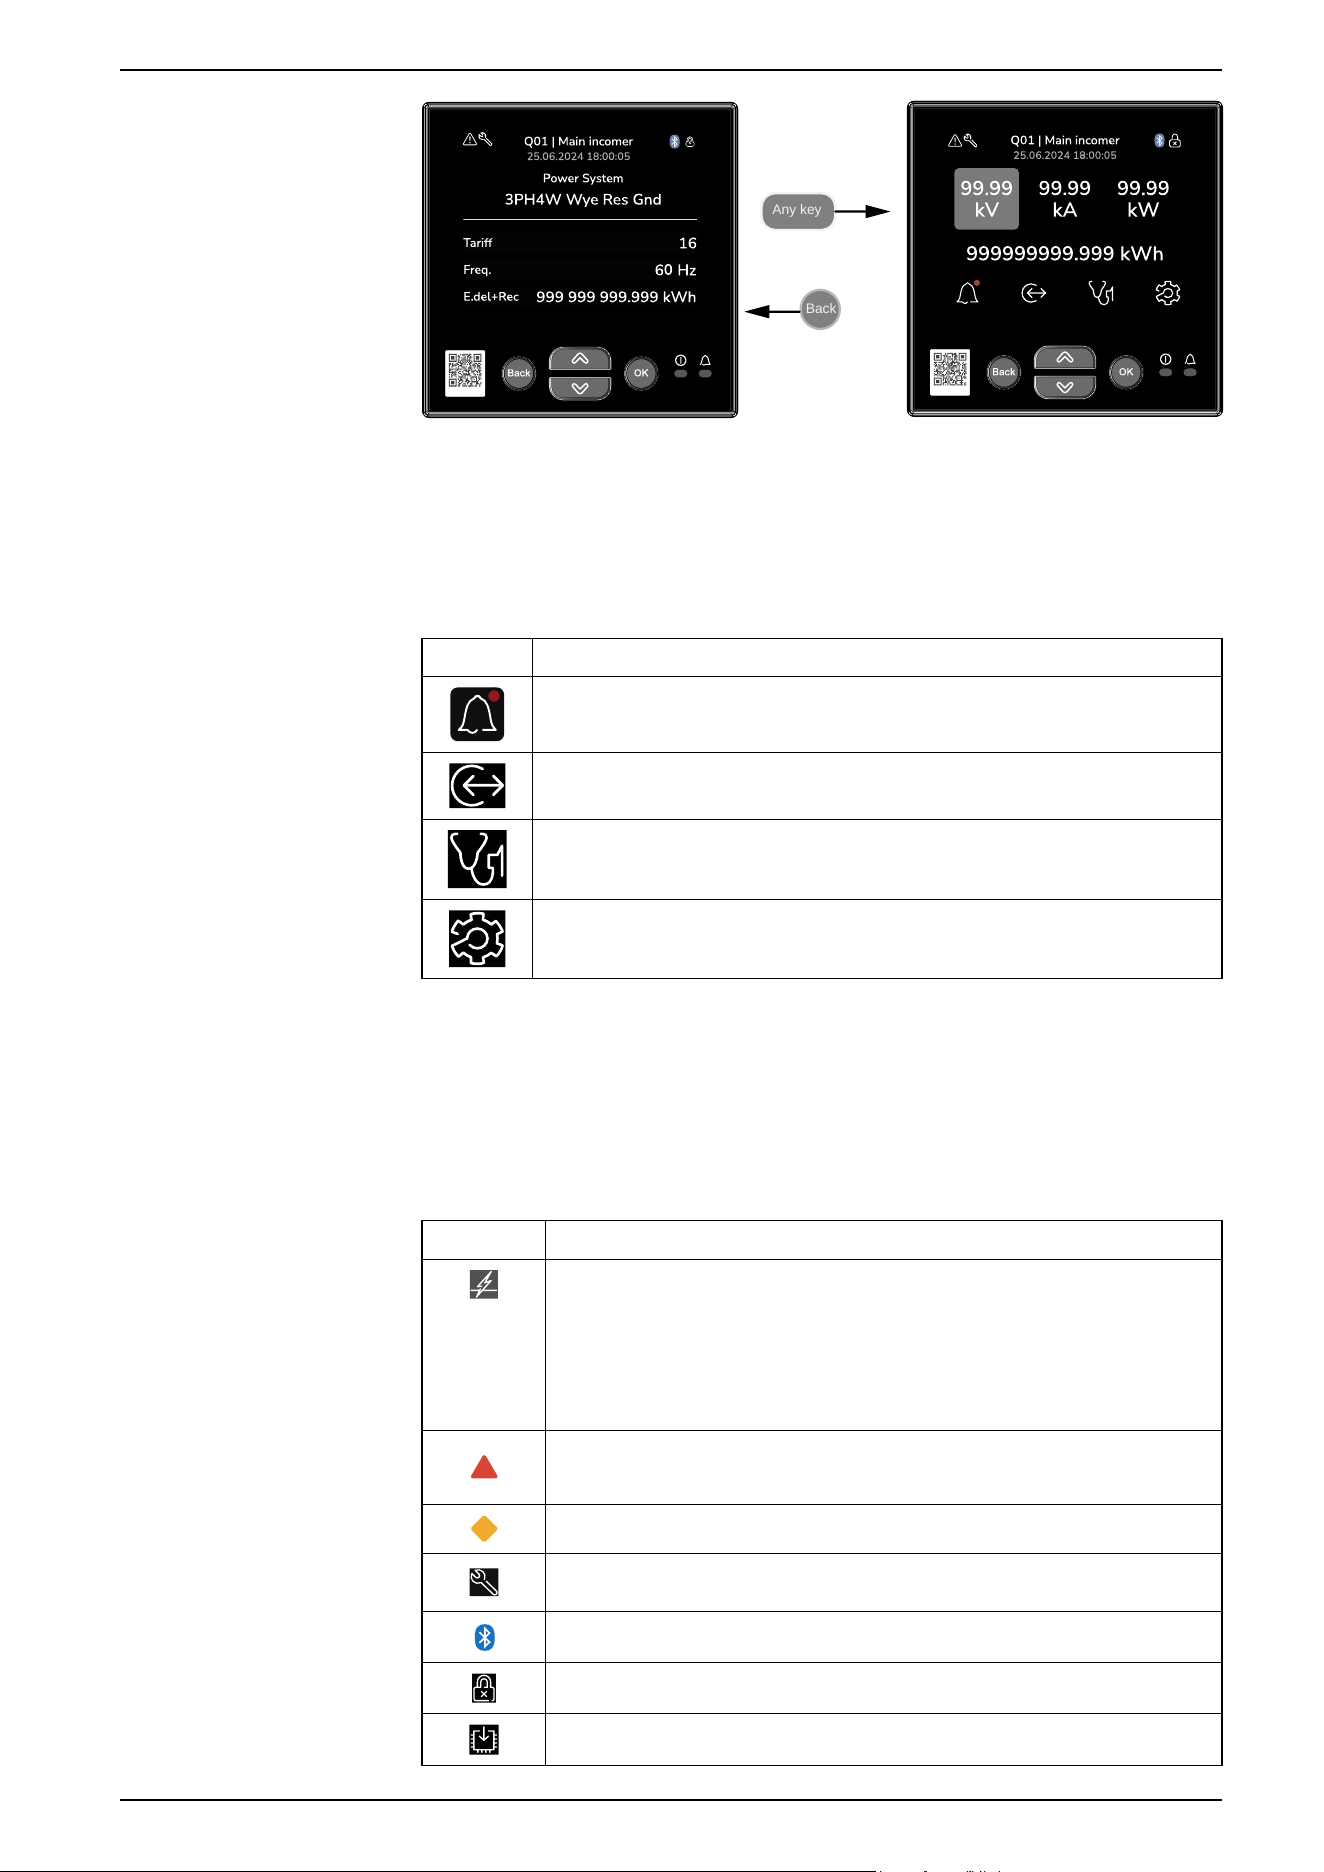
4.2 Default data display screen
The default data display screen varies depending on the meter model.
Summary screen for non-MID/MIR meter models
The summary screen is the default screen that displays real-time values for
current and voltage, total power, and energy consumption.
Summary screen for MID/MIR meter models
The Power System screen is the default screen that displays the power system
setting, active tariff, system frequency, and accumulated real energy (delivered +
received).
38 7EN02-0489-00
PowerLogic
™
Intuitive PM7100 / PM7200 / PM7300 series 4. Display
Any key
Back
4.3 Display menu icons
The menu icons at the bottom of the display allows you to navigate to the alarm
events, inputs/outputs, diagnostics, and settings screens.
Icon Description
This icon allows you to navigate to the alarm events screen that displays the active
alarms count and history log count.
This icon allows you to navigate to the digital inputs, digital outputs, and relay outputs
screen.
This icon allows you to navigate to the diagnostics screen that displays the device
info, meter status, timer, control power, phasor/polar, date and time, and identification.
This icon allows you to navigate to the settings screen to configure the meter,
communication, alarms, inputs/outputs, date and time, display, reset, and revenue
lock parameters.
4.4 Notification icons
To alert you about meter state or events, notification icons appear on the top left
(critical and immediate attention) or the top right corner (informational and status-
oriented) of the display screen.
Icon Description
(Displayed
only in MID/
MIR
compliance
meter
models)
The control power interruption event icon indicates that a control power (auxiliary
power) interruption event has occurred.
NOTE: The control power interruption event icon takes priority over all other
alarm icons.
The high priority alarm icon (red) blinks while the alarm is active. The alarm icon
remains displayed until you acknowledge. This icon indication requires immediate
attention.
The medium or low priority alarm icon (orange) blinks while the alarm is active.
The wrench icon indicates that meter requires maintenance (meter in an over
voltage condition or energy LED in an overrun state).
The Bluetooth icon indicates the connectivity status.
The lock icon indicates that the meter is revenue locked.
The firmware upgrade icon indicates that a firmware upgrade is in progress.
7EN02-0489-00 39
4. Display PowerLogic
™
Intuitive PM7100 / PM7200 / PM7300 series
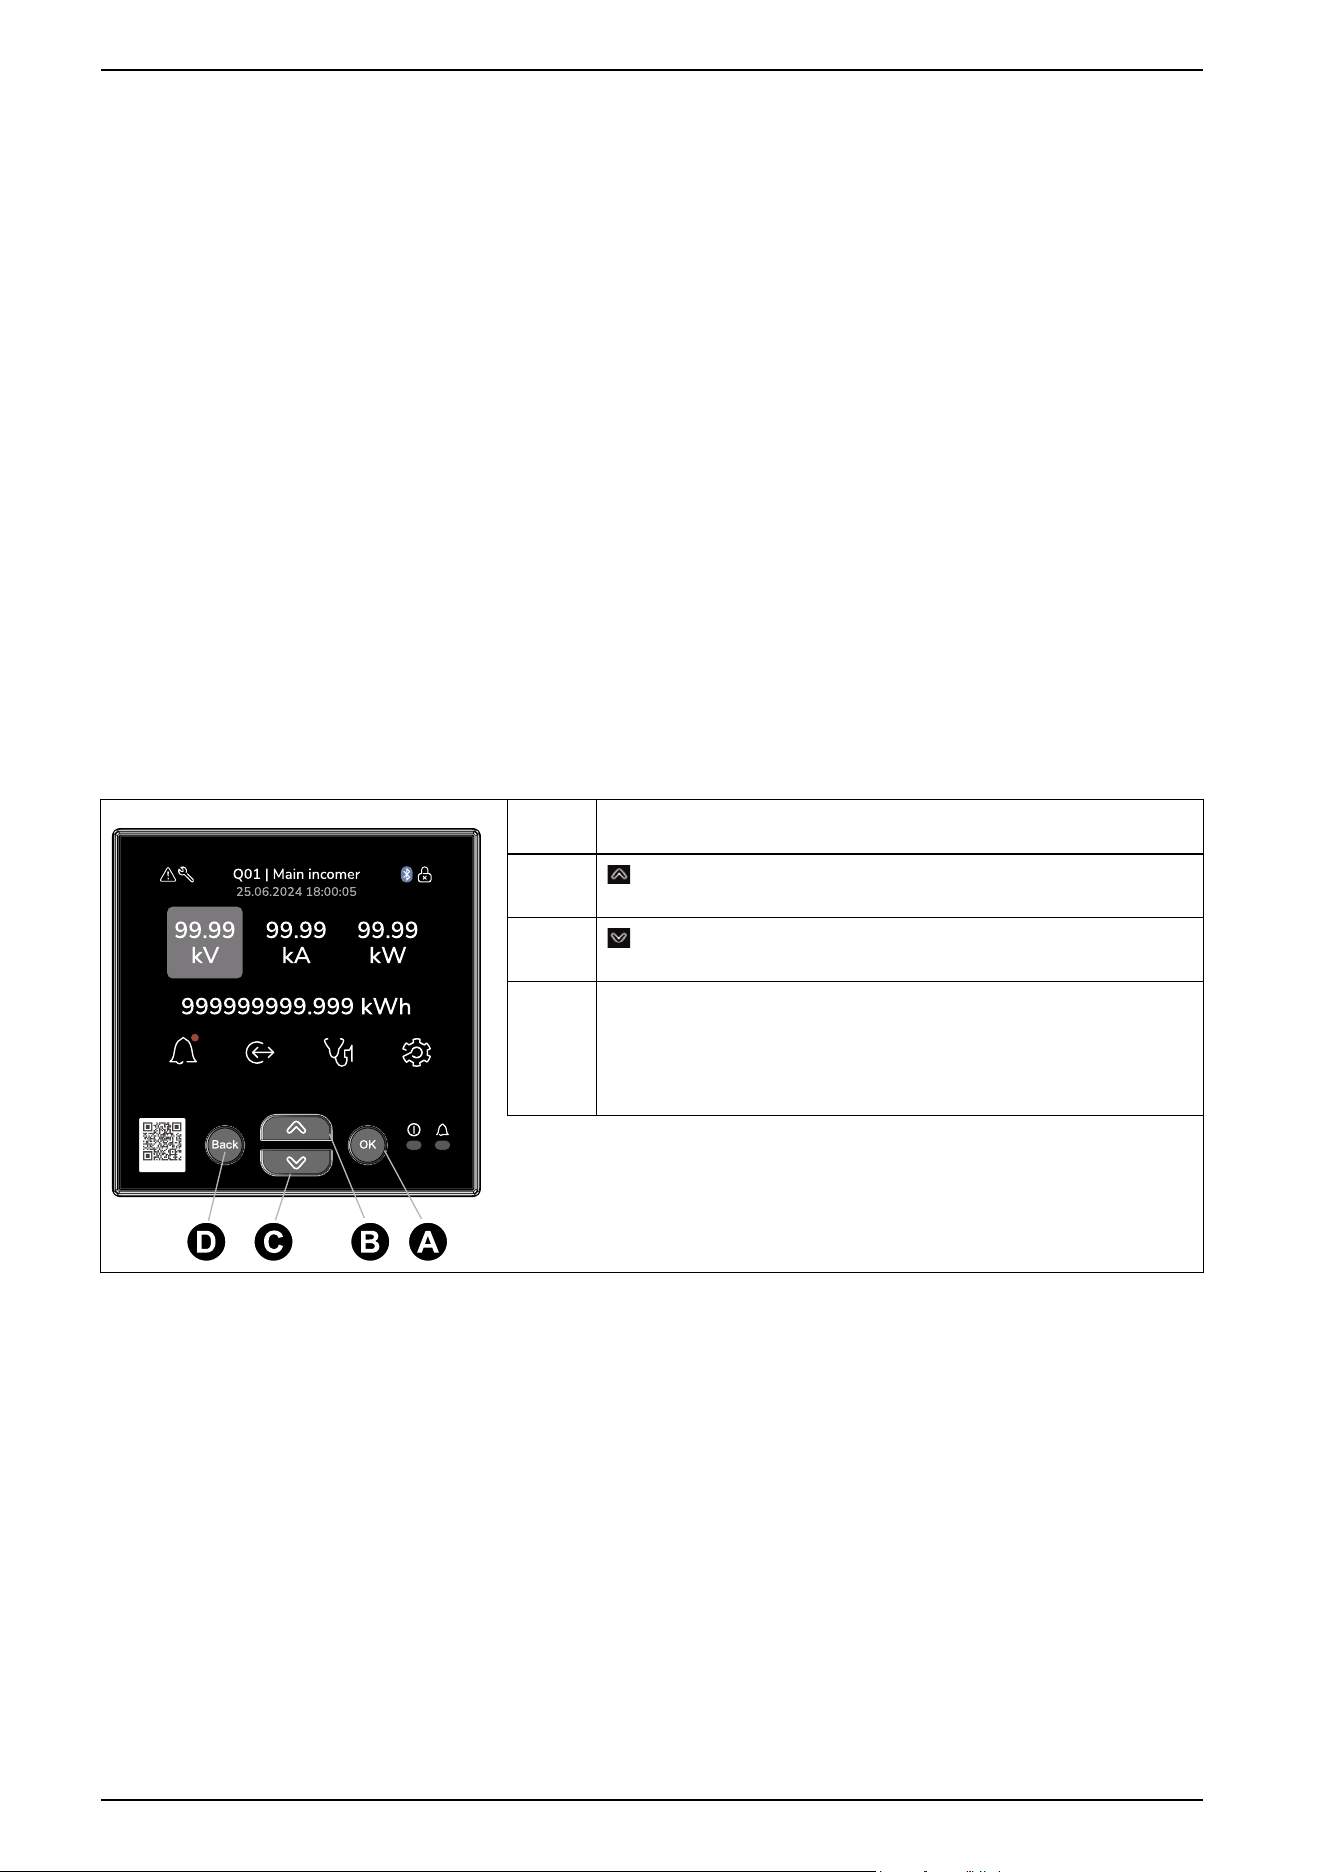
4.5 Meter display language
You can configure the meter to display information on the screen in one of several
languages.
The following languages are available:
• English (US)
• French
• Spanish
• German
• Italian
• Portuguese
• Russian
• Chinese
• Hebrew
4.6 Meter screen navigation
The meter buttons and display screen allow you to navigate data, setup screens,
and configure the meter’s setup parameters.
A
OK button. Use to select a menu item or confirm an entry or to view more
details.
B
Up button. Use to navigate up or increase a number in a numeric
setting.
C
Down button. Use to navigate down or decrease a number in a numeric
setting.
D
Back button. Use to return to the previous screen. For setup screens:
• If setup changes are made, press the Back button to display the
Apply settings screen.
• If editing a value, press the Back button to exit edit mode and restore
the previous value.
4.7 Access counter screen
The Access counter in the Settings screen increments when you change the
basic meter setup parameters (See Configuring the basic setup parameters, page
60) or configure CO2 and energy cost rates.
4.8 Button Shortcuts
4.8.1 Resetting the meter to the default language
To reset the meter to the default language:
40 7EN02-0489-00
PowerLogic
™
Intuitive PM7100 / PM7200 / PM7300 series 4. Display
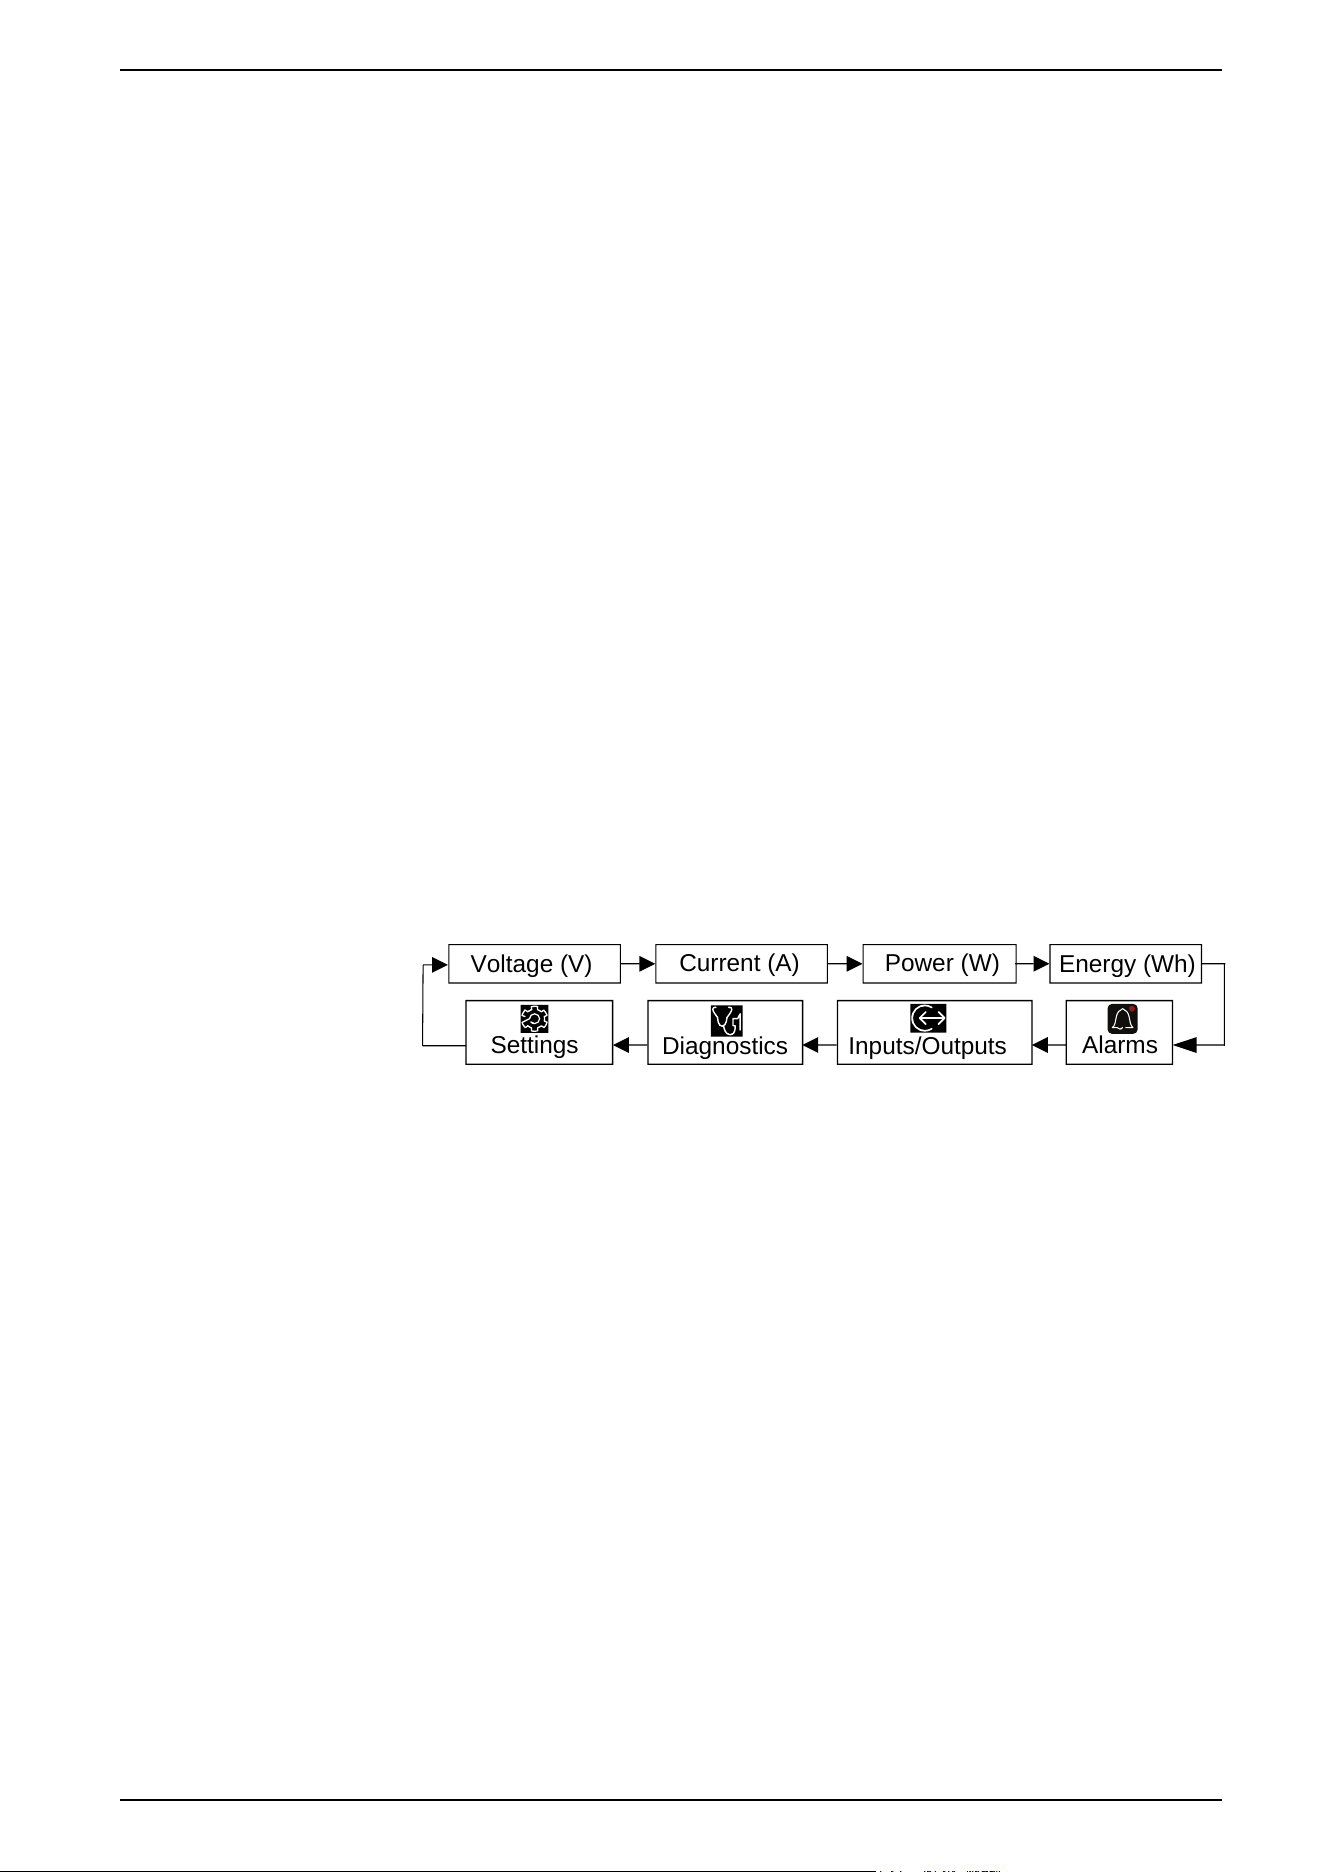
1. Press and hold the Back and OK buttons for 5 seconds to reset the meter to
the default language (English (US)).
4.8.2 Enabling Bluetooth
Use the following shortcuts to enable Bluetooth.
◻ If you are not on the Settings screen:
a. Press and hold the Back button for 3 seconds.
b. If Display Passcode is Enabled, enter the Passcode, and then press
OK.
The meter screen shows the Bluetooth and Advertising options as
Enabled.
◻ When you are already on the configuration screen:
a. Press and hold the Back button for 3 seconds.
The meter screen shows the Bluetooth and Advertising options as
Enabled.
4.9 Meter screen menus overview
All meter screens are grouped logically, according to their function. You can
access any available meter screen by first selecting the Level 0 (top level) screen
that contains it.
Figure 1 - Level 0 screen menus
Current (A)
Voltage (V)
Energy (Wh)
Power (W)
Alarms
Diagnostics
Settings
Inputs/Outputs
4.10 Menu tree
Use the menu tree to navigate to the parameter or setting you want to view or
configure.
The following image summarizes the available meter screens, displaying the IEC
menu options along with their corresponding IEEE menu equivalents shown in
parentheses [].
7EN02-0489-00 41
4. Display PowerLogic
™
Intuitive PM7100 / PM7200 / PM7300 series
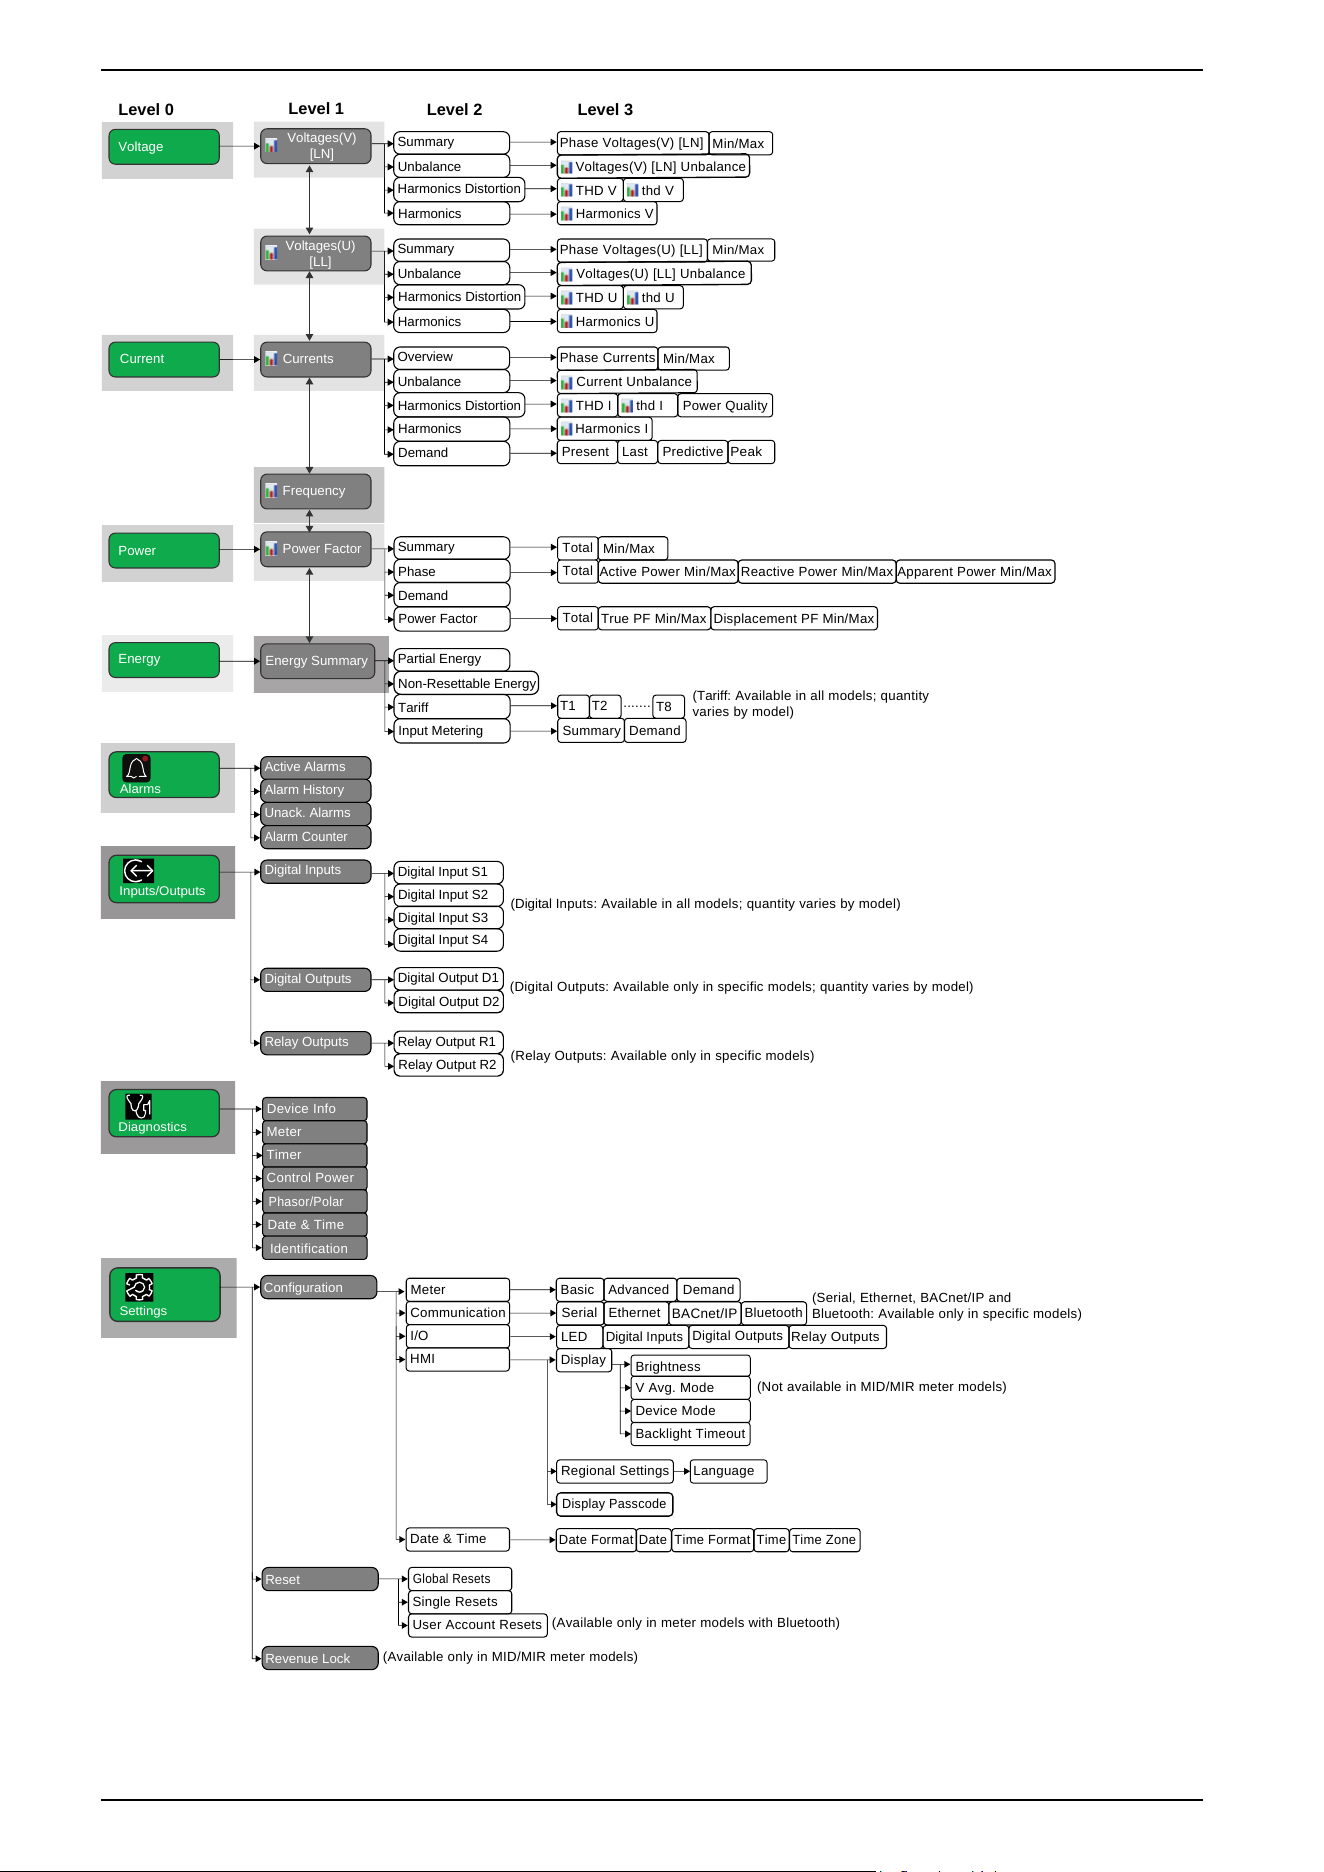
Summary
Unbalance
Harmonics Distortion
Level 1
Level 0
Level 2 Level 3
Voltage
Power
Energy
Active Alarms
Alarm History
Unack. Alarms
Alarm Counter
Alarms
Voltages(V)
[LN]
Power Factor
Summary
Phase
Demand
Power Factor
Min/Max
Total
Active Power Min/Max
Reactive
Power
Min/Max Apparent
Power
Min/Max
Total
True PF Min/Max Displacement PF Min/Max
Total
Summary Demand
Partial Energy
Non-Resettable Energy
Energy Summary
Tariff
Input Metering
T1 T2
T8
.......
Min/Max
Voltages(V) [LN]
Unbalance
Phase Voltages(V) [LN]
THD V
Harmonics
thd V
Harmonics V
Summary
Unbalance
Harmonics
Harmonics Distortion
Voltages(U)
[LL]
Frequency
Min/Max
Voltages
(U) [LL] Unbalance
Phase
Voltages
(U) [LL]
THD U thd U
Harmonics U
Overview
Unbalance
Harmonics Distortion
Harmonics
Demand
CurrentsCurrent
Min/Max
Current Unbalance
Phase Currents
THD I
Present
Last
Predictive
Peak
thd I
Power Quality
Harmonics I
Meter
Communication
Basic
Bluetooth
LED
Digital
Inputs
Digital Outputs
Relay Outputs
Ethernet
Serial
BACnet/IP
Advanced Demand
Digital Inputs
Digital Outputs
Inputs/Outputs
I/O
Display
Brightness
V Avg. Mode
Device Mode
Backlight Timeout
Regional Settings
Display Passcode
Language
HMI
Global Resets
Single Resets
User Account Resets
(Available only in MID/MIR meter models)
(Available only in meter models with Bluetooth)
Diagnostics
Configuration
Reset
Revenue Lock
Settings
Digital Input S1
Digital Input S2
Digital Input S3
Digital Input S4
Digital Output D1
Digital Output D2
Relay Outputs
Relay Output R1
Relay Output R2
Device Info
Meter
Timer
Control Power
Phasor/Polar
Identification
Date & Time
Date Format Date Time Format Time ZoneTime
Date & Time
(Not available in MID/MIR meter models)
(Digital Outputs: Available only in specific models; quantity varies by model)
(Digital
Inputs
: Available in all models; quantity varies by model)
(Relay Outputs: Available only in specific models)
(Serial, Ethernet, BACnet/IP and
Bluetooth: Available only in specific models)
(Tariff: Available in all models; quantity
varies by model)
42 7EN02-0489-00
PowerLogic
™
Intuitive PM7100 / PM7200 / PM7300 series 4. Display

4.10.1 Data display screens
The meter display screens allow you to view meter values and configure settings.
Minimum and maximum value indicators:
•
: Displays the minimum recorded value and its timestamp.
•
: Displays the maximum recorded value and its timestamp.
The following titles represent the display mode in IEC, with their
corresponding IEEE menu equivalents shown in parentheses [].
• Bulleted items indicate sub screens and their descriptions.
Voltages(V) [LN]
Graphical representation of the line-to-neutral voltage for all three phases (V1
[Van], V2 [Vbn], V3 [Vcn]).
NOTE: The line-to-neutral voltages (V) [LN] depend on the selected 1PH2W
LN, 1PH3W LL With N, and 3PH4W power system type configurations.
For information about individual harmonics up to the 31st, THD, and thd
measurements, see Harmonics, page 130.
Summary
• Phase Voltages(V) [LN] • Summary of line-to-neutral voltage on all three phases (V1 [Van], V2 [Vbn], V3 [Vcn]) and
the average voltage (V Avg.).
• Min/Max • Summary of the minimum and maximum values for line-to-neutral voltage on all three
phases (V1 [Van], V2 [Vbn], V3 [Vcn]) and the average voltage (V Avg.) with timestamps.
Unbalance Summary of the percentage line-to-neutral voltage unbalance (V Unb), along with the minimum
and maximum values and their timestamps.
NOTE: The line-to-neutral voltage unbalance (V Unb) is not applicable for 1PH power
system type configurations.
Harmonics Distortion
• THD V • Summary of THD (ratio of harmonic content to the fundamental) for line-to-neutral voltage
on all three phases (V1 [Van], V2 [Vbn], V3 [Vcn]) along with the minimum and maximum
values with timestamps.
• thd V • Summary of thd (ratio of harmonic content to the rms value of total harmonic content) for
line-to-neutral voltage on all three phases (V1 [Van], V2 [Vbn], V3 [Vcn]) along with the
minimum and maximum values with timestamps.
Harmonics Summary of line-to-neutral voltage harmonics data, including numeric magnitude and phase
angle for the fundamental, and graphical representation of the 3rd to 15th odd harmonics for
each line-to-neutral phase voltage.
Voltages(U) [LL]
Graphical representation of phase line-to-line voltage on all three phase pairs
(U12 [Vab], U23 [Vbc], U31 [Vca])
NOTE: The line-to-line voltages (U) [LL] depend on the selected 1PH2W LL,
and 3PH3W power system type configurations.
For information about individual harmonics up to the 31st, THD, and thd
measurements, see Harmonics, page 130.
Summary
• Phase Voltages(U) [LL] • Summary of phase line-to-line voltage on all three phase pairs (U12 [Vab], U23 [Vbc], U31
[Vca]) and the average line-to-line voltage (U Avg. [V Avg.]).
• Min/Max • Summary of the minimum and maximum values for line-to-line voltage on all three phase
pairs (U12 [Vab], U23 [Vbc], U31 [Vca]) and the average line-to-line voltage (U Avg. [V
Avg.]) with timestamps.
7EN02-0489-00 43
4. Display PowerLogic
™
Intuitive PM7100 / PM7200 / PM7300 series

Unbalance Summary of the percentage line-to-line voltage unbalance (U Unb), along with the minimum and
maximum values and their timestamps.
NOTE: The line-to-line voltage unbalance (U Unb) is not applicable for 1PH power system
type configuration.
Harmonics Distortion
• THD U • Summary of THD (ratio of harmonic content to the fundamental) for line-to-line voltage on
all three phase pairs (U12 [Vab], U23 [Vbc], U31 [Vca]) along with the minimum and
maximum values with timestamps.
• thd U • Summary of thd (ratio of harmonic content to the rms value of total harmonic content) for
line-to-line voltage on all three phase pairs (U12 [Vab], U23 [Vbc], U31 [Vca]) along with
the minimum and maximum values with timestamps.
Harmonics Summary of line-to-line voltage harmonics data, including numeric magnitude and phase angle
for the fundamental, and graphical representation of the 3rd to 15th odd harmonics for each line-
to-line phase voltage.
Currents
Graphical representation of each phase current ((I1 [Ia], I2 [Ib], I3 [Ic]), along with
the neutral current (In) and nominal current (Nominal).
NOTE:
• The phase currents ((I1 [Ia], I2 [Ib], I3 [Ic]) depends on the CT on
Terminal selection for 1PH2W LN and 1PH2W LL power system type
configurations.
• The neutral current (In) is available only for 1PH3W LL with N and
3PH4W power system type configurations.
• The ground current (Ig) is available only for 3PH3W power system type
configurations and when CT on Terminal is set to I1 I2 I3.
For information about individual harmonics up to the 31st, THD, thd, TDD, and
demand measurements, see Harmonics, page 130 and Demand measurements,
page 121
Overview
• Phase Currents • Summary of each phase current ((I1 [Ia], I2 [Ib], I3 [Ic]), the neutral current (In), the ground
current (Ig) and the average current (I Avg.).
• Min/Max • Summary of the minimum and maximum values for each phase current ((I1 [Ia], I2 [Ib], I3
[Ic]), the neutral current (In), the ground current (Ig) and the average current (I Avg.) with
timestamps.
Unbalance Summary of the percentage current-unbalance (I Unb), along with the minimum and maximum
values and their timestamps.
NOTE: The current-unbalance (I Unb) is not applicable for 1PH power system type
configuration.
Harmonics Distortion
• THD I • Summary of THD (ratio of harmonic content to the fundamental) for each phase current ((I1
[Ia], I2 [Ib], I3 [Ic]), the neutral current (In), the ground current (Ig) along with the minimum
and maximum values with timestamps.
• thd I • Summary of thd (ratio of harmonic content to the rms value of total harmonic content) for
each phase current ((I1 [Ia], I2 [Ib], I3 [Ic]), the neutral current (In), the ground current (Ig)
along with the minimum and maximum values with timestamps.
• Power Quality • Total Demand Distortion (TDD) values in percentage (%). TDD measures the total harmonic
current (sum of all harmonic RMS currents) relative to the system’s maximum load current.
Harmonics Summary of current harmonics data, including numeric magnitude and phase angle for the
fundamental, and graphical representation of harmonics of the 3rd to 15th odd harmonics for
each phase current.
Demand
• Present • Summary of the present demand interval for each phase current ((I1 [Ia], I2 [Ib], I3 [Ic]), the
neutral current (In), the ground current (Ig) and the average current (I Avg.).
• Last
• Summary of the last demand interval for each phase current ((I1 [Ia], I2 [Ib], I3 [Ic]), the
neutral current (In), the ground current (Ig) and the average current (I Avg.).
44 7EN02-0489-00
PowerLogic
™
Intuitive PM7100 / PM7200 / PM7300 series 4. Display

• Predictive • Summary of the predicted demand based on the current consumption rate for each phase
current ((I1 [Ia], I2 [Ib], I3 [Ic]), the neutral current (In), the ground current (Ig) and the
average current (I Avg.).
• Peak • Summary of the recorded peak demand for each phase current ((I1 [Ia], I2 [Ib], I3 [Ic]), the
neutral current (In), the ground current (Ig) and the average current (I Avg.) with
timestamps.
Frequency
Graphical representation of the frequency values.
Min/Max Frequency Summary of the minimum and maximum values for frequency parameters with timestamps.
Power Factor
Graphical representation of the power factor values.
For information about power factor calculation and demand measurements, see
Power factor, page 124 and Demand, page 121.
Summary
• Total • Summary of the power consumption for total active power in kW (P Total [Active Total]),
total reactive power in kvar (Q Total [Reac Total]), and total apparent power in kVA (S Total
[Appr Total]).
• Min/Max • Summary of the minimum and maximum values for total power consumption, including total
active power in kW (P Total [Active Total]), total reactive power in kvar (Q Total [Reac
Total]), and total apparent power in kVA (S Total [Appr Total]) with timestamps.
Phase
• Total
• Summary of per phase and total power values for active power P [Active] in kW (P1 [A], P2
[B], P3 [C], and Total), reactive power Q [Reac] in kvar (Q1 [A], Q2 [B], Q3 [C], and Total),
and apparent power S [Appr] in kVA (S1 [A], S2 [B], S3 [C], and Total).
• Active Power Min/Max
• Summary of the minimum and maximum values for per phase and total active power in kW
(P1 [A], P2 [B], P3 [C], and P Total [Active Total]) with timestamps.
• Reactive Power Min/Max
• Summary of the minimum and maximum values for per phase and total reactive power in
kvar (Q1 [A], Q2 [B], Q3 [C], and Q Total [Reac Total]) with timestamps.
• Apparent Power Min/Max
• Summary of the minimum and maximum values for per phase and total apparent power in
kVA (S1 [A], S2 [B], S3 [C], and S Total [Appr Total]) with timestamps.
Demand Summary of demand values for the current demand interval (Present), the previous demand
interval (Last), and the predicted demand interval (Predictive) based on the current power
consumption rate and the recorded peak power demand (Peak) value with timestamp for active
power demand (Pd [Wd]), reactive power demand (Qd [VARd]) and apparent power demand
(Sd [VAd]).
Power Factor
• Total
• Summary of true power factor and displacement power factor values for each phase (PF1
[PFa], PF2 [PFb], PF3 [PFc]) and total (PF Total).
• True PF Min/Max
• Summary of the minimum and maximum true power factor values with timestamps for each
phase (PF1 [PFa], PF2 [PFb], PF3 [PFc]) and total (PF Total).
• Displacement PF Min/Max
• Summary of the minimum and maximum displacement power factor values with timestamps
for each phase (PF1 [PFa], PF2 [PFb], PF3 [PFc]) and total (PF Total).
Energy Summary
Summary of the delivered active energy (P Del), delivered reactive energy (Q
Del), and delivered apparent energy (S Del) values.
NOTE: You can read multi-tariffs T9 to T16 only through communication.
7EN02-0489-00 45
4. Display PowerLogic
™
Intuitive PM7100 / PM7200 / PM7300 series
For information about energy measurements, multi-tariff measurements, and input
metering measurements, see Energy, page 120, Multi-tariff, page 112, and Input
metering, page 102.
Partial Energy Summary of accumulated values for delivered (Del), received (Rec), delivered plus received (D
+R), and delivered minus received (D-R) for partial active energy in Wh (P [Active]), partial
apparent energy in varh (Q [Reac]), and partial reactive energy in VAh (S [Appr]).
Non-Resettable Energy Summary of accumulated values for delivered (Del), received (Rec), delivered plus received (D
+R), and delivered minus received (D-R) for active energy in Wh (P [Active]), apparent energy
in varh (Q [Reac]), and reactive energy in VAh (S [Appr]).
Tariff
• T1 to T8
(Available in all models; quantity varies by model.)
Summary of the multi-tariffs (T1 to T8):
• Active energy delivered (Del) and received (Rec) in Wh (P [Active]) for the selected multi-
tariff.
• Reactive energy delivered (Del) and received (Rec) in varh (Q [Reac]) for the selected
multi-tariff.
• Apparent energy delivered (Del) and received (Rec) in VAh (S [Appr]) for the selected
multi-tariff.
Input Metering
• Summary • Summary of energy accumulations for the input metering channels (Inp Mtr Chan 1 to Inp
Mtr Chan 4).
• Demand • Summary of the last demand, present demand, predicted demand, and peak demand for
the input metering channels (Inp Mtr Chan 1 to Inp Mtr Chan 4).
Alarms
For information about alarms, see Alarms, page 104.
Active Alarms List of all active alarm events with a date/timestamp for each event.
Each alarm displays the severity, start time, event, phase, and threshold value.
Alarm History Historical list of all acknowledged alarm events with a date/timestamp for each event.
Each alarm displays the start time, event, phase, and threshold value.
Unack. Alarms List of all unacknowledged alarm events.
Alarm Counter Total number of occurrences for each alarm type.
Inputs/Outputs
For information about digital input, digital output, and relay output applications,
see Digital inputs, page 101, Digital outputs, page 101, and Relay outputs, page
102.
46 7EN02-0489-00
PowerLogic
™
Intuitive PM7100 / PM7200 / PM7300 series 4. Display

Digital Inputs
• Digital Input S1
• Digital Input S2
• Digital Input S3
• Digital Input S4
Available in all models; quantity varies by model.
Status (ON or OFF) of the selected digital input.
Counter shows the total number of detected off-to-on state transitions .
Timer shows the total duration (in seconds) during which the digital input remains in the on state.
Digital Outputs
• Digital Output D1
• Digital Output D2
(Available only in specific models; quantity varies by model.)
Status (ON or OFF) of the selected digital output.
Counter shows the total number of detected off-to-on state transitions.
Timer shows the total duration (in seconds) during which the digital output remains in the on
state.
Relay Outputs
• Relay Output R1
• Relay Output R2
(Available only in specific models.)
Status (ON or OFF) of the selected relay output.
Counter shows the total number of detected off-to-on state transitions .
Timer shows the total duration (in seconds) during which the relay output remains in the on
state.
Diagnostics
For information about meter status (diagnostic codes) and control power (auxiliary
power) interruption events, see Meter status, page 91 and Control power (auxiliary
power) interruption event, page 88
Device Info Bluetooth firmware information is available only in specific models
Displays the meter model, serial number, date of manufacture, firmware version (including OS -
Operating System, RS - Reset System and OS CRC (Cyclic Redundancy Check)), language
firmware, and Bluetooth firmware. The OS CRC value is a number (Hexadecimal format) that
identifies the uniqueness between different OS firmware versions.
Meter Displays the meter diagnostic status.
Timer Active Load Timer counter that keeps track of the total number of days, hours, minutes, and
seconds an active load is connected to the meter inputs.
Operating Timer counter for the total number of days, hours, minutes, and seconds the meter
has been powered.
Control Power Non-MID/MIR meter models: The control power screen displays how many times the meter lost
control power (number of losses) and the last power down event with the timestamp.
MID/MIR meter models: The control power screen displays how many times the meter lost
control power (number of losses) and the last power up and power down events with the
timestamp.
Phasor/Polar Phasor: Displays a graphical representation of the power system the meter is monitoring.
Polar: Displays the numeric magnitude and angles of all voltage and current phases.
Date & Time Displays the date and time.
Identification Displays a QR code containing the meter information.
Settings
Configuration
• Meter • Meter configuration screens:
◦ Basic: Screen to define the power system configuration, including VT connection, VT
primary and secondary values, CT terminal assignment, CT primary and secondary
values, nominal frequency and phase rotation. See Configuring the basic setup
parameters, page 60.
◦ Advanced: Screen to set up the active load timer and define the peak demand current
for TDD calculations. See Configuring the advanced setup parameters, page 62.
◦ Demand: Screen to set up the power demand, current demand, and input metering
demand. See Configuring the demand calculations, page 63.
• Communication (Serial, Ethernet, BACnet/IP, and Bluetooth: Available only in specific models.)
7EN02-0489-00 47
4. Display PowerLogic
™
Intuitive PM7100 / PM7200 / PM7300 series

• Communication configuration screens:
◦ Serial: Screen to configure the serial RS-485 parameters. See Configuring the serial
communications, page 64.
◦ Ethernet: Screen to configure the Ethernet parameters. See Configuring the Ethernet
communications, page 65.
◦ BACnet/IP: Screen to configure the BACnet/IP objects. See Configuring the BACnet/IP
settings, page 67.
◦ Bluetooth: Screen to configure the Bluetooth. See Configuring Bluetooth, page 68.
• I/O • Screens to set up the I/O parameters:
◦ LED: Screen to set up the alarm/energy pulsing LED. See Configuring the alarm/energy
pulsing LED, page 69.
◦ Digital Inputs: Screen to set up the digital inputs. See Configuring the digital inputs,
page 70.
◦ Digital Outputs: Screen to set up the digital outputs. See Configuring the digital
outputs, page 71.
◦ Relay Outputs: Screen to set up the relay outputs. See Configuring the relay outputs,
page 73.
• HMI
◦ Display
◦ Regional Settings
◦ Display Passcode
• Screens to configure the HMI parameters:
◦ Screen to configure display settings. See Configuring the display settings, page 74.
– Brightness: Screen to adjust the brightness of the display.
– V Avg. Mode (Not available in MID/MIR meter models): Screen to select the type
of average voltage you want the meter to display on the summary screen.
– Device Mode: Screen to configure regional settings (IEC or IEEE).
– Backlight Timeout: Screen to configure how long the device’s backlight stays on
before turning off when inactive.
◦ Language: Screen to set up the meter language settings. See Configuring the regional
settings, page 75.
◦ Settings: Screen to configure display passcode for settings screen. See Configuring the
display passcode, page 59.
• Date & Time
◦ Date Format
◦ Date
◦ Time Format
◦ Time
◦ Time Zone
• Screen to set up the meter date, time, and time zone. See Configuring date and time, page
75.
Reset
• Global Resets Screens to perform a global reset. See Performing global resets, page 76.
• Single Resets
Screens to perform a single reset. See Performing single resets, page 76.
• User Account Resets
(Available only in meter models with Bluetooth)
Screen to reset user accounts. See Performing user account resets, page 77.
Revenue Lock (Available only in MID/MIR meter models)
Screen for revenue lock. See Locking or unlocking revenue meter, page 78.
48 7EN02-0489-00
PowerLogic
™
Intuitive PM7100 / PM7200 / PM7300 series 4. Display

5. Cybersecurity
5.1 Overview
This chapter contains information about your product’s cybersecurity. Network
administrators, system integrators and personnel that commission, maintain or
dispose of a device should:
• Apply and maintain the device’s security capabilities. See Device security
capabilities, page 51 for details.
• Review assumptions about protected environments. See Protected
environment assumptions, page 52 for details.
• Address potential risks and mitigation strategies. See Potential risks and
compensating controls, page 53 for details.
• Follow recommendations to optimize cybersecurity.
Your device has security capabilities that:
• Allow it to be part of a NERC CIP compliant facility. Go to the North American
Electric Reliability Corporation website for information on NERC Reliability
Standards.
• Align with cybersecurity standards in the IEC 62443 international standard for
business IT systems and Industrial Automation and Control Systems (IACS)
products. Go to the International Electrotechnical Commission website for
information about the IEC 62443 international standard.
WARNING
POTENTIAL COMPROMISE OF SYSTEM AVAILABILITY, INTEGRITY, AND
CONFIDENTIALITY
• Set a display passcode to help reduce the risk of unauthorized physical
access to the meter.
• Disable unused ports/services and default accounts, where possible, to
minimize pathways for malicious attacks.
• Place networked devices behind multiple layers of cyber defenses (such as
firewalls, network segmentation, and network intrusion detection and
protection).
• Use cybersecurity best practices (for example: least privilege, separation of
duties) to help prevent unauthorized exposure, loss, modification of data and
logs, interruption of services, or unintended operation.
Failure to follow these instructions can result in death, serious injury, or
equipment damage.
5.2 Cybersecurity in Schneider Electric
Introduction
Cybersecurity is integral to Schneider Electric’s business strategy, and it follows a
cybersecurity posture that covers many aspects:
• Securing internal activities,
• Providing elevated levels of protection of strategic IT systems and assets,
• Leading the digital transformation within a cybersecure framework,
• Designing and developing new products and solutions with end-to-end
cybersecure measures and protection.
7EN02-0489-00 49
5. Cybersecurity PowerLogic
™
Intuitive PM7100 / PM7200 / PM7300 series

Schneider Electric is preparing for the 2027 Cyber Resilience Act (CRA) as part of
our ongoing commitment to cybersecurity. This effort supports compliance with EU
requirements and helps strengthen our global cybersecurity posture.
Cybersecurity policies
To support the development and maintenance of products, Schneider Electric
follows a Secure Development Lifecycle (SDL) compliant with the IEC 62443-4-2
Security Standard for Industrial Automation and Control systems.
It consists in implementing a process relying on security best practices, dedicated
tools that covers:
• Security training for teams involved in the product design, development, and
testing,
• Threat modeling analysis and security design reviews,
• Static code analysis and code security reviews,
• Periodic penetration and vulnerability testing,
• Stringent vulnerability management process.
5.3 Cybersecurity resources
Cybersecurity Solutions
For recommendations and guidance on how to help secure the environment and
infrastructure in which the power meter is deployed, Schneider Electric publishes
guidelines, white papers, and best practices that can be consulted in the
Cybersecurity Solutions page of Schneider Electric global website.
Cybersecurity Support Portal
In addition, other resources can be found in Schneider Electric Cybersecurity
Support Portal, including:
• Schneider Electric vulnerability management policy,
• Security Notifications about vulnerabilities in products and systems.
Schneider Electric’s vulnerability management policy addresses Cybersecurity
vulnerabilities affecting Schneider Electric products to help support the security of
our customers. Schneider Electric works collaboratively with researchers, Cyber
Emergency Response Teams (CERTs), and asset owners to help ensure that
accurate information is provided in a timely fashion to protect customer
installations. Schneider Electric’s Corporate Product CERT (CPCERT) is
responsible for managing and alerting on vulnerabilities and mitigations affecting
products. The Cybersecurity Support Portal also provides interfaces to report
Cybersecurity vulnerabilities and to register for the security notification updates
mailing list to stay informed through email on newly released or updated Security
Notifications.
5.4 Product defense-in-depth
Use a layered network approach with multiple security and defense controls in
your IT and control system to minimize data protection gaps, helps reduce single-
point-of-failure and create a strong cybersecurity posture. The more layers of
security in your network, the harder it is to breach defenses, take digital assets or
cause disruption.
50 7EN02-0489-00
PowerLogic
™
Intuitive PM7100 / PM7200 / PM7300 series 5. Cybersecurity

Place the device behind a secure firewall to protect against unauthorized access
and potential cyber threats.
5.4.1 Device security capabilities
Information confidentiality
These security capabilities help protect the confidentiality of information through
secure protocols that help prevent unauthorized users from reading information in
transit.
Bluetooth channel encryption provides confidentiality of information transmitted
over the wireless interface.
Physical security (MID/MIR meter models)
These security features, together with perimeter security, help prevent
unauthorized access to revenue-related parameters and settings and provide
evidence of physical tampering with the device, such as the revenue lock icon on
the display, which indicates whether the device is revenue locked.
Bluetooth user authentication
Access to the Bluetooth interface is secured and requires users to authenticate
using the password.
Display security
Access to the configuration screen is secured through a display passcode
authorization mechanism.
Firmware authenticity and integrity
Secure boot process ensures firmware integrity through verification at meter start-
up.
Firmware upgrades are validated using digital signature verification based on
asymmetric cryptographic techniques.
Debugging and testing interfaces are permanently disabled to prevent
unauthorized access.
Modbus/BACnet configuration write protection
Enabling write protection disables all Modbus/BACnet/IP write operations and
configuration changes.
Bluetooth pairing and encryption
During Bluetooth pairing, the devices securely exchange encryption keys. These
keys are used to protect the communication channel, ensuring both data
confidentiality and integrity.
7EN02-0489-00 51
5. Cybersecurity PowerLogic
™
Intuitive PM7100 / PM7200 / PM7300 series

Bluetooth user account locking (protection against repeated unauthorized
access attempts)
The meter locks for 4 minutes after five consecutive invalid login attempts through
the EcoStruxure
™
Power Device (EPD) application. After 4 minutes, the meter
unlocks automatically. To unlock the meter immediately, perform a power cycle.
Display passcode locking (protection against repeated unauthorized
access attempts)
The meter locks for 4 minutes after five consecutive invalid login attempts using
the display. To reset the display passcode, see Resetting the display passcode
using the product reset, page 59.
Bluetooth user account password and meter display passcode policies
The Bluetooth user account password for EcoStruxure
™
Power Device (EPD)
application must meet the following requirements:
• Between 8 to 32 characters in length
• Include at least one number, one uppercase character, one lowercase
character and one special character
• Must not contain the Username
• Do not use restricted characters such as: " [ ] : ; | = + * ? < > / \ ,
The meter display passcode for accessing the configuration screen must be a 6-
digit numeric value between 000000 and 999999 and must meet the following
requirements:
• Must contain at least two different digits (for example, 111111 is invalid;
911111 is valid).
• Must not use sequential digits in ascending or descending order (for example,
345678 and 876543 are invalid).
Secure activation of network and wireless interfaces
Modbus TCP/IP and BACnet/IP network communication protocols can be enabled
or disabled through the display. The Bluetooth wireless interface can also be
enabled or disabled through the display
Approved cryptography algorithms
ECC p-241 for asymmetric keys.
Symmetric encryption using AES128.
Hashing functions using SHA256.
True random number generator.
5.4.2 Protected environment assumptions
• Cybersecurity governance – available and up-to-date guidance on governing
the use of information and technology assets in your company.
• Perimeter security – installed devices, and devices that are not in service, are
in an access-controlled or monitored location.
52 7EN02-0489-00
PowerLogic
™
Intuitive PM7100 / PM7200 / PM7300 series 5. Cybersecurity

• Emergency power – the control system provides the capability to switch to
and from an emergency power supply without affecting the existing security
state or a documented degraded mode.
• Firmware upgrades – meter upgrades are implemented consistently to the
current version of firmware.
• Controls against malware – detection, prevention, and recovery controls to
help protect against malware are implemented and combined with
appropriate user awareness.
• Physical network segmentation – the control system provides the capability
to:
◦ Physically segment control system networks from non-control system
networks.
◦ Physically segment critical control system networks from non-critical
control system networks.
• Logical isolation of critical networks – the control system provides the
capability to logically and physically isolate critical control system networks
from non-critical control system networks. For example, using VLANs.
• Independence from non-control system networks – the control system
provides network services to control system networks, critical or non-critical,
without a connection to non-control system networks.
• Encrypt protocol transmissions over all external connections using an
encrypted tunnel, TLS wrapper or a similar solution.
• Zone boundary protection – the control system provides the capability to:
◦ Manage connections through managed interfaces consisting of
appropriate boundary protection devices, such as: proxies, gateways,
routers, firewalls, and encrypted tunnels.
◦ Use an effective architecture, for example, firewalls protecting application
gateways residing in a DMZ.
◦ Control system boundary protections at any designated alternate
processing sites should provide the same levels of protection as that of
the primary site, for example, data centers.
• No public internet connectivity – access from the control system to the
internet is not recommended. If a remote site connection is needed, for
example, encrypt protocol transmissions.
• Resource availability and redundancy – ability to break the connections
between different network segments or use duplicate devices in response to
an incident.
• Manage communication loads – the control system provides the capability to
manage communication loads to mitigate the effects of information flooding
types of DoS (Denial of Service) events.
• Control system backup – available and up-to-date backups for recovery from
a control system failure.
5.4.3 Potential risks and compensating controls
Address potential risks using these compensating controls:
7EN02-0489-00 53
5. Cybersecurity PowerLogic
™
Intuitive PM7100 / PM7200 / PM7300 series

Area Issue Risk Compensating controls
Display passcode Display passcode is not set.
If you do not set the display
passcode, unauthorized users can
gain access to the meter.
Set a 6-digit display passcode to help
reduce the risk of unauthorized access.
Secure protocols
Modbus TCP/IP, BACnet/IP,
DPWS protocols are unsecure.
The device does not have the
capability to transmit encrypted
data using these protocols.
If a malicious user gained access to
your network, they could intercept
communications.
For transmitting data over an internal
network, physically or logically segment
the network.
For transmitting data over an external
network, encrypt protocol
transmissions over all external
connections using an encrypted tunnel,
TLS wrapper or a similar solution.
NOTE: Enabling DPWS allows
clients to discover the device on
the local network. DPWS does not
permit device configuration
changes, firmware updates, user
management, or access to
sensitive data.
Modbus write
protection
Write protection is not enabled.
Unauthorized users can modify
network configuration settings,
which can affect system integrity
and operation.
Enable write protection for Modbus and
BACnet/IP communication.
NOTE: Security-related settings
can be modified only through the
meter display by authorized users.
Modbus RTU/TCP
Modbus RTU/TCP
communication is enabled when
not required.
Unauthorized users can access
meter data and configuration,
increasing exposure to
unauthorized changes or data.
Disable the Modbus RTU/TCP
communication when not in use.
NOTE: Security-related settings
can be modified only through the
meter display by authorized users.
5.5 Default settings
Area
Setting
Default
Communication protocols
Modbus TCP/IP Enabled
Modbus RTU Enabled
BACnet/IP Disabled
DPWS Enabled
Bluetooth Disabled
IPv4 Enabled
IPv6 Disabled
Configuration
Using the display Enabled
Using the PowerLogic™ Engineering Suite Enabled
Using Modbus programming or interface Enabled
5.6 Bluetooth user account and display passcode
The Bluetooth user account password for EcoStruxure
™
Power Device (EPD)
application is a critical security credential that controls access to wireless
communication with the meter. This password must meet defined complexity
requirements to ensure secure pairing and data exchange. The meter supports a
configurable display passcode to access the configuration screen through the
device display. This display passcode help prevent unauthorized local access.
54 7EN02-0489-00
PowerLogic
™
Intuitive PM7100 / PM7200 / PM7300 series 5. Cybersecurity

Bluetooth user account
Each meter has a unique, factory-set default Bluetooth user account password,
which is printed on the product label and also displayed on the meter screen. After
the first login using EcoStruxure
™
Power Device (EPD), it is recommended that
users change the factory-set default password and update it periodically to
enhance security. To reset the EcoStruxure
™
Power Device (EPD) user account
password, refer to Performing user account resets, page 77.
NOTE: The Bluetooth user account password does not expire.
Display passcode
NOTICE
UNAUTHORIZED ACCESS TO THE DEVICE
Set a display passcode to help reduce the risk of unauthorized physical access
to the meter.
Failure to follow these instructions can result in data loss or changes to
the device configuration.
NOTICE
IRRECOVERABLE DISPLAY PASSCODE
Record your display passcode in a secure location.
Failure to follow these instructions can result in data loss.
It is recommended to enable the display passcode during initial configuration. The
display passcode for accessing the configuration screen must be a 6-digit numeric
value between 000000 and 999999:
See Configuring the display passcode, page 59 for instructions on how to change
the display passcode.
5.7 Hardening
Recommendations to optimize cybersecurity in a protected environment:
• Review assumptions about protected environments and address potential
risks and mitigation strategies.
• Change the display passcode. See Configuring the display passcode, page
59 for details.
• Bluetooth user account locking: protection against repeated unauthorized
access attempts.
• Enable the write protection to disable all Modbus and BACnet/IP write
operations and configuration changes.
• Least functionality principle can be applied to prohibit and restrict the use of
unnecessary functions, protocols, or services.
• Disable communication protocol ports when they are not in use. This helps
reduce the attack surface.
• Regularly download the Certificate Revocation List (CRL) regularly from the
Schneider Electric security server and install it in the Microsoft Certificate
Store to maintain secure communication and validate certificate authenticity.
7EN02-0489-00 55
5. Cybersecurity PowerLogic
™
Intuitive PM7100 / PM7200 / PM7300 series

5.8 Bluetooth pairing and device recognition
The meter supports pairing with only one mobile application at a time. You can
disconnect the paired device either through the meter display or the mobile
application.
5.9 Enabling and disabling communication protocols
Using the display
See Configuring the serial communications, page 64 for instructions on how to
change the serial settings for your meter.
See Configuring the Ethernet communications, page 65 for instructions on how to
enable/disable Modbus TCP, DPWS, IPv4 and IPv6 settings for your meter.
See Configuring the BACnet/IP settings, page 67 for instructions on how to
change the BACnet/IP settings for your meter.
See Configuring Bluetooth, page 68 for instructions on how to change the
Bluetooth settings for your meter.
Using the PowerLogic™ Engineering Suite
See the PowerLogic™ Engineering Suite configuration guide (7EN02-0505) for
instructions on how to enable/disable communication protocols for your meter.
5.10 Reporting a security incident or vulnerability
To report suspicious activity or a cybersecurity incident, go to the Schneider
Electric Report an Incident website.
To report a security vulnerability affecting your product or solution, go to the
Schneider Electric Report a Vulnerability website.
5.11 Firmware upgrades
When meter firmware is upgraded - security configuration remains the same until
changed, including user accounts and display passcode. It is recommended to
review security configuration after an upgrade to analyze privileges for new or
changed device features and revoke or apply them according to your company
policies and standards.
Use the Modbus interface to perform the firmware upgrade.
Refer to the PowerLogic™ Engineering Suite configuration guide (7EN02-0505)
for the firmware upgrade procedure.
5.12 Secure disposal guidelines
Use the Secure disposal checklist when disposing a device to help prevent
potential disclosure of data.
56 7EN02-0489-00
PowerLogic
™
Intuitive PM7100 / PM7200 / PM7300 series 5. Cybersecurity

5.12.1 Secure disposal checklist
• Record activities: Document disposal actions according to your company
policies and standards to keep a record of activities.
• Decommission related rules and sanitize records:
◦ Follow decommission and sanitization tasks as described by your
organization or contact your network administrator.
◦ Decommission network and security rules, for example, a firewall rule that
could be used to get past the firewall.
◦ Perform records tracking sanitization tasks to remove records in related
systems, for example, monitoring SNMP servers.
• Disposal and reuse: See Disposal and reuse, page 57 for more information.
5.12.1.1 Disposal and reuse
Before removing the device from its intended environment, follow the Secure
disposal guidelines in this document.
Follow device removal tasks described by your organization or contact your
network administrator to determine a responsible method of disposal.
Dispose the device according to the legislation of the country. Some regulatory
organizations include:
• The United States Environmental Protection Agency (EPA) for guidance on
the sustainable management of electronics.
◦ The EPA provides an Electronic Product Environmental Assessment Tool
(EPEAT) that helps assess the environmental attributes of electronics.
• The European Waste Electrical & Electronic Equipment Directive (WEEE
Directive) is the Community directive on Waste Electrical and Electronic
Equipment.
• The European Restriction of Hazardous Substances Directive (RoHS)
directive on the restriction of the use of certain hazardous substances in
electrical and electronic equipment.
NOTICE
UNAUTHORIZED OR UNINTENDED ACCESS TO CONFIDENTIAL DATA
• Store devices that are not in service in an access-controlled or monitored
location.
• Physically destroy devices that are decommissioned.
Failure to follow these instructions can result in unauthorized or
unintended access to sensitive or secure customer data.
Device disposal
It is recommended that the entire device is physically destroyed. Destroying the
device helps prevent potential disclosure of data contained in the device that was
not removed.
Device reuse
Store the device in a location that is access controlled or monitored if there is
potential for reuse.
7EN02-0489-00 57
5. Cybersecurity PowerLogic
™
Intuitive PM7100 / PM7200 / PM7300 series

6. Configuring
6.1 Configuring using the display
6.1.1 Enabling or disabling the display passcode during initial
startup
During device startup, you can enable or disable the display passcode to control
access to the Settings screen.
NOTE: You can enable the display passcode during initial device startup or
later from the Settings screen.
NOTICE
UNAUTHORIZED ACCESS TO THE DEVICE
Set a display passcode to help reduce the risk of unauthorized physical access
to the meter.
Failure to follow these instructions can result in data loss or changes to
the device configuration.
NOTICE
IRRECOVERABLE DISPLAY PASSCODE
Record your display passcode in a secure location.
Failure to follow these instructions can result in data loss.
To enable or disable the display passcode during initial startup:
1. Power on the meter.
2. To enable the display passcode protection:
a. When prompted with For device operation security, set a display
passcode to access product settings., select Yes and press OK.
b. Set and confirm a new 6-digit display passcode (between 000000 and
999999), and then press OK.
NOTE:
The display passcode:
• Must contain at least two different digits (for example, 111111 is
invalid; 911111 is valid).
• Must not use sequential digits in ascending or descending order
(for example, 345678 and 876543 are invalid).
The display passcode is set. Use the display passcode to access the
Settings screen.
3. To disable the display passcode protection:
a. Scroll to No, and press OK.
NOTE: You can enable the display passcode later from the Settings
screen. See Configuring the display passcode, page 59 for
instructions on how to enable the display passcode.
The display passcode protection is disabled. Users can access Settings
screen without a passcode.
58 7EN02-0489-00
PowerLogic
™
Intuitive PM7100 / PM7200 / PM7300 series 6. Configuring

6.1.2 Configuring the display passcode
Use the HMI setup screen to enable or disable the display passcode or to change
the passcode.
RECOMMENDATION: Enable or change the display passcode to help prevent
unauthorized access to protected screens, such as configuration, reset, and
revenue lock.
NOTICE
UNAUTHORIZED ACCESS TO THE DEVICE
Set a display passcode to help reduce the risk of unauthorized physical access
to the meter.
Failure to follow these instructions can result in data loss or changes to
the device configuration.
NOTICE
IRRECOVERABLE DISPLAY PASSCODE
Record your display passcode in a secure location.
Failure to follow these instructions can result in data loss.
To enable or disable the display passcode or to change the passcode:
1. Navigate to Settings.
2. If Display Passcode is Enabled, enter the Passcode, and then press OK.
3. Navigate to Configuration > HMI > Display Passcode and press OK.
4. Scroll through the parameters you need to modify, and then press OK.
Table 9 - Settings screen passcode
Parameter Values
Description
Passcode Status Enabled
Disabled
Enable or disable the display passcode to access the settings screen.
Change Passcode 000000 to 999999 This parameter is available only when the Passcode Status is enabled.
Set the 6-digit display passcode to access the meter settings screen.
6.1.3 Resetting the display passcode using the product reset
If the user forgets the display passcode, use the product reset to set a new display
passcode to access the Settings screen.
NOTE:
• Resetting the product restores user settings to factory defaults. The reset
does not affect energy counters.
• For MID/MIR meter models, if the meter has revenue lock enabled, you
cannot reset the display passcode.
7EN02-0489-00 59
6. Configuring PowerLogic
™
Intuitive PM7100 / PM7200 / PM7300 series

NOTICE
UNAUTHORIZED ACCESS TO THE DEVICE
Set a display passcode to help reduce the risk of unauthorized physical access
to the meter.
Failure to follow these instructions can result in data loss or changes to
the device configuration.
NOTICE
LOSS OF ACCESS TO METER CONFIGURATION
Store the display passcode and the revenue lock passcode in a secure location
for MID/MIR meter models.
Failure to follow these instructions can result in loss of access to the
meter configuration.
NOTICE
IRRECOVERABLE DISPLAY PASSCODE
Record your display passcode in a secure location.
Failure to follow these instructions can result in data loss.
To reset a forgotten display passcode using product reset:
1. Reboot the meter.
The meter initializes and displays the home screen.
2. Within 10 seconds after the summary screen appears, press and hold
and
OK for 3 seconds.
The Reset Settings screen appears and displays the message Do you want
to perform product reset?.
3. Select Yes and press OK.
A confirmation screen appears and displays the message Product reset will
permanently delete all settings. This action cannot be undone.
Continue?.
4. Select Yes and press OK.
The Product reset in progress... screen appears.
5. When prompted with For device operation security, set a display
passcode to access product settings., select Yes and press OK.
6. Set and confirm a new 6-digit display passcode (between 000000 and
999999) and then press OK.
The display passcode is set. Use the display passcode to access the Settings
screen.
6.1.4 Configuring the basic setup parameters
Proper configuration of the meter’s basic setup parameters is essential for
accurate measurement and calculations. Use the Basic screen to configure the
basic meter parameters.
NOTE: If the standard (1-sec) alarms have been configured and you make
subsequent changes to the meter’s basic setup, all alarms are disabled to
prevent undesired alarm operation.
60 7EN02-0489-00
PowerLogic
™
Intuitive PM7100 / PM7200 / PM7300 series 6. Configuring
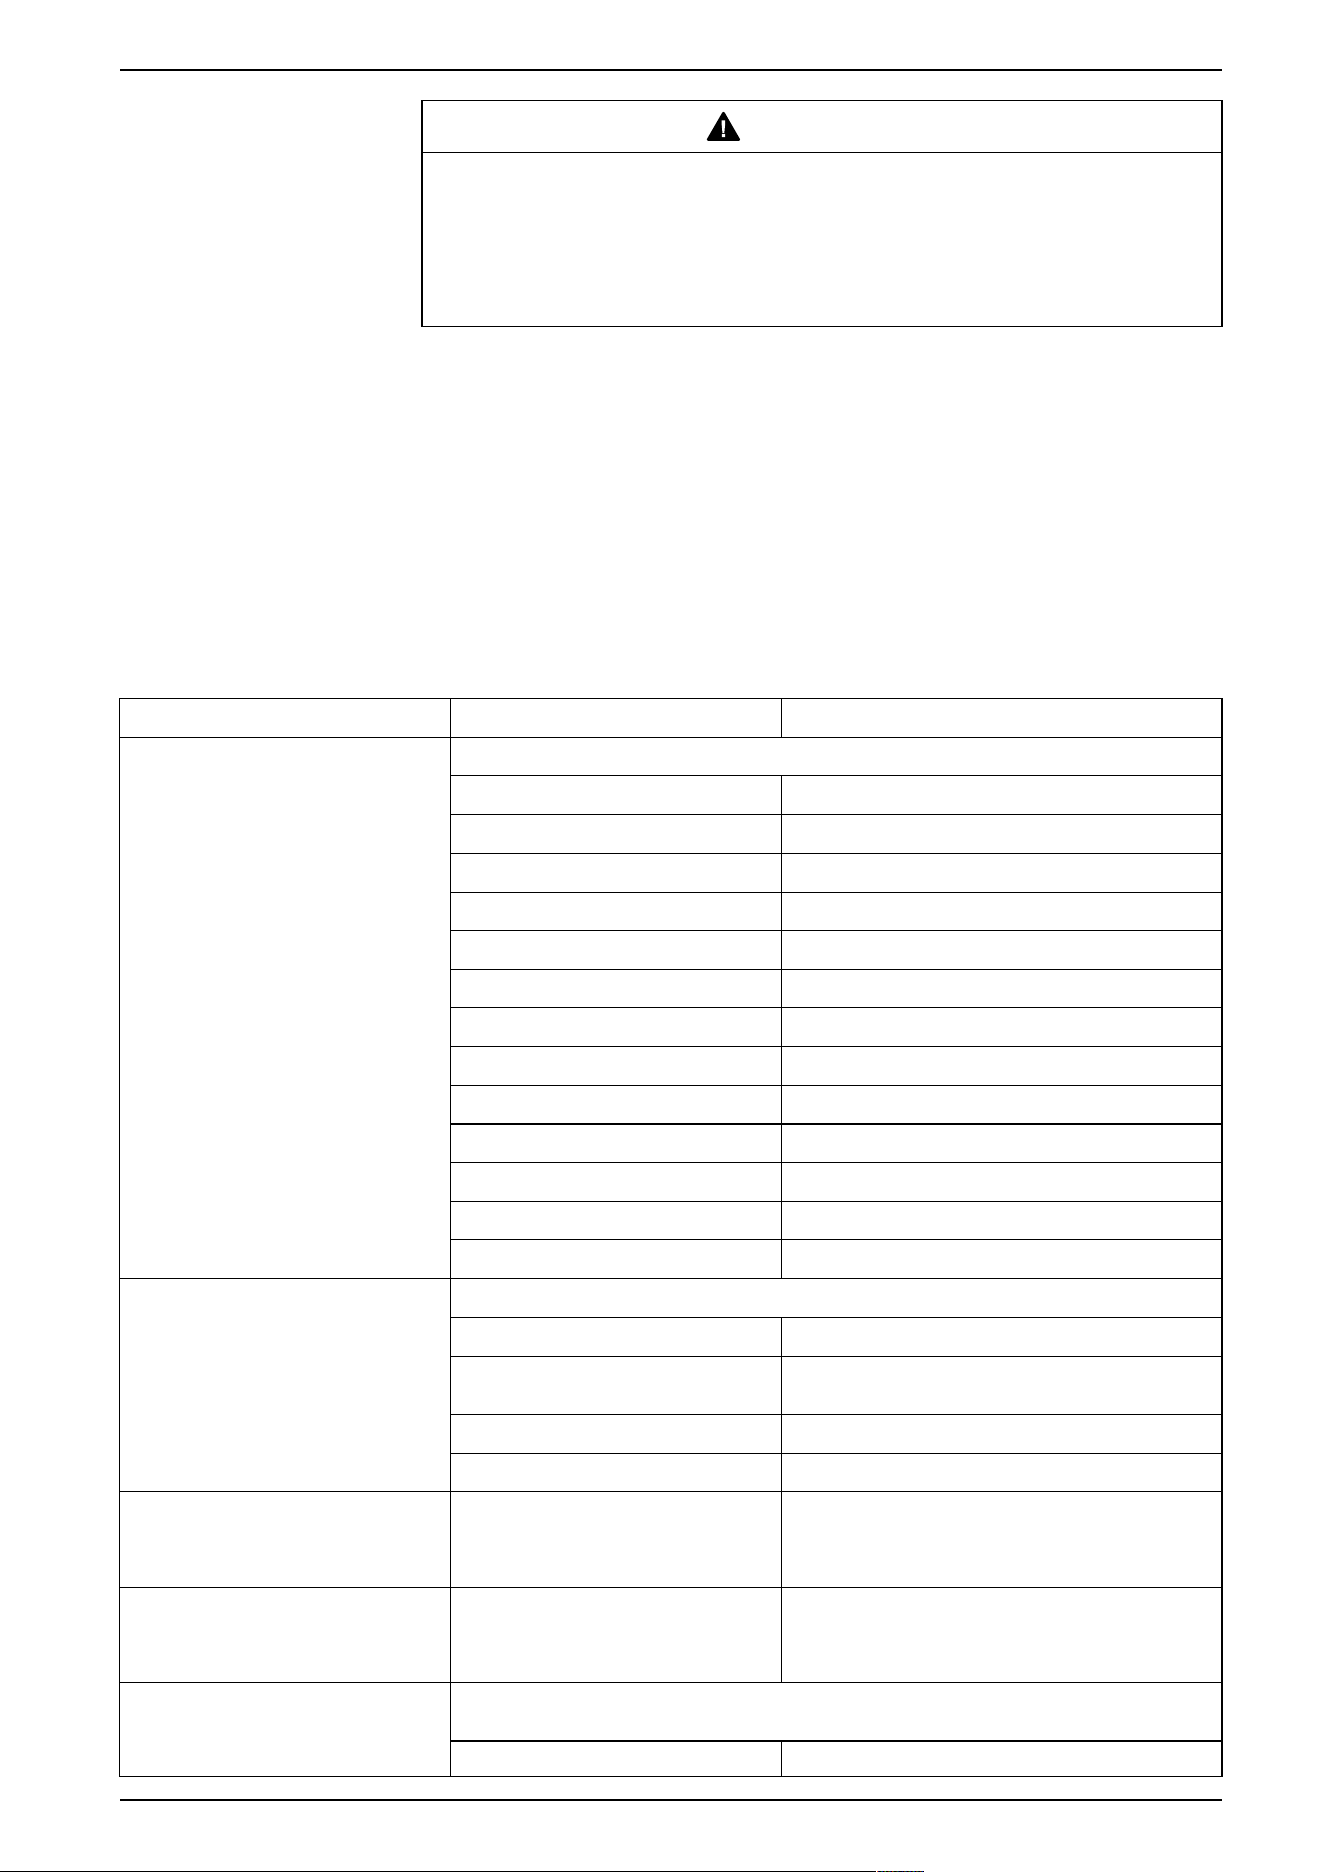
WARNING
UNINTENDED EQUIPMENT OPERATION
• Verify that all standard alarms settings are correct and adjust, as necessary.
• Re-enable all configured alarms.
Failure to follow these instructions can result in death, serious injury, or
equipment damage.
After saving the changes, confirm that all configured standard alarm settings are
still valid, reconfigure them as required, and then re-enable the alarms.
To configure the basic setup parameters:
1. Navigate to Settings.
2. If Display Passcode is Enabled, enter the Passcode, and then press OK.
3. Navigate to Configuration > Meter > Basic.
4. Scroll through the parameters you need to modify, and then press OK.
5. Scroll through the options and press OK to confirm the new setting.
Table 10 - Basic setup parameter settings (Voltage and current measurement circuits)
Parameter Values Description
Power System
Select the power system type (power transformer) the meter is wired to.
1PH2W LN
Single-phase 2-wire line-to-neutral.
1PH2W LL
Single-phase 2-wire line-to-line.
1PH3W LL with N
Single-phase 3-wire line-to-line with neutral.
3PH3W Dlt Ungnd 3-phase 3-wire ungrounded delta.
3PH3W Dlt Crnr Gnd
3-phase 3-wire corner grounded delta.
3PH3W Wye Ungnd 3-phase 3-wire ungrounded wye.
3PH3W Wye Gnd 3-phase 3-wire grounded wye.
3PH3W Wye Res Gnd 3-phase 3-wire resistance-grounded wye.
3PH4W Opn Dlt Ctr Tp 3-phase 4-wire center-tapped open delta.
3PH4W Dlt Ctr Tp 3-phase 4-wire center-tapped delta.
3PH4W Wye Ungnd 3-phase 4-wire ungrounded wye.
3PH4W Wye Gnd (Default) 3-phase 4-wire grounded wye.
3PH4W Wye Res Gnd 3-phase 4-wire resistance-grounded wye.
VT Connect
Select how many voltage transformers (VT) are connected to the electrical power system.
Direct Connect (Default)
Direct connect. No VTs are used.
1 VT
1 voltage transformer for single-phase power system
type.
Delta 2 VT
Delta 2 voltage transformers.
Wye 3 VT Wye 3 voltage transformers.
VT Primary
20 to 1000000
Default: 120
NOTE: Applies only when VT Connect is
selected to DELTA 2 VT or WYE 3 VT.
Enter the size of the VT primary, in Volts.
VT Secondary
20 to 690
Default: 120
NOTE: Applies only when VT Connect is
selected to DELTA 2 VT or WYE 3 VT.
Select the size of the VT secondary, in Volts.
CT on Terminal
Define how many current transformers (CT) are connected to the meter, and to which terminals
they are connected.
I1 1 CT connected to I1 terminal
7EN02-0489-00 61
6. Configuring PowerLogic
™
Intuitive PM7100 / PM7200 / PM7300 series

Table 10 - Basic setup parameter settings (Voltage and current measurement circuits) (Continued)
Parameter Values Description
I2 1 CT connected to I2 terminal
I3 1 CT connected to I3 terminal
I1 I2
2 CT connected to I1, I2 terminals
I2 I3
2 CT connected to I2, I3 terminals
I1 I3
2 CT connected to I1, I3 terminals
I1 I2 I3 (Default)
3 CT connected to I1, I2, I3 terminals
CT Primary
1 to 32767
Default: 5
Enter the size of the CT primary, in Amps.
CT Secondary
1
5
Default: 5
Select the size of the CT secondary, in Amps.
Nominal Frequency
50
60
Default: 50
Select the frequency of the electrical power system,
in Hertz.
Phase Rotation
ABC
CBA
Default: ABC
Select the phase rotation of the 3-phase system.
NOTE: Configure the VT nominal and CT nominal settings using PowerLogic™ Engineering Suite.
6. Press Back to display the Apply settings screen.
7. Select Yes, apply and press OK to apply the settings.
6.1.5 Configuring the advanced setup parameters
Use the Advanced screen to configure the load timer setpoint and peak current
demand.
To configure the advanced setup parameters:
1. Navigate to Settings.
2. If Display Passcode is Enabled, enter the Passcode, and then press OK.
3. Navigate to Configuration > Meter > Advanced.
4. Scroll through the parameters you need to modify, and then press OK.
5. Scroll through the options and press OK to confirm the new setting.
Table 11 - Advanced setup parameter settings
Parameter Values Description
Label
—
Read-only. Use the PowerLogic™ Engineering Suite configuration tool to change
the meter label.
Load Timer Setpt
0 to 10 x CT ratio
Default: 5
Set the minimum average load current in Amps required to start the timer. The
meter counts the number of seconds the load timer is ON when the measured
current is equal to or greater than this value.
Pk I dmd for TDD
0 to 10 x CT ratio
Default: 0
Set the minimum peak load current demand in Amps required for inclusion in total
demand distortion (TDD) calculations. When the load current is below this
demand threshold, the meter does not use the readings to calculate TDD. Set this
value to “0” (zero) to use the metered peak current demand for the calculation.
6. Press Back to display the Apply settings screen.
62 7EN02-0489-00
PowerLogic
™
Intuitive PM7100 / PM7200 / PM7300 series 6. Configuring

7. Select Yes, apply and press OK to apply the settings.
6.1.6 Configuring the demand calculations
Use the Demand screen to configure the power, current, and input metering
demands. Demand is a measure of average consumption over a fixed time
interval.
For information about demand, see Demand measurements, page 121.
To configure the demand calculations:
1. Navigate to Settings.
2. If Display Passcode is Enabled, enter the Passcode, and then press OK.
3. Navigate to Configuration > Meter > Demand.
4. Scroll through the parameters you need to modify, and then press OK.
5. Scroll through the options and press OK to confirm the new setting.
NOTE:
• You cannot configure the relay outputs for demand setup.
• You can configure the same digital input to support power demand,
current demand, and input demand.
Table 12 - Demand calculation setup parameter settings
Parameter Values Description
Power Demand
Current Demand
Input Demand
Method
Thermal
Timed Sliding
Block
Timed Block
(Default)
Timed Rolling
Block
Input Sync Block
Input Sync Roll
Block
Cmd Sync Block
Cmd Sync Roll
Block
Clock Sync Block
Clock Sync Roll
Block
Select the appropriate demand calculation method.
Interval
1 to 60
Default: 15
Set the demand interval, in minutes. For clock synchronization
methods, specify an interval that divides 1440 minutes (24x60)
evenly.
Subinterval
1 to 60
Default: 15
NOTE: Applies only to Timed Rolling Block, Input Sync Roll
Block, Cmd Sync Roll Block and Clock Sync Roll Block
methods.
Define the number of subintervals to divide demand interval
equally, in minutes.
Digital Output
NONE (Default)
Digital Output D1
Digital Output D2
Select the digital output to send the end of demand interval pulse.
7EN02-0489-00 63
6. Configuring PowerLogic
™
Intuitive PM7100 / PM7200 / PM7300 series

Table 12 - Demand calculation setup parameter settings (Continued)
Parameter Values Description
Digital Input
NONE (Default)
Digital Input S1
Digital Input S2
Digital Input S3
Digital Input S4
NOTE: Applies only to Input Sync Block and Input Sync Roll
Block methods.
Select the digital input used to synchronize demand.
Clock Sync Time
0 to 23:59 HH:MM
NOTE: Applies only to Clock Sync Block and Clock Sync
Roll Block methods (these synchronize the demand interval
to the meter’s internal clock).
Define the time-of-day to synchronize the demand, from the start of
the day. For example, set this setting to 0730 to synchronize
demand at 7:30 AM.
NOTE: Clock sync time is common for Current Demand,
Power Demand, and Input Demand.
6. Press Back to display the Apply settings screen.
7. Select Yes, apply and press OK to apply the settings.
6.1.7 Configuring the serial communications
Available only in specific models.
Use the Serial setup screen to configure the RS-485 communication to use
software to access the meter’s data or configure the meter remotely.
For information about serial communications, see Configuring the serial
communications, page 64.
To configure the serial communications:
1. Navigate to Settings.
2. If Display Passcode is Enabled, enter the Passcode, and then press OK.
3. Navigate to Configuration > Communication > Serial.
4. Scroll through the parameters you need to modify, and then press OK.
5. Scroll through the options and press OK to confirm the new setting.
Table 13 - Serial communication settings
Parameter Values Description
Modbus RTU
Disabled
Enabled
Default: Enabled
Enable or disable the Modbus communication.
Modbus Write
Protection
Disabled
Enabled
Default: Disabled
Enable or disable the Modbus write protection.
Address
1 to 247
Default: 1
Set a unique address for the device within the communications loop.
64 7EN02-0489-00
PowerLogic
™
Intuitive PM7100 / PM7200 / PM7300 series 6. Configuring

Table 13 - Serial communication settings (Continued)
Parameter Values Description
Baud Rate
38400
19200
9600
4800
Default: 19200
Select the data transmission speed. The baud rate must be the same for all
devices in the communications loop.
Parity
Even
Odd
None With One
None With Two
Default: Even
Select the parity mode. Select None With One or None With Two if the parity bit
is not used. Use the same parity setting for all devices in the communication loop.
6. Press Back to display the Apply settings screen.
7. Select Yes, apply and press OK to apply the settings.
6.1.8 Configuring the Ethernet communications
Available only in specific models.
Use the Ethernet setup screen to assign the meter a unique IP address to use
software to access the meter’s data or configure the meter remotely.
NOTE:
• To enable network communication, the meter requires either IPv4 or IPv6.
By default, IPv6 is disabled. If you disable IPv4 without enabling IPv6, the
device cannot communicate on the network.
• Over Modbus TCP, the Unit ID supports the values 1 and 255.
For information about Ethernet communications, see Configuring the Ethernet
communications, page 65.
Prerequisites:
Obtain the meter’s IP address information from your network administrator or IT
department. For more information about managing IPv4 address conflicts, refer
IPv4 address conflict detection, page 95.
NOTICE
LOSS OF COMMUNICATION ON THE NETWORK
• Assign a unique IP addresses to each device on the network.
• Avoid duplicate static IP address configurations.
• Configure only one active DHCP server per network segment.
• Verify the network configuration if repeated conflicts occur.
Failure to follow these instructions can result in an IP address conflict and
loss of communication on network.
To configure the Ethernet communications:
1. Navigate to Settings.
2. If Display Passcode is Enabled, enter the Passcode, and then press OK.
3. Navigate to Configuration > Communication > Ethernet.
4. Scroll through the parameters you need to modify, and then press OK.
5. Scroll through the options and press OK to confirm the new setting.
7EN02-0489-00 65
6. Configuring PowerLogic
™
Intuitive PM7100 / PM7200 / PM7300 series

Table 14 - Ethernet communication settings
Parameter Values Description
Modbus TCP
Disabled
Enabled
Default: Enabled
Enable or disable the Modbus TCP communication.
NOTE: Only authorized users can disable Modbus TCP communication
through the meter display.
Modbus Write
Protection
Disabled
Enabled
Default: Disabled
Enable or disable the Modbus write protection.
NOTE: Only authorized users can disable Modbus write protection through
the meter display.
MAC ID
—
Read-only. Displays the meter’s factory-programmed MAC address.
Device Name
—
Read-only. By default, the device name can be used as a DNS hostname that
maps to the IP address assigned by the DHCP server.
DPWS
Disabled
Enabled
Default: Enabled
Enable or disable the DPWS.
IPv4 Status
Disabled
Enabled
Default: Enabled
Enable or disable the IPv4 address.
IPv4 Filtering Status
Disabled
Enabled
Default: Disabled
Use the PowerLogic™ Engineering Suite configuration tool or the Modbus
command interface to enable IPv4 address filtering and assign the designated
level of access.
NOTE: You can disable this setting using the meter display.
IPv4 Mode
DHCP
BOOTP
Static
Default: Static
Select how the meter obtains its IPv4 address: DHCP, BOOTP, or Static.
DHCP: The meter acquires its IP address from your network’s DHCP server.
BOOTP: Uses Bootstrap Protocol.
Static: Uses the IPv4 address, subnet mask, and gateway that you manually
enter.
IPv4 Address 0 to 255
Set the IPv4 address of your meter. Example: 169.254.x.x, where x.x is derived
from the last two digits of the MAC address.
Contact your local network administrator for parameter values.
IPv4 Subnet Mask
0 to 255
Default: 255.255.255.0
Set the IPv4 subnet mask of your network.
Contact your local network administrator for parameter values.
IPv4 Gateway
0 to 255
Set the IPv4 gateway address of your network. Example: 169.254.x.x, where x.x
is derived from the last two digits of the MAC address
Contact your local network administrator for parameter values.
IPv6 Status
Disabled
Enabled
Default: Disabled
Enable or disable the IPv6 address.
IPv6 Filtering Status
Disabled
Enabled
Default: Disabled
Use the PowerLogic™ Engineering Suite configuration tool or Modbus command
interface to enable IPv6 address filtering and assign the designated level of
access.
NOTE: You can disable this setting using the meter display.
IPv6 Mode Static
Read-only. Mode through which the meter obtains its IPv6 address.
Static: Displays the previously configured IPv6 global address and IPv6 gateway
address from PowerLogic™ Engineering Suite. The link local address depends on
the MAC ID of the meter.
IPv6 Link Local
Address
—
Read-only. Displays the IPv6 link local address. Derived from the fe80::/64 prefix
and the MAC address. Assigned for communication between nodes on the same
link.
Example: fe80:0000:0000:0000:0280:67ff:fe90:e540
66 7EN02-0489-00
PowerLogic
™
Intuitive PM7100 / PM7200 / PM7300 series 6. Configuring

Table 14 - Ethernet communication settings (Continued)
Parameter Values Description
IPv6 Global Address
—
Read-only. Displays the IPv6 global address. Prefix 2001:0db8:85a3:0000::/64,
with the remaining 64 bits derived from the MAC address. Assigned for
communication across the Internet or large-scale networks.
Example: 2001:0db8:85a3:0000:0000:0080:6790:e540
IPv6 Gateway
—
Read-only. Displays the IPv6 gateway address.
Example: 2001:0db8:85a3:0000:0000:0000:0000:0001
6. Press Back to display the Apply settings screen.
7. Select Yes, apply and press OK to apply the settings.
6.1.9 Configuring the BACnet/IP settings
Available only in specific models.
Use the BACnet/IP screen to configure the BACnet/IP settings. Your meter
supports specific BACnet components and standard objects.
For information about supported BACnet/IP features, see Supported BACnet
features, page 97.
To configure the BACnet/IP settings:
1. Navigate to Settings.
2. If Display Passcode is Enabled, enter the Passcode, and then press OK.
3. Navigate to Configuration > Communication > BACnet/IP.
4. Scroll through the parameters you need to modify, and then press OK.
5. Scroll through the options and press OK to confirm the new setting.
Table 15 - BACnet/IP settings
Parameter Values Description
BACnet/IP
Disabled
Enabled
Default: Disabled
Enable or disable the BACnet/IP communication.
BACnet/IP Write
Protection
Disabled
Enabled
Default: Enabled
Enable or disable the BACnet/IP write protection.
Device ID
1 to 4194302
Default: A unique ID
derived from the device
serial number.
Enter the ID of the meter on your BACnet network. The ID must be unique on the
network.
UDP Port
1024 to 65355
Default: 47808
Enter the port the meter uses for BACnet/IP communications.
BBMD
Disabled
Enabled
Default: Disabled
Enable or disable the registration of the meter as a foreign device.
BBMD IP
0 to 255
Default:
000.000.000.000
Enter the IP address of the BACnet/IP Broadcast Management Device (BBMD), if
you use BBMD on your network.
Contact your local network administrator for parameter values.
7EN02-0489-00 67
6. Configuring PowerLogic
™
Intuitive PM7100 / PM7200 / PM7300 series

Table 15 - BACnet/IP settings (Continued)
Parameter Values Description
BBMD Port
1024 to 65355
Default: 47808
Enter the port number that is used for communications with the BBMD.
BBMD TTL
0 to 65355
Default: 600
Enter the length of time (in seconds) the BBMD keeps an entry for this device in its
foreign device table.
6. Press Back to display the Apply settings screen.
7. Select Yes, apply and press OK to apply the settings.
6.1.10 Configuring Bluetooth
Use Bluetooth screen to configure the Bluetooth communication.
Available only in specific models.
To enable Bluetooth using a shortcut, see Enabling Bluetooth, page 41.
NOTE:
• By default, the Bluetooth communication is Disabled.
• The meter supports pairing with only one mobile application at a time. You
can disconnect the paired device either through the meter display or the
mobile application.
• Keep the mobile device within 3 m (10 ft) of the meter and in the same
electrical room for Bluetooth communication.
To configure the Bluetooth:
1. Navigate to Settings.
2. If Display Passcode is Enabled, enter the Passcode, and then press OK.
3. Navigate to Configuration > Communication > Bluetooth.
4. Select Bluetooth, scroll to Enabled, and press OK to activate Bluetooth.
Result: The Advertising option appears.
5. Scroll to Advertising and select Enabled to start Bluetooth Advertising.
6. Select Yes and then press OK to activate Bluetooth Advertising.
7. Press OK to continue.
Result: The Bluetooth icon in the upper-right corner of the meter display
blinks every second to show that the meter is available for pairing.
NOTE: The device is discoverable for only 180 seconds after Bluetooth
advertising is activated.
8. On your mobile device, enable Bluetooth.
9. Select the meter PM7••• from the device list on your mobile. Verify that the
PIN: XXXXXX displayed on the mobile is the same as the PIN displayed on
the meter.
10. On the meter, select Confirm and press OK. Then, on your mobile, select
Pair to start the pairing process.
Result: The Bluetooth icon stops blinking after pairing is completed. When
pairing is successful, the Advertising option on the meter display changes to
Pairing Status: Paired after 3 seconds.
NOTE: The pairing process may take approximately 30 seconds.
68 7EN02-0489-00
PowerLogic
™
Intuitive PM7100 / PM7200 / PM7300 series 6. Configuring
Table 16 - Bluetooth settings
Parameter Values Description
Bluetooth
Disabled
Enabled
Default: Disabled
Enable or disable Bluetooth.
Default Password
—
Read-only. A unique, factory-set Bluetooth user account password is displayed on
the meter. Use this password the first time you login to EcoStruxure™ Power
Device (EPD).
To help protect your meter, it is recommended to change the factory-set password
after the first login and update it periodically.
The unique, factory-set Bluetooth user account password remains visible on the
meter even after you change the EcoStruxure™ Power Device (EPD) password.
Advertising
Disabled
Enabled
Default: Disabled
Enable or disable Bluetooth advertising.
6.1.11 Configuring the alarm/energy pulsing LED
Use the LED screen to configure the meter LED for alarming or energy pulsing
applications.
For information about alarm/energy pulsing LED, see Configuring the alarm/
energy pulsing LED, page 69.
To configure the alarm/energy pulsing LED:
1. Navigate to Settings.
2. If Display Passcode is Enabled, enter the Passcode, and then press OK.
3. Navigate to Configuration > I/O > LED.
4. Scroll through the parameters you need to modify, and then press OK.
5. Scroll through the options and press OK to confirm the new setting.
Table 17 - Alarm/energy pulsing LED settings
Parameter Values
Description
OFF
—
Select OFF to disable the LED.
Alarms
—
Select Alarms to configure the LED for alarm notification. In this mode, the LED
flashes with a 1-second ON and 1-second OFF cycle.
Energy Select Energy to configure the LED for energy pulsing.
7EN02-0489-00 69
6. Configuring PowerLogic
™
Intuitive PM7100 / PM7200 / PM7300 series

Table 17 - Alarm/energy pulsing LED settings (Continued)
Parameter Values
Description
• Pulse Weight
1 to 9999999
Default: 1
Define the pulse weight for energy pulsing. This parameter specifies the number
of pulses sent to the LED for every 1 kWh, 1 kvarh or 1 kVAh of accumulated
energy.
NOTE: This setting is ignored when the LED mode is set to Alarms.
• Channel Active Del
Active Rec
Active Del + Rec
Reactive Del
Reactive Rec
Reactive Del + Rec
Apparent Del
Apparent Rec
Apparent Del + Rec
Default: Active Del
Select the accumulated energy parameter to monitor and use for LED energy
pulsing.
NOTE: This setting is ignored when the LED mode is set to Alarms.
6. Press Back to display the Apply settings screen.
7. Select Yes, apply and press OK to apply the settings.
6.1.12 Configuring the digital inputs
Digital inputs are typically used for monitoring the status of external contacts or
circuit breakers. Use the Digital Inputs screen to configure the digital inputs.
RECOMMENDATION:PowerLogic™ Engineering Suite to configure the digital
inputs, as setup parameters that require text entry can only be modified using
PowerLogic™ Engineering Suite.
For information about digital input applications, see Digital inputs, page 101.
To configure the digital inputs:
1. Navigate to Settings.
2. If Display Passcode is Enabled, enter the Passcode, and then press OK.
3. Navigate to Configuration > I/O > Digital Inputs.
4. Scroll through the parameters you need to modify, and then press OK.
5. Scroll through the options and press OK to confirm the new setting.
NOTE:
• A digital input can be associated with a single function: alarm,
demand, input metering or multi-tariff.
• A digital input can be associated with a supported combination, such
as demand and alarm, or tariff and alarm.
Table 18 - Digital input settings
Parameter Values
Description
Digital Input S1
Digital Input S2
Digital Input S3
Digital Input S4
Label
—
Read-only. Use the PowerLogic™ Engineering Suite
configuration tool to assign names to the digital
inputs.
Debounce Time
10 to 1000
Default: 10
Enter the debounce duration for which the external
signal must remain stable to be considered valid.
Allowable values are increments of 10 (example: 10,
20, 30 up to 1000 ms).
Debounce is the time delay that compensates for
mechanical contact bounce.
70 7EN02-0489-00
PowerLogic
™
Intuitive PM7100 / PM7200 / PM7300 series 6. Configuring

Table 18 - Digital input settings (Continued)
Parameter Values
Description
Control Mode
Normal (Default)
Read-only. Use PowerLogic™ Engineering Suite or
Modbus communication to select this mode if the
digital input operates as a normal input when it is
associated with a digital input alarm or not linked to
any other meter function. In this mode, the meter
counts and records the number of incoming pulses.
For information about digital input alarms, see Digital
alarms, page 104.
Demand Sync
Read-only. Use PowerLogic™ Engineering Suite or
Modbus communication to select this mode if the
digital input is associated to an input synchronization
demand function. The meter uses the incoming pulse
to align its demand period with the external source.
For information about input demand synchronization,
see Synchronized demand, page 122.
Multi-tariff
Read-only. Use PowerLogic™ Engineering Suite or
Modbus communication to select this mode if the
digital input is associated with the multi-tariff function.
For information about multi-tariff measurements, see
Multi-tariff, page 112.
Input Metering
Read-only. Use PowerLogic™ Engineering Suite or
Modbus communication to select this mode if the
digital input is associated with one of the input
metering channels. The meter counts and records the
number of incoming pulses and related consumption
data associated with the pulses.
For information about input metering measurements,
see Input metering, page 102.
6. Press Back to display the Apply settings screen.
7. Select Yes, apply and press OK to apply the settings.
6.1.13 Configuring the digital outputs
Available only in specific models.
Digital outputs are typically used in switching applications, for example, to provide
on/off control signals for switching capacitor banks, generators, and other external
devices and equipment. Use the Digital Outputs screen to configure the digital
outputs.
RECOMMENDATION: Use PowerLogic™ Engineering Suite to configure the
digital outputs, as setup parameters that require text entry can only be modified
using PowerLogic™ Engineering Suite.
For information about digital output applications, see Digital outputs, page 101.
To configure the digital outputs:
1. Navigate to Settings.
2. If Display Passcode is Enabled, enter the Passcode, and then press OK.
3. Navigate to Configuration > I/O > Digital Outputs.
4. Scroll through the parameters you need to modify, and then press OK.
5. Scroll through the options and press OK to confirm the new setting.
7EN02-0489-00 71
6. Configuring PowerLogic
™
Intuitive PM7100 / PM7200 / PM7300 series

Table 19 - Digital output settings
Parameter Values
Description
Digital Output D1
Digital Output D2
Label
—
Read-only. Use the PowerLogic™ Engineering Suite
configuration tool to assign names to the digital
outputs.
Control Mode
External (Default)
Select this mode if the digital output is controlled
remotely through PowerLogic™ Engineering Suite or
by a PLC using communication commands.
Demand Sync
Select this mode if the digital output is associated
with a demand function. The meter sends a pulse to
the digital output port at the end of each demand
interval.
Alarm
Select this mode if the digital output is associated
with an alarm. The meter sends a pulse to the digital
output port when the alarm is triggered.
Energy
Select this mode if the digital output is associated
with energy pulsing.
Behavior Mode
Normal (Default)
NOTE: When Control Mode is set to Energy,
the Behavior Mode is fixed to Normal.
Select this mode when the control mode is set
toExternal or Alarm. In External mode, the digital
output remains ON until an OFF command is sent by
the computer or PLC. In Alarm mode, the digital
output remains ON until the drop-out point is crossed.
Timed
NOTE: When Control Mode is set to Demand
Sync, the Behavior Mode is fixed to Timed.
Select this mode for the digital output to remain ON
for the duration specified in the time setup register.
Coil-Hold
Select this mode when the control mode is set to
External or Alarm. For a unary alarm associated with
a digital output, set Behavior Mode to Coil-Hold.
The output turns ON when the “energize” command is
received and turns OFF when the “coil hold release”
command is received. After a control power loss, the
output restores its previous state.
On-Time
1 to 9999
Default: 1
NOTE: Applies when Behavior Mode is set to
Timed.
Set the pulse width duration (ON time) in seconds. In
energy mode, the ON time for the digital output pulse
is fixed at 20 ms.
Demand System
Power (Default)
Current
Input Metering
NOTE: Applies when Control Mode is set to
Demand-Sync.
Select the demand system to monitor.
Alarms All available alarms
NOTE: Applies when Control Mode is set to
Alarm.
Select one or more alarms to monitor.
Pulse per k_h
1 to 9999999
Default: 1
NOTE: Applies when Control Mode is set to
Energy.
Define how many pulses are sent to the LED for
every 1 kWh, 1 kvarh or 1 kVAh of accumulated
energy.
72 7EN02-0489-00
PowerLogic
™
Intuitive PM7100 / PM7200 / PM7300 series 6. Configuring

Table 19 - Digital output settings (Continued)
Parameter Values
Description
Channel
Active Del (Default)
Active Rec
Active Del + Rec
Reactive Del
Reactive Rec
Reactive Del + Rec
Apparent Del
Apparent Rec
Apparent Del + Rec
Select the accumulated energy parameter to monitor
and use for LED energy pulsing.
Pulse Width
20
25
50
100
Default: 20
Select the pulse width duration in milliseconds.
6. Press Back to display the Apply settings screen.
7. Select Yes, apply and press OK to apply the settings.
6.1.14 Configuring the relay outputs
Available only in specific models.
Relay outputs can be configured to be used in switching applications. Use the
Relay Outputs screen to configure the relay outputs.
RECOMMENDATION: Use PowerLogic™ Engineering Suite to configure the
relay outputs, as setup parameters that require text entry can only be modified
using software.
For information about relay output applications, see Relay outputs, page 102.
To configure the relay outputs:
1. Navigate to Settings.
2. If Display Passcode is Enabled, enter the Passcode, and then press OK.
3. Navigate to Configuration > I/O > Relay Outputs.
4. Scroll through the parameters you need to modify, and then press OK.
5. Scroll through the options and press OK to confirm the new setting.
Table 20 - Relay output settings
Parameter Values
Description
Relay Output R1
Relay Output R2
Label
—
Read-only. Use the PowerLogic™ Engineering Suite
configuration tool to assign names to the relay
outputs.
Control Mode
External (Default)
Select this mode if the relay output is controlled
remotely through PowerLogic™ Engineering Suite or
by a PLC using communication commands.
Alarm
Select this mode if the relay output is associated with
an alarm. The meter sends a pulse to the relay output
port when the alarm is triggered.
Behavior Mode
Normal (Default)
Select this mode when the control mode is set to
External or Alarm. In External mode, the relay
7EN02-0489-00 73
6. Configuring PowerLogic
™
Intuitive PM7100 / PM7200 / PM7300 series

Table 20 - Relay output settings (Continued)
Parameter Values
Description
output is closed state until an open command is sent
by the computer or PLC. In Alarm mode, remains in
the closed state until the drop-out point is crossed.
Timed
Select this mode for the relay output to remain ON for
the duration specified in the time setup register.
Coil-Hold
Select this mode when the control mode is set to
External or Alarm. For a unary alarm associated with
a relay output, set Behavior Mode to Coil-Hold. The
output turns ON when the “energize” command is
received and turns OFF when the “coil hold release”
command is received. After a control power loss, the
output restores its previous state.
On-Time
1 to 9999
Default: 1
NOTE: Applies when Behavior Mode is set to
Timed.
Set the pulse width duration (ON time) in seconds. In
energy mode, the ON time for the relay output pulse
is fixed at 20 ms.
Alarms All available alarms
Select one or more alarms to monitor.
Applies when Control Mode is set to Alarm.
6. Press Back to display the Apply settings screen.
7. Select Yes, apply and press OK to apply the settings.
6.1.15 Configuring the display settings
Use the HMI setup screen configure the display screen settings such as
brightness, type of average voltage, and standard convention (IEC or IEEE).
NOTE: Average voltage feature (V Avg. Mode) is not available in MID/MIR
meter models.
To configure the display settings:
1. Navigate to Settings.
2. If Display Passcode is Enabled, enter the Passcode, and then press OK.
3. Navigate to Configuration > HMI > Display.
4. Scroll through the parameters you need to modify, and then press OK.
5. Scroll through the options and press OK to confirm the new setting.
Table 21 - Display settings
Parameter Values
Description
Brightness
10 (Dimmest) to 100
(Brightest)
Default: 80
Adjust the value to change the display brightness.
V Avg. Mode
Auto (Default)
Set this mode to Auto to display the Vavg on the summary screen as either the
average line-to-line or line-to-neutral voltage, based on the wiring configuration.
Voltage L-L
Set this mode to Voltage L-L to display the Vavg on the summary screen as line-
to-line voltage.
Line-to-line voltage: max 690 V L-L. If the selected wiring configuration does not
have line-to-line voltage to be measured, the Vavg parameter on the summary
screen shows a sequence of asterisks (*****).
Voltage L-N
Set this mode to Voltage L-N to display the Vavg on the summary screen as line-
to-neutral voltage.
Line-to-neutral voltage: max 400 V L-N.
74 7EN02-0489-00
PowerLogic
™
Intuitive PM7100 / PM7200 / PM7300 series 6. Configuring

Table 21 - Display settings (Continued)
Parameter Values
Description
If the selected wiring configuration does not have line-to-neutral voltage to be
measured, the Vavg parameter on the summary screen shows a sequence of
asterisks (*****).
Device Mode
IEC
IEEE
Default: IEC
Select the standards convention for displaying menu names or meter data.
Backlight Timeout
0 to 60
Default: 15
Set the duration (in minutes) after which the screen turns off due to inactivity.
6.1.16 Configuring the regional settings
Use the HMI setup screen to configure the regional settings such as language for
the meter to display.
To configure the regional settings:
1. Navigate to Settings.
2. If Display Passcode is Enabled, enter the Passcode, and then press OK.
3. Navigate to Configuration > HMI > Regional Settings.
4. Press OK to continue.
5. Scroll through the options and press OK to confirm the new setting.
Table 22 - Regional settings
Parameter Values
Description
Language
English (US) (Default)
Spanish
Francais
Italiano
Portugues
German
Russian
Chinese
Hebrew
Select the language for the meter display.
NOTE: To reset the meter to the default language (English (US)), press and
hold the Back and OK buttons for 5 seconds.
6. Select Yes, apply and press OK to apply the settings.
6.1.17 Configuring date and time
Use the Date & Time screen to configure the date and time.
To configure date and time:
1. Navigate to Settings.
2. If Display Passcode is Enabled, enter the Passcode, and then press OK.
3. Navigate to Configuration > Date & Time.
4. Scroll through the parameters you need to modify, and then press OK.
5. Scroll through the options and press OK to confirm the new setting.
7EN02-0489-00 75
6. Configuring PowerLogic
™
Intuitive PM7100 / PM7200 / PM7300 series
Table 23 - Date and time settings
Parameter Values
Description
Date Format
DD.MM.YY
MM.DD.YY (Default)
YY.MM.DD
Set the date to be displayed in DD.MM.YY or MM.DD.YY or YY.MM.DD format.
Date
—
Read-only. Date displayed as per the date format selected.
Time Format
24-Hour (Default)
12-Hour
Set the time to be displayed in 24-Hour or 12-Hour (AM/PM) format.
Time
—
Read-only. Time displayed as per the time format selected.
Time Zone
GMT (Default)
Local
Select GMT or Local.
GMT Offset ±HH.0
Set the GMT offset between ±00.0 and ±12.0. Applies only when meter Time
Zone is set to Local.
6.1.18 Performing global resets
Use the Reset screen for performing the global reset to clear the meter
initialization, energy values, demand values, minimum/maximum values, alarm
counters and logs, I/O counters and logs, and input metering values.
For information about global resets, see Meter resets, page 103.
To perform global resets:
1. Navigate to Settings.
2. If Display Passcode is Enabled, enter the Passcode, and then press OK.
3. Navigate to Reset > Global Resets.
4. Scroll through the parameters you need to reset, and then press OK.
5. Select Reset and press OK to confirm.
Table 24 - Global resets
Parameter
Description
Meter Initialization
Clears all partial energy, demand, min/max values, data logs, alarm logs and counters, I/O counters and
timers, and load operation timer.
It is common practice to initialize the meter after its configuration is completed, before adding it to an energy
management system.
After configuring all the meter setup parameters, navigate through the different meter display screens and
make sure the displayed data is valid, then perform meter initialization.
Energies Clears all partial accumulated energy values.
Demands
Clears all power, current and input metering demands.
Min/Max Clears all minimum and maximum values.
Alarm Counters and
Logs
Clears all alarm event queues, alarm history, alarm counts and logs.
I/O Counts & Logs
Clears all I/O counters and timers.
Input Metering Clears all input metering data.
6.1.19 Performing single resets
Use the Reset screen to clear data in a specific register or register type.
76 7EN02-0489-00
PowerLogic
™
Intuitive PM7100 / PM7200 / PM7300 series 6. Configuring
Single resets are often combined to allow you to clear all data of a similar type, for
example, a kWh, kvar, and kVA reset may be combined into an energy reset that
clears all the meter’s energy logs.
For information about single resets, see Meter resets, page 103.
To perform single resets:
1. Navigate to Settings.
2. If Display Passcode is Enabled, enter the Passcode, and then press OK.
3. Navigate to Reset > Single Resets.
4. Scroll through the parameters you need to reset, and then press OK.
5. Select Reset and press OK to confirm.
Table 25 - Single resets
Parameter Values
Description
Partial Energy
Accumulated
Clears all accumulated energy values (kWh, kvarh, kVAh).
Demand
Power
Current
Input Metering
Select the demand registers to clear (power demand, current demand, or input
metering demand).
Alarms
Event Queue
Clears the alarm event queue register (active alarms list).
History Log Clears the alarm history log.
Counters Select the alarm counter to clear.
Digital Inputs
Timer
Select the digital input timer to clear (chose all or individual digital input timers).
Counters
Select the digital input counter to clear (chose all or individual digital input timers)
Digital Outputs
Timer
Select the digital output timer to clear (chose all or individual digital output timers).
Counters
Select the digital output counter to clear (chose all or individual digital output
timers).
Active Load Timer
—
Clears and restarts the load operation timer.
Multi-Tariff
—
Clears accumulated values in all tariff registers.
Input Metering
All Input Meters
Input Meter Ch1
Input Meter Ch2
Input Meter Ch3
Input Meter Ch4
Select the input metering channel to clear (chose all or individual input metering
channels).
6.1.20 Performing user account resets
Use the Reset screen to reset the EcoStruxure
™
Power Device (EPD) user
account password to its factory default value.
NOTE: Available only in meter models with Bluetooth.
To perform user account resets:
1. Navigate to Settings.
2. If Display Passcode is Enabled, enter the Passcode, and then press OK.
3. Navigate to Reset > User Account Resets.
4. Press OK and select Reset to confirm resetting the EcoStruxure
™
Power
Device (EPD) user account password to its factory default value.
7EN02-0489-00 77
6. Configuring PowerLogic
™
Intuitive PM7100 / PM7200 / PM7300 series

6.1.21 Locking or unlocking revenue meter
Use the Revenue Lock screen to configure the revenue meter. The meter
protects revenue-related settings and metrologically relevant parameters with a
revenue lock through the display. After you initialize the meter, you must lock it to
confirm to MID/MIR standards.
NOTE:
• The revenue lock or unlock is performed only through the meter display.
• Revenue lock screen is available only in MID/MIR meter models.
• There is no default revenue lock passcode. The revenue lock passcode is
set by the user when the meter is first revenue-locked, usually after the
initial meter configuration is completed. You can set a new passcode for
future revenue-lock operations during the unlock or lock process.
Prerequisites:
Before you lock your meter:
• Make sure that you have completed all necessary configuration.
• Perform a meter initialization reset to clear any previously accumulated meter
data.
A lost revenue lock passcode cannot be recovered.
NOTICE
REVENUE LOCK PASSCODE IRRECOVERABLE
• Record your revenue lock passcode information in a secure location to avoid
losing access to revenue-related configuration screen.
• Use the same revenue lock passcode to unlock the meter.
Failure to follow these instructions can result in data loss and loss of
access to product configuration.
NOTICE
LOSS OF ACCESS TO METER CONFIGURATION
Store the display passcode and the revenue lock passcode in a secure location
for MID/MIR meter models.
Failure to follow these instructions can result in loss of access to the
meter configuration.
For information about revenue lock meters, see Overview, page 139.
To lock or unlock revenue meter:
1. Locking the revenue meter:
a. Navigate to Settings.
b. If Display Passcode is Enabled, enter the Passcode, and then press
OK.
c. Navigate to Revenue Lock and press OK.
d. Press OK and select Locked to enable the revenue lock setting.
e. Set the 6-digit revenue lock Passcode (between 000000 and 999999),
and then press OK.
NOTE: Make sure you record this revenue lock Passcode and store it
in a secure place. Each time you set a revenue lock passcode for a
meter, you must use that same passcode to unlock it.
f. Select Yes and press OK to confirm the revenue lock metering setup and
commands.
A lock icon appears on the upper-right corner of the screen.
78 7EN02-0489-00
PowerLogic
™
Intuitive PM7100 / PM7200 / PM7300 series 6. Configuring

2. Unlocking the revenue meter:
a. Navigate to Settings.
b. If Display Passcode is Enabled, enter the Passcode, and then press
OK.
c. Navigate to Revenue Lock and press OK.
d. Press OK and select Unlocked to disable the revenue lock setting.
e. Enter the same revenue lock Passcode (between 000000 and 999999)
that you had set for locking, and then press OK.
A lock icon disappears from the upper-right corner of the screen.
6.2 Configuring using the PowerLogic™ Engineering
Suite
6.2.1 Configuring the meter settings
You can configure the meter using the PowerLogic™ Engineering Suite
configuration tool.
Refer to the PowerLogic™ Engineering Suite online help or the PowerLogic™
Engineering Suite Configuration guide (7EN02-0505) for instructions on how to
configure your meter.
7EN02-0489-00 79
6. Configuring PowerLogic
™
Intuitive PM7100 / PM7200 / PM7300 series

7. Operating
7.1 Viewing voltage parameters
You can view the voltage LN and voltage LL parameters.
NOTE:
• The line-to-neutral voltages (V) [LN] depend on the selected 1PH2W LN,
1PH3W LL With N, and 3PH4W power system type configurations.
• The line-to-line voltages (U) [LL] depend on the selected 1PH2W LL, and
3PH3W power system type configurations.
For information about individual harmonics up to the 31st, THD, and thd
measurements, see Harmonics, page 130.
To view the voltage parameters:
1. Navigate to Voltage screen, and then press OK.
2. Scroll down to view different voltage parameters, and then press OK.
Table 26 - Voltages(V) [LN] parameters
Parameter Description
Summary
• Phase Voltages(V) [LN] • Summary of line-to-neutral voltage on all three phases (V1 [Van], V2 [Vbn], V3 [Vcn]) and
the average voltage (V Avg.).
• Min/Max • Summary of the minimum and maximum values for line-to-neutral voltage on all three
phases (V1 [Van], V2 [Vbn], V3 [Vcn]) and the average voltage (V Avg.) with timestamps.
Unbalance Summary of the percentage line-to-neutral voltage unbalance (V Unb), along with the minimum
and maximum values and their timestamps.
NOTE: The line-to-neutral voltage unbalance (V Unb) is not applicable for 1PH power
system type configurations.
Harmonics Distortion
• THD V • Summary of THD (ratio of harmonic content to the fundamental) for line-to-neutral voltage
on all three phases (V1 [Van], V2 [Vbn], V3 [Vcn]) along with the minimum and maximum
values with timestamps.
• thd V • Summary of thd (ratio of harmonic content to the rms value of total harmonic content) for
line-to-neutral voltage on all three phases (V1 [Van], V2 [Vbn], V3 [Vcn]) along with the
minimum and maximum values with timestamps.
Harmonics Summary of line-to-neutral voltage harmonics data, including numeric magnitude and phase
angle for the fundamental, and graphical representation of the 3rd to 15th odd harmonics for
each line-to-neutral phase voltage.
Table 27 - Voltages(U) [LL] parameters
Parameter Description
Summary
• Phase Voltages(U) [LL] • Summary of phase line-to-line voltage on all three phase pairs (U12 [Vab], U23 [Vbc], U31
[Vca]) and the average line-to-line voltage (U Avg. [V Avg.]).
• Min/Max • Summary of the minimum and maximum values for line-to-line voltage on all three phase
pairs (U12 [Vab], U23 [Vbc], U31 [Vca]) and the average line-to-line voltage (U Avg. [V
Avg.]) with timestamps.
Unbalance Summary of the percentage line-to-line voltage unbalance (U Unb), along with the minimum and
maximum values and their timestamps.
NOTE: The line-to-line voltage unbalance (U Unb) is not applicable for 1PH power system
type configuration.
Harmonics Distortion
• THD U • Summary of THD (ratio of harmonic content to the fundamental) for line-to-line voltage on
all three phase pairs (U12 [Vab], U23 [Vbc], U31 [Vca]) along with the minimum and
maximum values with timestamps.
80 7EN02-0489-00
PowerLogic
™
Intuitive PM7100 / PM7200 / PM7300 series 7. Operating

Table 27 - Voltages(U) [LL] parameters (Continued)
Parameter Description
• thd U
• Summary of thd (ratio of harmonic content to the rms value of total harmonic content) for
line-to-line voltage on all three phase pairs (U12 [Vab], U23 [Vbc], U31 [Vca]) along with
the minimum and maximum values with timestamps.
Harmonics Summary of line-to-line voltage harmonics data, including numeric magnitude and phase angle
for the fundamental, and graphical representation of the 3rd to 15th odd harmonics for each line-
to-line phase voltage.
7.2 Viewing current parameters
You can view the phase current, unbalance, harmonics, and demand parameters.
NOTE:
• The phase currents ((I1 [Ia], I2 [Ib], I3 [Ic]) depends on the CT on
Terminal selection for 1PH2W LN and 1PH2W LL power system type
configurations.
• The neutral current (In) is available only for 1PH3W LL with N and
3PH4W power system type configurations.
• The ground current (Ig) is available only for 3PH3W power system type
configurations and when CT on Terminal is set to I1 I2 I3.
For information about individual harmonics up to the 31st, THD, thd, and TDD
measurements, see Harmonics, page 130.
For information about demand measurements, see Demand, page 121.
To view the current parameters:
1. Navigate to Current screen, and then press OK.
2. Scroll through the parameters, and then press OK to view the current
parameters.
Table 28 - Current parameters
Parameter Description
Overview
• Phase Currents • Summary of each phase current ((I1 [Ia], I2 [Ib], I3 [Ic]), the neutral current (In), the ground
current (Ig) and the average current (I Avg.).
• Min/Max • Summary of the minimum and maximum values for each phase current ((I1 [Ia], I2 [Ib], I3
[Ic]), the neutral current (In), the ground current (Ig) and the average current (I Avg.) with
timestamps.
Unbalance Summary of the percentage current-unbalance (I Unb), along with the minimum and maximum
values and their timestamps.
NOTE: The current-unbalance (I Unb) is not applicable for 1PH power system type
configuration.
Harmonics Distortion
• THD I • Summary of THD (ratio of harmonic content to the fundamental) for each phase current ((I1
[Ia], I2 [Ib], I3 [Ic]), the neutral current (In), the ground current (Ig) along with the minimum
and maximum values with timestamps.
• thd I • Summary of thd (ratio of harmonic content to the rms value of total harmonic content) for
each phase current ((I1 [Ia], I2 [Ib], I3 [Ic]), the neutral current (In), the ground current (Ig)
along with the minimum and maximum values with timestamps.
• Power Quality • Total Demand Distortion (TDD) values in percentage (%). TDD measures the total harmonic
current (sum of all harmonic RMS currents) relative to the system’s maximum load current.
Harmonics Summary of current harmonics data, including numeric magnitude and phase angle for the
fundamental, and graphical representation of harmonics of the 3rd to 15th odd harmonics for
each phase current.
Demand
7EN02-0489-00 81
7. Operating PowerLogic
™
Intuitive PM7100 / PM7200 / PM7300 series

Table 28 - Current parameters (Continued)
Parameter Description
• Present
• Summary of the present demand interval for each phase current ((I1 [Ia], I2 [Ib], I3 [Ic]), the
neutral current (In), the ground current (Ig) and the average current (I Avg.).
• Last • Summary of the last demand interval for each phase current ((I1 [Ia], I2 [Ib], I3 [Ic]), the
neutral current (In), the ground current (Ig) and the average current (I Avg.).
• Predictive • Summary of the predicted demand based on the current consumption rate for each phase
current ((I1 [Ia], I2 [Ib], I3 [Ic]), the neutral current (In), the ground current (Ig) and the
average current (I Avg.).
• Peak • Summary of the recorded peak demand for each phase current ((I1 [Ia], I2 [Ib], I3 [Ic]), the
neutral current (In), the ground current (Ig) and the average current (I Avg.) with
timestamps.
7.3 Viewing power parameters
You can view the summary of power, phase, demand, and power factor values.
For information about power factor calculation, see Power factor, page 124.
For information about demand measurements, see Demand, page 121.
To view the power parameters:
1. Navigate to Power screen, and then press OK.
2. Scroll through the parameters, and then press OK to view the power
parameters.
Table 29 - Power parameters
Parameter Description
Summary
• Total • Summary of the power consumption for total active power in kW (P Total [Active Total]),
total reactive power in kvar (Q Total [Reac Total]), and total apparent power in kVA (S Total
[Appr Total]).
• Min/Max • Summary of the minimum and maximum values for total power consumption, including total
active power in kW (P Total [Active Total]), total reactive power in kvar (Q Total [Reac
Total]), and total apparent power in kVA (S Total [Appr Total]) with timestamps.
Phase
• Total
• Summary of per phase and total power values for active power P [Active] in kW (P1 [A], P2
[B], P3 [C], and Total), reactive power Q [Reac] in kvar (Q1 [A], Q2 [B], Q3 [C], and Total),
and apparent power S [Appr] in kVA (S1 [A], S2 [B], S3 [C], and Total).
• Active Power Min/Max
• Summary of the minimum and maximum values for per phase and total active power in kW
(P1 [A], P2 [B], P3 [C], and P Total [Active Total]) with timestamps.
• Reactive Power Min/Max
• Summary of the minimum and maximum values for per phase and total reactive power in
kvar (Q1 [A], Q2 [B], Q3 [C], and Q Total [Reac Total]) with timestamps.
• Apparent Power Min/Max
• Summary of the minimum and maximum values for per phase and total apparent power in
kVA (S1 [A], S2 [B], S3 [C], and S Total [Appr Total]) with timestamps.
Demand Summary of demand values for the current demand interval (Present), the previous demand
interval (Last), and the predicted demand interval (Predictive) based on the current power
consumption rate and the recorded peak power demand (Peak) value with timestamp for active
power demand (Pd [Wd]), reactive power demand (Qd [VARd]) and apparent power demand
(Sd [VAd]).
Power Factor
• Total
• Summary of true power factor and displacement power factor values for each phase (PF1
[PFa], PF2 [PFb], PF3 [PFc]) and total (PF Total).
82 7EN02-0489-00
PowerLogic
™
Intuitive PM7100 / PM7200 / PM7300 series 7. Operating

Table 29 - Power parameters (Continued)
Parameter Description
• True PF Min/Max
• Summary of the minimum and maximum true power factor values with timestamps for each
phase (PF1 [PFa], PF2 [PFb], PF3 [PFc]) and total (PF Total).
• Displacement PF Min/Max
• Summary of the minimum and maximum displacement power factor values with timestamps
for each phase (PF1 [PFa], PF2 [PFb], PF3 [PFc]) and total (PF Total).
7.4 Viewing energy parameters
You can view the active energy (P), reactive energy (Q), apparent energy (S),
multi-tariff, and input metering parameters.
For information about energy measurements, see Energy, page 120.
For information about multi-tariff measurements, see Multi-tariff, page 112.
For information about input metering measurements, see Input metering, page
102.
To view the energy parameters:
1. Navigate to Energy screen, and then press OK.
2. Scroll through the parameters, and then press OK to view the summary of the
energy parameters.
Table 30 - Energy parameters
Parameter Description
Partial Energy Summary of accumulated values for delivered (Del), received (Rec), delivered plus received (D
+R), and delivered minus received (D-R) for partial active energy in Wh (P [Active]), partial
apparent energy in varh (Q [Reac]), and partial reactive energy in VAh (S [Appr]).
Non-Resettable Energy Summary of accumulated values for delivered (Del), received (Rec), delivered plus received (D
+R), and delivered minus received (D-R) for active energy in Wh (P [Active]), apparent energy
in varh (Q [Reac]), and reactive energy in VAh (S [Appr]).
Tariff
• T1 to T8
(Available in all models; quantity varies by model.)
Summary of the multi-tariffs (T1 to T8):
NOTE: You can read multi-tariffs T9 to T16 only through communication.
• Active energy delivered (Del) and received (Rec) in Wh (P [Active]) for the selected multi-
tariff.
• Reactive energy delivered (Del) and received (Rec) in varh (Q [Reac]) for the selected
multi-tariff.
• Apparent energy delivered (Del) and received (Rec) in VAh (S [Appr]) for the selected
multi-tariff.
Input Metering
• Summary • Summary of energy accumulations for the input metering channels (Inp Mtr Chan 1 to Inp
Mtr Chan 4).
• Demand • Summary of last demand for the input metering channels (Inp Mtr Chan 1 to Inp Mtr Chan
4).
7.5 Viewing alarms
You can view the active alarms, alarm history, unacknowledged alarms, and alarm
counters.
NOTE: The high priority alarm (red) is displayed on the screen until you
acknowledge the alarm. The pop-up alarm is displayed only for high and
medium priority alarms.
7EN02-0489-00 83
7. Operating PowerLogic
™
Intuitive PM7100 / PM7200 / PM7300 series
For information about alarms, see Alarms, page 104.
To view the alarm events:
1. Navigate to Alarms (
) screen.
2. Scroll through the parameters you need to view, and then press OK.
3. Press OK to acknowledge the alarm event details.
Table 31 - Alarm events
Parameter Description
Active Alarms List of all active alarm events with a date/timestamp for each event.
Each alarm displays the severity, start time, event, phase, and threshold value.
Alarm History Historical list of all acknowledged alarm events with a date/timestamp for each event.
Each alarm displays the start time, event, phase, and threshold value.
Unack. Alarms List of all unacknowledged alarm events.
Alarm Counter Total number of occurrences for each alarm type.
7.6 Viewing inputs/outputs status
You can view the digital inputs, digital outputs, and relay outputs status.
For information about digital input applications, see Digital inputs, page 101.
For information about digital output applications, see Digital outputs, page 101.
For information about relay output applications, see Relay outputs, page 102.
To view the inputs/outputs status:
1. Navigate to Inputs/Outputs (
) screen.
2. Scroll through the parameters you need to view, and then press OK.
Table 32 - Inputs/Outputs status
Parameter Description
Digital Inputs
• Digital Input S1
• Digital Input S2
• Digital Input S3
• Digital Input S4
Available in all models; quantity varies by model.
Status (ON or OFF) of the selected digital input.
Counter shows the total number of detected off-to-on state transitions .
Timer shows the total duration (in seconds) during which the digital input remains in the on state.
Digital Outputs
• Digital Output D1
• Digital Output D2
(Available only in specific models; quantity varies by model.)
Status (ON or OFF) of the selected digital output.
Counter shows the total number of detected off-to-on state transitions.
Timer shows the total duration (in seconds) during which the digital output remains in the on
state.
Relay Outputs
• Relay Output R1
• Relay Output R2
(Available only in specific models.)
Status (ON or OFF) of the selected relay output.
Counter shows the total number of detected off-to-on state transitions .
Timer shows the total duration (in seconds) during which the relay output remains in the on
state.
84 7EN02-0489-00
PowerLogic
™
Intuitive PM7100 / PM7200 / PM7300 series 7. Operating

7.7 Viewing diagnostics information
You can view the device info, meter status, device-on/operation timer, control
power, phasor/polar information, date and time, and meter information embedded
in QR code format.
For information about meter status (diagnostic codes), see Meter status, page 91.
For information about control power interruption, see Control power (auxiliary
power) interruption event, page 88.
To view the diagnostics information:
1. Navigate to Diagnostics (
) screen.
2. Scroll through the parameters you need to view, and then press OK.
Table 33 - Diagnostics information
Parameter Description
Device Info
Displays the meter model, serial number, date of manufacture, firmware version (including OS -
Operating System, RS - Reset System and OS CRC (Cyclic Redundancy Check)), language
firmware, and Bluetooth firmware. The OS CRC value is a number (Hexadecimal format) that
identifies the uniqueness between different OS firmware versions.
Meter
Displays the meter status.
Timer
Active Load Timer counter that keeps track of the total number of days, hours, minutes, and
seconds an active load is connected to the meter inputs.
Operating Timer counter for the total number of days, hours, minutes, and seconds the meter
has been powered.
Control Power
Non-MID/MIR meter models: The control power screen displays how many times the meter lost
control power (number of losses) and the last power down event with the timestamp.
MID/MIR meter models: The control power screen displays how many times the meter lost
control power (number of losses) and the last power up and power down events with the
timestamp.
Phasor/Polar
Phasor: Displays a graphical representation of the power system the meter is monitoring.
Polar: Displays the numeric magnitude and angles of all voltage and current phases.
Date & Time
Displays the date and time.
Identification
Displays a QR code containing the meter information.
7.8 Acknowledging the control power (auxiliary power)
interruption event
For MID/MIR compliance on applicable models.
Use the Control Power screen in the Diagnostics menu to acknowledge the
control power interruption event. The Facility Manager must assess the cause and
duration of the interruption as soon as the event icon
appears on the meter
display.
NOTE:
• You can acknowledge (dismiss) the control power interruption event with
Number of Losses, Last Power Up and Last Power Down only after
entering the Revenue Lock passcode.
• You cannot acknowledge alarms and control power interruption events at
the same time.
For information about control power interruption, see Control power (auxiliary
power) interruption event, page 88.
To acknowledge the control power (auxiliary power) interruption event:
7EN02-0489-00 85
7. Operating PowerLogic
™
Intuitive PM7100 / PM7200 / PM7300 series

1. Navigate to ( ) Diagnostics > Control Power.
The Number of Losses, Last Power Up and Last Power Down events with
timestamps appear on the same screen.
2. Press OK to acknowledge the control power (auxiliary power) interruption
event.
3. Enter the Revenue Lock passcode, and then press OK to confirm clearing
the on-screen notification.
NOTE: You can reset the Number of Losses to 0 only through the
Modbus communication. To perform this reset, you must disable the
Revenue Lock passcode through the meter display.
86 7EN02-0489-00
PowerLogic
™
Intuitive PM7100 / PM7200 / PM7300 series 7. Operating

8. Maintenance
8.1 Maintenance overview
The meter does not contain any user-serviceable parts. If the meter requires
service, contact your local Schneider Electric Technical Support representative.
NOTICE
METER DAMAGE
• Do not open the meter case.
• Do not attempt to repair any components of the meter.
Failure to follow these instructions can result in equipment damage.
Do not open the meter. Opening the meter voids the warranty.
8.2 Meter memory
The meter uses its non-volatile memory to retain data and metering configuration
values.
Under the operating temperature range specified for the meter, this non-volatile
memory is designed for an expected data retention life of approximately 20 years
under specified conditions.
NOTE: Life expectancy is a function of operating conditions and does not
constitute any expressed or implied warranty.
8.3 Meter battery
The internal battery in the meter keeps the meter’s clock running when it is
powered down to help maintain the meter time.
The life expectancy of the meter’s internal battery is estimated to be over 10 years
at 25 °C under typical operating conditions.
8.4 Diagnostics information
The meter provides you with diagnostics information to help with troubleshooting.
The Diagnostics screen provides meter info, meter status, meter on/operation
timer, control power, phasor/polar information, date & time, and meter information
embedded in QR code format.
8.5 Firmware version, model, and serial number
The Device Info menu in the Diagnostics screen provides the meter model,
serial number, date of manufacture, firmware version (including OS - Operating
System, RS - Reset System and OS CRC (Cyclic Redundancy Check)), language
firmware, and Bluetooth firmware. The OS CRC value is a number (Hexadecimal
format) that identifies the uniqueness between different OS firmware versions.
7EN02-0489-00 87
8. Maintenance PowerLogic
™
Intuitive PM7100 / PM7200 / PM7300 series

8.5.1 Firmware upgrades
Upgrading your meter’s firmware:
• Enhance existing features and functions
• Add new functionality
• Achieve compliance to new industry standards
• Helps to strengthen cybersecurity
• Helps to improve performance (example, optimize processing speed)
The meter supports the downloading of new firmware and language files through
the PowerLogic™ Engineering Suite, which is available at www.se.com. The latest
firmware and language files are available on the website.
NOTE:
• Schneider Electric does not recommend performing firmware updates
over a VPN connection.
• For MID/MIR meter models:
◦ The meter supports a maximum of 25 firmware upgrade attempts,
including both successful and unsuccessful attempts. After this limit is
reached, no further firmware upgrades are permitted.
◦ Disable the revenue lock using the meter display before upgrading.
8.6 Control power (auxiliary power) interruption event
NOTE: For MID/MIR compliance on applicable models.
When the meter is OFF and control power is applied, or when the meter is ON and
the control power is reset, the following actions occur:
• An icon
appears in the top-left corner of the screen to indicate that control
power has been lost.
• When the meter is ON and the control power drops below the operating
range, the meter logs a Last Power Down event with a timestamp before the
power turns off.
• When the meter is OFF and the control power is applied, the meter logs a
Last Power Up event with a timestamp after the power turns on.
• If multiple events occur along with a control power interruption, the control
power interruption icon takes priority over all other icons.
NOTE: The meter display shows only the total Number of Losses, Last
Power Down, and Last Power Up events. To view the full history of control
power interruptions (up to 20 events – 10 Last Power Down and 10 Last
Power Up), you must access the data through a communication interface.
8.7 Wrench icon
The wrench icon appears on the top left corner of the display screen.
The wrench icon alerts you when there is an over voltage condition or a potential
hardware or firmware abnormality in the meter that requires attention. It could also
indicate that the energy pulsing LED is in an overrun state.
The Meter menu in the Diagnostics screen provides the meter status information.
Make note of the information shown on the screen, then contact Schneider
Electric Technical Support. Refer to Diagnostic codes, page 91.
88 7EN02-0489-00
PowerLogic
™
Intuitive PM7100 / PM7200 / PM7300 series 8. Maintenance
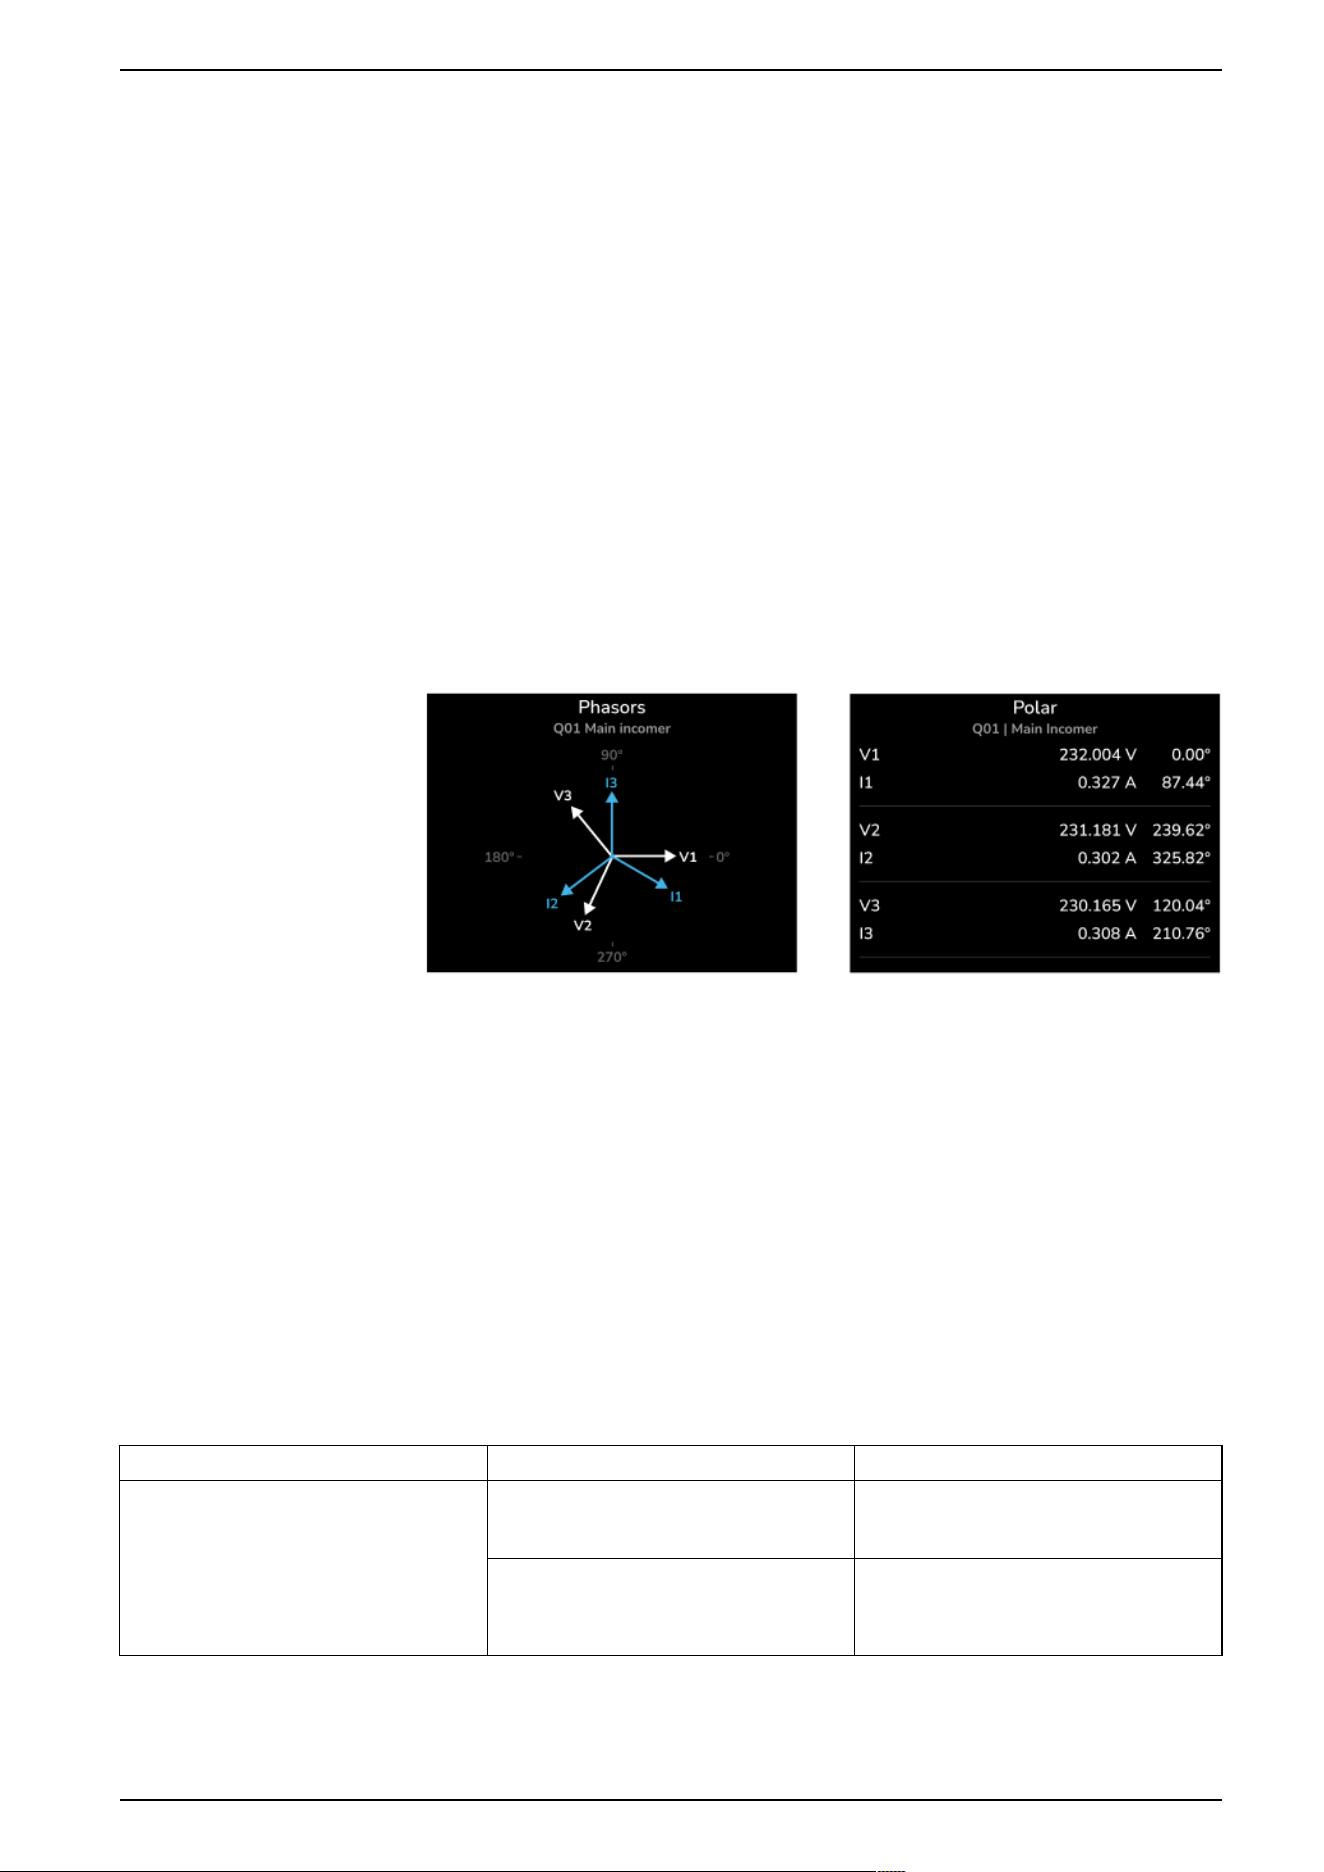
8.8 Phasors
Phasors are used to represent the voltage and current relative magnitude and
angles.
The length of the lines in the phasor diagram represents the relative magnitude of
the voltages with respect to the other phase voltages, and the currents with
respect to the other phase currents. All angles are measured with respect to the
V1 phase. The V1 phasor is fixed to the right-hand horizontal axis (positive x-axis).
Positive angles are measured counterclockwise.
Numeric values are provided for the magnitude and relative angle for each voltage
and current phase.
Phasor information can be used to troubleshoot incorrect connections on the
meter’s voltage and current inputs (for example, switched phase wiring or polarity
deviation), if you know how the phasors should be oriented for your power system.
8.8.1 Phasor screens
Phasor information is available on the meter’s display.
The graph on the Phasors screen shows a representation of the phase angles in
degrees. The Polar screen shows the RMS value and phase angle of each
voltage and current phases.
NOTE: If two phasor lines overlap (example, if they have the same relative
phase angle), only one phase label is visible as phasor diagram labels are
overwritten dynamically on the display panel.
8.9 Troubleshooting
8.9.1 LED indicators
Abnormal heartbeat/serial communications LED behavior could mean potential
problems with the meter.
Problem Probable causes Possible solutions
LED flash rate does not change when data
is sent from the host computer.
Communications wiring If using a serial to RS-485 converter, trace,
and check that all wiring from the computer
to the meter is properly connected.
Internal hardware problem Perform a hard reset: turn off control power
to the meter, then re-apply power. If the
problem persists, contact Technical
Support.
7EN02-0489-00 89
8. Maintenance PowerLogic
™
Intuitive PM7100 / PM7200 / PM7300 series

Problem Probable causes Possible solutions
Heartbeat/serial communications LED
remains lit and does not flash ON and OFF
Internal hardware problem Perform a hard reset: turn off control power
to the meter, then re-apply power. If the
problem persists, contact Technical
Support.
Heartbeat/serial communications LED
flashes, but the display is blank.
Display setup parameters incorrectly set Check the display settings over
communication.
If the problem is not fixed after troubleshooting, contact Technical Support for
help. Make sure that you have your meter’s firmware version, model, and serial
number information available to the Technical Support team for further diagnosis.
8.9.2 Troubleshooting checks
There are some checks you can perform to try to identify potential issues with the
meter’s operation.
The following table describes potential problems, their possible causes, checks
you can perform or possible solutions for each. After referring to this table, if you
cannot resolve the problem, contact your local Schneider Electric Technical
Support for assistance.
DANGER
HAZARD OF ELECTRIC SHOCK, EXPLOSION, OR ARC FLASH
• Apply appropriate Personal Protective Equipment (PPE) and follow safe
electrical work practices. See NFPA 70E, CSA Z462 or other local
standards.
• This equipment must be installed and serviced only by qualified personnel.
• Turn off all power supplying this device and the equipment in which it is
installed before working on or in the equipment.
• Always use a properly rated voltage sensing device to confirm that all power
is off.
• Assume communications and I/O wiring are hazardous live until determined
otherwise.
• Do not use the data from the meter to confirm power is off.
Failure to follow these instructions will result in death or serious injury.
Potential problem Possible cause Possible solution
The maintenance (wrench) icon appears on
the meter display. Refer to Diagnostic
codes, page 91.
It indicates an event has occurred which
may require attention.
Go to Diagnostics
> Meter screen. Event
messages display to indicate the reason the
icon is illuminated. Note these event
messages and call the Technical Support
representative for assistance.
The display is blank after applying control
power to the meter.
The meter may not be receiving the
necessary power.
The display may have timed out. Verify that
the power meter line and terminals are
receiving the necessary power. Verify that
the heartbeat LED is blinking. Press a
button to see if the display entered screen
saver mode.
The data being displayed is inaccurate or
not what you expect.
• Incorrect setup values.
• Incorrect voltage inputs.
• Meter is wired improperly
• Check that the correct values have
been entered for meter setup
parameters (CT and VT ratings,
Nominal Frequency, and so on).
• Check meter voltage input terminals (1,
2, 3, 4) to verify that adequate voltage
is present.
• Check that all CTs and VTs are
connected correctly (proper polarity is
observed) and that they are energized.
Check shorting terminals. See the in
the Wiring section of the Instruction
Sheet.
90 7EN02-0489-00
PowerLogic
™
Intuitive PM7100 / PM7200 / PM7300 series 8. Maintenance

Potential problem Possible cause Possible solution
• Check the phasor or polar screens to
diagnose wiring issues.
Cannot communicate with meter from a
remote personal computer.
• Meter address is incorrect.
• Meter baud rate is incorrect.
• Communications lines are improperly
connected.
• Communications lines are improperly
discontinued.
• Check to see that the meter is correctly
addressed.
• Verify that the baud rate of the meter
matches the baud rate of all other
devices on its communications link.
• Verify the meter communication
connections.
• Check to see that a multi-point
communications terminator is installed.
Energy/Alarm LED not working. May have been disabled by user. Confirm that the energy/alarm LED is
configured correctly.
Meter communication failure on network IP address conflict • Verify that no duplicate IP address
exists on the network.
• Check device diagnostics and network
configuration. The meter records
diagnostic events related to:
◦ IP address conflict detection
◦ IP address changes
◦ Fallback IP assignment
NOTE: If an IP address conflict
occurs, the meter automatically
detects and manages the
condition. For more information,
refer IPv4 address conflict
detection, page 95.
8.9.3 Diagnostic codes
The meter status provides you with diagnostic codes to help with troubleshooting.
Refer to the table below for the diagnostic codes, their possible causes, and the
corresponding corrective actions. If the issue persists after you perform the
actions described, contact Technical Support.
NOTE: If multiple errors occur simultaneously, the displayed error code is a
combination of the active error codes. Contact Technical Support for
assistance in interpreting the error code.
Diagnostic code Fault Probable causes Possible solutions
0x0004 NVRAM Fail Internal non-volatile
memory failure.
Contact Technical Support for
meter replacement.
0x0008 RTC Fail Real-time clock
malfunction.
Contact Technical Support for
meter replacement.
0x0010 Calibration Fail Calibration data error or
corruption.
Contact Technical Support for
meter replacement.
0x0020 Clipping Detected Input voltage or current
exceeds the supported
limit.
Reduce the measurement input
to within the supported range.
0x0040 Energy Pulse Overrun Configured pulse per k_h
for energy LED or digital
output is too high.
Reduce the configured pulse
per k_h value to within the
supported range.
0x0080 Input Metering Digital Input Rate Exceeded Pulse rate received on the
digital input exceeds the
supported limit.
Reduce the pulse output from
the connected meter to within
the supported range.
0x0100 Language Version Fail Language or configuration
error.
Restart the upgrade after power
cycling the meter. Contact
Technical Support if the issue
persists.
0x0200 Language String Mismatch Language or configuration
error.
Restart the upgrade after power
cycling the meter. Contact
7EN02-0489-00 91
8. Maintenance PowerLogic
™
Intuitive PM7100 / PM7200 / PM7300 series

Diagnostic code Fault Probable causes Possible solutions
Technical Support if the issue
persists.
0x0400 BLE Comm Fail BLE communication failure. Contact Technical Support for
diagnosis.
0x0800 Flash Fail Flash memory failure. Contact Technical Support for
meter replacement.
0x1000 ADC Fail Analog-to-digital converter
failure.
Contact Technical Support for
meter replacement.
0x2000 Firmware Upgrade Fail Interruption during firmware
upgrade (power or
communication issue).
Restart the upgrade after power
cycling the meter. Contact
Technical Support if the issue
persists.
8.10 Technical assistance
Visit www.se.com for support and assistance with lost passcodes or other
technical problems with the meter.
Make sure you have your meter’s model, serial number, and firmware version
readily available if calling Technical Support.
92 7EN02-0489-00
PowerLogic
™
Intuitive PM7100 / PM7200 / PM7300 series 8. Maintenance

9. Technical reference
9.1 Communications
9.1.1 Recommended network communication metrics
Avoid unsupported network packets and implement traffic filtering to ensure
proper meter operation.
NOTE:
• To help prevent unintended functioning of the meter and communication
interfaces, avoid sending unsupported network packets for extended
periods. If issues occur, perform a power cycle to restore normal
operation.
• To minimize unwanted traffic to the meter, implement traffic filtering at the
switch level. For example, if the meter is connected in an IGMP
environment with a switch, enable IGMP snooping, configure the VLAN
interface settings, and apply multicast filtering.
9.1.2 Serial communications
The meter supports serial communication through the RS-485 port.
In an RS-485 network, there is usually one main device (called a client), like an
Ethernet to RS-485 gateway, which connects to several other devices (called
servers), such as meters. For applications that require only one dedicated
computer to communicate with the servers, an USB to RS-485 converter can be
used to connect to the client.
You can connect up to 32 devices on a single RS-485 network.
9.1.2.1 RS-485 network configuration
Each device on the same RS-485 communications bus must have a unique
address and all connected devices must be set to the same protocol, baud rate,
and parity (data format).
NOTE: To communicate with the meter using PowerLogic™ Engineering
Suite, you must set the serial site and all connected devices in the RS-485
network to the same parity setting.
9.1.2.2 RS-485 port setup
The meter is factory-configured with default serial communications settings that
you may need to modify before connecting the meter to the RS-485 bus.
The meter is factory-configured with the following default serial communications
settings:
• Modbus RTU = Enabled
• Modbus Write Protection = Disabled
• Mode = Slave
• Protocol = Modbus RTU
• Address = 1
• Baud Rate = 19200
• Parity = Even
7EN02-0489-00 93
9. Technical reference PowerLogic
™
Intuitive PM7100 / PM7200 / PM7300 series

You can use a communications converter or Ethernet gateway device to connect
to the meter.
9.1.3 Ethernet communications
The meter uses Modbus TCP and BACnet/IP protocols to communicate at data
speed up to 100 Mbps through its Ethernet port.
Table 34 - Protocol, ports, and connections
Protocol
Port (Default)
Number of connections
Modbus TCP 502 8
BACnet/IP 47808 N/A
9.1.3.1 Ethernet configuration
To use Ethernet communication, you must configure your device’s IP address,
subnet, and gateway information, if required by your network.
You need to enter network information for any Ethernet servers used by the
device.
NOTE: Contact your network system administrator for your IP address and
other Ethernet network configuration values.
Configure the device’s Ethernet settings using the display. Modify the settings
provided by your network administrator before connecting the meter to your local
area network (LAN).
After the Ethernet port is configured and connected to the LAN, you can use
PowerLogic™ Engineering Suite to configure other meter setup parameters.
9.1.3.2 Ethernet port setup
The meter is factory-configured with default Ethernet communications settings.
You must modify the default Ethernet settings before connecting the meter to your
local area network (LAN).
The default Ethernet communications settings are:
• Modbus TCP = Enabled
• Modbus Write Protection = Disabled
• MAC ID = Factory-programmed MAC address
• Device Name = PM7•••
• DPWS = Enabled
• IPv4 Status = Enabled
• IPv4 Filtering Status = Disabled
• IPv4 Mode = Static
• IPv4 Address = 169.254.x.x, where x.x is derived from the last two digits
of the MAC address
• IPv4 Subnet Mask = 255.255.255.0
• IPv4 Gateway = 169.254.x.x, where x.x is derived from the last two digits
of the MAC address
• IPv6 Status = Disabled
• IPv6 Filtering Status = Disabled
• IPv6 Mode = Static
94 7EN02-0489-00
PowerLogic
™
Intuitive PM7100 / PM7200 / PM7300 series 9. Technical reference

• IPv6 Link Local Address = Derived from the fe80::/64 prefix and the MAC
address
• IPv6 Global Address = Prefix 2001:0db8:85a3:0000::/64, with the remaining
64 bits derived from the MAC address
• IPv6 Gateway = 2001:0db8:85a3:0000:0000:0000:0000:0001
9.1.3.3 IPv4 address conflict detection
The meter detects and manages duplicate IPv4 addresses on the network using
Address Conflict Detection (ACD).
Overview
The meter supports IPv4 Address Conflict Detection (ACD) to detect and handle
duplicate IPv4 addresses on the network.
An IPv4 address conflict occurs when two meters on the same network use the
same IPv4 address. This condition can lead to:
• Communication failures
• Intermittent connectivity
• Packet loss
• Application errors
Causes of IPv4 address conflicts
IPv4 address conflicts can occur for the following reasons:
• Misconfigured static IPv4 addresses
• Duplicate IPv4 address configuration
• DHCP server issues
• Multiple DHCP servers on the same network
• Cloned meters with unchanged network settings
ACD functionality
Initial probing
• Sends Address Resolution Protocol (ARP) probes before using an IPv4
address.
• Checks whether another meter is using the address.
• Identifies a conflict if a response is received.
Address announcement
• Sends ARP announcements after confirming that no conflict exists.
• Notifies other devices on the network of IPv4 address usage.
Ongoing monitoring
• Monitors the network for conflicts after assigning an IPv4 address.
• Follows the configured behavior if a conflict is detected.
ARP operations
ARP probe
• Sent before assigning an IPv4 address.
• Uses 0.0.0.0 as the source IPv4 address.
• Checks whether the target IPv4 address is already in use.
7EN02-0489-00 95
9. Technical reference PowerLogic
™
Intuitive PM7100 / PM7200 / PM7300 series

ARP announcement
• Sent after assigning an IPv4 address.
• Uses the same IPv4 address as both source and target.
• Updates other meters on the network about IPv4 ownership.
Meter behavior during conflict detection
DHCP configuration
• Conflict during startup:
◦ Sends a DHCP Decline message to the DHCP server.
◦ Initiates a new DHCP request.
• Conflict during operation:
◦ Releases the conflicting IPv4 address.
◦ Sends a new DHCP request to obtain another IPv4 address.
• DHCP server not available:
◦ Repeats the DHCP requests.
◦ If no response is received:
– Assigns a fallback IPv4 address in the 169.254.x.x range, where x.
x is derived from the last two digits of the MAC address.
– Continues DHCP repeat attempts at regular intervals.
Static IPv4 configuration
• Detects conflicts on the configured IPv4 address.
• Avoids using the conflicting address.
• P performs periodic checks to verify whether the conflict persists.
• Restores the configured IPv4 address after the conflict is resolved.
Fallback IPv4 behavior
• Assigns a link-local fallback IPv4 address (169.254.x.x, where x.x is
derived from the last two digits of the MAC address) when required. Verifies
that the fallback address is not in use before assignment.
• If the fallback IPv4 address is also in conflict:
◦ Does not assign an IPv4 address.
◦ May display 0.0.0.0 as the IPv4 address.
9.1.4 BACnet/IP
BACnet/IP protocol allows communication between the components of a building
automation and control system (for example, HVAC, lighting control, security
systems and related equipment).
The BACnet/IP protocol defines a number of services that are used to
communicate between devices and the objects that are acted upon by those
services.
Term Definition
APDU Application protocol data unit, that data portion of a BACnet message.
Confirmed message A message for which the device expects an answer.
COV, COV increment Change of value, sets the amount by which a value must change for the meter to send a
subscription notification.
Device A BACnet device is a unit that is designed to understand and use BACnet protocol (for example,
a BACnet-enabled meter or software program). It contains information about the device and
device data in objects and object properties. Your meter is a BACnet device.
96 7EN02-0489-00
PowerLogic
™
Intuitive PM7100 / PM7200 / PM7300 series 9. Technical reference
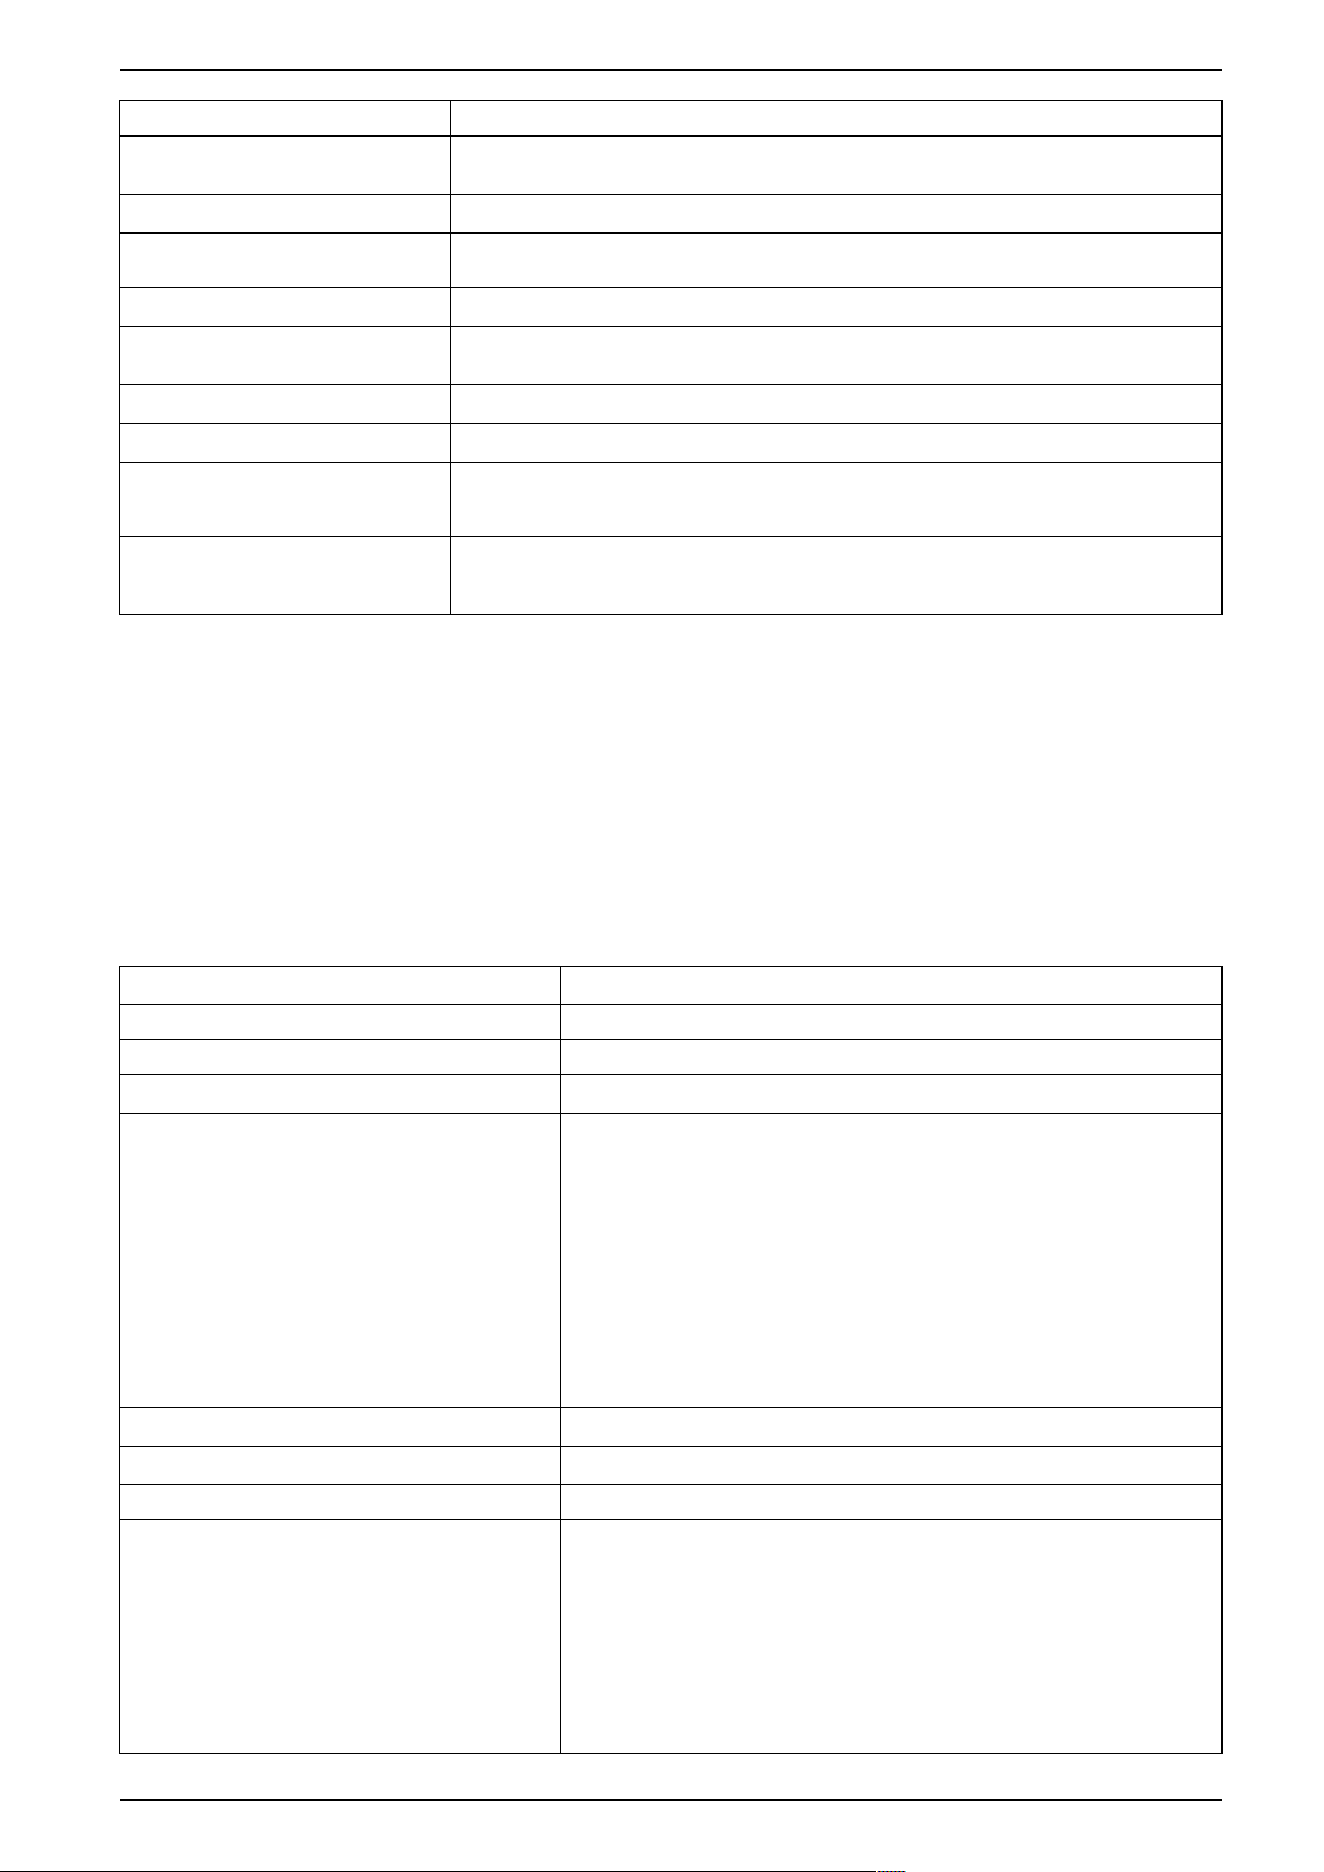
Term Definition
Object Represents the device and device data. Each object has a type (for example, analog input or
binary input) and has a number of properties.
Present value The current value of an object.
Property The smallest piece of information in BACnet communications, it consists of a name, data type,
and value.
Service Messages from one BACnet device to another.
Subscription A relationship between a BACnet client and the meter, so that when the present value property
of an object changes on the meter, a notification is sent to the client.
Subscription notification The message the meter sends to indicate a COV event has occurred.
Unconfirmed message A message for which the device does not expect an answer.
BACnet Broadcast Management
Device (BBMD)
A BACnet/IP device (or software application) residing on a BACnet/IP subnet that sends BACnet
broadcast messages from devices on its subnet to peer BBMDs and registered foreign devices
on other subnets.
Foreign device A BACnet/IP device (or software application) that resides on a remote IP subnet and registers
with a BBMD to facilitate the sending and receiving of broadcast messages to/from devices
accessible by the BBMD.
9.1.4.1 Supported BACnet features
Your meter supports specific BACnet components and standard objects.
The meter’s BACnet/IP protocol support is certified by BACnet International. Go to
www.bacnetinternational.org or www.se.com and search for your meter model to
access the PICS (Protocol Implementation Conformance Statement) for your
meter.
Supported BACnet components
BACnet component Description
Protocol version 1
Protocol revision 25
Standardized device profile (Annex L) BACnet Application Specific Controller (B-ASC)
BACNet Interoperability Building Blocks (Annex K) • DS-RP-B (Data Sharing - Read Property - B)
• DS-RPM-B (Data Sharing - Read Property Multiple - B)
• DS-WP-B (Data Sharing - Write Property - B)
• DS-WPM-B (Data Sharing - Write Property Multiple - B)
• DS-COV-B (Data Sharing - COV - B)
• DM-DDB-B (Device Management - Dynamic Device Binding - B)
• DM-DOB-B (Device Management - Dynamic Object Binding - B)
• DM-DCC-B (Device Management - Device Communication Control - B)
• DM-RD-B (Device Management - Reinitialize Device - B)
• NM-FDR-A (Network Management – Foreign Device Registration – A)
BACnet/IP (Annex J) BACnet communication internet protocol
Data link layer options UDP
Character set ANSI X3.4/UTF-8
Supported services • subscribeCOV
• readProperty
• readPropertyMultiple
• writeProperty
• writePropertyMultiple
• deviceCommunicationControl
• who-HAS
• who-Is
7EN02-0489-00 97
9. Technical reference PowerLogic
™
Intuitive PM7100 / PM7200 / PM7300 series

BACnet component Description
• I-Am
• I-Have
• Confirmed COV notification
• Unconfirmed COV notification
Segmentation The meter does not support segmentation
Static device address binding The meter does not support static device address binding
Networking options The meter supports registration as a foreign device
Supported standard object types
NOTE: The BACnet protocol allows you to set the out-of-service property of
an object to true and write a value to that property for testing purposes. In this
case, your BACnet software displays the value you wrote to the object, not the
actual value from the meter and the system it is monitoring. Make sure you set
the out-of-service property of all objects to false before you put the meter into
service.
Object type Optional properties supported Writeable properties supported Conditional writeable
properties supported
Device Object • Location
• Description
• Local_Time
• Local_Date
• Active_COV_Subscriptions
• Profile_Name
• Object_Name
• Object_Identifier
• Location
• Description
• APDU_Timeout
• Number_Of_APDU_Retries
—
Analog Input Object • Description
• Reliability
• COV_Increment
• Out_Of_Service
• COV_Increment
Present_Value
Binary Input Object • Description
• Reliability
Out_Of_Service Present_Value
Multi-state Input
Object
• Description
• Reliability
• State_Text
Out_Of_Service Present_Value
Network Port
• Description
• Network_Number
• Network_Number_Quality
• Apdu_Length
• Link_Speed
• Mac_Address
• Bacnet_Ip_Mode
• Bacnet_Ip_Udp_Port
• Bacnet_Ip_Address
• Bacnet_Ip_Subnet_Mask
• Bacnet_Ip_Default_Gateway
• Bacnet_Ip_Dns_Server
—
• FD BBMD Address
• FD Subscription
Lifetime
9.1.4.2 BACnet/IP communications implementation
Your meter's BACnet implementation includes specific behaviors and
configuration. See your meter’s BACnet object list at www.se.com for the
supported standard object types.
98 7EN02-0489-00
PowerLogic
™
Intuitive PM7100 / PM7200 / PM7300 series 9. Technical reference

Basic configuration for BACnet communications
Before communicating with the meter via BACnet protocol, make sure the basic
BACnet settings are configured appropriately for your network. The Device ID
must be unique in your BACnet IP network.
Change of Value (COV) subscriptions
The meter supports up to 20 COV subscriptions. You can add COV subscriptions
to Analog Input, Binary Input and Multi-state Input objects using your BACnet-
compatible software.
9.1.4.3 BACnet/IP settings
The meter is factory-configured with default BACnet/IP communications settings
that you may need to modify.
The default BACnet/IP communications settings are:
• BACnet/IP = Disabled
• BACnet/IP Write Protection = Enabled
• Device ID = A unique ID derived from the device serial number.
• UDP Port = 47808
• BBMD = Disabled
• BBMD IP = 000.000.000.000
• BBMD Port = 47808
• BBMD TTL = 600
7EN02-0489-00 99
9. Technical reference PowerLogic
™
Intuitive PM7100 / PM7200 / PM7300 series

9.2 Logging
9.2.1 Data log
The meter is shipped from the factory with data logging enabled for selected
values.
Typically, delivered energy (kWh, kvarh, and kVAh) is logged by default, but you
can configure the meter to record other measurements, such as received energy,
input metering accumulations, and peak demand values from previous demand
intervals.
The meter can record 14 parameters for 180 days at 15-minute intervals (default).
9.2.2 Alarm log
The meter can log the occurrence of any alarm condition. The alarm records are
stored in the meter’s alarm history log.
Each time an alarm occurs, it is recorded in the alarm log. The alarm log in the
meter stores the pickup and dropout points of the alarms, along with the
corresponding date and time.
9.2.2.1 Alarm log storage
The power and energy meter stores alarm log data in non-volatile memory.
The size of the alarm log is fixed at 40 records.
9.2.3 Memory allocation for log files
Each file in the meter has a maximum memory size.
Memory is not shared between the different logs, so reducing the number of
values recorded in one log does not allow more values to be stored in a different
log.
Log type Maximum records stored Storage
Alarm log 40 2200 bytes
Data log * 135826 2MB
* The data log stores up to 2 MB of recorded data. The maximum retention period depends on the
logging interval and the number of selected parameters. Actual data retention may vary depending
on the logging configuration and the number of parameters selected for recording.
• Default configuration (15-minute logging interval, 3 parameters): Approximately 60367
records, providing up to 21 months of data storage.
• Maximum configuration (15-minute logging interval, 14 parameters): Approximately 17526
records, providing up to 6 months of data storage.
• Minimum configuration (15-minute logging interval, 1 parameter): Approximately 135826
records, providing up to 47 months of data storage.
100 7EN02-0489-00
PowerLogic
™
Intuitive PM7100 / PM7200 / PM7300 series 9. Technical reference
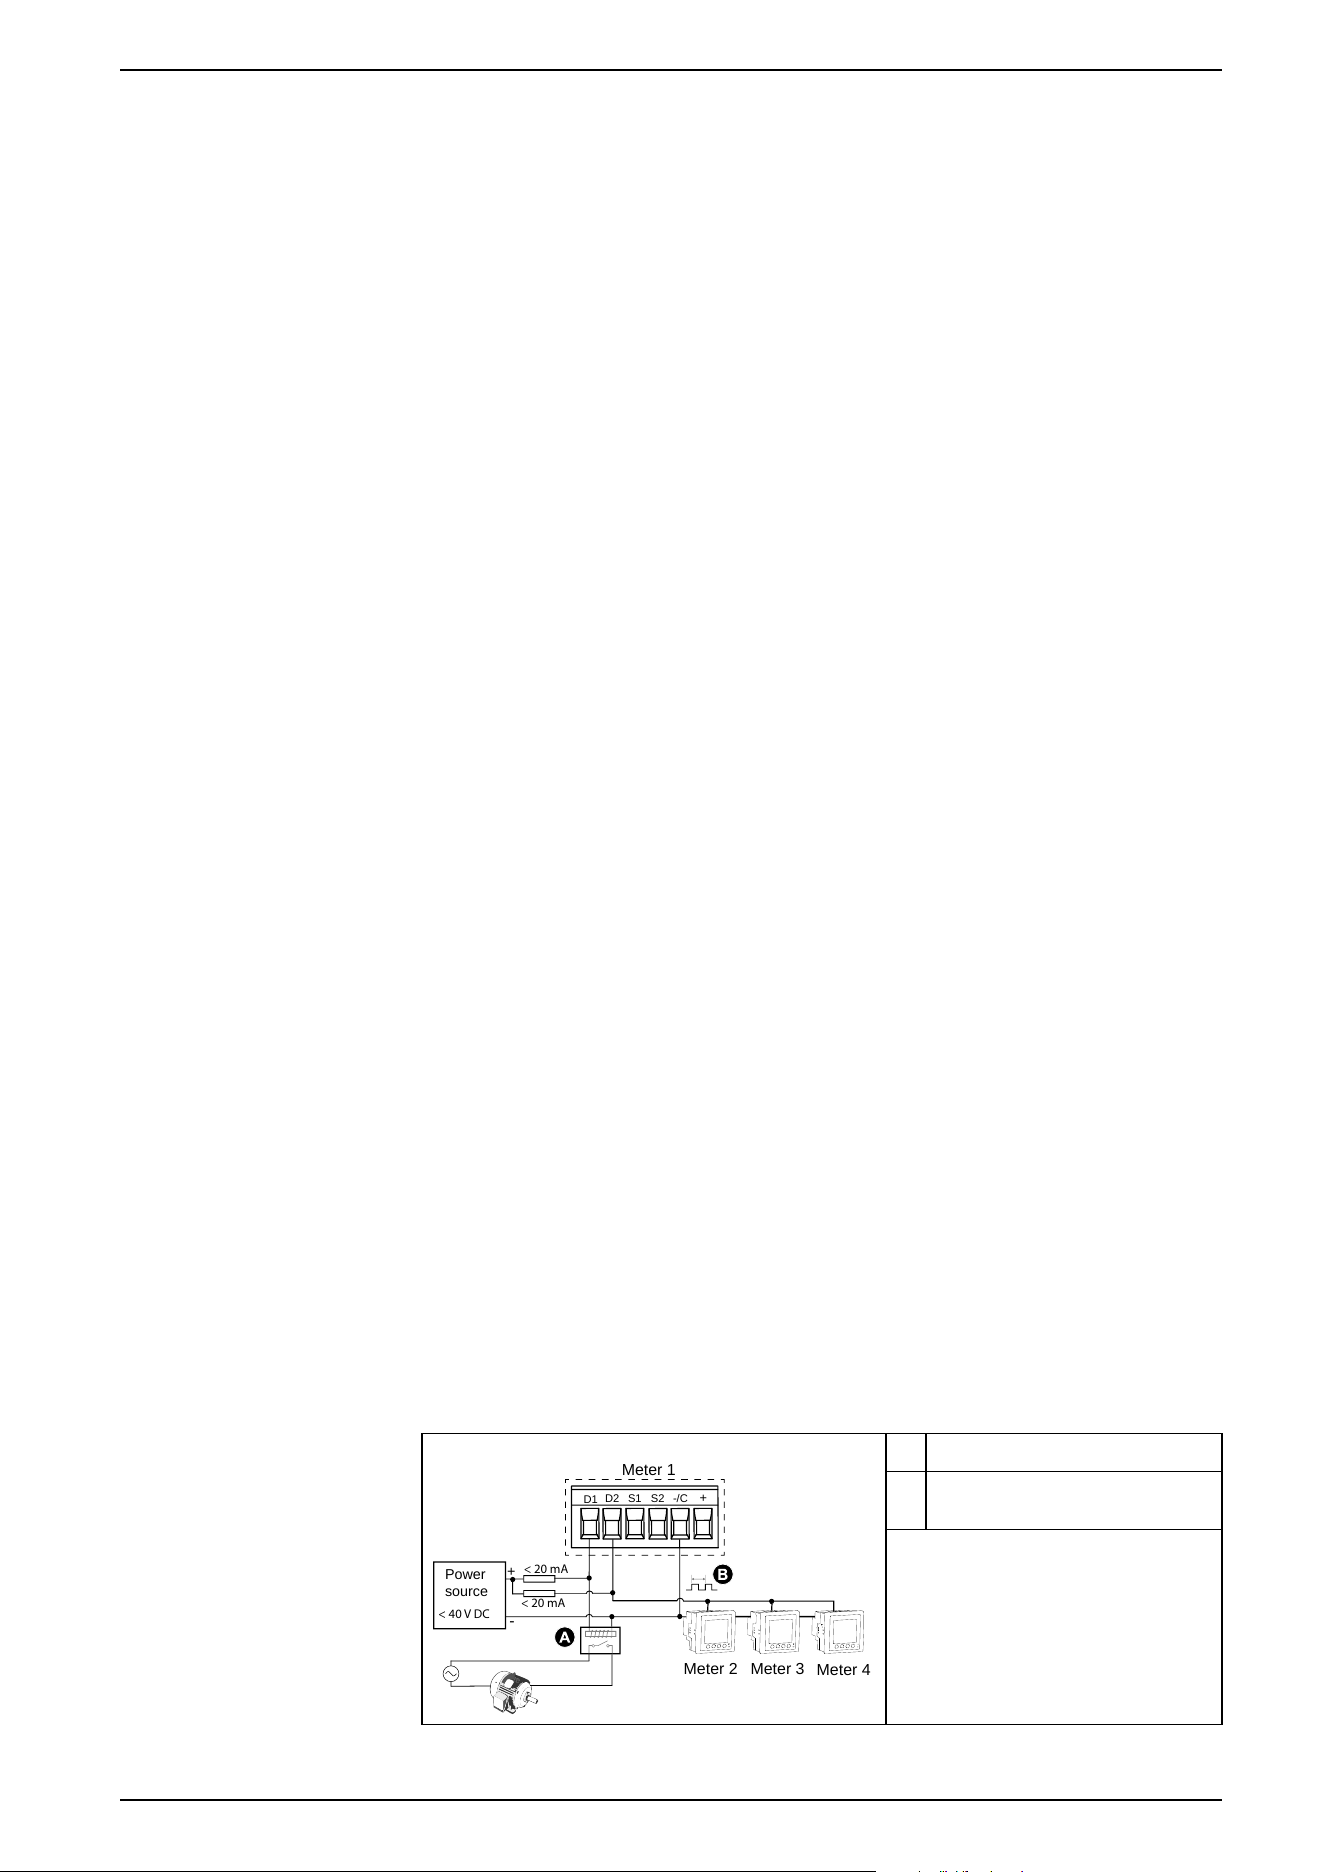
9.3 Inputs/Outputs
9.3.1 Digital input applications
Digital inputs are typically used for monitoring the status of external contacts or
circuit breakers.
9.3.1.1 Digital input wiring considerations
The meter’s digital inputs require an external voltage source to detect the digital
input’s on/off state.
The meter detects an ON state if the external voltage appearing at the digital input
is within its operating range. The external voltage can be derived from either the
wetting output provided by the meter or by a voltage source up to 36 V DC
external to the meter.
9.3.2 Digital output applications
Digital outputs are typically used in switching applications, for example, to provide
on/off control signals for switching capacitor banks, generators, and other external
devices and equipment.
The digital outputs can handle voltages less than 40 V DC.
The digital output can also be used in demand synchronization applications,
where the meter provides pulse signals to the input of another meter to control its
demand period. The digital output can also be used in energy pulsing applications,
where a receiving device determines energy usage by counting the kWh pulses
coming from the meter’s digital output.
You can connect one of your meter’s digital outputs to a relay that switches on a
generator and the other digital output to send a demand sync pulse to other
meters.
The digital outputs on the meter are internally designed using solid-state devices
with an open-collector configuration. These outputs must be connected to the
specified power supply with a current limiter to function.
9.3.2.1 Digital output application example
You can connect one of your meter’s digital outputs to a relay that switches on a
generator and the other digital output to send a demand sync pulse to other
meters.
In the following example, the first meter (Meter 1) controls and sets the demand
period (900 seconds) of the other meters (Meter 2, Meter 3, Meter 4) through the
output pulse occurring at the end of the first meter’s demand interval.
+
-
D1
D2
S1
S2 -/C
+
Power
source
Meter 1
Meter 2
Meter 3
Meter 4
< 40 V DC
< 20 mA
< 20 mA
A Relay
B Demand period (in this example,
900 seconds)
7EN02-0489-00 101
9. Technical reference PowerLogic
™
Intuitive PM7100 / PM7200 / PM7300 series

9.3.3 Relay output applications
Relay outputs can be configured to be used in switching applications, for example,
to provide on/off control signals for switching capacitor banks, generators, and
other external devices and equipment.
WARNING
RISK OF INJURY OR EQUIPMENT DAMAGE
Always apply the same power type (AC or DC) to both the relay outputs.
Failure to follow these instructions can result in death, serious injury, or
equipment damage.
9.3.4 Energy pulsing
You can configure the meter’s alarm/energy LED or the digital outputs for energy
pulsing.
• The meter is equipped with an alarm/energy pulsing LED. When configured
for energy pulsing, the LED emits pulses that are then used to determine the
accuracy of the meter’s energy measurements.
• The meter sends the pulses from the configured digital outputs port, which
are then used to determine the accuracy of the meter’s energy
measurements by pulse counter.
9.3.5 Input metering
The digital inputs are designed to count pulses from external transducers and
convert these pulses to energy measurements.
Each input metering channel is configured to count the pulses received from its
assigned digital input. These incoming pulses are used to calculate and measure
consumption data (example, BTU, kWh, L, kg). To ensure accurate measurement,
each channel must be configured with the following parameters:
• Pulse Weight: Defines the number of pulses per unit of measurement.
• Unit Code: Specifies the unit of measure associated with the monitored value
(e.g., Wh, kWh, L, kg).
• Demand Code: For time-based values (e.g., kWh), this defines the associated
demand unit (e.g., kW) used in demand calculations. For other values (e.g.,
kg), it can be configured to provide rate information (e.g., kg/h or kg/s).
• Mode: Determines whether the input is triggered by a complete pulse or a
signal transition.
For example, if one pulse represents 125 Wh, you can configure the meter for Wh
pulsing as follows:
• Pulse Weight = pulses/Wh = 1/125 = 0.008
• Unit Code = Wh
• Demand Code = kW (automatically set)
• Mode = pulse
If you want to configure the meter for kWh pulsing, you need to adjust the pulse
weight calculation and unit code as follows:
• Pulse Weight = pulses/kWh = 1/0.125 = 8
• Unit Code = kWh
102 7EN02-0489-00
PowerLogic
™
Intuitive PM7100 / PM7200 / PM7300 series 9. Technical reference

9.4 Resets
9.4.1 Meter resets
Resets allow you to clear various accumulated parameters stored on your meter
or reinitialize the meter or meter accessories.
Meter resets clear your meter’s onboard data logs and other related information.
Resets are typically performed after you make changes to the meter’s basic setup
parameters (such as frequency, VT/PT or CT settings) to clear invalid or obsolete
data in preparation for putting the meter into active service.
9.4.1.1 Meter initialization
Meter initialization is a special command that clears the meter’s logged data,
counters, and timers.
It is common practice to initialize the meter after its configuration is completed,
before adding it to an energy management system.
After configuring all the meter setup parameters, navigate through the different
meter display screens and make sure the displayed data is valid then perform
meter initialization.
7EN02-0489-00 103
9. Technical reference PowerLogic
™
Intuitive PM7100 / PM7200 / PM7300 series

9.5 Alarms
9.5.1 Alarms overview
An alarm is the meter’s means of notifying you when an alarm condition is
detected, such as an error or an event that falls outside of normal operating
conditions. Alarms are typically setpoint-driven and can be programmed to
monitor certain behaviors, events, or unwanted conditions in your electrical
system.
You can configure your meter to generate and display high, medium, and low
priority alarms when predefined events are detected in the meter’s measured
values or operating states. Your meter also logs the alarm event information.
The meter ships with some alarms already enabled from the factory. Other alarms
need to be configured before the meter can generate alarms.
Customize meter alarms as required, such as changing the priority. You can also
create custom alarms using the advanced features of your meter.
9.5.2 Available alarms
Your meters support a number of different alarm types.
Alarm type Number
Unary 4
Digital 4
(The number of available digital alarms depends on the meter
model.)
Standard 29
9.5.3 Unary alarms
A unary alarm is the simplest type of alarm — it monitors a single behavior, event,
or condition.
NOTE: Power cycle the device to reset the unary alarms.
Available unary alarms
The meter supports four unary alarms.
Table 35 - Unary alarms list
Alarm
Description
Meter Power Up Meter powers on after losing control power.
Meter Reset
Meter resets for any reason.
Meter Diagnostics Meter’s self-diagnostic feature detects an abnormality.
Phase Reversal
Meter detects an unexpected phase rotation.
9.5.4 Digital alarms
Digital alarms monitor the ON or OFF state of the meter’s digital inputs.
104 7EN02-0489-00
PowerLogic
™
Intuitive PM7100 / PM7200 / PM7300 series 9. Technical reference
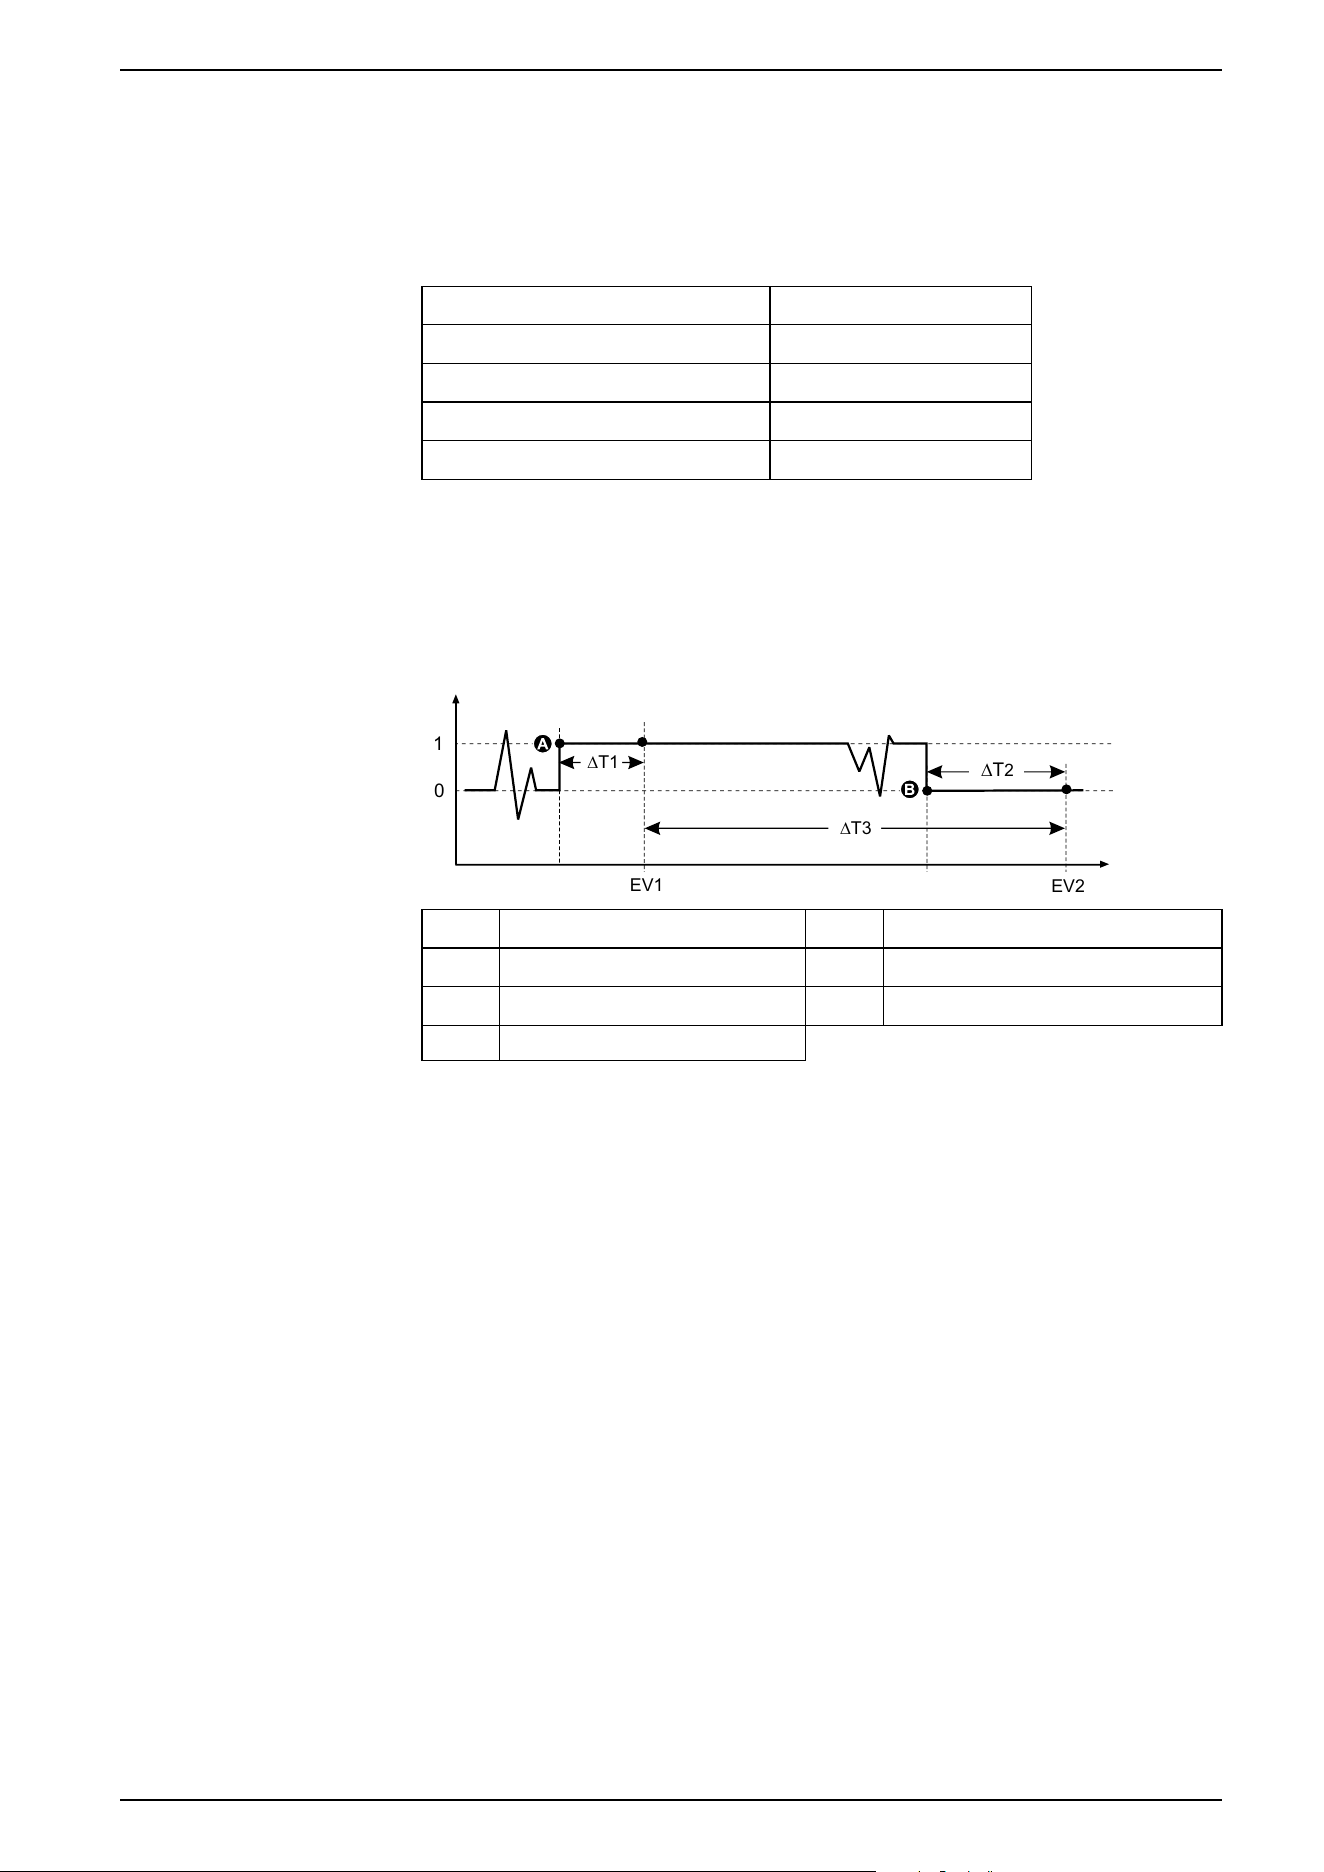
Available digital alarms
The meter supports 1, 2, or 4 digital alarms.
NOTE: The number of available digital alarms depends on the meter model.
Table 36 - Digital alarms list
Alarm
Description
Digital Alarm S1 Digital input 1
Digital Alarm S2 Digital input 2
Digital Alarm S3 Digital input 3
Digital Alarm S4 Digital input 4
Digital alarm with setpoint delay
To help prevent false triggers from erratic signals, you can set up pickup and
dropout time delays for the digital alarm.
EV1
EV2
0
1
∆T1
∆T
2
∆T3
A Pickup setpoint (1 = ON) ΔT2 Dropout time delay (in seconds)
B Dropout setpoint (0 = OFF) EV2 End of alarm condition
ΔT1 Pickup time delay (in seconds) ΔT3 Alarm duration (in seconds)
EV1 Start of alarm condition
NOTE: To help prevent filling the alarm log with nuisance alarm trips, the
digital alarm is automatically disabled if the digital input changes state more
than four times in one second or more than 10 times in ten seconds. In this
case, you must re-enable the alarm using the display or PowerLogic™
Engineering Suite.
9.5.5 Standard alarms
Standard alarms are set point-driven alarms which monitor certain behaviors,
events, or unwanted conditions in your electrical system.
Standard alarms have a detection rate equal to the 50/60 meter cycle, which is
nominally 1 second if the meter’s frequency setting is configured to match the
system frequency (50 or 60 Hz).
Many of the standard alarms are 3-phase alarms. Alarm set points are evaluated
for each of the three phases individually, but the alarm is reported as a single
alarm. The alarm pickup occurs when the first phase exceeds the alarm pickup
magnitude for the pickup time delay. The alarm is active if any phase remains in
an alarm state. The alarm dropout occurs when the last phase drops below the
dropout magnitude for the dropout time delay.
7EN02-0489-00 105
9. Technical reference PowerLogic
™
Intuitive PM7100 / PM7200 / PM7300 series
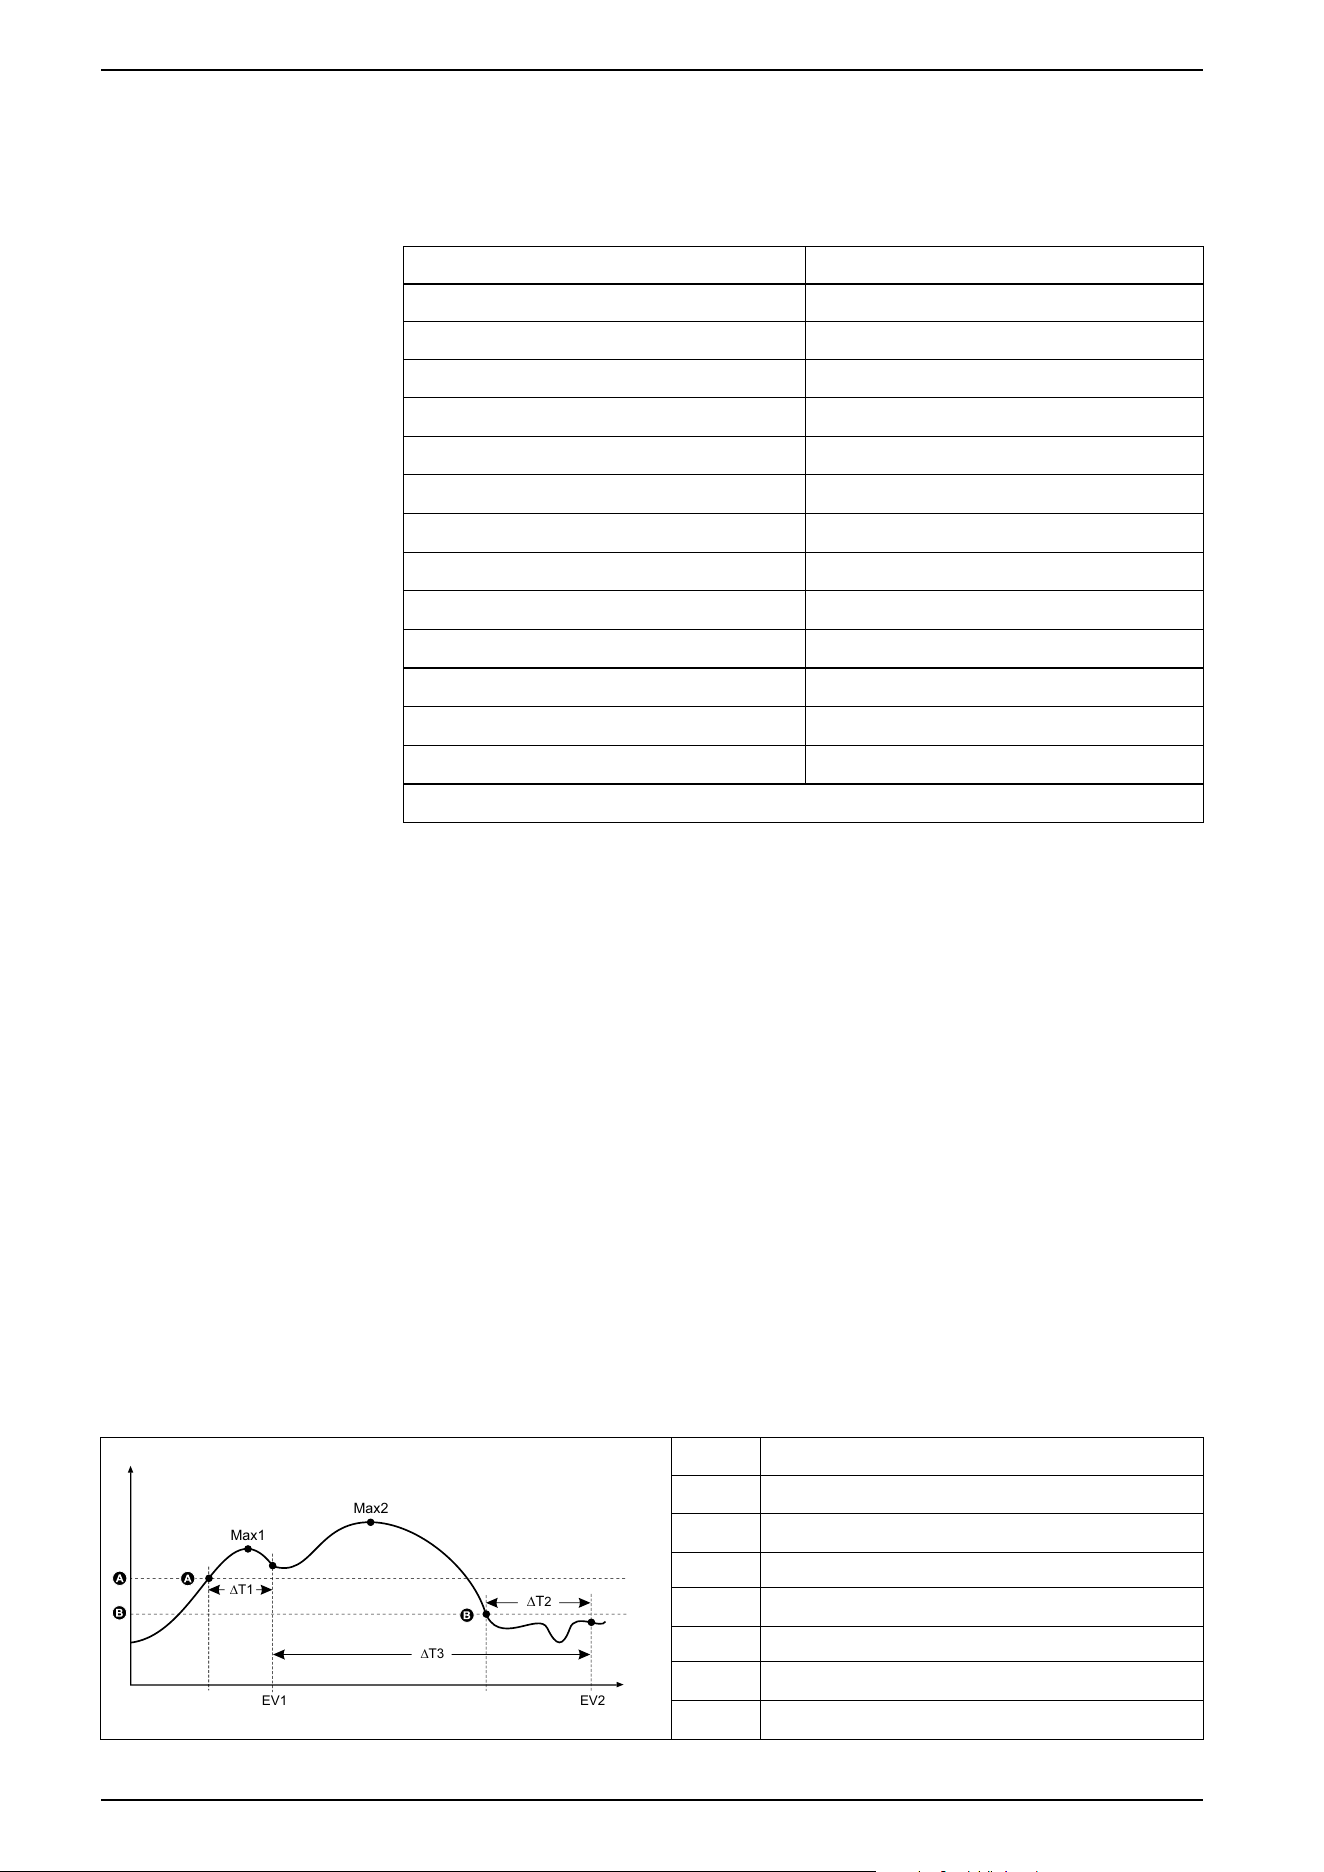
Available standard alarms
The meter supports set of standard alarms.
Table 37 - Standard alarms list
Over Current, Phase Over Demand Active Power, Present
Under Current, Phase Over Demand Active Power, Last
Over Current, Neutral Over Demand Active Power, Predicted
Over Current, Ground Over Demand Reactive Power, Present
Over Voltage, L-L Over Demand Reactive Power, Last
Under Voltage, L-L Over Demand Reactive Power, Predicted
Over Voltage, L-N Over Demand Apparent Power, Present
Under Voltage L-N Over Demand Apparent Power, Last
Over Power, Active Over Demand Apparent Power, Predicted
Over Power, Reactive Over Frequency
Over Power, Apparent Under Frequency
Leading Power Factor, True Over Voltage Unbalance
Lagging Power Factor, True Over Voltage Total Harmonic Distortion*
Leading Power Factor, Displacement Phase Loss
Lagging Power Factor, Displacement
* Over Voltage Unbalanceand Over Voltage Total Harmonic Distortion alarms applies only to L-
L voltage.
9.5.5.1 Example of over and under setpoint (standard) alarm operation
The meter supports over and under setpoint conditions on standard alarms.
A setpoint condition occurs when the magnitude of the signal being monitored
crosses the limit specified by the pickup setpoint setting and stays within that limit
for a minimum time specified by the pickup time delay setting.
The setpoint condition ends when the magnitude of the signal being monitored
crosses the limit specified by dropout setpoint setting and stays within that limit for
a minimum time specified by dropout time delay setting.
Over setpoint
When the value rises above the pickup setpoint setting and remains there long
enough to satisfy the pickup time delay period (ΔT1), the alarm condition is set to
ON. When the value falls below the dropout setpoint setting and remains there
long enough to satisfy the dropout time delay period (ΔT2), the alarm condition is
set to OFF.
EV1
EV2
∆T1
∆T
2
∆T3
Max1
Ma
x2
A Pickup setpoint
B Dropout setpoint
ΔT1 Pickup time delay period (in seconds)
EV1 Start of alarm condition
ΔT2 Dropout time delay (in seconds)
EV2 End of alarm condition
ΔT3 Alarm duration (in seconds)
Max1 Maximum value recorded during pickup period
106 7EN02-0489-00
PowerLogic
™
Intuitive PM7100 / PM7200 / PM7300 series 9. Technical reference
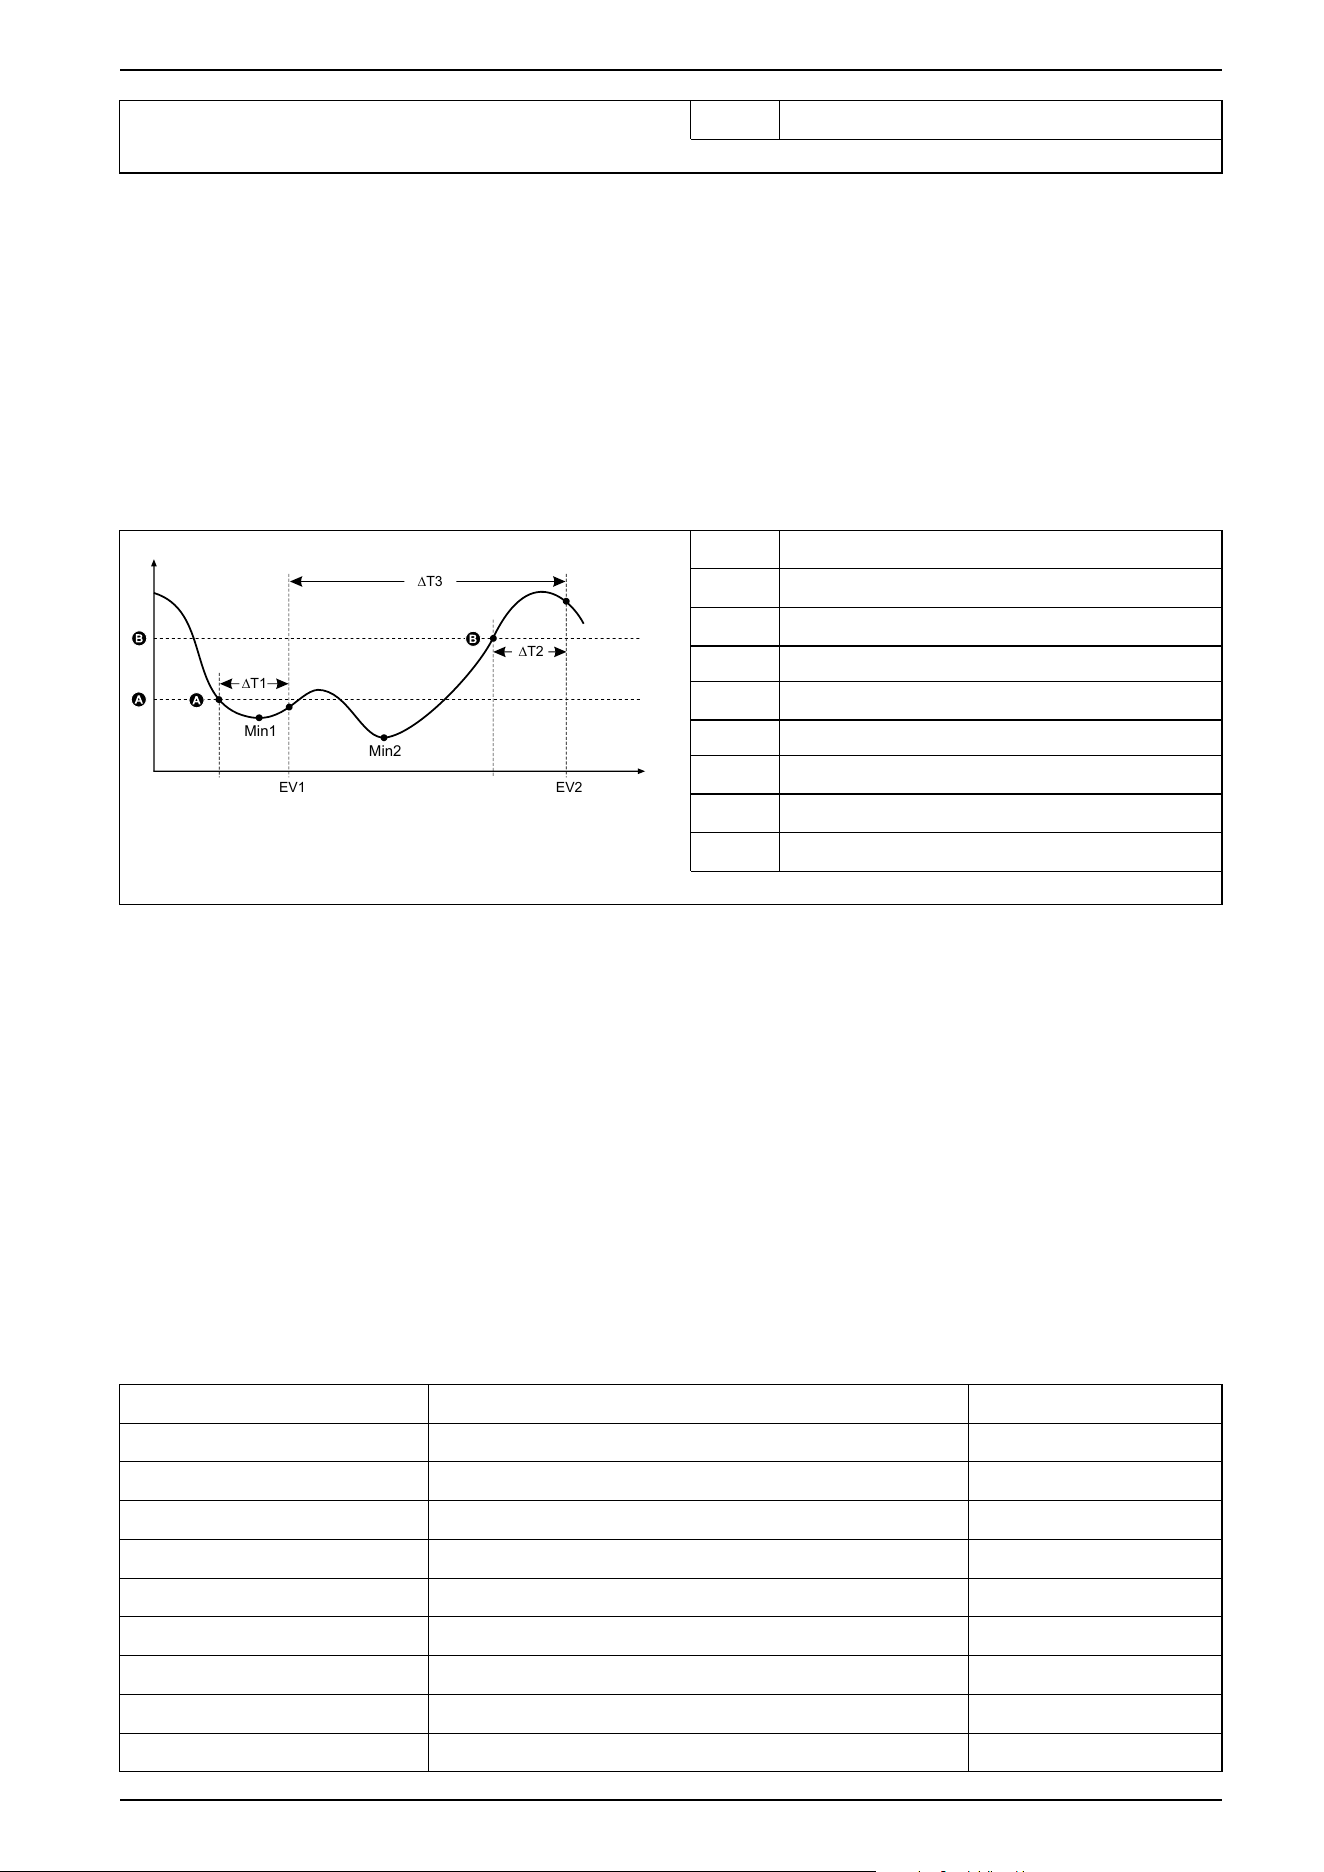
Max2 Maximum value recorded during alarm period
The meter records the date and time when the alarm event starts (EV1) and when
it ends (EV2). The meter also performs any task assigned to the event, such as
operating a digital output. The meter also records maximum values (Max1, Max2)
before, during or after the alarm period.
Under setpoint
When the value falls below the pickup setpoint setting and remains there long
enough to satisfy the pickup time delay period (ΔT1), the alarm condition is set to
ON. When the value rises above the dropout setpoint setting and remains there
long enough to satisfy the dropout time delay period (ΔT2), the alarm condition is
set to OFF.
EV1
EV2
∆T1
∆T2
∆T3
Min1
Min2
A Pickup setpoint
B Dropout setpoint
ΔT1 Pickup time delay period (in seconds)
EV1 Start of alarm condition
ΔT2 Dropout time delay (in seconds)
EV2 End of alarm condition
ΔT3 Alarm duration (in seconds)
Min1 Minimum value recorded during pickup period
Min2 Minimum value recorded during alarm period
The meter records the date and time when the alarm event starts (EV1) and when
it ends (EV2). The meter also performs any task assigned to the event, such as
operating a digital output. The meter also records minimum values (Min1, Min2)
before, during or after the alarm period.
9.5.5.2 Maximum allowable setpoint
The meter is programmed to help prevent user data entry errors, with set limits for
the standard alarms.
The maximum setpoint value you can enter for some of the standard alarms
depends on the voltage transformer ratio (VT ratio), current transformer ratio (CT
ratio), system type (example, number of phases) or the maximum voltage and
maximum current limits programmed at the factory.
NOTE: VT ratio is the VT primary divided by the VT secondary and CT ratio is
the CT primary divided by the CT secondary.
Standard alarm
Maximum setpoint value Valid range
Over Current, Phase (maximum current) x (CT ratio)
0.000 to 99999.000 A
Under Current, Phase (maximum current) x (CT ratio) 0.000 to 99999.000 A
Over Current, Neutral (maximum current) x (CT ratio) x (number of phases) 0.000 to 99999.000 A
Over Current, Ground (maximum current) x (CT ratio) 0.000 to 99999.000 A
Over Voltage, L-L (maximum voltage) x (VT ratio) 0.00 to 999999.00 V
Under Voltage, L-L (maximum voltage) x (VT ratio) 0.00 to 999999.00 V
Over Voltage, L-N (maximum voltage) x (VT ratio) 0.00 to 999999.00 V
Under Voltage L-N (maximum voltage) x (VT ratio) 0.00 to 999999.00 V
Over Power, Active (maximum voltage) x (maximum current) x (number of phases) 0.0 to 9999999.0 kW
7EN02-0489-00 107
9. Technical reference PowerLogic
™
Intuitive PM7100 / PM7200 / PM7300 series
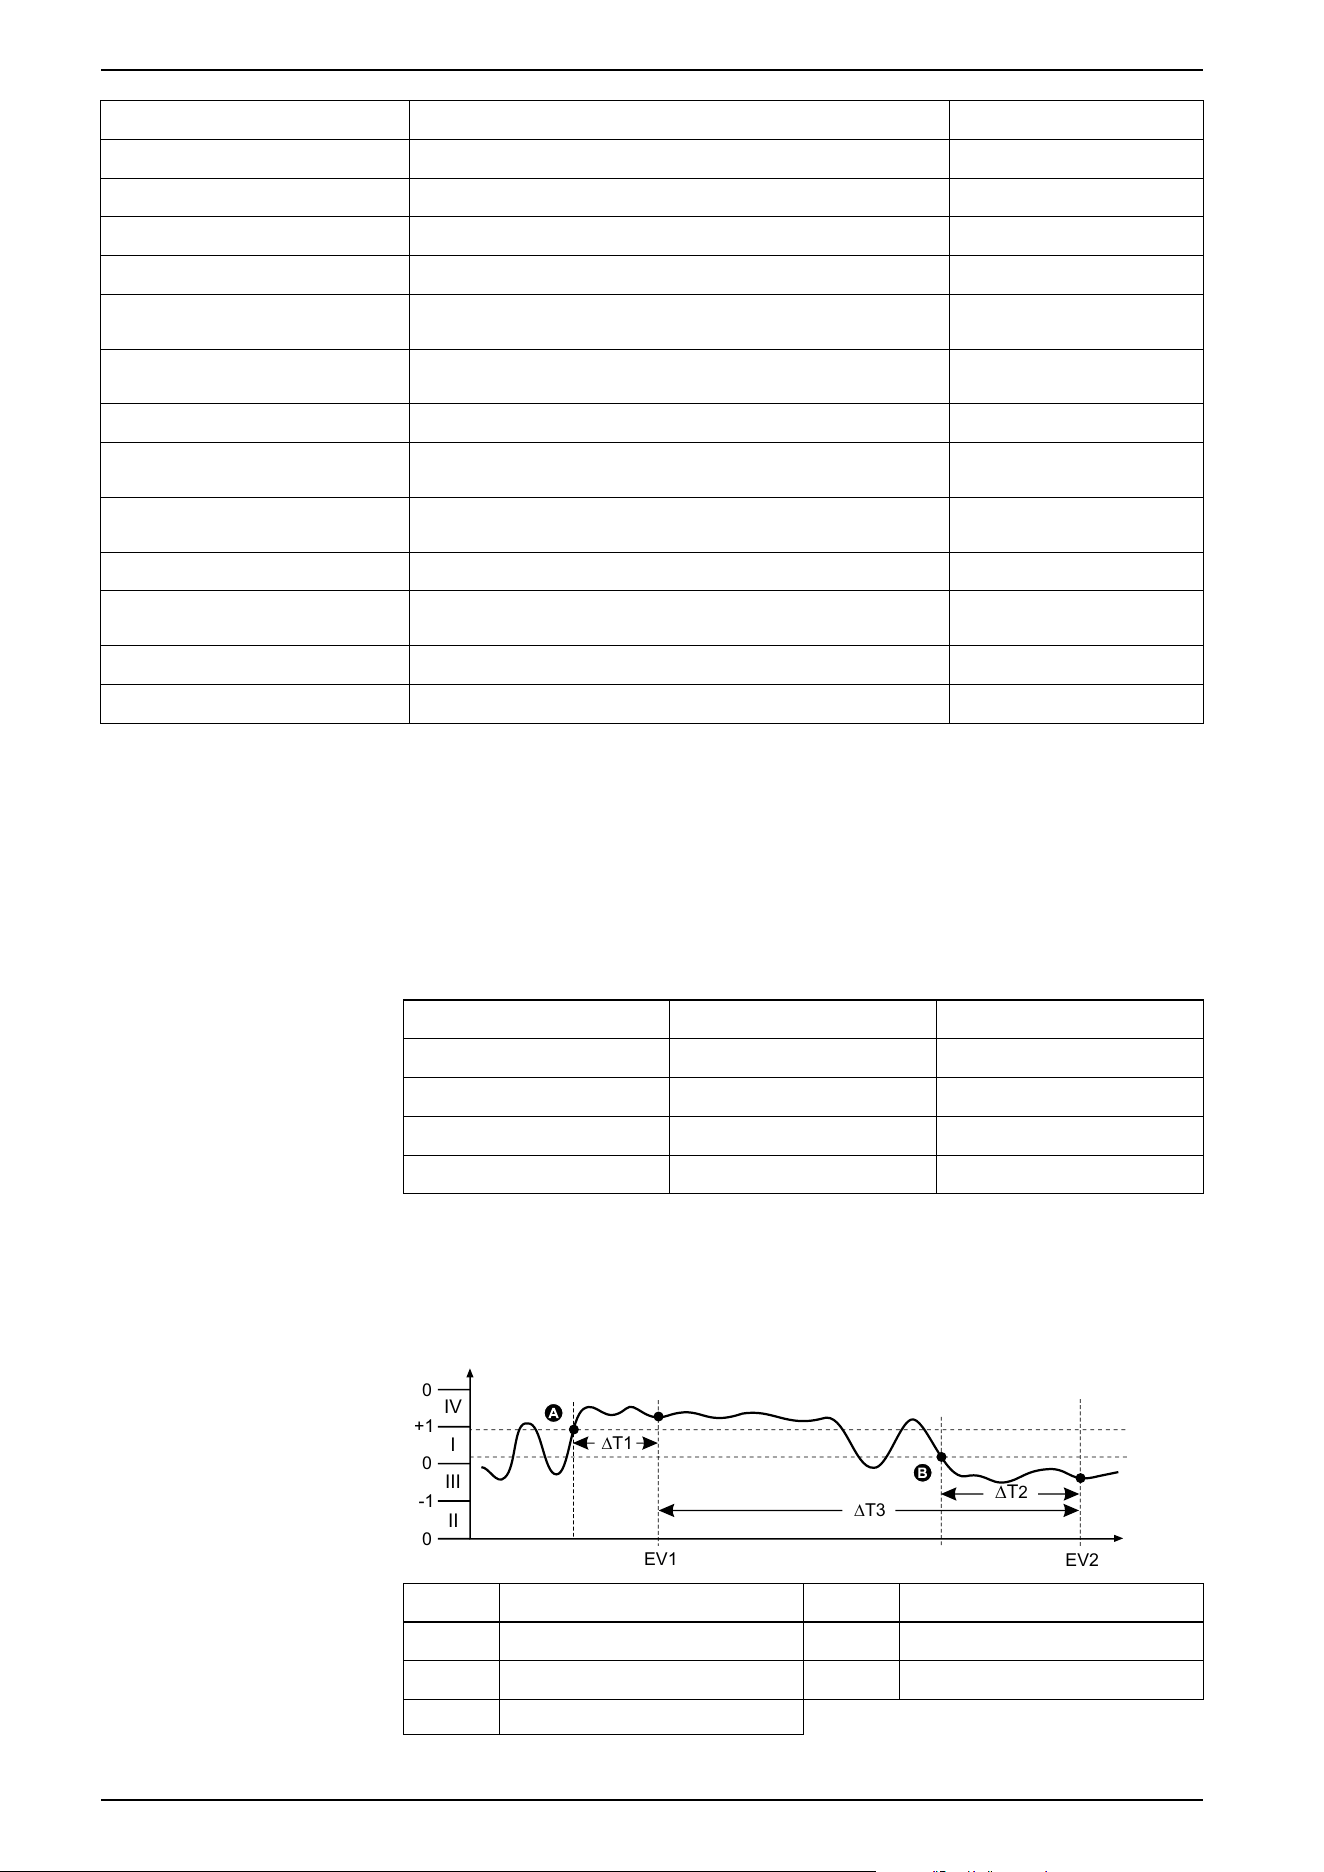
Standard alarm
Maximum setpoint value Valid range
Over Power, Reactive (maximum voltage) x (maximum current) x (number of phases) 0.0 to 9999999.0 kvar
Over Power, Apparent (maximum voltage) x (maximum current) x (number of phases) 0.0 to 9999999.0 kVA
Over Demand Active Power, Present (maximum voltage) x (maximum current) x (number of phases) 0.0 to 9999999.0 kW
Over Demand Active Power, Last (maximum voltage) x (maximum current) x (number of phases) 0.0 to 9999999.0 kW
Over Demand Active Power,
Predicted
(maximum voltage) x (maximum current) x (number of phases) 0.0 to 9999999.0 kW
Over Demand Reactive Power,
Present
(maximum voltage) x (maximum current) x (number of phases) 0.0 to 9999999.0 kvar
Over Demand Reactive Power, Last (maximum voltage) x (maximum current) x (number of phases) 0.0 to 9999999.0 kvar
Over Demand Reactive Power,
Predicted
(maximum voltage) x (maximum current) x (number of phases) 0.0 to 9999999.0 kvar
Over Demand Apparent Power,
Present
(maximum voltage) x (maximum current) x (number of phases) 0.0 to 9999999.0 kVA
Over Demand Apparent Power, Last (maximum voltage) x (maximum current) x (number of phases) 0.0 to 9999999.0 kVA
Over Demand Apparent Power,
Predicted
(maximum voltage) x (maximum current) x (number of phases) 0.0 to 9999999.0 kVA
Over Voltage Unbalance (maximum voltage) x (VT ratio) 0 to 99%
Phase Loss (maximum voltage) x (VT ratio) 0.00 to 999999.00
9.5.5.3 Power factor (PF) alarms
You can set up a Leading PF or Lagging PF alarm to monitor when the circuit’s
power factor goes above or below the threshold you specify.
The Leading PF and Lagging PF alarms use the power factor quadrants as the
values on the y-axis, with quadrant II on the lowest end of the scale, followed by
quadrant III, quadrant I, and finally quadrant IV on the highest end of the scale.
Quadrant PF values Lead/Lag
II 0 to -1 Leading (capacitive)
III -1 to 0 Lagging (inductive)
I 0 to 1 Lagging (inductive)
IV 1 to 0 Leading (capacitive)
Leading PF alarm
The Leading PF alarm monitors an over setpoint condition.
∆T3
∆T
2
∆T1
EV1
EV2
II
IV
I
III
0
+1
0
-1
0
A Pickup setpoint ΔT2 Dropout time delay (in seconds)
B Dropout setpoint EV2 End of alarm condition
ΔT1 Pickup delay period (in seconds) ΔT3 Alarm duration (in seconds)
EV1 Start of alarm condition
108 7EN02-0489-00
PowerLogic
™
Intuitive PM7100 / PM7200 / PM7300 series 9. Technical reference
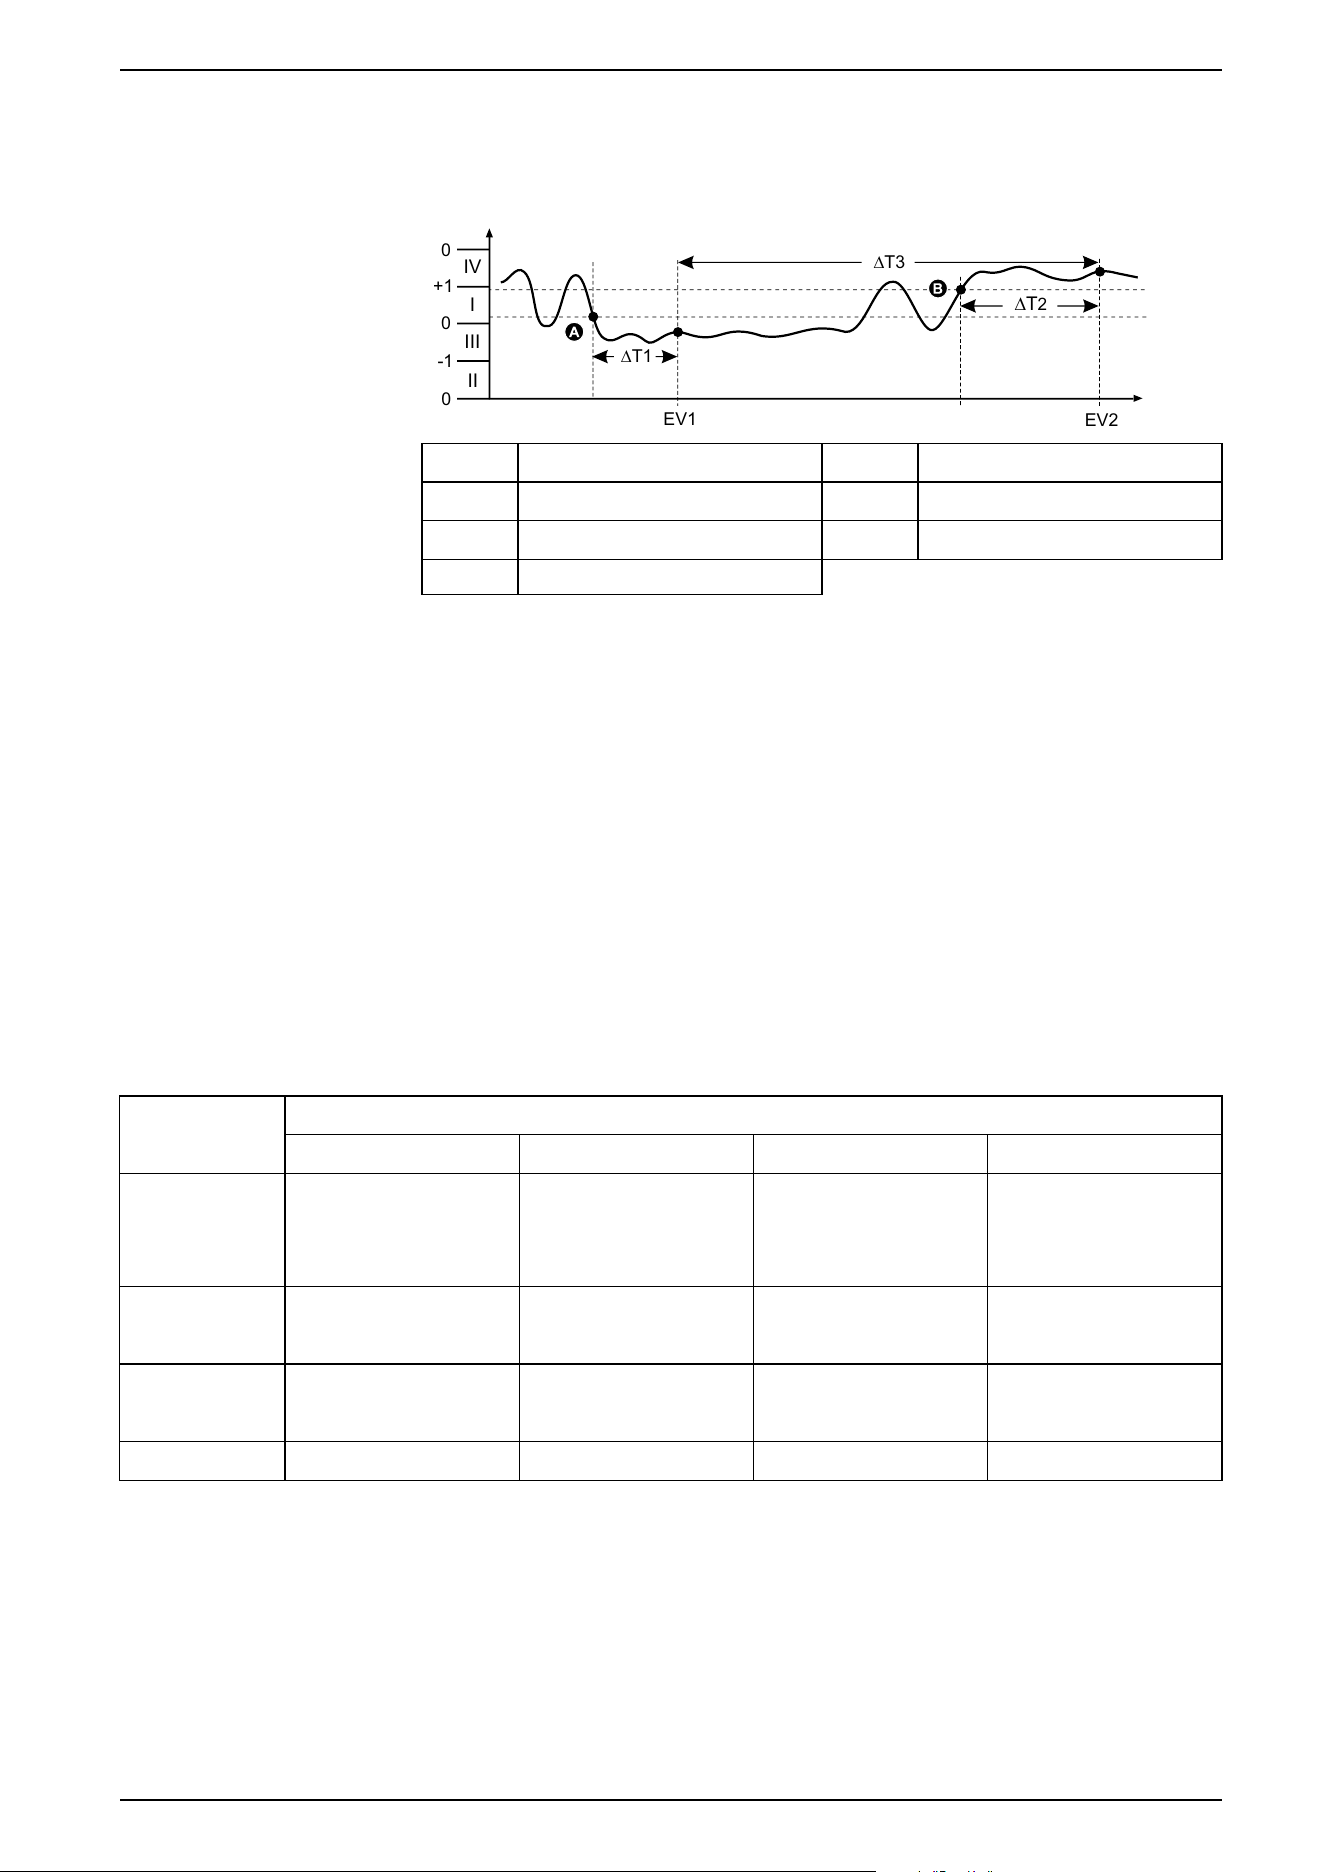
Lagging PF alarm
The Lagging PF alarm monitors an under setpoint condition.
II
IV
∆T3
∆T
2
∆T1
EV1
EV2
I
III
0
+1
0
-1
0
A Pickup setpoint ΔT2 Dropout time delay (in seconds)
B Dropout setpoint EV2 End of alarm condition
ΔT1 Pickup delay period (in seconds) ΔT3 Alarm duration (in seconds)
EV1 Start of alarm condition
9.5.5.4 Phase loss alarm
The phase loss alarm is an under setpoint alarm that monitors the voltages on a 3-
phase system and triggers the alarm when one or two phases fall below the
pickup setpoint setting and remain there long enough to satisfy the pickup time
delay period.
When all of the phases rise above the dropout setpoint setting and remain there
long enough to satisfy the dropout time delay period, the alarm condition is set to
OFF.
9.5.6 Alarm priorities
Each alarm has a priority level that you can use to distinguish between events that
require immediate action and those that do not require action.
Alarm priority Alarm display notification and recording method
Alarm LED Alarm icon Alarm details Alarm logging
High Blinks while the alarm is
active.
Blinks while the alarm is
active. Alarm icon remains
displayed until
acknowledged.
Click Details to display
what caused the alarm to
pickup or drop off. Click
Ack to acknowledge the
alarm.
Recorded in alarm log.
Medium Blinks while the alarm is
active.
Blinks while the alarm is
active.
Click Details to display
what caused the alarm to
pickup or drop off.
Recorded in alarm log.
Low Blinks while the alarm is
active.
Blinks while the alarm is
active.
Click Details to display
what caused the alarm to
pickup or drop off.
Recorded in alarm log.
None No activity None None Recorded in event log only.
NOTE: The alarm LED notification only occurs if the alarm/energy pulsing
LED is configured for alarming.
Multiple alarm considerations
If multiple alarms with different priorities are active at the same time, the display
shows the alarms in the order of alarm IDs.
7EN02-0489-00 109
9. Technical reference PowerLogic
™
Intuitive PM7100 / PM7200 / PM7300 series

9.5.7 Alarm setup overview
You can use the meter display or PowerLogic™ Engineering Suite to configure
unary, digital, or standard (1-Sec) alarms.
If you make changes to the basic power meter setup, all alarms are disabled to
help prevent undesired alarm operation. If you configure standard alarm setpoints
using the display, any decimals previously configured using PowerLogic™
Engineering Suite are lost.
NOTICE
UNINTENDED EQUIPMENT OPERATION
• Verify all alarm settings are correct and adjust, as necessary.
• Re-enable all configured alarms.
Failure to follow these instructions can result in incorrect alarm functions.
9.5.8 LED alarm indicator
You can use the meter’s alarm/energy pulsing LED as an alarm indicator.
When set to detect alarms, the LED blinks to indicate an alarm condition.
9.5.9 Alarm display and notification
The meter notifies you when an alarm condition is detected.
Alarm icon
When a low, medium, or high priority alarm is tripped, this symbol appears at the
top right corner of the display screen, indicating that an alarm is active:
For high priority alarms, the alarm icon remains displayed until you acknowledge
the alarm.
Active alarms
When a pickup event occurs, the active alarm list appears on the Active Alarms
screen.
Alarm details
Details about the alarms can be viewed using Active Alarms, Alarm History,
Unack. Alarms, and Alarm counter screens on the meter display.
9.5.10 Active alarms list and alarm history log
Each occurrence of a low, medium, or high priority events is stored in the active
alarms list and recorded in the alarm history log.
110 7EN02-0489-00
PowerLogic
™
Intuitive PM7100 / PM7200 / PM7300 series 9. Technical reference

The active alarm list holds 40 entries at a time. The list works as a circular buffer,
replacing old entries as new entries over 40 are entered into the active alarms list.
The information in the active alarms list is volatile and re- initializes when the
meter resets.
The alarm history log holds 40 entries. The log also works as a circular buffer,
replacing old entries with new entries. The information in the alarm history log is
non-volatile and is retained when the meter resets.
7EN02-0489-00 111
9. Technical reference PowerLogic
™
Intuitive PM7100 / PM7200 / PM7300 series
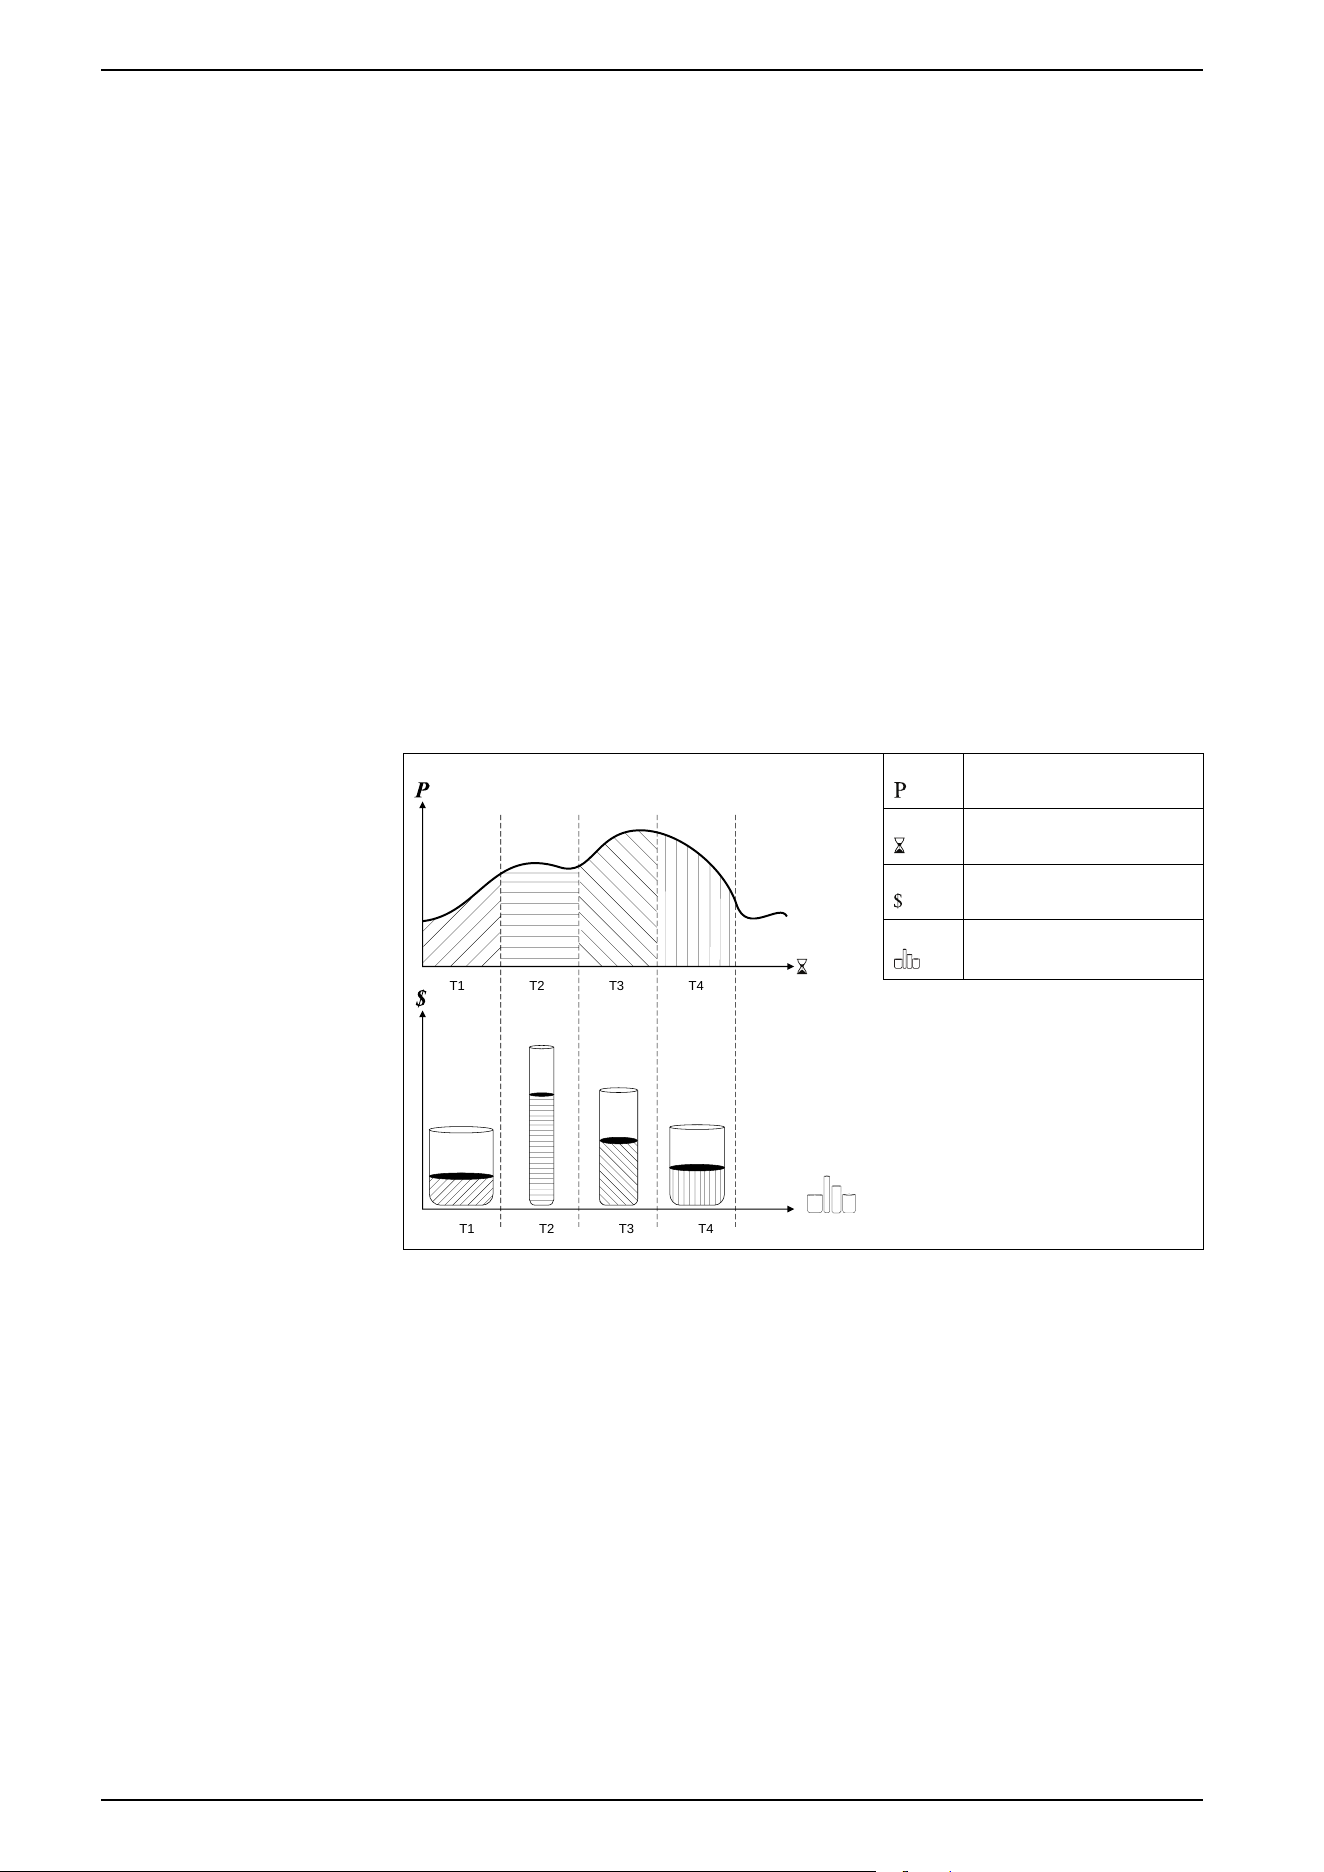
9.6 Multi-tariff
9.6.1 Overview
The multi-tariff feature allows you to set up different tariffs for storing energy
values. The energy values for different tariffs are stored in registers that
correspond to each of those tariffs. The meter supports configuration of up to 16
different tariffs. Multi-tariffs can be configured only through PowerLogic™
Engineering Suite or Modbus command.
Multi-tariff example
The multi-tariff feature can be used when a utility has set up tariff schedules with
different rates based on what day or time-of-day energy is consumed.
In the following illustration, the area under the power curve equals the energy
consumed.
Typically, the utility sets tariff schedules so the cost of energy is higher during high
demand or high energy consumption times. How these “tariff energy containers”
are configured determines how fast these containers fill, which correlates to
increasing energy costs. The price per kWh is lowest at tariff T1 and highest at
tariff T2.
T1 T2 T3 T4
T1 T2 T3 T4
Power
Time
Cost
Tariff energy containers
9.6.2 Multi-tariff implementation
The meter supports configuration of up to 16 different tariffs to measure and
monitor energy usage that can be used in billing or cost applications.
There are three different tariff modes you can use to activate the multi-tariff
registers:
• Command mode
• Time-of-day mode
• Input mode
112 7EN02-0489-00
PowerLogic
™
Intuitive PM7100 / PM7200 / PM7300 series 9. Technical reference

9.6.3 Tariff setup
You can change tariffs and the tariff mode using PowerLogic™ Engineering Suite
or Modbus command.
You can configure input mode and time-of-day mode using the PowerLogic™
Engineering Suite or Modbus command. It is recommended that you use
PowerLogic™ Engineering Suite to configure time-of-day mode.
The active tariff is controlled based on the tariff mode.
• When the meter is set to command mode, the active tariff is controlled by the
Modbus commands from your energy management system or other Modbus
client.
• When the meter is set to input mode, the active tariff is controlled by the
status of the digital inputs.
• When the meter is set to time-of-day mode, the active tariff is controlled by
the day type, the start and end times, and the start and end dates.
9.6.4 Command mode overview
You can use command mode to set the active tariff on the device by sending a
Modbus command or by using PowerLogic™ Engineering Suite.
The selected tariff is applied to the measured energy until another command is
issued to activate a different tariff.
If you are using Modbus, search for your meter's Modbus register list at
www.se.com to download the Modbus map.
9.6.5 Time-of-day mode overview
You can use time-of-day mode to create a tariff schedule that specifies where the
meter stores energy or input metered data based on the time of year (month and
day), the type of day (every day, weekend, weekday, or a specific day of the
week), and the time of day. Configure the schedule using Modbus command or by
using PowerLogic™ Engineering Suite.
The data collected from the different tariffs can then be used in energy audits or
similar costing and budget planning purposes.
9.6.5.1 Time-of-day mode tariff validity
A valid time-of-day tariff has certain conditions and limitations:
• Each tariff must cover a unique time (tariffs cannot overlap), but there can be
periods with no tariff.
• Any number of tariffs, from none to the maximum number of tariffs, can be
applied.
• Time-of-day tariffs do not adjust for daylight savings time.
• Time-of-day tariffs include February 29th in leap years (however, it is not
recommended to have February 29th as a start or end date, as that tariff
would be invalid for non-leap years.
• Except for leap years, tariff dates are not year specific. If you wanted to create
a tariff that starts on the first Monday in August, you need to enter the date for
that year, then manually update the tariff information for the subsequent
years.
Your device performs validation checks as you enter tariff information. It prompts
you to change the information that you have entered or set the tariff to disabled if
the tariff configuration is invalid. These checks can include:
7EN02-0489-00 113
9. Technical reference PowerLogic
™
Intuitive PM7100 / PM7200 / PM7300 series

• Start and end times must be different (for example, you cannot create a tariff
that starts at 02:00 and ends at 02:00).
• Start time can only be earlier than end time for tariffs that are applied every
day. You can create a daily tariff that starts at 06:00 and ends at 02:00, but
these times are only valid for the Everyday tariff and invalid for the other tariff
types.
• Start day must be earlier than end day if the days are in the same month. You
cannot create a tariff that starts June 15 and ends June 12.
9.6.5.2 Time-of-day tariff creation methods
You can create time-of-day tariffs using one of two methods, or a combination of
these methods.
The two methods of creating tariffs are:
• Time of year tariffs divide the year into multiple sections (usually seasons),
where each section has one or more day types. For example, an eight-tariff
configuration using this method could have Spring, Summer, Fall and Winter
seasons that also use different weekend and weekday tariffs.
• Daily tariffs can divide days by day of the week, a weekday, a weekend, or
every day, and can specify the time-of-day. For example, an eight-tariff
configuration could have every day in the year divided into three-hour tariff
periods or could have four tariffs for weekends and four tariffs for weekdays.
You can combine these methods, for example, if you wanted to create a tariff that
applies on Mondays from January 1 to June 30, from 09:00 to 17:00. However,
since only one tariff can be applied at any time, you cannot use an everyday or
weekday tariff type because you already specified a tariff for the time periods
09:00 to 17:00.
Depending on how you configure the tariffs and the maximum number of tariffs
supported by your meter, you may not be able to assign tariffs for the entire year,
potentially leaving time gaps that do not have any tariff assigned to them.
9.6.5.3 Time-of-day mode tariff configuration considerations
The time-of-day tariff is not a calendar. The meter does not calculate the
corresponding day of the week to a specific date, but February 29th is considered
a valid date if you are programming the meter during a leap year.
When you enter tariff time, be aware that the displayed minute value includes the
entire minute. For example, an end time of 01:15 includes the time from 01:15:00
through 01:15:59. To create a tariff period that starts right after this, you must set
the next tariff’s start time to 01:16. Although it may appear that there is a gap
between these tariffs, there is not.
NOTE: You must always set the tariff times to UTC (GMT, Greenwich Mean
Time), not local time. The GMT Offset (h) setup parameter does not apply to
tariff times.
9.6.5.4 Example tariff configurations for a four-tariff system
In these examples, four tariffs are used to cover the entire year (there are no time
periods that do not have an associated tariff).
Configuration 1: four tariffs with weekdays and weekends
Tariff Type Start date End date Start time End time
1 Weekend June 21 December 20 00:00 23:59
2 Weekend December 21 June 20 00:00 23:59
3 Weekday June 21 December 20 00:00 23:59
4 Weekday December 21 June 20 00:00 23:59
114 7EN02-0489-00
PowerLogic
™
Intuitive PM7100 / PM7200 / PM7300 series 9. Technical reference

NOTE: The end time of 23:59 is 23:59:59 or just before midnight.
All weekend days fall into one of two different tariffs, depending on the date. All
weekdays fall into one of two different tariffs, depending on the date. This
configuration does not use tariffs based on the time-of-day, or any day types other
than weekend or weekday.
Example dates and corresponding tariffs:
• Friday, June 29 = tariff 3
• Sunday, November 28th = tariff 1
Configuration 2: one season for weekends, with off-peak and shoulder hours, two
seasons for weekdays, with shoulder hours
Tariff Type Start date End date Start time End time
1 Every day January 1 December 31 23:00 04:59
2 Weekdays May 1 September 20 00:00 22:59
3 Weekdays October 1 April 30 05:00 22:59
4 Weekends January 1 December 31 05:00 22:59
All days have a tariff applied between 23:00 and 04:59, corresponding to off-peak
hours. All weekend days have a tariff applied from 05:00 to 22:59, corresponding
to shoulder hours. All weekdays fall into one of two seasons (summer or winter)
and have two tariffs applied throughout the day.
Example dates and corresponding tariffs:
• Wednesday, March 21, 08:00 = tariff 3
• Tuesday, January 10, 21:00 = tariff 3
• Sunday, June 24, 14:00 = tariff 4
• Friday, August 17, 00:00 = tariff 1
9.6.6 Input mode overview
You can use input mode to have the digital inputs of the device set to know which
tariff is applied to the energy that is presently being consumed.
The number of different tariffs that can be applied is determined by the number of
available digital inputs and the total number of tariffs supported by your device.
9.6.6.1 Input mode tariff configuration considerations
Digital inputs are available for tariffs if they are not used, or if they are only
associated with alarms (Normal). To make a digital input available, you must
manually disconnect the conflicting association before configuring tariffs.
NOTE: You must always set the tariff times to UTC (GMT, Greenwich Mean
Time), not local time. The GMT Offset (h) setup parameter does not apply to
tariff times.
To configure the tariffs using the PowerLogic™ Engineering Suite, see the
PowerLogic™ Engineering Suite online help or in the PowerLogic™ Engineering
Suite device configuration guide, available for download at www.se.com.
9.6.6.2 Digital input assignment for input control mode
You need to assign one or more digital inputs with non-exclusive associations to
define the active tariff.
If a digital input is used for multi-tariff, it cannot be used for an exclusive
association (such as Demand Sync or Input Metering), but digital inputs can be
7EN02-0489-00 115
9. Technical reference PowerLogic
™
Intuitive PM7100 / PM7200 / PM7300 series
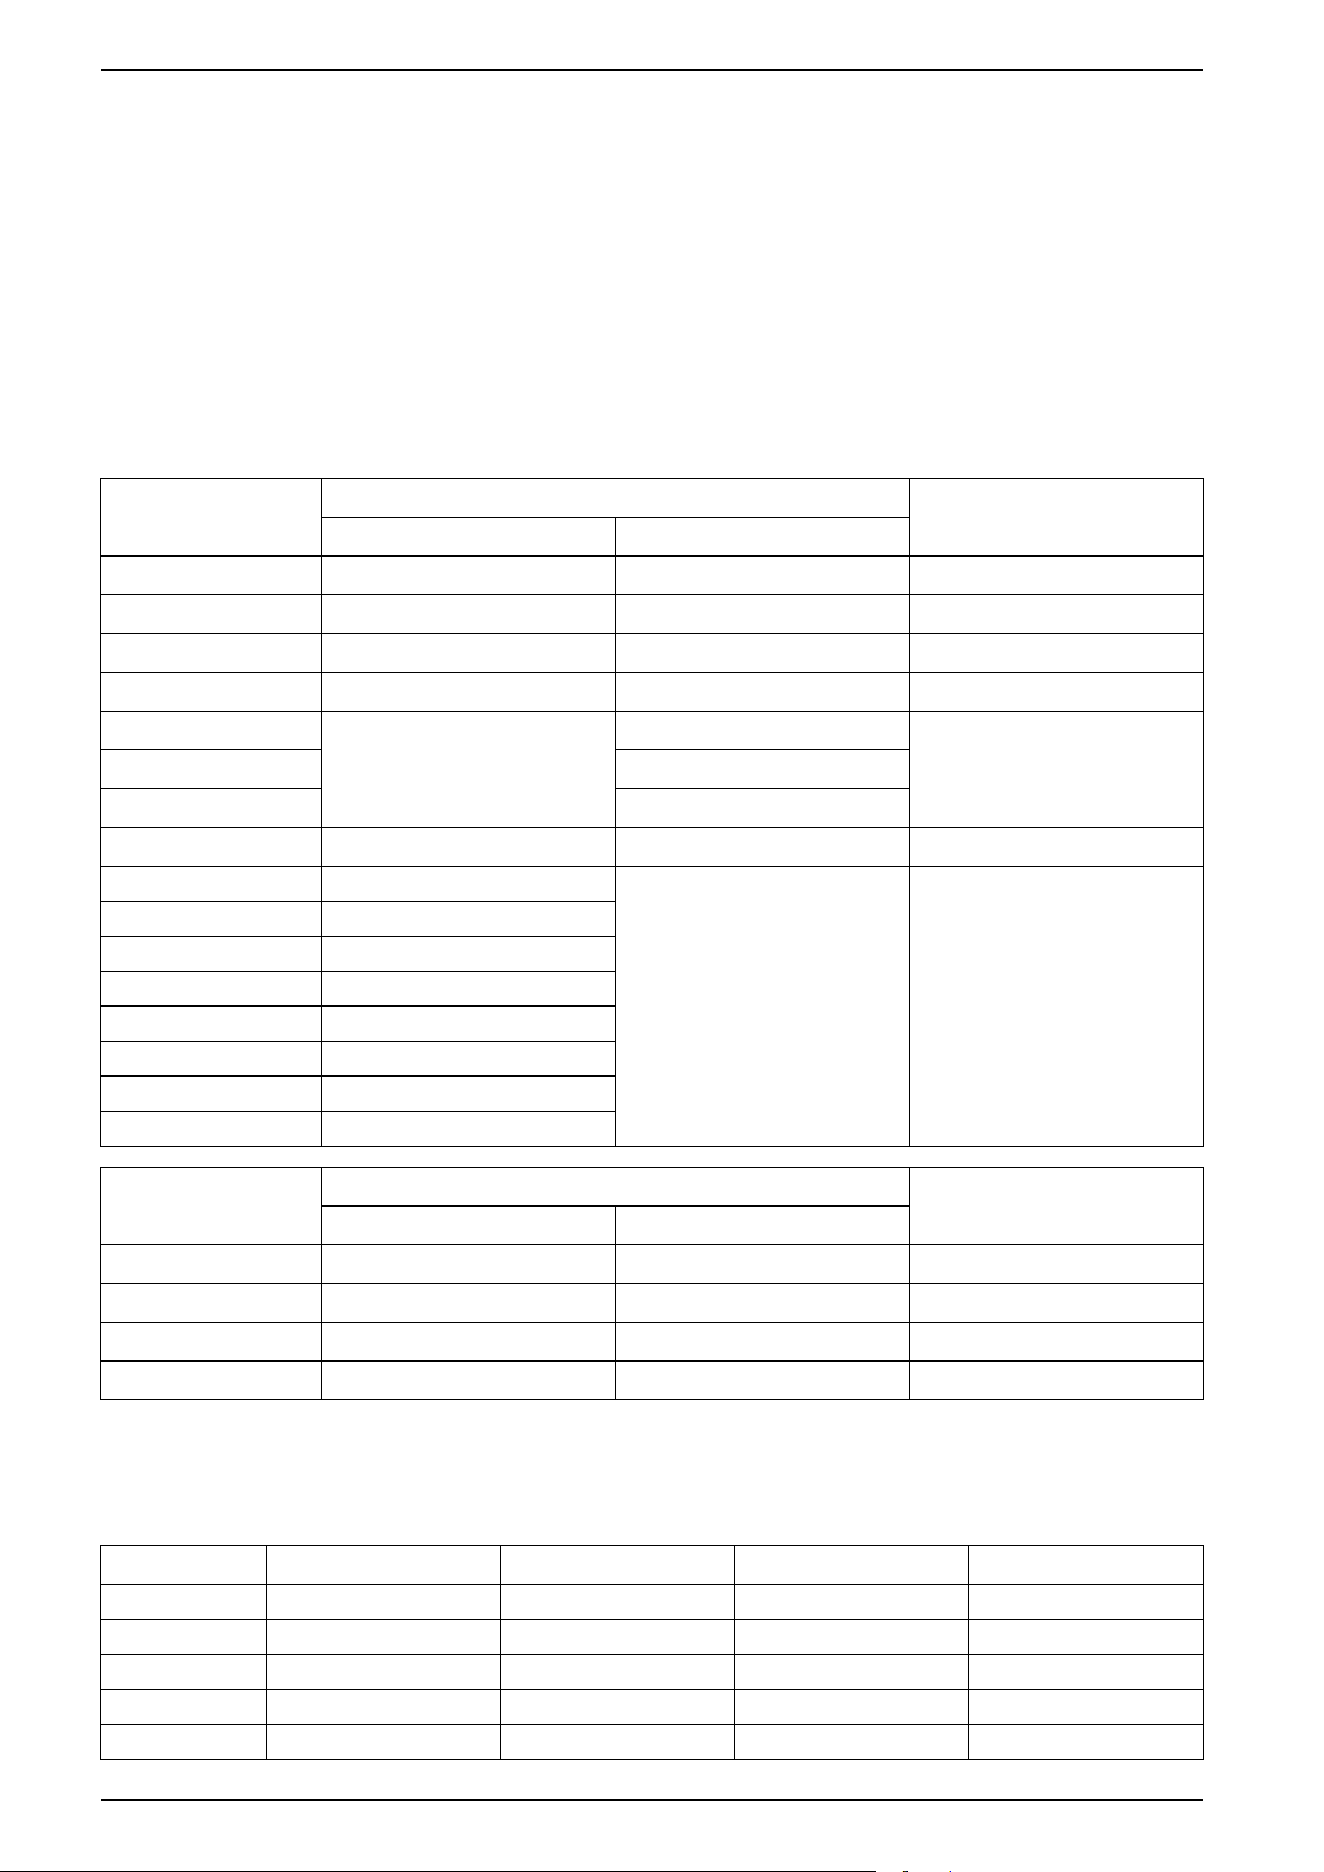
shared with a non-exclusive association (such as Alarms). To make a digital input
available for setting tariffs, any conflicting associations must be manually removed
at the source of the original association.
You cannot configure any digital input tariff if digital input 1 is not available for
association. Likewise, digital input 2 must be available to select more than two
tariffs.
The status of the digital inputs is used to calculate the binary value of the active
tariff, where off = 0 and on = 1. The calculation of the number of tariffs value can
differ, depending on the number of digital inputs that can be selected (that is,
inputs that can be associated with multi-tariff).
Digital inputs requirements for required number of tariffs
Number of tariffs
required
Digital inputs required
Tariff selection conditions
Configuration 1 Configuration 2
1
—
1 (digital input 1) Must use 1 digital input
2 1 (digital input 1) 2 (digital input 1 and 2) Must use 1 or 2 digital inputs
3
—
2 (digital input 1 and 2) Must use 2 digital inputs
4 2 (digital input 1 and 2) 3 (digital input 1, 2 and 3) Must use 2 or 3 digital inputs
5
—
3 (digital input 1, 2 and 3)
Must use 3 digital inputs6 3 (digital input 1, 2 and 3)
7
3 (digital input 1, 2 and 3)
8 3 (digital input 1, 2 and 3) 4 (digital input 1, 2, 3 and 4) Must use 3 or 4 digital inputs
9
—
4 (digital input 1, 2, 3 and 4) Must use 4 digital inputs
10
—
11
—
12
—
13
—
14
—
15
—
16
—
Number of tariffs
required
Digital inputs required
Tariff selection conditions
Configuration 1 Configuration 2
1
—
1 (digital input 1) Must use 1 digital input
2 1 (digital input 1) 2 (digital input 1 and 2) Must use 1 or 2 digital inputs
3
—
2 (digital input 1 and 2) Must use 2 digital inputs
4 2 (digital input 1 and 2) 2 (digital input 1 and 2) Must use 2 digital inputs
Configuration 1: 16 tariff assignment using 4 digital inputs
NOTE: There is no inactive tariff with this configuration.
Tariff
Digital input 4 Digital input 3 Digital input 2 Digital input 1
T1 0 0 0 0
T2 0 0 0 1
T3 0 0 1 0
T4 0 0 1 1
T5 0 1 0 0
116 7EN02-0489-00
PowerLogic
™
Intuitive PM7100 / PM7200 / PM7300 series 9. Technical reference

Tariff
Digital input 4 Digital input 3 Digital input 2 Digital input 1
T6 0 1 0 1
T7 0 1 1 0
T8 0 1 1 1
T9 1 0 0 0
T10 1 0 0 1
T11 1 0 1 0
T12 1 0 1 1
T13 1 1 0 0
T14 1 1 0 1
T15 1 1 1 0
T16 1 1 1 1
Configuration 2: 15 tariff assignment using 4 digital inputs
Tariff
Digital input 4 Digital input 3 Digital input 2 Digital input 1
None
*
0 0 0 0
T1 0 0 0 1
T2 0 0 1 0
T3 0 0 1 1
T4 0 1 0 0
T5 0 1 0 1
T6 0 1 1 0
T7 0 1 1 1
T8 1 0 0 0
T9 1 0 0 1
T10 1 0 1 0
T11 1 0 1 1
T12 1 1 0 0
T13 1 1 0 1
T14 1 1 1 0
T15 1 1 1 1
* This digital input configuration (0000) means there are no active tariffs (all tariffs
are disabled).
Configuration 1: 8 tariff assignment using 3 digital inputs
NOTE: There is no inactive tariff with this configuration.
Tariff
Digital input 3 Digital input 2 Digital input 1
T1 0 0 0
T2 0 0 1
T3 0 1 0
T4 0 1 1
T5 1 0 0
T6 1 0 1
T7 1 1 0
T8 1 1 1
7EN02-0489-00 117
9. Technical reference PowerLogic
™
Intuitive PM7100 / PM7200 / PM7300 series
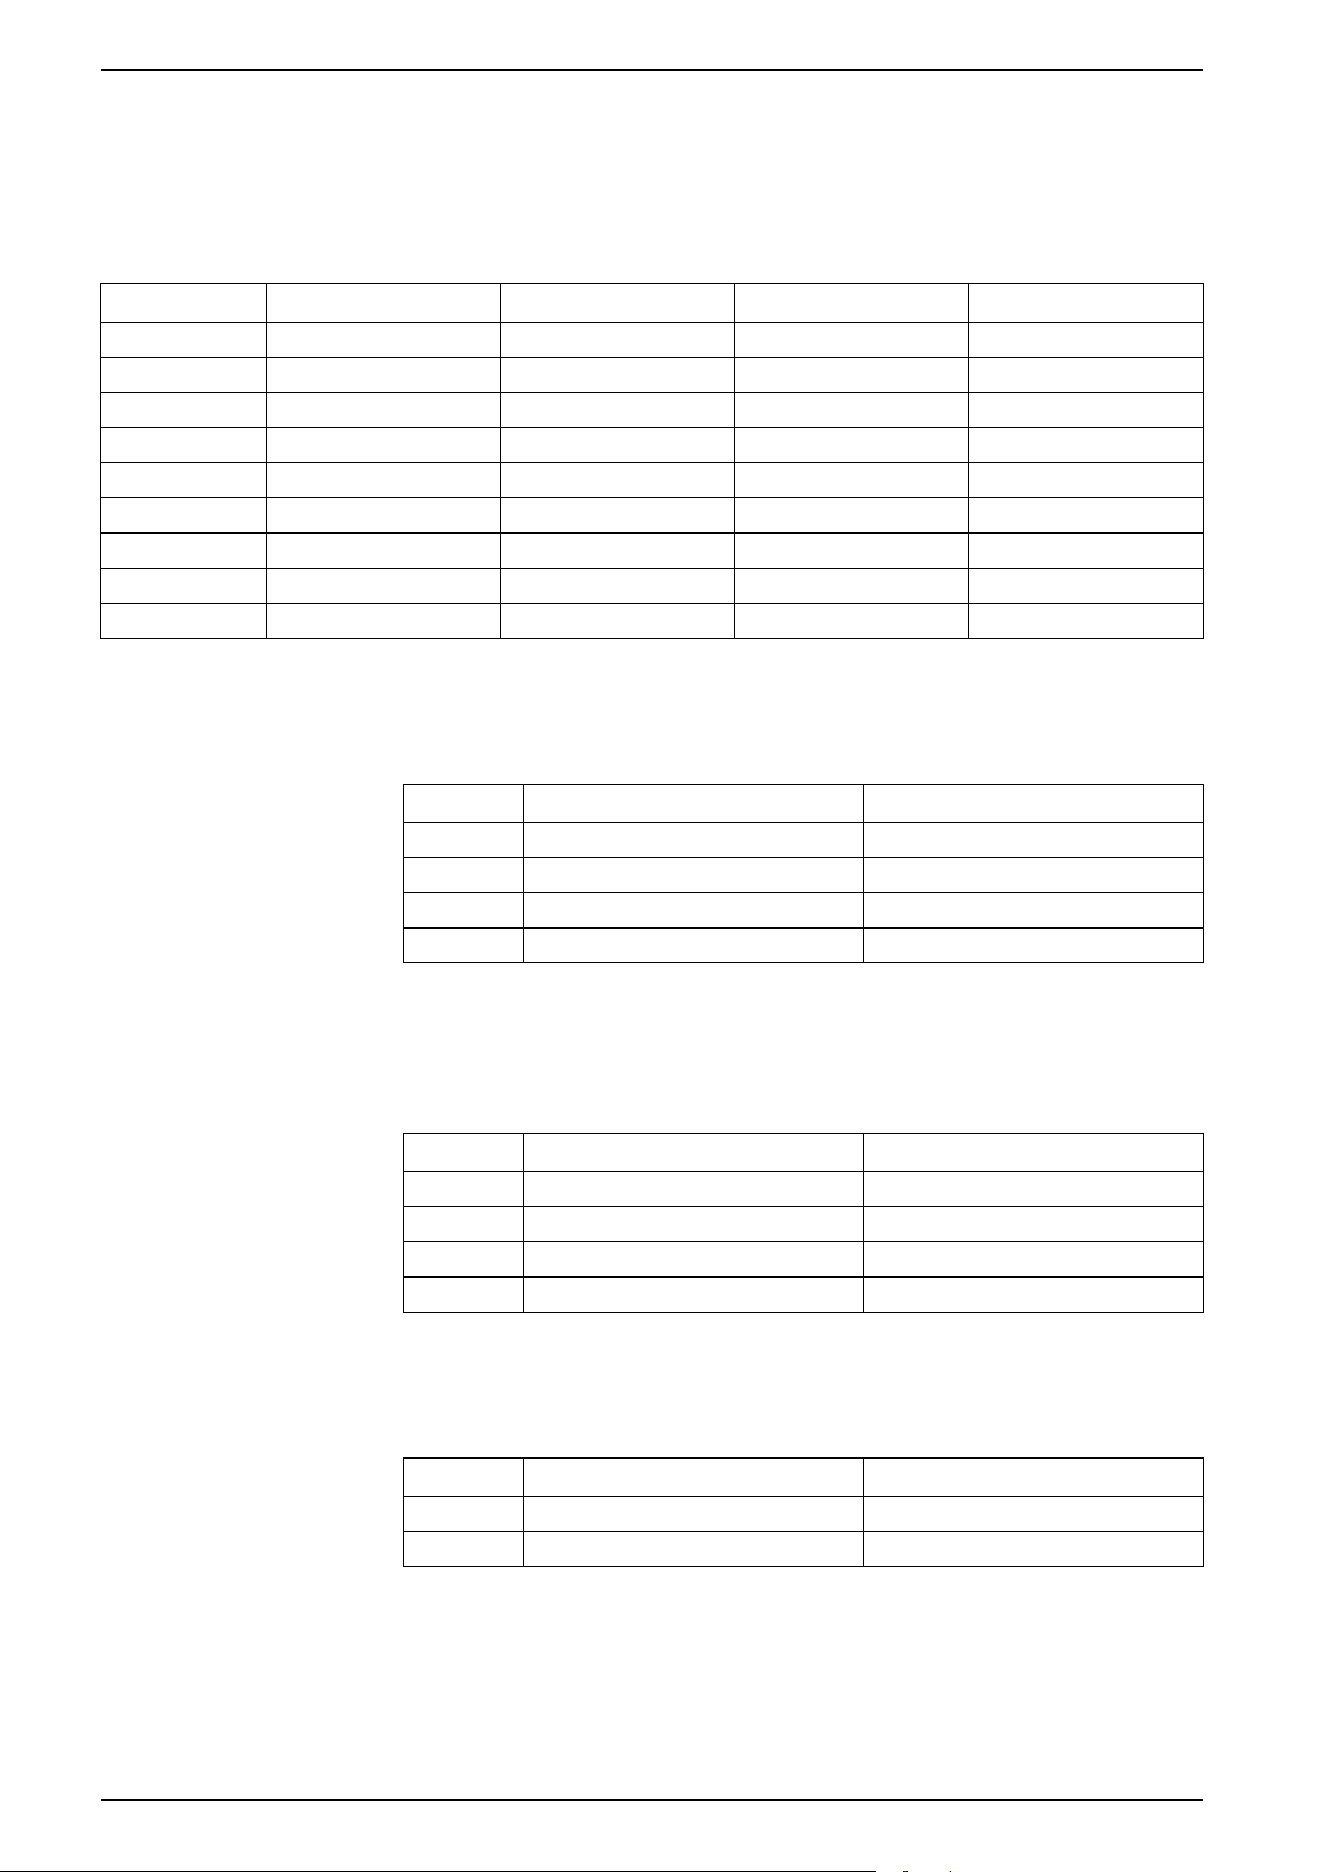
Configuration 2: 8 tariff assignment using 4 digital inputs
NOTE: Digital input configuration 0000 means there are no active tariffs (all
tariffs are disabled).
NOTE: Any configuration above T8 (that is, 1001 and higher) is invalid and
therefore ignored by the meter (the active tariff does not change).
Tariff Digital input 4 Digital input 3 Digital input 2 Digital input 1
None 0 0 0 0
T1 0 0 0 1
T2 0 0 1 0
T3 0 0 1 1
T4 0 1 0 0
T5 0 1 0 1
T6 0 1 1 0
T7 0 1 1 1
T8 1 0 0 0
Configuration 1: 4 tariff assignment using 2 digital inputs
NOTE: There is no inactive tariff with this configuration.
Tariff Digital input 2 Digital input 1
T1 0 0
T2 0 1
T3 1 0
T4 1 1
Configuration 2: 3 tariff assignment using 2 digital inputs
NOTE: Digital input configuration 00 means there are no active tariffs (all
tariffs are disabled).
Tariff Digital input 2 Digital input 1
None 0 0
T1 0 1
T2 1 0
T3 1 1
Configuration 1: 2 tariff assignment using 2 digital inputs
NOTE: There is no inactive tariff with this configuration.
Tariff Digital input 2 Digital input 1
T1 0 0
T2 0 1
Configuration 2: 2 tariff assignment using 2 digital inputs
NOTE: Digital input configuration 00 means there are no active tariffs (all
tariffs are disabled).
118 7EN02-0489-00
PowerLogic
™
Intuitive PM7100 / PM7200 / PM7300 series 9. Technical reference


9.7 Measurements
9.7.1 Instantaneous measurements
The meter provides highly accurate 1-second measurements.
These measurements include true RMS, per phase, and total for:
• 3-phase voltage (line-to-line, line-to-neutral)
• 3-phase current, neutral, and ground current
• Active (kW), reactive (kvar), and apparent (kVA) power
• True PF (power factor)
• Displacement PF
• System frequency
• Voltage (line-to-line, line-to-neutral) and current unbalance
The voltage and current inputs are continuously monitored at a sampling rate of
128 points per cycle. This amount of resolution helps enable the meter to provide
reliable measurements and calculated electrical values for various commercial,
buildings, and industrial applications.
9.7.2 Energy measurements
The meter provides fully bidirectional, 4-quadrant, Class 0.5S/0.2S accurate
energy metering.
The meter calculates and stores all accumulated active, reactive, and apparent
energy measurements in non-volatile memory:
• Wh, varh, VAh (delivered and received)
• Wh, varh, VAh net (delivered - received)
• Wh, varh, VAh absolute (delivered + received)
Energy registers can be logged automatically on a programmed schedule. All
energy parameters represent the total for all three phases. You can view
accumulated energy from the display.
9.7.3 Preset energy
NOTE: Not applicable for MID/MIR meter models.
You can input the previous energy values when you replace the meter. Preset
energy value cannot be set more than maximum energy overflow value
(9.2233 E).
The preset energy values include active energy (Wh), reactive energy (varh), and
apparent energy (VAh) (delivered and received).
9.7.4 Min/Max values
When readings reach their minimum or maximum values, the meter records the
values with a date and timestamp and stores them in nonvolatile memory.
The meter’s real-time readings are updated once every 50 cycles for 50 Hz
systems, or once every 60 cycles for 60 Hz systems.
120 7EN02-0489-00
PowerLogic
™
Intuitive PM7100 / PM7200 / PM7300 series 9. Technical reference

9.7.5 Demand measurements
The meter provides present, last, predicted, and peak (maximum) demand, and a
date/timestamp when the peak demand occurred.
The meter supports standard demand calculation methods, including sliding block,
fixed block, rolling block, thermal, and synchronized.
Peak demand registers can be reset manually (passcode protected) or logged and
reset automatically on a programmed schedule.
Demand measurements include:
• kW, kvar, kVA demand total, and per phase
NOTE: Per phase demand is supported only through the Modbus
communication.
• Amps demand average, per phase, neutral or ground.
• Demand calculation for pulse input metering (WAGES)
9.7.5.1 Power demand
Power demand is a measure of average power consumption over a fixed time
interval.
NOTE: If not specified, references to demand are assumed to mean power
demand.
The meter measures instantaneous consumption and can calculate demand using
various methods.
9.7.5.1.1 Power demand calculation methods
Power demand is calculated by dividing the energy accumulated during a
specified period by the length of that period.
How the meter performs this calculation depends on the method and time
parameters you select (for example, timed rolling block demand with a 15-minute
interval and 5-minute subinterval).
To be compatible with electric utility billing practices, the meter provides the
following types of power demand calculations:
• Block interval demand
• Synchronized demand
• Thermal demand
You can configure the power demand calculation method from the display or
software.
9.7.5.1.2 Block interval demand
For block interval demand method types, you specify a period interval (or block)
that the meter uses for the demand calculation.
Select/configure how the meter handles that interval from one of these different
methods:
7EN02-0489-00 121
9. Technical reference PowerLogic
™
Intuitive PM7100 / PM7200 / PM7300 series
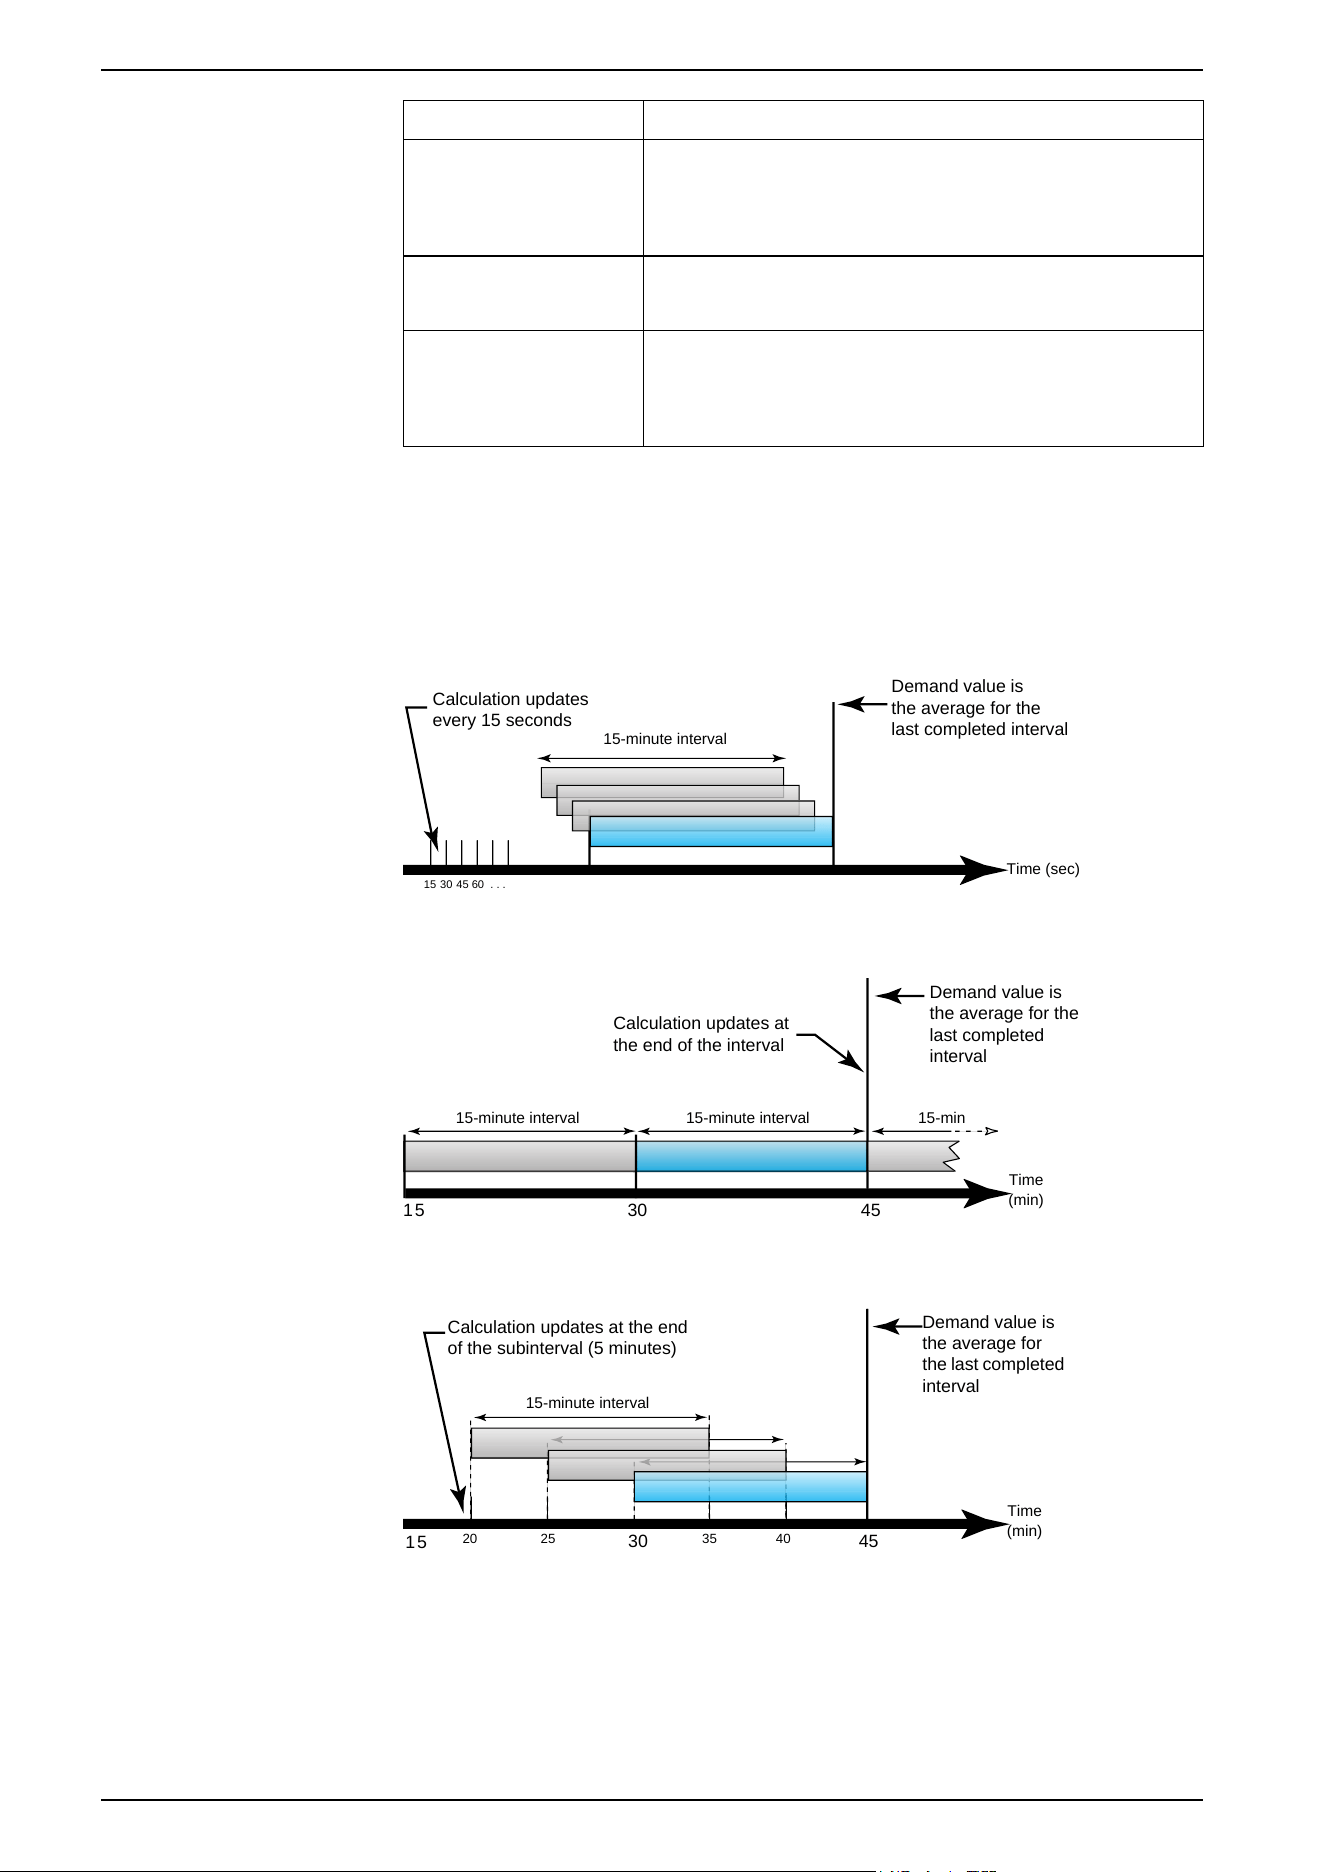
Type Description
Timed Sliding Block Select an interval from 1 to 60 minutes (in 1-minute increments). If
the interval is between 1 and 15 minutes, the demand calculation
updates every 15 seconds. If the interval is between 16 and 60
minutes, the demand calculation updates every 60 seconds. The
meter displays the demand value for the last completed interval.
Timed Block Select an interval from 1 to 60 minutes (in 1-minute increments). The
meter calculates and updates the demand at the end of each
interval.
Timed Rolling Block Select an interval and a subinterval. The subinterval must divide
evenly into the interval (for example, three 5-minute subintervals for
a 15-minute interval). Demand is updated at the end of each
subinterval. The meter displays the demand value for the last
completed interval.
Block interval demand example
The following illustration shows the different ways power demand is calculated
using the block interval method. In this example, the interval is set to 15 minutes.
Figure 2 - Timed sliding block
15 30 45 60 . . .
Demand value is
the average for the
last completed interval
Time (sec)
Calculation updates
every 15 seconds
15-minute interval
Figure 3 - Timed block
15 30 45
Demand value is
the average for the
last completed
interval
Time
(min)
Calculation updates at
the end of the interval
15-minute interval 15-minute interval 15-min
Figure 4 - Timed rolling block
15
5403
20 35 4025
Demand value is
the average for
the last completed
interval
Time
(min)
Calculation updates at the end
of the subinterval (5 minutes)
15-minute interval
9.7.5.1.3 Synchronized demand
You can configure the demand calculations to be synchronized using an external
pulse input, a command sent over communications, or the device’s internal real-
time clock.
122 7EN02-0489-00
PowerLogic
™
Intuitive PM7100 / PM7200 / PM7300 series 9. Technical reference
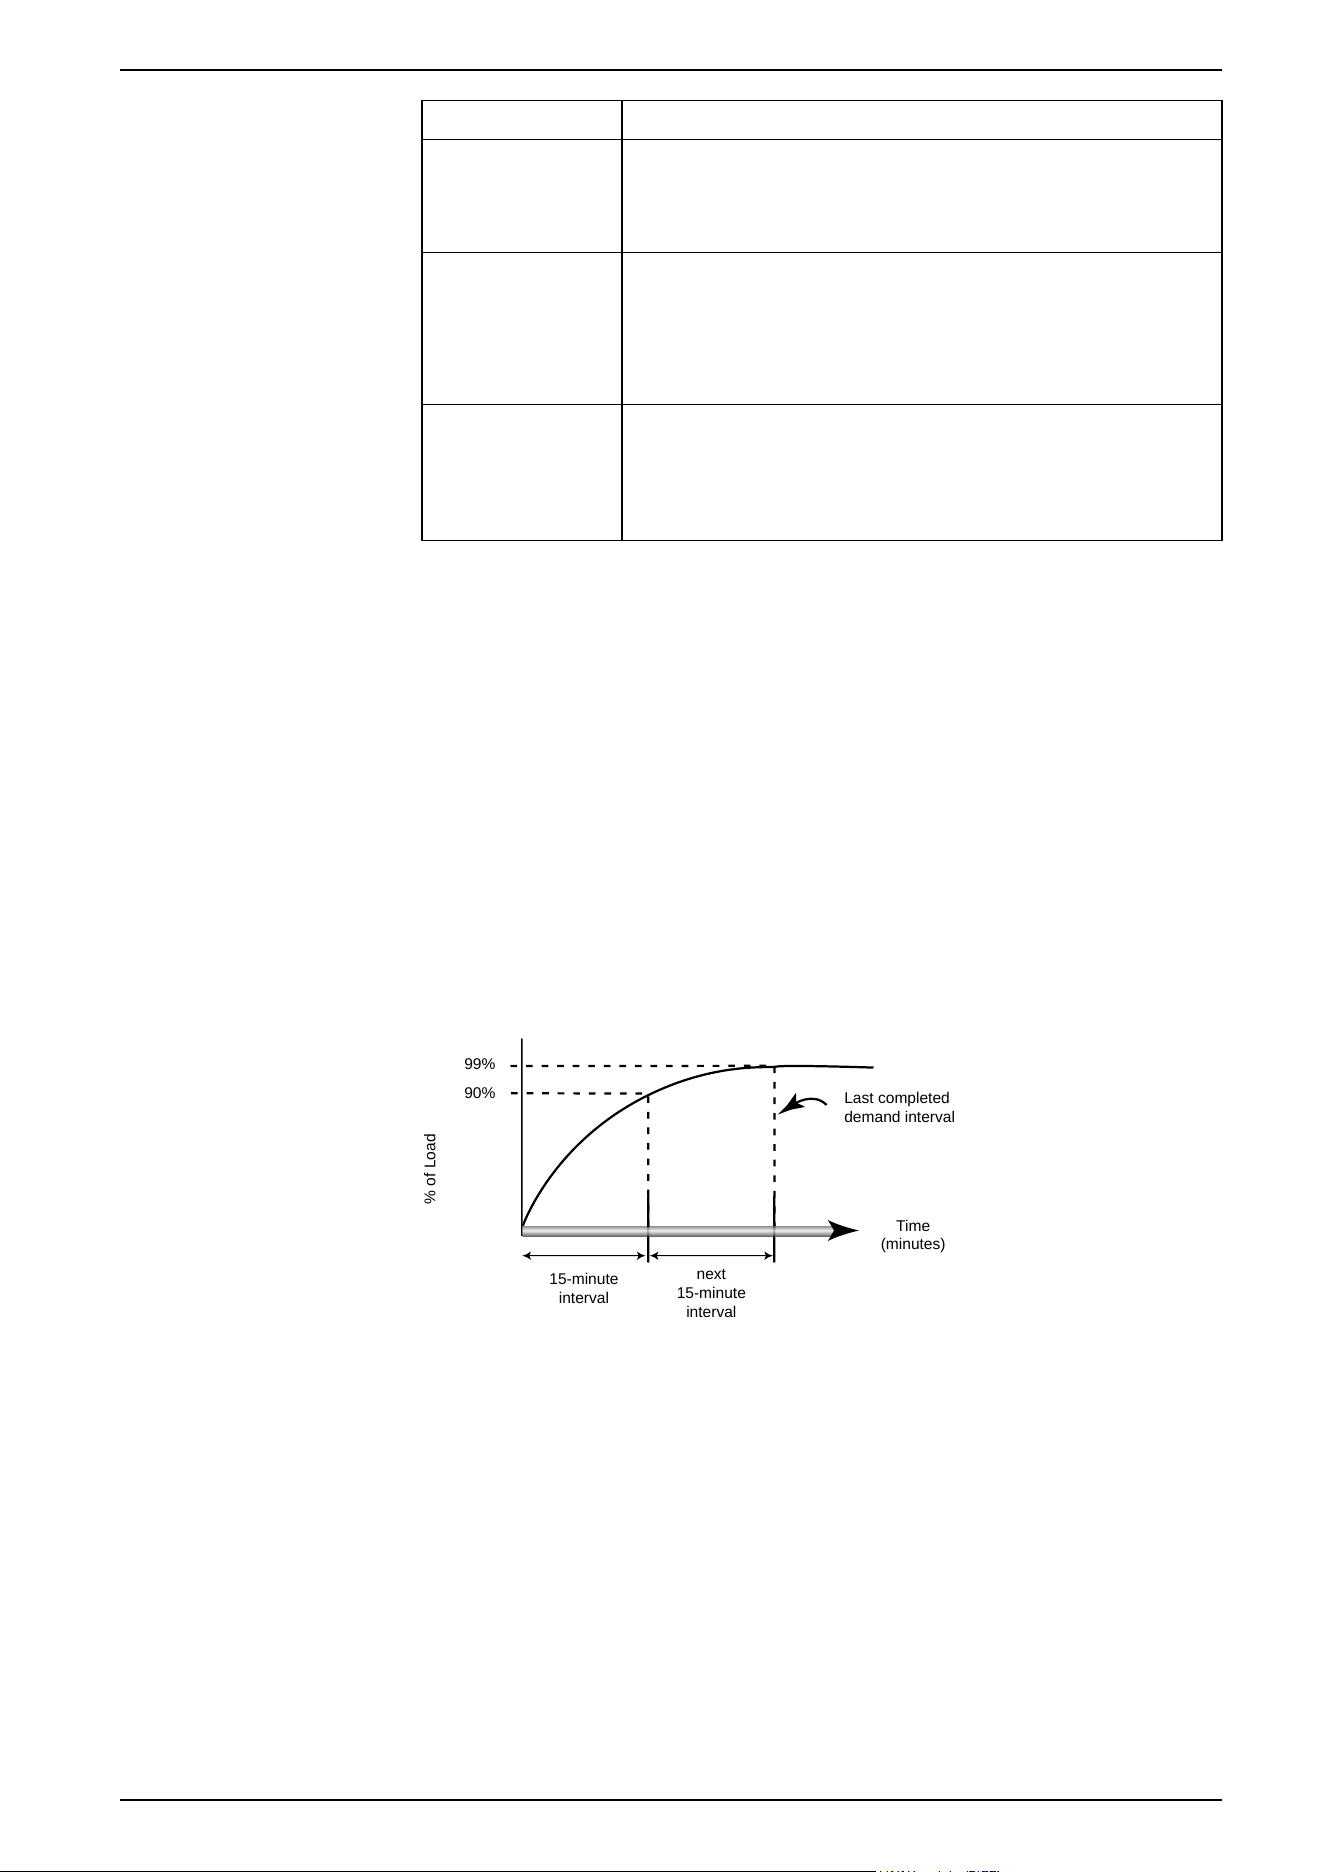
Type Description
Input synchronized
demand
This method allows you to synchronize the demand interval of your meter
with an external digital pulse source (such as another meter’s digital
output) connected to your meter's digital input. This helps synchronize
your meter to the same time interval as the other meter for each demand
calculation.
Command
synchronized demand
This method allows you to synchronize the demand intervals of multiple
meters on a communications network. For example, if a programmable
logic controller (PLC) input is monitoring a pulse at the end of a demand
interval on a utility revenue meter, you can program the PLC to send a
command to multiple meters whenever the utility meter starts a new
demand interval. Each time the command is sent, the demand readings of
each meter are calculated for the same interval.
Clock synchronized
demand
This method allows you to synchronize the demand interval to the meter’s
internal real-time clock. This helps you synchronize the demand to a
particular time, typically on the hour (for example, at 12:00 am). If you
select another time-of-day when the demand intervals are to be
synchronized, the time must be specified in minutes from midnight. For
example, to synchronize at 8:00 am, select 480 minutes.
NOTE: For these demand types, you can choose block or rolling block
options. If you select a rolling block demand option, you need to specify a
subinterval.
9.7.5.1.4 Thermal demand
Thermal demand calculates the demand based on a thermal response, which
imitates the function of thermal demand meters.
The demand calculation updates at the end of each interval. You can set the
demand interval from 1 to 60 minutes (in 1-minute increments).
Thermal demand example
The following illustration shows the thermal demand calculation. In this example,
the interval is set to 15 minutes. The interval is a window of time that moves
across the timeline. The calculation updates at the end of each interval.
Last completed
demand interval
Time
(minutes)
next
15-minute
interval
15-minute
interval
% of Load
99%
90%
9.7.5.2 Current demand
The meter calculates current demand using the block interval, synchronized or
thermal demand methods.
You can set the demand interval from 1 to 60 minutes in 1-minute increments (for
example, 15 minutes).
9.7.5.3 Predicted demand
The meter calculates predicted demand for the end of the present interval for kW,
kvar, and kVA demand, considering the energy consumption so far within the
present (partial) interval and the present rate of consumption.
7EN02-0489-00 123
9. Technical reference PowerLogic
™
Intuitive PM7100 / PM7200 / PM7300 series
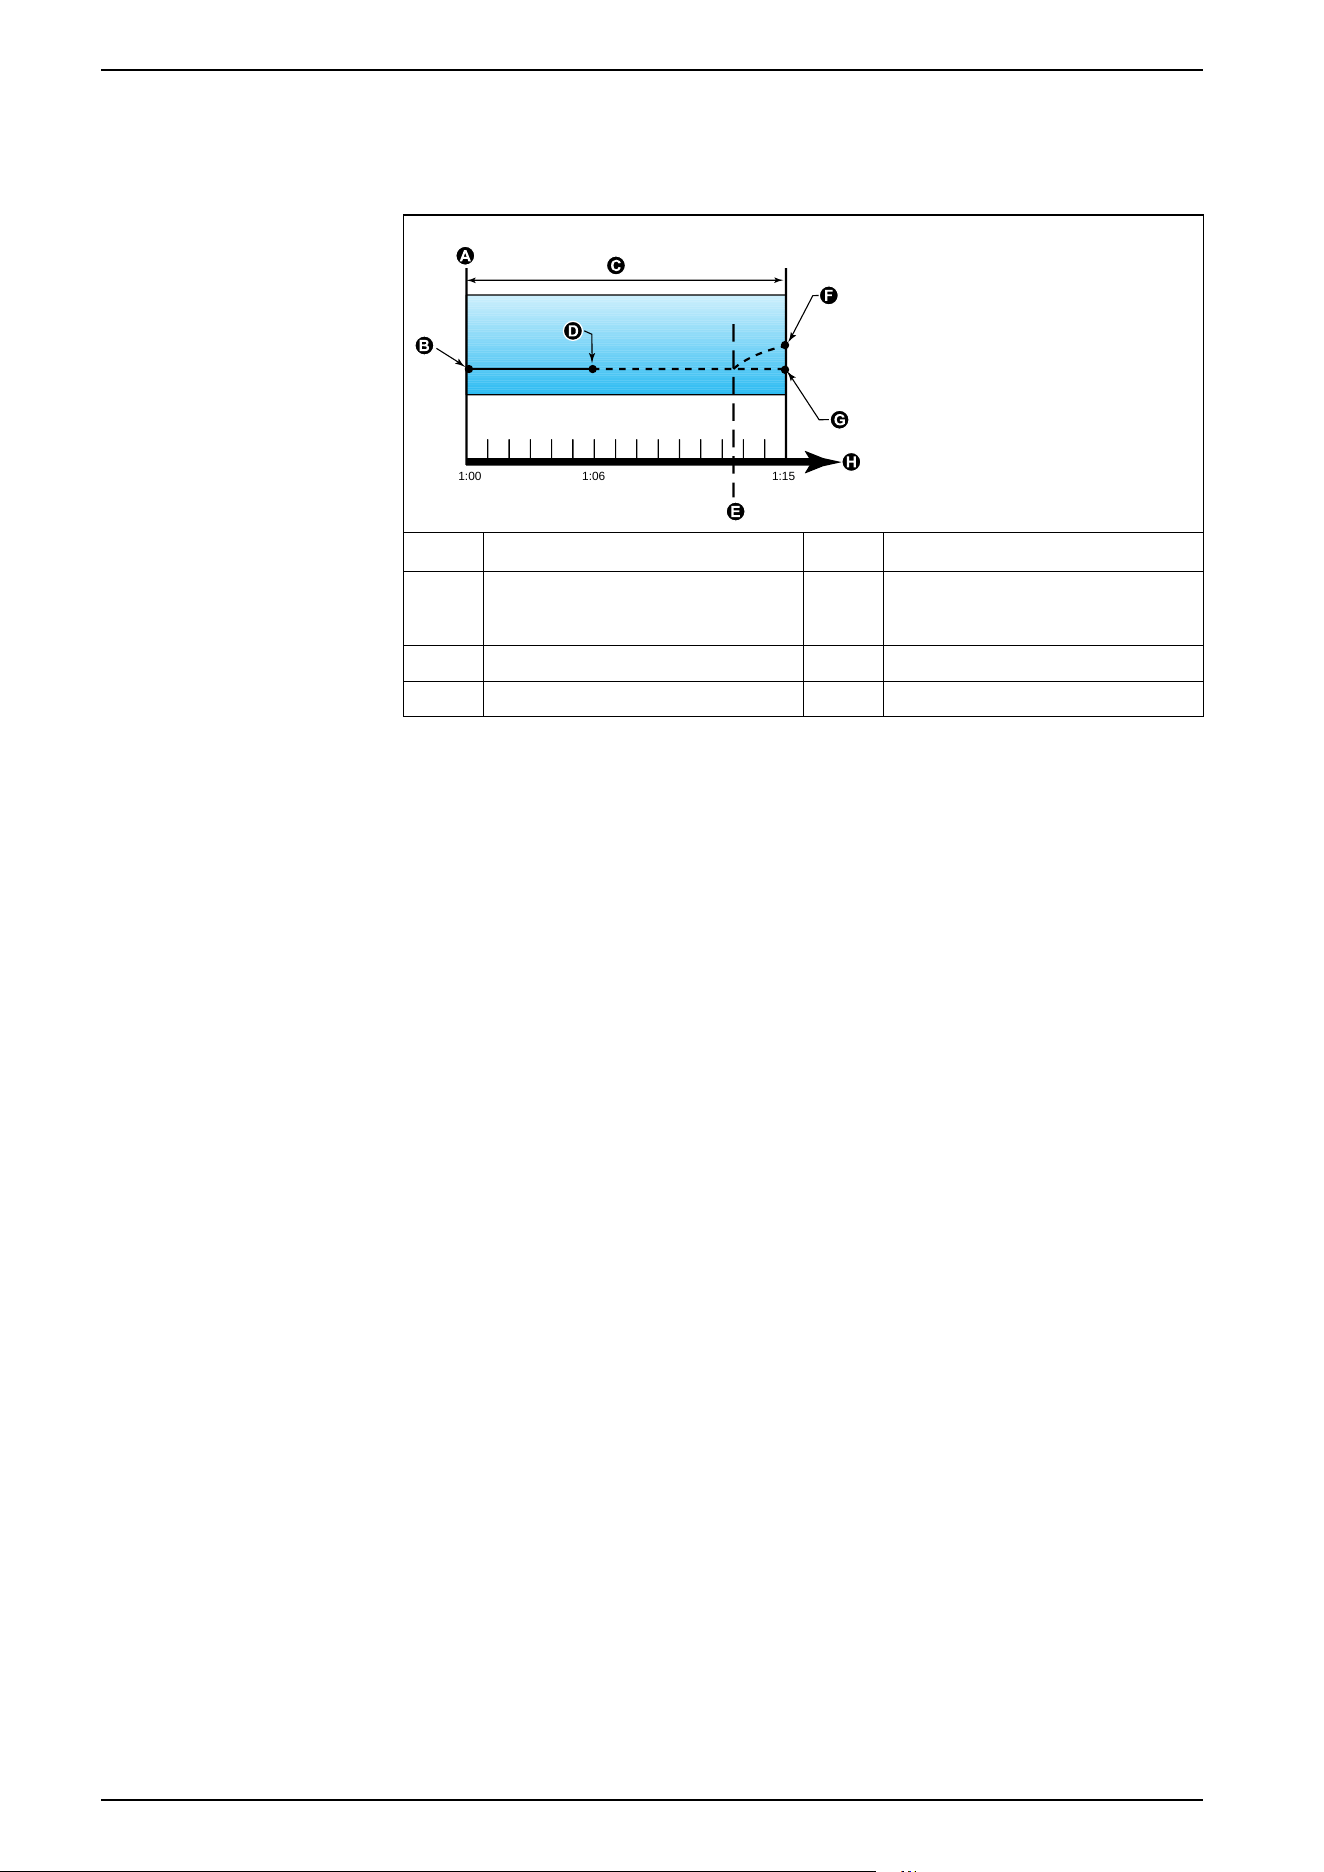
Predicated demand is updated according to the update rate of your meter.
The following illustration shows how a change in load can affect predicted demand
for the interval. In this example, the interval is set to 15 minutes.
1:00 1:06 1:15
A Beginning of interval E Change in load
B Demand for last completed interval F Predicted demand if load is added
during interval. The predicted demand
increases to reflect increased demand
C 15-minute interval G Predicted demand if no load is added
D Partial interval H Time
9.7.5.4 Peak demand
The meter records the peak (or maximum) values for kWD, kvarD, and kVAD
power (or peak demand).
The peak for each value is the highest average reading since the meter was last
reset. These values are maintained in the meter’s non-volatile memory.
The meter also stores the date and time when the peak demand occurred. Along
with the peak demand, the meter also stores the coinciding average 3-phase
power factor. The average 3-phase power factor is defined as “demand kW/
demand kVA” for the peak demand interval.
9.7.5.5 Input metering demand
The input metering channels can be used to measure water, air, gas, electric, and
steam utilities (WAGES).
The number of available metering input channels equals the number of unused
digital inputs.
Typical WAGES utility meters have no communications capabilities, but they
usually have a pulse output. The utility meter sends a pulse to its output each time
a preset quantity or amount of (WAGES) energy is consumed or delivered. This
preset quantity or amount is referred to as the pulse weight.
To monitor the utility meter, connect its pulse output to the power meter’s digital
input. Associate the digital input for input metering and configure the input
metering operation mode, pulse weight, consumption units, and demand units.
9.7.6 Power and power factor
The sampled measurements taken at the meter’s voltage and current inputs
provide data for calculating power and power factor.
In a balanced 3-phase alternating current (AC) power system source, the AC
voltage waveforms on the current-carrying conductors are equal but offset by one-
124 7EN02-0489-00
PowerLogic
™
Intuitive PM7100 / PM7200 / PM7300 series 9. Technical reference

third of a period (a phase angle shift of 120 degrees between the three voltage
waveforms).
9.7.6.1 Current phase shift from voltage
Electrical current can lag, lead, or be in phase with the AC voltage waveform, and
is typically associated with the type of load – inductive, capacitive, or resistive.
For purely resistive loads, the current waveform is in phase with the voltage
waveform. For capacitive loads, current leads voltage. For inductive loads, current
lags voltage.
The following diagrams show how voltage and current waveforms shift based on
load type under ideal (laboratory) conditions.
Current and voltage in phase (resistive) Current leads voltage (capacitive) Current lags voltage (inductive)
9.7.6.2 Real, reactive, and apparent power (PQS)
A typical AC electrical system load has both resistive and reactive (inductive or
capacitive) components.
Real power, also known as active power (P) is consumed by resistive loads.
Reactive power (Q) is either consumed by inductive loads or generated by
capacitive loads.
Apparent power (S) is the capacity of your measured power system to provide real
and reactive power.
The units for power are watts (W or kW) for real power P, vars (var or kvar) for
reactive power Q, and volt-amps (VA or kVA) for apparent power S.
7EN02-0489-00 125
9. Technical reference PowerLogic
™
Intuitive PM7100 / PM7200 / PM7300 series
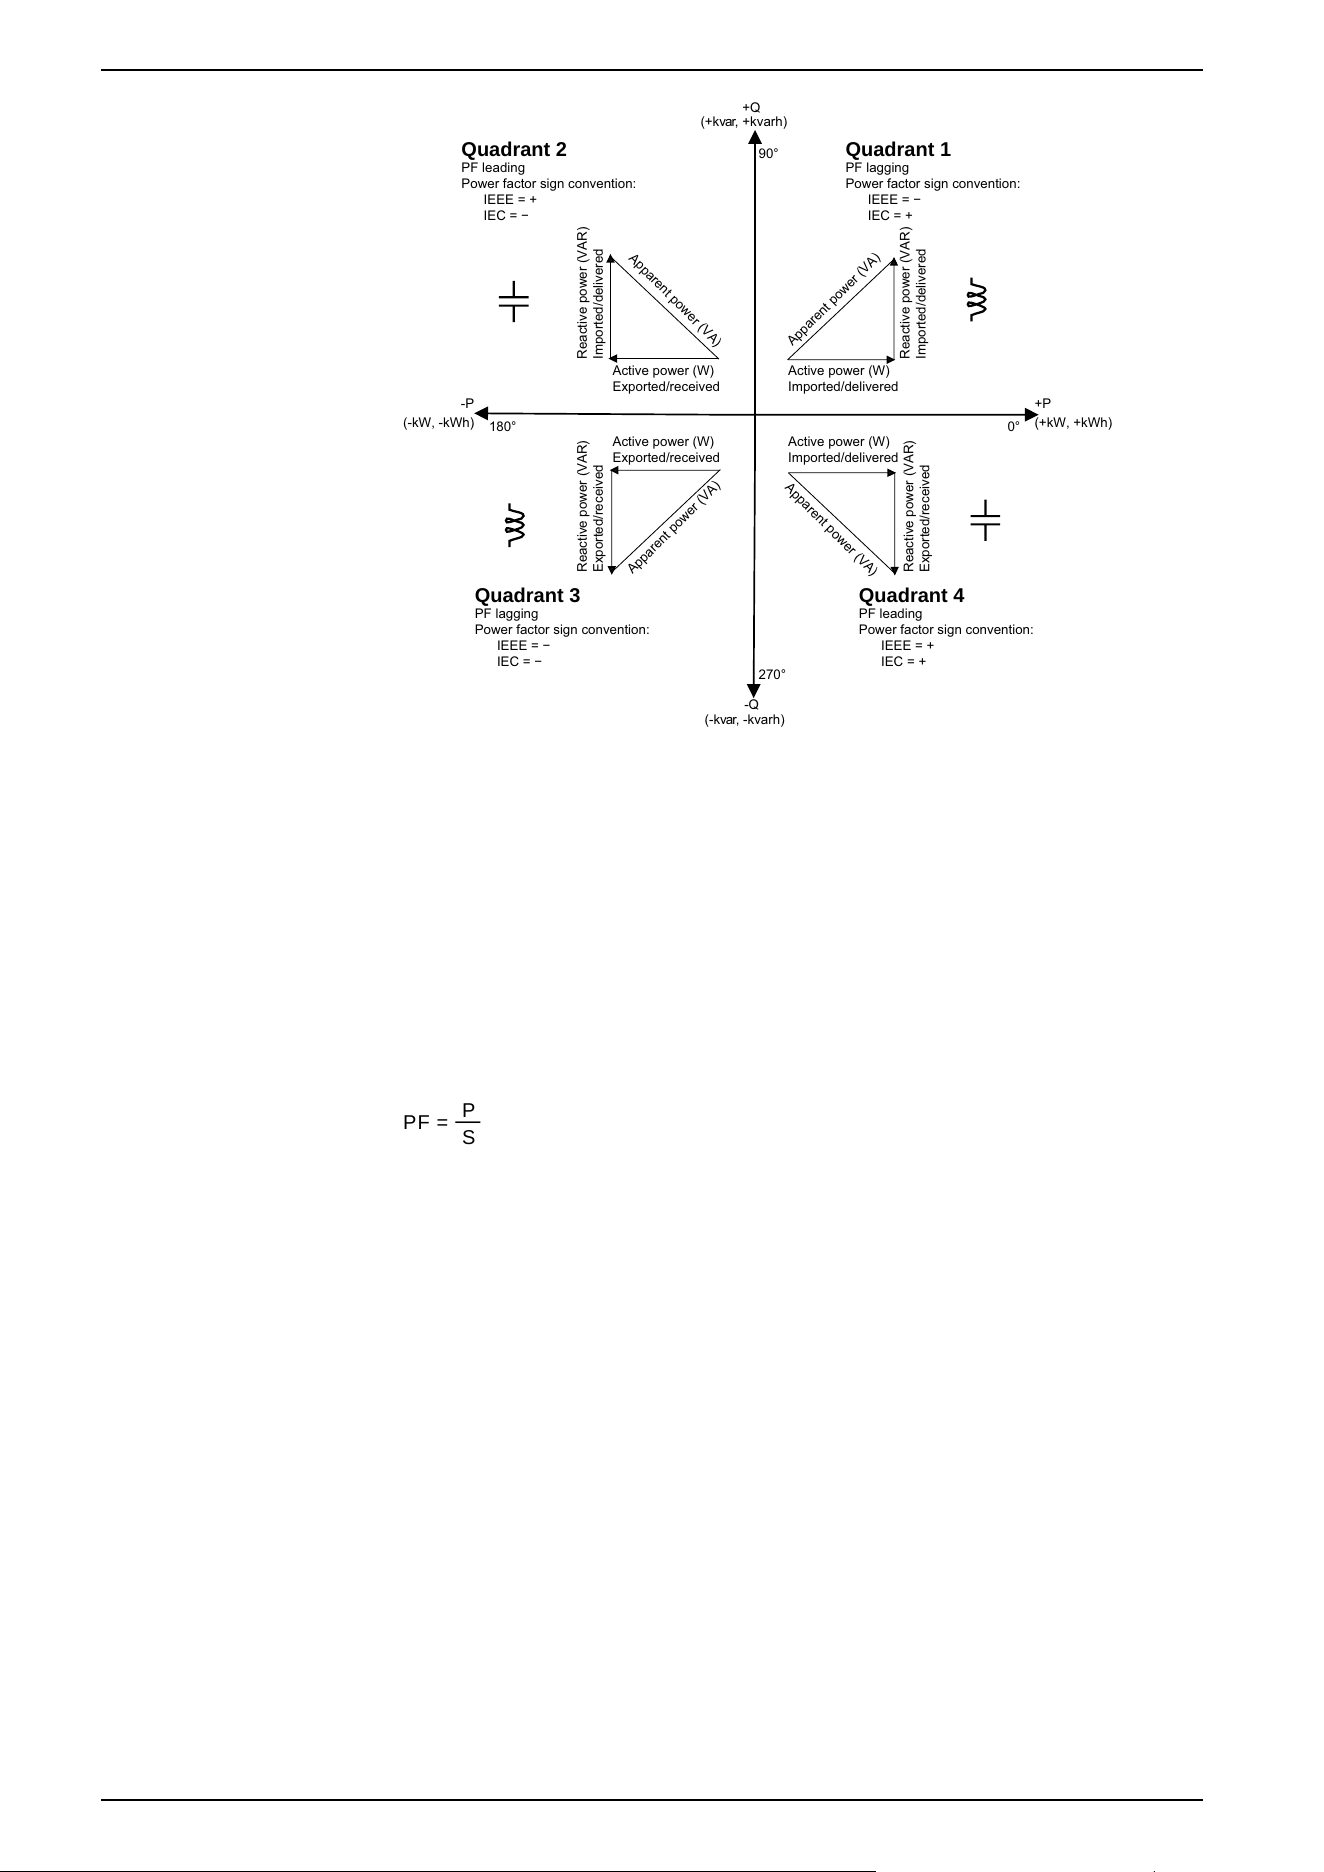
+Q
(+kvar, +kvarh)
-P
(-kW, -kWh)
-Q
(-kvar, -kvarh)
+P
(+kW, +kWh)
Active power (W)
Exported/received
Apparent power (VA)
Reactive power (VAR)
Imported/delivered
Quadrant 3
PF lagging
Power factor sign convention:
IEEE = −
IEC = −
Quadrant 4
PF leading
Power factor sign convention:
IEEE = +
IEC = +
Quadrant 1
PF lagging
Power factor sign convention:
IEEE = −
IEC = +
Quadrant 2
PF leading
Power factor sign convention:
IEEE = +
IEC = −
90°
0°
180°
270°
Apparent power (VA)
Reactive power (VAR)
Imported/delivered
Active power (W)
Exported/received
Reactive power (VAR)
Exported/received
Apparent power (VA)
Apparent power (VA)
Active power (W)
Imported/delivered
Active power (W)
Imported/delivered
Reactive power (VAR)
Exported/received
Power flow
Positive real power P(+) flows from the power source to the load. Negative real
power P(-) flows from the load to the power source.
9.7.6.3 Power factor (PF)
Power factor (PF) is the ratio of real power (P) to apparent power (S).
PF is provided as a number between -1 and 1 or as a percentage from -100% to
100%, where the sign is determined by the convention.
PF
P
S
=
—
A purely resistive load has no reactive components, so its power factor is 1 (PF =
1, or unity power factor). Inductive or capacitive loads introduce a reactive power
(Q) component to the circuit which causes the PF to become closer to zero.
True PF and displacement PF
The meter supports true power factor and displacement power factor values:
• True power factor includes harmonic content.
• Displacement power factor only considers the fundamental frequency.
NOTE: Unless specified, the power factor displayed by the meter is true power
factor.
9.7.6.4 Power factor sign convention
Power factor sign (PF sign) can be positive or negative and is defined by the
conventions used by the IEEE or IEC standards.
You can set the power factor sign (PF sign) convention that is used on the display
to either IEC or IEEE.
126 7EN02-0489-00
PowerLogic
™
Intuitive PM7100 / PM7200 / PM7300 series 9. Technical reference

PF sign convention: IEC
PF sign correlates with the direction of real power (kW) flow.
• Quadrant 1 and 4: Positive real power (+kW), the PF sign is positive (+).
• Quadrant 2 and 3: Negative real power (-kW), the PF sign is negative (-).
PF sign convention: IEEE
PF sign correlates with the PF lead/lag convention, in other words, the effective
load type (inductive or capacitive):
• For a capacitive load (PF leading, quadrant 2 and 4), the PF sign is positive
(+).
• For an inductive load (PF lagging, quadrant 1 and 3), the PF sign is negative
(-).
9.7.6.5 Power factor register format
The meter provides power factor values in a variety of formats to suit your energy
management software.
Power factor in IEC and lead/lag (IEEE) formats: Float32 and Int16U registers
The meter provides total power factor in IEC and lead/lag (IEEE) formats in both
Float32 and Int16U data types. You can use these registers to bring power factor
information into third-party software. These registers are interpreted using the
standard IEC and IEEE sign conventions.
NOTE: For information on how to calculate actual power factor values from
the values in Int16U registers, see your meter’s Modbus register list, available
from www.se.com.
Four quadrant power factor information: floating point registers
The meter also provides PF information (including sign and quadrant) in single
floating-point registers for each of the PF values (for example, per-phase and total
values for true and displacement PF, and associated minimums and maximums).
The meter performs a simple algorithm to the PF value then stores it in the
appropriate PF register.
The meter and software interpret these PF registers for reporting or data entry
fields according to the following diagram:
7EN02-0489-00 127
9. Technical reference PowerLogic
™
Intuitive PM7100 / PM7200 / PM7300 series
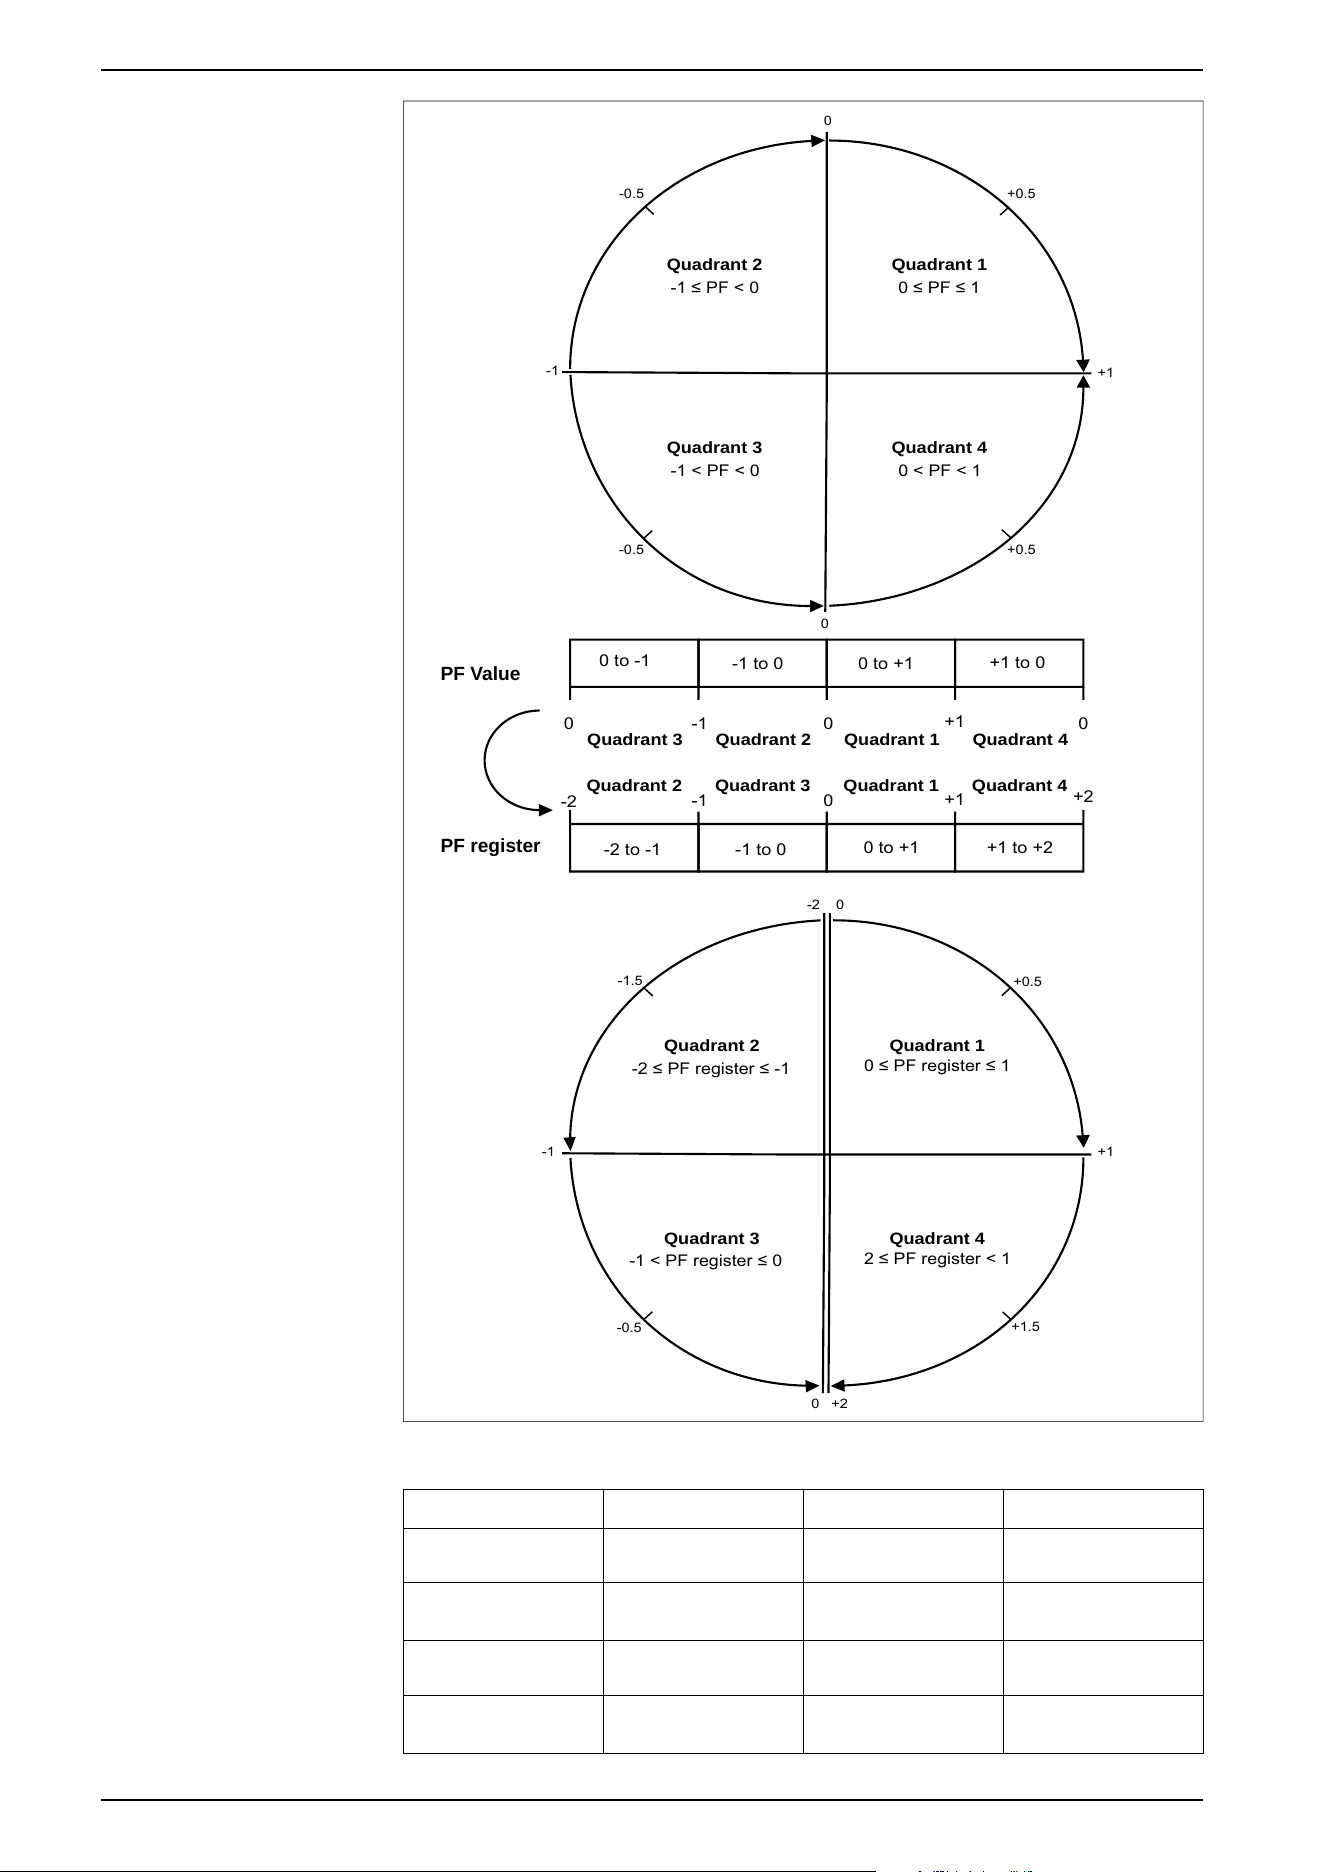
Quadrant 3
0
-1 0
+1
0
-2
-1 0
+1
+2
0
-1
0
+1
5.0+5.0-
+0.5-0.5
-2 to -1 -1 to 0
0 to +1
+1 to +2
0 to -1
-1 to 0
0 to +1
+1 to 0
0 +2
-1
-2
0
+1
-0.5
+0.5
+1.5
-1.5
Quadrant 2 Quadrant 1 Quadrant 4
Quadrant 2 Quadrant 3 Quadrant 1 Quadrant 4
Quadrant 2 Quadrant 1
Quadrant 3 Quadrant 4
Quadrant 2
-1 ≤ PF < 0
Quadrant 1
0 ≤ PF ≤ 1
Quadrant 3
-1 < PF < 0
Quadrant 4
0 < PF < 1
-2 ≤ PF register ≤ -1
2 ≤ PF register < 1
-1 < PF register ≤ 0
0 ≤ PF register ≤ 1
PF register
PF Value
The PF value is calculated from the PF register value using the following formulas:
Quadrant PF range PF register range PF formula
Quadrant 1 0 to +1 0 to +1 PF value = PF register
value
Quadrant 2 -1 to 0 -2 to -1 PF value = (-2) - (PF
register value)
Quadrant 3 0 to -1 -1 to 0 PF value = PF register
value
Quadrant 4 +1 to 0 +1 to +2 PF value = (+2) - (PF
register value)
128 7EN02-0489-00
PowerLogic
™
Intuitive PM7100 / PM7200 / PM7300 series 9. Technical reference

Go to www.se.com and search for your meter’s Modbus register list to download a
copy.
9.7.7 Timers
The meter supports active load timer, operating timer, and input/output timer.
Active load timer
The active load timer keeps track of how much time the input current exceeds the
specified load timer setpoint current.
Operating timer
The operating timer keeps track of how long the meter has been powered up.
Input/output timer
The input/output timer shows how long an input or output has been ON.
7EN02-0489-00 129
9. Technical reference PowerLogic
™
Intuitive PM7100 / PM7200 / PM7300 series

9.8 Power quality
9.8.1 Power quality measurements
The meter provides harmonic distortion metering up to the 31st harmonic.
The following power quality measurements are available:
• Individual harmonics (odd and even harmonics up to 31st)
• Total harmonic distortion (THD, thd) for current and voltage (line-to-line, line-
to-neutral)
• Total demand distortion (TDD)
The following harmonics data is available on the display:
• Numeric magnitude and angle of the fundamental (first) harmonic.
• Graphical display of the 3rd to 15th harmonics, expressed as a percentage of
the fundamental harmonic.
9.8.2 Harmonics overview
Harmonics are integer multiples of the fundamental frequency of the power
system.
Harmonics information is valuable for power quality analysis, determining properly
rated transformers, maintenance, and troubleshooting. Evaluation of harmonics is
required for compliance to system power quality standards such as EN50160 and
meter power quality standards such as IEC 61000-4-30.
Harmonics measurements include per-phase magnitudes and angles (relative to
the fundamental frequency of the phase A voltage) for the fundamental and higher
order harmonics relative to the fundamental frequency. The meter’s power system
setting defines which phases are present and determines how line-to-line or line-
to-neutral voltage harmonics and current harmonics are calculated.
Harmonics are used to identify whether the supplied system power meets required
power quality standards, or if non-linear loads are affecting your power system.
Power system harmonics can cause current flow on the neutral conductor, and
damage to equipment such as increased heating in electric motors. Power
conditioners or harmonic filters can be used to minimize unwanted harmonics.
9.8.3 Total harmonic distortion %
Total harmonic distortion (THD%) is a measure of the total per-phase voltage or
current harmonic distortion present in the power system.
THD% provides a general indication of the quality of a waveform. THD% is
calculated for each phase of both voltage and current.
9.8.4 Total demand distortion
Total demand distortion (TDD) is the per-phase harmonic current distortion against
the full load demand of the electrical system.
TDD indicates the impact of harmonic distortion in the system. For example, if
your system is showing high THD values but a low demand, the impact of
harmonic distortion on your system might be insignificant. However, at full load,
the THD value for the current harmonics is equal to TDD, so this could negatively
impact your system.
130 7EN02-0489-00
PowerLogic
™
Intuitive PM7100 / PM7200 / PM7300 series 9. Technical reference

9.8.5 Harmonic content calculations
Harmonic content (H
C
) is equal to the RMS value of all the non-fundamental
harmonic components in one phase of the power system.
The meter uses the following equation to calculate H
C
:
HC = (H
2
)
2
+ (H
3
)
2
+ (H
4
)
2
...
9.8.6 THD% calculations
THD% is a quick measure of the total distortion present in a waveform and is the
ratio of harmonic content (H
C
) to the fundamental harmonic (H
1
).
By default, the meter uses the following equation to calculate THD%:
THD%
H
C
H
1
-------- 100%=
x
9.8.7 thd calculations
thd is an alternate method for calculating total harmonic distortion that uses the
RMS value for the total harmonic content rather than the fundamental content.
The meter uses the following equation to calculate thd:
thd x 100=
(H
1
)
2
+ (H
C
)
2
H
C
9.8.8 TDD calculations
TDD (total demand distortion) evaluates the harmonic currents between an end
user and a power source.
The harmonic values are based on a point of common coupling (PCC), which is a
common point where each user receives power from the power source.
The meter uses the following equation to calculate TDD:
TDD = ( (HCIA)
2
+ (HCIB)
2
+ (HCIC)
2
) / (ILoad) x 100
Where ILoad is equal to the maximum demand load on the power system.
7EN02-0489-00 131
9. Technical reference PowerLogic
™
Intuitive PM7100 / PM7200 / PM7300 series

9.9 Verifying accuracy
9.9.1 Overview of meter accuracy
All meters are tested and verified at the factory in compliance with International
Electrotechnical Commission (IEC) and American National Standards Institute
(ANSI) standards.
Your digital power meter typically does not require re-calibration. However, in
some installations a final accuracy verification of the meters is required, especially
if the meters are used for revenue or billing applications.
For a list of accuracy standards that your meter complies to, contact your local
Schneider Electric representative or download the meter brochure from
www.se.com.
9.9.2 Accuracy test requirements
The most common method for testing meter accuracy is to apply test voltages and
currents from a stable power source and compare the meter’s readings with
readings from a reference device or energy standard.
Signal and power source
The meter maintains its accuracy during voltage and current signal source
variations, but its energy pulsing output needs a stable test signal to help produce
accurate test pulses. The meter’s energy pulsing mechanism needs
approximately 10 seconds to stabilize after every source adjustment.
The meter must be connected to control power to conduct accuracy verification
testing. Refer to your meter’s installation documentation for power supply
specifications.
DANGER
HAZARD OF ELECTRIC SHOCK, EXPLOSION, OR ARC FLASH
Verify the device’s power source meets the specifications for your device’s
power supply.
Failure to follow these instructions will result in death or serious injury.
Control equipment
Control equipment is required for counting and timing the pulse outputs from an
energy pulsing LED or digital output.
• Most standard test benches have an arm equipped with optical sensors to
detect LED pulses (the photo diode circuitry converts detected light into a
voltage signal).
• The reference device or energy standard typically has digital inputs that can
detect and count pulses coming from an external source (i.e., the meter’s
digital output).
NOTE: The optical sensors on the test bench can be disrupted by strong
sources of ambient light (such as camera flashes, florescent tubes, sunlight
reflections, floodlights, etc.). This can cause test errors. Use a hood, if
necessary, to block out ambient light.
132 7EN02-0489-00
PowerLogic
™
Intuitive PM7100 / PM7200 / PM7300 series 9. Technical reference
Environment
The meter should be tested at the same temperature as the testing equipment.
The ideal temperature is about 23 ºC (73 ºF).
A warm-up time of 30 minutes is recommended before beginning energy accuracy
verification testing. At the factory, the meters are warmed up to their typical
operating temperature before calibration to help ensure that the meters reach their
optimal accuracy at operating temperature.
Most high precision electronic equipment requires a warm-up time before it
reaches its specified performance levels.
Reference device or energy standard
To help ensure the accuracy of the test, it is recommended that you use a
reference device or reference energy standard with a specified accuracy that is 6
to 10 times more accurate than the meter under test. Before you start testing, the
reference device or energy standard should be warmed up as recommended by
the manufacturer.
NOTE: Verify the accuracy and precision of all measurement equipment used
in accuracy testing (for example, voltmeters, ammeters, power factor meters).
9.9.3 Meter settings for accuracy testing
Your meter’s power system and other parameters must be configured for accuracy
testing.
Meter parameter Value
Power system 3PH4W Wye Gnd (3-phase, 4 wire Wye with
ground).
Energy pulse constant
(Alarm/energy pulsing LED or digital output)
In sync with reference test equipment.
9.9.4 Verifying accuracy test
The following tests are guidelines for accuracy testing your meter.
DANGER
HAZARD OF ELECTRIC SHOCK, EXPLOSION, OR ARC FLASH
• Apply appropriate Personal Protective Equipment (PPE) and follow safe
electrical work practices. See NFPA 70E, CSA Z462 or other local
standards.
• Turn off all power supplying this device and the equipment in which it is
installed before working on or in the equipment.
• Always use a properly rated voltage sensing device to confirm that all power
is off.
• Do not exceed the maximum ratings of this device.
• Verify the device’s power source meets the specifications for your device’s
power supply.
Failure to follow these instructions will result in death or serious injury.
1. Turn off all power supplying this device and the equipment in which it is
installed before working on the device or equipment.
7EN02-0489-00 133
9. Technical reference PowerLogic
™
Intuitive PM7100 / PM7200 / PM7300 series
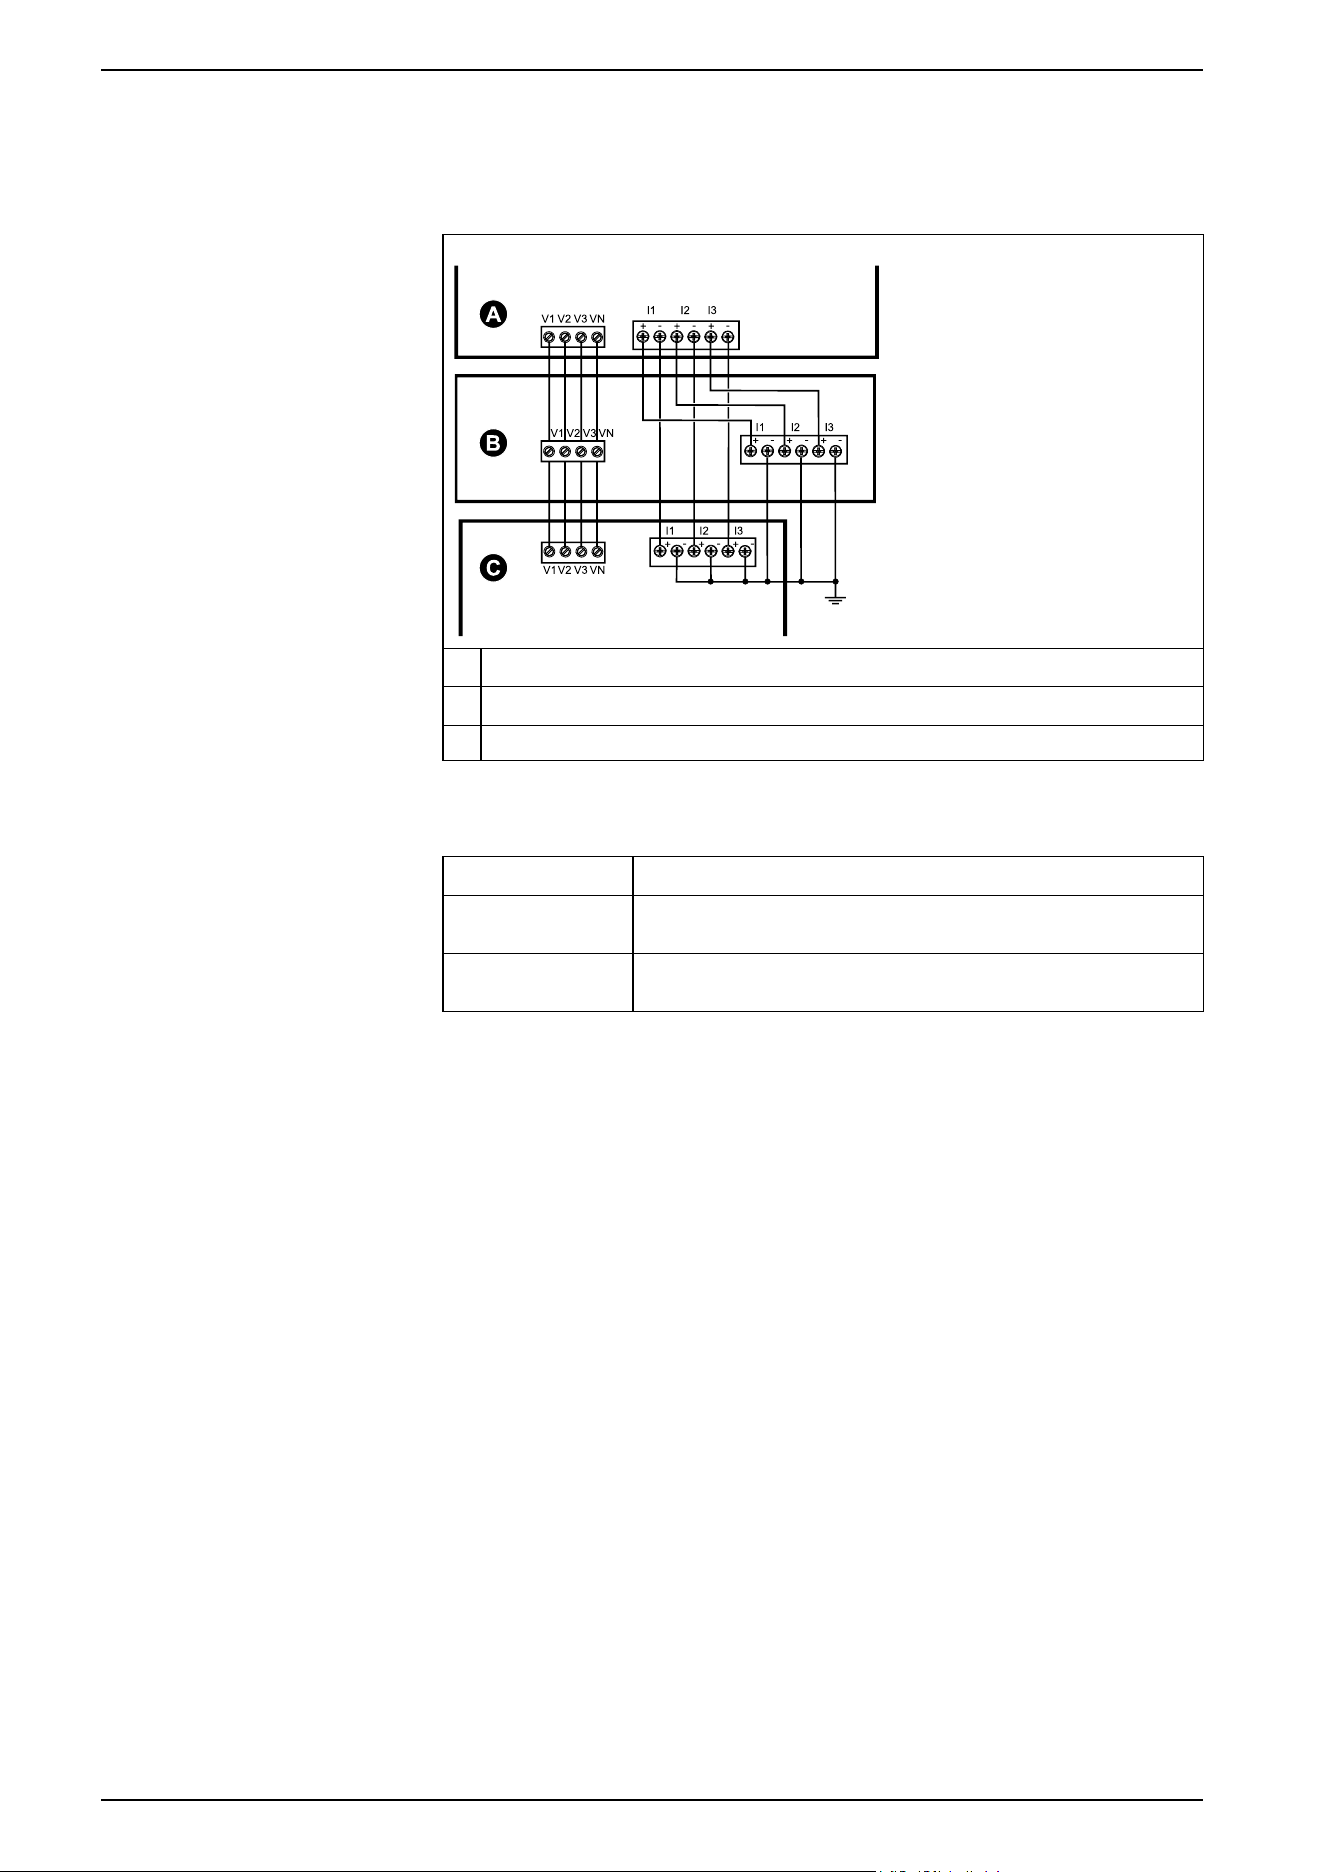
2. Use a properly rated voltage sensing device to confirm that all power is off.
3. Connect the test voltage and current source to the reference device or energy
standard. Ensure that all voltage inputs to the meter under test are connected
in parallel and all current inputs are connected in series.
A Reference device or energy standard
B Test voltage and current source
C Meter under test
4. Connect the control equipment used for counting the standard output pulses
using one of these methods:
Option Description
Energy pulsing LED Align the red-light sensor on the standard test bench armature over
the energy pulsing LED.
Digital output Connect the meter’s digital output to the standard test bench pulse
counting connections.
NOTE: When selecting which method to use, be aware that energy
pulsing LEDs and digital outputs have different pulse rate limits.
5. Before performing the verification test, let the test equipment power up the
meter and apply voltage for at least 30 seconds. This helps stabilize the
internal circuitry of the meter.
6. Configure the meter’s parameters for verifying accuracy testing.
7. Depending on the method selected for counting the energy pulses, configure
the meter’s energy pulsing LED or one of the digital outputs to perform energy
pulsing. Set the meter’s energy pulse constant so it is in sync with the
reference test equipment.
8. Perform accuracy verification on the test points. Run each test point for at
least 30 seconds to allow the test bench equipment to read an adequate
number of pulses. Allow 10 seconds of dwell time between test points.
9.9.4.1 Required pulses calculation for accuracy verification testing
Accuracy verification test equipment typically requires you to specify the number
of pulses for a specific test duration.
The reference test equipment typically requires you to specify the number of
pulses required for a test duration of “t” seconds. Normally, the number of pulses
required is at least 25 pulses, and the test duration is greater than 30 seconds.
Use the following formula to calculate the required number of pulses:
Number of pulses = Ptot x K x t/3600
134 7EN02-0489-00
PowerLogic
™
Intuitive PM7100 / PM7200 / PM7300 series 9. Technical reference

Where:
• Ptot = total instantaneous power in kilowatts (kW)
• K = the meter’s pulse constant setting, in pulses per kWh
• t = test duration, in seconds (typically greater than 30 seconds)
9.9.4.2 Total power calculation for accuracy verification testing
Accuracy verification testing supplies the same test signal (total power) to both the
energy reference/standard and the meter under test.
Total power is calculated as follows, where:
• Ptot = total instantaneous power in kilowatts (kW)
• VLN = test point line-to-neutral voltage in volts (V)
• I = test point current in amps (A)
• PF = power factor
The result of the calculation is rounded up to the nearest integer.
For a balanced 3–phase Wye system:
Ptot = 3 x VLN x I x PF x 1 kW/1000 W
NOTE: A balanced 3–phase system assumes that the voltage, current, and
power factor values are the same for all phases.
For a single-phase system:
Ptot = VLN x I x PF x 1 kW/1000W
9.9.4.3 Percentage error calculation for accuracy verification testing
Accuracy verification testing requires you to calculate the percentage error
between the meter being tested and the reference/standard.
Calculate the percentage error for every test point using the following formula:
Energy error = (EM - ES) / ES x 100%
Where:
• EM = energy measured by the meter under test
• ES = energy measured by the reference device or energy standard.
NOTE: If accuracy verification reveals inaccuracies in your meter, they may be
caused by typical sources of test errors. If there are no sources of test errors
present, please contact your local Schneider Electric representative.
9.9.5 Accuracy verification test points
The meter should be tested at full and light loads and at lagging (inductive) power
factors to help ensure testing over the entire range of the meter.
The test amperage and voltage input rating are labeled on the meter.
Watt-hour test point Sample accuracy verification test point
Full load 100% to 200% of the nominal current, 100% of the nominal voltage and
nominal frequency at unity power factor or one (1).
Light load 10% of the nominal current, 100% of the nominal voltage and nominal
frequency at unity power factor or one (1).
Inductive load (lagging
power factor)
100% of the nominal current, 100% of the nominal voltage and nominal
frequency at 0.50 lagging power factor (current lagging voltage by 60°
phase angle).
7EN02-0489-00 135
9. Technical reference PowerLogic
™
Intuitive PM7100 / PM7200 / PM7300 series
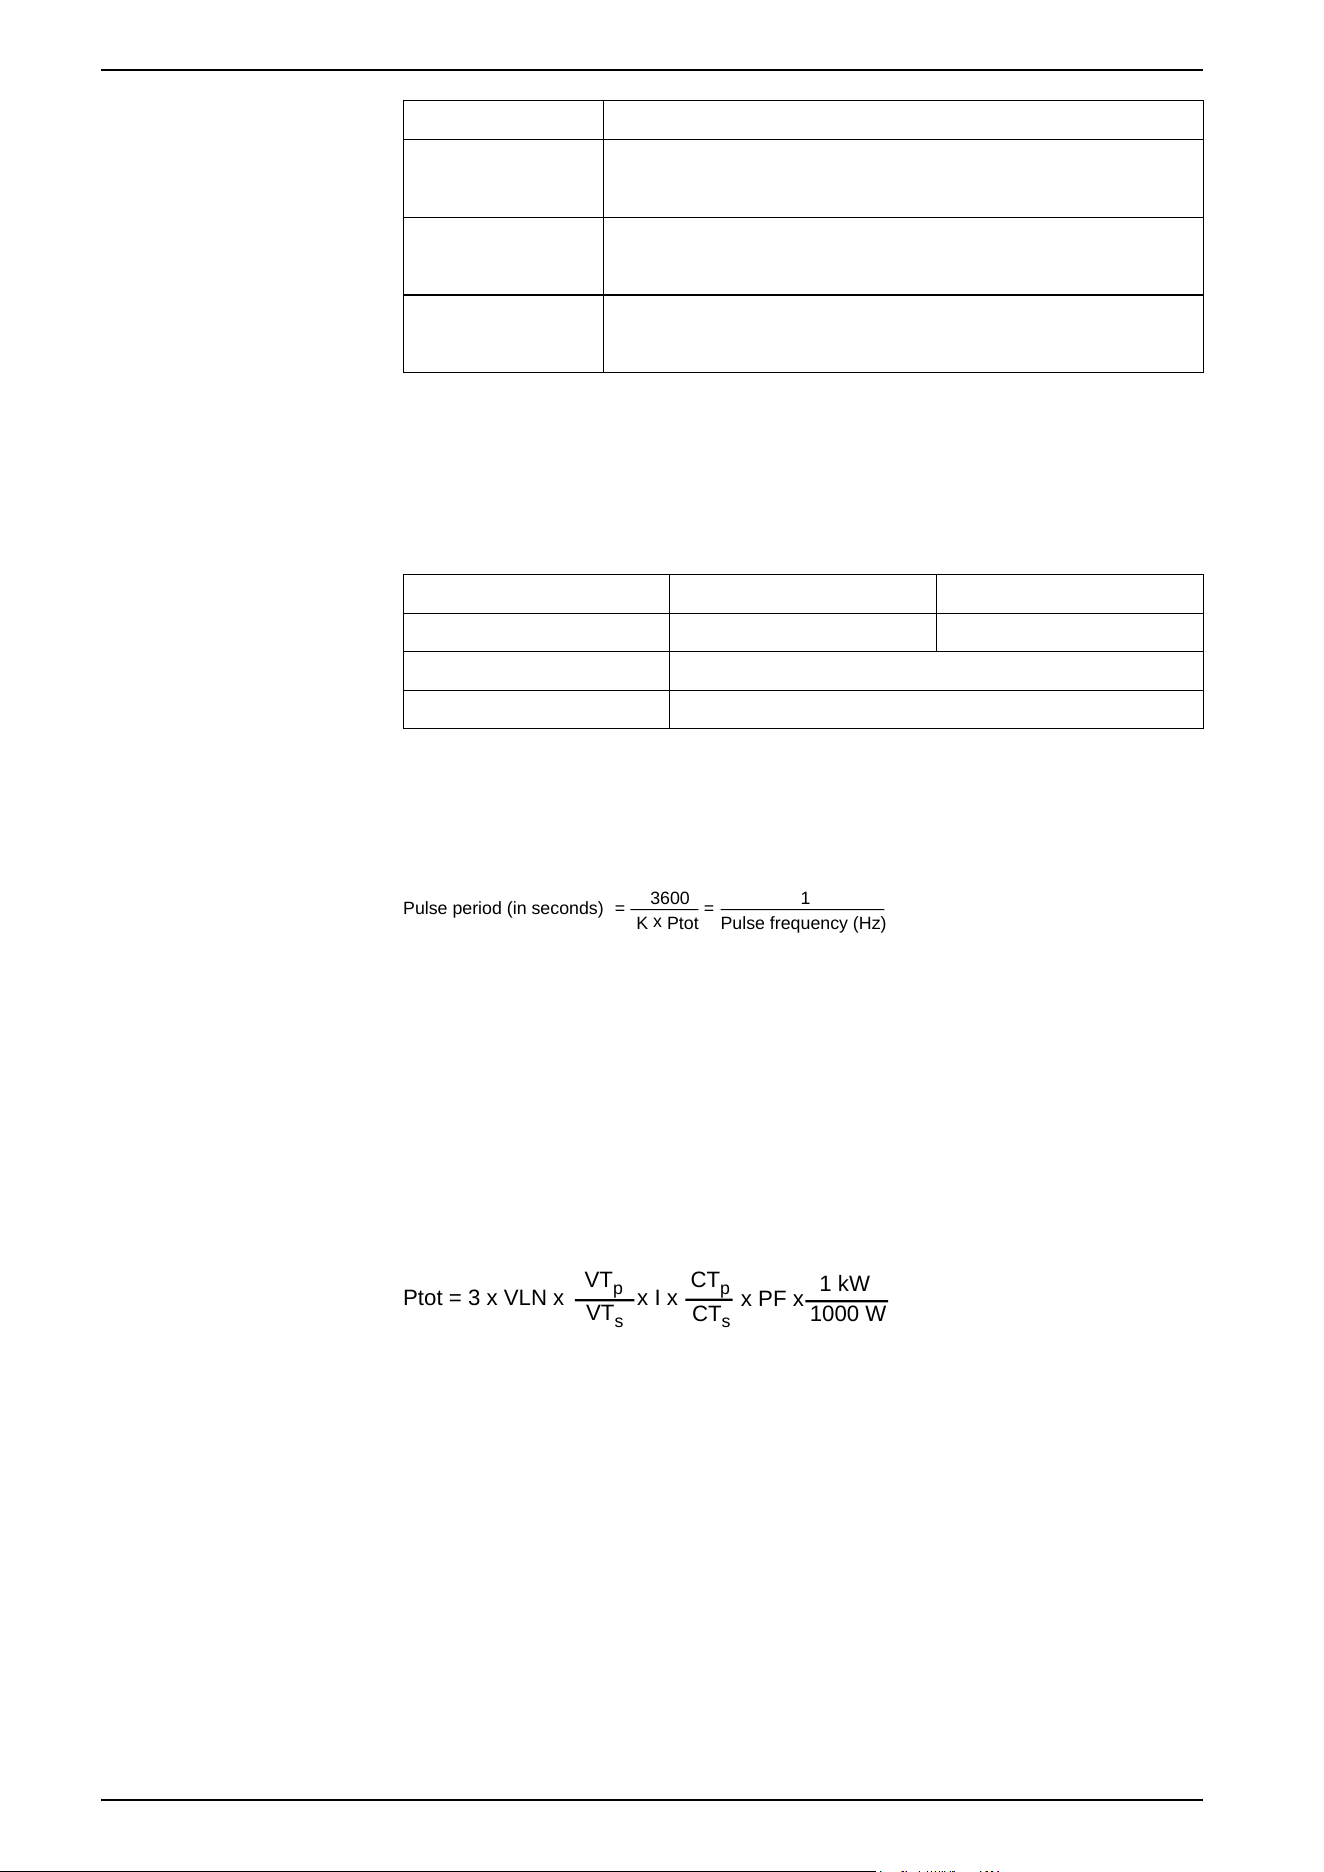
VAR-hour test point Sample accuracy verification test point
Full load 100% to 200% of the nominal current, 100% of the nominal voltage and
nominal frequency at zero power factor (current lagging voltage by 90°
phase angle).
Light load 10% of the nominal current, 100% of the nominal voltage and nominal
frequency at zero power factor (current lagging voltage by 90° phase
angle).
Inductive load (lagging
power factor)
100% of the nominal current, 100% of the nominal voltage and nominal
frequency at 0.87 lagging power factor (current lagging voltage by 30°
phase angle).
9.9.6 Energy pulsing considerations
The meter’s energy pulsing LED and pulse outputs are capable of energy pulsing
within specific limits.
Description Energy pulsing LED Pulse output
Maximum pulse frequency 2.5 kHz 25 Hz
Minimum pulse constant 1 pulse per k_h
Maximum pulse constant 9,999,000 pulses per k_h
The pulse rate depends on the voltage, current and PF of the input signal source,
the number of phases, and the VT and CT ratios.
If Ptot is the instantaneous power (in kW) and K is the pulse constant (in pulses
per kWh), then the pulse period is:
Pulse period (in seconds)
3600
K
x
Ptot
1
Pulse frequency (Hz)
= =
9.9.7 VT and CT considerations
Total power (Ptot) is derived from the values of the voltage and current inputs at
the secondary side and takes into account the VT and CT ratios.
The test points are always taken at the secondary side, regardless of whether VTs
or CTs are used.
If VTs and CTs are used, you must include their primary and secondary ratings in
the equation. For example, in a balanced 3-phase Wye system with VTs and CTs:
Ptot = 3 x VLN x
VT
p
VT
s
x I x
CT
p
CT
s
x PF x
1 kW
1000 W
where Ptot = total power, VT
p
= VT primary, VT
s
= VT secondary, CT
p
= CT
primary, CT
s
= CT secondary and PF = power factor.
9.9.8 Example calculations
This example calculation shows how to calculate power, pulse constants and
maximum pulse frequency, and how to determine a pulse constant that helps
reduce the maximum pulse frequency.
A balanced 3-phase Wye system uses 480:120 volt VTs and 100:5 amp CTs. The
signals at the secondary side are 119 volts line-to-neutral and 4.99 amps, with a
power factor of 0.85. The desired pulse output frequency is 20 Hz (20 pulses per
second).
136 7EN02-0489-00
PowerLogic
™
Intuitive PM7100 / PM7200 / PM7300 series 9. Technical reference
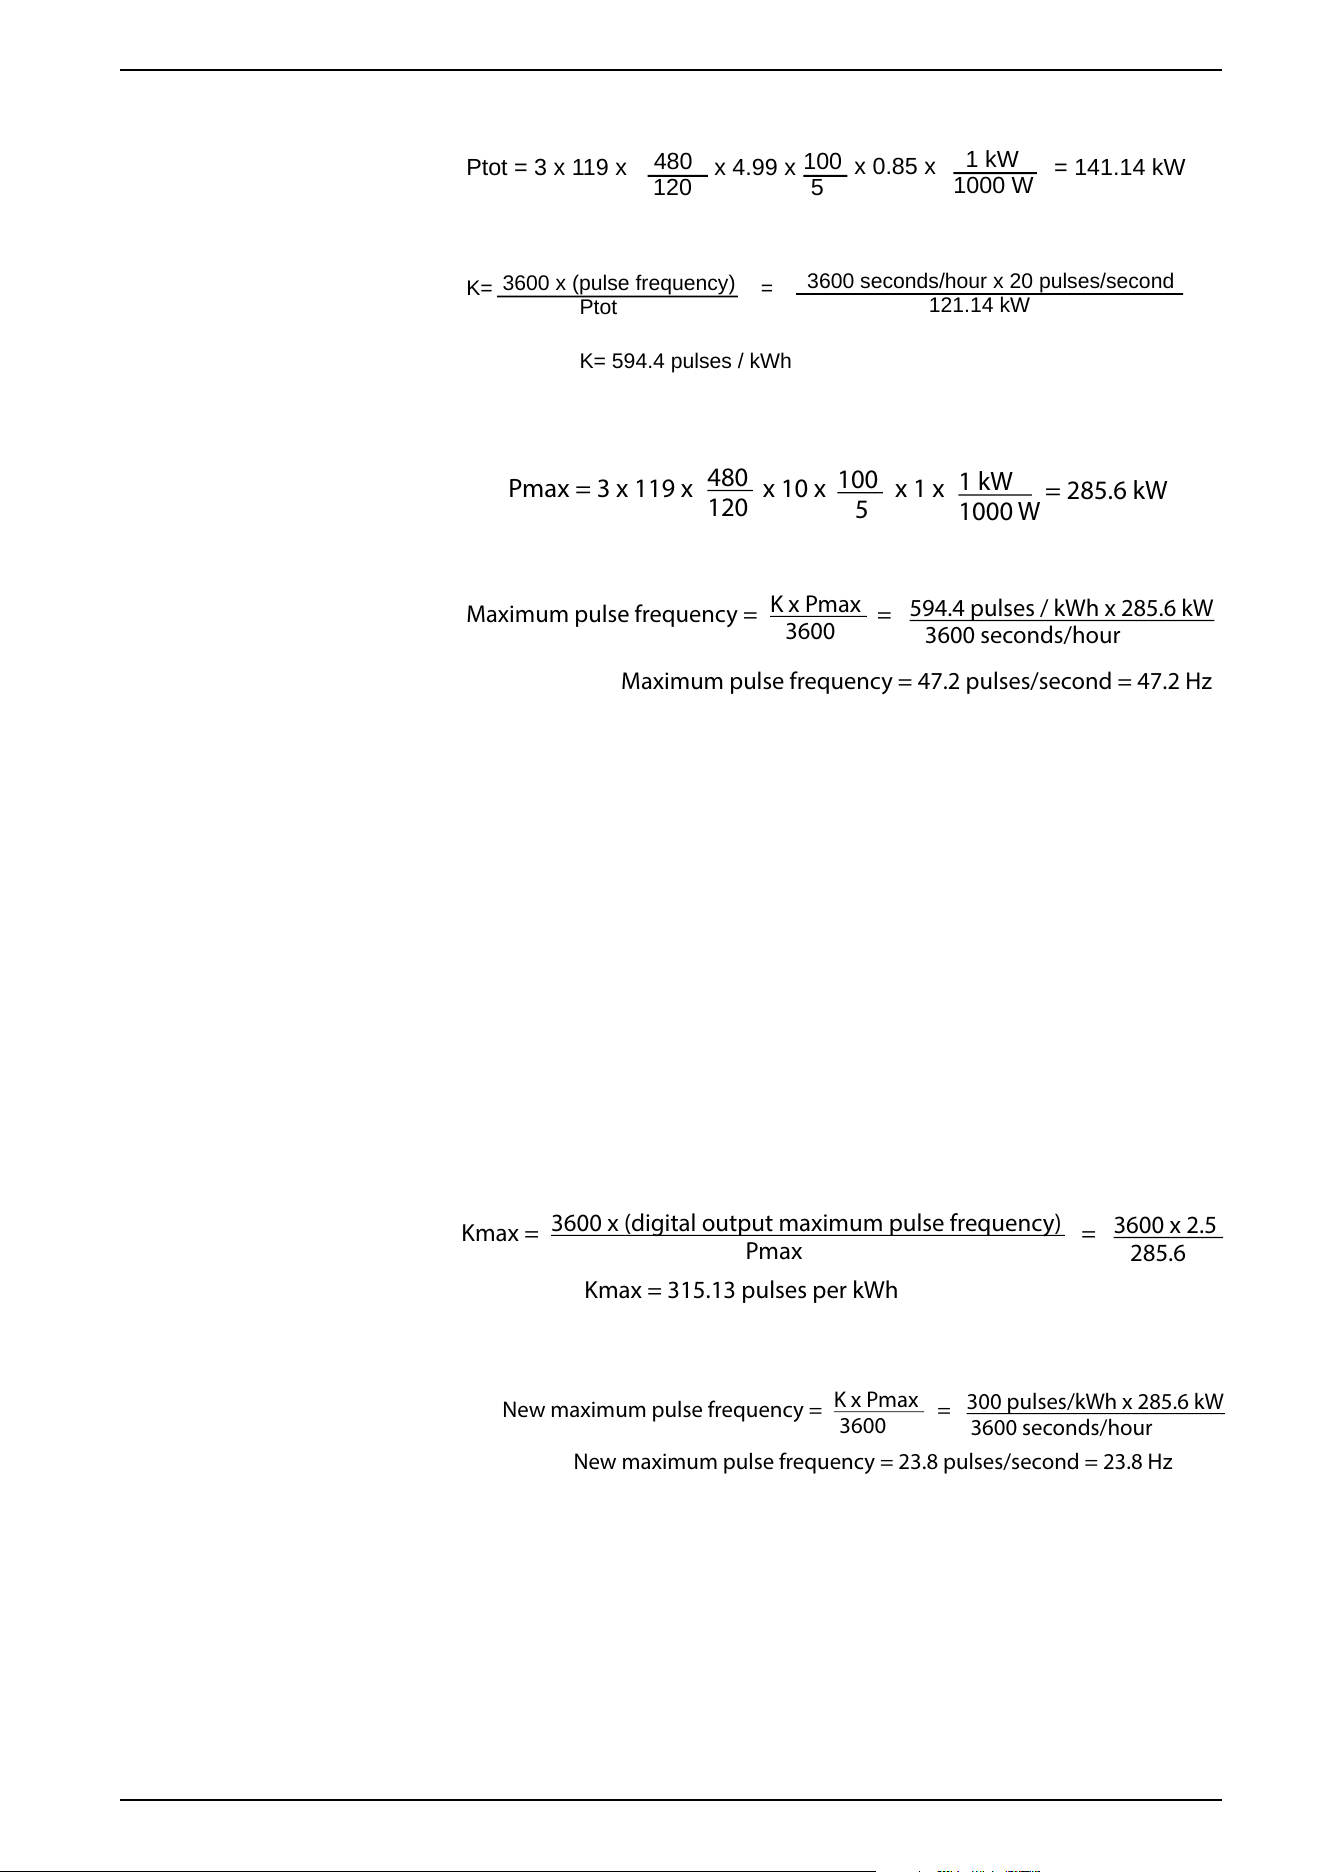
1. Calculate the typical total output power (Ptot):
Ptot = 3 x 119 x
480
120
x 4.99 x
100
5
x 0.85 x
1 kW
1000 W
= 141.14 kW
2. Calculate the pulse constant (K):
K=
3600 x (pulse frequency)
Ptot
=
3600 seconds/hour x 20 pulses/second
121.14 kW
K= 594.4 pulses / kWh
3. At full load (200% of nominal current = 10 A) and power factor (PF = 1),
calculate the maximum total output power (Pmax):
Pmax = 3 x 119 x
480
120
x 10 x
100
5
x 1 x
1 kW
1000 W
= 285.6 kW
4. Calculate the maximum output pulse frequency at Pmax:
Maximum pulse frequency =
K x Pmax
3600
=
594.4 pulses / kWh x 285.6 kW
3600 seconds/hour
Maximum pulse frequency = 47.2 pulses/second = 47.2 Hz
5. Check the maximum pulse frequency against the limits for the LED and digital
outputs:
• 47.2 Hz ≤ LED maximum pulse frequency (2.5 kHz)
• 47.2 Hz > digital output maximum pulse frequency (25 Hz)
NOTE: The maximum pulse frequency is within the limits for LED energy
pulsing. However, the maximum pulse frequency is greater than the limits
for digital output energy pulsing. Pulse output frequencies greater than 25
Hz will saturate the digital output and cause it to stop pulsing. Therefore,
in this example, you can only use the LED for energy pulsing.
Adjustments to allow energy pulsing at the digital outputs
If you want to use the digital output, you must decrease the output pulse
frequency, so it is within the limits.
Using the values from the earlier example, the maximum pulse constant for the
digital output is:
Kmax =
3600 x (digital output maximum pulse frequency)
Pmax
=
3600 x 2.5
285.6
Kmax = 315.13 pulses per kWh
1. Set the pulse constant (K) to a value below Kmax, for example, 300 pulses/
kWh. Calculate the new maximum output pulse frequency at Pmax:
New maximum pulse frequency =
K x Pmax
3600
=
300 pulses/kWh x 285.6 kW
3600 seconds/hour
New maximum pulse frequency = 23.8 pulses/second = 23.8 Hz
2. Check the new maximum pulse frequency against the limits for the LED and
digital outputs:
• 23.8 Hz ≤ LED maximum pulse frequency (2.5 kHz)
• 23.8 Hz ≤ digital output maximum frequency (25 Hz)
As expected, changing K to a value below Kmax allows you to use the digital
output for energy pulsing.
3. Set the new pulse constant (K) on your meter.
7EN02-0489-00 137
9. Technical reference PowerLogic
™
Intuitive PM7100 / PM7200 / PM7300 series

9.9.9 Typical sources of test errors
If you see excessive errors during accuracy testing, examine your test setup and
test procedures to eliminate typical sources of measurement errors.
Typical sources of accuracy verification testing errors include:
• Loose connections of voltage or current circuits, often caused by worn-out
contacts or terminals. Inspect terminals of test equipment, cables, test
harness and the meter under test.
• Meter ambient temperature does not match 23 °C (73 °F).
• Floating (ungrounded) neutral voltage terminal in any configuration with
unbalanced phase voltages.
• Inadequate meter control power, resulting in the meter resetting during the
test procedure.
• Ambient light interference or sensitivity issues with the optical sensor.
• Unstable power source causing energy pulsing fluctuations.
• Incorrect test setup: not all phases connected to the reference device or the
energy standard. All phases connected to the meter under test should also be
connected to the reference meter/standard.
• Moisture (condensing humidity), debris or pollution present in the meter under
test.
138 7EN02-0489-00
PowerLogic
™
Intuitive PM7100 / PM7200 / PM7300 series 9. Technical reference

9.10 Revenue (MID/MIR meter models)
9.10.1 Overview
The meter includes a revenue lock feature available in MID/MIR compliant
variants (meter models certified under the Measuring Instruments Directive 2014/
32/EU for sub-billing applications). This feature improves security by preventing
unauthorized changes to revenue-critical parameters and helps reduce the risk of
tampering or manipulating metering data.
After the meter is revenue-locked, only authorized users can perform
revenue-related configuration tasks.
9.10.2 Revenue metering components
To meet government regulations and utility security requirements, the meter
incorporates display passcode entry to reset meter values, for example, Master
reset.
9.10.3 Revenue firmware security features
Your revenue meter has additional firmware security features.
When revenue-locked, you cannot perform resets, configure some revenue-
specific parameters, or upgrade your meter.
Firmware upgrades
You cannot upgrade a locked meter.
To upgrade your meter, you must:
• Follow the unlocking procedure to unlock the meter. See Unlocking the
revenue meter, page 78.
• Perform the upgrade.
• Follow the locking procedure to lock the meter. See Locking the revenue
meter, page 78.
NOTE: For MID/MIR meter models, the meter supports a maximum of 25
firmware upgrade attempts, including both successful and unsuccessful
attempts. After this limit is reached, no further firmware upgrades are
permitted.
9.10.4 Protected setup parameters and functions
Your meter has features and settings that cannot be changed when the meter is
revenue-locked. To prevent modifications to revenue-related settings and data on
your meter, some of the features and parameters on your meter cannot be edited
when the meter is revenue-locked.
7EN02-0489-00 139
9. Technical reference PowerLogic
™
Intuitive PM7100 / PM7200 / PM7300 series

Protected setup parameters
Settings Protected status Description
Power system settings Yes You cannot change any power system settings when the meter is
locked (for example, power system type, VT and CT connections,
VT and CT primary and secondary values, system frequency, and
phase rotation).
NOTE: For MID/MIR compliance, the Power System must be
set to either 3PH4W Wye Gnd (3-phase 4-wire wye grounded)
or 3PH3W Dlt Ungnd (3-phase 3-wire delta ungrounded) or
1PH2W LN (Single-phase 2-wire line-to-neutral).
Meter label Yes You cannot change the meter label when the meter is locked.
Meter time settings Yes You cannot change the meter’s date when the meter is locked.
Energy pulsing Yes The alarm/energy pulsing LED on the MID/MIR compliant models is
permanently set for energy pulsing and cannot be disabled or used
for alarms. All other setup parameters for the energy pulsing LED
are also permanently set and cannot be modified. The settings are
fixed at:
• Mode (Control) = Energy (energy pulsing)
• Pulses per k_h (Pulse Rate) = 10,000 (pulses per kWh)
NOTE: The pulses per kWh reflect uncompensated values
only. This means that the PT and CT values are ignored,
and the pulses represent the raw energy calculated from
the metering inputs.
• Channel (Parameter) = Active Energy Del+Rec
Multi-tariff and input metering settings Yes You cannot change multi-tariff mode or settings when the meter is
locked. For MID/MIR compliant models, you can only configure a
subset of input metering settings when the meter is locked (channel
label and demand code cannot be configured).
Protected functions
Functions Description
Resets After the meter is locked, the following functions are disabled:
• Product reset
• Global resets: Meter initialization (all) and energies
• Single resets: Energy and multi-tariff
Control power (auxiliary power)
interruption event
• After the meter is locked, the control power (auxiliary power) interruption event is
acknowledged only after entering the Revenue Lock passcode.
For a complete list of protected functions and settings, see your meter’s Modbus
register list, available from www.se.com.
9.10.5 Revenue locking
Revenue locking your meter helps prevent modifications to revenue-related
settings and data on your meter or tampering with your meter’s voltage and
current connections.
Revenue locking may be required to help meet government regulations and utility
security requirements or can be used to help ensure the validity of revenue data.
You must configure all the lock-protected setup parameters before locking the
meter.
9.10.5.1 Revenue-locking summary
You must configure and revenue lock your meter before installing it.
• Unlock your revenue meter if it is locked.
140 7EN02-0489-00
PowerLogic
™
Intuitive PM7100 / PM7200 / PM7300 series 9. Technical reference

• Configure the required revenue settings specific for installation.
NOTE: If you are using PowerLogic™ Engineering Suite to configure your
meter, allow for any communication delays before removing power to your
meter.
• Verify the revenue settings have been implemented.
• Clear all accumulated meter data.
• Revenue lock your meter.
• Verify the meter is revenue-locked.
• Install the meter and install the terminal covers according to your meter’s
instruction sheet.
7EN02-0489-00 141
9. Technical reference PowerLogic
™
Intuitive PM7100 / PM7200 / PM7300 series
10. Device specifications
Mechanical characteristics
IP degree of protection (IEC 60529) Display: IP65
Meter body: IP30 (except connectors)
Connectors: IP20 with terminal covers installed, IP10 without terminal covers
Mounting position Vertical
Display type Color LCD, 320 x 240 resolution
Display backlight Backlit LCD, multilingual, bar graphs, 6 lines, 4 concurrent values
Viewable area 72.69 x 55.1 mm (2.86 x 2.17 in)
Keypad 4-button
Weight < 0.417 kg (< 0.919 lb)
Dimensions W x H x D
Protrusion from cabinet
96 x 96 x 74 mm (3.78 x 3.78 x 2.91 in) [depth of meter from housing mounting flange]
15.5 mm (0.61 in)
Panel thickness 6 mm (0.24 in) maximum
Electrical characteristics
Table 38 - Measurement accuracy
• Measurement type: True RMS on three-phase (3P, 3P + N), 128 samples per cycle, zero blind
• IEC 61557-12:2018, BS EN IEC 61557-12:2022: PMD/[SD|SS]/K70/0.5 / PMD/[SD|SS]/K70/0.2
Measurement type Class of accuracy
Active energy Class 0.5S/0.2S as per IEC 62053-22:2020, BS EN 62053-22:2021 at 1 A/5 A I
nominal
Reactive energy Class 2 as per IEC 62053-24:2020, BS EN 62053-24:2021 at 1 A/5 A I
nominal
Active power Class 0.5/0.2 as per IEC 61557-12:2018, BS EN IEC 61557-12:2022
Apparent power Class 0.5/0.2 as per IEC 61557-12:2018, BS EN IEC 61557-12:2022
Reactive power Class 2 as per IEC 61557-12:2018, BS EN IEC 61557-12:2022
Current, phase Class 0.5/0.2 as per IEC 61557-12:2018, BS EN IEC 61557-12:2022
Voltage (L-N) Class 0.5/0.2 as per IEC 61557-12:2018, BS EN IEC 61557-12:2022
Frequency Class 0.05
Power factor ±0.005 Count/±0.002 Count
NOTE: Reactive power and energy are calculated according to IEC 62053-
24:2020, BS EN 62053-24:2021. Harmonics are not included in this
calculation.
Table 39 - Power quality accuracy
Measurement type Class of accuracy
Voltage unbalance Class 0.5 as per IEC 61557-12:2018, BS EN IEC 61557-12:2022
Voltage harmonics Class 2 as per IEC 61557-12:2018, BS EN IEC61557-12:2022
Voltage THD/thd Class 2 as per IEC 61557-12:2018, BS EN IEC 61557-12:2022
Current harmonics Class 2 as per IEC 61557-12:2018, BS EN IEC 61557-12:2022
Current THD Class 2 as per IEC 61557-12:2018, BS EN IEC 61557-12:2022
142 7EN02-0489-00
PowerLogic
™
Intuitive PM7100 / PM7200 / PM7300 series 10. Device specifications

Table 40 - Voltage inputs
Maximum VT/PT primary 1.0 MV AC
Specified accuracy range 20...400 V L-N/35...690 V L-L (Wye) or 35...600 V L-L (Delta)
UL listed up to 347 V L-N/600 V L-L
Measurement category / Overvoltage
category
CAT III
Impedance 5 MΩ
Rated impulse voltage 6 kV for 1.2 μs
Frequency Measured: 45...65 Hz
Nominal: 50/60 Hz
Burden < 0.2 VA at 240 V L-N
Table 41 - Current inputs
CT secondary Nominal: 5 A or 1 A
Measured current 0.01...1(2) A / 0.05...5(10) A
Starting current 1 mA
Impedance < 0.3 mΩ
Frequency Measured: 45...65 Hz
Nominal: 50/60 Hz
Burden < 0.05 VA at 10 A
Table 42 - AC control power
Nominal AC voltage 277 V L-N (Range: 100...277 V L-N ± 10%)
415 V L-L (Range: 100...415 V L-L ± 10%)
Burden 6.2 VA/3.4 W max at 120 V L-N
8.2 VA/3.8 W max at 230 V L-N
13.5 VA/4.7 W max at 415 V L-L
Overvoltage category CAT III 300 V L-N class per IEC 61010
Nominal frequency 50/60 Hz (Range: 45...65 Hz)
Ride-through time 30 ms typical at 120 V L-N and maximum burden
120 ms typical at 230 V L-N and maximum burden
430 ms typical at 415 V L-L and maximum burden
Table 43 - DC control power
Nominal DC voltage 250 V (Range: 125...250 V ± 20%)
Burden 3.2 W max at 250 V DC
Ride-through time 20 ms typical at 125 V DC and maximum burden
Overvoltage category CAT III 300 V DC class per IEC 61010
Table 44 - Relay outputs (PM7151DUW / PM7231DUW / PM7232DUW / PM7252DUW / PM7332DUW /
PM7351DUW)
Number 2 (selected models)
Maximum output frequency 0.5 Hz maximum (1 second ON/1 second OFF – minimum times)
Switching current 250 V AC at 8.0 A, 25 k cycles, resistive
30 V DC at 2.0 A, 75 k cycles, resistive
7EN02-0489-00 143
10. Device specifications PowerLogic
™
Intuitive PM7100 / PM7200 / PM7300 series
Table 44 - Relay outputs (PM7151DUW / PM7231DUW / PM7232DUW / PM7252DUW / PM7332DUW /
PM7351DUW) (Continued)
30 V DC at 5.0 A, 12.5 k cycles, resistive
Isolation 3 kV rms
Overvoltage category CAT II
Table 45 - Digital outputs (Not available in PM7231DUW / PM7232DUW / PM7332DUW)
Number 1 or 2 (selected outputs)
Maximum load voltage 40 V DC
Maximum load current 20 mA
ON resistance 50 Ω maximum
Meter constant 1 to 9999999 pulses per k_h (k_h = kWh, kvarh or kVAh depending on the energy parameter
selected)
Pulse width 50% duty cycle
Pulse ON time Configurable (20 ms, 25 ms, 50 ms, 100 ms)
Maximum pulse frequency ≤ 25 Hz
Maximum pulse width ≤ 200 ms
Leakage current 0.03 μA
Isolation 5 kV rms
Table 46 - Digital inputs
Number 1 or 2 or 4 (selected models)
Voltage OFF 0...4 V DC
Voltage ON 18.5...36 V DC
Frequency 2 Hz (T ON min = T OFF min = 250 ms)
Input resistance 110 kΩ
Isolation 5 kV rms
Response time 20 ms
Wetting output 24 V DC/ 8 mA max
Input burden 2 mA at 24 V DC
Environmental characteristics
Operating temperature Meter: -25...70 °C (-13...158 °F)
Display: -20...70 °C (-4...158 °F)
Storage temperature -40...+85 °C (-40...185 °F)
Humidity rating Operating: 5...95% RH non-condensing at 50 °C (122 °F)
Storage: 5% to 80% RH non-condensing
Maximum dew point 37 °C (99 °F)
Pollution degree 2
Altitude ≤ 2000 m (6562 ft) CAT III / ≤ 3000 m (9843 ft) CAT II
144 7EN02-0489-00
PowerLogic
™
Intuitive PM7100 / PM7200 / PM7300 series 10. Device specifications

Location For indoor use in a stationary panel
Must be permanently connected and fixed
Product life 15 years at 40 °C (104 °F), 95% RH
LEDs
Table 47 - LED indicators
Heartbeat/communications activity Green LED
Alarm/energy pulsing output LED
(Configurable)
Amber LED
Table 48 - Alarm/energy pulsing LED
Type Amber LED, optical
Maximum pulse frequency 50 Hz
Maximum pulse rate 2.5 kHz
Pulse width 50% duty cycle (200 μs minimum ON time)
Meter constant 10000 pulses per k_h
Configurable from 1 to 9999999 pulses per k_h (k_h = kWh, kvarh or kVAh)
(Fixed at 10000 pulses per kWh on MID/MIR meter models)
Wavelength 590 to 635 nm
EMC (ElectroMagnetic Compatibility)
Harmonic current emissions IEC 61000-3-2
Flicker emissions IEC 61000-3-3
Immunity to electrostatic discharge IEC 61000-4-2
Immunity to radiated fields IEC 61000-4-3
Immunity to fast transients IEC 61000-4-4
Immunity to surges IEC 61000-4-5
Immunity to conducted disturbances,
150 kHz to 80 MHz
IEC 61000-4-6
Immunity to magnetic fields IEC 61000-4-8
Immunity to voltage dips and
interruptions
IEC 61000-4-11
Immunity for ring wave IEC 61000-4-12
Immunity to damped oscillatory waves IEC 61000-4-18
Radiated and conducted emissions CISPR 32: Class B
Safety and product standards
Protective class Protective class II
Double insulated for user-accessible parts
Safety IEC 61010-1:2010/AMD1:2016/COR1:2019 (Edition 3)
7EN02-0489-00 145
10. Device specifications PowerLogic
™
Intuitive PM7100 / PM7200 / PM7300 series

EN 61010-1:2010+A1:2019
UL 61010-1, Edition 3:2023
IEC 61010-2-030:2017 (Edition 2)
EN 61010-2-30:2021/A11:2021
UL 61010-2-030, Edition 2:2023
IEC 62052-31:2024 / BS EN 62052-31:2024
CAN/CSA-C22.2 No. 61010-1-12, Edition 3:2023
CSA C22.2 No. 61010-2-030:18, Edition 2:2018
Standard compliance IEC 62052-11:2020
IEC 62053-22:2020
IEC 62053-24:2020
IEC 61557-12:2018
BS EN IEC 62052-11:2021/A11:2022
BS EN 62053-22:2021
BS EN 62053-24:2021
BS EN IEC 61557-12:2022
BS EN 50470-1:2022
BS EN 50470-3:2022
WELMEC Guide 7.2 Software Guide Version
2025
ANSI C12.1:2024
Cybersecurity RED-DA (EN 18031-1:2024)
Adheres to IEC 62443-4-2 requirements
EMC standards EN 61326-1:2021 and IEC 61000 series (Sub standards)
IEC 61326-1:2020
CISPR 11:2015+AMD1:2016+AMD2:2019
CISPR 32:2015 AMD 1:2020
EN 55011:2016/A2:2021
EN 55032:2015+A11:2020
IEC 62052-11:2020
USA: FCC 47 CFR Part 15 Subpart B
Canada: ICES-003 Issue 7:2020
RF standards ETSI EN 300 328 V2.2.2 (2019-07)
MPE:
• EN IEC 62311:2020 / IEC 62311:2019
• EN 62479:2010 / BS EN 62479:2010 / IEC 62479:2010
USA
• FCC 47 CFR Part 15 Subpart C
• MPE: 47 CFR FCC Part 2.1091
Canada
• ISED RSS-247 Issue 4
• ISED RSS-GEN Issue 5 + A1 + A2
• MPE: RSS-102 Issue 6 (2023-12)
Australia/New Zealand
• AS/NZS 4268:2017+A1:2021
• MPE: AS/NZS 2772.2:2016
RF EMC standards ETSI EN 301 489-1 V2.2.3 (2019-11)
ETSI EN 301 489-17 V3.3.1 (2024-09)
146 7EN02-0489-00
PowerLogic
™
Intuitive PM7100 / PM7200 / PM7300 series 10. Device specifications
MID/MIR compliance
Additional specifications apply to the MID/MIR meter models (PM7151DUW /
PM7211DUW / PM7231DUW / PM7351DUW).
Applicable MID/MIR standards and
class index
BS/EN 50470-1 Class C
BS/EN 50470-3 Class C
Type of measuring equipment Static watt-hour meter
Intended use Indoor use only, permanently mounted in residential, commercial, or light industrial applications,
where levels of vibration and shock are of low significance
Mechanical environment M1
Electromagnetic (EMC) environment E2
Applicable measurements C (kWh)
Voltage at voltage terminals 3PH4W Wye Gnd (3-phase 4-wire wye grounded): 3x63.5 V L-N/110 V L-L...3x400 V L-N/690 V
L-L
3PH3W Dlt Ungnd (3-phase 3-wire delta ungrounded): 3x110...3x690 V L-L
1PH2W LN (Single-phase 2-wire line-to-neutral): 63.5...400 V L-N
Current Rating (Imin – Iref (Imax)) 0.01...1(2) A / 0.05...5(10) A
Electrical network frequency 50 Hz
Impulse voltage rating 6 kV
AC voltage rating 4 kV
RS-485 communication (PM7112DUW / PM7211DUW /
PM7212DUW / PM7222DUW / PM7231DUW / PM7232DUW /
PM7332DUW)
Number of ports 1
Maximum cable length 1219 m (4000 ft)
Maximum number of devices (unit
loads)
Up to 32 devices on the same bus
Parity Even, Odd, None With One, None With Two (1 stop bit for Odd or Even parity, 2 stop bits for
None With One and None With Two)
Baud rate 4800, 9600, 19200, 38400 baud
Protocol Modbus RTU
Isolation 2.5 kV RMS galvanic isolation, double insulated
Ethernet communication (PM7142DUW / PM7151DUW /
PM7252DUW / PM7351DUW)
Number of ports 1
Data rate Up to 100 Mbps
Protocol Modbus TCP and BACnet/IP
7EN02-0489-00 147
10. Device specifications PowerLogic
™
Intuitive PM7100 / PM7200 / PM7300 series

Bluetooth communication (PM7211DUW / PM7212DUW /
PM7222DUW / PM7231DUW / PM7232DUW / PM7252DUW /
PM7332DUW / PM7351DUW)
Version 5.3
Operating frequency band 2400 to 2483.5 MHz
Channel spacing 2 MHz
Channels 40
Modulation type GFSK
Maximum output power (EIRP) ≤ 10 dBm (default: 0 dBm)
Real-time clock
Clock drift < 0.5 seconds per day (typical) as per IEC 62054-21
Battery backup time 3 years without control power (typical)
Conformal coating
PCBAs assembled in this product are treated with UL approved conformal coating chemical.
148 7EN02-0489-00
PowerLogic
™
Intuitive PM7100 / PM7200 / PM7300 series 10. Device specifications