MaxiSys Ultra S2
USER MANUAL

i
Patent
This product is protected by patents in the U.S. and elsewhere. For more information,
please visit https://autel.us/virtual-patents/.
Trademarks
Autel
®
, MaxiSys
®
, MaxiDAS
®
, MaxiScan
®
, MaxiTPMS
®
, MaxiRecorder
®
, and
MaxiCheck
®
are trademarks of Autel Intelligent Technology Corp., Ltd., registered in
China, the United States, and other countries. All other marks are trademarks or
registered trademarks of their respective holders.
Copyright Information
No part of this manual may be reproduced, stored in a retrieval system or transmitted in
any form or by any means electronic, mechanical, photocopying, recording, or otherwise
without the prior written permission of Autel.
Disclaimer of Warranties and Limitation of Liabilities
All information, specifications and illustrations in this manual are based on the latest
information available at the time of printing.
Autel reserves the right to make changes at any time without notice. While information
of this manual has been carefully checked for accuracy, no guarantee is given for the
completeness and correctness of the contents, including but not limited to the product
specifications, functions, and illustrations.
Autel will not be liable for any direct, special, incidental, or indirect damages, or for any
economic consequential damages (including the loss of profits) as a result of using this
product.
IMPORTANT
Before operating or maintaining this unit, please read this manual carefully, paying extra
attention to the safety warnings and precautions.
For Services and Support
pro.autel.com
www.autel.com
1-855-288-3587 (North America)
+86 (0755) 8614-7779 (China)

ii
For technical assistance in all other markets, please refer to Technical Support in this
manual.
Safety Information
For your own safety and the safety of others, and to prevent damage to the device and
vehicles upon which it is used, it is important that the safety instructions presented
throughout this manual be read and understood by all persons operating or coming into
contact with the device.
There are numerous procedures, techniques, tools, and parts required for servicing
vehicles, as well as the skills of the person doing the work. Because of the vast number
of test applications and variations in the products that can be tested with this equipment,
we cannot possibly anticipate or provide advice or safety messages to cover every
circumstance. It is the automotive technician’s responsibility to be knowledgeable of the
system being tested. It is crucial to use proper service methods and test procedures. It
is essential to perform tests in an appropriate and acceptable manner that does not
endanger your safety, the safety of others in the work area, the device being used, or the
vehicle being tested.
Before using the device, always refer to and follow the safety messages and applicable
test procedures provided by the manufacturer of the vehicle or equipment being tested.
Use the device only as described in this manual. Be sure to read, understand, and follow
all safety messages and instructions in this manual.
Safety Messages
Safety messages are provided to help prevent personal injury and equipment damage.
All safety messages are introduced by a signal word indicating the hazard level.
DANGER
Indicates an imminently hazardous situation which, if not avoided, could result in death
or serious injury to the operator or to bystanders.
WARNING
Indicates a potentially hazardous situation which, if not avoided, could result in death or
serious injury to the operator or to bystanders.
Safety Instructions
The safety messages herein cover situations Autel is aware of at the time of publication.
Autel cannot know, evaluate or advise you as to all of the possible hazards. You must be
certain that any condition or service procedure encountered does not jeopardize your
personal safety.

iii
DANGER
When an engine is operating, keep the service area WELL VENTILATED or attach a
building exhaust removal system to the engine exhaust system. Engines produce carbon
monoxide, an odorless, poisonous gas that causes slower reaction time and can lead to
serious personal injury or loss of life.
It is not advised to use headphones at a high volume
Listening at high volumes for long periods of time may result in loss of hearing.
Safety Warnings
⚫ Always perform automotive testing in a safe environment.
⚫ Wear safety eye protection that meets ANSI standards.
⚫ Keep clothing, hair, hands, tools, test equipment, etc. away from all moving or hot
engine parts.
⚫ Operate the vehicle in a well-ventilated work area, for exhaust gases are poisonous.
⚫ Put the transmission in PARK (for automatic transmission) or NEUTRAL (for manual
transmission) and make sure the parking brake is engaged.
⚫ Put blocks in front of the drive wheels and never leave the vehicle unattended while
testing.
⚫ Be extra cautious when working around the ignition coil, distributor cap, ignition wires
and spark plugs. These components create hazardous voltages when the engine is
running.
⚫ Keep a fire extinguisher suitable for gasoline, chemical, and electrical fires nearby.
⚫ Do not connect or disconnect any test equipment while the ignition is on or the
engine is running.
⚫ Keep the test equipment dry, clean, free from oil, water or grease. Use a mild
detergent on a clean cloth to clean the outside of the equipment as necessary.
⚫ Do not drive the vehicle and operate the test equipment at the same time. Any
distraction may cause an accident.
⚫ Refer to the service manual for the vehicle being serviced and adhere to all
diagnostic procedures and precautions. Failure to do so may result in personal injury
or damage to the test equipment.
⚫ To avoid damaging the test equipment or generating false data, make sure the
vehicle battery is fully charged and the connection to the vehicle DLC is clean and
secure.
⚫ Do not place the test equipment on the distributor of the vehicle. Strong electro-
magnetic interference can damage the equipment.

iv
CONTENTS
1 USING THIS MANUAL ................................................................................................... 1
1.1 CONVENTIONS ..................................................................................................... 1
2 GENERAL INTRODUCTION .......................................................................................... 3
2.1 MAXISYS TABLET ................................................................................................. 3
2.2 MAXIFLASH VCMI2 .............................................................................................. 9
2.3 ACCESSORIES KIT .............................................................................................. 13
2.4 OTHER ACCESSORIES......................................................................................... 14
3 GETTING STARTED .................................................................................................... 16
3.1 POWER UP ........................................................................................................ 16
3.2 POWER DOWN ................................................................................................... 21
4 AI TECHNICIAN ASSISTANT ...................................................................................... 22
5 DIGITAL VEHICLE INSPECTION ................................................................................ 24
6 DIAGNOSTICS ............................................................................................................. 28
6.1 ESTABLISH VEHICLE COMMUNICATION .................................................................. 28
6.2 GETTING STARTED ............................................................................................. 33
6.3 VEHICLE IDENTIFICATION ..................................................................................... 35
6.4 NAVIGATION....................................................................................................... 40
6.5 DIAGNOSTICS MENU ........................................................................................... 43
6.6 DIAGNOSTICS FUNCTIONS ................................................................................... 43
6.7 GRAPHICAL DIAGNOSTICS ................................................................................... 61
6.8 LIVE DATA FUSION ............................................................................................. 63
6.9 PROGRAMMING AND CODING ............................................................................... 64
6.10 GENERIC OBDII OPERATIONS ............................................................................. 67
6.11 DIAGNOSTIC REPORT ......................................................................................... 71

v
6.12 EXIT DIAGNOSTICS ............................................................................................. 75
7 SERVICE ...................................................................................................................... 77
7.1 OIL RESET SERVICE ........................................................................................... 77
7.2 ELECTRIC PARKING BRAKE (EPB) SERVICE .......................................................... 78
7.3 TIRE PRESSURE MONITORING SYSTEM (TPMS) SERVICE ...................................... 79
7.4 BATTERY MANAGEMENT SYSTEM (BMS) SERVICE ................................................ 79
7.5 DIESEL PARTICULATE FILTER (DPF) SERVICE ....................................................... 79
7.6 STEERING ANGLE SENSOR (SAS) SERVICE .......................................................... 80
8 ADAS............................................................................................................................ 82
9 MEASUREMENT .......................................................................................................... 83
9.1 OSCILLOSCOPE .................................................................................................. 83
9.2 MULTIMETER.................................................................................................... 146
9.3 WAVEFORM GENERATOR .................................................................................. 169
9.4 BUS INSPECTION .............................................................................................. 194
10 DATA MANAGER ....................................................................................................... 220
10.1 VEHICLE HISTORY ............................................................................................ 221
10.2 WORKSHOP INFORMATION................................................................................. 223
10.3 CUSTOMER ...................................................................................................... 224
10.4 IMAGE ............................................................................................................. 225
10.5 CLOUD REPORT ............................................................................................... 227
10.6 PDF FILES ...................................................................................................... 227
10.7 REVIEW DATA .................................................................................................. 227
10.8 REFERENCE VALUE .......................................................................................... 228
10.9 DATA LOGGING ................................................................................................ 229
10.10 UNINSTALL APPS .............................................................................................. 229
11 BATTERY TEST ......................................................................................................... 230

vi
11.1 MAXIBAS BT506 BATTERY TESTER .................................................................. 231
11.2 TEST PREPARATION ......................................................................................... 233
11.3 IN-VEHICLE TEST .............................................................................................. 234
11.4 OUT-VEHICLE TEST .......................................................................................... 240
12 SETTINGS .................................................................................................................. 242
12.1 UNIT ............................................................................................................... 242
12.2 LANGUAGE ...................................................................................................... 243
12.3 PRINT SETTINGS .............................................................................................. 243
12.4 REPORT SETTINGS ........................................................................................... 244
12.5 PUSH NOTIFICATION ......................................................................................... 245
12.6 AUTO UPDATE ................................................................................................. 245
12.7 OBFCM UPLOAD ............................................................................................. 246
12.8 ADAS SETTINGS ............................................................................................. 246
12.9 VEHICLE LIST ................................................................................................... 246
12.10 APP SORTING .................................................................................................. 247
12.11 BATTERY TEST................................................................................................. 247
12.12 COUNTRY/REGION CODE .................................................................................. 247
12.13 LAWS AND REGULATIONS .................................................................................. 248
12.14 SYSTEM SETTINGS ........................................................................................... 248
12.15 ABOUT ............................................................................................................ 248
13 UPDATES ................................................................................................................... 249
14 VCMI MANAGER ....................................................................................................... 250
14.1 WI-FI CONNECTION .......................................................................................... 251
14.2 VCMI BLUETOOTH PAIRING .............................................................................. 252
14.3 BAS BLUETOOTH PAIRING ................................................................................ 253
14.4 VCMI UPDATE ................................................................................................. 253

vii
14.5 BAS UPDATE .................................................................................................. 254
15 HAND-HELD INCLINOMETER .................................................................................. 255
16 SUPPORT .................................................................................................................. 257
16.1 SUPPORT SCREEN LAYOUT ............................................................................... 257
16.2 MY ACCOUNT .................................................................................................. 257
16.3 TRAINING ........................................................................................................ 258
16.4 DATA LOGGING ................................................................................................ 258
16.5 FAQ ............................................................................................................... 258
17 MAXIVIEWER ............................................................................................................. 260
18 MAXIVIDEO ................................................................................................................ 263
19 QUICK LINKS ............................................................................................................ 264
20 REMOTE DESKTOP .................................................................................................. 265
20.1 OPERATIONS ................................................................................................... 265
21 USER FEEDBACK ..................................................................................................... 267
22 AUTEL USER CENTER ............................................................................................. 268
23 MAINTENANCE AND SERVICE ................................................................................ 270
23.1 MAINTENANCE INSTRUCTIONS............................................................................ 270
23.2 TROUBLESHOOTING CHECKLIST ......................................................................... 271
23.3 ABOUT BATTERY USAGE ................................................................................... 271
23.4 SERVICE PROCEDURES ..................................................................................... 272
24 COMPLIANCE INFORMATION .................................................................................. 276
25 WARRANTY ............................................................................................................... 279

1
1 Using This Manual
This manual contains device usage instructions.
Some illustrations shown in this manual may contain modules and optional equipment
that are not included in your system.
1.1 Conventions
The following conventions are used:
1.1.1 Bold Text
Bold text is used to highlight selectable items such as buttons and menu options.
Example:
⚫ Tap OK.
1.1.2 Notes and Important Messages
1.1.2.1 Notes
A NOTE provides helpful information such as additional explanations, tips, and
comments.
1.1.2.2 Important
IMPORTANT indicates a situation that if not avoided may result in damage to the tablet
or vehicle.
1.1.3 Hyperlinks
Hyperlinks are available in electronic documents. Blue italic text indicates a selectable
hyperlink; blue underlined text indicates a website link or an email address link.

2
1.1.4 Illustrations
Illustrations used in this manual are samples, the actual testing screen may vary for each
vehicle being tested. Observe the menu titles and on-screen instructions to make correct
option selection.
1.1.5 Procedures
An arrow icon indicates a procedure. Example:
➢ To power down the MaxiSys tablet
1. Long press (press and hold) the Power/Lock button.
2. Tap the Power Off option.
3. Tap OK.
3
2 General Introduction
There are two main components to the MaxiSys system:
⚫ MaxiSys Tablet — the central processor and monitor for the system.
⚫ MaxiFlash VCMI2 — Vehicle Communication and Measurement Interface 2.
This manual describes the construction and operation of these devices and how they
work together to deliver diagnostic solutions.
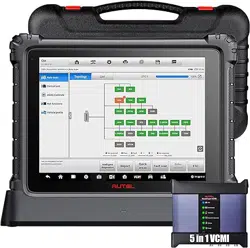
2.1 MaxiSys Tablet
2.1.1 Function Description
Figure 2-1 MaxiSys Tablet, Front View
1. 13.7” TFT-LCD Capacitive Touchscreen
2. Ambient Light Sensor — detects ambient brightness
3. Power LED — refer to Table 2-1 Power LED Description for details
4. Front Camera
5. Built-in Microphone
4
Table 2-1 Power LED Description
LED
Color
Description
Power
Green
⚫ Lights green when the tablet is charging and the
battery level is above 90%.
⚫ Lights green when the tablet is powered on and the
battery level is above 20%.
Yellow
Lights yellow when the tablet is charging and the battery
level is below 90%.
Red
⚫ Lights red when the tablet is powered on and the
battery level is below 20%.
⚫ Lights red when the tablet shows abnormality after
being powered on or during charging.
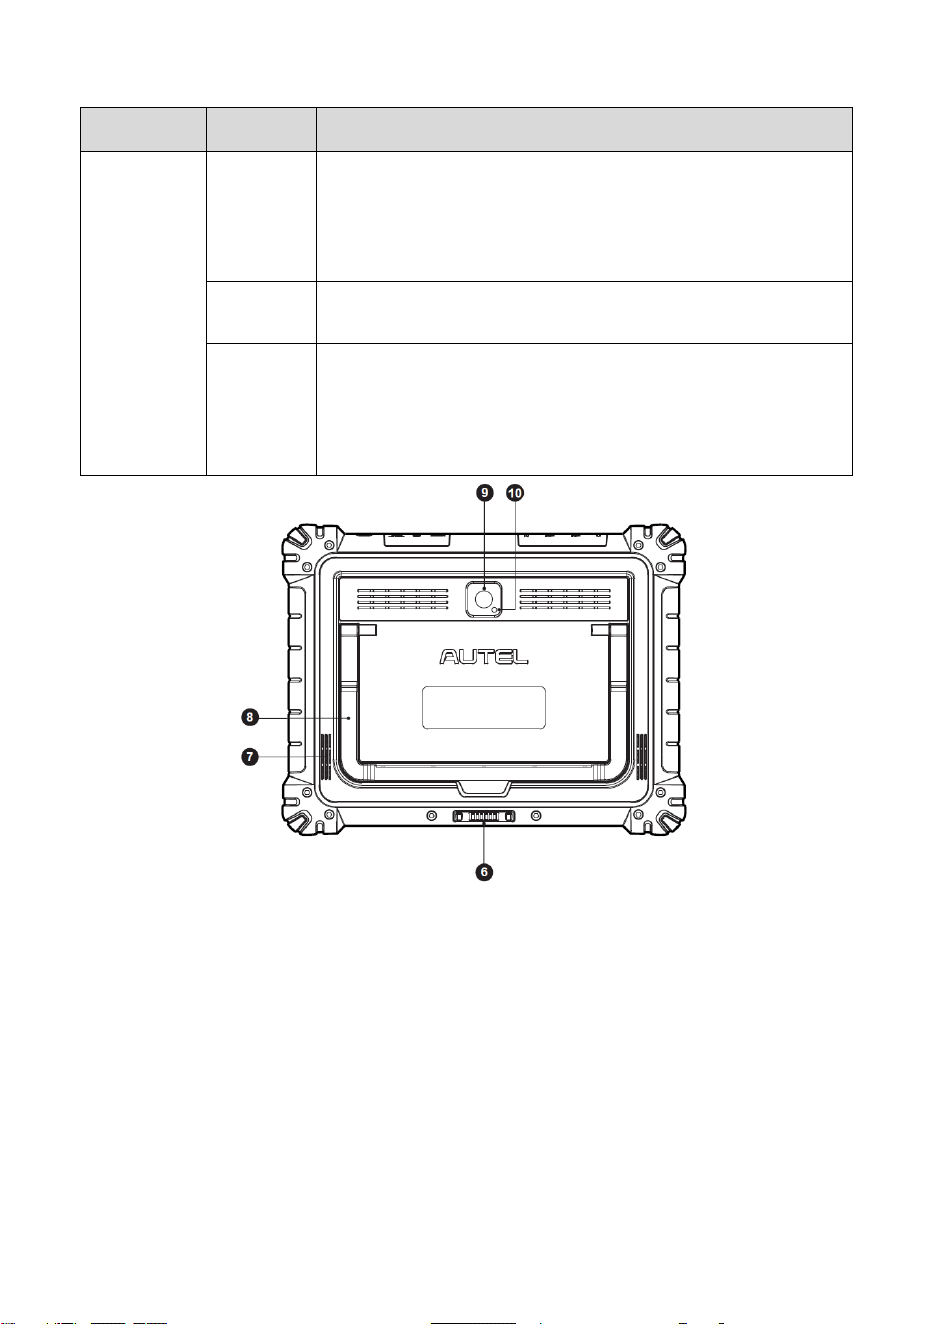
Figure 2-2 MaxiSys Tablet, Back View
6. Docking Station Port
7. Speaker
8. Collapsible Stand — extends from the back to allow hands-free viewing of the tablet
9. Rear Camera
10. Camera Flash
5
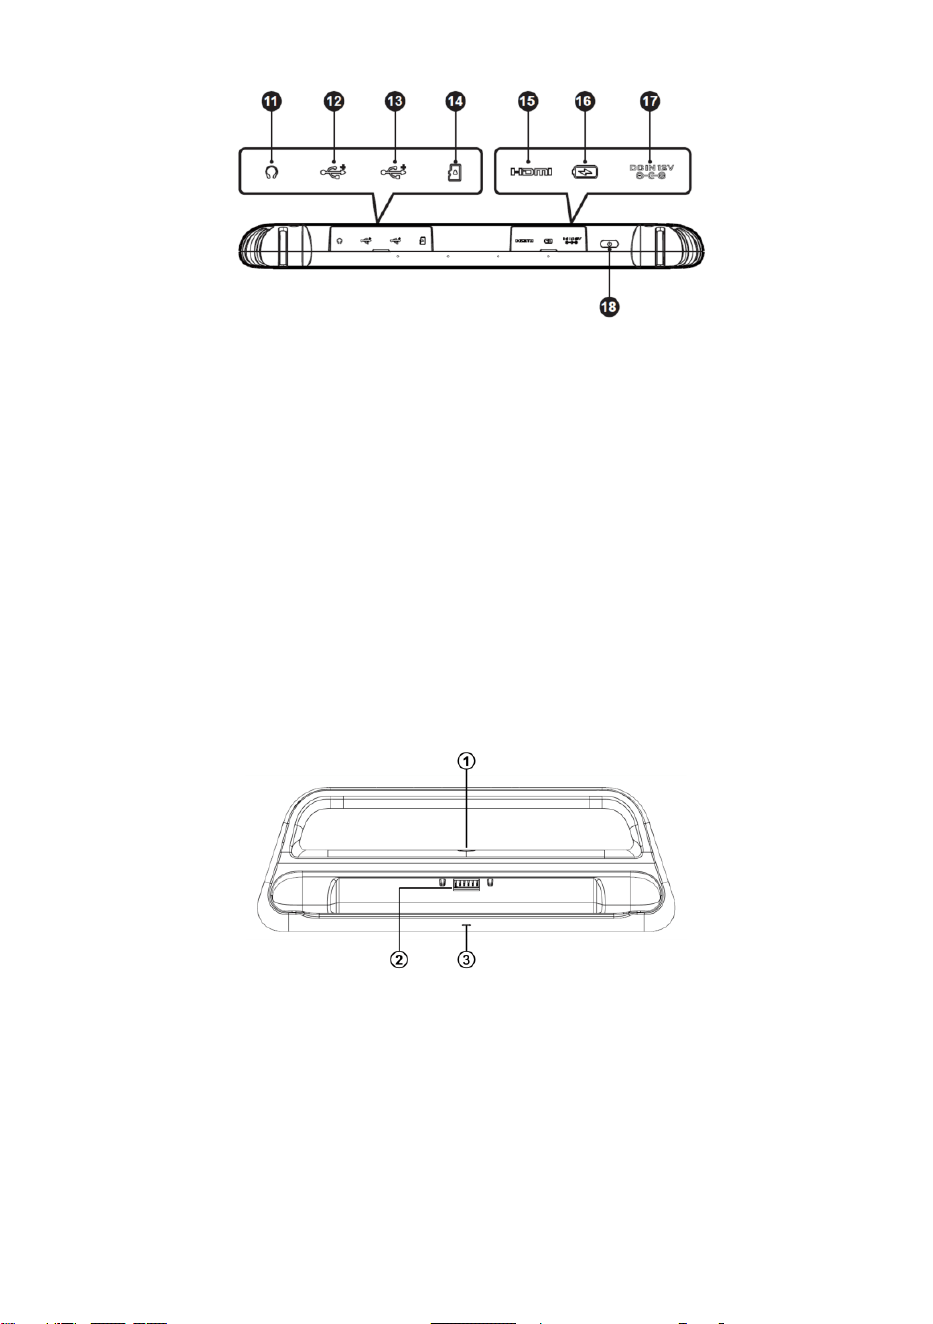
Figure 2-3 MaxiSys Tablet, Top View
11. Headphone Jack
12. USB Port
13. USB Port
14. Mini SD Card Slot
15. HDMI (High-Definition Multimedia Interface) Port
16. Type-C Charging Port
17. DC Power Supply Input Port
18. Power/Lock Button — long press to turn on/off the tablet; short press to turn off and
lock the screen
2.1.2 Docking Station
Figure 2-4 Docking Station
1. DC Power Port — connects to the AC/DC adapter for power supply
2. Charging Dock — holds the tablet for optimum viewing and convenient charging
3. Status Indicator Light

6
The indicator light displays differently in response to the tablet status described below:
A. Green light — battery power of the tablet is sufficient (≥90%)
B. Yellow light — battery level is between 0% and 90%
NOTE
Ensure the docking station is clear of any small metal or other conductive parts to avoid
short-circuit damage to the charger and the tablet.
2.1.3 Power Sources
The tablet can receive power from any of the following sources:
⚫ Internal Battery Pack
⚫ AC/DC Power Supply
⚫ Vehicle Power
⚫ Type-C Power Supply
IMPORTANT
Do not charge the battery when the temperature is lower than 0 °C (32 °F) or higher than
45 °C (113 °F).
2.1.3.1 Internal Battery Pack
The tablet can be powered with its internal rechargeable battery, which if fully charged
can provide sufficient power for about 10 hours of continuous operation.
2.1.3.2 AC/DC Power Supply
The tablet can be powered from an electrical outlet using the AC/DC power adapter. The
AC/DC power supply also charges the internal battery pack.
2.1.3.3 Vehicle Power
The tablet can be powered from the auxiliary power outlet adapter or other DC power
port on the test vehicle through a direct cable connection. The vehicle power cable
connects to the DC power supply port on the top side of the tablet.
2.1.3.4 Type-C Power Supply
This tablet can be powered using the supplied USB Type-C cable. It supports USB Type-
C 45W (15V/3A) PD (power delivery) fast charging if your power adapter supports the
PD protocol.

7
2.1.4 Technical Specifications
Table 2-2 Tablet Specifications
Item
Description
Operating System
Android 13
Processor
Octa-core processor
Memory
12 GB RAM & 512 GB on-board memory
Display
13.7-inch anti-glare screen (2176 x 1600)
Connectivity
⚫ Wi-Fi x 2 (802.11 a/b/g/n/ac/ax 2x2 MIMO)
⚫ BT V5.2 + EDR
⚫ GPS
⚫ USB 2.0 (Two USB host Type A)
⚫ USB Type C (used to charge the tablet or connect to
a PC for data transfer)
⚫ HDMI 2.0
⚫ SD Card (support up to 256 GB)
Camera
⚫ Rear: 16 Megapixel, autofocus with flashlight
⚫ Front: 16 Megapixel
Sensors
⚫ Gravity Accelerometer
⚫ Ambient Light Sensor (ALS)
Audio
Input / Output
⚫ Microphone
⚫ Dual speakers
⚫ 3-band or 4-band 3.5 mm headset jack
Power and Battery
⚫ Charging via 12V 6A DC power adapter
⚫ Supplied docking station
⚫ USB Type-C 45W (15V/3A) PD (Power Delivery) fast
charging. Ensure the power adapter supports the PD
protocol.
⚫ 18000 mAh 3.8V lithium-polymer battery

8
Item
Description
Input Voltage
⚫ DC input: 12V/6A
⚫ USB-C input: 15V/3A max. (also support 9V/3A or
5V/3A)
Operating Temp.
0 °C to 50 °C (32 °F to 122 °F)
Storage Temp.
-10 °C to 60 °C (14 °F to 140 °F)
Dimensions
(W x H x D)
366.5 mm (14.43”) x 281.7 mm (11.09”) x 34 mm (1.34”)
Weight
2115.4 g (4.66 lbs.)
Protocols
PLC J2497, ISO-15765, SAE-J1939, ISO-14229 UDS,
SAE-J2411 Single Wire Can (GMLAN), ISO-11898-2,
ISO-11898-3, SAE-J2819 (TP20), TP16, ISO-9141, ISO-
14230, SAE-J2610 (Chrysler SCI), UART Echo Byte,
SAE-J2809 (Honda Diag-H), SAE-J2740 (GM ALDL),
SAE-J1567 (CCD BUS), Ford UBP, Nissan DDL UART
with Clock, BMW DS2, BMW DS1, SAE J2819 (VAG
KW81), KW82, SAE J1708, SAE-J1850 PWM (Ford SCP),
SAE-J1850 VPW (GM Class2), ISO 13400, CAN FD
Table 2-3 Docking Station Specifications
Item
Description
Input Voltage
DC 12V/6A
Operating Temp.
0 °C to 45 °C (32 °F to 113 °F)
Storage Temp.
-20 °C to 60 °C (-4 °F to 140 °F)
Dimensions
(W x H x D)
395.7 mm (15.58”) x 136.2 mm (5.36”) x 54 mm (2.13”)
Weight
1020.3 g (2.25 lbs.)
9
2.2 MaxiFlash VCMI2
2.2.1 Function Description
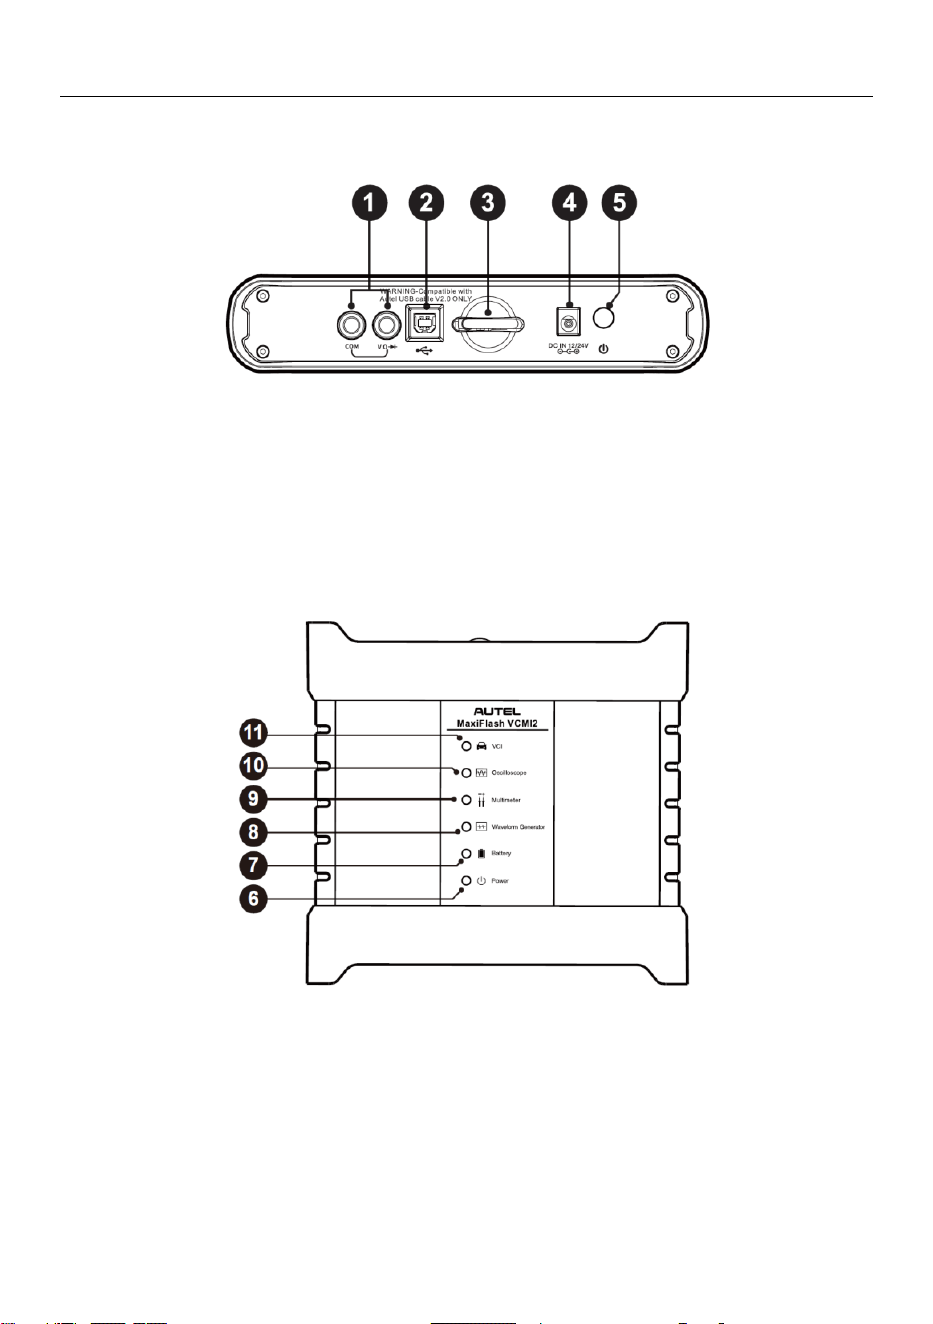
Figure 2-5 VCMI2 Top View
1. Multimeter Jacks
2. USB Port
3. Hook
4. DC Power Supply Input Port
5. Power Button
Figure 2-6 VCMI2 Front View
6. Power LED — refer to Table 2-4 Power LED Description for details
7. Battery LED — refer to Table 2-5 Battery LED Description for details
8. Waveform Generator LED — lights green when operating in the waveform generator
mode
10
9. Multimeter LED — lights green when operating in the multimeter mode
10. Oscilloscope LED — flashes green when operating in the oscilloscope mode
11. Vehicle LED — refer to Table 2-6 Vehicle LED Description for details
IMPORTANT
Do not disconnect this programming device while the vehicle LED status light is on. If
programming is interrupted while the vehicle's ECU is blank or only partially programmed,
the module may be unrecoverable.
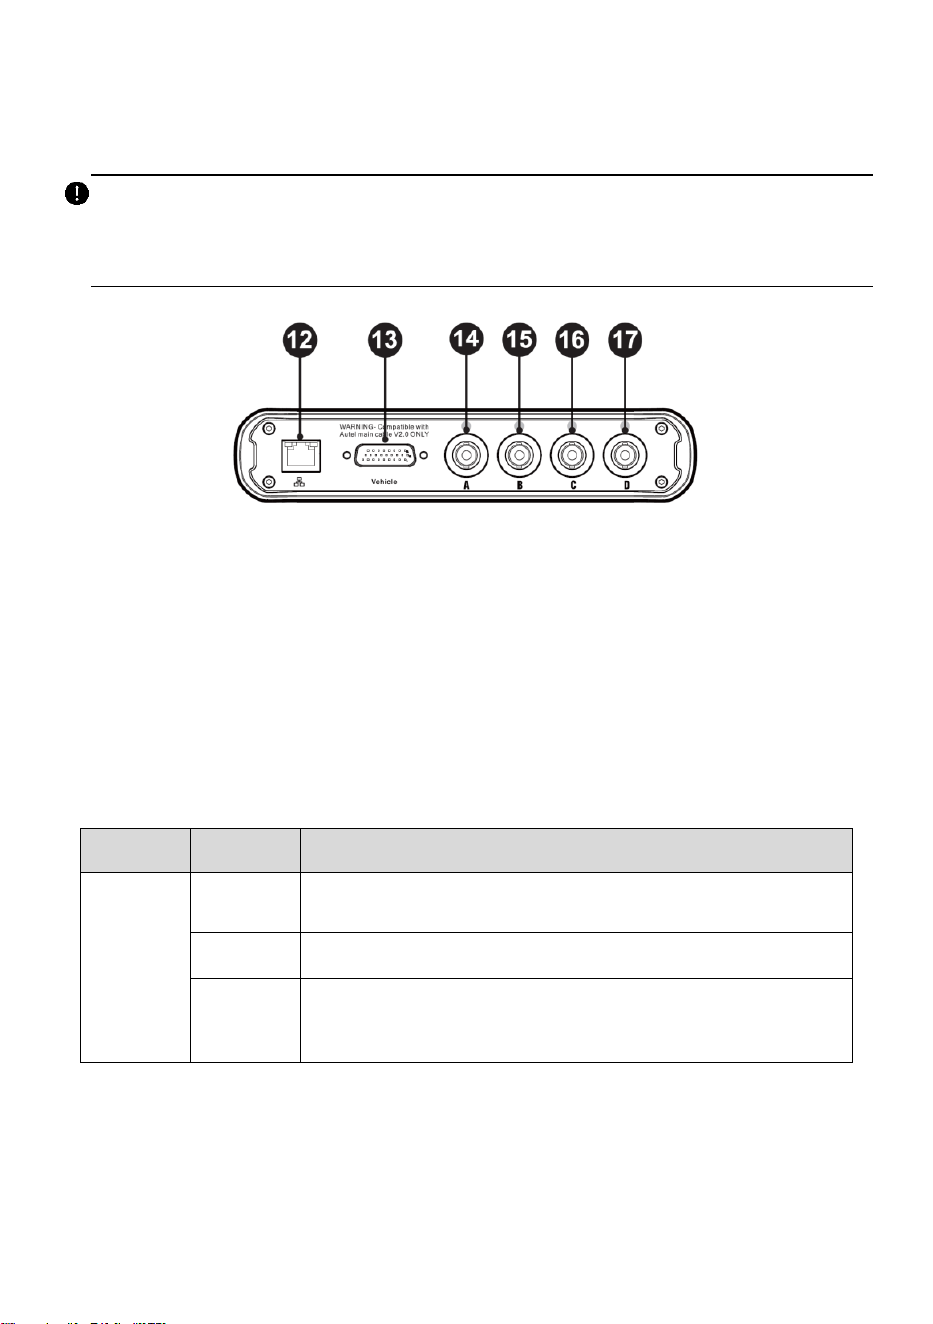
Figure 2-7 VCMI2 Bottom View
12. Ethernet Port
13. Vehicle Data Connector (DB26-Pin)
14. Input Channel A
15. Input Channel B
16. Input Channel C
17. Input Channel D
Table 2-4 Power LED Description
LED
Color
Description
Power
Yellow
Lights yellow automatically at power up when VCMI2 is self-
testing.
Green
Lights solid green when VCMI2 is powered on.
Red
⚫ Lights solid red when a system failure occurs.
⚫ Flashes red when VCMI2 is upgrading.

11
Table 2-5 Battery LED Description
LED
Color
Description
Battery
Green
⚫ Flashes green when VCMI2 is charging.
⚫ Lights solid green when fully charged or the battery level
is above 50%.
Yellow
Lights yellow when the battery level is above 25% but below
50%.
Red
⚫ Lights red when the battery level is above 10% but
below 25%.
⚫ Flashes red when the battery level is below 10%.
Table 2-6 Vehicle LED Description
LED
Color
Description
Vehicle
Green
⚫ Lights solid green when connected via USB cable.
⚫ Flashes green when communicating via USB/Ethernet
cable.
Blue
⚫ Lights solid blue when connected via Ethernet
cable/Bluetooth.
⚫ Flashes blue when communicating via Bluetooth.
Cyan
⚫ Lights solid cyan when connected via Wi-Fi.
⚫ Flashes cyan when communicating via Wi-Fi.
2.2.1.1 Communication Capability
The VCMI2 supports Bluetooth (BT), Wi-Fi and USB communications. It can transmit
vehicle data to the tablet with or without a cable connection. In open areas, the working
range of the transmitter through BT communication is up to 328 feet (100 m). The working
range of 5G communication Wi-Fi is up to 328 feet (100 m). If the signal is lost due to
being taken out of range, communication will be restored once the tablet is within range.
2.2.1.2 Measurement Capability
The VCMI2 is designed with the functions of multimeter, oscilloscope, waveform
generator, and bus inspection. The parameters such as voltage, resistance, current,
signal frequency, and voltage-time characteristic of the signal, can be measured and the
results are displayed on the tablet.

12
2.2.1.3 Programming Capability
The VCMI2 is a D-PDU, SAE J2534 & RP1210 compliant PassThru programming
interface device. Using the updated OEM software, it is capable of replacing the existing
software/firmware in the Electronic Control Units (ECUs), programming new ECUs and
fixing software-controlled drivability issues and emission issues.
2.2.2 Power Sources
The VCMI2 can receive power from the following sources:
⚫ Vehicle Power
⚫ AC/DC Power Supply
⚫ Built-in Rechargeable Battery Pack
2.2.2.1 Vehicle Power
The VCMI2 operates on 12/24 V vehicle power, which receives power via the vehicle
data connection port. The device powers on whenever it is connected to an OBD II/EOBD
compliant Data Link Connector (DLC). For non-OBDII/EOBD compliant vehicles, the
device can be powered from an auxiliary power outlet adapter or other suitable power
port on the test vehicle using the auxiliary power cable.
2.2.2.2 AC/DC Power Supply
The VCMI2 can be powered from a wall socket using the AC/DC power adapter.
2.2.2.3 Built-in Battery Pack
The VCMI2 can also be powered with its built-in 3750 mAh battery pack.

13
2.2.3 Technical Specifications
Table 2-7 VCMI2 Specifications
Item
Description
Communications
⚫ BT V5.0 + EDR
⚫ USB 2.0
⚫ Wi-Fi 5G
⚫ Ethernet
Wireless Frequency
5 GHz
Power and Battery
⚫ 3750 mAh lithium-polymer battery
⚫ Charging via 12 V DC power supply
Operating Temp.
0 °C to 50 °C (32 °F to 122 °F)
Storage Temp.
-20 °C to 60 °C (-4 °F to 140 °F)
Dimensions
(W x H x D)
200.3 mm (7.89") x 192.8 mm (7.59") x 39.9 mm (1.57")
Weight
1160.7 g (2.56 lbs.)
2.3 Accessories Kit
2.3.1 Main Cable
The VCMI2 can be powered through the Autel main cable V2.0 (the V2.0 icon can be
seen on the cable) when connected to an OBDII/EOBD compliant vehicle. The main
cable connects the VCMI2 to the vehicle’s Data Link Connector (DLC), through which
the VCMI2 can transmit vehicle data to the tablet.
Figure 2-8 Main Cable V2.0
14
NOTE
The MaxiFlash VCMI2 can only be connected by the Autel main cable V2.0. DO NOT
use other Autel main cables to connect the MaxiFlash VCMI2.
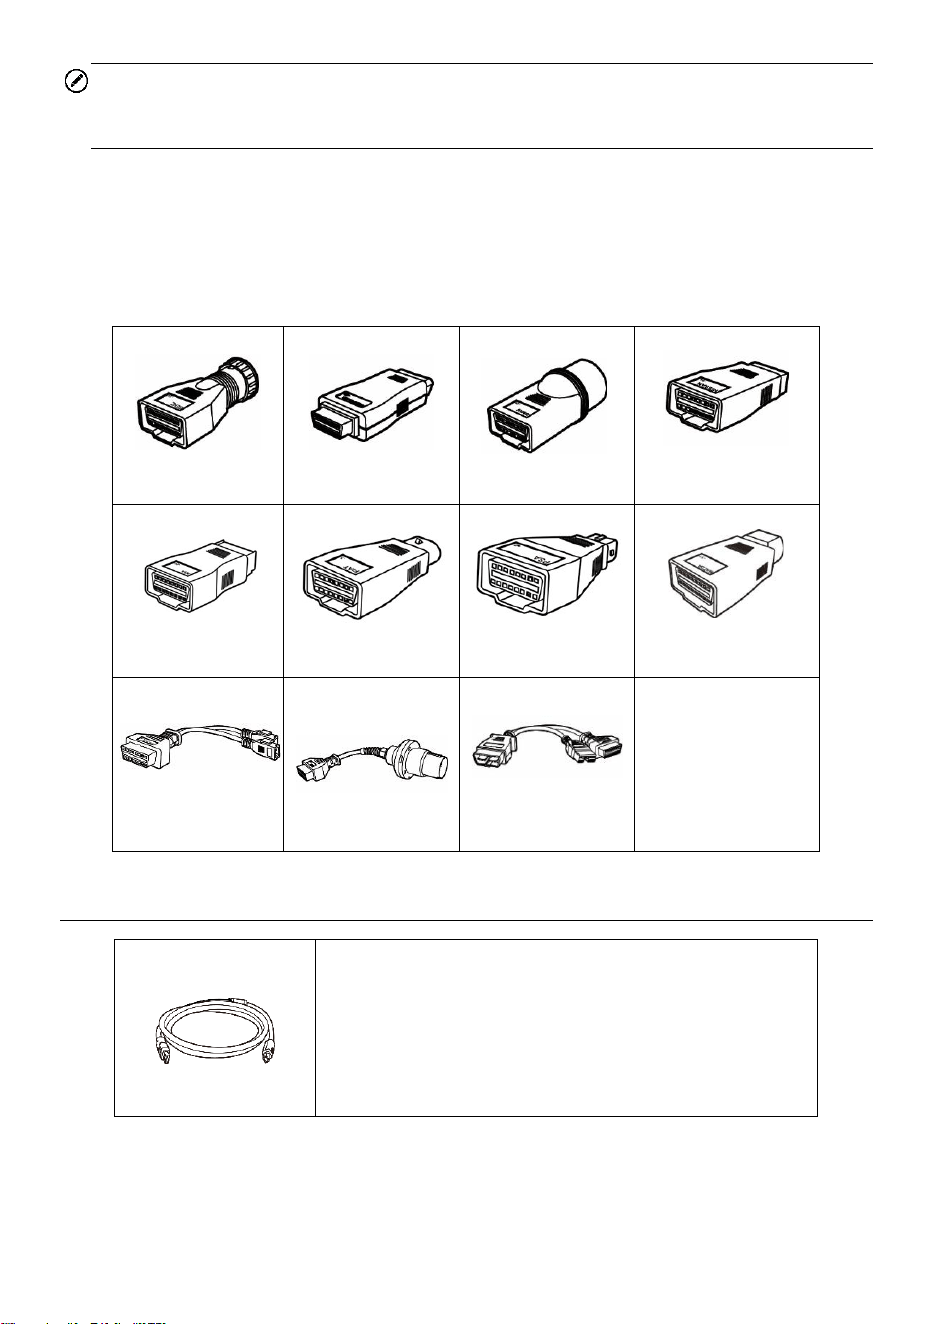
2.3.2 OBDI-Type Adapters (Optional)
The optional OBDI-type adapters are for non-OBDII vehicles. The adapter used depends
on the type of vehicle being tested. The most common adapters are shown below.
(Adapters are sold separately. Please contact your distributor for details.)
Benz-14
Chrysler-16
BMW-20
Nissan-14
Kia-20
Fiat-3
PSA-2
Mazda-17
Volkswagen/
Audi-2+2
Benz-38
Mitsubishi/
Hyundai-12+16
2.4 Other Accessories
USB 2.0 Cable V2 (the V2 icon can be seen on the
cable)
Connects the tablet to the VCMI2.
15
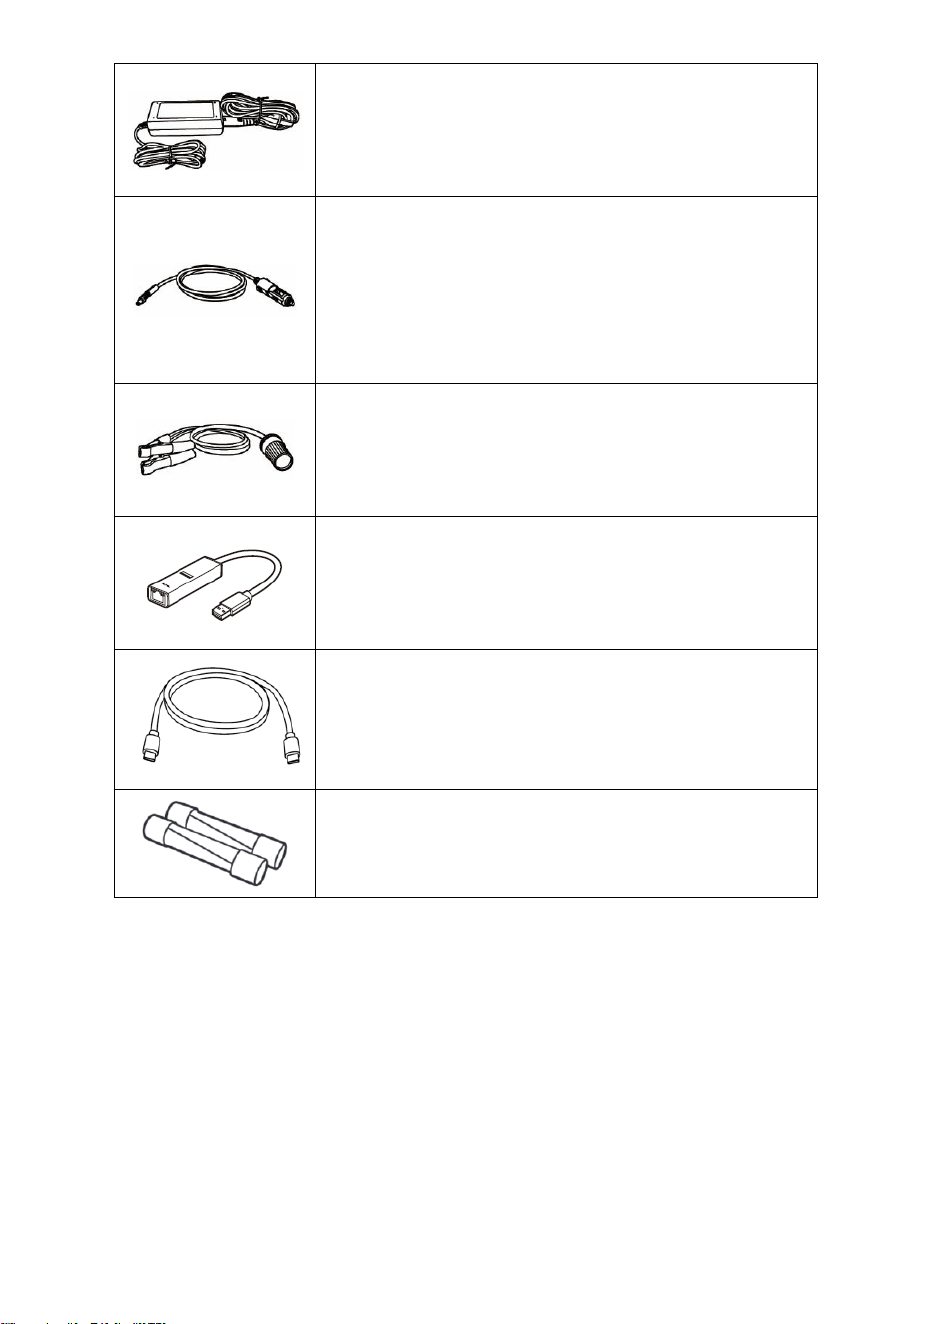
AC/DC Adapter (12V)
Connects the tablet to the external AC/DC power port
for power supply.
Auxiliary Power Outlet Adapter
Provides power to the tablet or the VCMI2 through
connection to the vehicle’s auxiliary power outlet
adapter receptacle, as some non-OBDII vehicles
cannot provide power via the DLC connection.
Clamp Cable
Provides power to the tablet or the VCMI2 through
connection to the vehicle’s battery.
USB to Ethernet Adapter
Network connection function can be realized through
this device.
USB Type-C Cable
Supports charging.
Spare Fuse x2
A safety device for the auxiliary power outlet adapter.
16
3 Getting Started
Make sure that the tablet has sufficient power or is connected to the external power
supply (see Power Sources).
3.1 Power Up
Long press (press and hold) the Power/Lock button on the top-right side of the tablet to
switch the unit on. Swipe up from the bottom of the Lock screen to enter the MaxiSys
Job Menu screen.
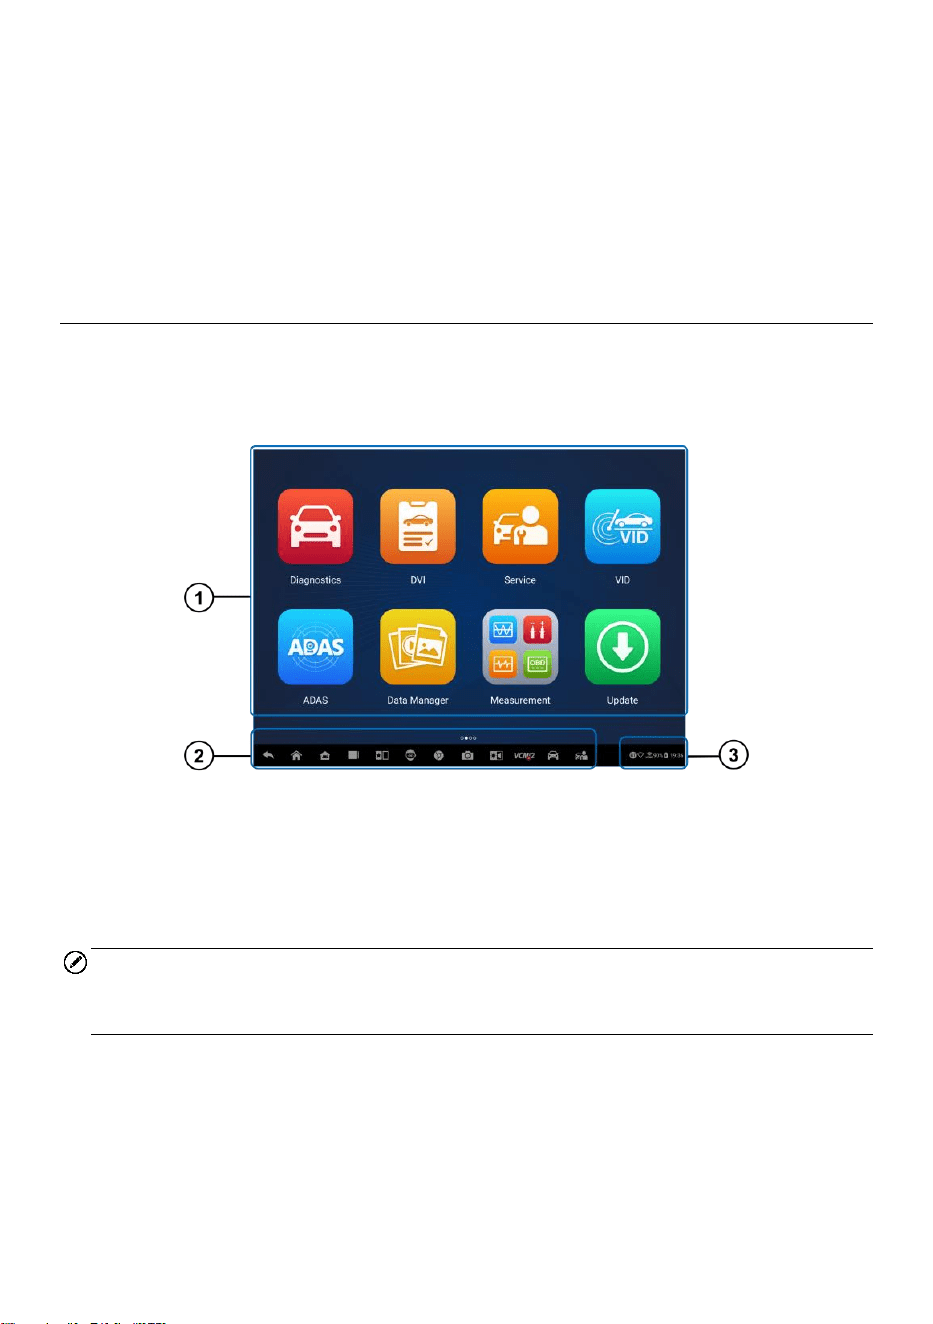
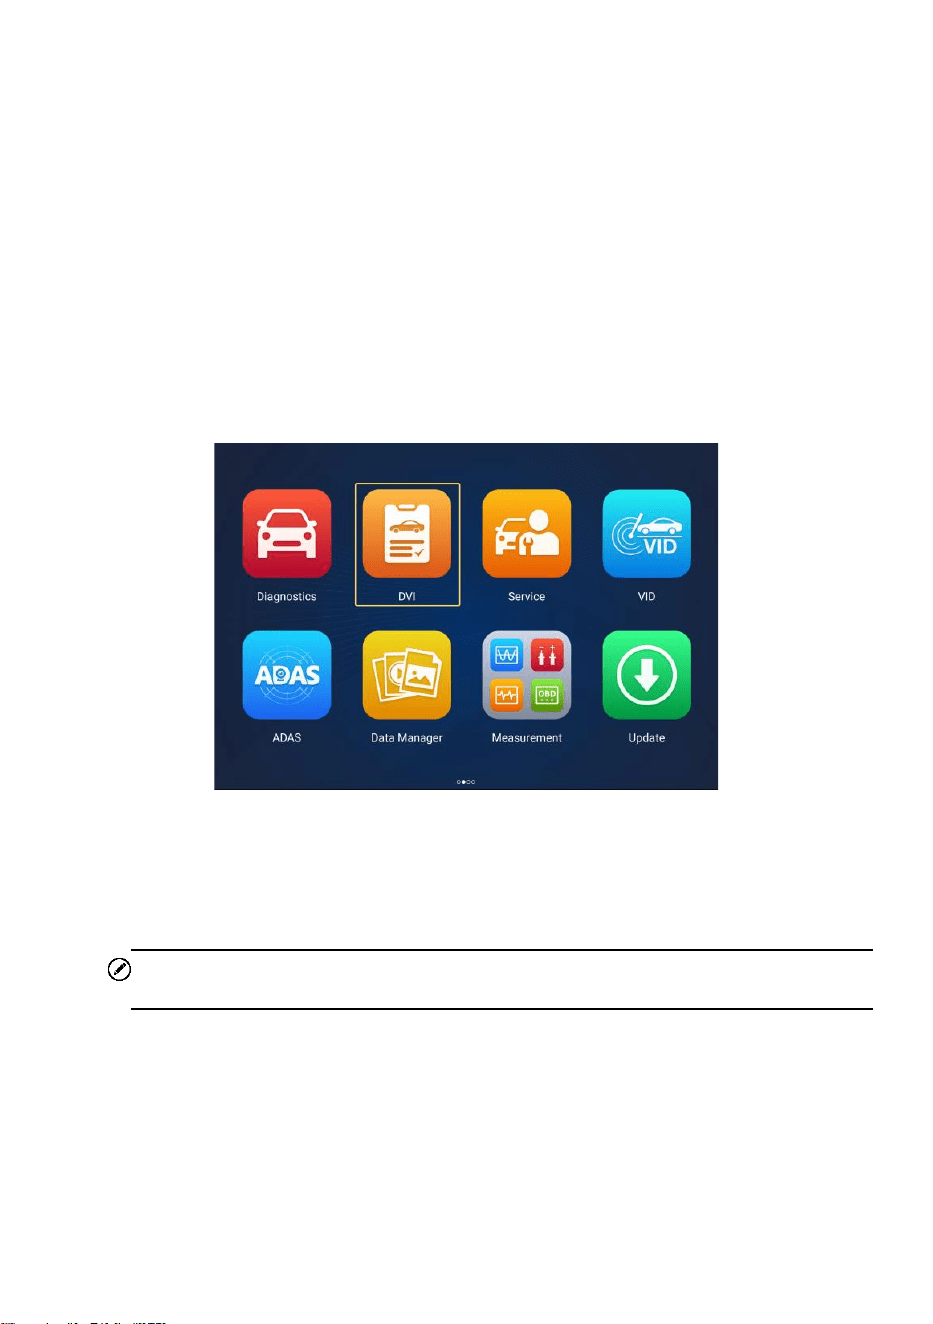
Figure 3-1 MaxiSys Job Menu
1. Application Buttons
2. Locator and Navigation Buttons
3. Status Icons
NOTE
It is recommended that you lock the screen when not in use to protect information in the
system and conserve power.
Almost all operations on the tablet are controlled through the touchscreen. The
touchscreen navigation is menu-driven, allowing for quick access to the test procedure
or the data that you need, through a series of questions and options. Detailed
descriptions of the menu structures are found in the chapters for each application.
17
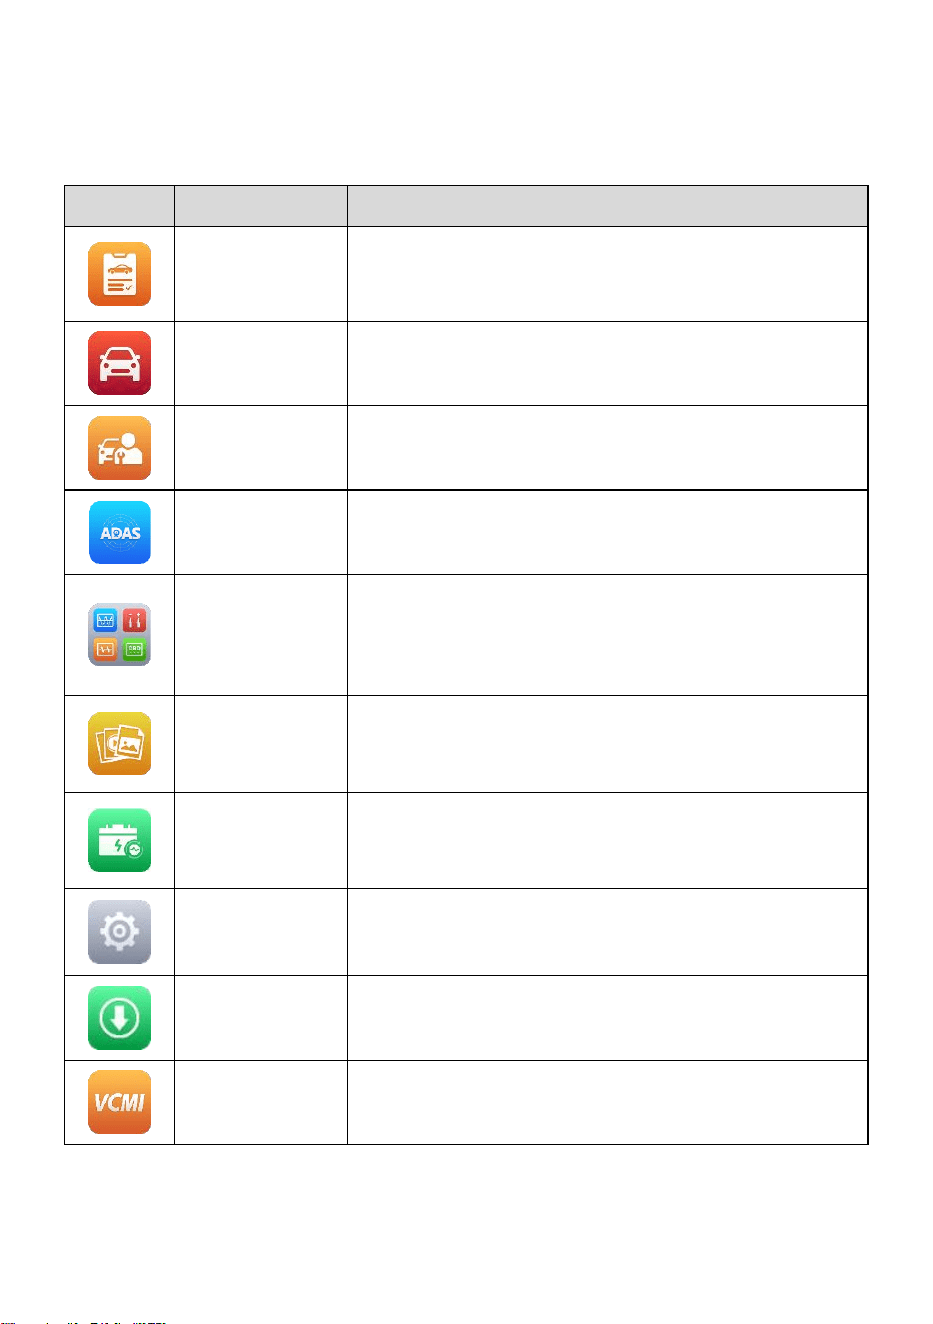
3.1.1 Application Buttons
The table below briefly describes each of the applications in the MaxiSys system.
Table 3-1 Applications
Button
Name
Description
DVI
Before diagnosing, the technicians perform an overall
inspection with their eyes and record the results. See
Digital Vehicle Inspection.
Diagnostics
Accesses the diagnostics functions. See Diagnostics.
Service
Accesses Service functions menu. See Service.
ADAS
Accesses ADAS systems menu. See ADAS.
Measurement
Software tools that measure vehicle system parameters,
including voltage, resistance, and current, and monitor
signal activities. See Measurement.
Data Manager
Accesses the saved repair shop, customer, and vehicle
data, including detailed vehicle diagnostics and test
records. See Data Manager.
Battery Test
Accesses the Battery Test menu with two functions,
including in-vehicle test and out-vehicle test. See Battery
Test.
Settings
Accesses the system settings menu and general tablet
menu. See Settings.
Update
Accesses system software update menu. See Update.
VCMI Manager
Accesses VCMI connection menu. See VCMI Manager.
18
Button
Name
Description
Hand-held
Inclinometer
Connects your tablet to a hand-held inclinometer to
measure the ride height of Mercedes-Benz vehicles. See
Hand-held Inclinometer.
Support
Synchronizes Autel's online service database with the
MaxiSys tablet. See Support.
MaxiViewer
Provides a quick search for supported functions and/or
vehicles. See MaxiViewer.
MaxiVideo
Configures the unit to operate as a video scope device
by connecting to an imager head cable for close vehicle
inspections. See MaxiVideo.
Quick Link
Provides associated website bookmarks to allow quick
access to product update, service, support, and other
information. See Quick Link.
Remote
Desktop
Configures your tablet to receive remote support using
the TeamViewer application. See Remote Desktop.
User Feedback
You can submit feedback through this application when
you encounter problems during the use of the tablet. See
User Feedback.
Autel User
Center
Allows users to register Autel tool for downloading the
latest released software. See Autel User Center.
OEM
Authorization
Manages the permissions for unlocking the OE gateway.
MaxiTools
Includes Log collection and Factory data reset two parts.
Demonstration
Provides step-by-step operation demonstration for
diagnostics.
19
Button
Name
Description
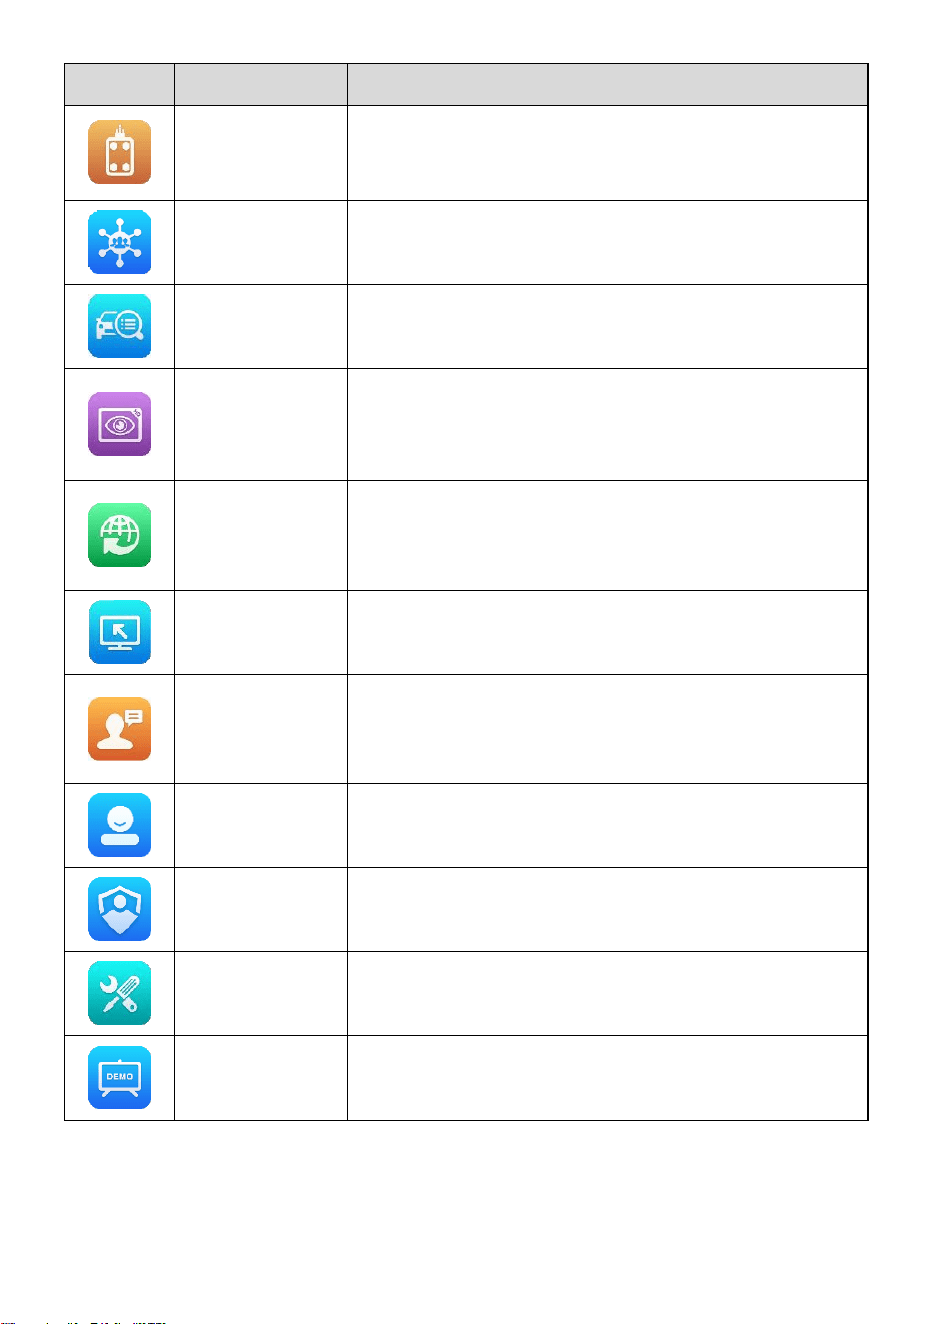
Voice Skills
Center
Allows you to learn how to use the AI Technician
Assistant application. Currently, the supported language
of AI Technician Assistant is English.
3.1.2 Locator and Navigation Buttons
Operations of the Navigation buttons at the bottom of the screen are described in the
table below:
Table 3-2 Locator and Navigation Buttons
Icon
Name
Description
Locator
Indicates the location of the screen. Swipe the screen
left or right to view the previous or next screen.
Back
Returns to the previous screen.
MaxiSys
Home
Returns to MaxiSys Job Menu.
Android
Home
Returns to the Android system home screen.
Recent Apps
Displays a list of applications that are currently running.
Tap an app icon to launch. Close a running application
by swiping it to the top. Or close all running applications
by tapping Clear All.
Split Screen
The side-by-side dual screen mode is especially
designed for showing two different windows
simultaneously. The frequently-used applications in the
split app bar can be added and deleted.
AI Technician
Assistant
Performs tasks with voice control. See AI Technician
Assistant. Currently, the supported language of voice
control is English.
Browser
Launches the Chrome Internet browser.
20
Icon
Name
Description
Camera
Tap the Camera icon to open camera viewfinder. Press
and hold the icon to capture a screenshot of the display
screen. The saved files are auto-stored in the Data
Manager application for later review. See Data
Manager.
Display &
Sound
Adjusts the brightness of the screen and the volume of
the audio output.
VCMI
Manager
Shortcut
Opens the VCMI Manager application. A green icon at
the bottom-right corner indicates the VCMI2 is
connected, while a red “X” icon will be displayed if the
connection fails. The battery status icon on the upper-
left corner displays the remaining VCMI2 power.
MaxiSys
Shortcut
Returns to the Diagnostics screen.
Service
Shortcut
Returns to the Service screen.
➢ To use the camera
1. Tap the Camera icon. The camera screen opens.
2. Focus the image to be captured in the viewfinder.
3. Tap the camera icon on the right side of the screen. The viewfinder now shows
the captured picture and auto-saves the taken photo.
4. Tap the thumbnail image on the top-right corner of the screen to view the stored
images.
5. Tap the Back or Home button to exit the camera application.
NOTE
After swiping the camera screen from left to right, the camera mode and video mode
can be switched by tapping the Camera icon or Video icon.
3.1.3 System Status Icons
Your MaxiSys tablet is a fully functional Android tablet with the standard Android
operating system status icons. Refer to Android documentation for additional information.

21
3.2 Power Down
All vehicle communications should be terminated before shutting down the tablet. A
warning message displays if a shutdown is attempted while the tablet is communicating
with the vehicle. Forcing a shutdown while the tablet is communicating with the vehicle
may lead to ECU errors on some vehicles. Please exit the Diagnostics application before
shutting off the tablet.
➢ To power down the MaxiSys tablet
1. Long press (press and hold) the Power/Lock button.
2. Tap the Power Off option.
3. Tap OK.
3.2.1 Reboot System
In case of a system crash, long press the Power/Lock button and tap Restart to reboot
the system.
22
4 AI Technician Assistant
The MaxiSys Ultra S2 system features Autel’s advanced voice-controlled AI Technician
Assistant function, which can help you perform tasks such as opening applications, auto
scanning vehicle systems, quickly locating diagnostic functions, and assisting with
decision-making to improve efficiency.
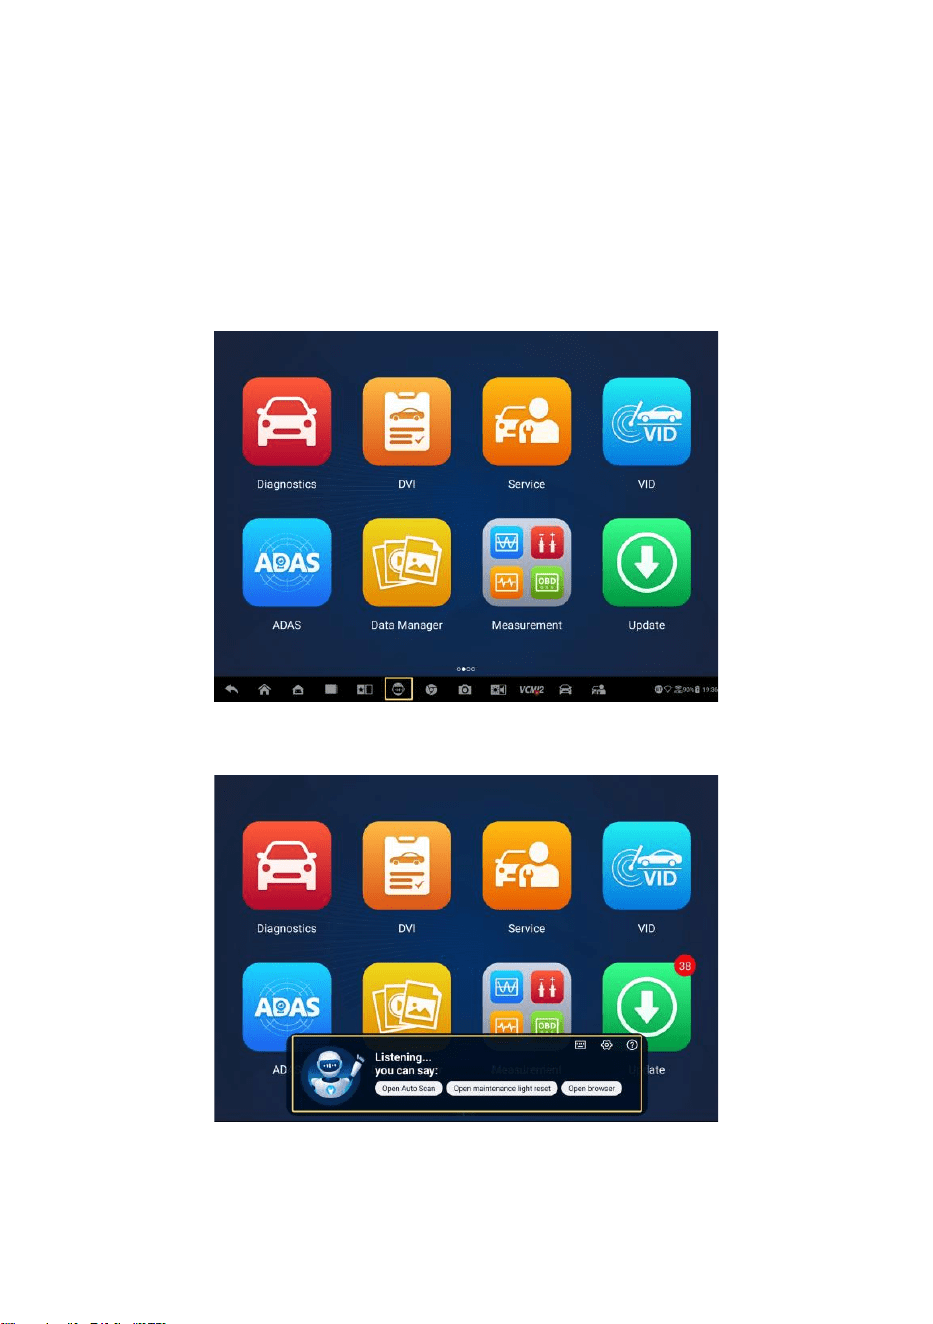
Figure 4-1 AI Technician Assistant Icon
Figure 4-2 AI Technician Assistant Screen

23
When you give a command beginning with “Hey Max,” everything is extremely easy, such
as opening applications or functions, identifying test vehicles, connecting the Wi-Fi, and
turning on the camera, without lifting a finger.
The AI Technician Assistant function mainly assists you in doing the following tasks:
A. Open system applications
You can say, " Open browser,” “Launch the browser,” “Open gallery,” “Turn on the
camera,” “Turn on Bluetooth,” “Turn up the volume,” “Start the email,” etc.
B. Open the applications on the MaxiSys Job Menu
You can say, “Open VID,” “Open Honda Diagnostic,” “Open the oscilloscope,” “Start
the oscilloscope,” “Turn on VCMI,” and so on.
C. Search and locate the diagnostics functions
You can say: “Automatic selection,” “Open auto scan,” “Read DTC,” “I want to do
EPB reset,” “Go to ECU reset”, “Open hot functions,” “Open maintenance light reset,”
“Start injector functions,” etc.
D. Control the function buttons
The function buttons, such as OK, ESC, and Fault Scan, can be controlled by voice
instead of being tapped.
24
5 Digital Vehicle Inspection
Before diagnosing, a Digital Vehicle Inspection (DVI) is necessary for technicians to
check the vehicle’s appearance, exterior and interior, brakes and tires, engine
compartment, and more. Technicians can perform a comprehensive visual inspection
and then record the results in the MaxiSys system.
➢ To perform the DVI
1. Power up the tablet and ensure that it is connected to a power source.
2. Tap the DVI application button from the MaxiSys Job Menu.
Figure 5-1 DVI Application Icon
3. Choose Vehicle Information on the left navigation menu and enter the
corresponding information on the right, including the repair shop information,
technician information, customer information, and vehicle information.
NOTE
Fields marked with an asterisk (*) are mandatory.
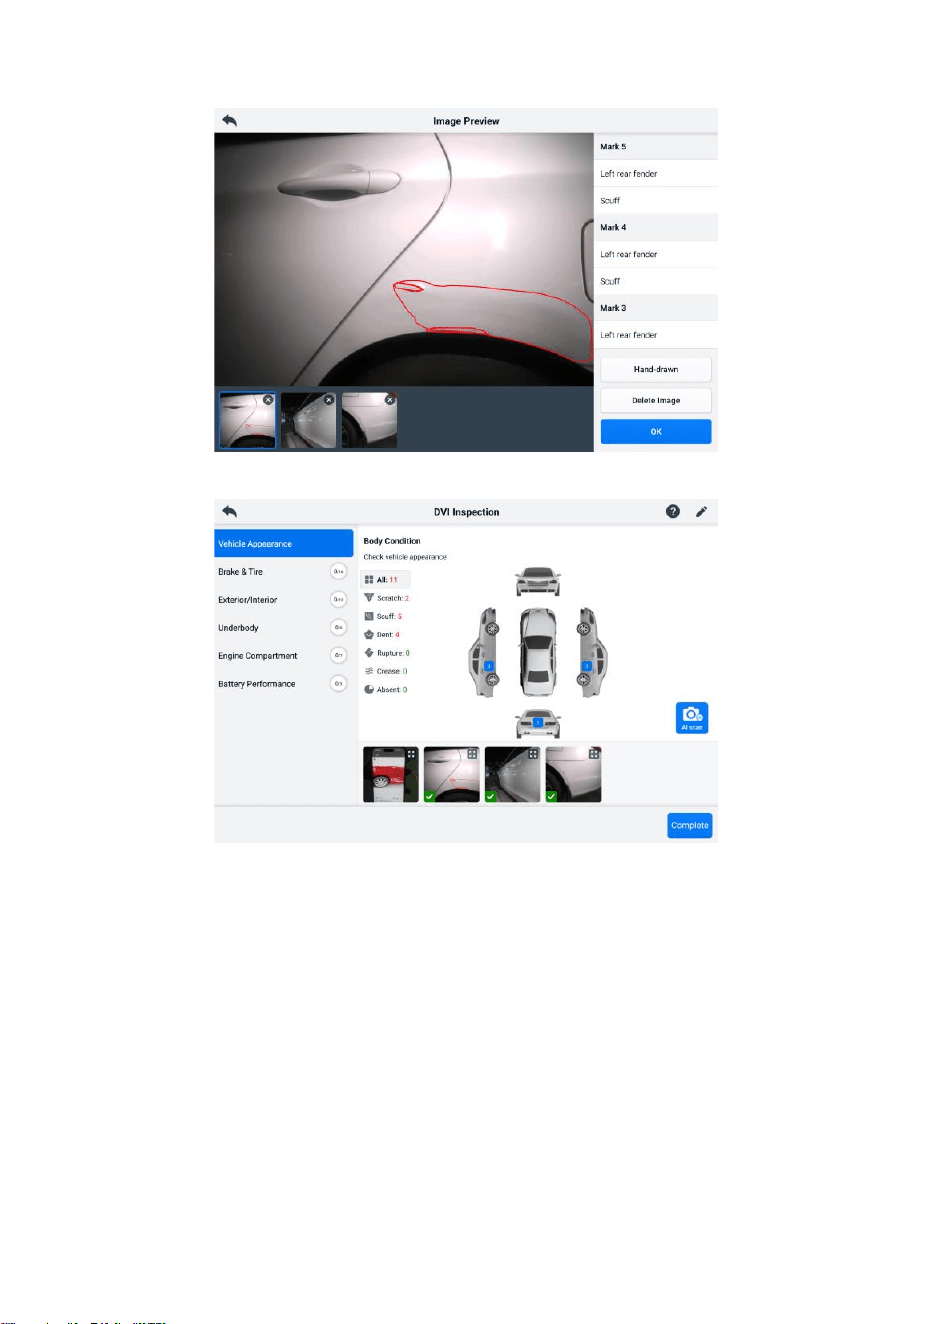
4. Select Vehicle Appearance on the navigation menu. For the damaged areas
and the related components, tap the AI Scan button to take photos and tap
Done. Tap Draw by Hand to draw circles with a finger on the photo to make
marks and then tap Save. Tap OK to return to the Body Condition screen. Finish
all the checks of the vehicle's appearance with the same steps.
25
Figure 5-2 Vehicle Appearance Inspection Screen 1
Figure 5-3 Vehicle Appearance Inspection Screen 2
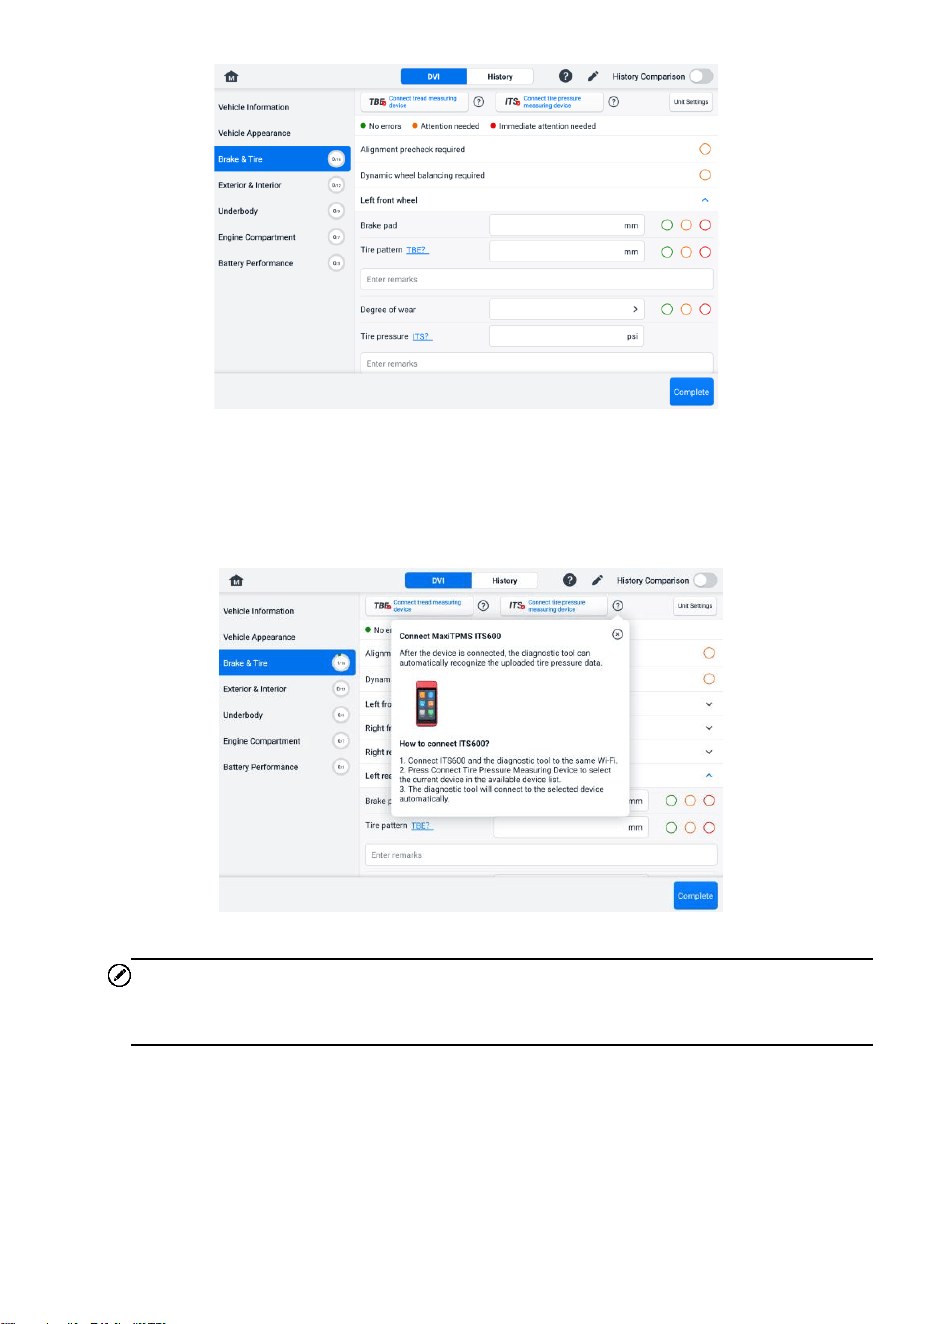
5. Select Brake & Tire on the navigation menu. Follow the onscreen instructions
to check the vehicle’s brakes and tires.
⚫ Make a visual inspection based on the actual situation. There are three
options for selection: No errors, Attention needed, and Immediate
attention needed.
26
Figure 5-4 Brake & Tire Inspection Screen 1
⚫ Tap the Help icon and follow the on-screen steps to connect a tread-
measuring device or a tire pressure-measuring device to the Ultra S2. The
diagnostic tablet can automatically recognize the uploaded tire pressure
or tread depth data. Enter the corresponding data on the screen.
Figure 5-5 Brake & Tire Inspection Screen 2
NOTE
Tap the History Comparison button in the upper-right corner of the screen to make
a comparison with the history conditions.
6. Select a function item on the left navigation menu and follow the onscreen
instructions to complete the inspections of the vehicle’s exterior/interior,
underbody, engine compartment, and battery performance.
27
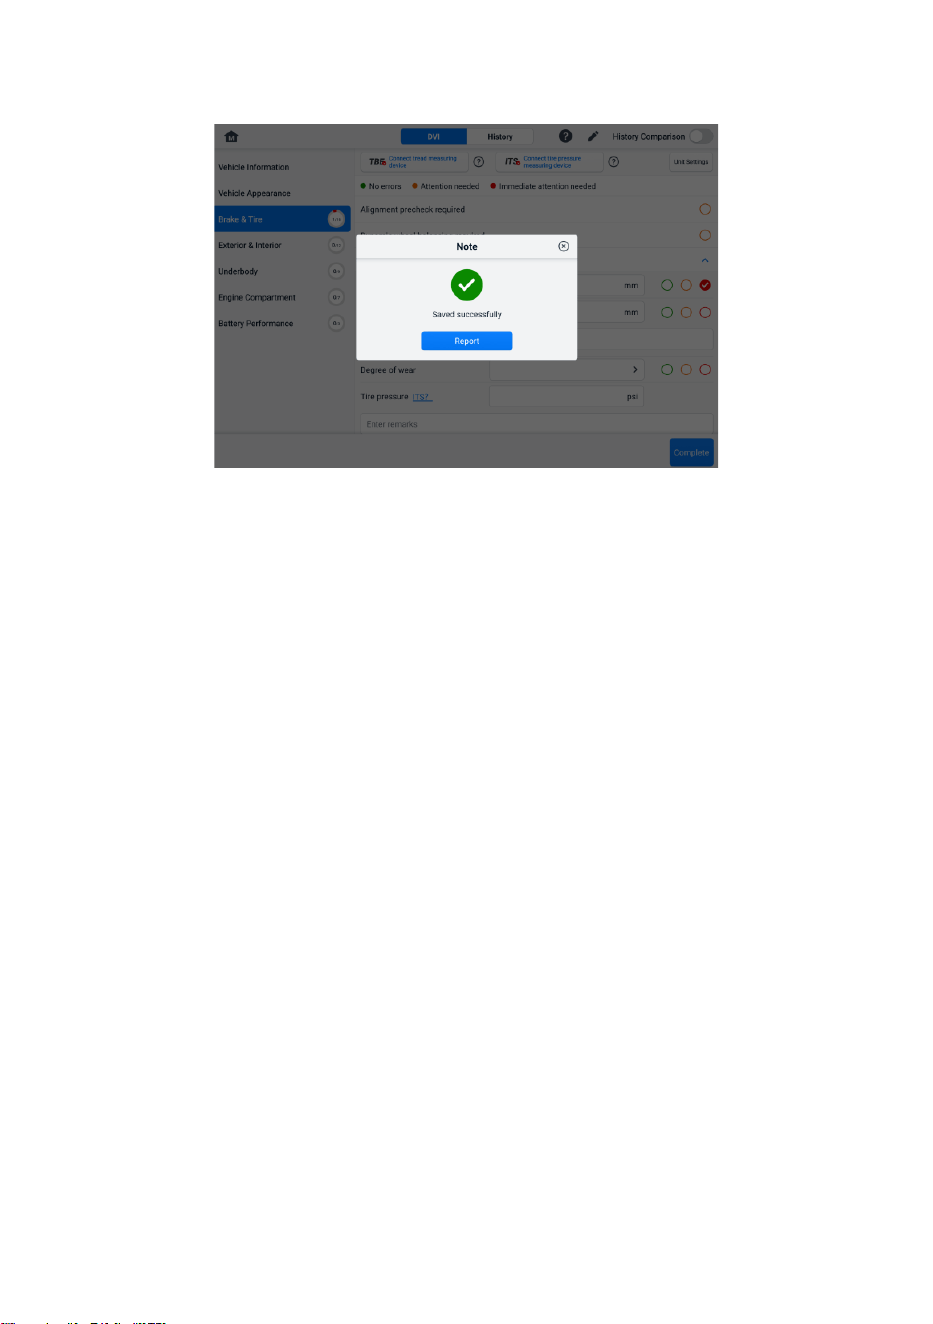
7. Tap Complete at the bottom-right of the screen to save all the inspections. Tap
Report to view the generated DVI report.
Figure 5-6 DVI Saving Screen
8. The DVI report can also be viewed in the Data Manager application. Tap PDF
or Cloud Report and select a report to open and view the detailed information.

28
6 Diagnostics
The Diagnostics application can access the electronic control module of multiple vehicle
control systems, including but not limited to the engine, transmission, antilock brake
system (ABS), and airbag system (SRS).
6.1 Establish Vehicle Communication
The Diagnostics operations require connecting the MaxiSys tablet to the test vehicle
through the VCMI2 using the main cable. (Use the applicable OBD I-type adapter if
needed.) To establish proper vehicle communication with the tablet, you need to perform
the following steps:
1. Connect the VCMI2 to the vehicle’s DLC for both communication and power supply.
2. Connect the VCMI2 to the tablet via Bluetooth pairing, Wi-Fi, or USB connection.
3. When the above steps are completed, check the VCMI Manager Shortcut at the
bottom of the screen. If a green BT, Wi-Fi, or USB icon displays at the lower-right
corner, the MaxiSys tablet is ready to start vehicle diagnosis.
6.1.1 Vehicle Connection
The method used to connect the VCMI2 to a vehicle’s DLC depends on the vehicle’s
configuration as follows:
⚫ A vehicle equipped with an On-board Diagnostics Two (OBDII) management system
supplies both communication and 12-volt power through a standardized J-1962 DLC.
⚫ A vehicle not equipped with an OBDII management system supplies communication
through a DLC connection, and in some cases supplies 12-volt power through the
auxiliary power outlet adapter receptacle or a connection to the vehicle battery.
OBDII Vehicle Connection
This type of connection only requires the main cable without any additional adapter.
➢ To connect to an OBDII vehicle
1. Connect the main cable’s female adapter to the Vehicle Data Connector on the
VCMI2, and tighten the captive screws.
2. Connect the cable’s 16-pin male adapter to the vehicle’s DLC, which is generally
located under the vehicle dashboard.

29
NOTE
The vehicle’s DLC is not always located under the dashboard. Refer to the user manual
of the test vehicle for additional connection information.
Non-OBDII Vehicle Connection
This type of connection requires both the main cable and a required OBDI adapter for
the specific vehicle being serviced.
There are three possible conditions for non-OBDII vehicle connection:
⚫ DLC connection supplies both communication and power.
⚫ DLC connection supplies communication, and power is to be supplied via the
auxiliary power outlet adapter connection.
⚫ DLC connection supplies communication, and power is to be supplied via connection
to the vehicle battery.
➢ To connect to a non-OBDII vehicle
1. Connect the main cable’s female adapter to the Vehicle Data Connector on the
VCMI2, and tighten the captive screws.
2. Locate the required OBDI adapter and connect its 16-pin jack to the main
cable’s male adapter.
3. Connect the attached OBDI adapter to the vehicle’s DLC.
NOTE
Some vehicles may have more than one adapter or may have test leads instead of an
adapter. Make the proper connection to the vehicle’s DLC as required.
➢ To connect the auxiliary power outlet adapter
1. Plug the DC power connector of the auxiliary power outlet adapter into the DC
power supply input port on the device.
2. Connect the male connector of the auxiliary power outlet adapter into the
vehicle’s auxiliary power outlet adapter receptacle.
➢ To connect the clamp cable
1. Connect the tubular plug of the clamp cable to the male connector of the
auxiliary power outlet adapter.

30
Figure 6-1 Connection Between Auxiliary Power Outlet Adapter and Clamp Cable
2. Plug the DC power connector of the auxiliary power outlet adapter into the DC
power supply input port of the VCMI2.
3. Connect the clamp cable to the vehicle’s battery.
6.1.2 VCMI Connection
After the VCMI2 is properly connected to the vehicle, the Power LED on the VCMI2 lights
solid green and a beep sound will be heard, indicating it is ready to establish
communication with the tablet.
Coming with the MaxiSys tablet tool kit, the VCMI2 supports three communication
methods with the tablet: Bluetooth, Wi-Fi, and USB cable.
6.1.2.1 Bluetooth Connection
In open areas, the working range for Bluetooth communication is about 328 feet (100 m),
giving technicians greater mobility to perform vehicle diagnosis from anywhere in the
repair shop.
To expedite multi-vehicle diagnostics, more than one VCMI2 can be used in busy repair
shops, enabling technicians to quickly pair their MaxiSys tablet to each VCMI2 via
Bluetooth separately, therefore eliminating the need to unplug the VCMI2 from one
vehicle and then connect it to another each time.
➢ To pair the tablet with the VCMI2 via Bluetooth
1. Power up the tablet.
2. Select the VCMI Manager application from the MaxiSys Job Menu.
3. Select VCMI BT from the connection mode list and tap the Bluetooth toggle to
turn it ON. The device automatically scans for available devices for Bluetooth
pairing. The found devices are listed in the settings section on the bottom-right
of the screen.

31
NOTE
If no VCMI2 is found, this may indicate that the signal strength is too weak to be detected.
Reposition the VCMI2 and remove all possible objects that may cause signal interference.
Tap the Scan button at the top-right corner of the screen to rescan for devices.
4. Typically, the VCMI2 name displays as “Maxi” suffixed with a serial number.
Select the VCMI2 for pairing. (If more than one VCMI2 is used, ensure the
correct VCMI2 is selected to pair.)
5. When the pairing is successful, the connection status displays as “Connected.”
6. The VCMI Manager Shortcut on the bottom of the screen displays a green circle
BT icon when the tablet and the VCMI2 are connected.
Refer to VCMI Bluetooth Pairing for additional information.
6.1.2.2 Wi-Fi Connection
The VCMI2 supports 5 GHz Wi-Fi connection. In open areas, the working range of 5G
Wi-Fi communication is up to 328 feet (100 m).
➢ To pair the tablet with the VCMI2 via Wi-Fi
1. Power up the tablet.
2. Select the VCMI Manager application from the MaxiSys Job Menu.
3. Select Wi-Fi from the connection mode list and tap the Wi-Fi toggle to turn it
ON. The tablet automatically scans for available devices for Wi-Fi connection.
Found VCMI2 are listed in the settings section on the bottom-right of the screen.
4. Typically, the VCMI2 name displays as “Maxi” suffixed with a serial number.
Select the required device for connection.
5. When the pairing is successful, the connection status is shown as “Connected.”
6. The VCMI Manager Shortcut on the bottom of the screen displays a green circle
Wi-Fi icon when the tablet and the VCMI2 are connected.
Refer to Wi-Fi Connection for additional information.
6.1.2.3 USB Cable Connection
The USB cable connection is a simple and quick way to establish a communication
between the tablet and the VCMI2. After properly connecting the USB cable from the
tablet to the VCMI2, the VCMI Manager Shortcut on the bottom of the screen displays a
green badge and the Vehicle LED on the VCMI2 lights solid green, indicating the
connection between the devices is successful. The MaxiSys diagnostics tablet is now
ready to perform vehicle diagnosis.

32
NOTE
For the most stable communication, it is recommended to use a USB connection between
the tablet and the VCMI2 when performing ECU programming or coding.
6.1.3 No Communication Message
A. If the tablet is unable to connect to the VCMI2, an “Error” message displays. An
“Error” message indicates the tablet is not communicating with the VCMI2.
Troubleshoot the error by performing the following steps:
⚫ Ensure the VCMI2 is powered on.
⚫ When using the wireless connection, ensure the network is configured correctly
and the proper device has been connected.
⚫ If the tablet loses communication abruptly during the diagnosis, ensure no
objects are causing signal interruption.
⚫ Ensure the VCMI2 is properly positioned with the VCMI2 front side up.
⚫ Move the tablet closer to the VCMI2. If using the wired connection, ensure the
cable is securely attached to the VCMI.
⚫ Ensure the VCMI2 communication mode is lit for the selected communication
type: Bluetooth, Wi-Fi, or USB cable.
B. If the VCMI2 is unable to establish a communication link, a message will display
troubleshooting instructions. Possible causes for the communication error include:
⚫ The VCMI2 is unable to establish a communication link with the vehicle.
⚫ A vehicle system has been selected for diagnosis that is not supported by the
vehicle.
⚫ There is a loose connection.
⚫ There is a blown vehicle fuse.
⚫ The vehicle or the data cable has a wiring fault.
⚫ There is a circuit fault in the data cable or adapter.
⚫ The vehicle identification is incorrectly entered.
33
6.2 Getting Started
Prior to the first use of the Diagnostics application, ensure the VCMI2 is properly
connected to and is communicating with the tablet. See Establish Vehicle
Communication for further details.
6.2.1 Vehicle Menu Layout
When the VCMI2 is properly connected to the vehicle via the main cable, and paired to
the tablet, the platform is ready to start vehicle diagnosis. Tap the Diagnostics
application button on the MaxiSys Job Menu. The Vehicle Menu is displayed on the
screen.
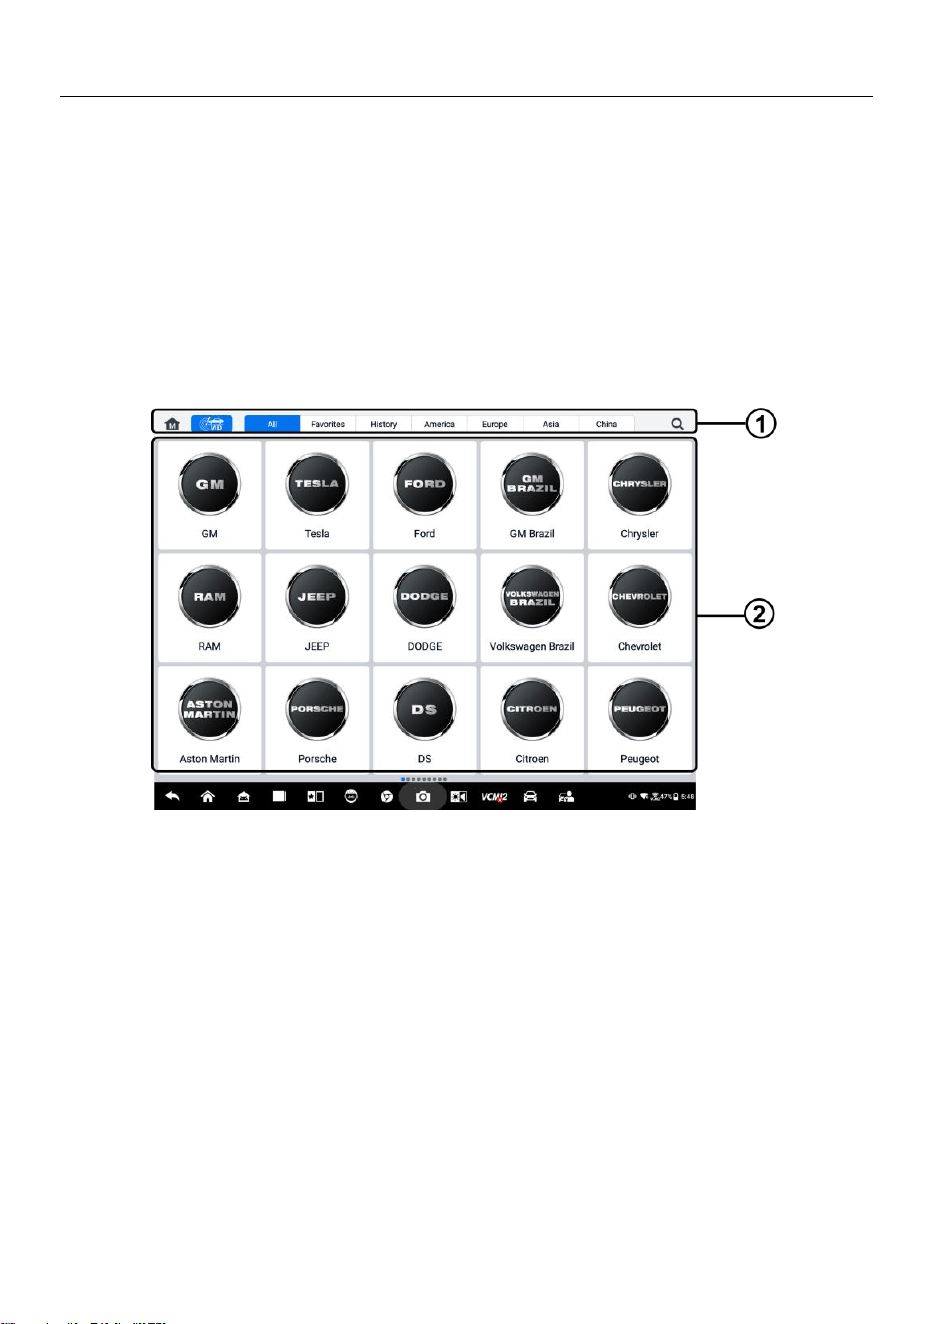
Figure 6-2 Vehicle Menu Screen
1. Top Toolbar Buttons
2. Manufacturer Icons
6.2.1.1 Top Toolbar Buttons
The operations of the toolbar buttons at the top of the screen are listed and described in
the table below:
34
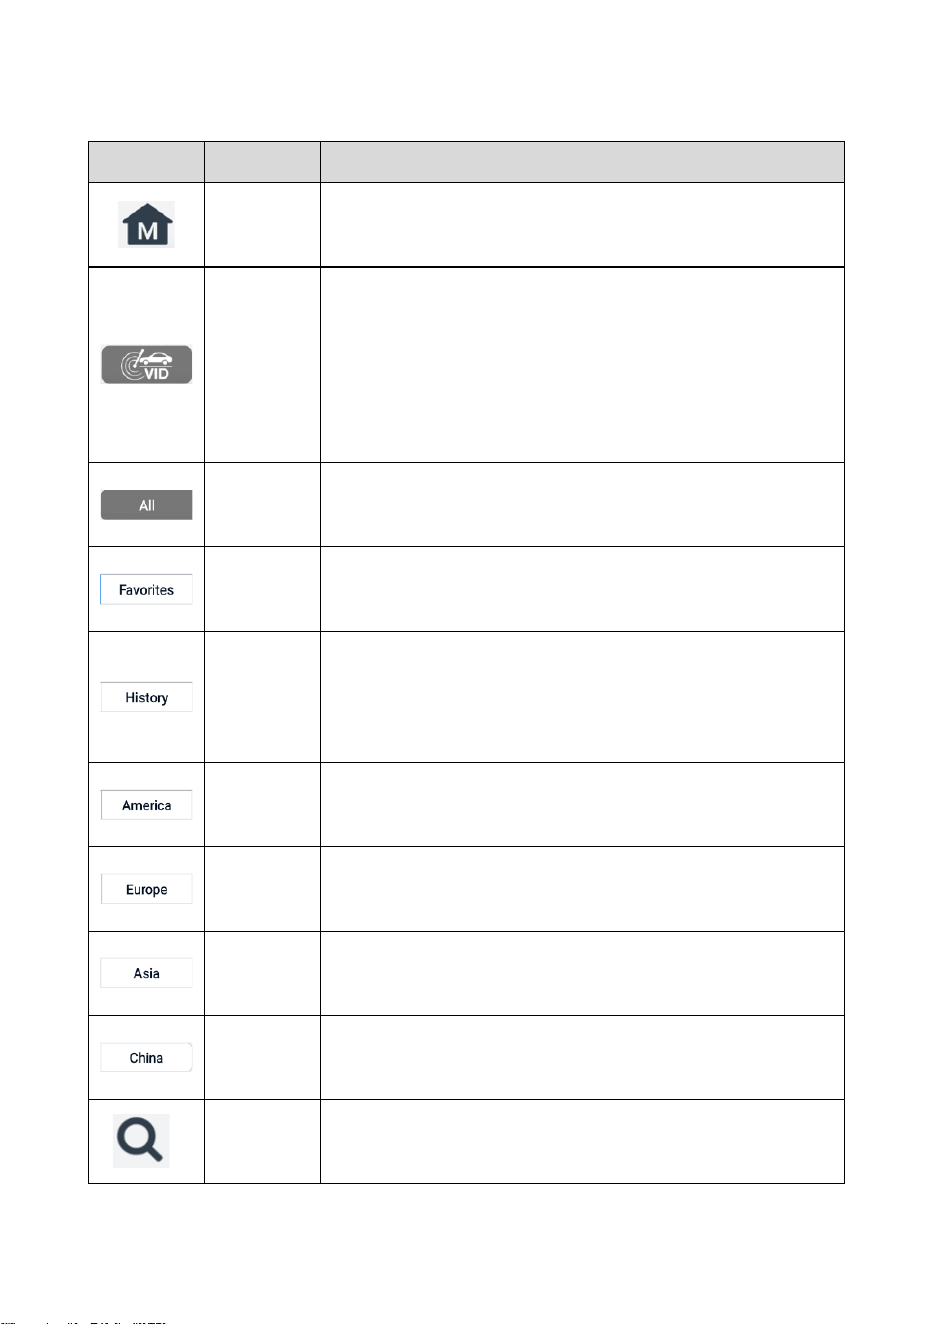
Table 6-1 Top Toolbar Buttons
Button
Name
Description
Home
Returns to the MaxiSys Job Menu.
VID
Tap this button to open a drop-down list:
⚫ Tap Auto Detect for auto VIN detection.
⚫ Tap Manual Input to enter the VIN code or license
number manually.
⚫ Tap Scan VIN/License Plate to scan the VIN
code/license number by camera.
All
Displays all the vehicle makes in the vehicle menu.
Favorites
Displays user-selected favorite vehicle makes.
History
Displays the stored test vehicle history records. This
option provides direct access to the previously tested
vehicle recorded during the previous test. See Vehicle
History.
America
Displays the American vehicle menu.
Europe
Displays the European vehicle menu.
Asia
Displays the Asian vehicle menu.
China
Displays the Chinese vehicle menu.
Search
Tap inside the search field to display a virtual keyboard
and input the vehicle manufacturer to test.

35
6.2.1.2 Manufacturer Icons
The manufacturer icons display the various vehicle brands. Select the manufacturer icon
after the VCMI2 is properly connected to the test vehicle to start a diagnostic session.
6.3 Vehicle Identification
The MaxiSys diagnostic system supports five methods of vehicle identification.
1. Auto Detect
2. Manual Input
3. Scan VIN/License
4. Manual Vehicle Selection
5. OBDII Direct Entry
6.3.1 Auto Detect
The MaxiSys diagnostic system features the latest VIN-based Auto Detect function to
identify CAN vehicles with just one tap, enabling the technician to quickly identify the
exact vehicle and scan its available systems for fault codes.
There are two entry options to perform the Auto Detect function:
A. From the VID application
➢ To perform Auto Detect
1. Connect the tablet with the VCMI2 and establish a communication link via
Bluetooth, Wi-Fi or USB cable. See Establish Vehicle Communication.
2. Tap the VID application button from the MaxiSys Job Menu.
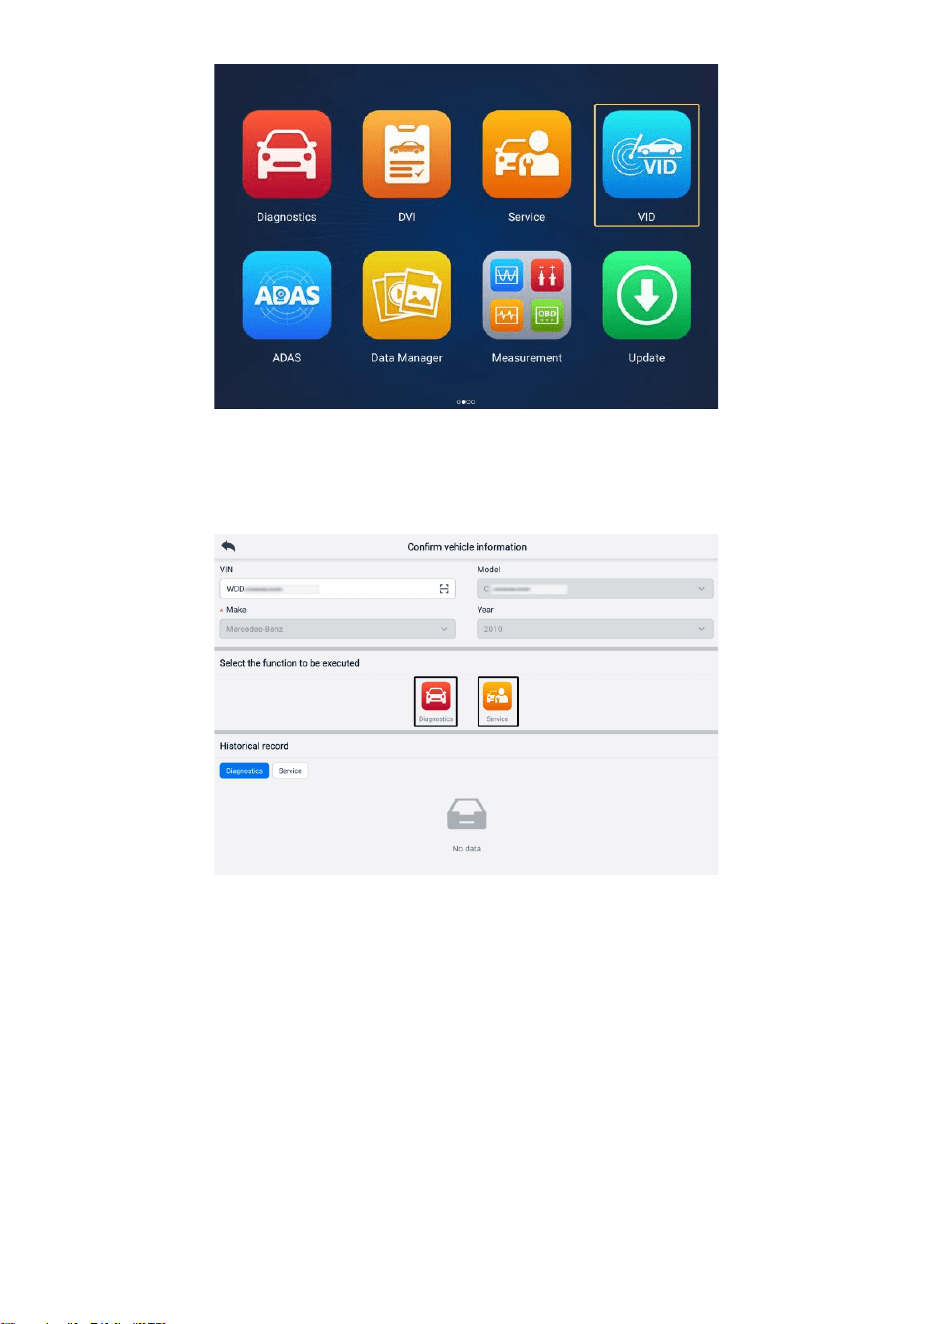
36
Figure 6-3 VID Application Screen
3. The vehicle information will be automatically identified and then displayed on
the screen. Tap Diagnostics or Service to execute the function.
Figure 6-4 Vehicle Information Confirmation Screen 1
If the vehicle information can not be identified automatically, please manually enter the
VIN or tap the Scan icon to scan and recognize the VIN. For detailed operation steps,
please refer to Manual Input.
37
Figure 6-5 Vehicle Information Confirmation Screen 2
B. From the Diagnostics application
➢ To perform Auto Detect
1. Tap the Diagnostics application button from the MaxiSys Job Menu. The
Vehicle Menu displays.
2. Tap the VID button on the top toolbar. Select Auto Detect. The tablet starts VIN
scanning on the vehicle's ECU. Once the test vehicle is successfully identified,
the system will guide you to the Diagnostics Main Menu screen.
Figure 6-6 VID Button Screen

38
6.3.2 Manual Input
For vehicles that do not support the Auto Detect function, the MaxiSys diagnostic system
allows you to enter the vehicle VIN or license number manually, or simply take a photo
of the VIN sticker or license plate for quick vehicle identification.
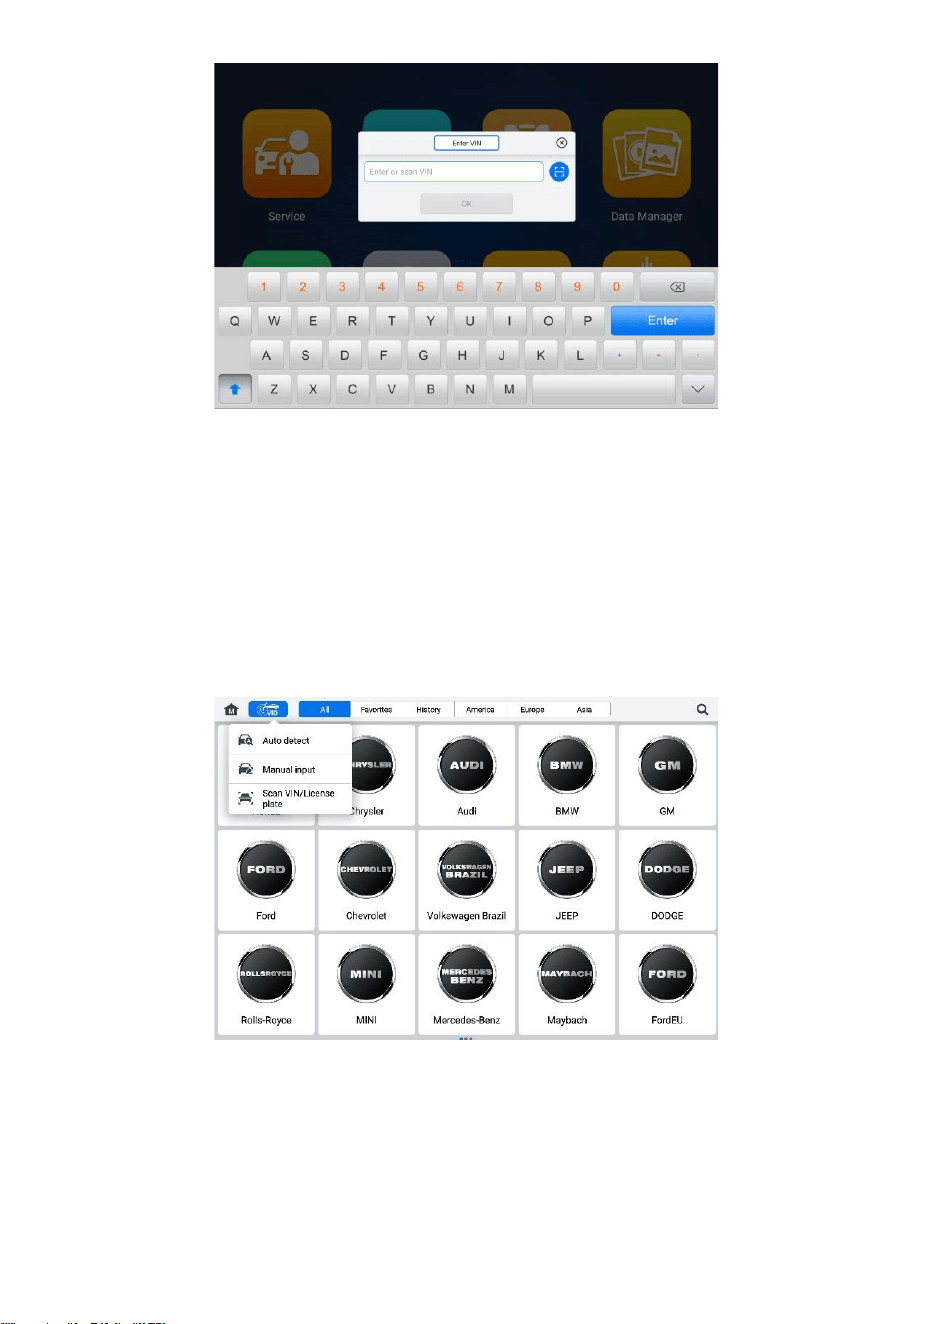
➢ To perform Manual Input
1. Tap the Diagnostics application button from the MaxiSys Job Menu. The
Vehicle Menu displays.
2. Tap the VID button on the top toolbar (see Figure 6-6 VID Button Screen).
3. Select Manual Input.
4. Tap the input box and enter the correct VIN code or license number.
5. Tap OK. The vehicle will be identified and matched to the vehicle database, and
the system will guide you to the Diagnostics Main Menu screen.
6.3.3 Scan VIN/License
Tap Scan VIN/License in the dropdown list (see Figure 6-6 VID Button Screen), the
camera will be opened. On the right side of the screen, from top to bottom, three options
are available: Scan Bar Code, Scan VIN, and Scan License.
NOTE
The method of Scan License is supported in some countries and areas. Please manually
input the license number if it is not available.
Select one of three options and position the tablet to align the VIN or license number
within the scanning window. The result displays in the Recognition result dialog box after
scanning. Tap OK to confirm the result, and then the vehicle information confirmation
screen will display on the tablet. If all the vehicle information is correct, tap the icon in the
middle of the screen to confirm the VIN of the vehicle being tested, and tap OK to
continue.

39
Figure 6-7 Scan VIN/License Screen
If the VIN/License number cannot be scanned, please manually input the VIN/License
number. Tap OK to continue. Confirm the VIN of the vehicle being tested to proceed.
6.3.4 Manual Vehicle Selection
When the vehicle's VIN is not automatically retrievable through the vehicle's ECU, or the
specific VIN is unknown, you can select the vehicle manually.
Step-by-step Vehicle Selection
This mode of vehicle selection is menu-driven. Select a vehicle manufacturer on the
Diagnostics Vehicle Menu screen and the Acquire VIN Information screen displays, then
tap the Manual Selection button. Select the vehicle information, such as brand, Model,
Capacity, Engine type, and Model year, on the same screen. Tap the ESC button at the
lower-right corner of the screen to exit the vehicle selection. Tap the Reset button to
reselect the vehicle information if needed.
6.3.5 OBDII Direct Entry
Occasionally, the tablet may not be able to identify a vehicle. For these vehicles, the user
may perform a generic OBDII or EOBD diagnostic. See Generic OBDII Operations for
additional information.
40
6.4 Navigation
6.4.1 Diagnostics Screen Layout
After the vehicle information is confirmed, tap OK to enter the main diagnostic program.
This section describes common functions, including Auto Scan, Control Unit, Service,
and Programming. The available functions may vary among different vehicles.
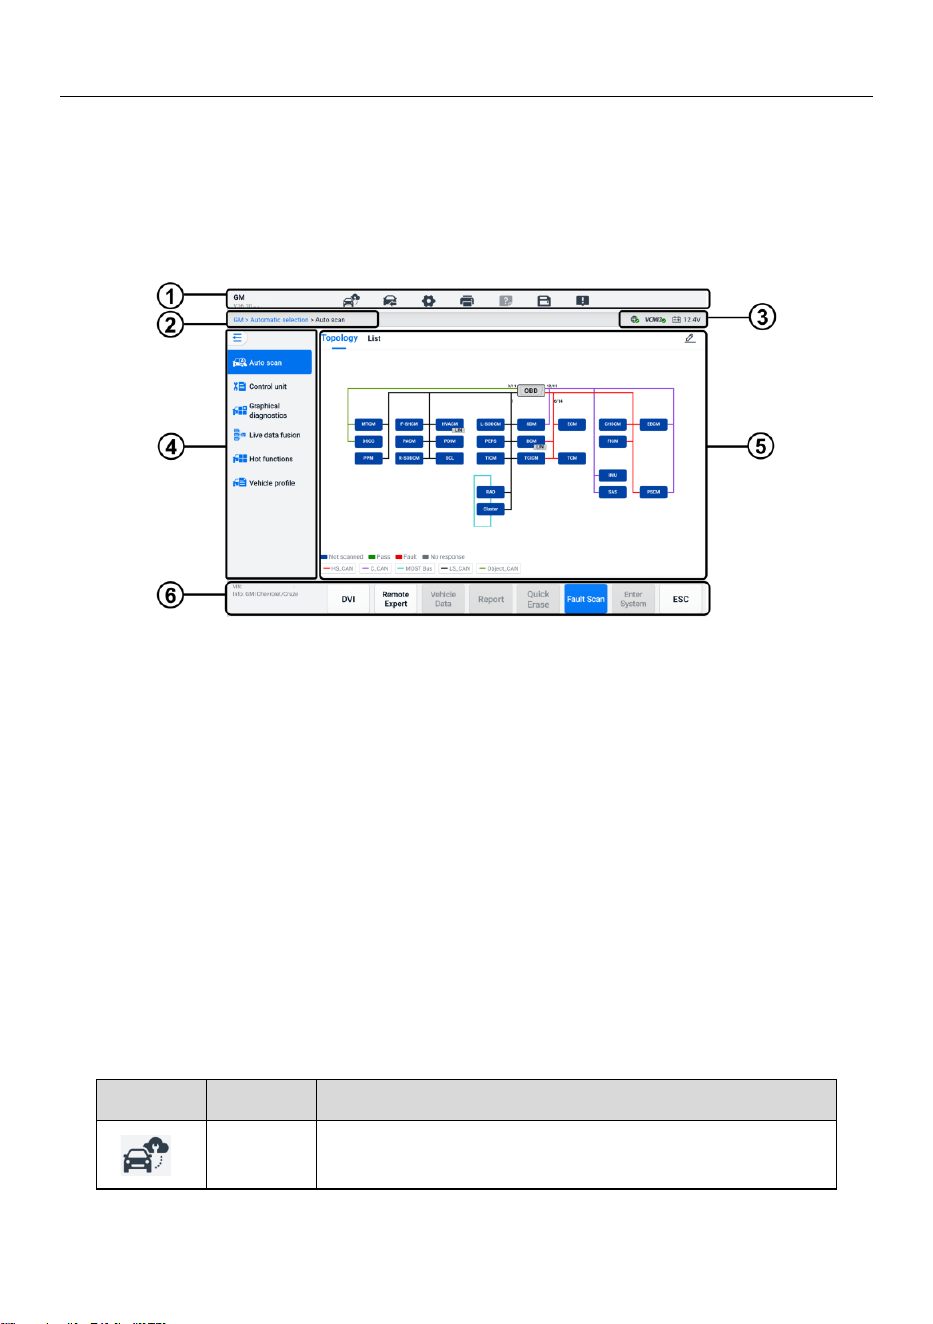
Figure 6-8 Diagnostics Main Menu Screen
1. Diagnostics Toolbar
2. Current Directory Path
3. Status Information Bar
4. Navigation Bar
5. Main Section
6. Function Buttons
6.4.1.1 Diagnostics Toolbar
The diagnostics toolbar contains buttons that allow you to print or save the displayed
data and perform other operations. The table below provides a brief description for the
operations of the diagnostics toolbar buttons:
Table 6-2 Diagnostics Toolbar Buttons
Button
Name
Description
Remote
Expert
Tap to launch the Remote Expert application. This
function is available in some countries and regions.
41
Button
Name
Description
Vehicle
Swap
Exits the diagnostic session and returns to the vehicle
menu screen to select another vehicle for testing.
Settings
Opens the Settings screen. See Settings.
Print
Saves and prints a copy of the displayed data. See Print
Settings.
Help
Provides instructions or tips for the operation of various
diagnostic functions.
Save
Opens a submenu that provides options for data storage.
Data
Logging
Use this function when encountering an error while
testing or diagnosing a vehicle. This function will record
the communication data and ECU information of the test
vehicle and send it to Autel's technical staff to review and
provide solutions.
Go to the Support application to follow the processing
progress. See Data Manager.
NOTE
The diagnostics toolbar (located on the top of the screen) will be active throughout the
diagnostic session for tasks such as printing and saving the displayed data, obtaining
help information, or performing data logging.
➢ To print data in Diagnostics
1. Tap the Diagnostics application on the MaxiSys Job Menu. The Print button
on the diagnostics toolbar is available throughout all Diagnostics operations.
2. Tap Print and a drop-down menu displays.
a) Print This Page — prints a screenshot copy of the current screen.
b) Print All Data — prints a PDF copy of all displayed data.
3. A temporary file will be created and sent via the computer to the printer.
4. When the file is sent, a confirmation message displays.
NOTE
Make sure the tablet and the printer are connected either by Wi-Fi or LAN before printing.
For more instructions on printing, see Print Settings for details.

42
➢ To submit Data Logging reports in Diagnostics
1. Tap the Diagnostics application on the MaxiSys Job Menu. The Data Logging
button on the diagnostics toolbar is available throughout all Diagnostics
operations.
2. Tap the Data Logging button to display the error options. Select a specific error,
then tap OK, and a submission form will display to let you fill in the report
information.
3. Tap the Send button in the upper-right corner of the screen to submit the report
form via the Internet. A confirmation message displays when sent successfully.
6.4.1.2 Current Directory Path
The current directory path shows all directory names to access the current page.
6.4.1.3 Status Information Bar
The status information Bar at the top-right of the Main Section displays the following
items:
1. Network Status Icon — indicates whether a network is connected.
2. VCMI2 Icon — indicates the communication status between the tablet and the
VCMI2.
3. Battery Icon — indicates the battery status of the vehicle.
6.4.1.4 Navigation Bar
The navigation bar on the left side of the screen displays the main menu of the
diagnostics functions. The main menu varies by the vehicle being tested. The common
menu includes Auto Scan, Control Unit, Service, Hot Functions, Vehicle Profile, and
Programming. Tap the icon in the upper-left corner of the navigation bar to hide the
main menu, and tap it again to display.
6.4.1.5 Main Section
The main section varies depending on the stage of operations, which shows vehicle
identification selections, the main menu, test data, messages, instructions, and other
diagnostic information.
6.4.1.6 Function Buttons
The function buttons displayed at the bottom of the screen vary by operation. Function
includes navigation, reporting, and code clearing. The functions of these buttons will be
described in the following sections when relevant.

43
6.4.2 Screen Messages
Messages display when additional input is needed before proceeding. There are mainly
three types of on-screen messages: Confirmation, Warning, and Error.
6.4.2.1 Confirmation Messages
This type of messages usually displays as an “Information” screen, when you are about
to perform an action that cannot be reversed or when an action has been initiated and
your confirmation is needed to continue.
When a user-response is not required, the message displays briefly.
6.4.2.2 Warning Messages
This type of messages displays when completing the selected action may result in an
irreversible change or loss of data. An example of this message is the “Erase Codes”
message.
6.4.2.3 Error Messages
Error messages display when a systemic or procedural error has occurred. Possible
errors include cable disconnection and communication interruption.
6.5 Diagnostics Menu
The Diagnostics application enables you to establish a data connection with the vehicle’s
ECU through the VCMI2 for vehicle diagnosis and maintenance.
The Main Menu screen (see Figure 6-8 Diagnostics Main Menu Screen) navigates users
to perform read codes, clear codes, or perform comprehensive automotive diagnostic
functions, and so on. After the function is selected, the tablet will establish a
communication with the vehicle through the VCMI2, and enter the corresponding function
menu or selection menu based on your selection.
6.6 Diagnostics Functions
Auto Scan
The Auto Scan function, which can be used to start auto scanning for all the available
systems on the vehicle, will be listed on the navigation bar when accessing the
diagnostics function.
On the Auto Scan screen, there are two tabs: Topology Tab and List Tab.
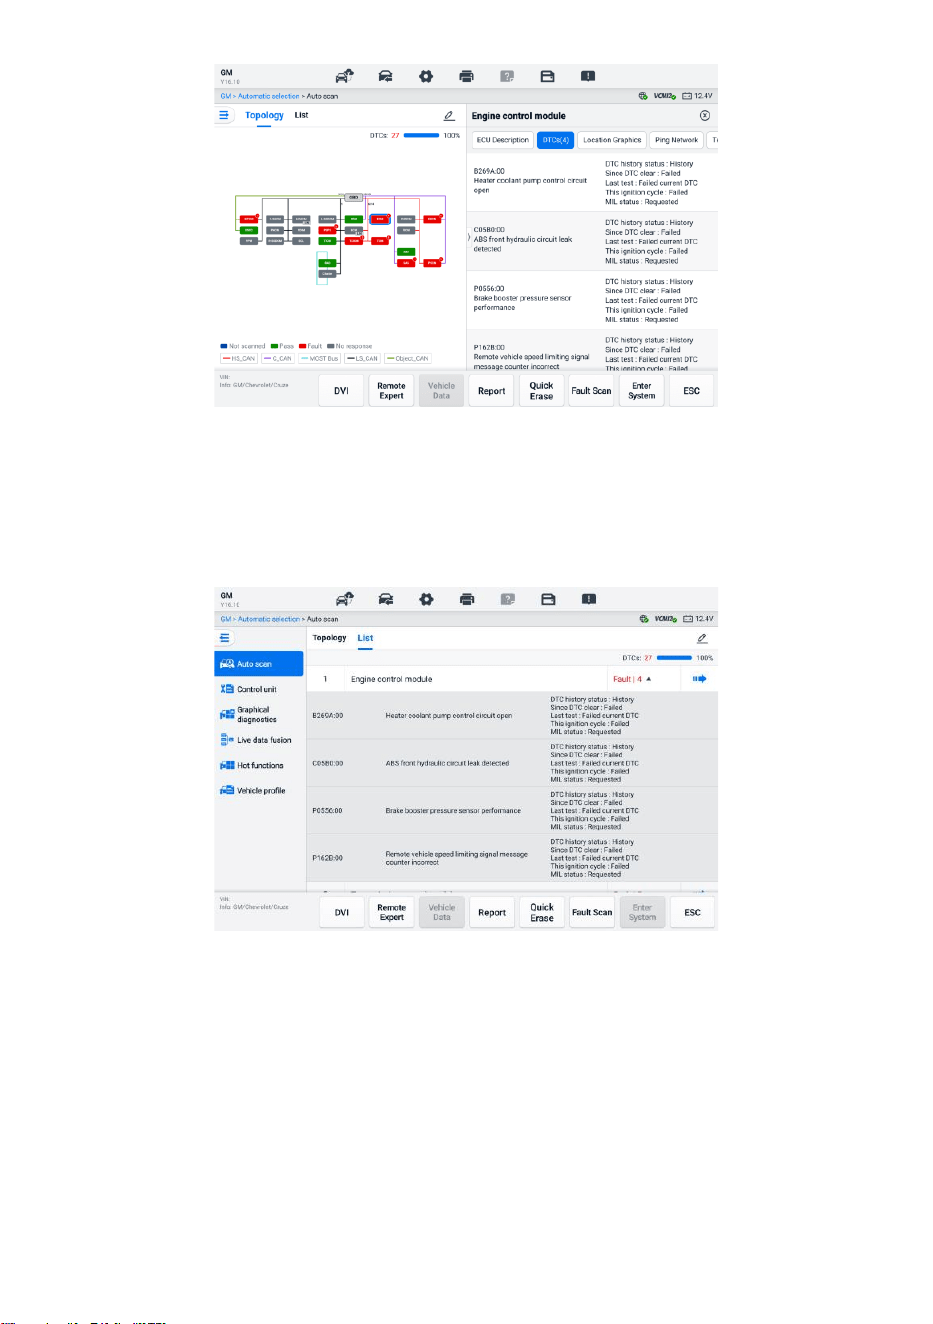
A. Topology Tab Page
44
For a number of vehicle brands, including Volkswagen, Audi, BMW, Ford, Land
Rover, Jaguar, Chrysler, Fiat, Volvo, etc., a topology map is available to display the
relationship between vehicle systems. The ECU system of the tested vehicle is
displayed in the form of a topology diagram, which describes the layout of the cables
and systems of the vehicle control circuit and the path used for data transmission.
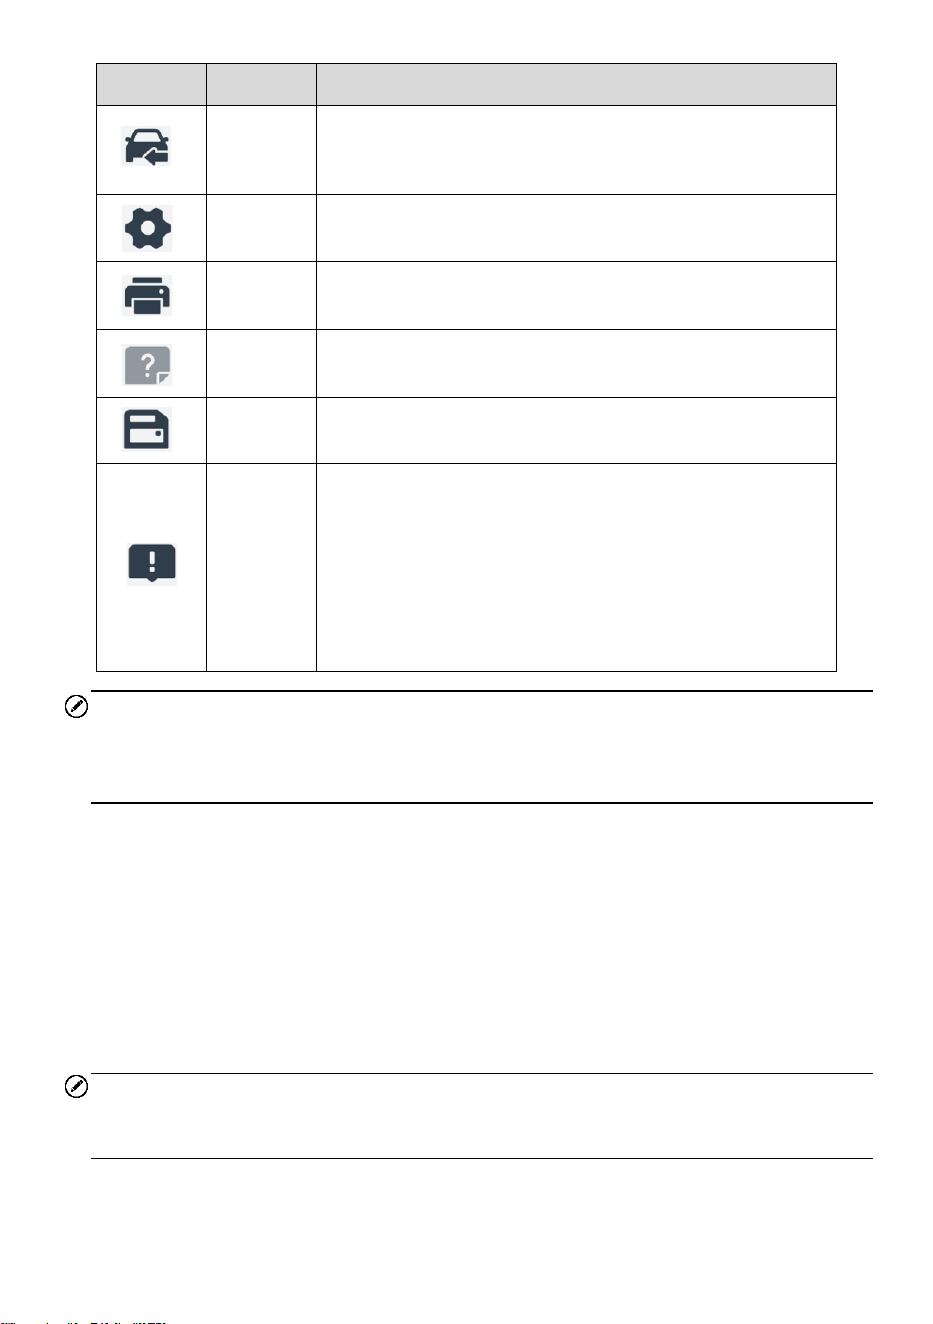
When selecting a system, the information such as ECU description, DTCs, location
graphics, and PING network displays on the right side.
Figure 6-9 Topology Tab Page
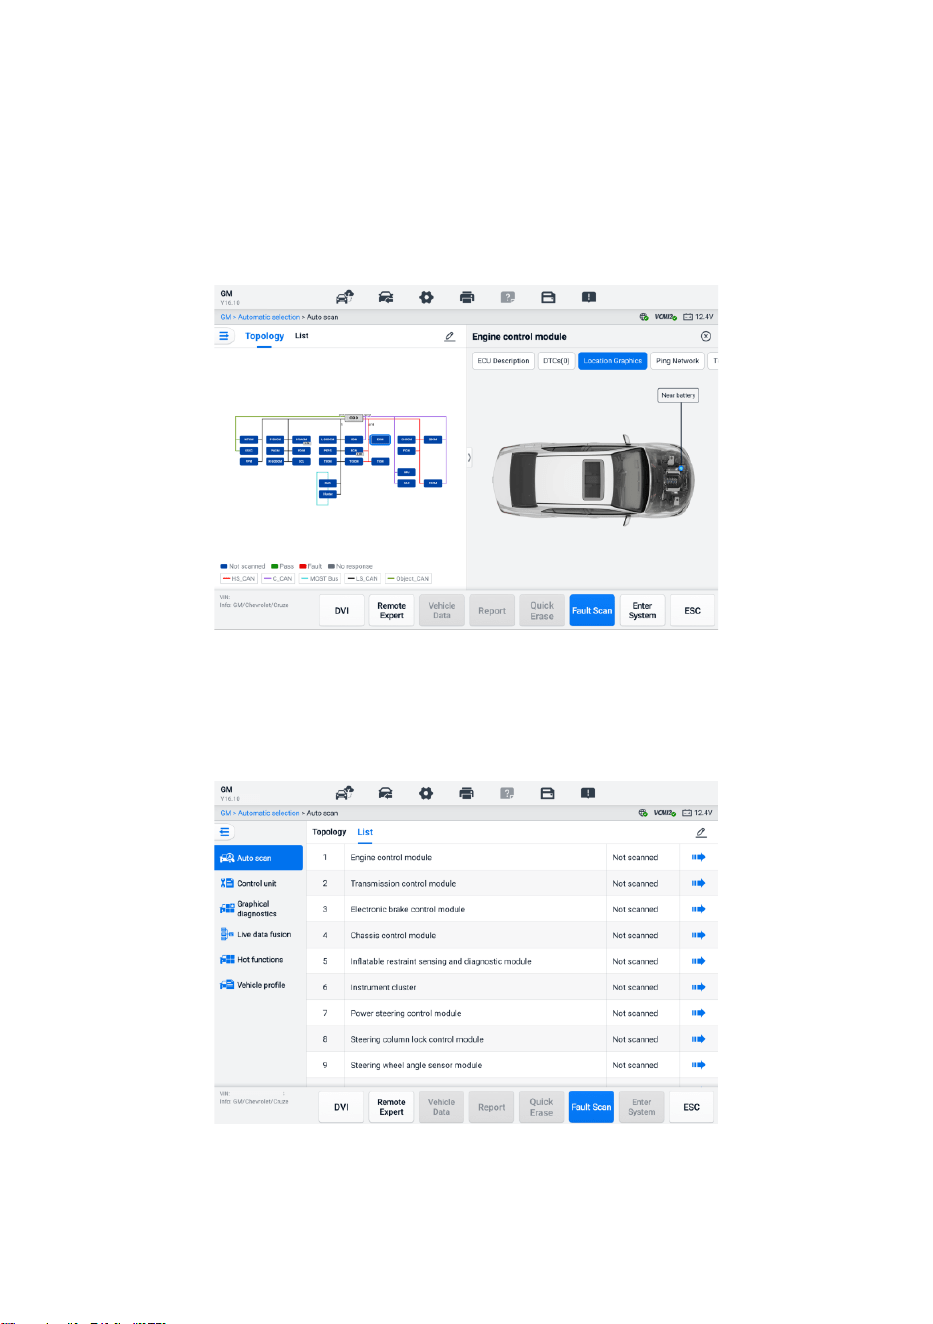
B. List Tab Page
The List Tab page is available for most vehicles.
Figure 6-10 List Tab Page
45
➢ To perform an Auto Scan function
Take topology as an example:
1. Tap the Diagnostics application button on the MaxiSys Job Menu. Choose the
corresponding vehicle information and enter the Main Menu screen (see Figure
6-8 Diagnostics Main Menu Screen).
2. Select Auto Scan from the navigation bar.
3. The topology map displays in the main section. Tap the Fault Scan button at
the bottom of the screen to scan the vehicle system modules.
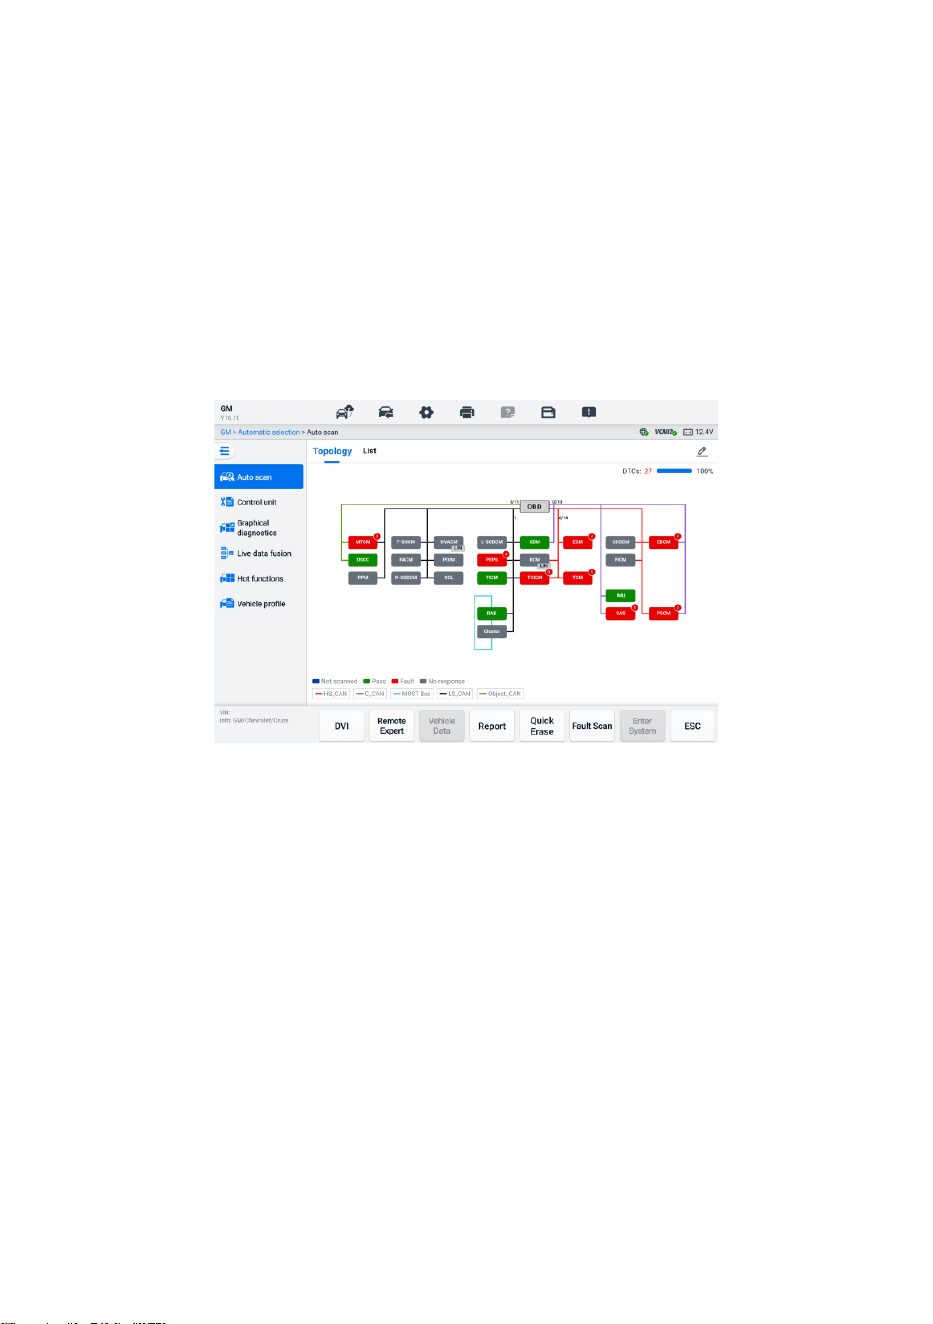
Auto Scan Results
A. Topology Tab Page
Figure 6-11 Scan Results in Topology Tab Page 1
The number of total faults will appear on the upper-right corner, and the results will be
displayed in different colors after scanning:
⚫ Green: the system has detected no faults.
⚫ Red: the system has detected faults. The number of faults appears on the upper-
right corner of the system.
⚫ Gray: the system has not received a response.
⚫ Blue: the system has not been scanned.
After scanning, you can tap a system with faults to view the information such as detailed
DTCs, location graphics, and PING network on the right side.
46
Figure 6-12 Scan Results in Topology Tab Page 2
Tap the Enter System button at the bottom to perform further diagnostics or perform
functions based on the detected faults with voice commands beginning with “Hey Max.”
B. List Tab Page
Figure 6-13 Scan Results in List Tab Page
The number of total faults will appear on the upper-right corner. The detailed scan results
are displayed in four columns.
⚫ Column 1 — displays the system numbers
⚫ Column 2 — displays the scanned systems
⚫ Column 3 — displays the scan results
Fault | #: Indicates there is/are detected fault code(s) present; "#" indicates the

47
quantity of detected faults.
Pass | No Fault: Indicates the system was scanned and no fault has been
detected.
Not Scanned: Indicates the system has not been scanned.
No Response: Indicates the system has not received a response.
⚫ Column 4 — tap the button to enter a system for performing further diagnostics.
The table below provides a brief description of the function buttons at the bottom of the
Auto Scan screen:
Table 6-3 Function Button Descriptions
Name
Description
DVI
Accesses the DVI application screen.
Remote Expert
Exits the Diagnostics function and accesses the Remote
Expert function to perform the remote service.
Vehicle Data
Displays the related vehicle data information.
Report
Displays the diagnostic data in report form.
Quick Erase
Erases all fault information after scanning.
Fault Scan
Scans vehicle system modules.
Pause
Pauses the scanning process.
Enter System
Enters the ECU system.
ESC
Returns to the previous screen or exits the Diagnostics screen.
Control Unit
The Control Unit function allows you to manually locate a required control system for
testing through a series of choices. Simply follow the menu-driven procedures and make
a proper selection each time; the program will guide you to the diagnostic function menu
after a few choices you've made.

48
Figure 6-14 Control Unit Screen
Available functions may vary by vehicle. The function menu may include:
⚫ ECU Information — displays detailed ECU information. Select to display the
information screen.
⚫ Trouble Codes — contains Read Codes and Erase Codes. The former displays
detailed DTC information retrieved from the vehicle control module. The latter
facilitates you to erase DTCs and other data from the ECU.
⚫ Live Data — retrieves and displays live data and parameters from the vehicle’s ECU.
⚫ Active Test — provides specific subsystem and component tests. This selection
may display as Actuators, Actuator Test, or Function Tests. Available tests vary by
vehicle.
⚫ Special Functions — provides component adaptation or variant coding functions
for custom configurations and allows the entry of adaptive values for certain
components after repairs. Depending on the test vehicle, this selection may
sometimes appear as Control Unit Adaptations, Variant Coding, Configuration, or
something similar.
6.6.1 ECU Information
This function retrieves and displays the specific information for the tested control unit,
including unit type, version numbers, and other information.
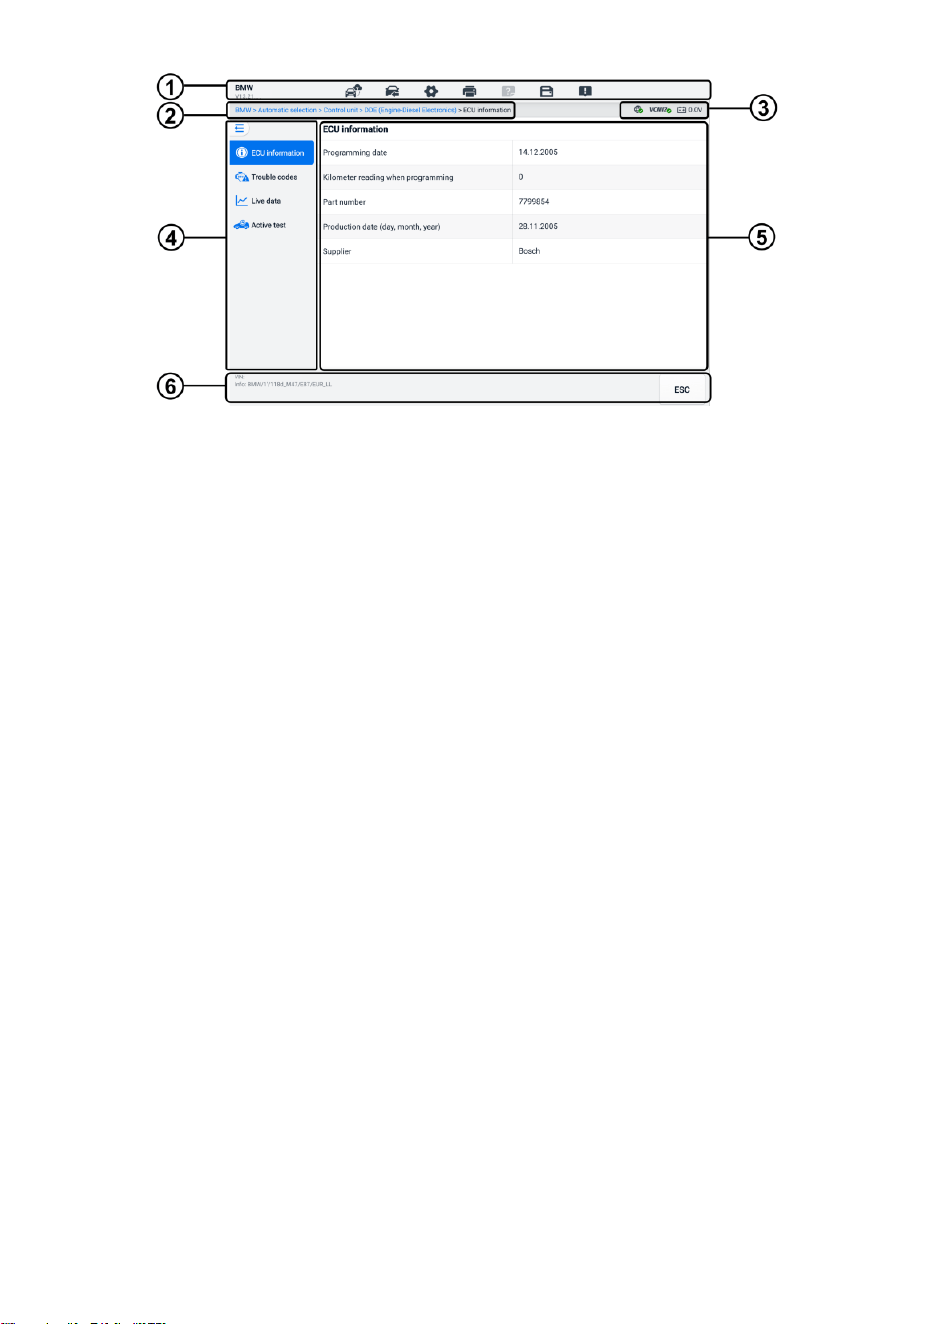
49
Figure 6-15 ECU Information Screen
1. Diagnostics Toolbar — see Table 6-2 Diagnostics Toolbar Buttons for detailed
descriptions of the operations of each button.
2. Current Directory Path
3. Status Information Bar
4. Navigation Bar
5. Main Section — the left column displays the item names; the right column displays
the specifications or descriptions.
6. Function Button — in this case, only an ESC button is available; tap it to exit after
viewing.
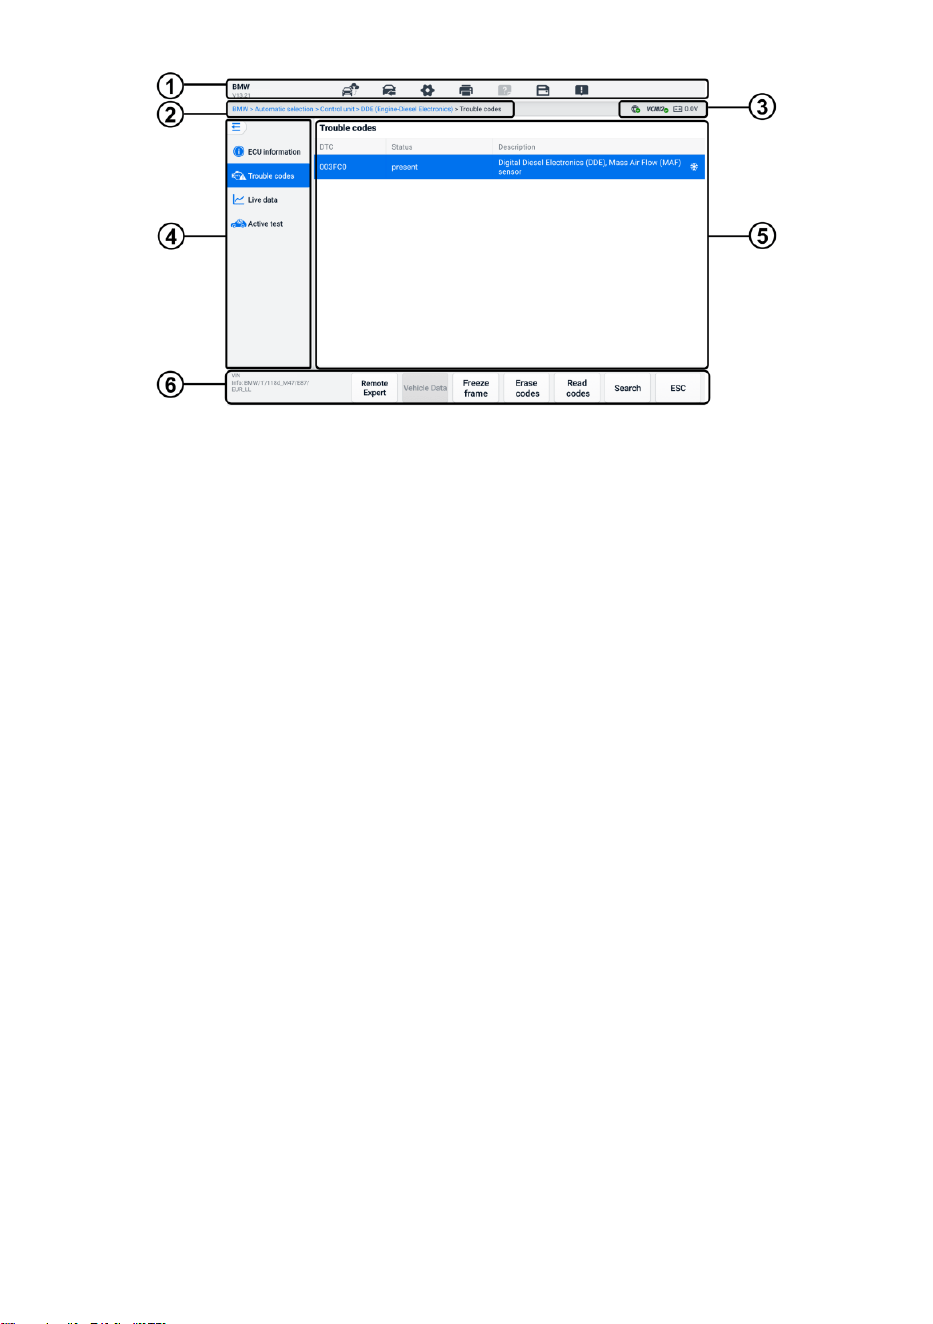
6.6.2 Trouble Codes
The Freeze Frame, Read Codes, and Erase Codes function buttons are contained in the
Trouble Codes screen. The Freeze Frame button will be activated if there are freeze
frame data for viewing. Tap the Erase Codes button to erase DTCs and other data from
the ECU, while tapping the Read Codes button to display the detailed DTC information
retrieved from the vehicle control module. When tapping Trouble Codes from the
navigation bar of the Control Unit screen, the tablet will automatically read the DTC
information in ECU.
50
Figure 6-16 Trouble Codes Screen
1. Diagnostics Toolbar — see Table 6-2 Diagnostics Toolbar Buttons for detailed
descriptions of the operations of each button.
2. Current Directory Path
3. Status Information Bar
4. Navigation Bar
5. Main Section
⚫ Column 1 — displays the retrieved codes from the vehicle
⚫ Column 2 — indicates the status of the retrieved codes
⚫ Column 3 — displays detailed descriptions for the retrieved codes
⚫ Snowflake Icon — only displays when freeze frame data is available for viewing.
Tap the icon to display data screen. The Freeze frame screen is similar to that
of the Read codes screen and share similar operations
6. Function Buttons
⚫ Remote Expert — tap to access the remote expert function.
⚫ Freeze Frame — a snowflake icon appears when freeze frame data is available
for viewing.
⚫ Erase Codes — tap to erase codes from the ECU. It is recommended to read
DTCs and make necessary repairs before erasing the codes.
After reading the retrieved codes from the vehicle and certain repairs have been
made, you can erase the codes from the vehicle using this function. Before
performing this function, make sure the vehicle's ignition key is in the ON (RUN)
position with the engine off.

51
➢ To erase codes
1. Tap Erase Codes from the function buttons.
2. A warning message displays to inform you of data loss when this
function is applied.
Tap Yes to continue. A confirming screen displays when the
operation is successfully done.
Tap No to exit.
3. Tap ESC on the confirming screen to exit the Erase Codes screen.
4. Check the Read Codes function again to ensure the operation is
successful.
⚫ Read Codes — retrieves and displays the DTCs from the vehicle control system.
The Read Codes screen varies for each vehicle being tested.
⚫ Search — tap to search the selected DTC for additional information on the
Internet.
⚫ ESC — tap it to return to the previous screen or exit the function.
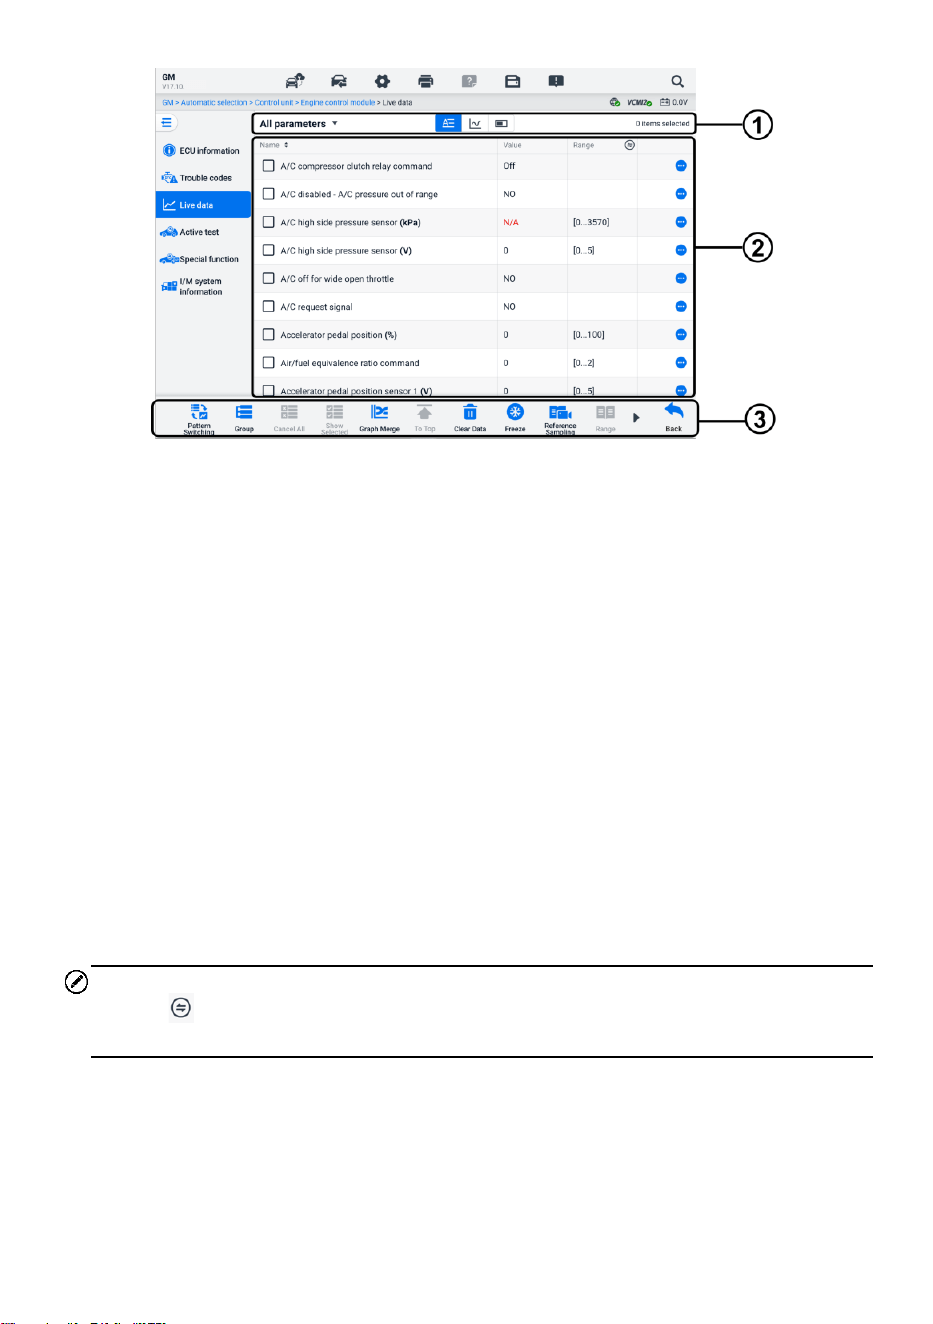
6.6.3 Live Data
After tapping the Live Data option from the left navigation bar, the screen displays the
parameter groups by default. Tap a group to enter the live data screen for details. You
can also create a new data group by tapping the Add ( ) icon.
The live data screen displays the data list for the selected system. The displayed
parameters vary by vehicle. Gesture scrolling allows you to move quickly through the
data list. Touch the screen and drag your finger up or down to reposition the parameters
being displayed if the data occupies more than one screen.
52
Figure 6-17 Live Data Screen
1. Top Toolbar
⚫ Data Group Selection — tap the dropdown button to select the data group
needed.
⚫ Display Mode — three display modes are available for a selected data group.
Text Mode — the default mode that displays the parameters as a text list.
Waveform Graph Mode — displays the parameters in waveform graphs.
Digital Gauge Mode — displays the parameters in the form of a digital
gauge graph.
2. Main Section
⚫ Name Column — displays the parameter names.
Check Box — tap the check box to the left of a parameter to select the item.
Tap the check box again to deselect it.
⚫ Value Column — displays the values of the parameters.
⚫ Range Column — displays the ranges of the parameters.
NOTE
Tap the icon on the right of the Range column to switch the display between the
maximum & minimum values at the recording function and the reference value.
⚫ Overflow Menu Button — opens a submenu that provides four display modes
and other options.
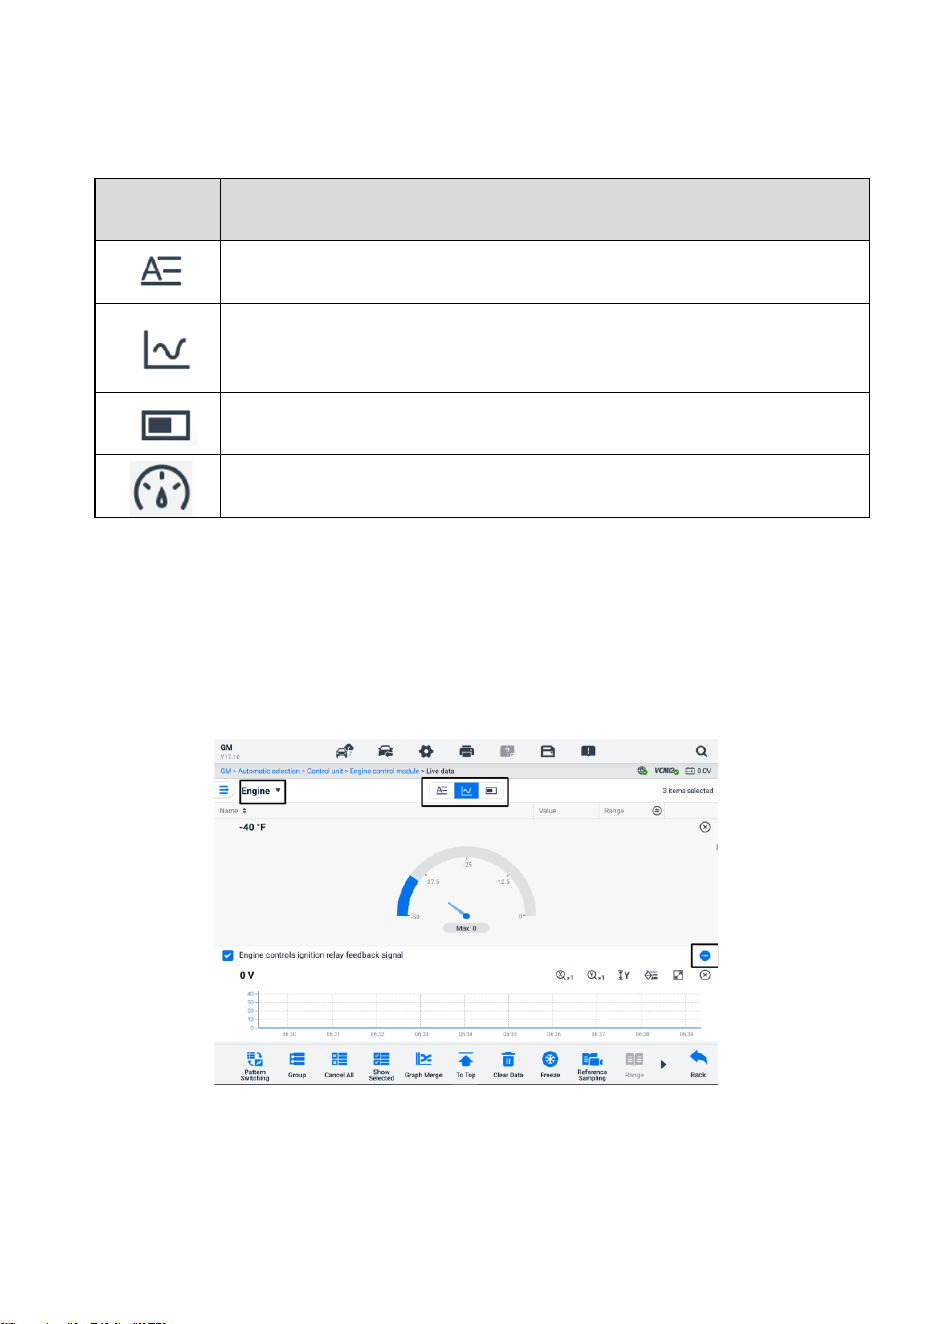
53
Display Mode
There are four types of display modes available for data viewing, allowing you to view
various types of parameters in the mode best suited to represent the data.
Icon
Display Mode
Text Mode
Waveform Graph Mode. The digital-type parameters and status
parameters are supported.
Digital Gauge Mode. Only digital-type parameters are supported.
Analog Gauge Mode. Only digital-type parameters are supported.
➢ To select the display mode
1. Select the data group you need at the left corner of the top toolbar.
2. Tap a display mode among the text mode, waveform graph mode, and digital
gauge mode for the selected data group.
3. Or tap the overflow menu button to select a display mode for a specific
parameter. Each parameter item displays the selected mode independently.
Figure 6-18 Display Mode Screen
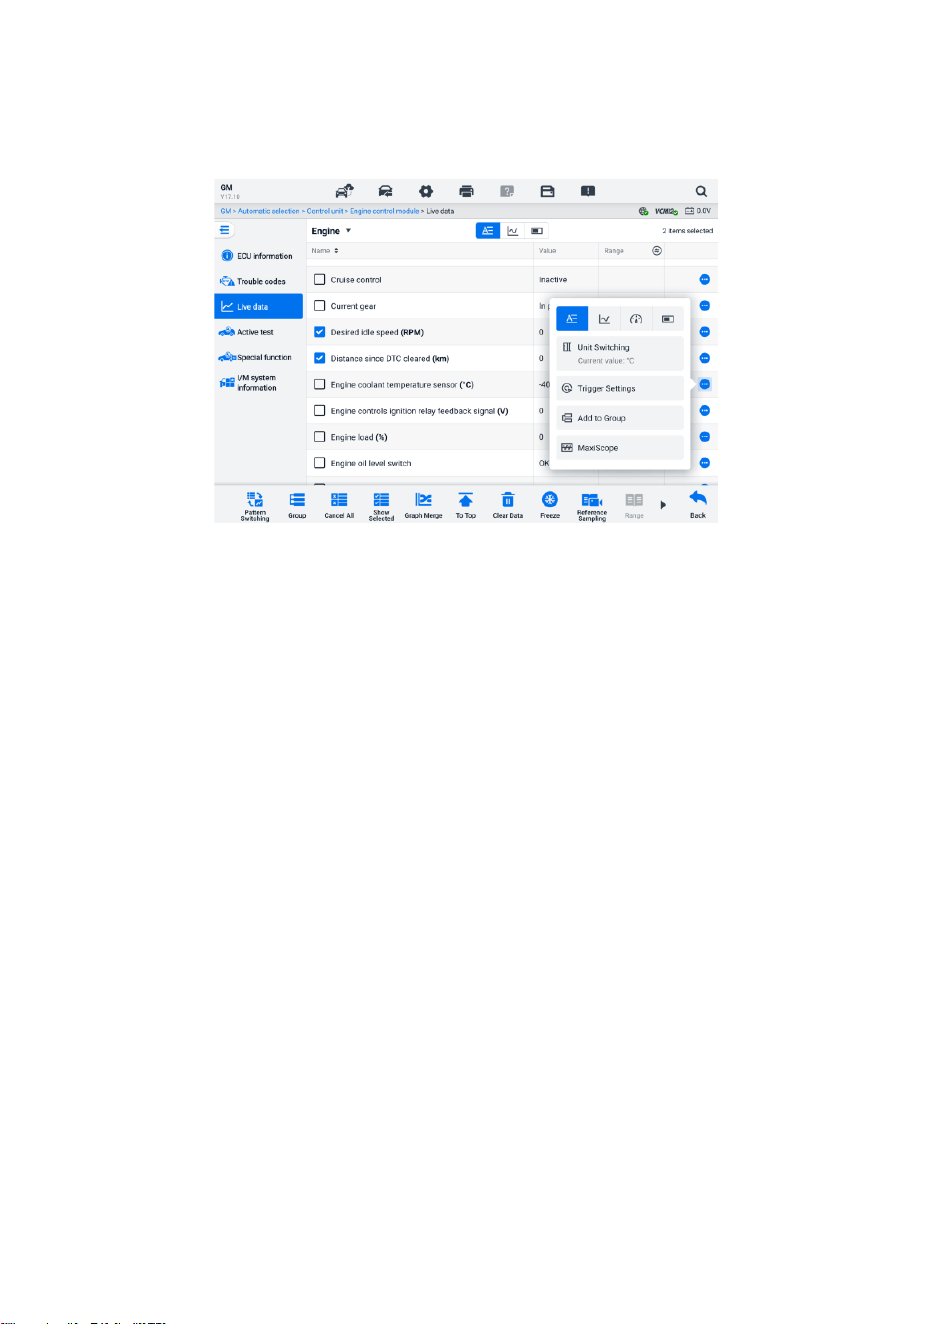
54
Control Button
A total of 4 control buttons will be displayed: Unit Switching, Trigger Setting, Add to Group,
and MaxiScope.
Figure 6-19 Control Button Screen
1) Unit Switching — tap to switch the unit for the parameter value.
2) Trigger Settings
On the trigger settings screen, you can set a standard range by filling in a minimum
value and a maximum value. When exceeding this range, the trigger function will be
executed, and the device will automatically record and save the generated data. You
can check the saved live data by tapping the Review button at the bottom of the
screen.
Tap the overflow button on the right side of the parameter to open a submenu. The
Trigger Settings button is displayed under the Text Mode in the submenu. Tap to
display the Trigger Settings window.
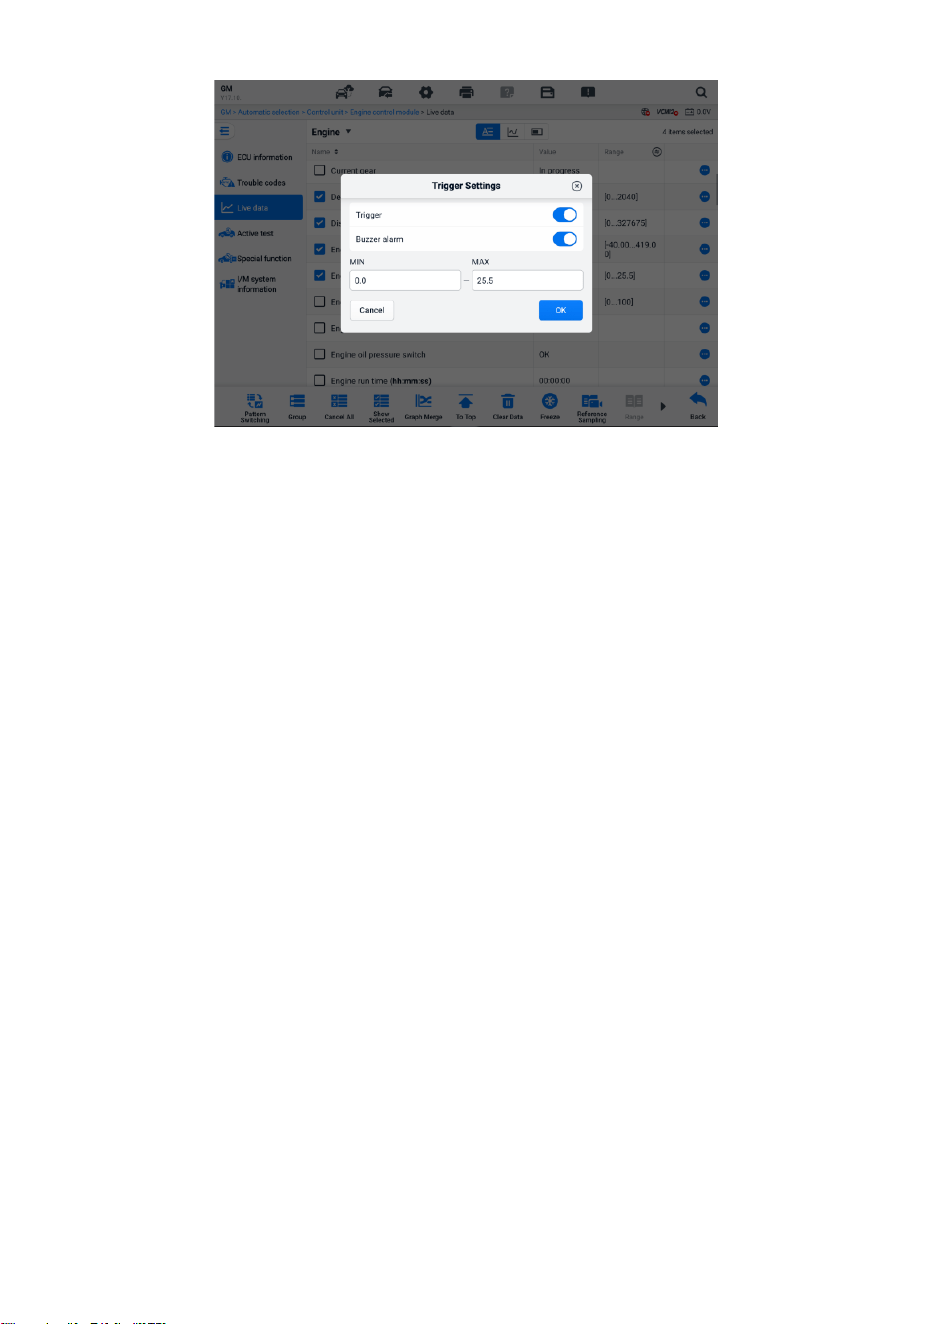
55
Figure 6-20 Trigger Settings Screen
Two buttons and two input boxes are available in the Trigger Settings window.
a) Trigger — switches the trigger on and off. The trigger is ON by default.
b) Buzzer Alarm — switches the alarm on and off. The alarm function makes a
beeping sound as an alert when the data reading reaches the preset minimum
or maximum point. The buzzer alarm will only sound at the first trigger.
c) MIN — tap this input box to display a virtual keyboard to enter the required lower
limit value.
d) MAX — tap this input box to display a virtual keyboard to enter the required
upper limit value.
➢ To set a trigger
1. Tap the overflow button on the right side of the parameter to open a submenu.
2. Tap the Trigger Settings button under the Text Mode in the submenu to open
the Trigger Settings window.
3. Tap the MIN input box and enter the required minimum value.
4. Tap the MAX input box and enter the required maximum value.
5. Tap OK to save the setting and return to the Live Data screen; or tap Cancel to
exit without saving.
When the trigger is successfully set, a trigger mark displays in front of the parameter
name. The mark is gray when not triggered and displays orange when triggered.
Moreover, two horizontal lines are displayed on each of the data graphs (when
Waveform Graph Mode is applied) to indicate the alarm point. The limit lines are
shown in different colors to differentiate them from the parameter waveforms.
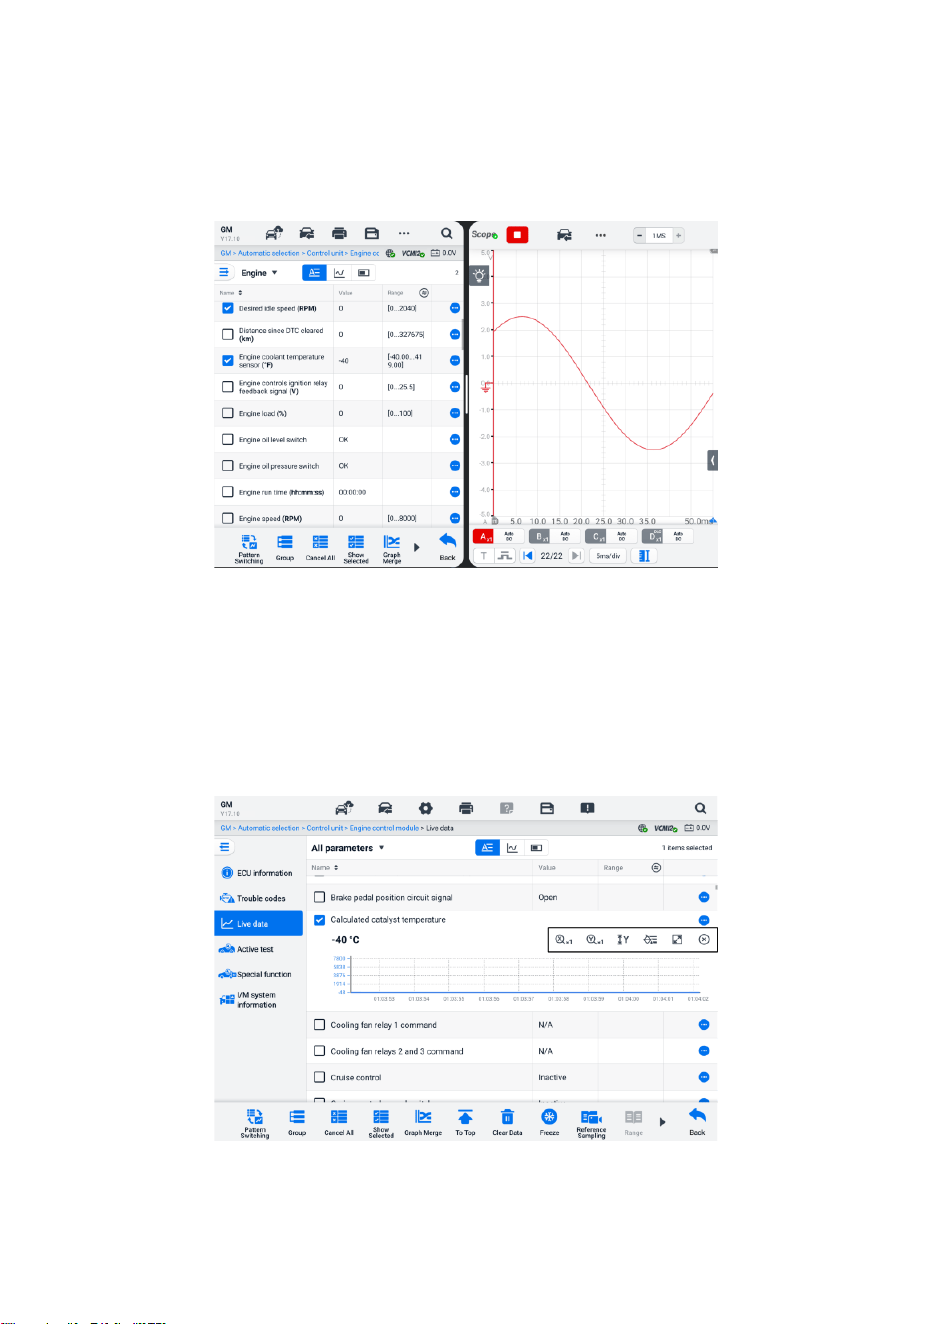
56
3) Add to Group — tap to add the selected parameters to the custom group.
4) MaxiScope — tap to connect the VCMI immediately or enter the demo mode.
The Live Data and the MaxiScope functions are performed simultaneously on
the split screen.
Figure 6-21 MaxiScope Screen
Text Mode — the default mode that displays the parameters as a text list.
Waveform Graph Mode
In this mode, six control buttons will display on the right side of the parameter item,
allowing you to manipulate the display status.
Figure 6-22 Waveform Graph Mode Screen
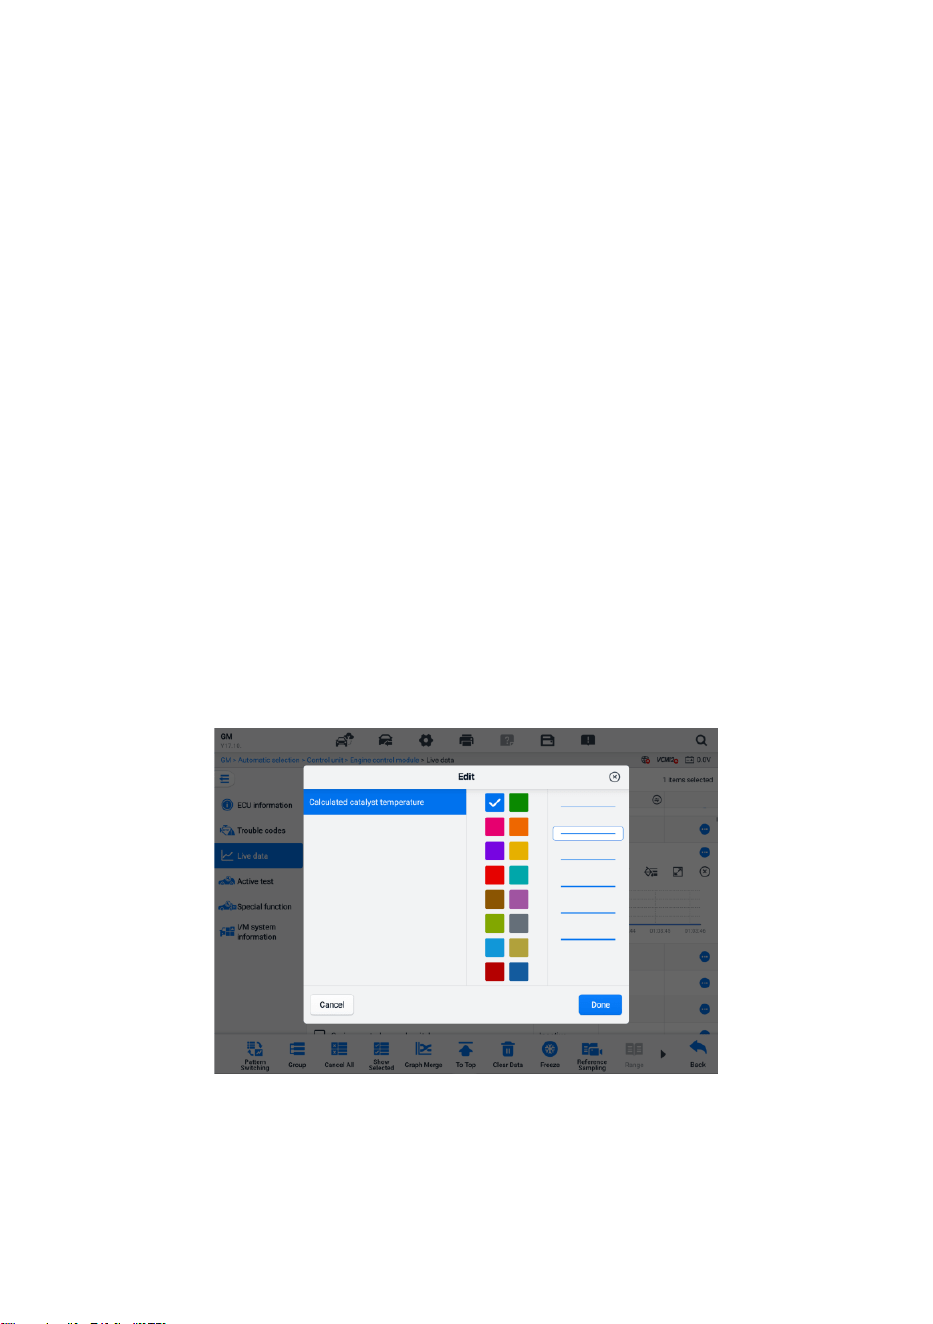
57
1) Scale Button for the X-axis: There are four scales available for the X-axis: x1,
x2, x4, and x8.
2) Scale Button for the Y-axis: There are three scales available for the Y-axis: x1,
x2, and x4.
3) Settings Button (SetY) — sets the minimum and maximum value of the Y-axis.
4) Edit Button — edits the waveform color and the line thickness.
5) Zoom-in Button — tap once to display the selected data graph in full screen.
6) Exit Button — tap to exit the waveform graph mode.
Full Screen Display — There are five control buttons available on the top-right side
of the screen.
⚫ Scale Button for the X-axis: There are four scales available for the X-axis: x1,
x2, x4, and x8.
⚫ Scale Button for the Y-axis: There are three scales available for the Y-axis: x1,
x2, and x4.
⚫ Edit Button — tap to open an edit window, in which you can set the waveform
color and the line thickness displayed for the selected parameter item.
⚫ Zoom-out Button — tap to exit the full-screen display.
⚫ Exit Button — tap to exit the waveform graph mode.
➢ To edit the waveform color and line thickness
1. Select a parameter item to display in Waveform Graph mode.
2. Tap the Edit button, and an edit window will display.
Figure 6-23 Waveform Edit Screen
3. The parameter item is selected automatically in the left column.

58
4. Select a color from the second column.
5. Select a line thickness from the right column.
6. Tap Done to save the setting and exit, or tap x to exit without saving.
NOTE
In the full-screen display, edit the waveform color and line thickness by tapping the Edit
button on the top-right side of the screen.
Analog Gauge Mode — displays the parameters in gauge charts.
Digital Gauge Mode — displays the parameters in the form of a digital gauge graph.
3. Function Buttons
The operations of the available functional buttons on the Live Data screen are described
below:
Pattern Switching — tap to switch between the vertical list mode and grid list mode.
Long press the button to display a pop-up window showing all the grid mode patterns,
such as 12-grid, 9-grid, 6-grid, etc. Select a pattern to display the parameters.
Group — tap to create a new group or select an existing custom group. The Edit
Group and Delete Group buttons are available at the bottom of the screen once the
Group button is selected.
Cancel All — tap to cancel all selected parameter items. Up to 50 parameters can
be selected at one time.
Show Selected/Show All — tap this button to switch between the two options: one
displays the selected parameter items, and the other displays all the available items.
Graph Merge — tap this button to merge selected data graphs (for Waveform Graph
Mode only). This function is very useful when comparing different parameters.
NOTE
This mode supports 2 concurrent cure fusion groups of up to 8 parameters per group that
can be represented digitally. Non-digital parameters are not supported.
➢ To merge selected data graphs
1. Select the parameters to be merged.
2. Tap the Graph Merge button at the bottom of the Live Data screen.
3. The selected parameters are displayed on the screen. Tap the selectable check
box on the right to choose the parameter and group. The grey check box is not
available to select.
4. Tap Start Fusion to start.

59
5. Tap the Back button to exit.
To Top — tap to move a selected data item to the top of the list.
Clear Data — tap to clear all cached live data.
Freeze — tap to display the retrieved data in freeze mode.
⚫ Resume — tap to exit the freeze data mode and return to normal data display.
⚫ Previous Frame — tap to move to the previous frame of frozen data.
⚫ Play/Pause — tap to play/pause the frozen data.
⚫ Next Frame — tap to move to the next frame of frozen data.
Reference Sampling — tap to perform cyclic sampling of all live data in the current
system and provide the maximum, minimum, and average values of the sampled
data. Technicians can customize sampling conditions. This function can be used for
the comparative analysis of live data, assisting technicians in quickly identifying the
abnormal data.
Range — tap to display the sampled reference values including the maximum,
minimum, and average values.
Record — tap to start recording the live data of the selected data items. Tap the
Record button at the bottom of the Live Data screen. A message will display,
prompting the user to select the parameters to record. Tap the Got It button to
confirm. Scroll down and select the data items to record. Tap the Record button to
start recording. Tap the Complete button to stop recording. The recorded live data
can be viewed in the Review section at the bottom of the Live Data screen. The
recorded data can also be reviewed in the Data Manager application.
⚫ Complete — Tap to stop data recording and return to normal data display.
⚫ Flag — displays when the Record function is applied. Tap this button to set flags
to note points of interest when recording data. Notes can be added during
playback in Review or Data Manager. Select the preset flag to open a popup
window and display a virtual keyboard to input notes.
Review — tap to review the recorded data. Tap the Review button to display a
recording list and select one item to review.
NOTE
Only the data recorded during the current operation can be reviewed on the Live Data
screen. All the historical recorded data can be reviewed in "Review Data" in the Data
Manager application.
⚫ Pattern Switching — switches the display pattern.
⚫ Graph Merge — merges selected data graphs.
⚫ Show Selected — displays the selected parameters.
⚫ Previous Frame — switches to the previous frame of recorded data.
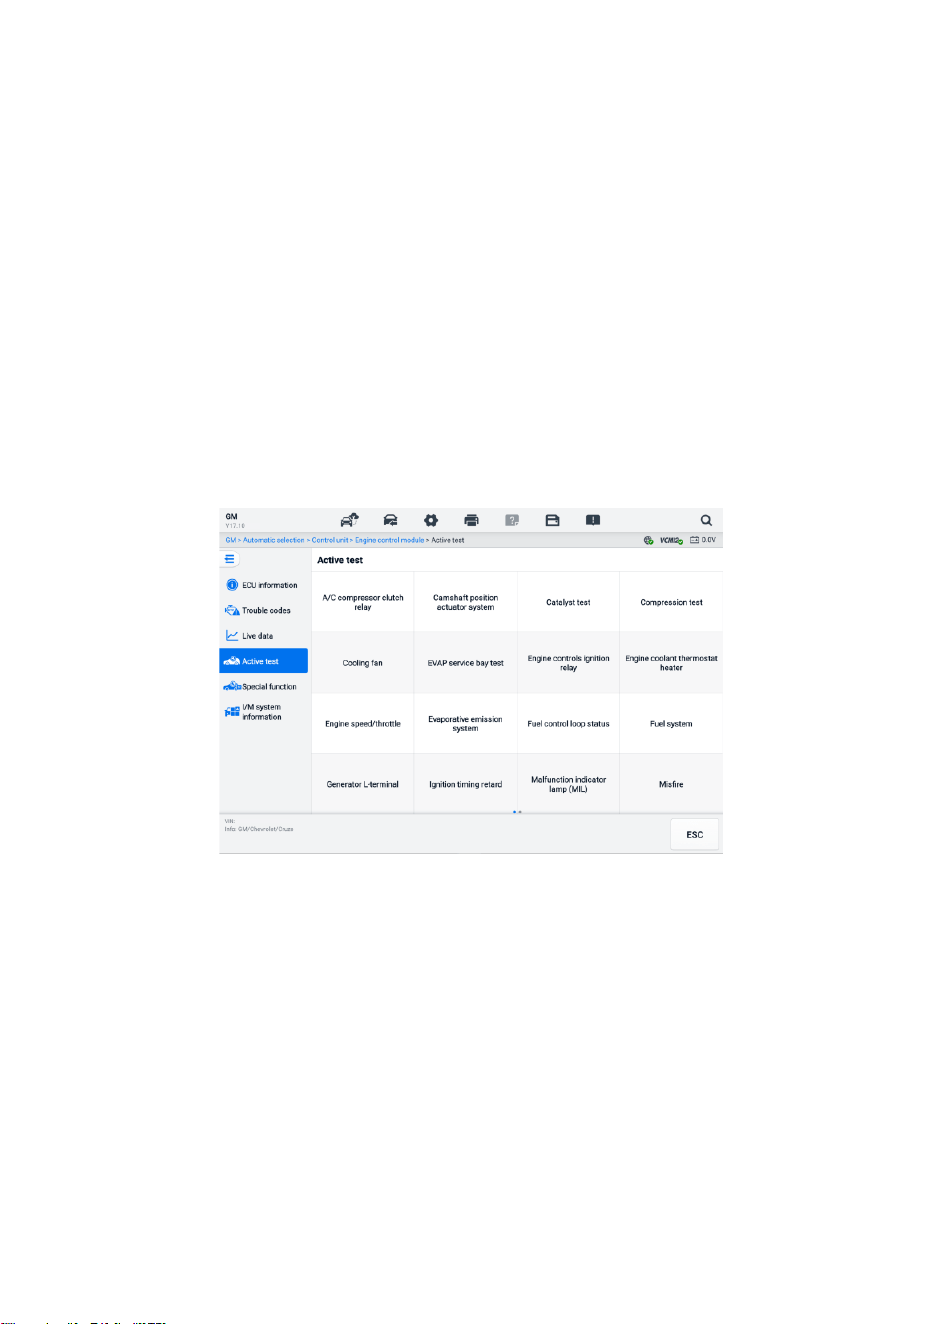
60
⚫ Play/Pause — tap to play/pause the recorded data.
⚫ Next Frame — switches to the next frame of recorded data.
⚫ Back — exits the Review screen and returns to the Live Data screen.
Back — returns to the previous screen or exits the function.
6.6.4 Active Test
The Active Test function is used to access vehicle-specific subsystem and component
tests. Available tests vary by vehicle.
During an active test, the tablet sends commands to the ECU to activate the actuators.
This test determines the integrity of the system or part by reading ECU data, or by
monitoring the operation of the actuators. Such tests may include switching a solenoid,
relay, or switch, between two operating states.
Selecting Active Test displays a menu of test options. Available tests vary by vehicle.
Figure 6-24 Active Test Screen
Select a test from menu options. Follow the instructions displayed on the screen to
complete test. Procedures and instructions vary by vehicle.
The function buttons in the lower-right corner of the Active Test screen manipulate the
test signals. The operational instructions are displayed in the main section of the test
screen. Follow the on-screen instructions and make appropriate selections to complete
the tests. Tap the ESC button to exit the test when finished.
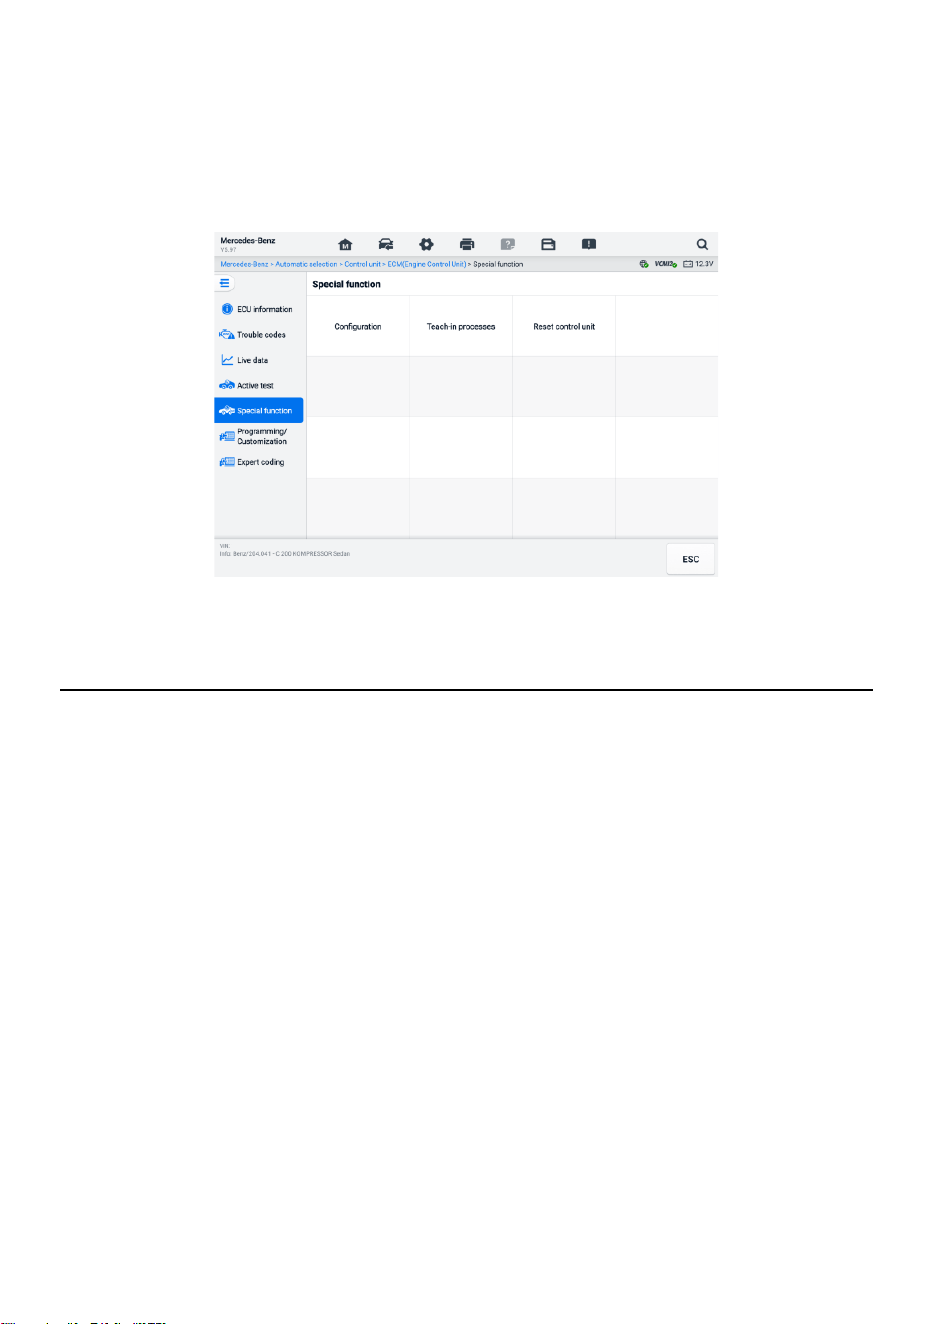
61
6.6.5 Special Functions
Depending on the test vehicle, this selection may sometimes appear as Learning
Process, Correction Programming, Emissions Inspection (Not valid for USA), OBD I/M
Check (Not valid for USA), or something similar. You can select one to proceed according
to your demands.
Figure 6-25 Special Functions Screen
6.7 Graphical Diagnostics
This function displays the vehicle system in a graphical format. It can intuitively show the
relative position of the sensors in the system and the corresponding real-time data. The
general diagnostic functions, including reading code, erasing code, and fault scanning,
are also supported in this section. See Diagnostics Functions for details.
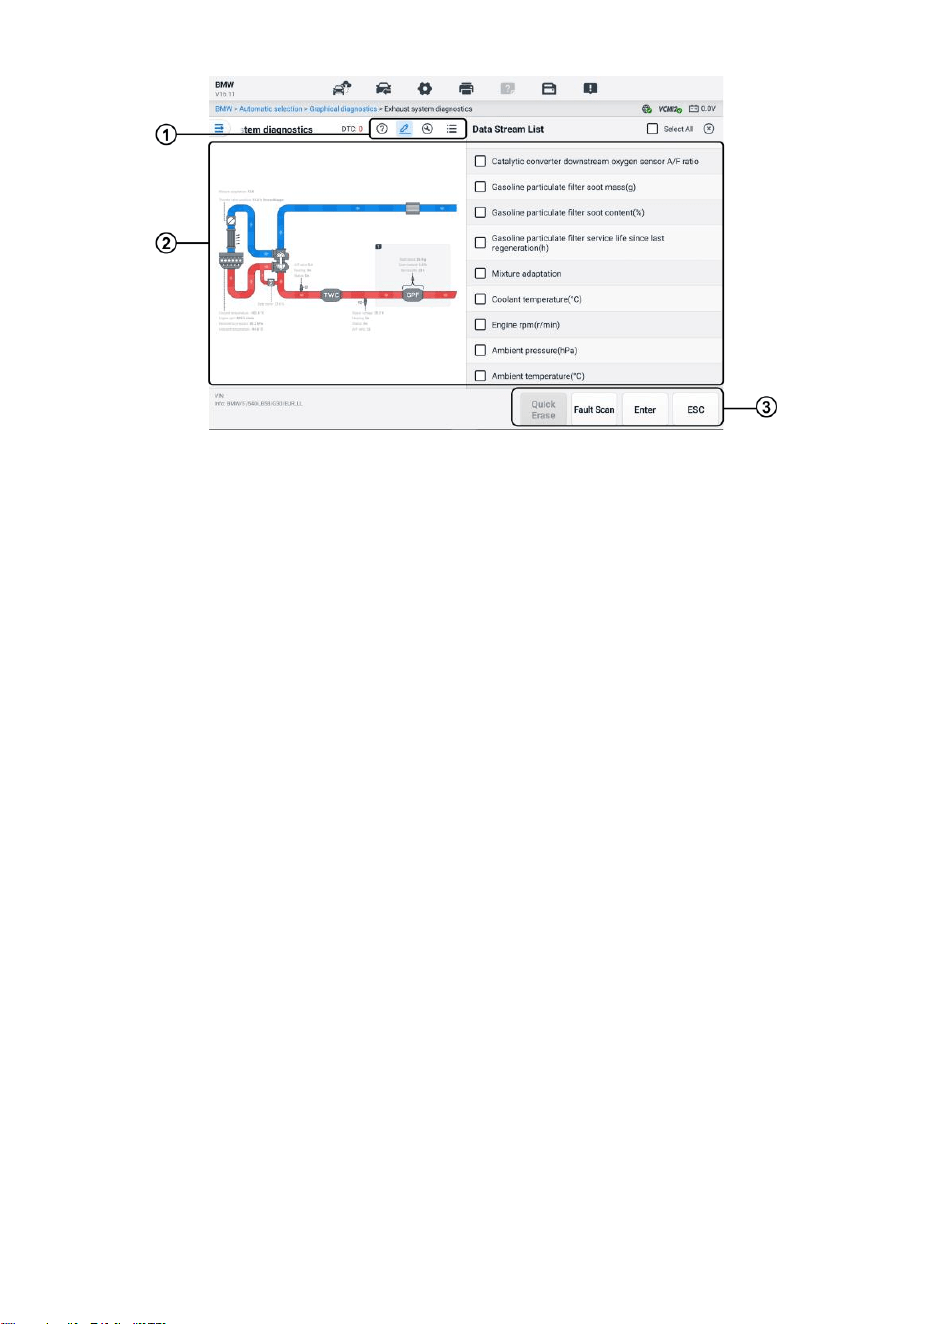
62
Figure 6-26 Graphical Diagnostics Screen
1. Top Icons — the corresponding contents will display on the right of the main section
after tapping a top icon.
Help Information — tap to display the code description and the icon description of
the vehicle system.
Live Data Selection — tap to select the live data you need from the list. The
selected live data will be highlighted in the graphs on the left of the main section.
The unselected live data and values will show as grey in the graphs.
Active Test — tap to display the Active Test screen. Follow the onscreen
instructions and set values for a test. This function helps technicians troubleshoot
problems more intuitively and efficiently.
System List Switching — tap to display the vehicle system in a list format.
2. Main Section — the left displays the selected system in intuitive graphs. The right
shows the corresponding contents after tapping a top icon.
3. Function Buttons — the buttons vary by the test vehicle. The function buttons in the
above screenshot are as follows:
Quick Erase: Erases all fault information after scanning.
Fault Scan: Scans vehicle system modules.
Enter: Enters the system.
ESC: Exits the function.
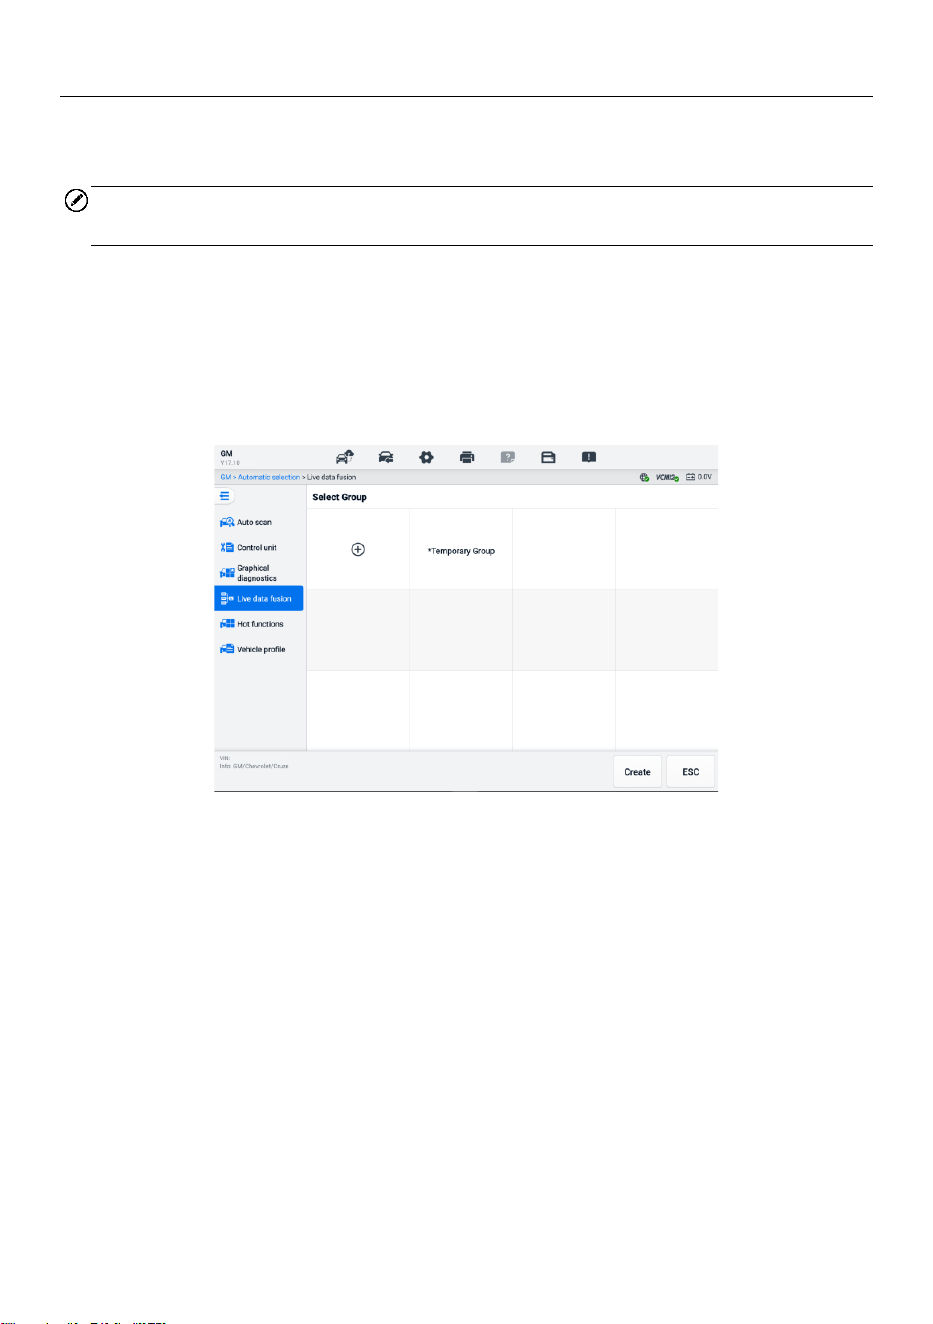
63
6.8 Live Data Fusion
For multiple systems, this function provides a quick way to create a new group.
Conducting the fusion performance based on the custom group items.
NOTE
This function is supported for certain vehicles.
➢ To perform the live data fusion function
1. Tap the Live Data Fusion option on the navigation bar from the Diagnostics
Main Menu Screen.
2. Tap the Add icon or the Create button to add a new group. You can also select
the temporary group, which is generated by default.
Figure 6-27 Live Data Fusion Screen 1
3. Tap the dropdown button on the upper-left corner of the main section to select
the specific module you need. Tap the Add icon on the right of the parameters
to add.
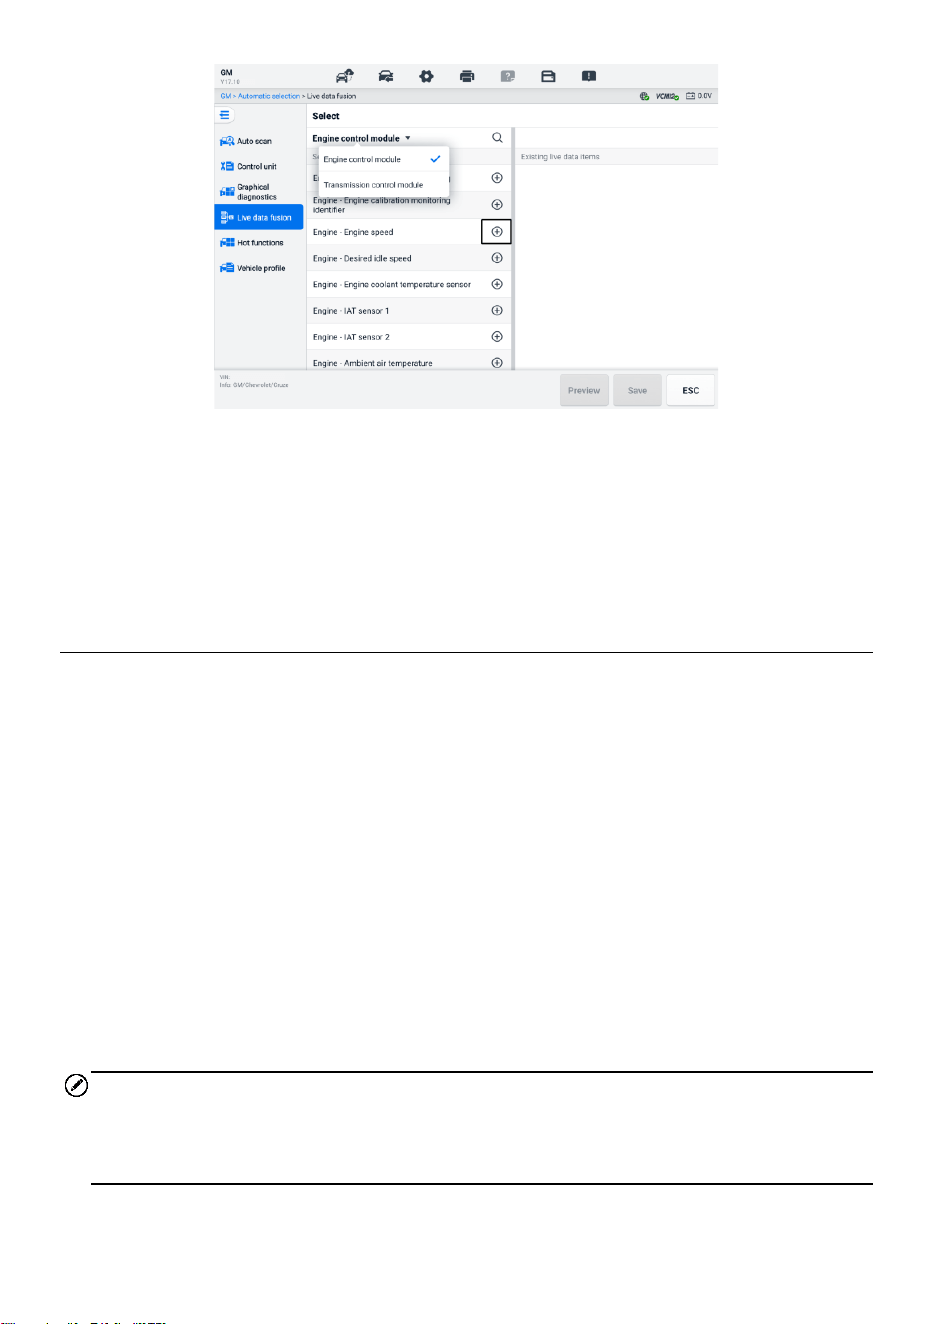
64
Figure 6-28 Live Data Fusion Screen 2
4. Tap Save at the bottom to add a new group or select an existing custom group.
Tap OK. The screen displays the saved parameters.
5. Follow the operations in the Live Data function to proceed. See Live Data for
details.
6.9 Programming and Coding
Since the introduction of OBDII and leading up to modern hybrids and EVs, hardware
and software technologies in cars have been advancing at an exponential rate. Updating
software may be the only way to fix the following issues:
⚫ Drivability
⚫ Fuel Efficiency
⚫ Power Loss
⚫ Fault Codes
⚫ Durability of Mechanical Parts
The Programming and Coding function is used to re-flash the vehicle control modules,
which allows you to update the computer software of the vehicle to the latest version, as
well as to reprogram adaptive data of certain components after making repairs or
replacements.
NOTE
The programming function applies only when the vehicle is connected with a VCMI2,
which serves as a PassThru interface to establish communication with and transfer data
to the vehicle’s ECU.

65
Available programming or coding operations vary by test vehicle. Only the available
operations display in the tablet menu.
There are two general types of programming operations:
A. Coding — also known as Teach-in Program, or Component Adaptation, is used to
reprogram adaptive data for vehicle control modules after repairs or replacements
of vehicle parts.
B. Reprogramming — downloads the latest version of software from the online server
database through Internet access (this procedure is done automatically when the
tablet is connected to the Internet, so there is no need to check for software updates
yourself), and reprograms the newest version into the vehicle's ECU.
NOTE
Ensure that the tablet is connected to a stable internet access before applying the ECU
programming function, so that the tablet is able to obtain access to the vehicle
manufacturer's server for update service.
Selecting the Programming opens a menu of operation options that vary by vehicle make
and model. Selecting a menu option either displays a programming screen or opens
another menu of additional choices. Follow the on-screen instructions to operate. How
and what information is presented on the screen vary by the type of operation being
performed.
6.9.1 Coding
The main section of the Coding screen displays a list of vehicle components and the
coding information that mainly consists of two parts:
1. All available systems for coding are displayed on the left side, and the coding data
or value on the right side.
2. The bottom of the main section displays the functional buttons that enable you to
manipulate the operation.
Check the vehicle condition and the coding information carefully. Use the functional
button to edit Codes for the corresponding components. Tap Send when you finish
editing all items. When the operation is completed, an execution status message such
as Completed, Finished or Successful, may display.
Tap the ESC button to exit the function.

66
6.9.2 Reprogramming
Before reprogramming begins:
⚫ It is mandatory that the tablet is connected to a stable Wi-Fi network.
⚫ The tablet must be connected to the VCMI2 via a USB cable.
⚫ The tablet battery must be fully charged during module programming. Connect the
tablet to a charger if needed.
⚫ Attach the battery maintainer to the vehicle battery to ensure a steady voltage is
maintained throughout programming. Voltage requirements differ by vehicle
manufacturer. Consult vehicle manufacturer recommendations prior to programming
a module.
⚫ Do not quit the application during a module reprogramming as the process may fail
and may also result in permanent damage to the module.
Typical reprogramming operations require you to input and validate VIN number first. Tap
the input box and enter the correct number. The programming interface then displays.
The main section of the reprogramming interface offers information of the hardware, the
current software version, and the newest software versions to be programmed into the
control units.
A series of on-screen operational instructions will display to guide you through the
programming procedure.
Carefully read the on-screen information and follow the instructions to execute the
programming procedure.
6.9.3 Re-flash Errors
IMPORTANT
When reprogramming onboard, always make sure the vehicle battery is fully charged
and in good working condition. During reprogramming, the operation may fail if voltage
falls below the proper operation voltage. Sometimes a failed operation can be recovered,
but the failed reprogramming can also ruin the control module. We recommend
connecting an external battery maintainer to the vehicle to ensure a steady voltage is
maintained throughout programming. The required voltage differs by vehicle
manufacturer. Consult vehicle manufacturer for correct voltage to be maintained.
Occasionally a flash update procedure may not complete properly. Common causes of
flash errors include poor cable connections between the tablet, VCMI, and vehicle, the
vehicle ignition being switched off before the flash procedure is complete, or low vehicle
battery voltage.

67
If the process quits, recheck all the cable connections to assure good communications
and initialize the flash procedure. The programming procedure will automatically repeat
if the previous operation does not succeed.
6.10 Generic OBDII Operations
The OBDII/EOBD vehicle diagnosis option offers a quick way to check for DTCs, isolate
the cause of an illuminated malfunction indicator lamp (MIL), check monitor status prior
to emissions certification testing, and perform other emissions-related services. The
OBDII direct access option is also used for testing OBDII/EOBD compliant vehicles that
are not included in the database. Diagnostics Toolbar Buttons at the top of the screen
are available for specific vehicle diagnostics. See Table 6-2 Diagnostics Toolbar Buttons
for details.
6.10.1 General Procedure
➢ To access the OBDII/EOBD diagnostics functions
1. Tap the Diagnostics button from the MaxiSys Job Menu. The Vehicle Menu
displays.
2. Tap the EOBD button. There are two options to establish communication with
the vehicle.
⚫ Auto Scan — select it to establish communication using each protocol in
order to determine which one the vehicle is using.
⚫ Protocol — select it to open a submenu of various protocols. A
communication protocol is a standardized way of data communication
between an ECM and a diagnostic tool. Global OBD may use several
different communication protocols.
3. Select a specific protocol if the Protocol option is selected. Wait for the
OBDII/EOBD Diagnostic Menu to appear.
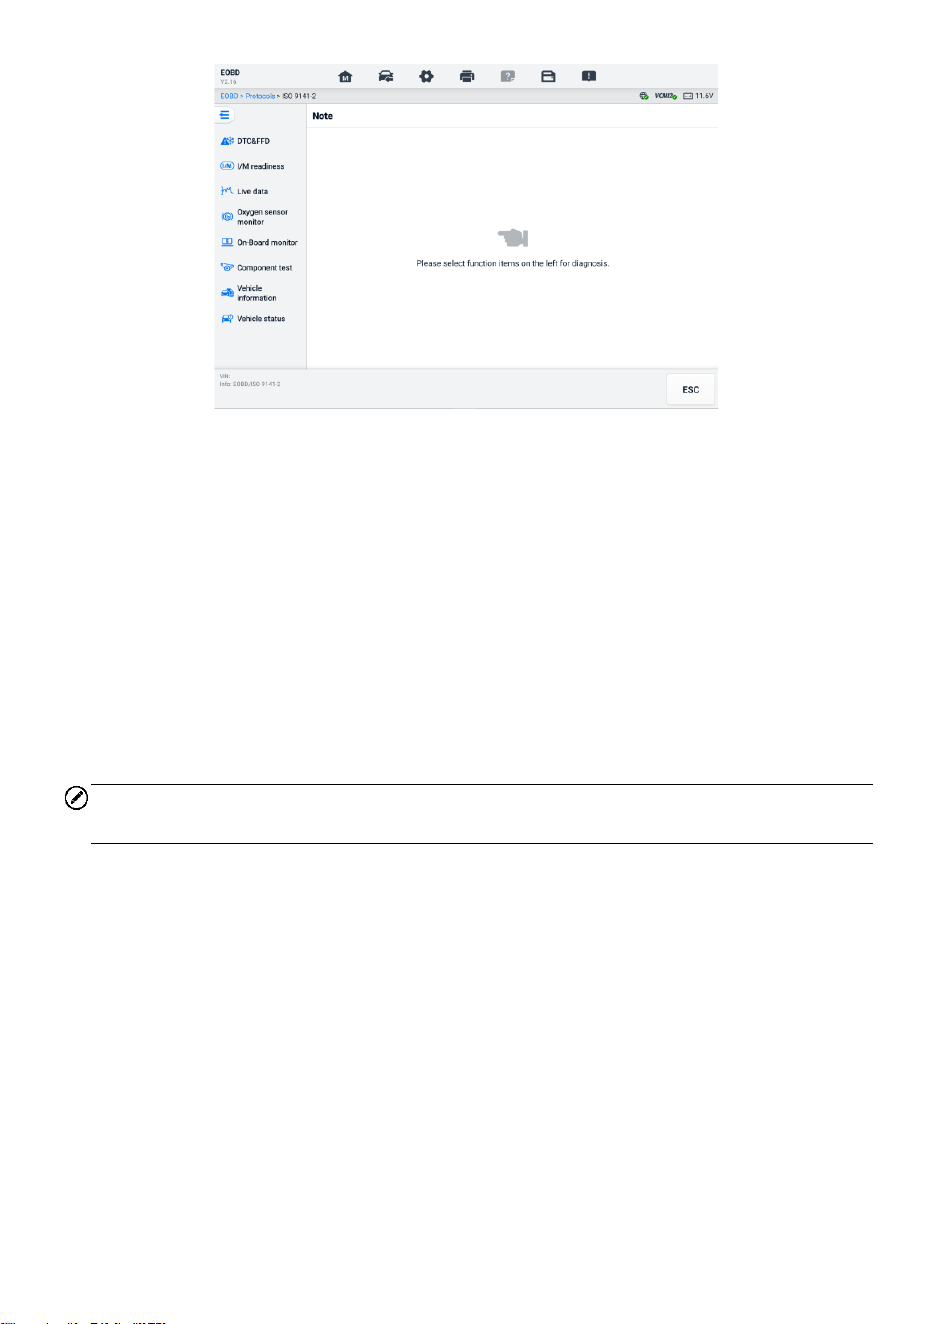
68
Figure 6-29 OBDII Diagnostic Menu
4. Select a function option to continue.
⚫ DTC & FFD
⚫ I/M Readiness
⚫ Live Data
⚫ Oxygen Sensor Monitor
⚫ On-Board Monitor
⚫ Component Test
⚫ Vehicle Information
⚫ Vehicle Status
NOTE
The supported functions may vary by vehicle.
6.10.2 Function Descriptions
This section describes the various functions of each diagnostic option:
6.10.2.1 DTC & FFD
When this function is selected, the screen displays a list of Stored Codes and Pending
Codes. When the Freeze Frame data of certain DTCs are available for viewing, a
snowflake button will display on the right side of the DTC item. The Erase Codes and
Read codes functions can be applied by tapping the Function Buttons at the bottom of
the screen.

69
⚫ Current Codes
Current codes are emission-related DTCs from the ECM of the vehicle. OBD
II/EOBD Codes have a priority according to their emission severity, with higher-
priority codes overwriting lower-priority ones. The priority of the code determines the
illumination of the Malfunction Indicator Lamp (MIL) and the codes erase procedure.
Manufacturers rank codes differently, so DTCs may vary by vehicle.
⚫ Pending Codes
These are codes whose storing conditions have been met during the last drive cycle,
but need to be met on two or more consecutive drive cycles before the DTC stored.
The purpose of displaying pending codes is to assist the service technician after a
vehicle repair when diagnostic information is cleared, by reporting test results after
a single driving cycle.
a) If a test fails during the driving cycle, the DTC associated is reported. If the
pending fault does not occur again within 40 to 80 warm-up cycles, the fault is
automatically cleared from memory.
b) Test results reported do not necessarily indicate a faulty component or system.
If test results indicate another failure after additional driving, a DTC is stored to
indicate a faulty component or system.
⚫ Freeze Frame
In most cases the stored frame is the last DTC reported. Certain DTCs, those that
have a greater impact on vehicle emission, have a higher priority. In these cases,
DTC of the highest priority is the one for which the freeze frame records are retained.
Freeze frame data includes a "snapshot" of critical parameter values at the time the
DTC is stored.
⚫ Erase Codes
This option is used to clear all emission-related diagnostic data including DTCs,
freeze frame data and specific manufacturer-enhanced data from the vehicle ECM.
This option resets the I/M Readiness Monitor Status for all vehicle monitors to Not
Ready or Not Complete status.
A confirmation screen displays when the clear codes option is selected to prevent
accidental loss of data. Select Yes on the confirmation screen to continue, or select
No to exit.
6.10.2.2 I/M Readiness
This function is used to check the readiness of the monitoring system. It is an excellent
function to use prior to having a vehicle inspected for state emissions compliance.

70
Selecting I/M Readiness opens a submenu with two choices:
⚫ Since DTCs Cleared — displays the status of monitors since the last time the DTCs
are erased.
⚫ This Driving Cycle — displays the status of monitors since the beginning of the
current drive cycle.
6.10.2.3 Live Data
This function enables the display of real-time PID data from the ECU. Displayed data
includes analog and digital input and output, and system status information broadcast in
the vehicle data stream.
Live data can be displayed in various modes, see Live Data for detailed information.
6.10.2.4 Oxygen Sensor Monitor
This function allows retrieval and review of recent oxygen sensor monitor test results
stored on the vehicle's on-board computer.
The Oxygen Sensor Monitor test function is not supported by vehicles that communicate
using a controller area network (CAN). For Oxygen Sensor Monitor test results of CAN-
equipped vehicles, refer to On-Board Monitor.
6.10.2.5 On-Board Monitor
This function allows you to view the results of On-Board Monitor tests. The tests are
useful after the service when a vehicle's control module memory is already erased.
6.10.2.6 Component Test
This function enables dual-directional control of the ECM so that the diagnostic tool can
transmit control commands to operate the vehicle systems. This function is useful in
determining how well the ECM responds to a command.
6.10.2.7 Vehicle Information
This function enables the display of the vehicle identification number (VIN), calibration
identification number, calibration verification number (CVN), and other information of the
test vehicle.
6.10.2.8 Vehicle Status
This function checks the current condition of the vehicle, such as the communication
protocols of OBDII modules, number of fault codes, and status of the Malfunction
Indicator Light (MIL).

71
6.11 Diagnostic Report
6.11.1 Pre-Scan and Post-Scan Functions
After performing pre-scan and post-scan functions by entering the same maintenance
order number, tap Data Manager > Vehicle History to select the historical test record
named with the maintenance order number. Both the pre-scan results and post-scan
results will be displayed in the same historical test record, which can be generated as a
PDF report for easily comparing the changes between pre-scan and post-scan.
⚫ Pre-Scan Function
Select and tap a vehicle button from the Vehicle Menu screen. Enter the
maintenance order number in the pop-up box to scan and detect the whole vehicle.
You can also add pictures to record the current condition of the vehicle. Once the
pre-scan is completed, you are not allowed to perform the pre-scan again, and the
scan result cannot be modified.
⚫ Post-Scan Function
After the pre-scan is complete, exit the current test vehicle and tap the vehicle button
from the Vehicle Menu screen to reconnect again. Enter the same maintenance
order number in the pop-up box. The screen for post-scan will display. The post-
scan record will be generated when the scan is completed. The pre-scan results and
post-scan results will be displayed in the same historical test record.
NOTE
The post-scan function can be performed repeatedly. After exiting the vehicle, you only
need to tap the vehicle button from the Vehicle Menu screen to reconnect again, and
then enter the same maintenance order number in the pop-up box and follow the steps
to rescan. The last one is the final post-scan result.
6.11.2 Diagnostics Report Saving, Viewing, and Sharing
The diagnostic report can be reviewed, saved, and shared with others through many
ways.
6.11.2.1 Diagnostics Report Saving
⚫ Via the History function
1) Tap Diagnostics on the MaxiSys Job Menu, and select History on the top
toolbar.
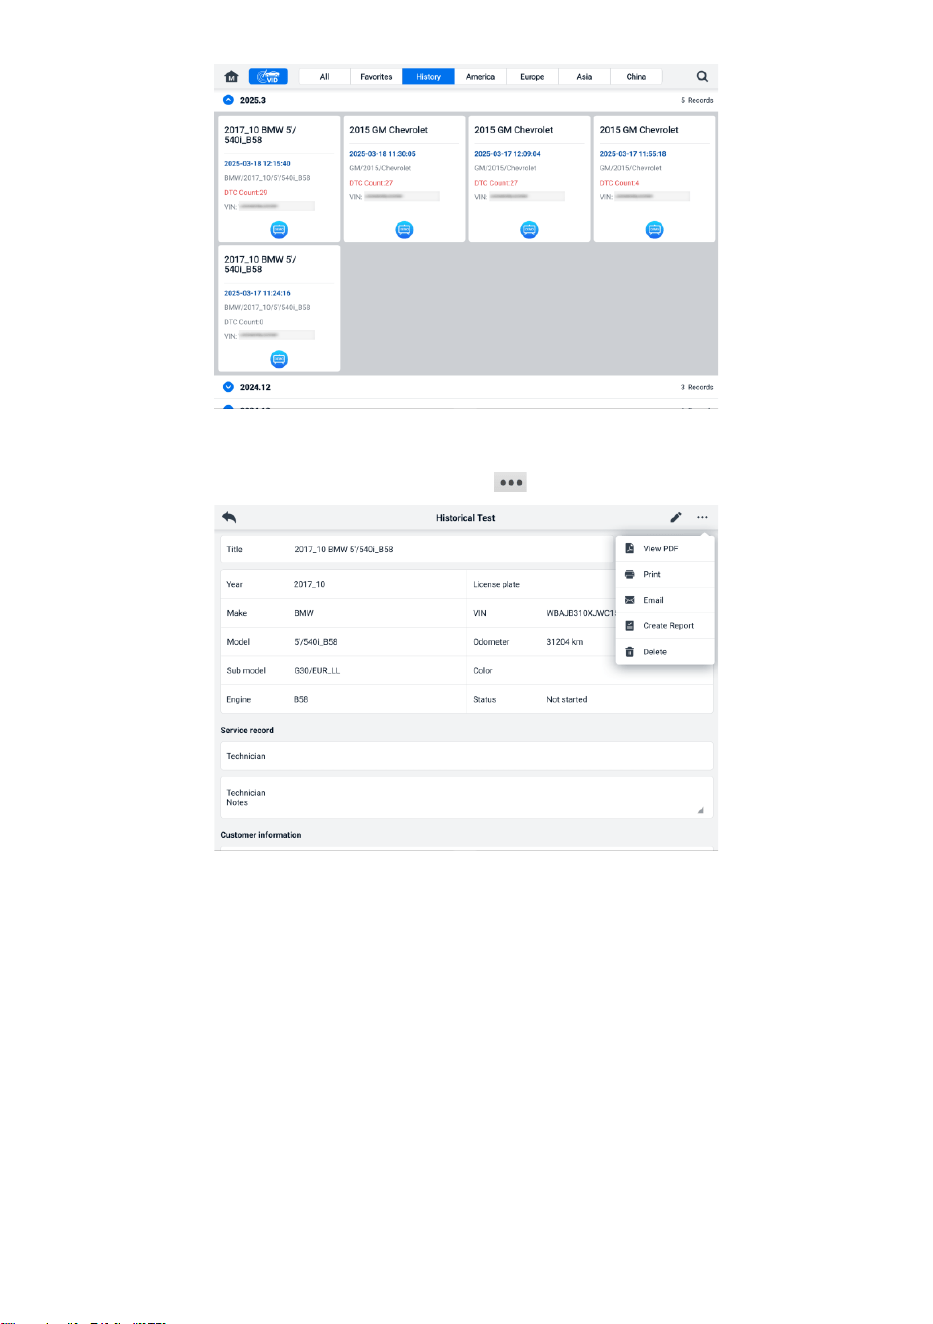
72
Figure 6-30 History Screen
2) Select a history record, and tap the button on the upper-right corner.
Figure 6-31 Historical Test Screen
3) Tap Create Report. Enter the license plate and current mileage. Tap Save.
⚫ Via the Auto Scan function
1) Enter the Auto Scan page and tap Fault Scan from the function buttons at the
bottom of the screen.
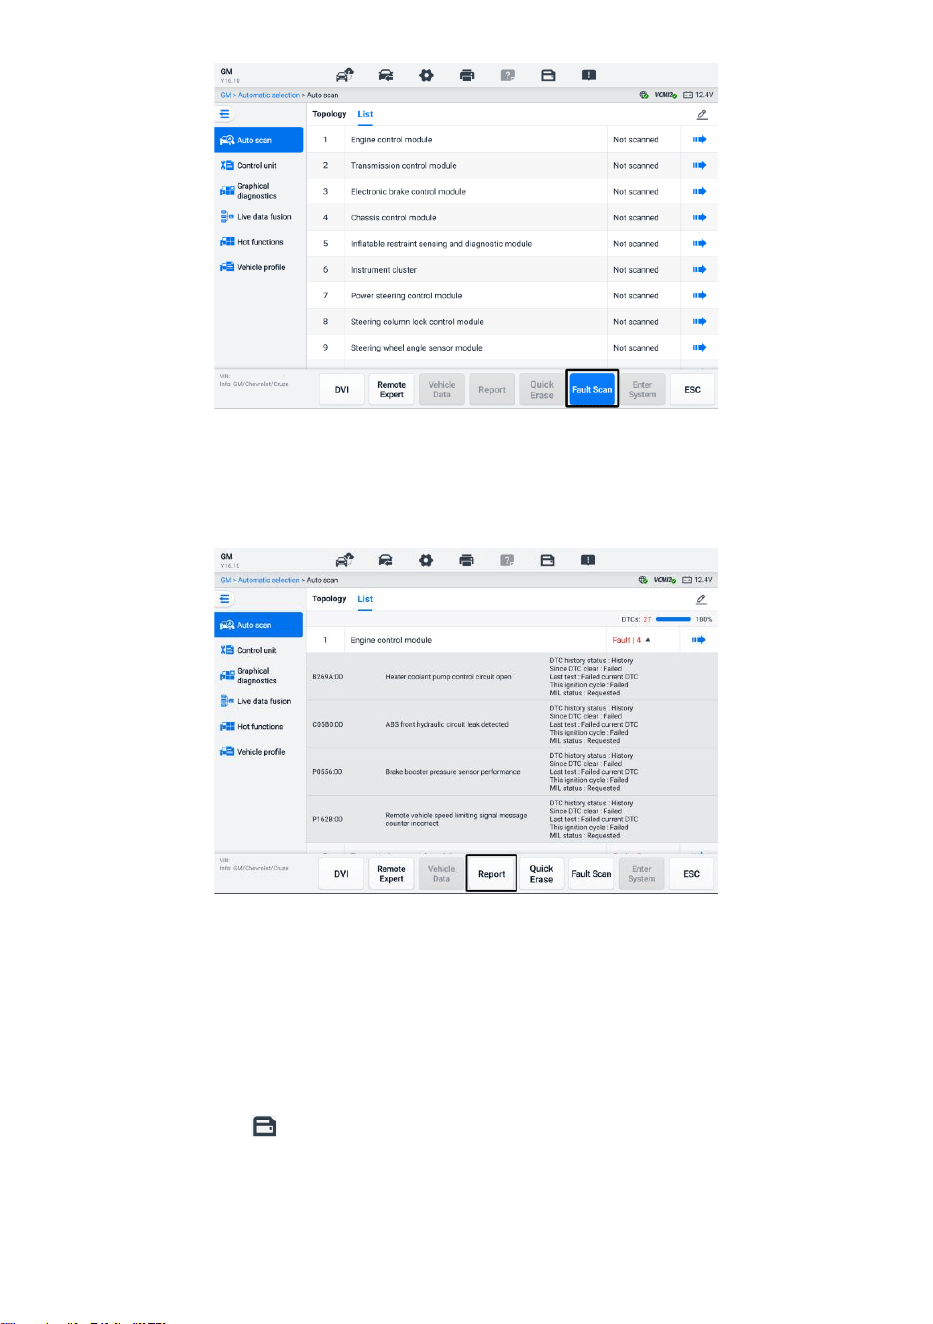
73
Figure 6-32 Auto Scan Screen 1
2) When the system scan is completed, tap Report from the function buttons at
the bottom of the screen. Enter the odometer reading and tap OK.
Figure 6-33 Auto Scan Screen 2
⚫ Via the functions on the diagnostics toolbar
The diagnostic report can also be viewed from diagnostics functions screen
including Auto scan and Trouble codes. There are two ways to view the saved
reports:
Tap the button in the diagnostics toolbar and select Save as PDF. Enter
the odometer reading and then tap Save. Tap the File button on the upper-right
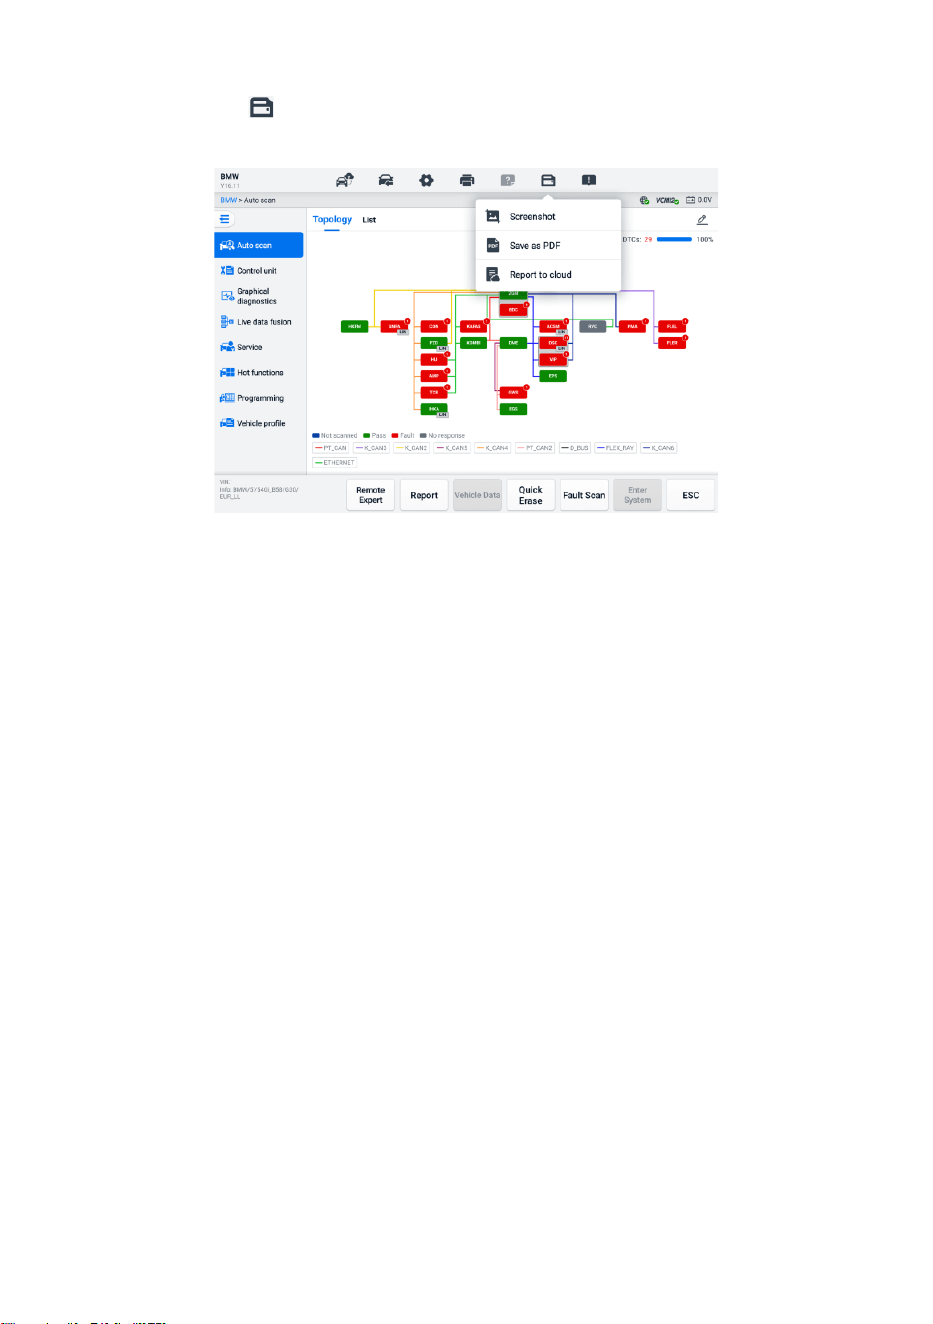
74
corner of the screen and select a saved report to view.
Tap the button in the diagnostics toolbar and select Report to Cloud. Enter
the odometer reading. Tap Save > View Report to view the saved report.
Figure 6-34 Auto Scan Screen
6.11.2.2 Diagnostics Report Viewing
All the saved reports can be viewed in the Data Manger application.
Tap Data Manager > Vehicle History. Select a specific vehicle history record and
then tap View PDF in the upper-right corner to view the report.
Once you save the reports by tapping the Save as PDF button, tap Data Manager >
PDF to view these reports.
Once you save the reports by tapping the Create Report or Report to Cloud button,
tap Data Manager > Cloud Report to view these reports.
6.11.2.3 Diagnostics Report Cloud Sharing
1) Tap Data Manager > Cloud Report to enter the Report List screen.
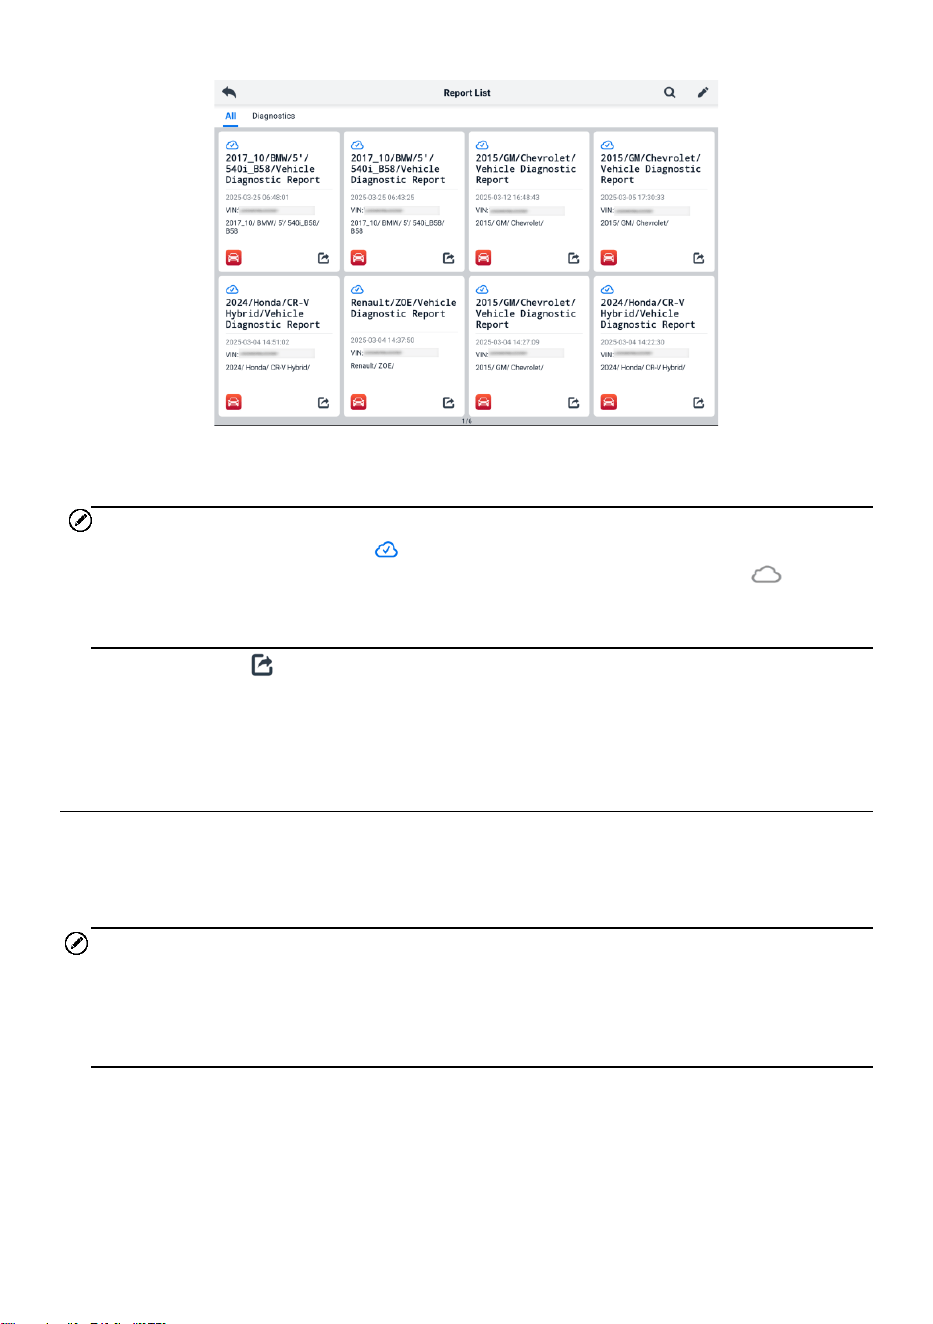
75
Figure 6-35 Report List
NOTE
Note that if the report displays , it means the report has been uploaded to the cloud
successfully, and you can share the report with others; if the report displays , it means
the report has failed to upload to the cloud, but will try to automatically upload to the cloud
when entering the Report again.
2) Tap the on the lower-right corner of the report.
3) There are three ways for report cloud sharing: scan the QR code, send by email,
send by SMS (via phone number).
6.12 Exit Diagnostics
The Diagnostics application operates while communication with the vehicle is still active.
It is important to properly exit from the diagnostics operation screen to stop all
communications with the vehicle before closing the Diagnostics application.
NOTE
Damage to the vehicle electronic control module (ECM) may occur if communication is
disrupted. Ensure all forms of communication link such as data cable, USB cable, and
wireless or wired network, are properly connected throughout the test. Exit all screens
before disconnecting the test cable and power supply.

76
➢ To exit the Diagnostics application
1. On an active diagnostics screen:
1. Tap the Back or ESC button to exit a diagnostic session step by step.
2. Or tap the Vehicle Swap button in the Diagnostics Toolbar to return to the
Vehicle Menu screen.
2. On the vehicle menu screen:
1) Tap the Home button on the Top Toolbar.
2) Or tap the Back button on the Navigation Bar at the bottom of the screen.
3) Or tap the Home button on the Diagnostics Toolbar to exit the application
directly and return to the MaxiSys Job Menu.
NOTE
After exiting the Diagnostics application, the tablet is no longer communicating with the
vehicle and it is safe to open other MaxiSys applications.
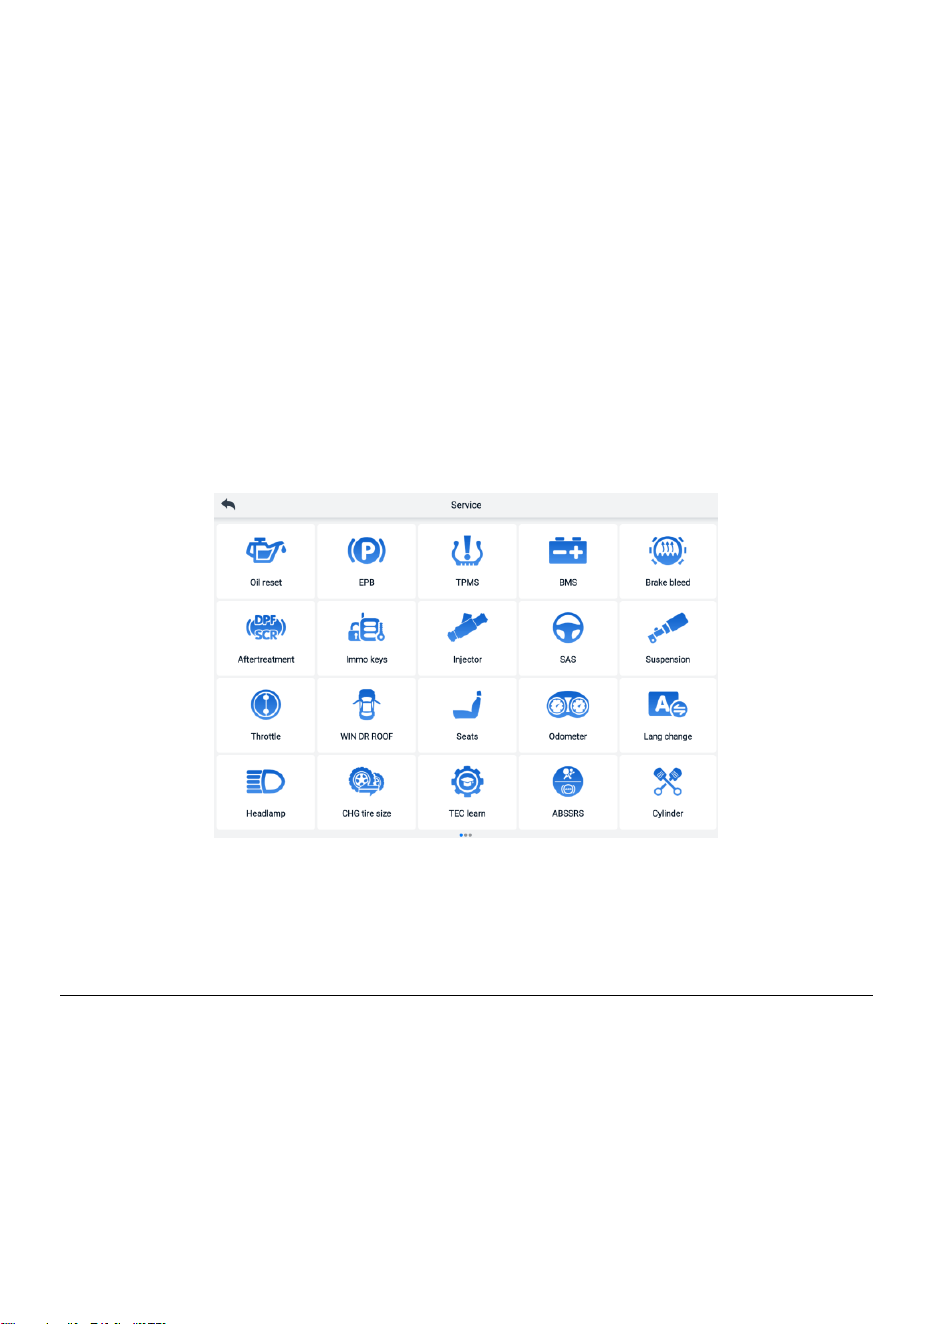
77
7 Service
The Service section is specially designed to provide quick access to the vehicle systems
for various scheduled service and maintenance tasks. The typical service operation
screen is a series of menu-driven executive commands. Follow on-screen instructions to
select appropriate execution options, enter correct values or data, and perform
necessary actions. The application will display detailed instructions to complete selected
service operations.
After entering each special function, the screen will display two application choices:
Diagnosis and Hot Functions. The Diagnosis enables the reading and clearing of codes
which is sometimes necessary after completing certain special functions. Hot Functions
consists of sub-functions of the selected special function.
Figure 7-1 Service Menu
Several most commonly used services are described in this chapter.
7.1 Oil Reset Service
Perform reset for the Engine Oil Life system, which calculates an optimal oil life change
interval depending on the vehicle driving conditions and climate. The Oil Life Reminder
must be reset each time the oil is changed, so the system can calculate when the next
oil change is required.

78
NOTE
1. Always reset the engine oil life to 100% after every oil change.
2. All required work must be carried out before the service indicators are reset. Failure
to do so may result in incorrect service values and cause DTCs to be stored by the
relevant control module.
3. For some vehicles, the scan tool can reset additional service lights such as
maintenance cycle and service interval. On BMW vehicles for example, service
resets include engine oil, spark plugs, front/rear brakes, coolant, particle filter, brake
fluid, micro filter, vehicle inspection, exhaust emission inspection and vehicle checks.
7.2 Electric Parking Brake (EPB) Service
This function has a multitude of usages to maintain the electronic braking system safely
and effectively. The applications include deactivating and activating the brake control
system, assisting with brake fluid control, opening and closing brake pads, and setting
brakes after disc or pad replacement.
7.2.1 EPB Safety
It can be dangerous to perform Electric Parking Brake (EPB) system maintenance, so
before you begin the service work, please keep these rules in mind.
✓ Ensure that you are fully familiar with the braking system and its operation before
commencing any work.
✓ The EPB control system may be required to be deactivated before carrying out any
maintenance/diagnostic work on the brake system. This can be done from the tool
menu.
✓ Only perform maintenance work when the vehicle is stationary and on level ground.
✓ Ensure that the EPB control system is reactivated after the maintenance work has
been completed.
NOTE
Autel accepts no responsibility for any accident or injury arising from the maintenance of
the Electric Parking Brake system.

79
7.3 Tire Pressure Monitoring System (TPMS) Service
This function allows you to quickly look up the tire sensor IDs from the vehicle ECU, as
well as to perform TPMS replacement and reset procedures after tire sensors are
replaced.
7.4 Battery Management System (BMS) Service
The Battery Management System (BMS) allows the tool to evaluate the battery charge
state, monitor the close-circuit current, register the battery replacement, activate the rest
state of the vehicle, and charge the battery via the diagnostic socket.
NOTE
1. This function is not supported by all vehicles.
2. The sub functions and actual test screens of the BMS may vary by vehicle, please
follow the on-screen instructions to make correct option selection.
The vehicle may use either a sealed lead-acid battery or an Absorbed Glass Mat (AGM)
battery. Lead acid battery contains liquid sulphuric acid and can spill when overturned.
AGM battery (known as VRLA battery, valve regulated lead acid) also contains sulphuric
acid, but the acid is contained in glass mats between terminal plates.
It is recommended that the replacement aftermarket battery has the same specifications,
such as capacity and type, as the exiting battery. If the original battery is replaced with a
different type of battery (e.g. a lead-acid battery is replaced with an AGM battery) or a
battery with a different capacity (mAh), the vehicle may require reprogramming of the
new battery type, in addition to, performing the battery reset. Consult the vehicle manual
for additional vehicle-specific information.
7.5 Diesel Particulate Filter (DPF) Service
The Diesel Particulate Filter (DPF) function manages DPF regeneration, DPF component
replacement teach-in and DPF teach-in after replacing the engine control unit.
The ECM monitors driving style and selects a suitable time to employ regeneration.
Vehicles driven a lot at idle speed and low load will attempt to regenerate earlier than
those driven with higher load and speed. For regeneration to take place, a prolonged
high exhaust temperature must be obtained.
In the event of the car being driven in such a way that regeneration is not possible, i.e.,
frequent short journeys, a diagnostic trouble code will eventually be registered in addition
to the DPF light and “Check Engine” indicators displaying. A service regeneration can be
requested in the workshop using the diagnostic tool.

80
Before performing a forced DPF regeneration using the tool, check the following items:
⚫ The fuel light is not on.
⚫ No DPF-relevant faults are stored in system.
⚫ The vehicle has the specified engine oil.
⚫ The oil for diesel is not contaminated.
IMPORTANT
Before diagnosing the problematic vehicle and attempting to perform an emergency
regeneration, it is important to obtain a full diagnostic log and read out relevant measured
value blocks.
NOTE
1. The DPF will not regenerate if the engine management light is on, or there is a faulty
EGR valve.
2. The ECU must be re-adapted when replacing the DPF and when topping up the fuel
additive Eolys.
3. If the vehicle needs to be driven in order to perform a DPF service, a second person
is needed for the function. One person should drive the vehicle while the other person
observes the screen on the Tool. Do not attempt to drive and observe the scan tool at
the same time. This is dangerous and puts your life and the lives of other motors and
pedestrians at risk.
7.6 Steering Angle Sensor (SAS) Service
SAS Calibration permanently stores the current steering wheel position as the straight-
ahead position in the SAS EEPROM. Therefore, the front wheels and the steering wheel
must be set exactly to the straight-ahead position before calibration. In addition, the VIN
is also read from the instrument cluster and stored permanently in the SAS EEPROM.
On successful completion of calibration, the SAS fault memory is automatically cleared.
Calibration must always be carried out after the following operations:
⚫ Steering wheel replacement
⚫ SAS replacement
⚫ Any maintenance that involves opening the connector hub from the SAS to the
column
⚫ Any maintenance or repair work on the steering linkage, steering gear or other
related mechanism

81
⚫ Wheel alignment or wheel track adjustment
⚫ Accident repairs where damage to the SAS or assembly, or any part of the steering
system may have occurred.
NOTE
1. Autel accepts no responsibility for any accident or injury arising from servicing the
SAS system. When interpreting DTCs retrieved from the vehicle, always follow the
manufacturer's recommendation for repair.
2. All software screens shown in this manual are examples, and actual test screens may
vary by test vehicle. Pay attention to the menu titles and onscreen instructions to
make correct option selections.
3. Before starting procedure, make sure the vehicle has an ESC button. Look for button
on dash.

82
8 ADAS
Advanced Driver Assistance Systems (ADAS) are an array of vehicle systems that aid
the driver either through passive alerts or by active control of the vehicle to drive safer
and with greater awareness and precision.
Cameras, sensors, ultrasound, radar and LIDAR are some of the systems used to
capture the driving environment data, including travelling or static vehicles position,
pedestrian location, road sign, driving lane and intersection detection, road (curves) and
driving conditions (poor visibility or evening driving), use that information to instruct the
vehicle to take its predetermined action. Cameras, sensors, and sensing systems are
typically located in front and rear bumpers, windshield, front grill, and side and rearview
mirrors.
Autel ADAS Calibration Tool provides comprehensive and precise ADAS calibration.
1. Covers many vehicle manufacturers, including Benz, BMW, Audi, Volkswagen,
Porsche, Infiniti, Lexus, GM, Ford, Volvo, Toyota, Nissan, Honda, Hyundai, Kia, etc.
2. Supports the calibration of multiple driver assistant systems, including Adaptive.
Cruise Control (ACC), Night Vision System (NVS), Lane Departure Warning (LDW),
Blind Spot Detection (BSD), Around View Monitoring (AVM), Rear Collision Warning
(RCW), Heads-up Displays (HUD), etc.
3. Supplies graphic illustrations and step-by-step instructions.
4. Provides demos to guide the technician through the calibration.
Figure 8-1 ADAS Introduction Screen

83
9 Measurement
The Measurement application can provide all the features needed for performing
electrical and electronic circuit tests as well as monitoring signal activities on today's
vehicles.
After properly connecting with a test vehicle and communicating with MaxiSys tablet, the
VCMI2 (Vehicle Communication and Measurement Interface 2) is used as an integrated
device that functions as an oscilloscope, a waveform generator, a multimeter, and a CAN
bus inspection.
9.1 Oscilloscope
An oscilloscope is a measuring instrument that shows how a signal varies with time in a
graphical way. Various signal activities can be displayed and monitored on a two-
dimensional grid. The graphical form created by a signal is called a waveform. The
voltage-time characteristic of the signal or waveform is drawn as a visual line called the
trace.
9.1.1 Safety Information
Follow these instructions below to reduce the risk of injury from electric shock and
prevent equipment damage.
A. Maximum input ranges
Observe all terminal ratings and warnings marked on the product.
DANGER
⚫ To prevent electric shock, take all necessary safety precautions when working on
equipment where voltages beyond the specified input range may exists. Contact with
voltages outside of the specified measuring range presents a risk of electric shock.
⚫ To prevent injury or death, the oscilloscope must not be directly connected to the
battery. To measure battery voltages, use a differential isolating probe specifically
rated for battery use.
WARNING
Operation outside of the safe input range is likely to cause permanent damage to the
oscilloscope and other connected equipment.

84
B. Grounding
DANGER
⚫ The scope's ground connection through the USB cable is for measurement purposes
only. The oscilloscope does not have a protective safety ground.
⚫ Do not connect the ground input (chassis) to any electrical power source. To prevent
personal injury or death, use a voltmeter to check that there is no significant AC or
DC voltage between the oscilloscope ground and the point to which you intend to
connect the ground input.
WARNING
⚫ Applying a voltage to the ground input is likely to cause permanent damage to the
oscilloscope, the attached computer, and other equipment.
⚫ To prevent measurement errors caused by poor grounding, always use the high-
quality USB cable supplied with the oscilloscope or Wi-Fi connection.
C. External connections
DANGER
To prevent injury or death, use only the power cord and adaptor supplied with the product.
D. Environment
DANGER
To prevent injury or death, do not use the product in wet or damp conditions, or around
explosive gas or vapor.
WARNING
To prevent any damage, always use and store your oscilloscope in appropriate
environment.
E. Product Maintenance
The product contains no user-repairable parts. Repair, servicing, and calibration require
specialized test equipment and must be performed by Autel Tech Support or an approved
service provider.
DANGER
To prevent injury or death, do not use the product if it appears to be damaged in any way.
Stop using the product when any abnormal operations occur.
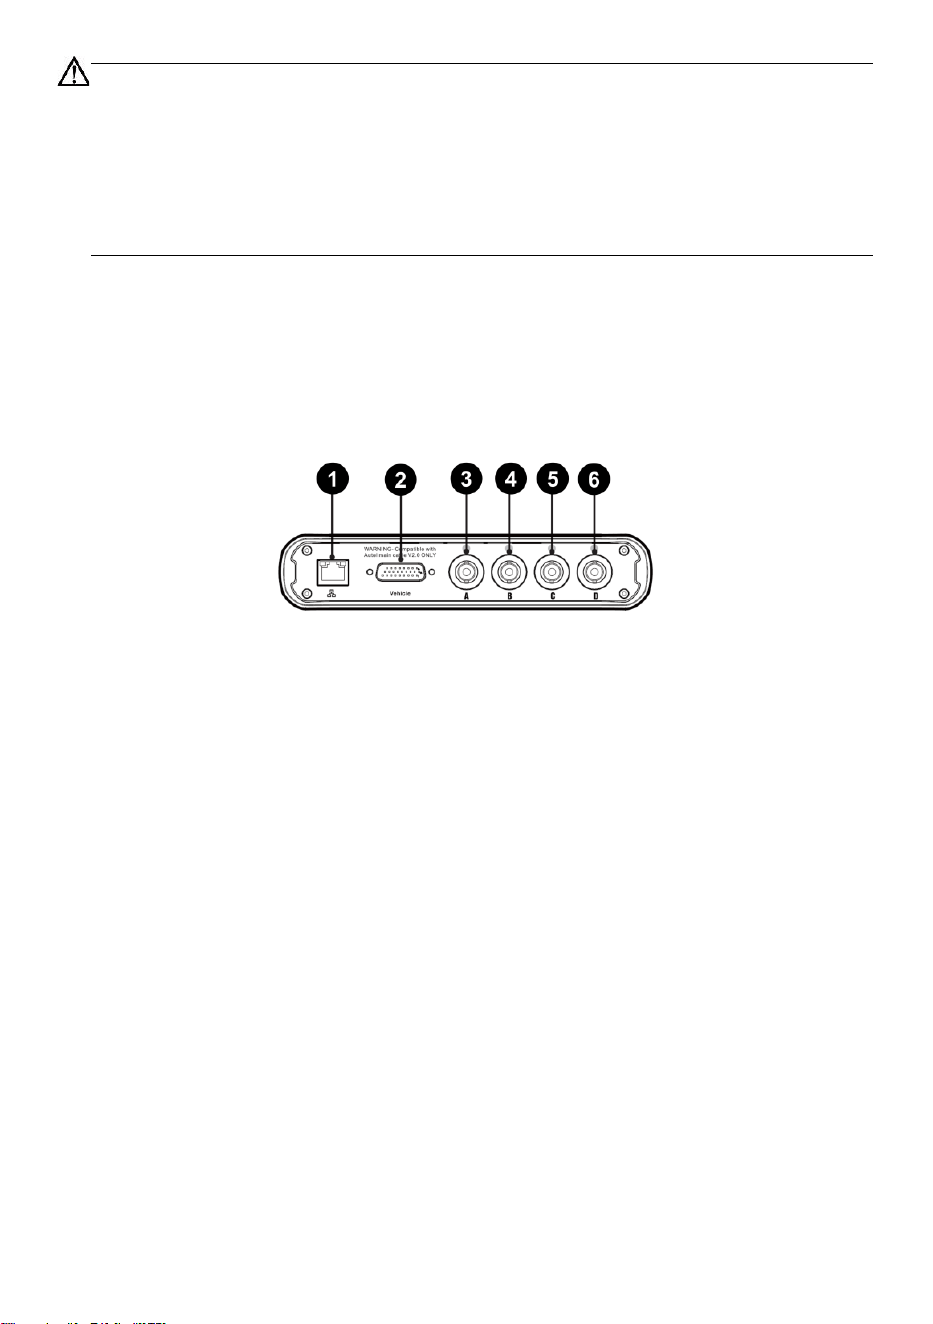
85
WARNING
⚫ Do not tamper with or disassemble the oscilloscope, connectors or accessories.
Internal damage will affect performance.
⚫ Do not block any of the instrument's air vents to avoid damage caused by
overheating.
⚫ When cleaning the oscilloscope, use wet soft cloth with mild detergent in water. Do
not allow water to enter the oscilloscope casing.
9.1.2 General Introduction
9.1.2.1 Component Locations
The input channels are located at the bottom of the VCMI2 and are compatible with many
test leads and probes.
1. Ethernet Connector — Connects to RJ45 Network Cable
2. Vehicle Data Connector — Connects to the vehicle DLC using the provided Main
Cable.
3. Input Channel A
4. Input Channel B
5. Input Channel C
6. Input Channel D
The oscilloscope LED is located on the front panel of the VCMI2. When the VCMI2 is
properly connected and powered on, the oscilloscope LED flashes green when operating
in the oscilloscope mode.
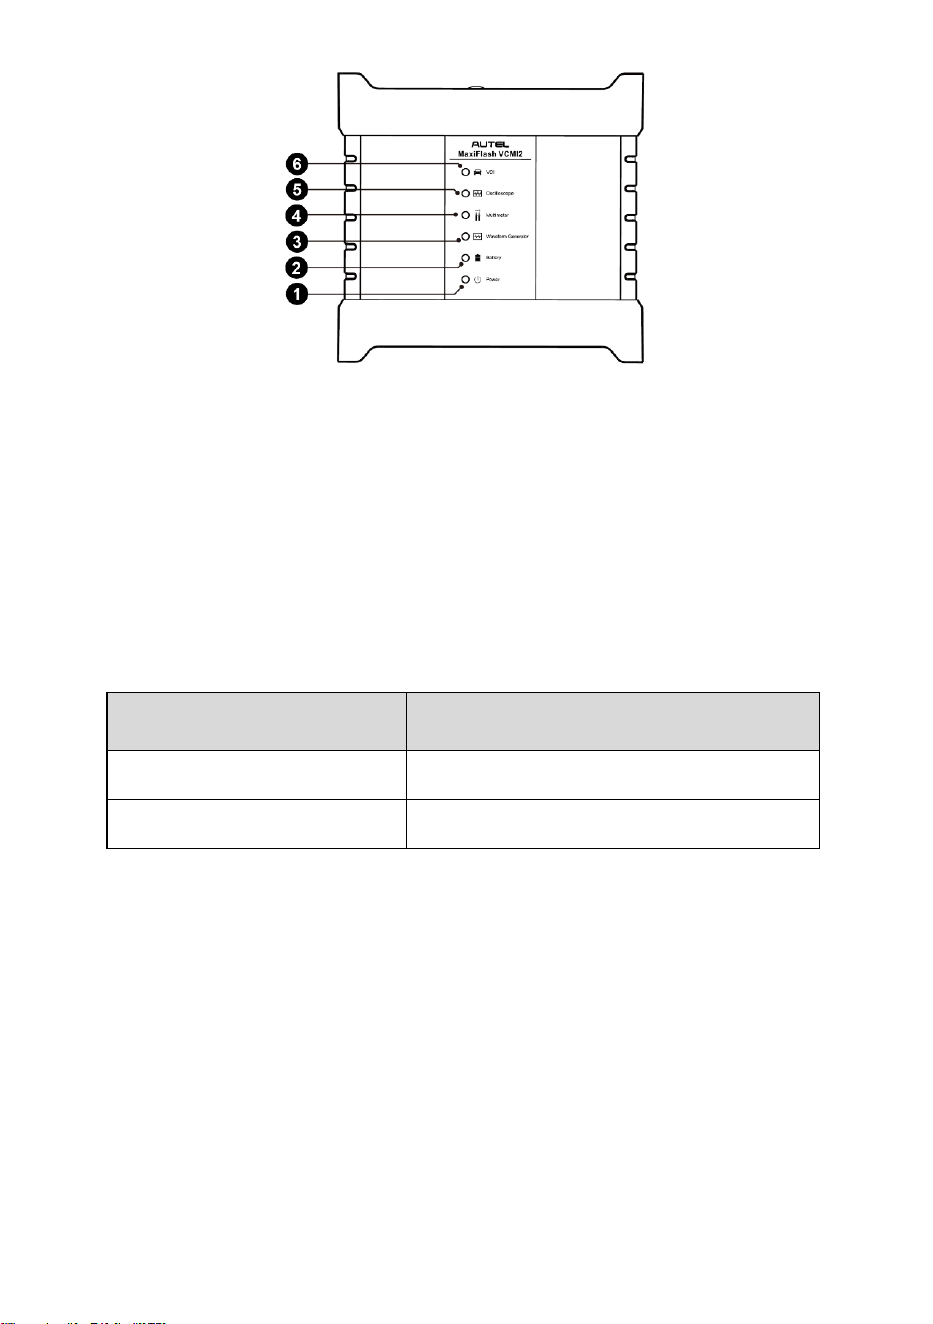
86
1. Power LED
2. Battery LED
3. Waveform Generator LED
4. Multimeter LED
5. Oscilloscope LED
6. Vehicle LED
9.1.2.2 Technical Specifications
Table 9-1 Technical Specifications
Item
Description
Channels
4
Bandwidth
20 MHz

87
Item
Description
Maximum Sample Rate
⚫ 1 or 2 channels: 80 MS/s*
⚫ 3 or 4 channels: 20 MS/s*
*
MS/s = mega samples per second
1) Select arbitrary one channel, the
maximum sample rate is 80 MS/s.
2) Select two channels (AC, BC, AD, or
BD), the maximum sample rate is also
80MS/s.
3) Select two channels (AB/CD) or more
than three channels, the maximum
sample rate is 20 MS/s.
Input Ranges (Full Scale)
±50 mV to ±200 V
Sensitivity
10 mV/div to 40 V/div
Input Coupling
AC/DC
Input Impedance
1 MΩ in parallel with 25 pF
Vertical Resolution
12 bits
Buffer Memory
32M samples shared among active
channels
Time Base Ranges
100 ns/div to 1000 s/div
Connection
⚫ USB 2.0
⚫
Wi-Fi
Max. Wi-Fi Transmission
Distance
Up to 98 ft.
DC Accuracy
±1 % of full scale
Storage Humidity Range
5 to 95 % RH, non-condensing
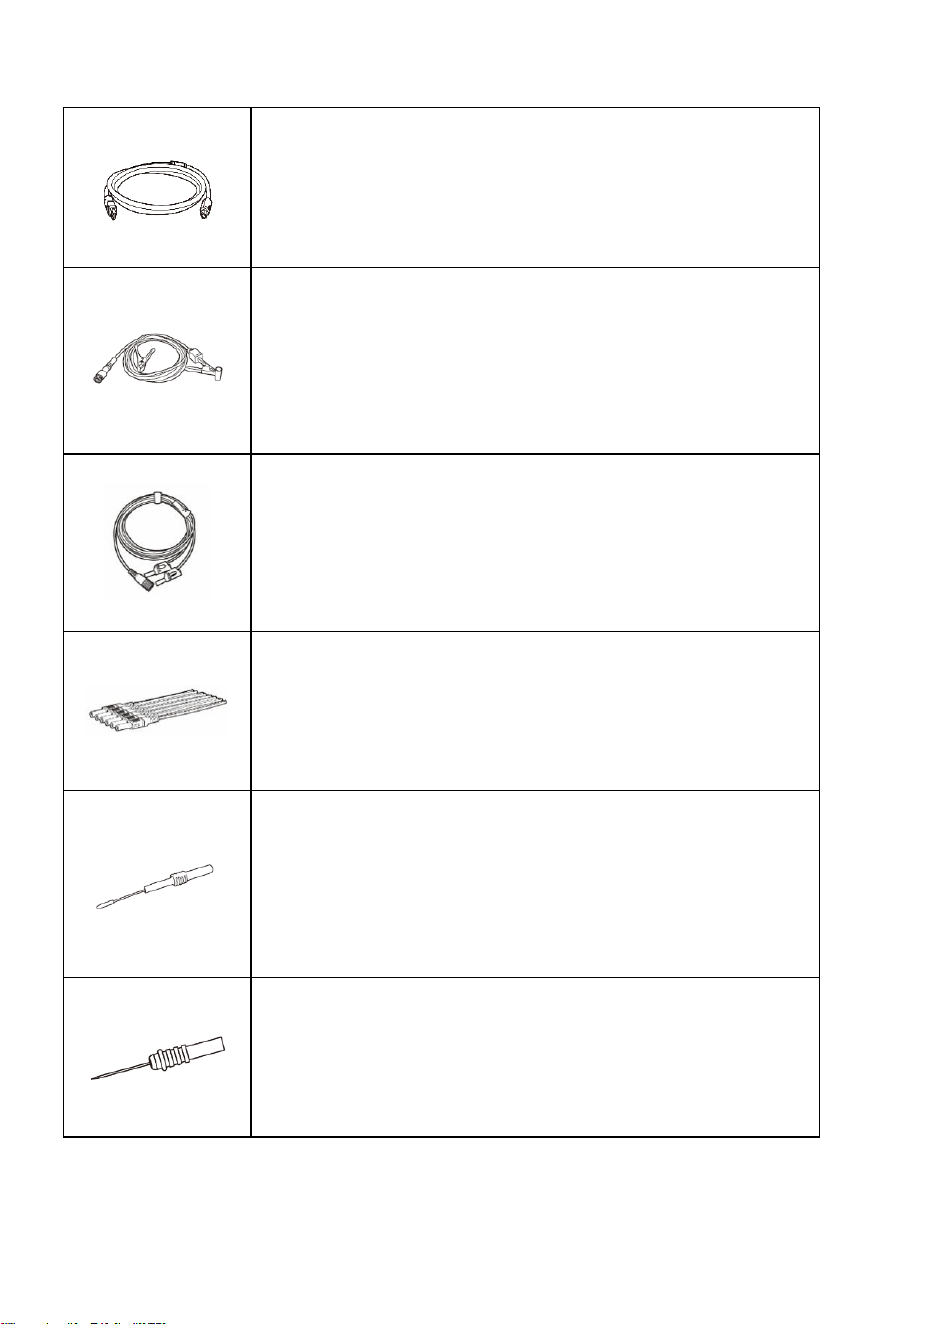
88
9.1.2.3 Accessories
Autel USB Cable V2 (the V2 icon can be seen on the cable)
(SA001)
Connects the oscilloscope to the tablet to ensure reliable
signal transmission.
Secondary Ignition Pickup (SA273)
The BNC connector is connected to the oscilloscope to
measure the secondary ignition voltage of conventional
ignition systems and most HEI (High Energy Ignition) and DIS
(Distributorless Ignition) systems.
Scope Test Lead
(Red: SA005, Green: SA006, Blue: SA007, Yellow: SA008)
The BNC connector is connected to the oscilloscope, and the
4mm banana plug is connected to various probes.
Breakout Lead (SA151)
Enables easy access to existing automotive wiring harness
connectors for obtaining signals of various sensors. Four sizes
are available: 0.6 mm, 1.5 mm, 2.3 mm and 2.8 mm.
Flexible Back-pinning Probe (Red: SA053, Black: SA054)
Designed for back-probing under the insulation of multi-plug
terminals to detect the signal of the test component. The
flexible part can be bent and access to difficult areas. The
probe tip is not replaceable.
Back-pinning Probe Set (SA051)
Designed for back-probing under the insulation of plugs to pick
up the signal of the test component. The probe tip is
replaceable.
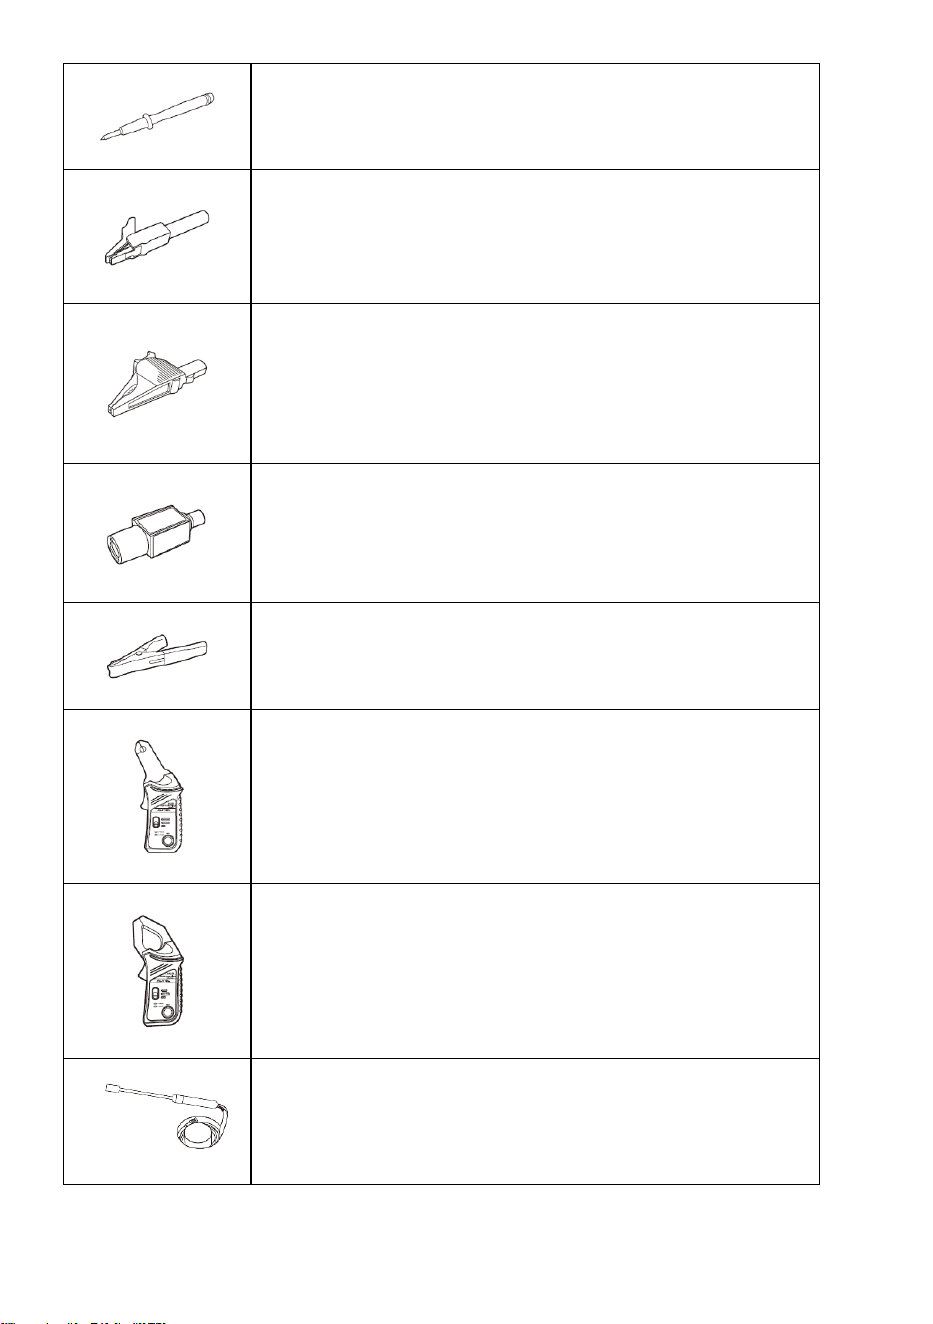
89
Multimeter Probe (Red: SA055, Black: SA056)
Designed for connecting exposed wires or terminals.
Small Alligator Clips (Red: SA057, Black: SA058)
Used to connect exposed wires or terminals. SA059 (red) and
SA060 (black) for larger terminals.
Large Dolphin Clips (Red: SA059, Black: SA060)
Used to connect exposed wires or terminals, including battery
terminals. SA057 (red) and SA058 (black) for smaller
terminals.
Attenuators 20:1 (SA020)
Passive 20:1 attenuator, can output 1V when inputting a 20V
signal.
Battery Clip (Optional) (Red: SA061, Black: SA062)
Dedicated to connecting car battery terminals.
65A AC/DC Current Clamp (Optional) (SA253)
Used to measure AC or DC currents up to 65A. Two scales are
available: 1mV/10mA for 10mA to 20A, 1mV/100mA for 10mA
to 65A.
650A AC/DC Current Clamp (Optional) (SA256)
Used to measure AC or DC currents up to 650A. Two scales
are available: 1mV/100mA for 100mA to 200A, 1mV/1A for
100mA to 650A.
Coil On Plug (COP) Probe (Optional) (SA271)
Used with the oscilloscope to measure the secondary ignition
voltage of COP.
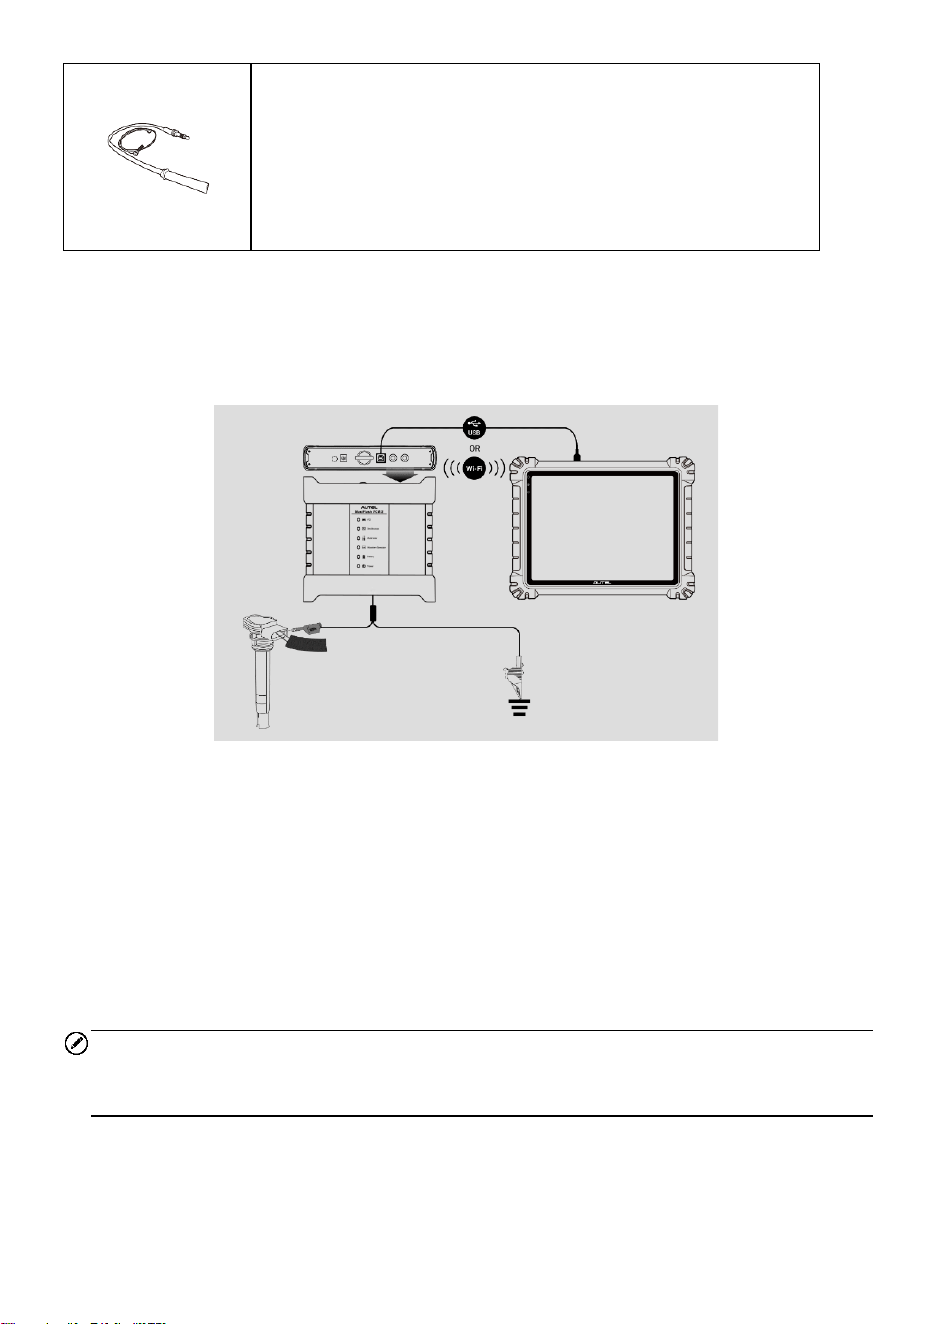
90
HT Extension Lead (Optional) (SA275)
Fit the HT extension leads between the coil pack and the plugs
of the independent ignition system (COP), and then place the
(SA273) secondary ignition pickup on each lead to obtain the
secondary ignition voltage.
9.1.3 Getting Started
Before opening the Oscilloscope application, the VCMI2 must be connected to the tablet
via the provided USB cable or Wi-Fi network.
Figure 9-1 Connection Diagram
➢ To open the oscilloscope application
1. Insert the applicable test lead or probe terminal ends into the input channel(s)
to complete the connection. (See Figure 9-1 Connection Diagram.)
2. Tap the Measurement icon on the MaxiSys Job Menu. The Measurement
screen opens.
3. Tap the Oscilloscope icon to open the oscilloscope menu.
4. Select a desired testing option to continue.
NOTE
Please check the oscilloscope LED status indicator on the front panel of VCMI2. The
oscilloscope LED flashes green when operating in the oscilloscope mode.
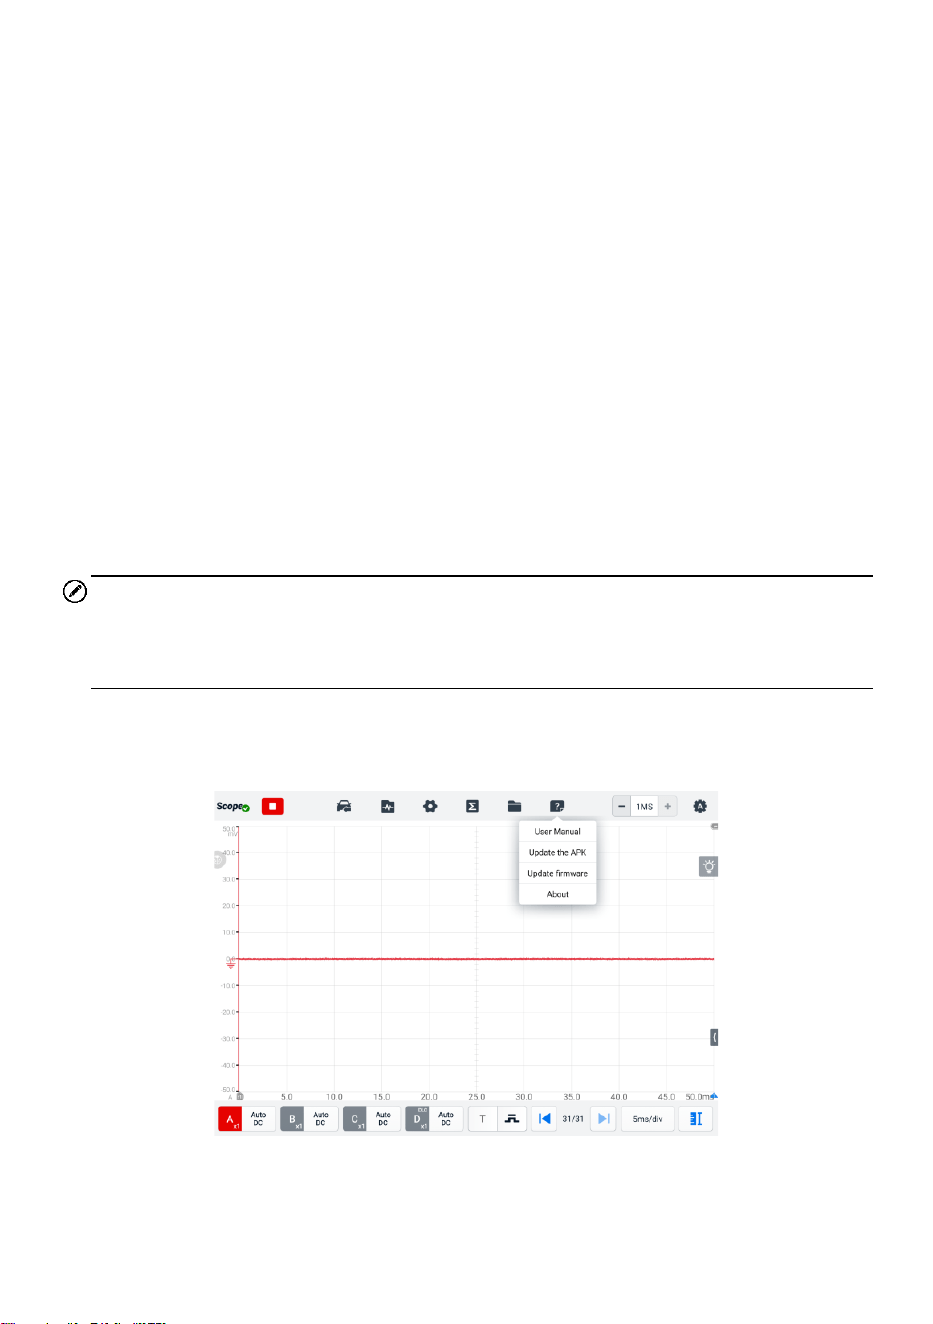
91
9.1.3.1 Message Prompt
A message showing "Are you sure to open the waveform of Demo mode?" displays after
tapping the Oscilloscope icon and opening the oscilloscope menu. Please tap OK to
enter the demo mode or tap Cancel to exit.
A message showing "Are you sure to open the waveform data?" also displays after the
tablet and the VCMI2 connect successfully. Please tap OK to display the actual waveform
or tap Cancel to exit.
9.1.4 Oscilloscope Update
The operating software for the oscilloscope is regularly updated. Tap the Help button in
the upper toolbar and then tap the Update the APK button in the dropdown list to update
the software.
Before updating the oscilloscope's software, please make sure the tablet has a stable
Internet connection.
9.1.4.1 APK Update
NOTE
The acronym APK (Android Package Kit) is used on the tablet and in this manual. An
APK file contains all the assets of a particular app. Updating an APK means to install the
latest version of the app on your tablet.
➢ To update the APK
1. Tap the Help button on the upper toolbar of the screen. A dropdown menu
displays. Tap Update the APK in the dropdown menu.
Figure 9-2 Help Screen
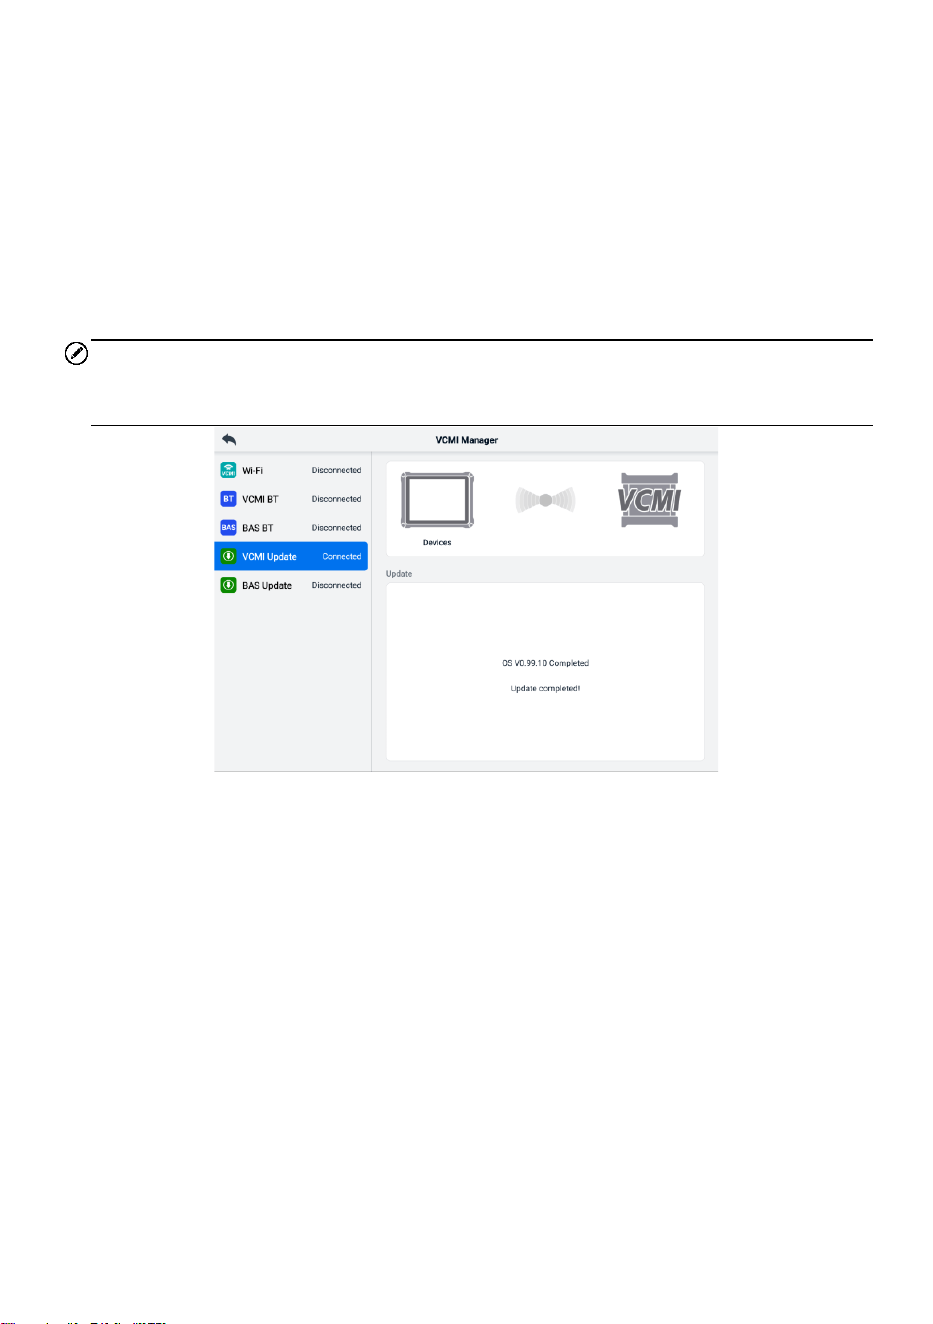
92
2. A confirmation message will display.
3. Tap OK to update the software or tap Cancel to exit.
9.1.4.2 Firmware Update
➢ To update the firmware
1. Tap the Help button on the upper toolbar of the screen. A dropdown menu
displays. (See Figure 9-2 Help Screen.)
2. Tap Update Firmware in the dropdown list. The screen will switch to the Update
section in the VCMI Management application.
NOTE
Please disconnect the MaxiScope from the VCMI2 before update. A message displays,
and tap OK to confirm that you have disconnected the MaxiScope from the VCMI2.
Figure 9-3 Firmware Update Screen
3. If the installed version is not the latest available, the current version and the
latest version of the OS, firmware, and scope firmware will appear. Tap Update
Now to update. Please do not leave the update page during upgrading. It takes
about 5–15 minutes for the whole process to complete.
9.1.5 Screen Layout and Operations
The Oscilloscope application measures changing voltages of an electrical system over a
period of time. This signal is depicted as a shape. The grid on the screen shows divisions
of voltage and time to enable measurements to be made.
Tap the Measurement icon on the MaxiSys Job Menu screen then select Oscilloscope
in the menu, the oscilloscope page displays. The screen typically includes the following
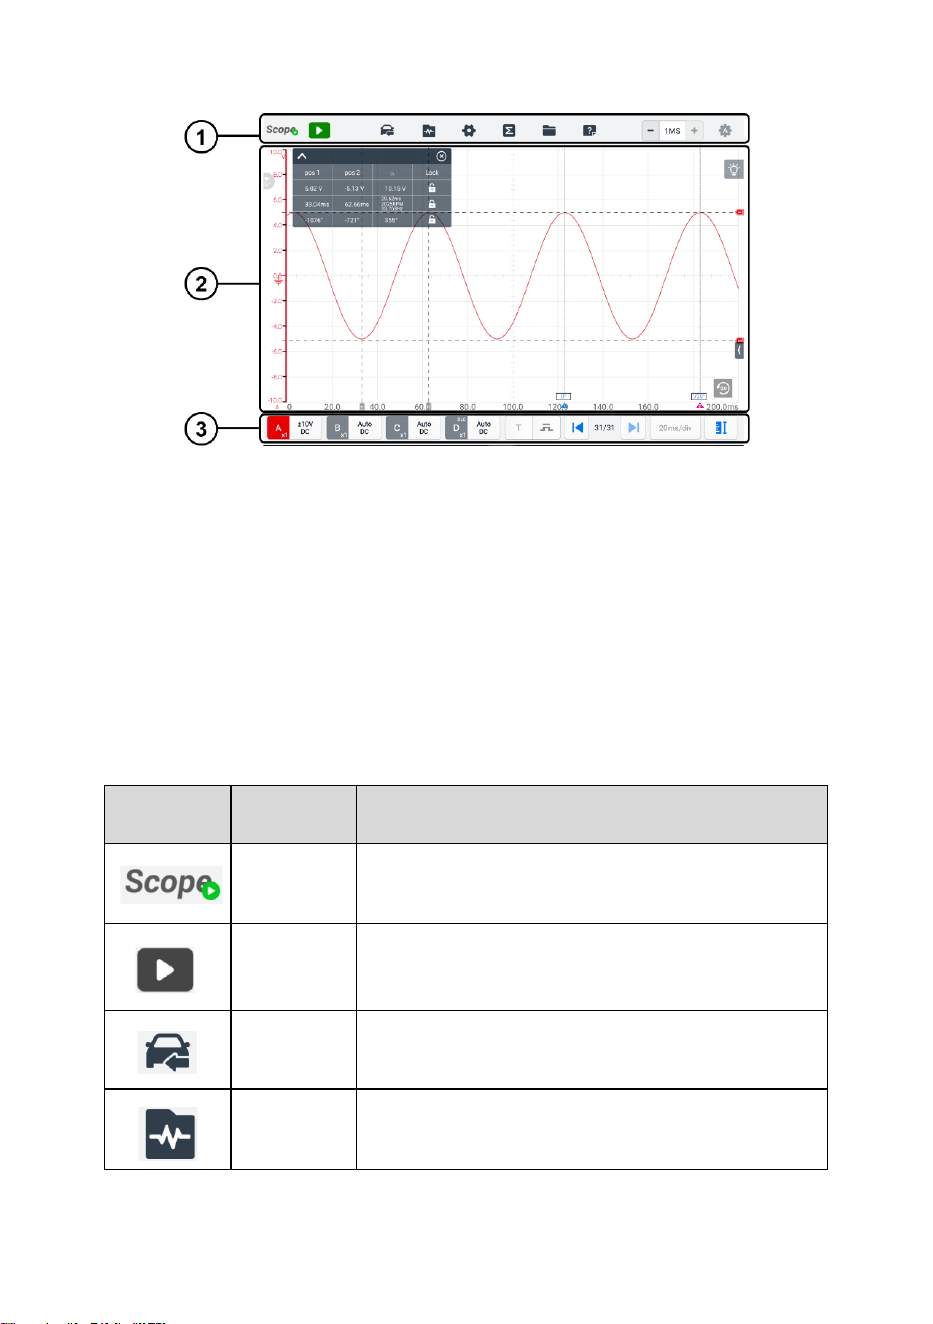
93
sections.
Figure 9-4 Oscilloscope Menu Screen
1. Upper Toolbar
2. Main Section
3. Lower Toolbar
9.1.5.1 Upper Toolbar
The upper toolbar is used for configurations of various settings and operations. The
following table provides brief descriptions of each button.
Table 9-2 Upper Toolbar
Button
Name
Description
Scope
Icon
Indicates the oscilloscope connection status.
Start/Stop
Start or stop the oscilloscope device.
Presets
Access preset guide. Select preset to correctly
configure oscilloscope to capture a waveform of the
specified type.
Waveform
Library
Search, upload, share, open, load as reference
waveform, and follow the waveforms in the
waveform library.
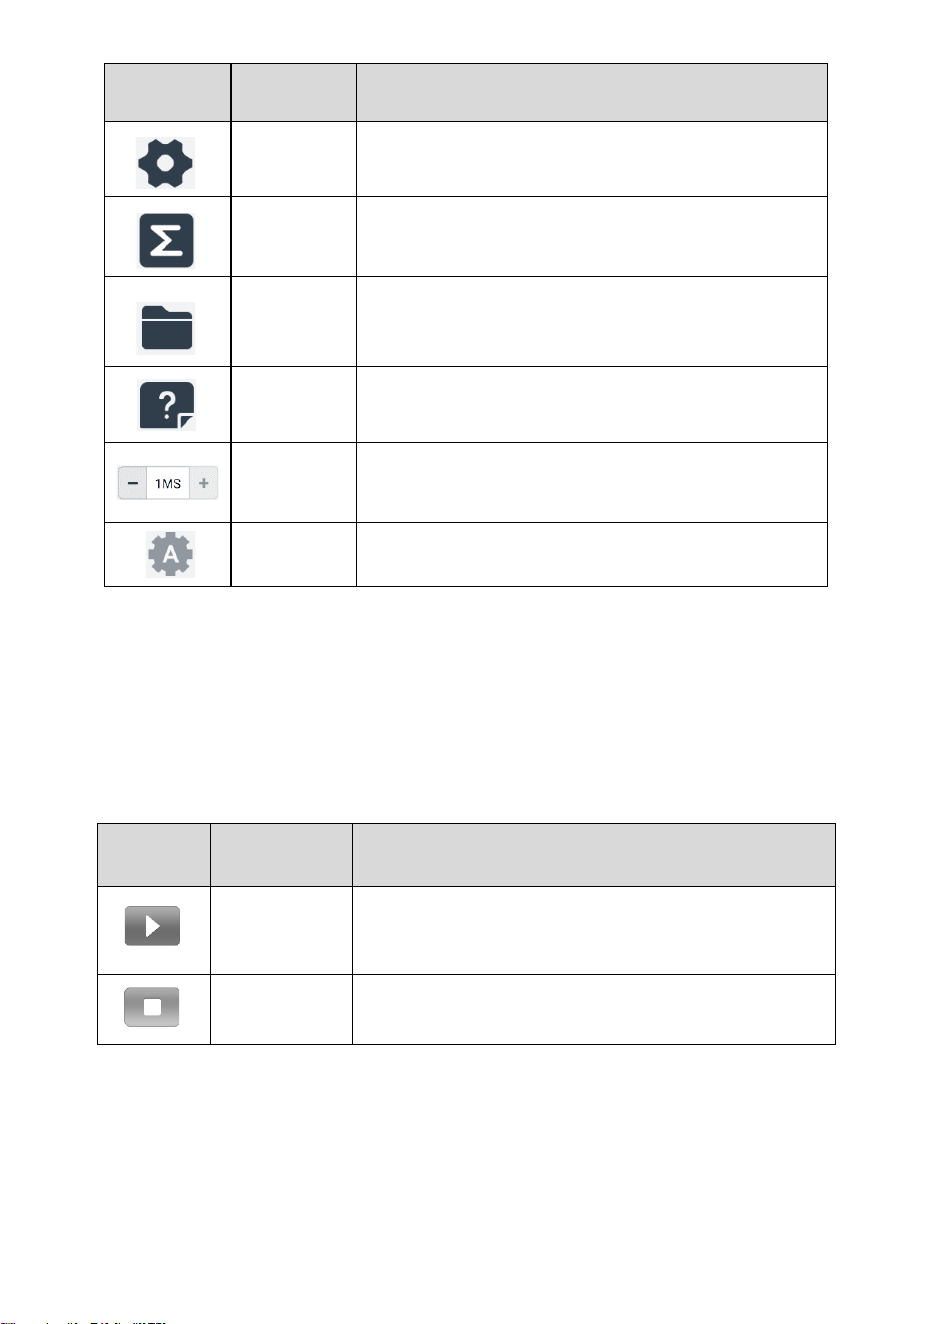
94
Button
Name
Description
Settings
Configurations of mode setting, waveform
generator, decoding setting, startup setting, and
demo setting.
Math
Channel
Tap to display the math channel on the screen.
File
Print, open, save, delete the waveform data or
upload the waveform to waveform library.
Moreover, save, import the configuration and open
the recent documents.
Help
View the user manual, update the APK
(oscilloscope software) and firmware.
Number of
Samples
Set the maximum number of samples that will be
captured on each channel.
Auto Scale
Set the appropriate amplitude range to display the
signal correctly.
⚫ Scope Icon
This icon displays the oscilloscope connection status. A green check mark means
the tablet and oscilloscope are connected successfully; a red “X” means the tablet
and the scope are not connected.
⚫ Start/Stop Button
Tap the Start/Stop Button icon to start or stop the oscilloscope device.
Button
Name
Description
Start
Tap to start the oscilloscope and initiate sampling.
Stop
Tap to stop the oscilloscope and terminate sampling.
⚫ Presets Menu
Tap the vehicle icon button in the top navigation bar to enter the Presets Menu. This
menu offers a wide variety of preset guided information for you to view.

95
The frequently used test components and options are listed in the Presets menu:
Actuators — test the common car actuators such as injectors, fuel pumps, and
canister purge solenoids.
Battery Charging — test the functions related to car charging, including current
and voltage idle test.
Combination Test — combined test of the vehicle's sensors or actuators, such
as the crankshaft position sensor and camshaft position sensor test; the primary
ignition and crankshaft position test; the throttle position sensor and front
oxygen sensor test.
Data Communication — test the vehicle communication buses including CAN-
bus, LIN-bus, and K-Line.
Engine Starting — Test the functions related to car starting, including starting
current and voltage test.
Ignition Systems — test the ignition process of the vehicle, including the
voltage and current test of the primary and secondary ignition.
Sensors — test the common car sensors such as oxygen sensors, camshaft
sensors, and crankshaft sensors.
NOTE
Do not connect to HV control signal such as the ignition control wire. It may cause the
damage to the product. The measured voltage value during the actuator test may be
different from the actual value.
➢ To use the Presets menu
1. Tap the Presets button in the upper toolbar. A submenu opens.
2. Tap the desired test component or option in the left column.
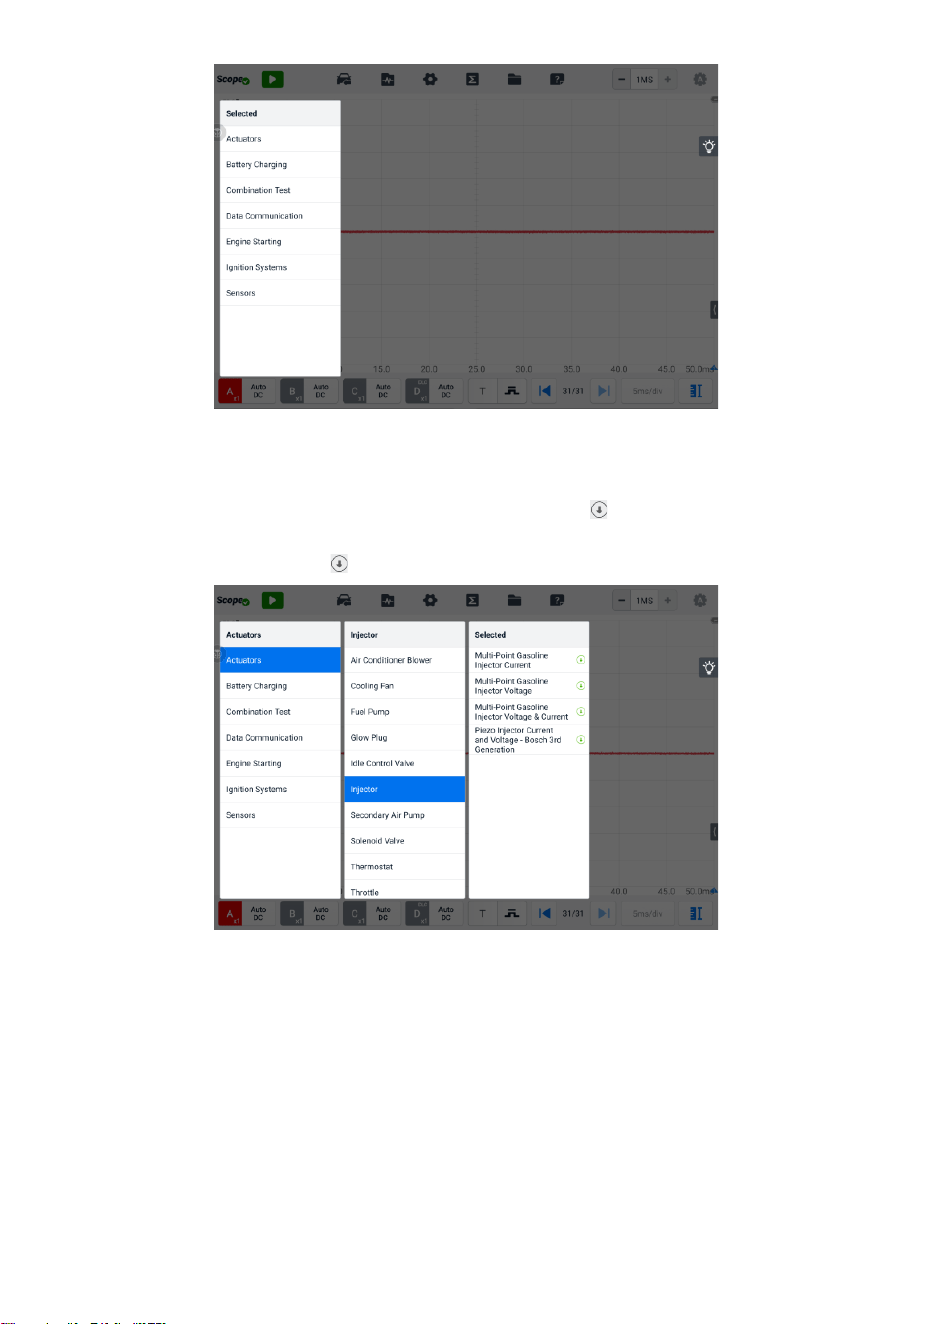
96
Figure 9-5 Presets Menu Screen 1
3. Tap an option you need from the submenu, and if there is no preset case or the
version of the preset case is too low, tap the button to download the new
preset case you need. If the current preset case is already a new version, the
download button will not be displayed.
Figure 9-6 Presets Menu Screen 2
4. View the preset guided information. A reference signal waveform displays (an
injector selection is used here as an example) on the main section and the
preset guided information on the right side of the screen.
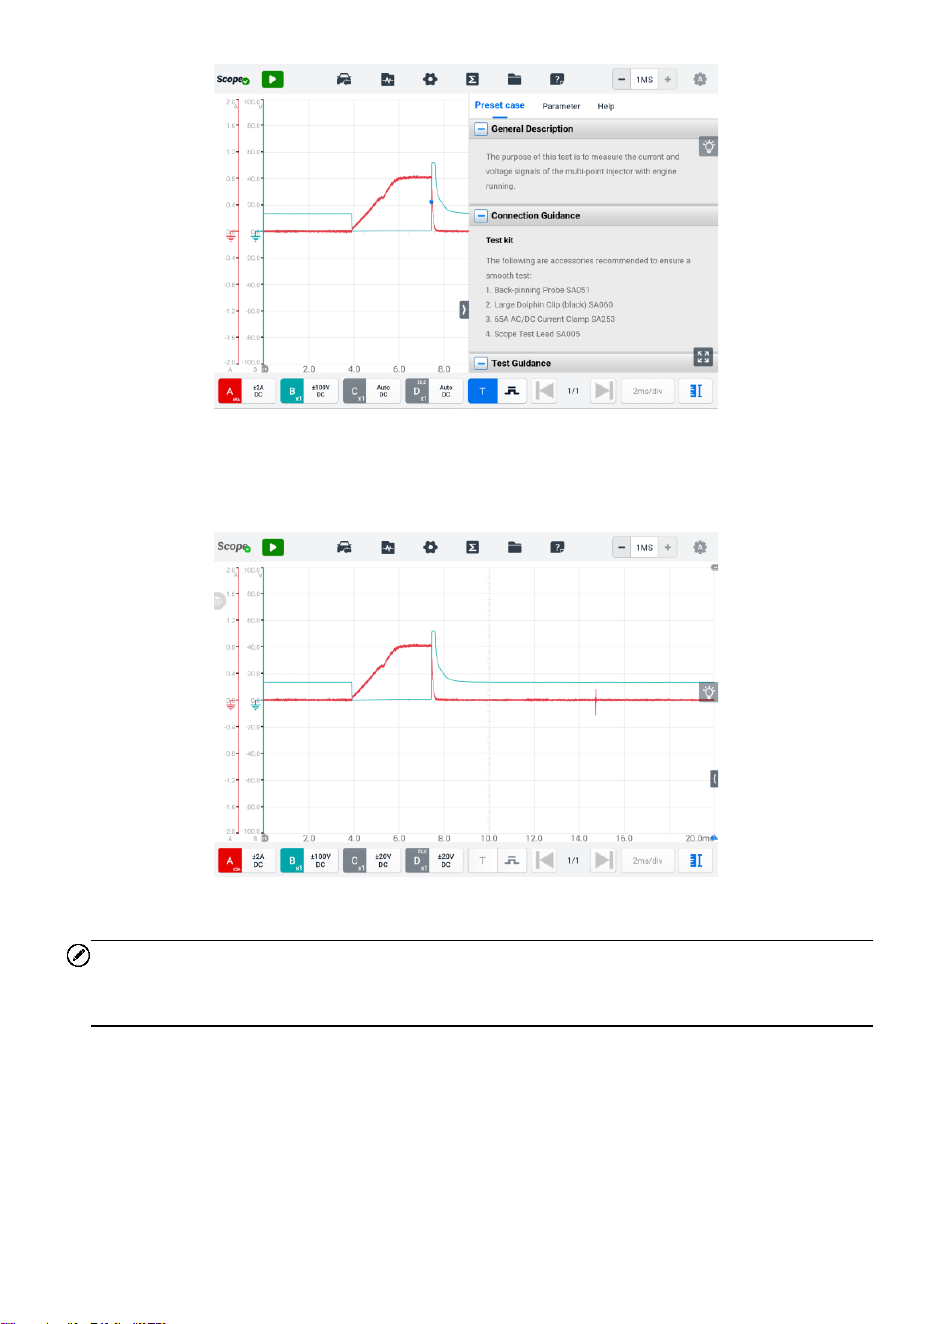
97
Figure 9-7 Presets Display Screen
5. Tap the arrow button to hide the preset guided information and display the
waveform.
Figure 9-8 Reference Signal Waveform Display
NOTE
Parameter values such as the ranges of voltage and time divisions are automatically set
for presets.
6. Tap the four-directional arrow icon in the lower right corner to display the preset
guided information, including the general description, connection guidance,
connection diagram, test guidance, real vehicle connection, waveform analysis
and related DTCs in full screen. Tap again to exit full screen.

98
NOTE
Images in the preset guided information can be displayed in a full screen for viewing in
details.
7. Tap the Start/Stop button. The oscilloscope will perform waveform acquisition
according to the preset parameters.
⚫ Waveform Library
Tap the waveform icon on the upper toolbar to open the Waveform Library Page.
The waveform library includes online waveform library and local waveform library.
1) Online Waveform Library
The waveforms in the online waveform library are picked and uploaded by Autel
users during repair and test process using an oscilloscope. It allows you to search
for the waveforms from the vehicle and component you want to test, or upload and
share your own waveforms.
The search result displays the information such as the waveform picture, waveform
ID, VIN code, vehicle code, etc. The waveform in the online library can also be
loaded as reference waveform for better waveform analysis.
There are two methods to search for waveforms: Condition-based search and
keyword-based search.
Condition-based Search
On the condition-based search page, the waveform(s) can be accurately
searched after selecting the corresponding conditions, such as the vehicle
model, test category, status, etc. Once you have searched a waveform, you can
open, share the waveform ID to others, and follow as your favorite.
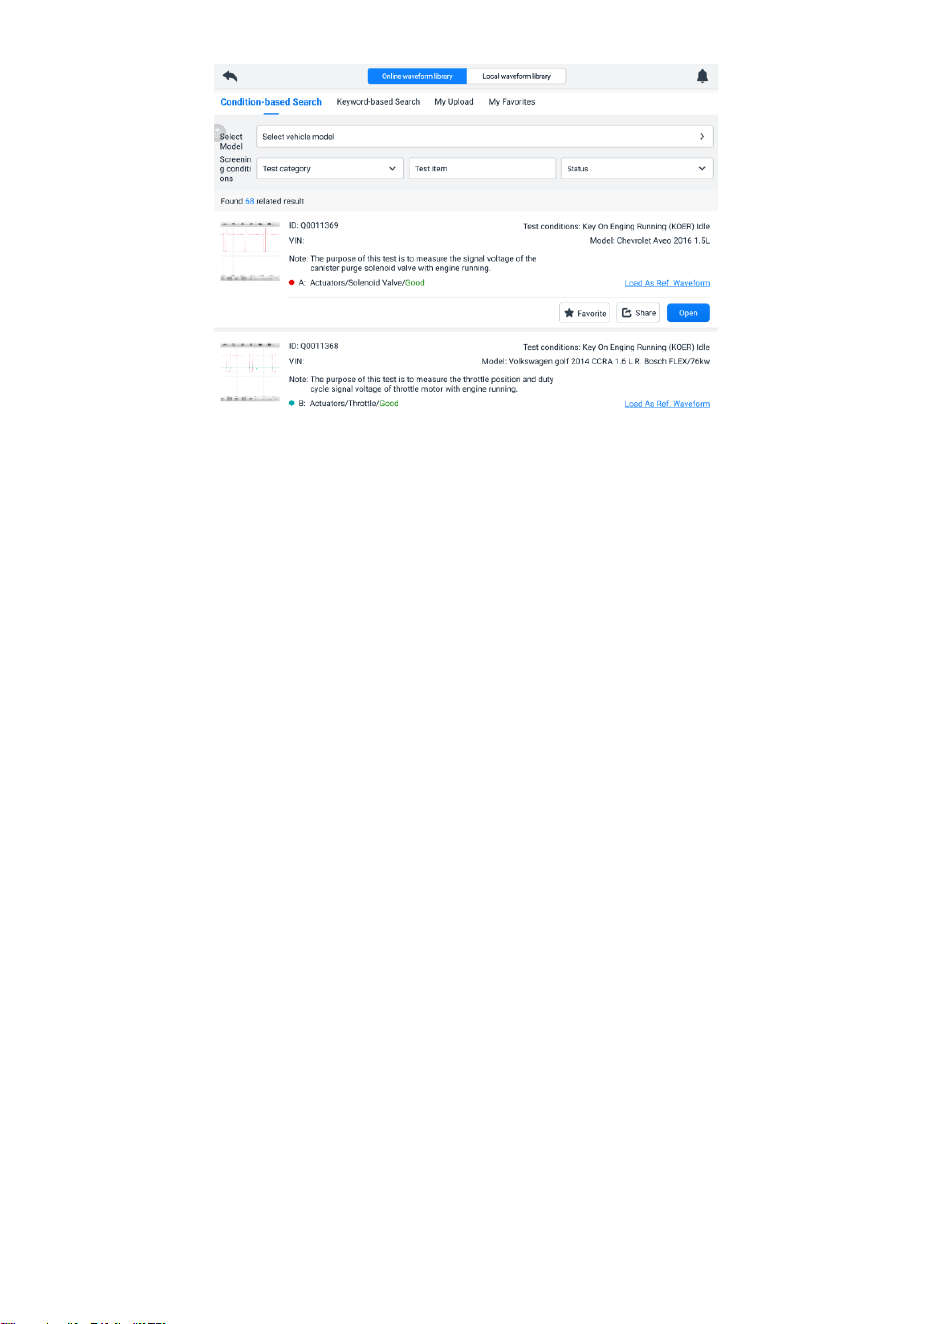
99
Figure 9-9 Conditional-based Search Screen
✓ Model
Tap the input field or the arrow icon on the right to select the vehicle
model. The manufacturer and model should be selected from the column
that displays.
✓ Screening conditions
Three screening conditions are available: Test category, test item, and
status.
Tap the dropdown menu to select the test category such as the actuators,
battery charging, engine starting, or no selection.
Tap the dropdown menu to select the condition status: no selection, good
or bad.
✓ Search result
The search result will automatically display in the lower section of the
page after selecting the model and conditions, showing the image of
waveform, waveform ID, VIN or the screening conditions.
Tap the corresponding buttons on the lower right side to share, follow or
open the waveform. Tap the Load As Ref. Waveform to load the
waveform as a reference waveform for better waveform analysis.
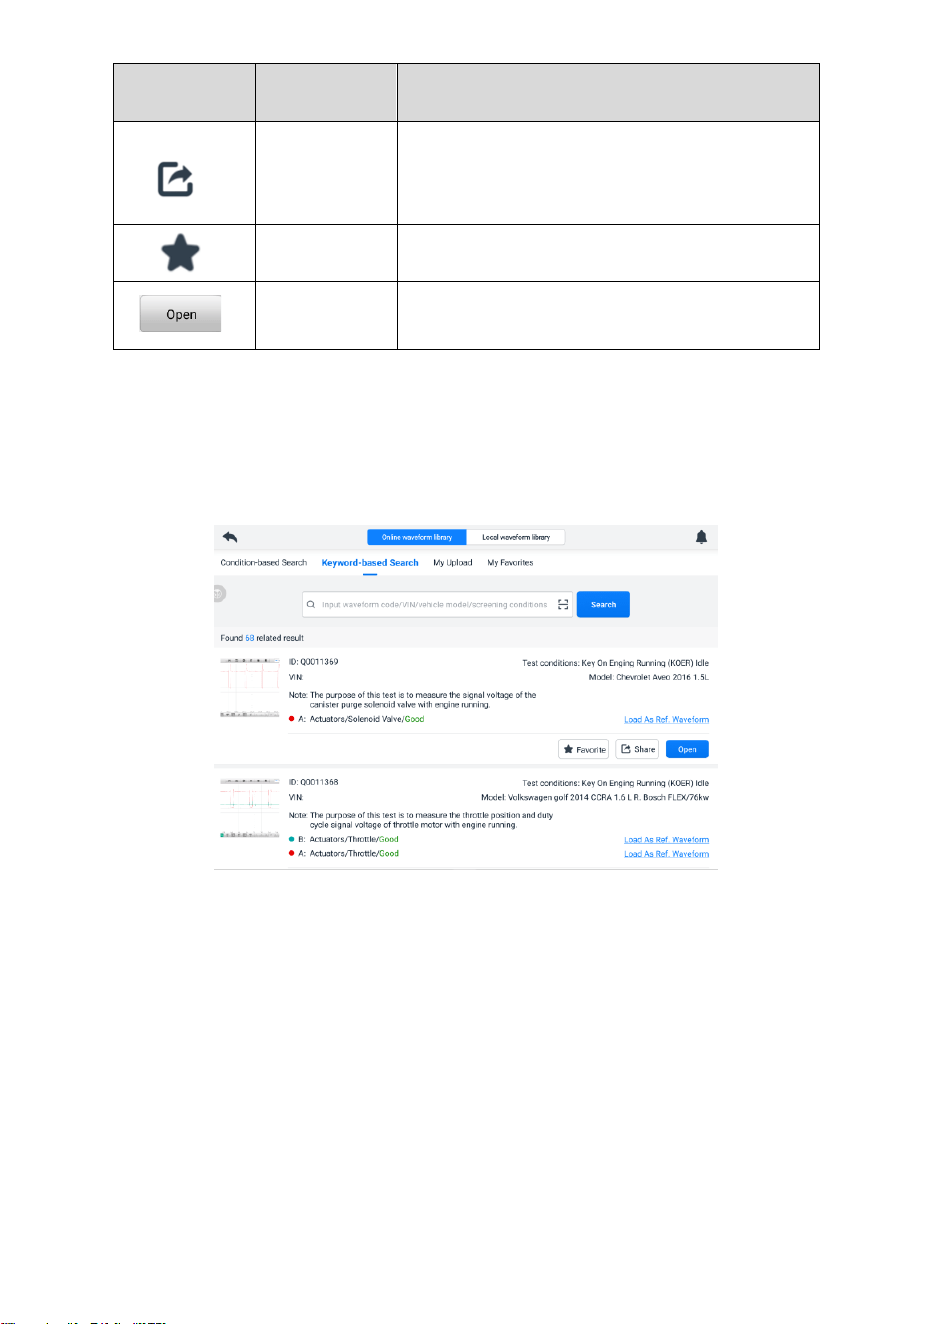
100
Button
Name
Description
Share
Tap to display a waveform ID and you can
share it through Twitter or Facebook to
anyone you want.
Favorite
Tap to add the waveform to your favorites.
Open
Tap to open the waveform.
Keyword-based Search
On the keyword-based search page, please input the waveform ID, VIN, vehicle
code, or screening conditions and then tap the "Search" button to roughly
search the waveform(s) you want. You can also scan the waveform code or VIN
by tapping the Scan icon in the input field to search the waveform.
Figure 9-10 Keyword-based Search Screen
My Upload
Your own waveforms can be saved and uploaded to the online server. The
uploaded waveforms can be searched from "My Upload" tab.
Please input the waveform code, VIN, vehicle code, or screening conditions and
then tap the Search button to search the waveform(s) you have uploaded. The
waveform can be opened, shared, followed, reviewed, and loaded as a
reference waveform once you have found it.
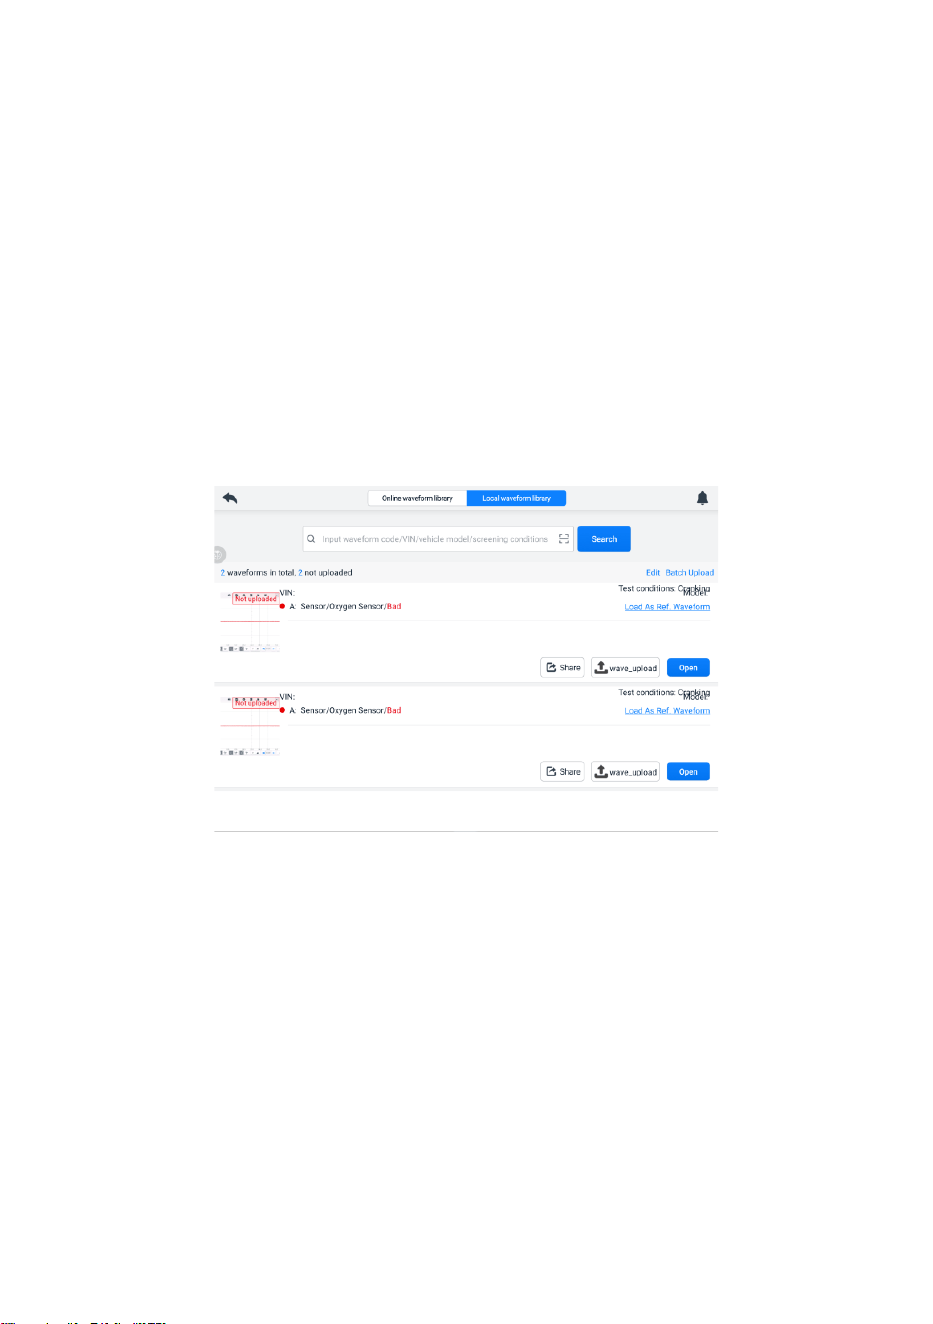
101
My Favorites
All the waveforms you have searched in the Condition-based Search, Keyword-
based Search or My Upload tab can be followed as My Favorites by tapping the
five-point start button. The waveform can also be opened, shared, followed and
loaded as a reference waveform.
2) Local Waveform Library
The waveforms in the local waveform library are the ones saved in the tablet.
Input the waveform code, VIN, vehicle code, or screening conditions and then tap
the Search button to search the waveforms saved in the local library. The found
result displays the picture of waveform, waveform ID, screening conditions, vehicle
model, etc. The waveforms can be opened, loaded as reference waveforms, shared
waveform codes, uploaded or batch uploaded.
Figure 9-11 Local Waveform Library Screen
⚫ Settings Menu
Tap the gear icon button in the upper toolbar to open the Settings Menu. The Mode,
Window Function, Waveform Generator, Decoding Settings, and Startup
Setting can be manually configured in the menu.
A. Mode
Four views are available: oscilloscope view, record view, XY view, and spectrum
view.
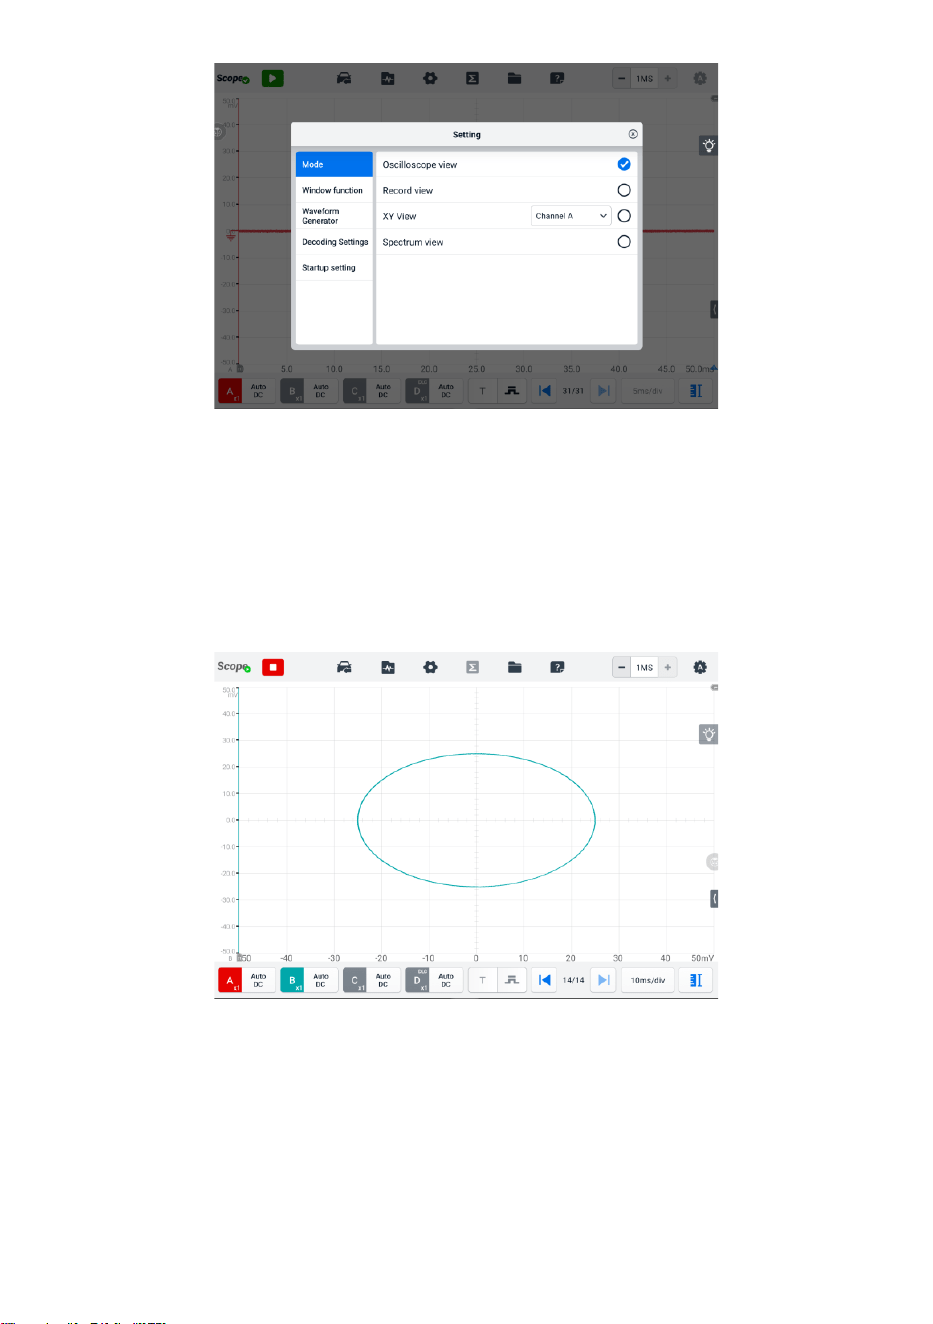
102
Figure 9-12 Mode Setting Screen
✓ Oscilloscope View: the waveform shows how a signal varies with time in
a graphical way.
✓ Record View: the waveform records signal and shows signal record.
✓ XY View: the waveform shows the relationships between periodic signals,
displaying a graph of one channel against another.
Figure 9-13 XY View Setting Screen
✓ Spectrum View: the waveform shows the signal level on a vertical axis
against frequency on the horizontal axis in a graphical way. One or more
spectra with a common frequency axis can be displayed in the spectrum
view.
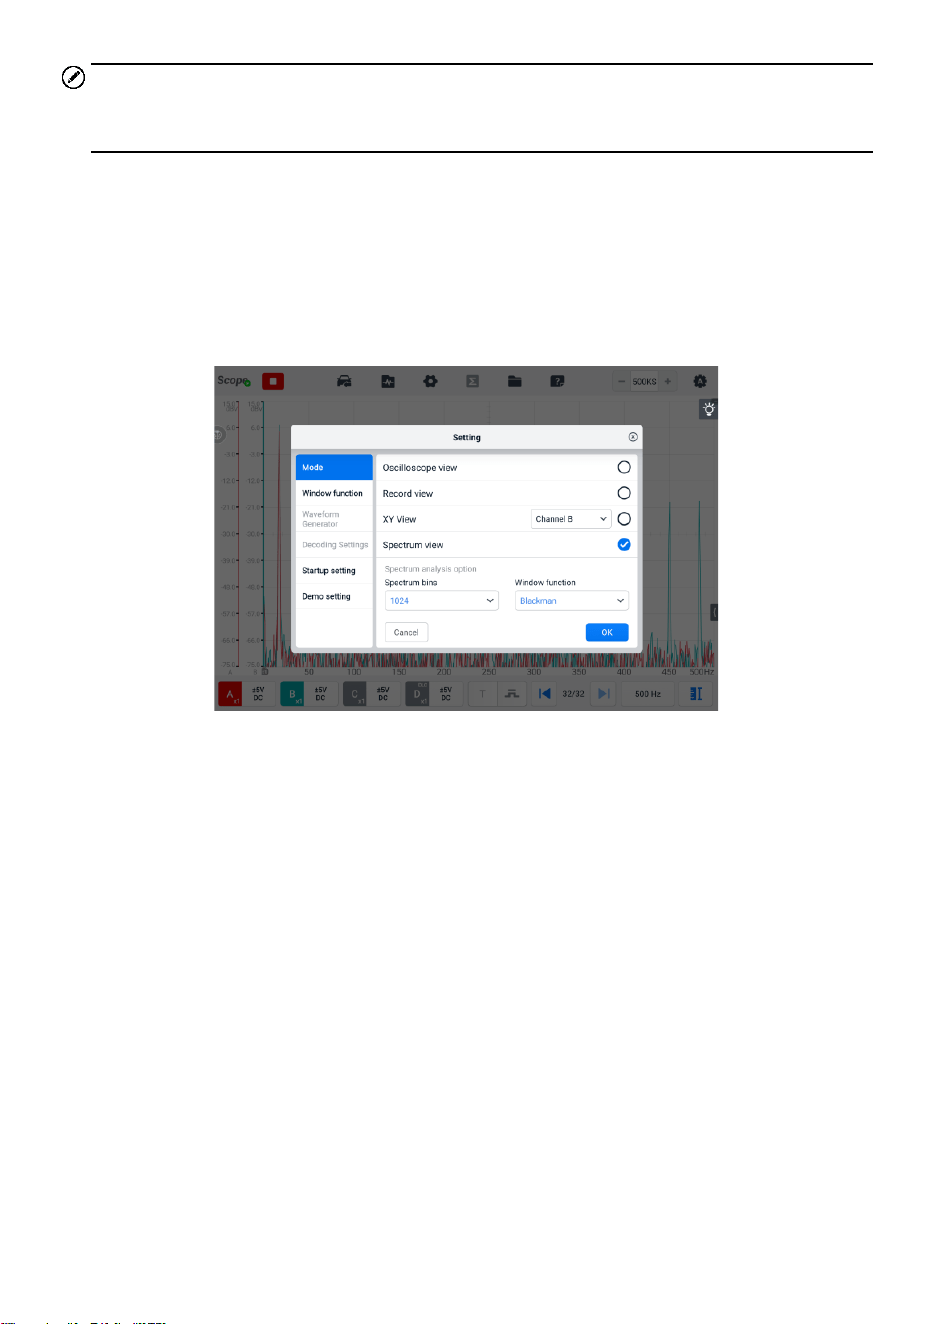
103
NOTE
The Wi-Fi connection does not support the XY View and Spectrum View. Please use the
USB cable to connect the device, instead of the Wi-Fi connection.
The spectrum-related analysis options display after selecting the spectrum view in the
Mode setting screen. Select the desired spectrum bins and window functions for better
spectrum analysis.
The amplitude over-range of Y-axis can be adjusted by the amplitude level. When the
sampling frequency is low, the current frequency can also be adjusted. The maximum
frequency supports 20 M.
Figure 9-14 Spectrum View Settings Screen 1
Spectrum Analysis Option
Spectrum Bins: it allows you to set the number of frequency bins into which the
spectrum is divided.
Window Function: it allows you to select one of the standard window functions to
reduce the impact of running on a time-limited waveform.

104
Table 9-3 Window Function Table
Window
Main peak
width
(bins @ -3 dB)
Highest
side lobe
(dB)
Side lobe
roll-off
(dB/octave)
Description
Rectangle
0.89
-13.2
6
No fading; maximal
sharpness; used for
short transients.
Blackman
1.68
-58
18
Often used for audio
work.
Blackman-
Harris
1.90
-92
6
Used for general
purpose.
Flattop
2.94
-44
6
Negligible pass-band
ripple; mainly used for
calibration.
Gauss
1.33 to 1.79
-42 to -69
6
Gives minimal time and
frequency errors.
Hann
1.20 to 1.86
-23 to -47
12 to 30
Used for audio and
vibration work.
Hamming
1.30
-41.9
6
Also called raised sine-
squared; used for
speech analysis.
Triangle
1.28
-27
12
Also called Bartlett
window.
Y-axis
Display Mode: Magnitude Mode displays the frequency spectrum of the last
waveform.
Scale: the scaling of the vertical axis.
Logarithm: the vertical axis is scaled in decibels.
Linear: the axis is scaled in equal intervals from DC to the frequency.
Logarithmic Unit: the reference quantity used for the logarithm scale.
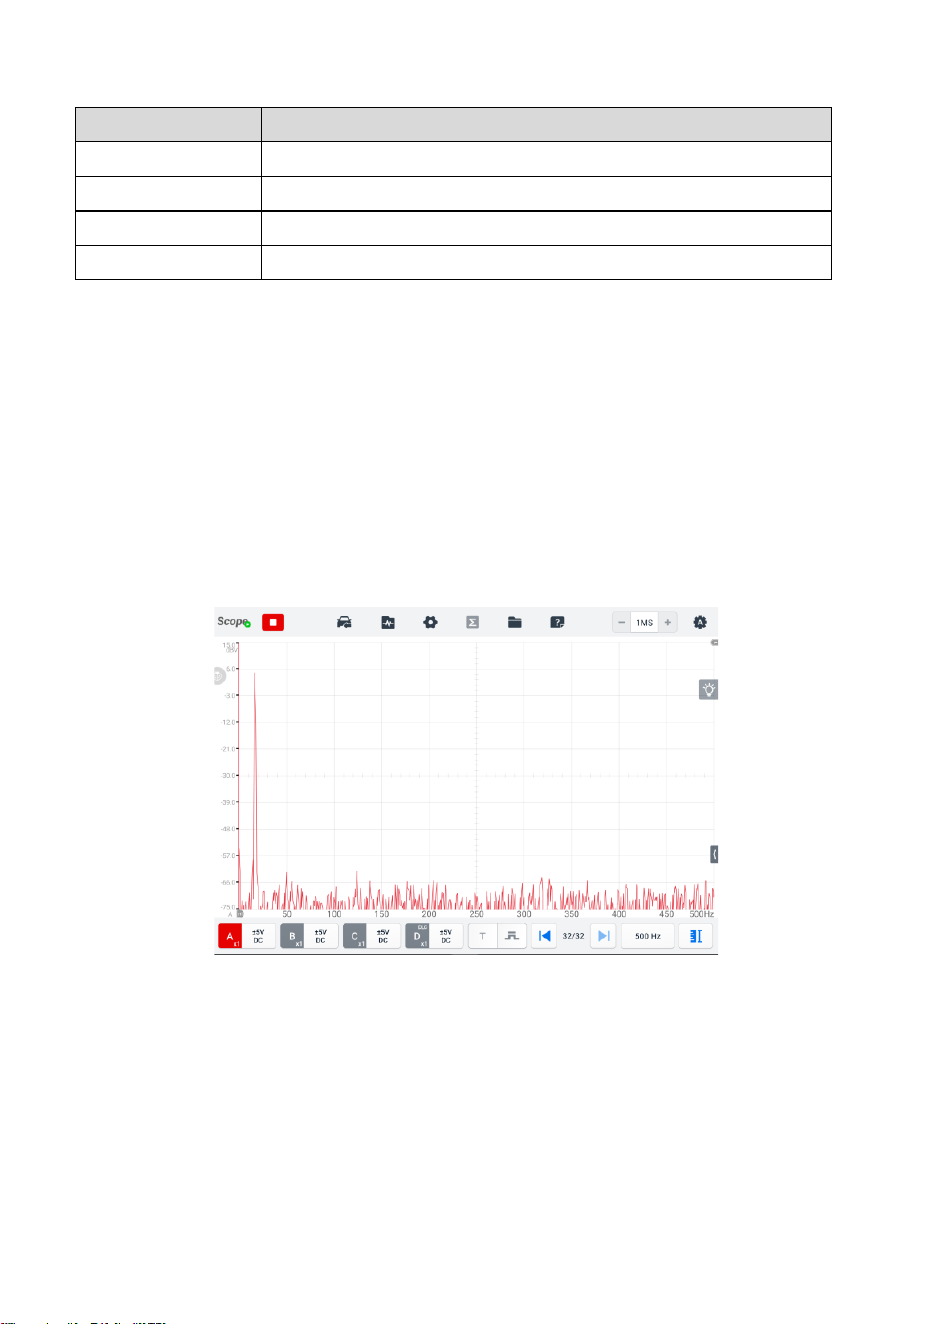
105
Table 9-4 Logarithm Unit Specifications
Logarithmic Unit
Description
dBV
Reference level is 1 V.
dBu
Reference level is 1 mW with a load resistance of 600 Ω.
dBm
Reference level is 1 mW into the specified load impedance.
Any dB
Reference level is an arbitrary voltage.
X-axis
Scale: the scale of the frequency axis.
Linear: the axis is scaled in equal intervals from DC to the frequency.
➢ To set the Spectrum View
1. Tap the Settings button on the upper toolbar. A dialog box opens.
2. Select the Mode option in the dialog box, and then tap to select Spectrum View.
3. Tap the input field or the dropdown arrow icon to select the desired options from
the column. Tap OK to confirm.
Figure 9-15 Spectrum View Settings Screen 2
B. Window Function
A display window with a grid displays the data captured by the oscilloscope. By
default, a single trace is displayed. Additional traces can be added via the window
display menu.
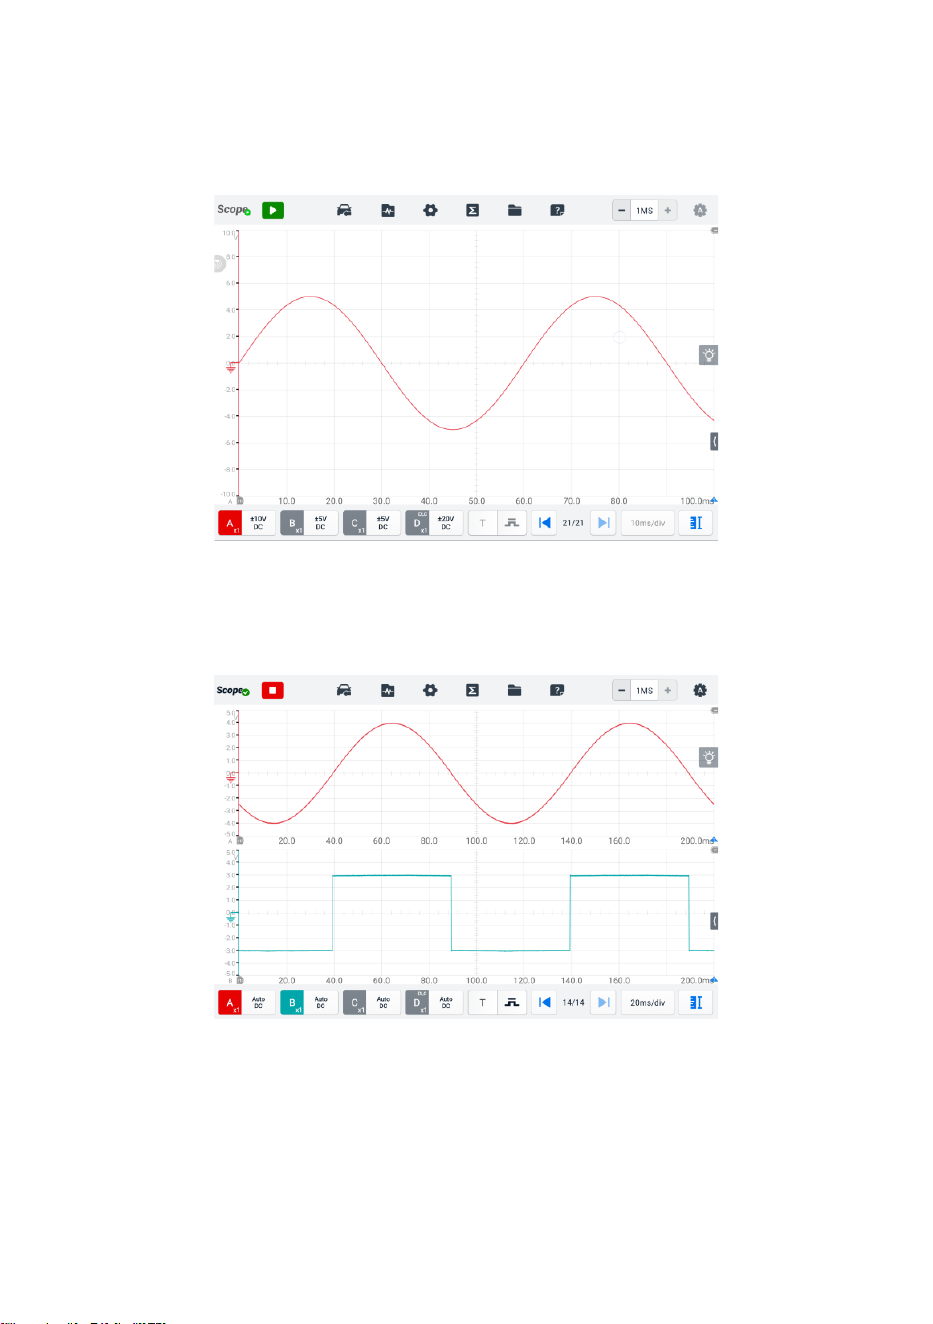
106
Display Mode
The Window Function menu allows you to configure up to four traces.
Single Window — displays a single trace.
Figure 9-16 Single Window Screen
Double Window — displays two separate traces horizontally, one below the
other.
Figure 9-17 Double Window Screen
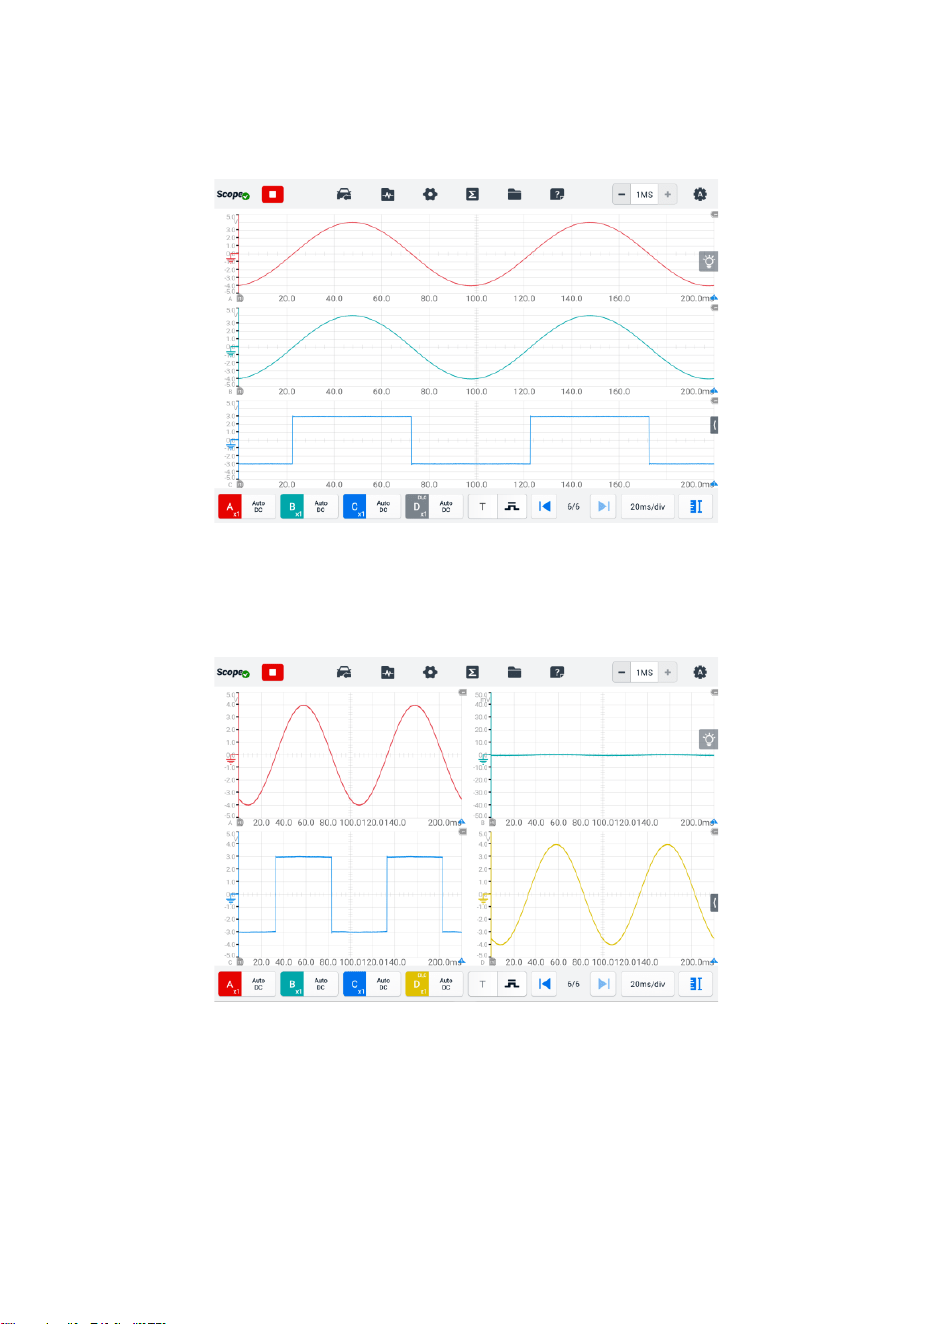
107
Triple Window — displays three separate traces horizontally, one below the
other.
Figure 9-18 Triple Window Screen
Quadruple Window — displays four separate traces, two horizontally, two
vertically.
Figure 9-19 Quadruple Windows Screen
➢ To set the display mode
1. Tap the Settings button in upper toolbar. A dialog box opens.
2. Select the Window Function in the dialog box.
3. Tap the appropriate number icon to display the corresponding number of traces
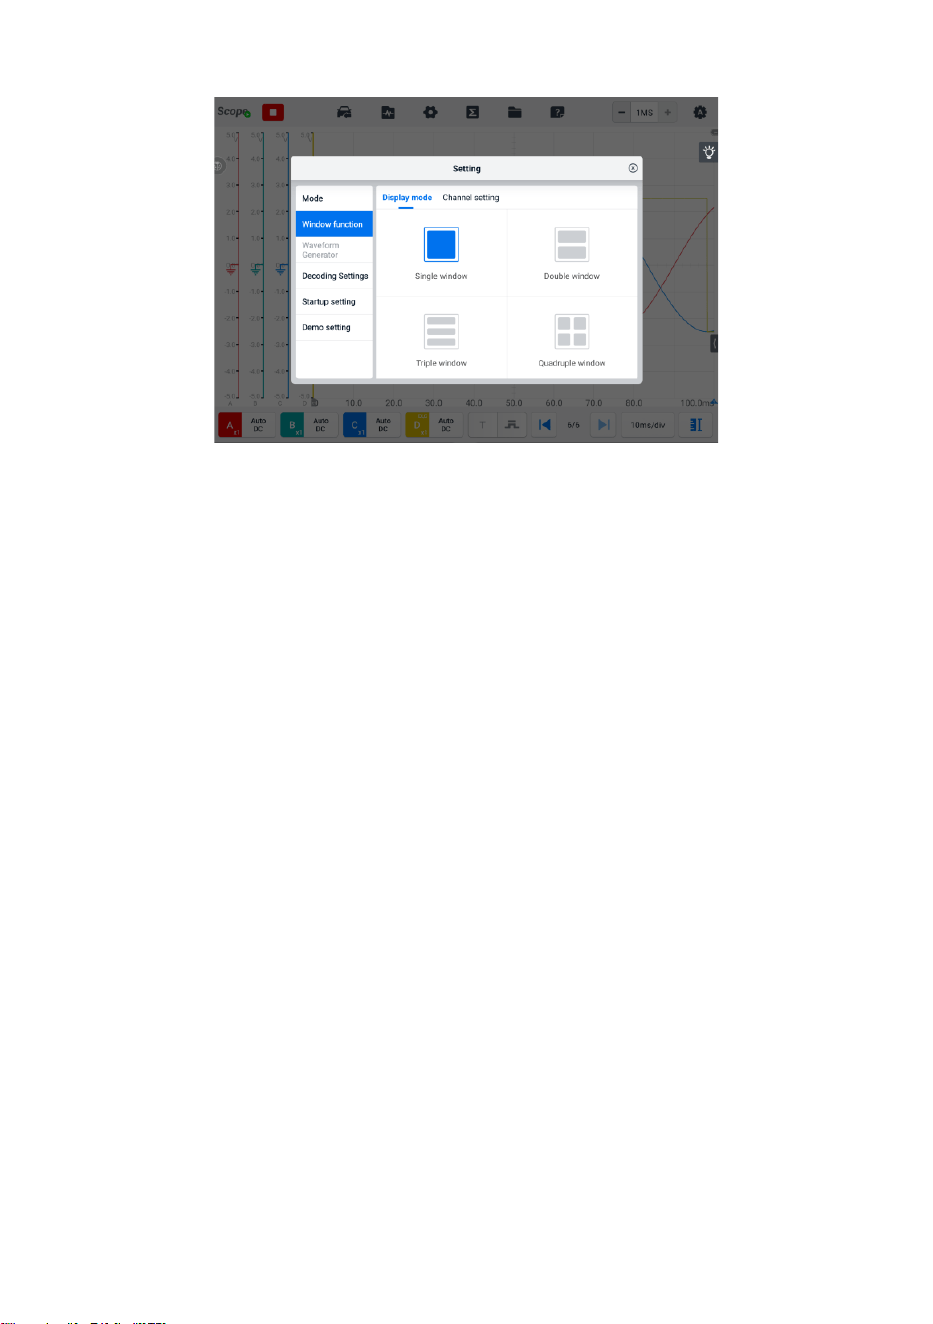
108
onscreen.
Figure 9-20 Display Mode Selection Screen
4. Close the dialog box. The window is displayed as selected.
Channel Setting
The Channel Setting allows you to arrange the display position of the activated
channels. Select which channels are visible in the display window. The display
status is set to ON, the input channels are enabled, otherwise, the input
channels (set to OFF status) are not available for viewing.
➢ To set the channel setting
1. Tap the Settings button in the upper toolbar. A dialog box opens.
2. Select the Window Function in the dialog box, then select Channel Setting.
3. Swipe the display status icon to ON. Select the position for each channel from
the dropdown menu.
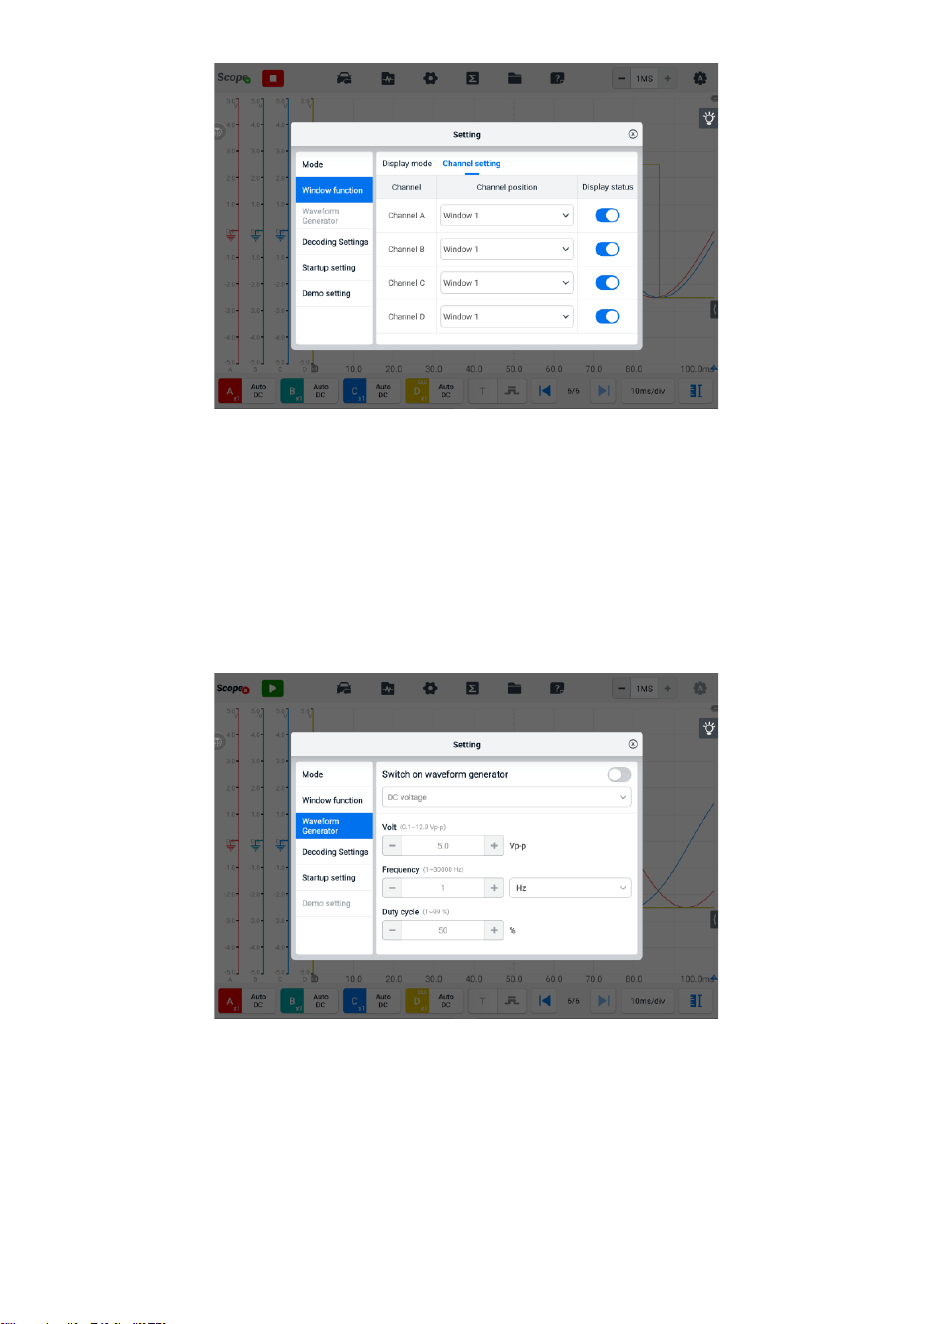
109
Figure 9-21 Channel Setting Screen
4. Close the dialog box and the activated channel is displayed in the selected
window.
C. Waveform Generator
The Waveform Generator operates simultaneously with the oscilloscope. Use the
waveform generator to simulate the DC voltage, square wave, square wave (X+Y),
triangle wave, and actuators drive.
Figure 9-22 Waveform Generator Screen
➢ To set the waveform generator
1. Tap the Settings button in the upper toolbar. A dialog box opens.
2. Select the Waveform Generator option in the dialog box.
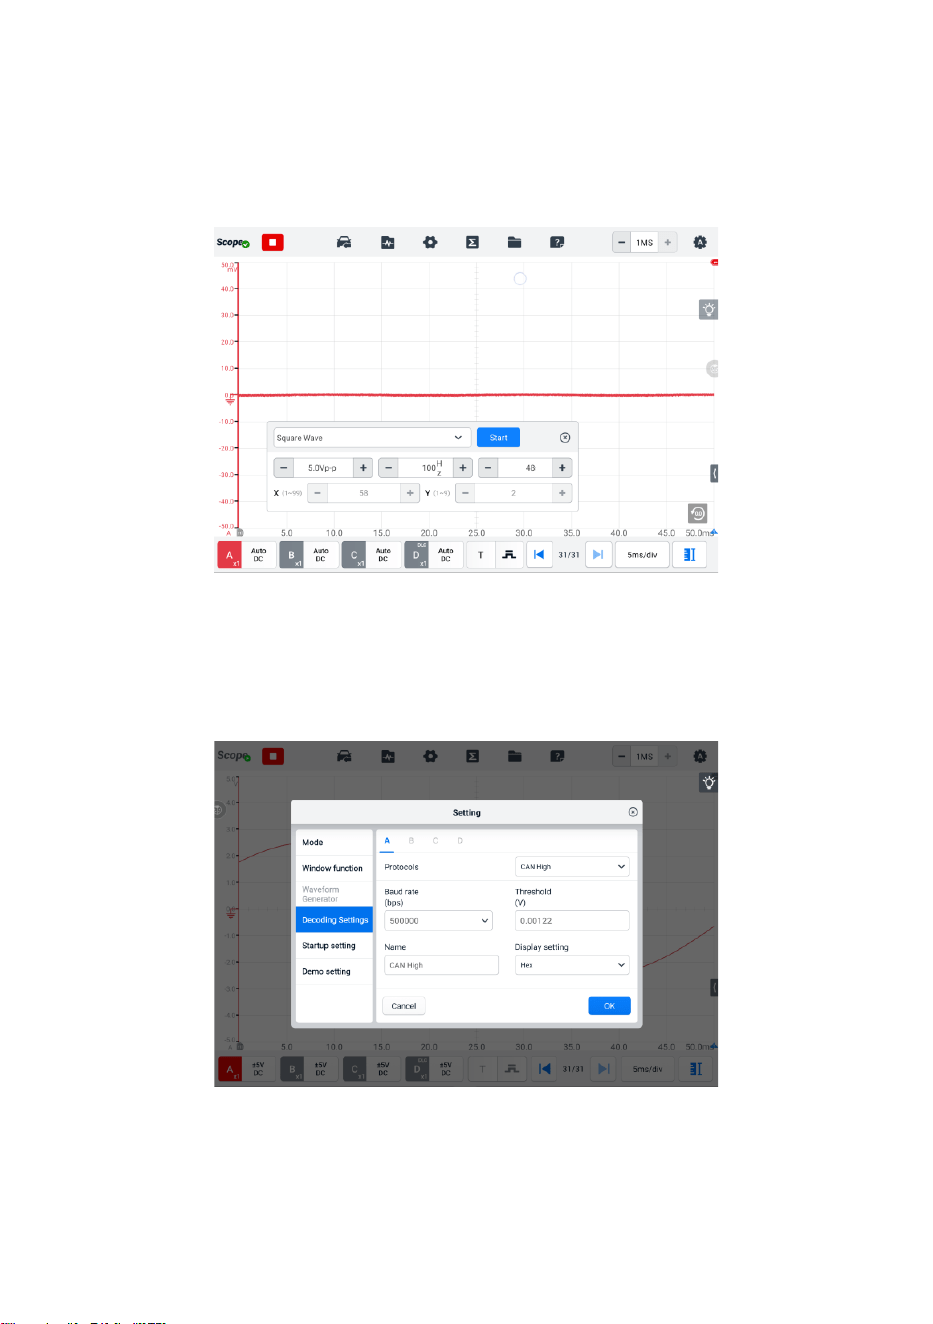
110
3. Swipe the OFF to ON to enable the waveform generator. Select a desired option
from the dropdown menu. Tap the "+" or "-" buttons to adjust the voltage,
frequency and duty cycle values.
4. Close the dialog box. The waveform generator settings are displayed on the
screen.
Figure 9-23 Waveform Generator Display Screen
D. Decoding Settings
When the oscilloscope mode is selected, the decoding settings are available.
Figure 9-24 Decoding Settings Screen 1
9 Protocols are available: CAN High, CAN Low, LIN, FlexRay, RS232/UART, I2S,

111
I2C, USB (1.0/1.1), and CAN FD. The detailed setting options vary according to each
protocol.
CAN High/CAN Low: Controller Area Network (CAN) is a serial protocol used
in automotive to allow microcontrollers to communicate with each other. It
typically uses differential signaling (with signals named CAN High and CAN Low)
to increase noise immunity.
LIN: Local Interconnect Network (LIN) is a serial protocol used in automotive
electronics to allow microcontrollers to communicate with low-speed peripherals.
FlexRay: It is an automotive network communications protocol for high-speed
data.
RS232/UART: Universal Asynchronous Receiver/Transmitter (UART) is the
communication interface found in the serial or COM ports once commonly found
on computers. Each channel of data is transmitted on a single wire pair using
an electrical standard such as RS232.
I2S: Inter-IC Sound (I2S) is a serial protocol used in digital audio devices for
communications between circuits such as CD transports and audio DACs.
I2C: Inter-Integrated Circuit (I2C) is a way to connect peripheral chips in
consumer electronics products and is widely used in embedded systems.
USB (1.0/1.1): Universal Serial Bus (USB) is widely used in personal computers
and tablets for communication.
CAN FD: The CAN FD serial protocol is an extended version of the Controller
Area Network (CAN), which allows electronic controllers to receive sensor
messages and transmits control messages faster than traditional CAN
communication.
Baud Rate: The baud rate will display a default value, which needs to be manually
set according to the actual signal to get the correct decoding result.
Threshold: The voltage that defines the transition in either direction between high
logic state and low logic state.
Name: The name of the protocol that you have selected above. The channel and the
corresponding protocol name will display in the scope view after selection.
Display Setting: You can also choose a display mode for the decoded data: Hex or
Binary.
➢ To make the decoding settings
Using CAN High as an example.
1. Tap the Settings button in the upper toolbar. A dialog box opens.
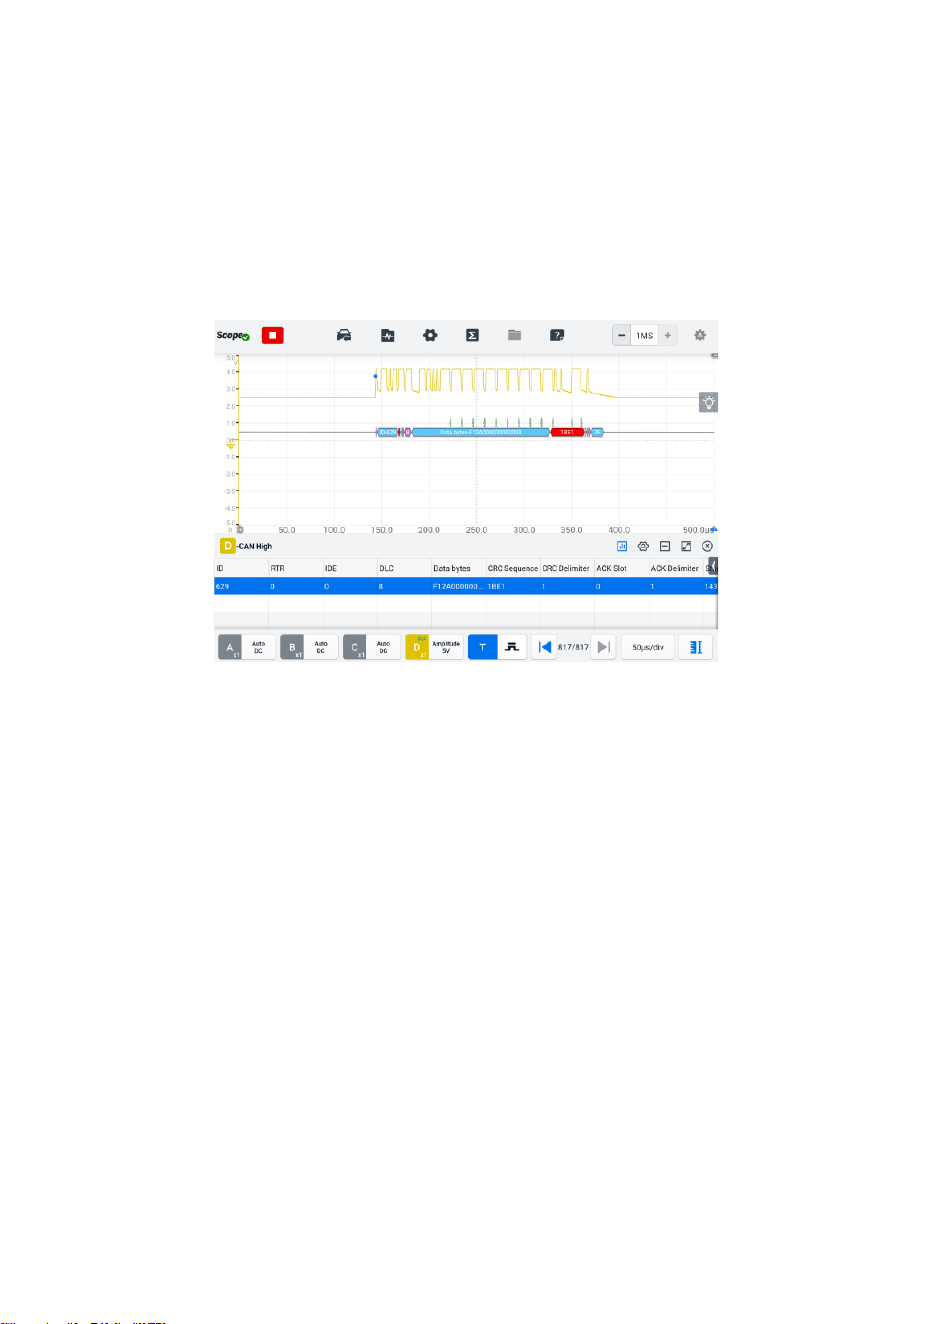
112
2. Select the Mode option in the dialog box and tap the Oscilloscope Mode.
3. Select the Decoding Settings in the dialog box.
4. Select the channel(s) that you want to set, and then select the CAN High
protocol from the dropdown list.
5. For the baud rate and threshold, you can keep the displayed values or manually
enter a value according to the actual signal.
6. Select the Hex or Binary display mode from the dropdown list.
7. Tap OK to confirm. The decoding settings are displayed on the screen.
Figure 9-25 Decoding Settings Screen 2
E. Startup Setting
This function allows the user to choose the startup configuration when launch the
oscilloscope application.
On the Startup Setting screen, there are three options: Load user default
configuration at startup, Load last session configuration at startup, and Load
factory configuration at startup. Select one option according to the specific need.
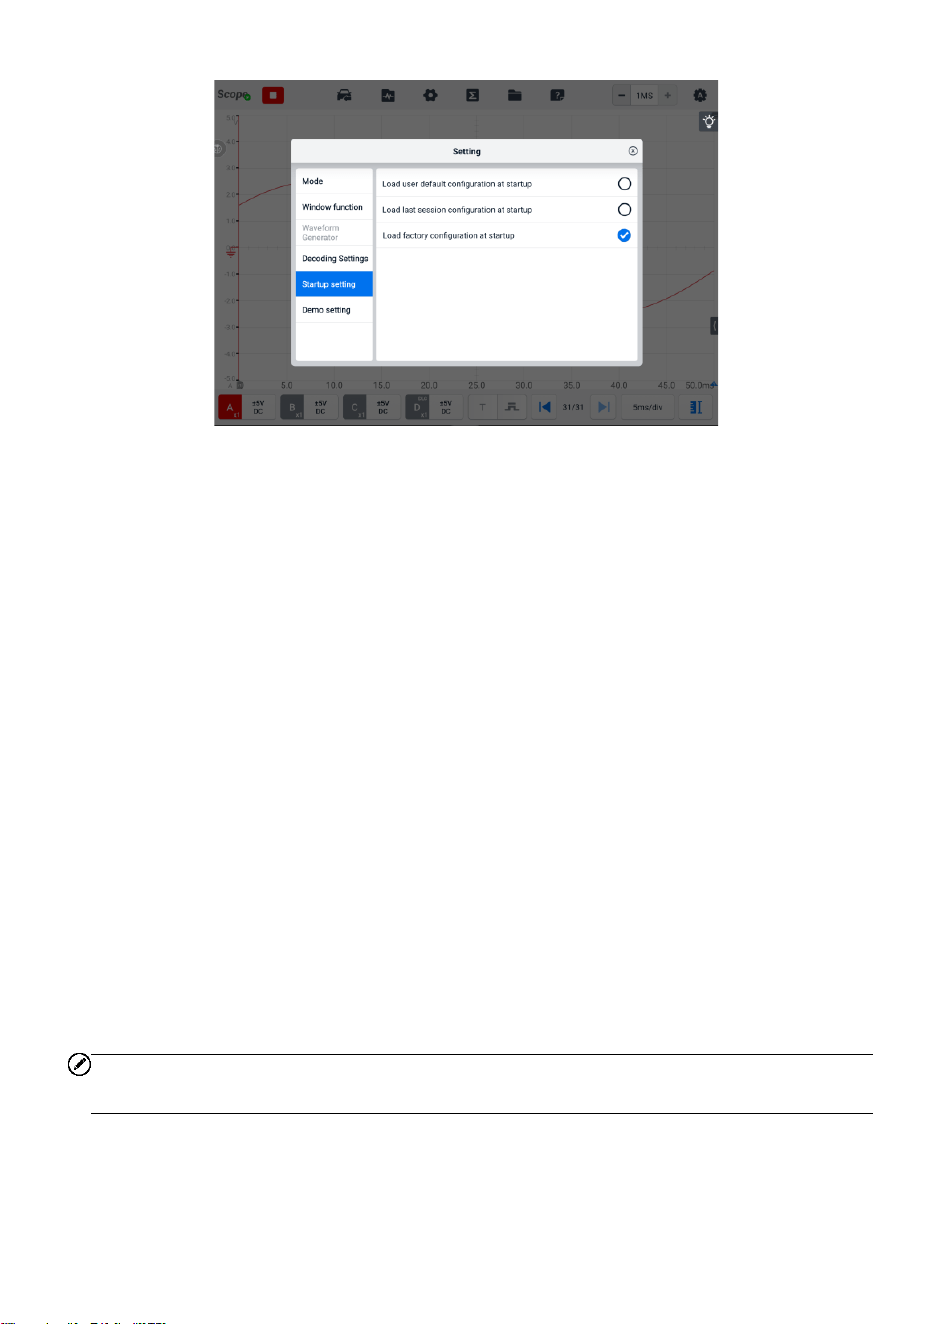
113
Figure 9-26 Startup Settings Screen
⚫ Math Channel
A math channel is a virtual channel generated by a mathematical function of the
input channel. It can be displayed in an oscilloscope in the same way as an input
signal, and like an input signal it has its own measure axis, scale and color.
The oscilloscope has a set of built-in math channels:
✓ Turnover: reverses the signal polarity to turn the waveform upside down on the
screen
✓ A+B: channel A plus channel B
✓ A-B: channel A minus channel B
✓ A*B: multiply channel A by channel B
✓ A/B: channel A divided by channel B
✓ Frequency: the frequency of the signal
✓ Pulse Width (+): the positive pulse width
✓ Pulse Width (-): the negative pulse width
✓ Duty Cycle (+): the positive duty cycle
✓ Duty Cycle (-): the negative duty cycle
NOTE
When connecting via Wi-Fi, it only supports Turnover, A+B, A-B, A*B and A/B.
➢ To set the math channel
Using Invert A as an example.
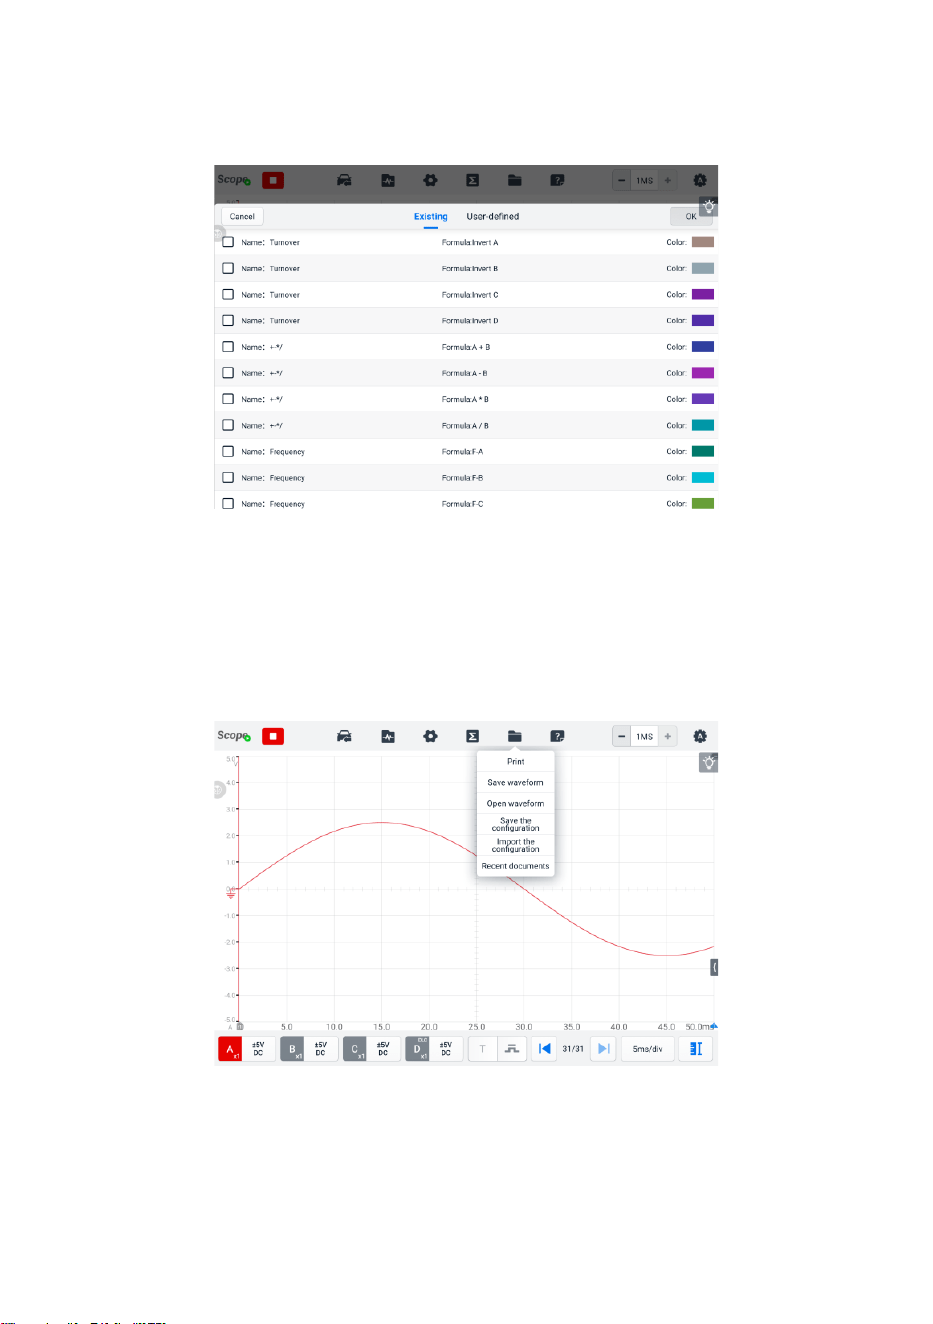
114
1. Tap the Math Channels icon in the upper toolbar. A dialog box opens.
2. Select Existing in the dialog box.
3. Select Invert A, and tap OK to continue.
Figure 9-27 Math Channel Setting Screen 1
4. The waveforms are displayed on the screen.
⚫ File Menu
The File Menu allows you to print, open, save, and delete the waveform data. The
File Menu supports the following functions.
Figure 9-28 File Menu Screen

115
✓ Print — tap to create and print a temporary PNG picture of the current waveforms.
NOTE
1. Make sure the tablet is properly setup to print and is connected to the printer.
2. Make sure the network is available.
✓ Waveform Operation
This section allows you to save and open the waveforms.
Save waveform — tap to save the waveform on the current screen. Three types of
file saving are available in the dropdown list: Oscilloscope data file, Text file, and
Excel file. Select one of the file saving ranges from save current page, save last
5 pages and save all pages. Finally tap the Save button to save the waveform.
Select the Text File option to save the current waveform data to a text file. Use the
ES File Explorer app on the Android home screen to review file: Home > ES File
Explorer > Local > Internal Storage > Scan > Data > Scope > txt.
Open waveform — tap to retrieve the saved waveforms.
✓ Configuration Operation
The configurations can be saved and imported, or set to default.
Save the configuration — tap to save the configuration values of waveforms on
the current screen including the amplitude, the time base, the number of samples,
etc.
Import the configuration — tap to import the saved configuration values of
waveforms. Tap the System Default Configuration option to cancel the current setting
values and refresh the screen to retrieve the default setting values.
✓ Recent documents — tap to open the recent documents in order to view the
waveforms currently opened in the waveform library.
⚫ Help Menu
The Help Menu displays the user manual, update the APK and firmware, and view
version numbers of the installed APK and firmware.
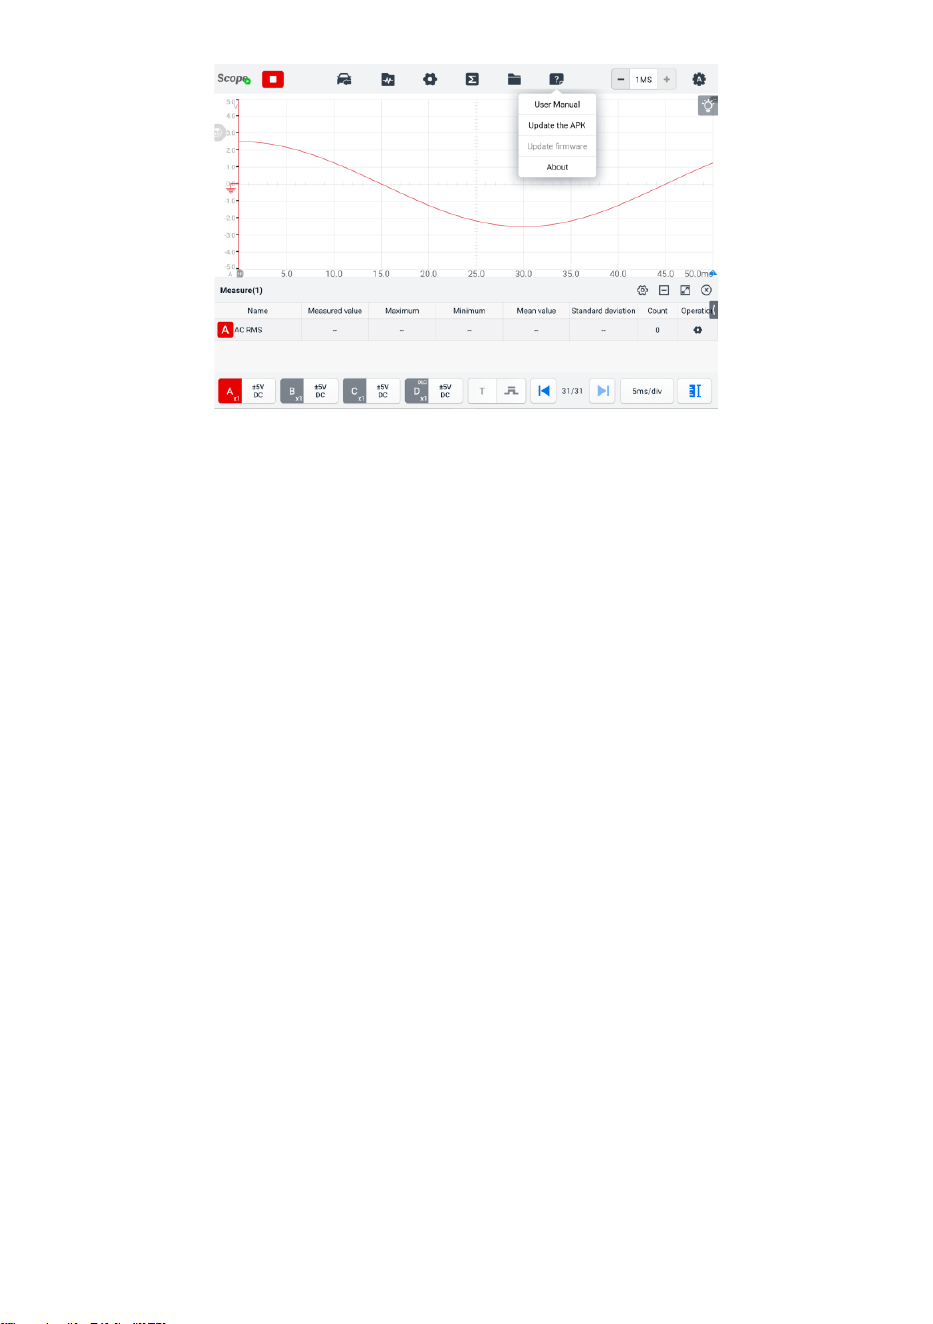
116
Figure 9-29 Help Menu Screen
✓ User Manual — displays instructions for the proper use of the oscilloscope.
✓ Update the APK — connects to the Autel server and to get the latest application
software version.
✓ Update Firmware — connects to the Autel server and to get the latest firmware
version.
✓ About — displays the model number and the installed versions of the software
and firmware.
⚫ Number of Samples
This button allows you to set the maximum number of samples that will be captured
by each channel. The sampling rate of current time base can be adjusted by
changing the number of samples. Tap the minus or plus icon to adjust the number
of samples.
⚫ Auto Scale
Use the Auto Scale button to trigger the device to automatically analyze the signal
of the opened channel, and automatically set the appropriate amplitude and time
base range to display the signal correctly. In auto scale setting, the time base is only
valid for periodic signals.
9.1.5.2 Main Section
Up to four traces, along with digital readouts of current signal values, signal status and
triggering conditions, can be displayed simultaneously on the main view section screen.
Each trace has two control features, X-axis and Y-axis, which enable you to adjust the
oscilloscope settings to suit the particular test measurement. If multiple traces are
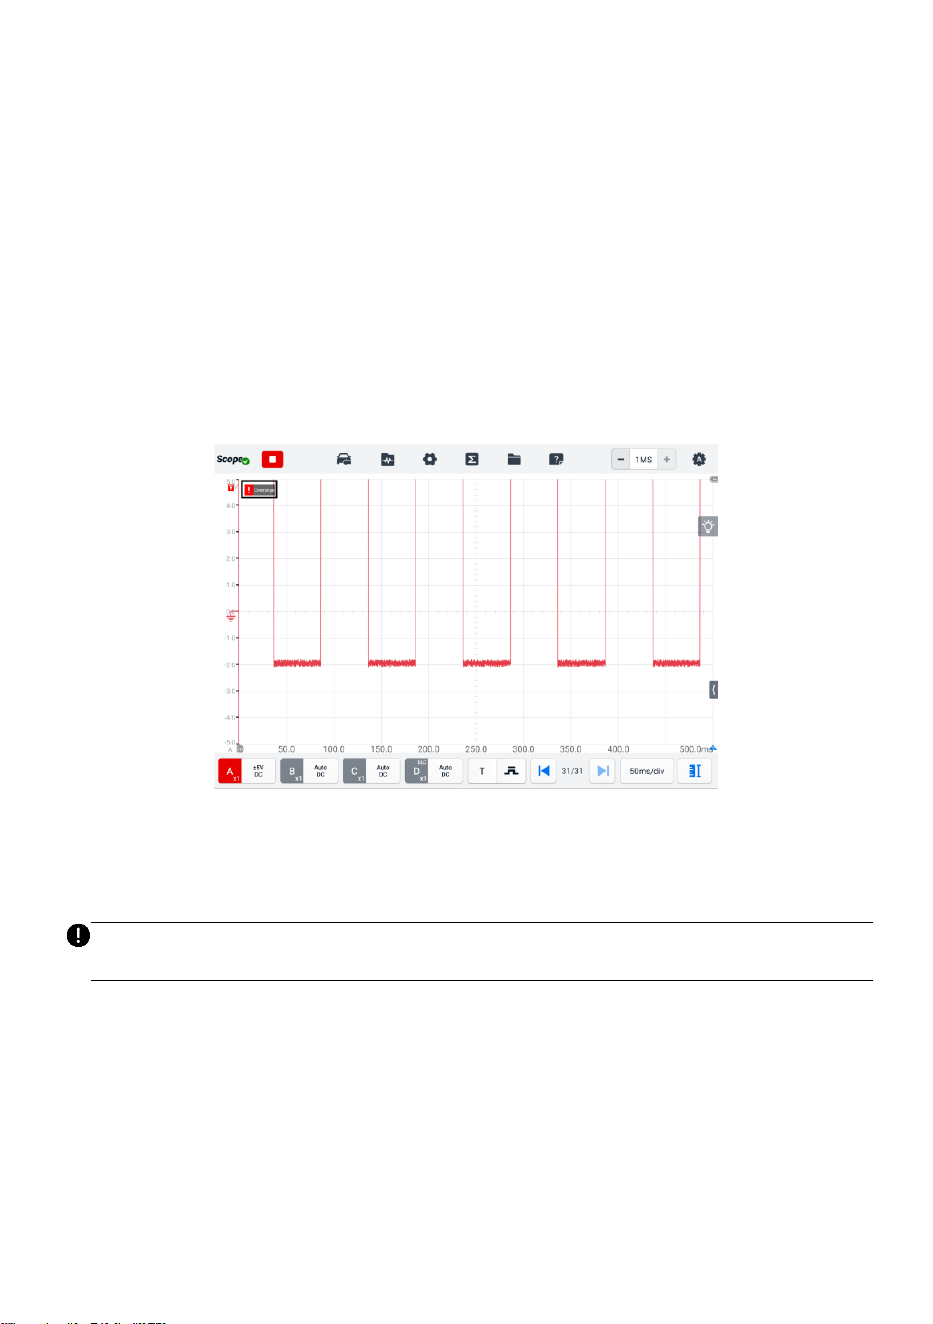
117
displayed at the same time, the Y-axis for each trace is adjusted separately while the X-
axis is the same for all traces.
✓ Y-axis — the voltage level is recorded on the vertical. It displays on the left side of
the screen.
✓ X-axis — time is presented on the horizontal line. It is shown along the bottom of
the screen.
⚫ Measurement Overrange Indicator
When the amplitude exceeds the measurement input range, a red overrange
indicator with the message "overrange" is displayed in the top left corner of the
screen. Exceeding the common-mode input range may result in inaccurate
measurements and can lead to severe signal distortion.
Figure 9-30 Overrange Indicator Screen
Select an appropriate scale setting for the signal being sampled to avoid an
overrange condition.
IMPORTANT
To prevent electric shock, do not exceed voltage limits between inputs
⚫ Channel Selection
In the main view section, a channel has two conditions: selected and unselected. A
channel must be selected in order for the waveform to be movement, to use the
zoom-in or to add measurement rulers.
Tap the Zero Baseline marker or the Y-axis (the line thickens when selected). After
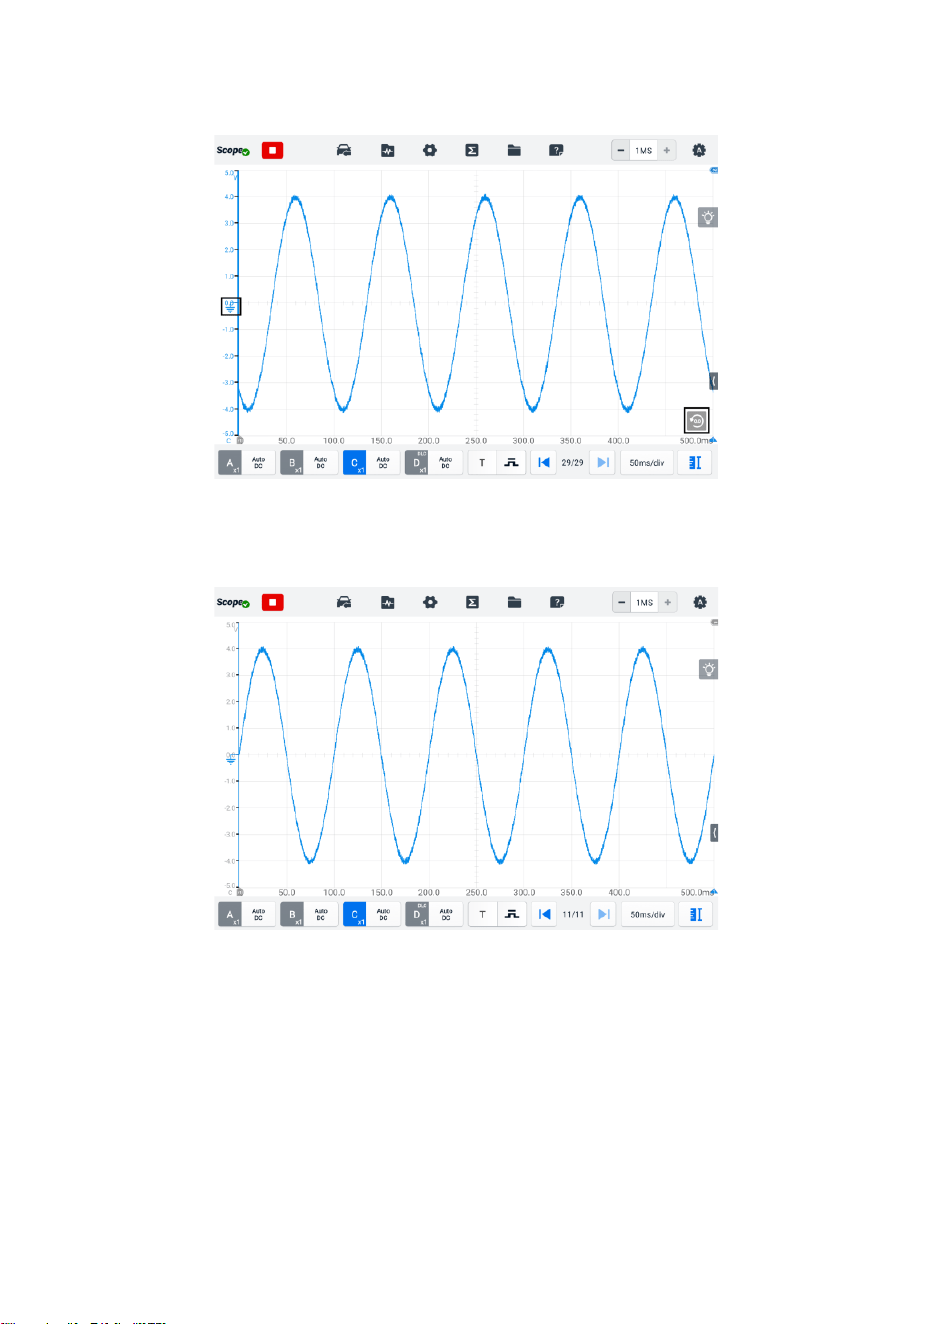
118
the channel is selected, the waveform can be zoomed. Tap the counterclockwise
arrow button at the right corner to recover after zooming.
Figure 9-31 Channel Selection 1 (Selected)
Tap the Zero Baseline marker or the Y-axis again to exit the channel selection.
Figure 9-32 Channel Selection 1 (Unselected)
⚫ Waveform Zooming
The zooming function allows you to change the size and position of a signal during
or after capturing a waveform to examine it in greater details. It does not change the
stored data, but the way it displays.
The X-axis and Y-axis can be zoomed using your fingertips. The waveform can be
zoomed during or after capturing the signal.
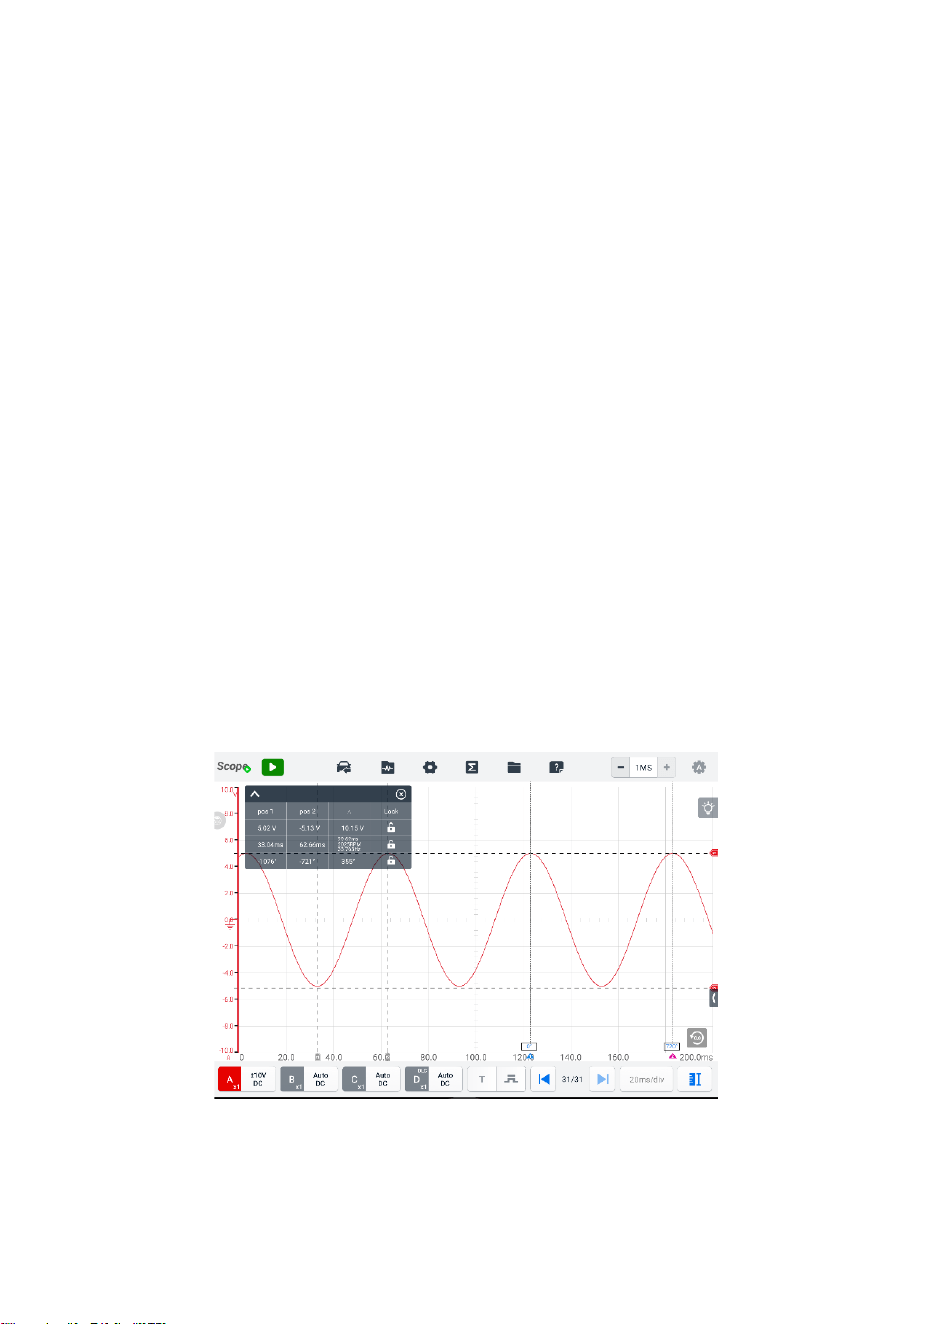
119
⚫ Measurement Rulers
The coordinate Rulers allow the amplitude and time duration of a waveform to be
measured precisely. They are useful when determining signal characteristics such
as amplitude at specific points, the cycle time (duration) and frequency.
There are three types of measurement rulers: the vertical Time Ruler, the horizontal
Signal Ruler, and the vertical Angle Ruler.
Tap the Ruler Activator in the lower left corner of the grid and drag it across the
screen to the desired position. A Time Ruler is generated.
Tap the Ruler Activator in the lower right corner of the grid and drag it across the
screen to the desired position. An Angle Ruler is generated.
The two angle rulers are positioned to mark the start and end of a cycle. By default,
the start and end angle values are 0° and 720°, which can be configured in the Phase
Setting box.
The Signal Ruler can be generated in the similar way by tapping the Ruler
Activator in the upper right corner and dragging it downwards.
When dragging the Measurement Rulers, a Ruler Table showing time and voltage
values for the corresponding channels will be displayed. The Delta icon refers to the
absolute difference between the values of the rulers, which can be locked by tapping
the Lock icon. Tap the X button in the upper right corner of the ruler table to delete
all rulers.
Figure 9-33 Rulers Display Screen
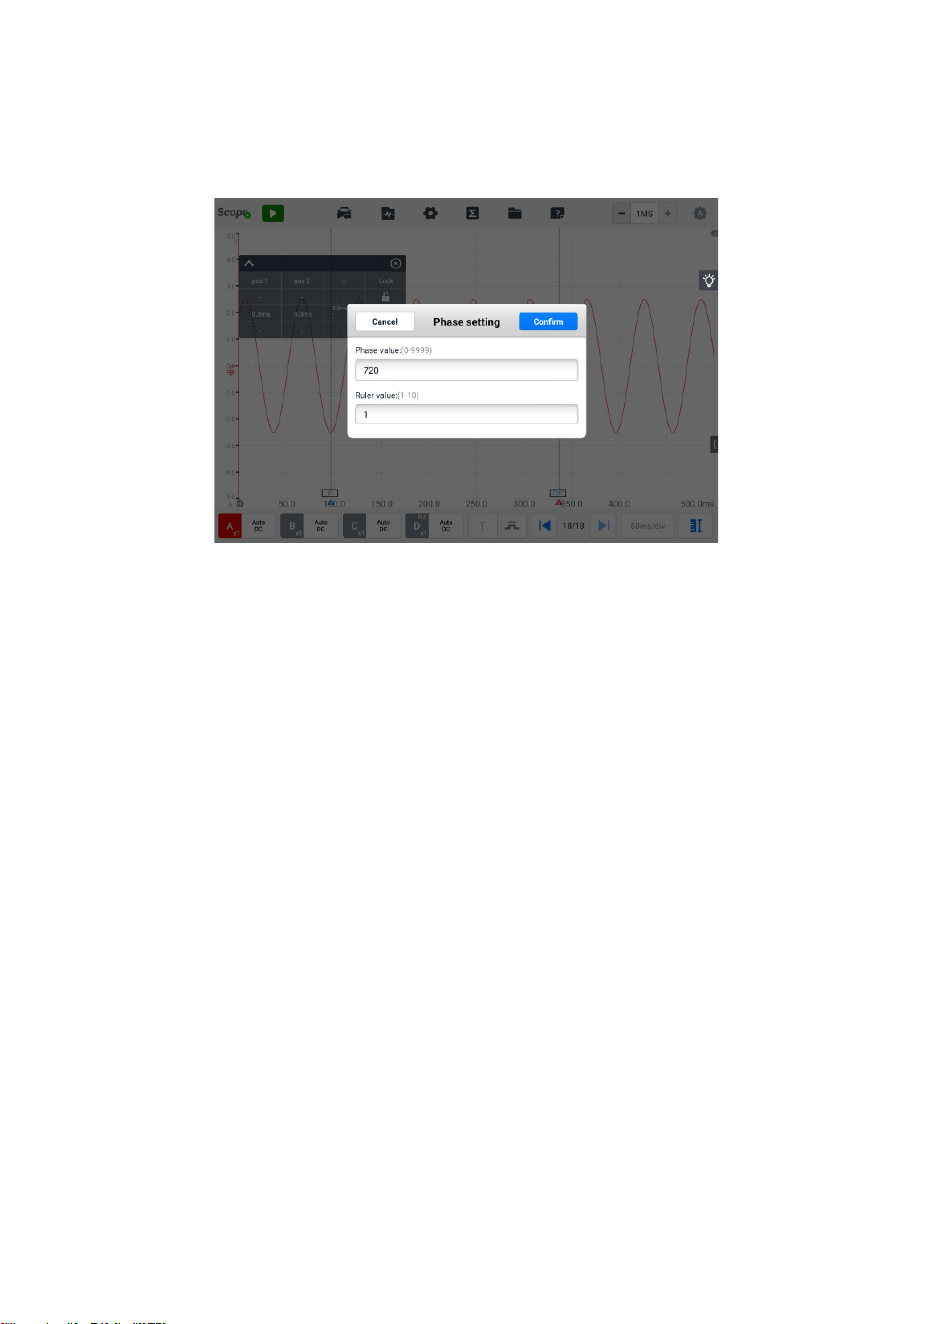
120
➢ To configure angle settings
1. Drag Angle Activator to generate the angle rulers.
2. Tap the start or end angle value to open the Phase Setting box.
3. Input the desired phase value and the ruler value in the field.
Figure 9-34 Phase Setting Screen
4. Tap Confirm in the upper-right corner to save the settings, or tap Cancel to exit
without saving.
⚫ Zero Baseline
The zero baseline is marked the 0 value in the Y-axis, showing the ground level of
each channel waveform.
After the channel is selected, the Zero Baseline can be adjusted by dragging the
Zero Baseline marker up/down along the Y-axis, or dragging the waveform up/down,
or moving the screen up/down in the grid.
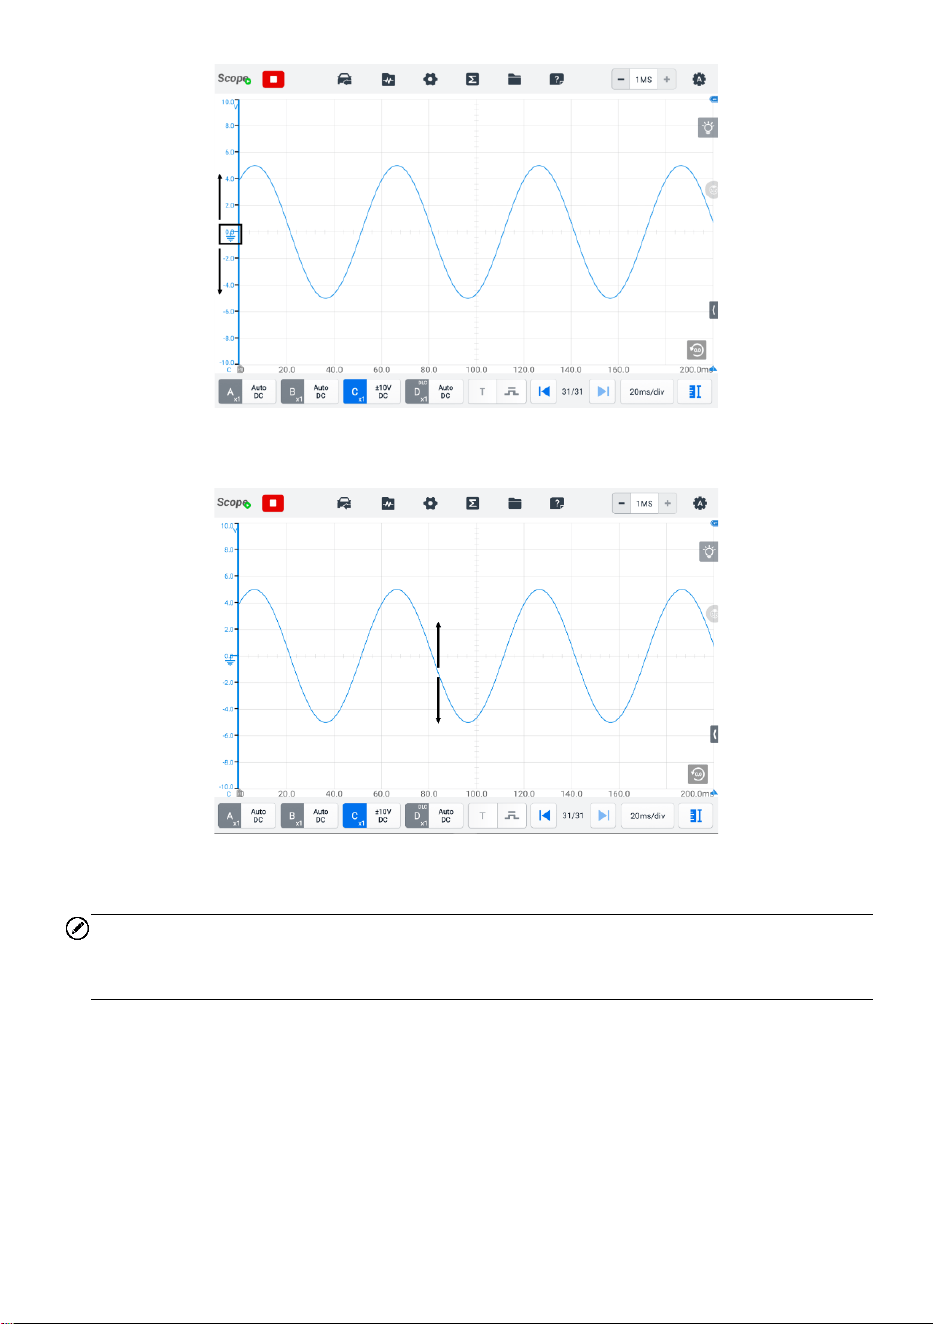
121
Figure 9-35 Dragging Zero Baseline Marker Screen
Figure 9-36 Dragging Waveform or Moving Screen
NOTE
To reposition waveform or to move the screen, tap the Zero Baseline marker to select.
The line will display thicker when selected.
⚫ Parameter and Help
Tap the arrow button in the lower-right corner of the screen to open the Parameter
and Help windows.
The Parameter function allows you to view the values of parameters including
sampling interval, sampling rate, sample size, channel, range, and coupling mode.
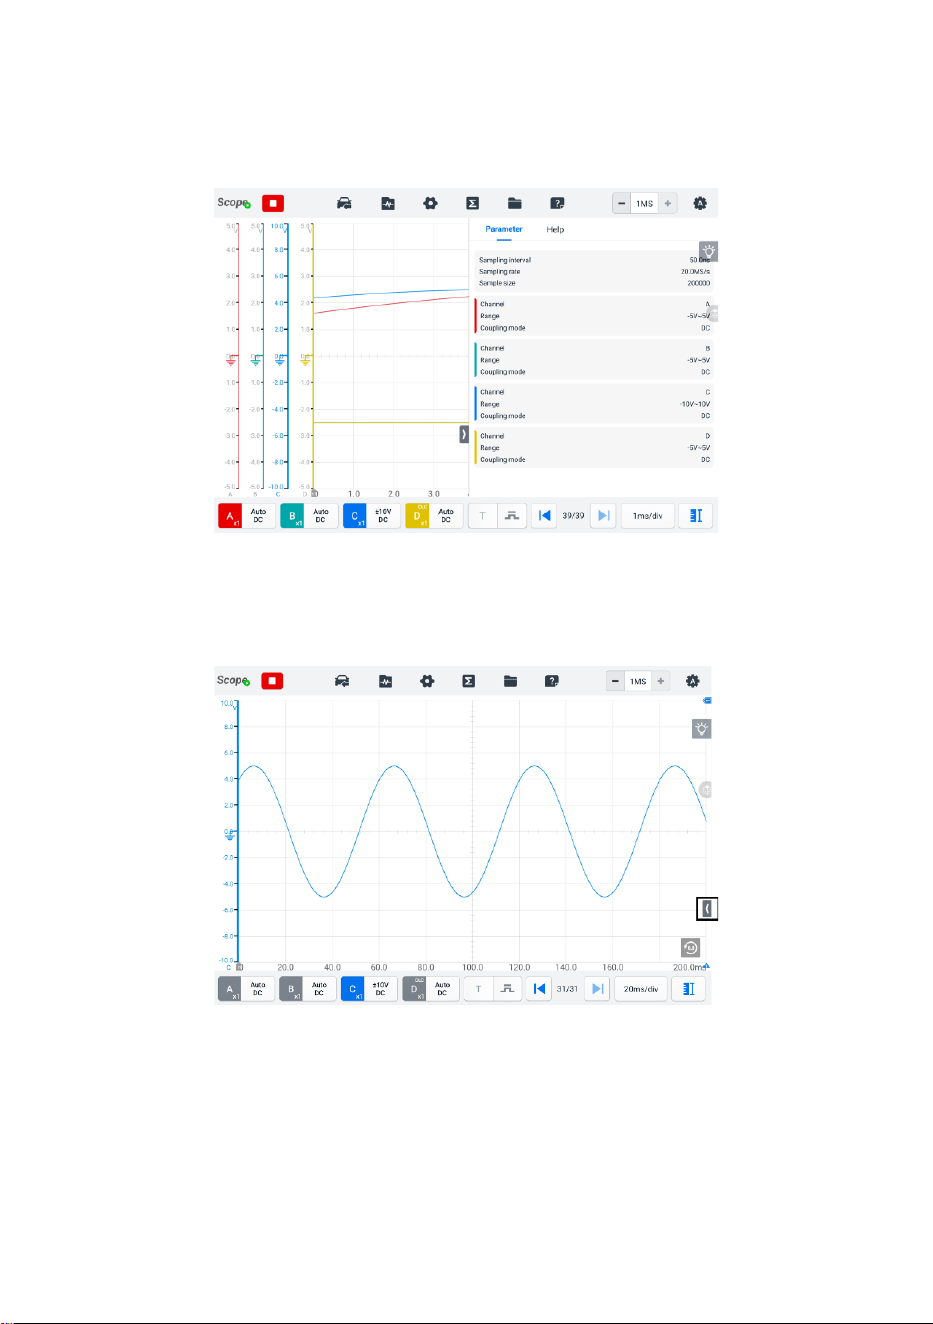
122
The Help function displays the user manual of the oscilloscope. The Help page also
displays when selecting the Help and User Manual buttons on the upper toolbar. The
help information can be full-page shown by tapping the four-directional arrow icon in
the lower right corner.
Figure 9-37 Parameter Screen
➢ To open or close the parameter and help window
1. Tap the arrow button on the right-hand side of the screen.
Figure 9-38 Arrow Button Position Screen
2. The parameter and help window appear.
3. To close, tap the arrow button again or tap any space outside of the window.
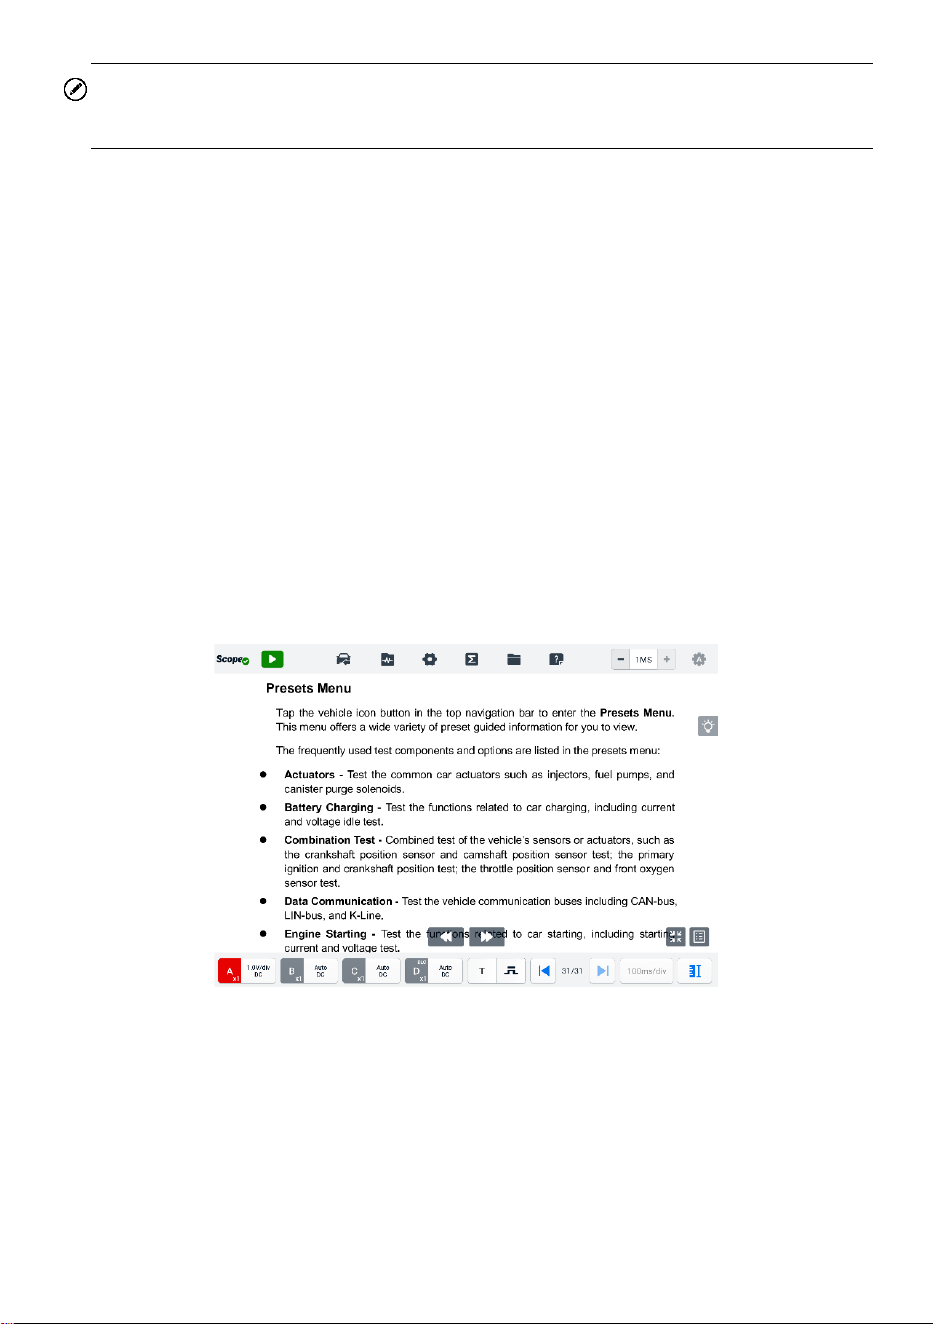
123
NOTE
The preset guided information is also displayed on the right side of the screen when the
specific options and test components have been selected from the Presets menu.
⚫ Real-time Help
The real-time help button is a bulb-shaped button that can be dragged and moved
on the screen.
Tap this real-time help button to directly switch to display all the relevant introduction
and test procedure information after you tap any function on the oscilloscope screen,
for better understanding the selected function.
➢ To view the real-time help information
Take the Presets function as an example.
1. Tap the Presets button on the upper toolbar to open the preset menu.
2. Tap the bulb-shaped real-time help button. All the information about the Presets
Menu is displayed on right side of the screen.
3. View the information by dragging it up and down using your fingertips. The real-
time help information can be displayed in a full screen by tapping the four-
directional arrow icon in the lower right corner. Tap it again to recover the half-
screen display.
Figure 9-39 Real-time Help Screen (Full Screen)
9.1.5.3 Lower Toolbar
The buttons in the lower toolbar include the channel control buttons, trigger setting
buttons, buffer button, time base button, and measurement button. The following table
provides a brief description of each button.
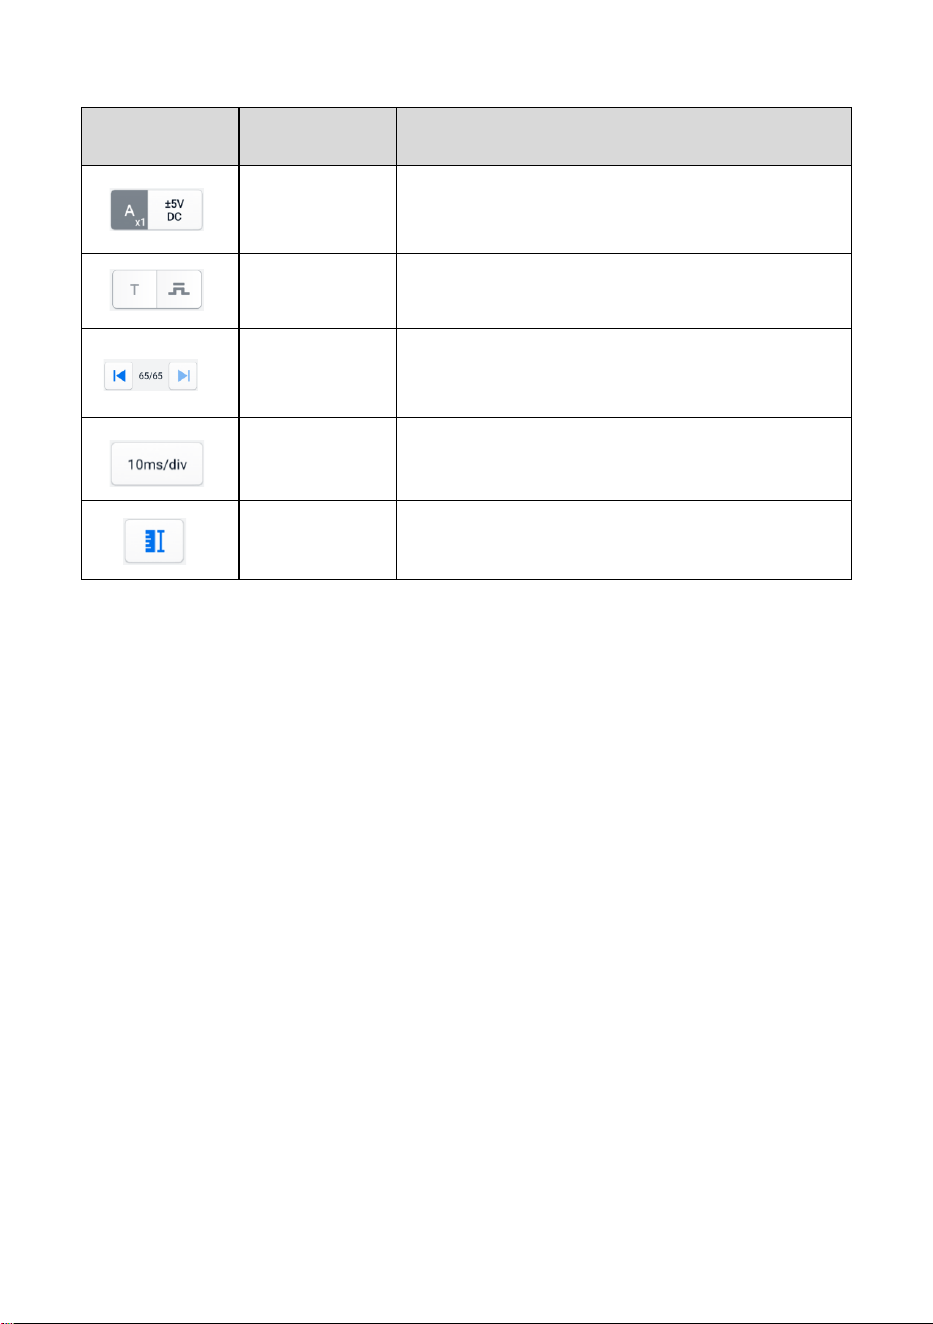
124
Table 9-5 Lower Toolbar
Button
Name
Description
Channel
Control
Tap to configure the settings of each channel.
Active channel icons display in color; inactive
icons display in gray.
Trigger
Tap to open the trigger setting menu.
Buffer
Tap the Back or Next button to scroll to the
previous or the next frame in the waveform.
Time Base
Tap to select an appropriate time per division.
Measurement
Tap to select an appropriate measurement.
⚫ Channel Control
There are four input channels: input channel A, input channel B, input channel
C, and input channel D. The four channel buttons display on the lower left side of
the screen. Set the input channel(s) through the corresponding channel control
button(s).
Each Channel Control button includes Amplitude Setting, Probe Setting, Probe Edit,
and Low-pass Filtering. The probe name is displayed in the lower-right corner of the
left column of the channel control button. The amplitude is displayed in the right
column of the channel control button.
➢ To activate and close the channel
1. Tap the left column of the channel control button to activate the channel. The
button color changes from gray to the corresponding color of the channel.
2. Tap the right column of the channel control button to open the settings dialog
box.
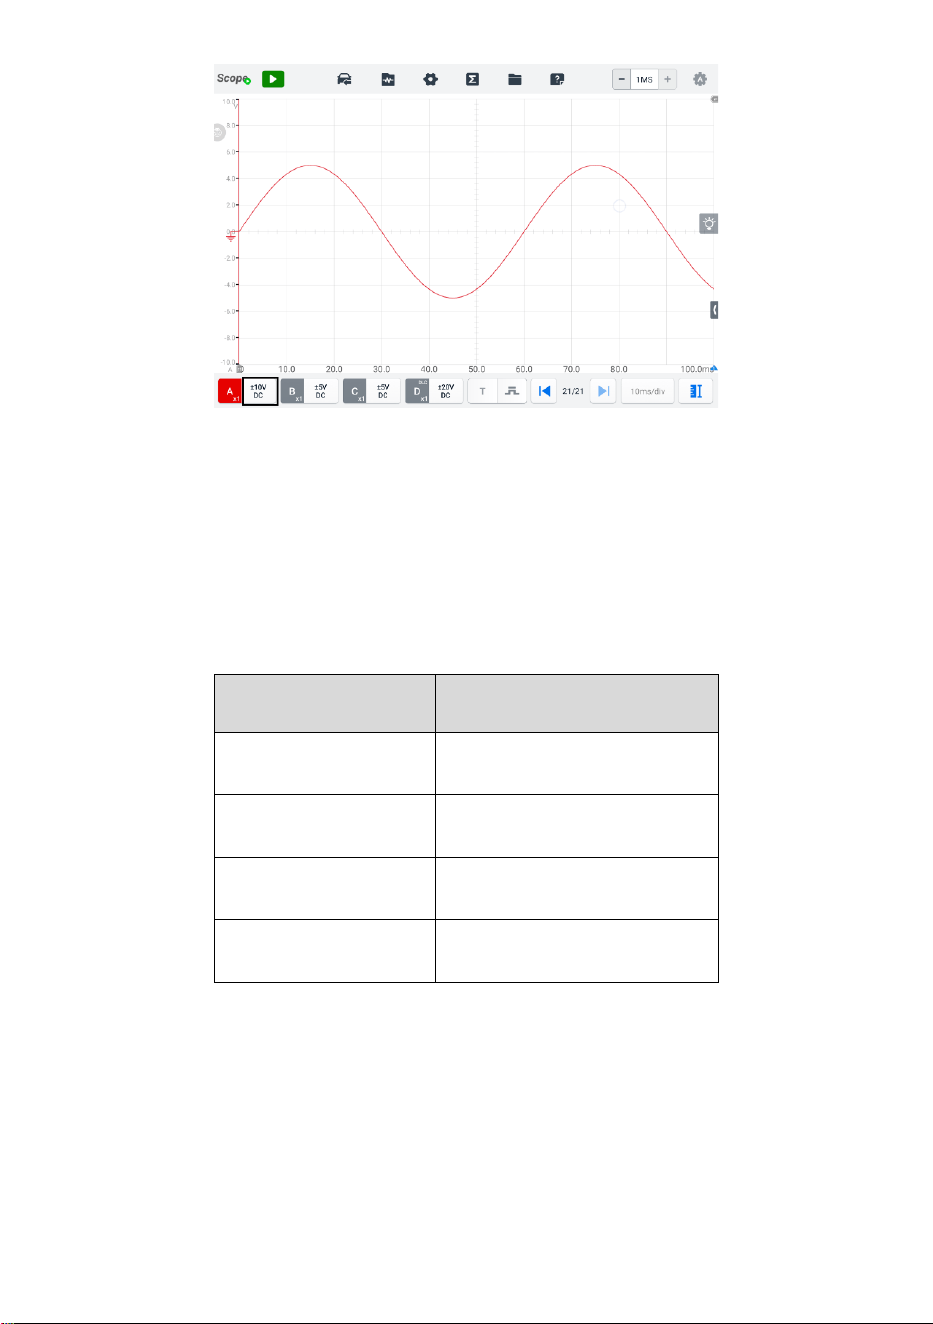
125
Figure 9-40 Activate Channel Screen
3. Tap the left column of channel control button again to close the channel. The
closed channel button displays gray.
Channel Color
Identify each channel waveform by color.
Table 9-6 Channel Color Table
Input Channel
Color
A
Red
B
Green
C
Blue
D
Yellow
Amplitude Setting
The amplitude, probe, and low-pass filtering settings can be configured in the
Channel control dialog box.
The amplitude setting allows you to set up the oscilloscope to capture signals
with the specified range. If the input signal exceeds the selected range, an over-
range indicator will be displayed. Select Auto to enable the device to adjust the
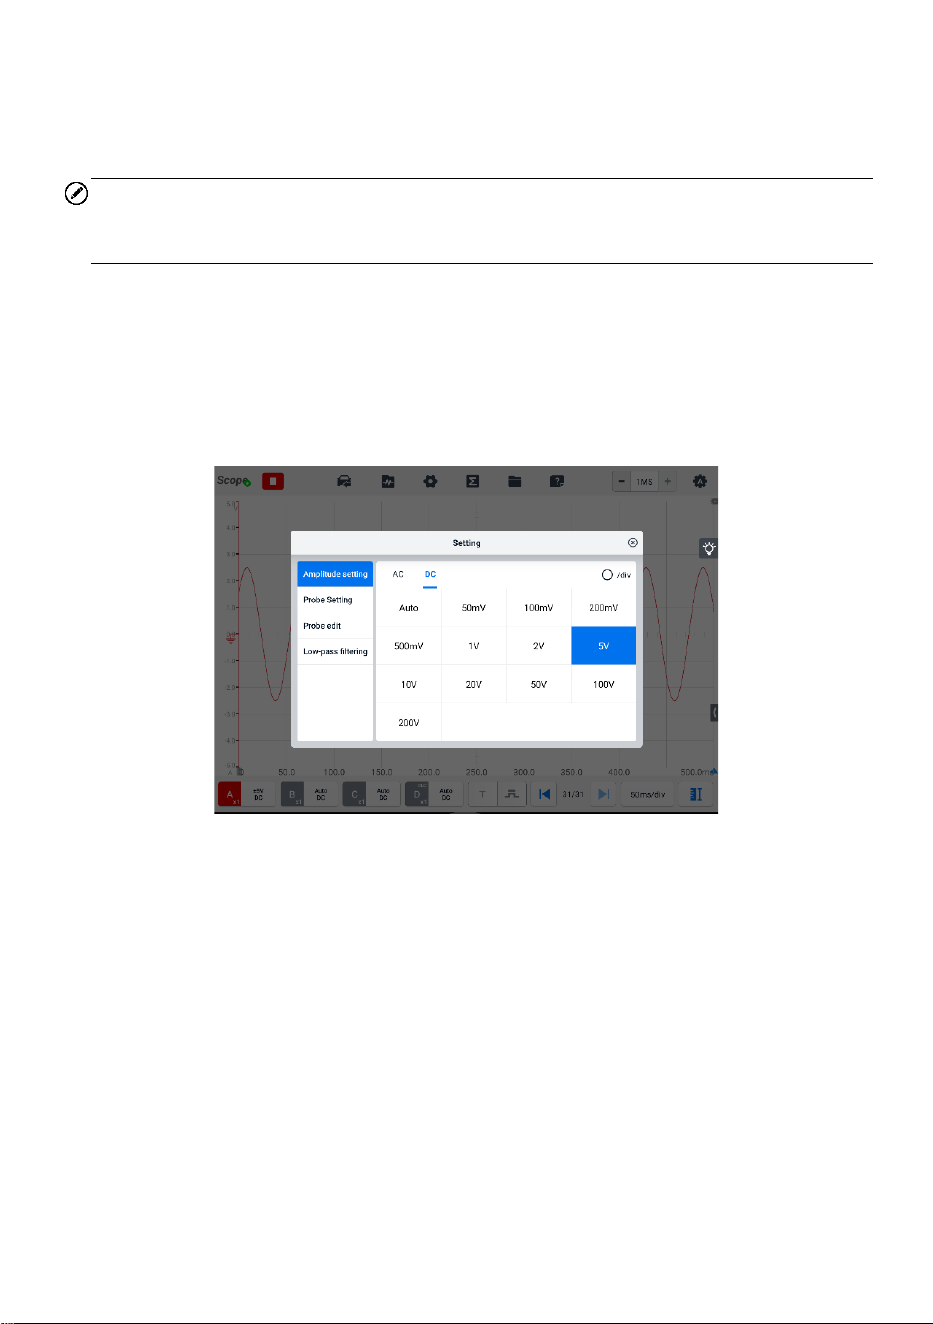
126
vertical scale automatically.
The vertical scale will be changed, while the horizontal scale will not be changed.
AC and DC voltage can be toggled to set up the input circuitry.
NOTE
The vertical scale is ALWAYS divided into 10 major divisions, and all scale settings reflect
in these 10 divisions. The division set of 10 cannot be changed.
There are two modes available to set the amplitude value.
Mode 1: For example, selecting DC 5 V sets the channel amplitude to ±5 DC
(displayed on the right side of the channel control button), the vertical scale
range is from -5 V to +5 V. The vertical scale is divided into 10 segments, each
segment increases by 1 V.
Figure 9-41 Amplitude Setting Screen (DC 5 V)
Mode 2: Select the ## /div button to adjust value incremented by each division.
For example, selecting DC 1.0 V/div, sets the channel amplitude to 1.0 V/div
DC (seen at the right side of the channel control button). Each segment
increases by 1 V. As the vertical scale is divided into 10 segments, the entire
vertical scale range is from -5 V to +5 V.
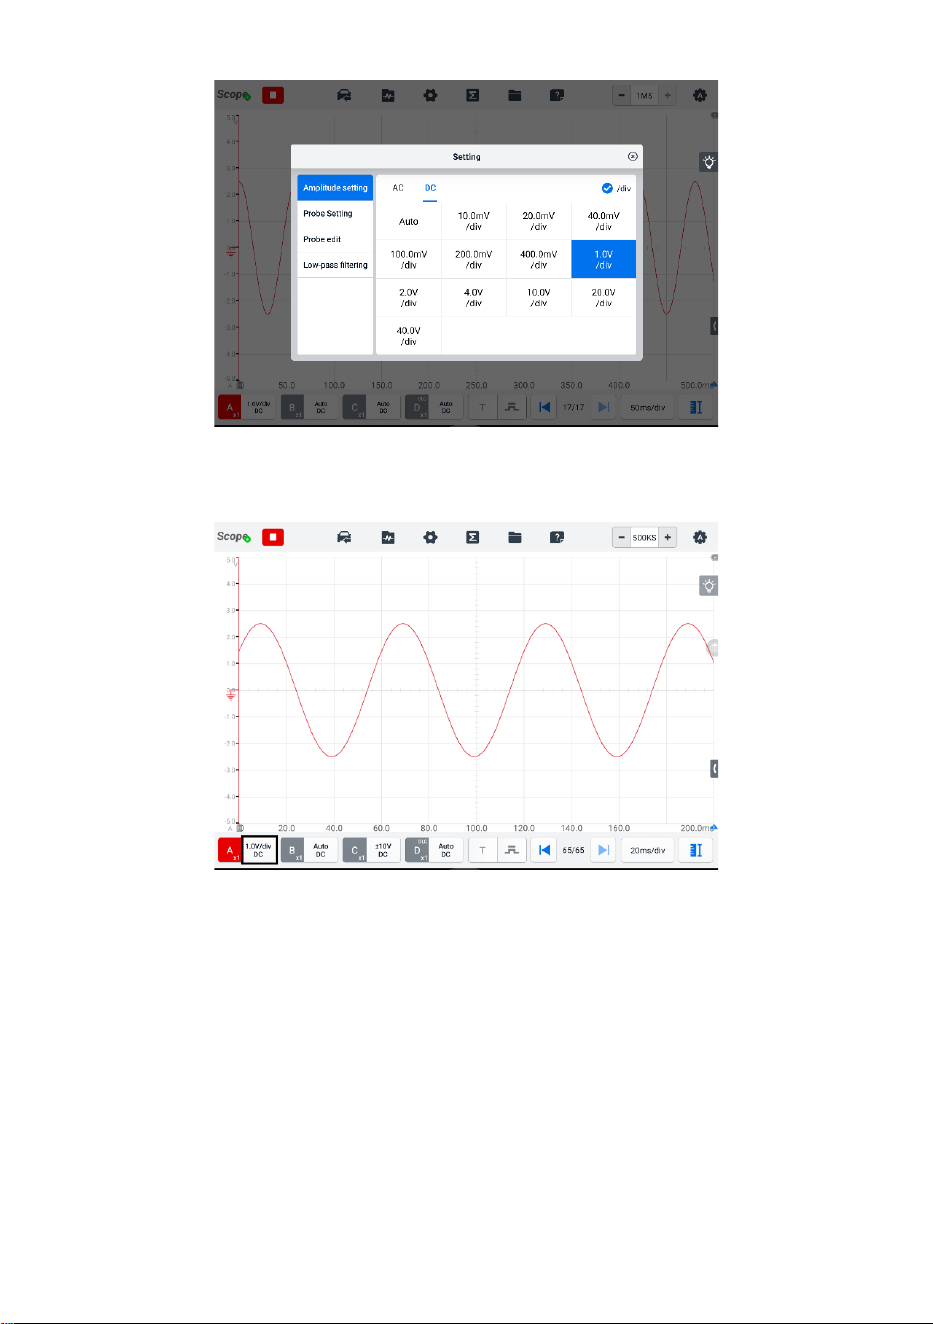
127
Figure 9-42 Amplitude Setting Screen (DC 1.0 V/div)
Figure 9-43 Amplitude Setting Screen (DC 1.0 V/div)
Probe Setting
A probe is an accessory that connects to your oscilloscope and to detect signals
to be measured.
This oscilloscope has built-in definitions of standard probes. By default, the
probe is set to be x1, which means 1V signal at the input to the probe will display
as 1V.
The inner probes (built-in probes) include:

128
✓ X1: no attenuation
✓ 10∶1 Attenuator: select when using a 10-fold attenuation probe
✓ 20∶1 Attenuator: select when using a 20-fold attenuation probe (SA020)
✓ X1000: select when using a 1,000-fold attenuation probe
✓ 65 A Current Clamp (1 mV/10 mA mode, Max: 20 A): 1 mV/10 mA mode
on 65 A current clamp, the max. current is 20 A
✓ 65 A Current Clamp (1 mV/100 mA mode, Max: 65 A): 1 mV/100 mA
mode on 65 A current clamp, the max. current is 65 A
✓ 650 A Current Clamp (1 mV/100 mA mode, Max: 200 A): 1 mV/100 mA
mode on 650 A current clamp, the max. current is 200 A
✓ 650 A Current Clamp (1 mV/1 A mode, Max: 650 A): 1 mV/1 A mode on
650 A current clamp, the max. current is 650 A
✓ Coil-On-Plug Ignition Probe [COP]: select when using the COP ignition
probe (SA271)
✓ Secondary Ignition Probe [ignition]: select when using the secondary
ignition probe (SA273)
✓ Secondary Ignition Probe (inverted) [R_ignition]: select when using the
secondary ignition probe (SA273) and inverting the secondary ignition
signal
You can select the inner standard probes in the probe settings. After selecting
a correct probe, the settings can be seen in the lower right corner of the left
column of the channel control button, indicating the probe is in use.
Tap the question mark icon to view the image of the corresponding current
clamp in full screen.
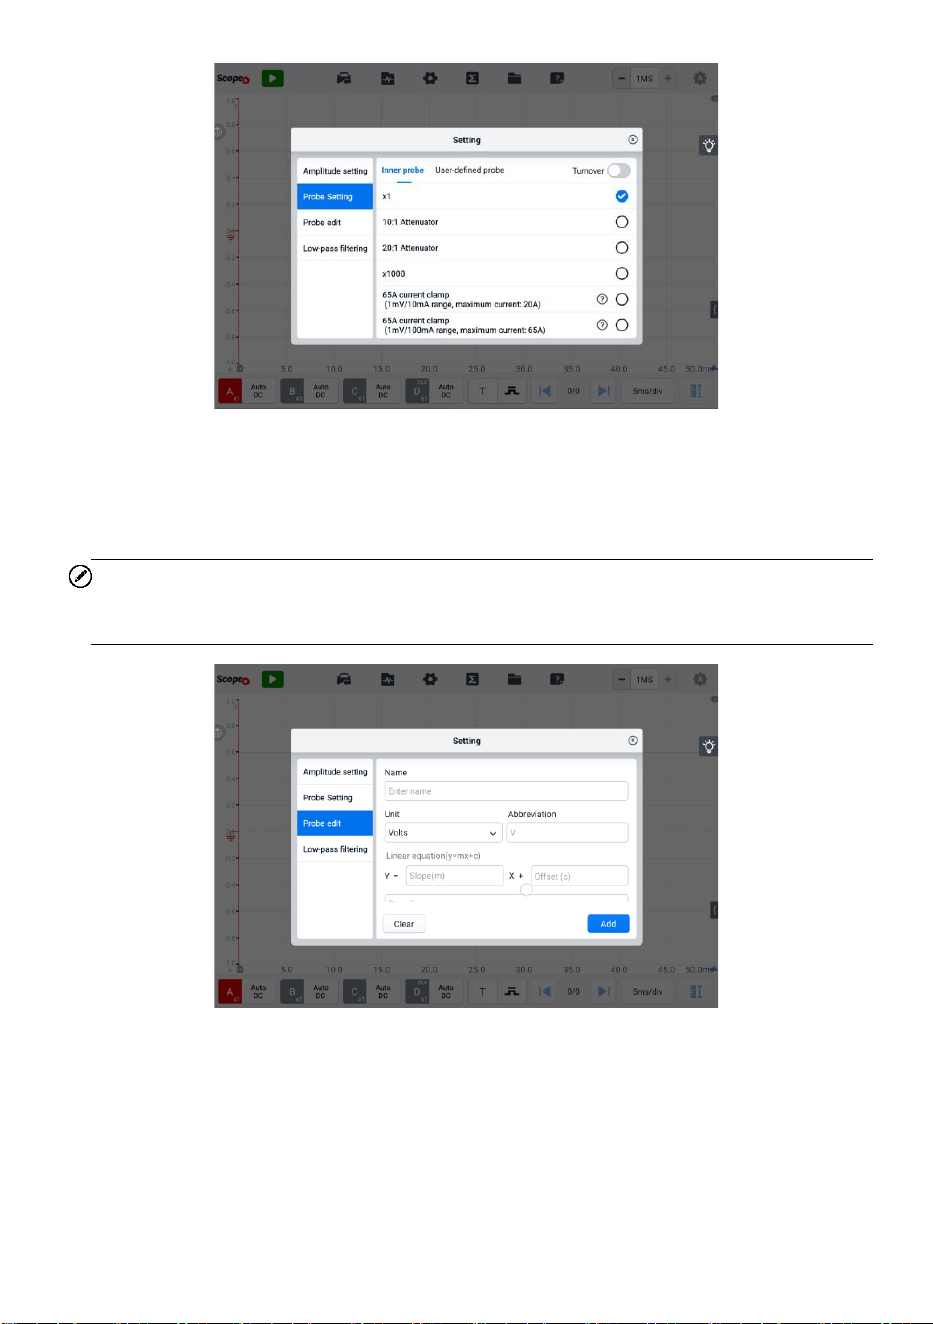
129
Figure 9-44 Inner Probe Setting Screen
Probe Edit
Add custom probes not included in the built-in standard probe menu.
NOTE
Please refer to the probe's instruction manual or consult the corresponding manufacturer
for the linear equation (y=mx+c).
Figure 9-45 Probe Edit Screen
➢ To add custom probes
Add a 20∶1 Attenuator as an example:
1. Tap the right column of the channel control button at the bottom of the screen
to open the setting dialog box.
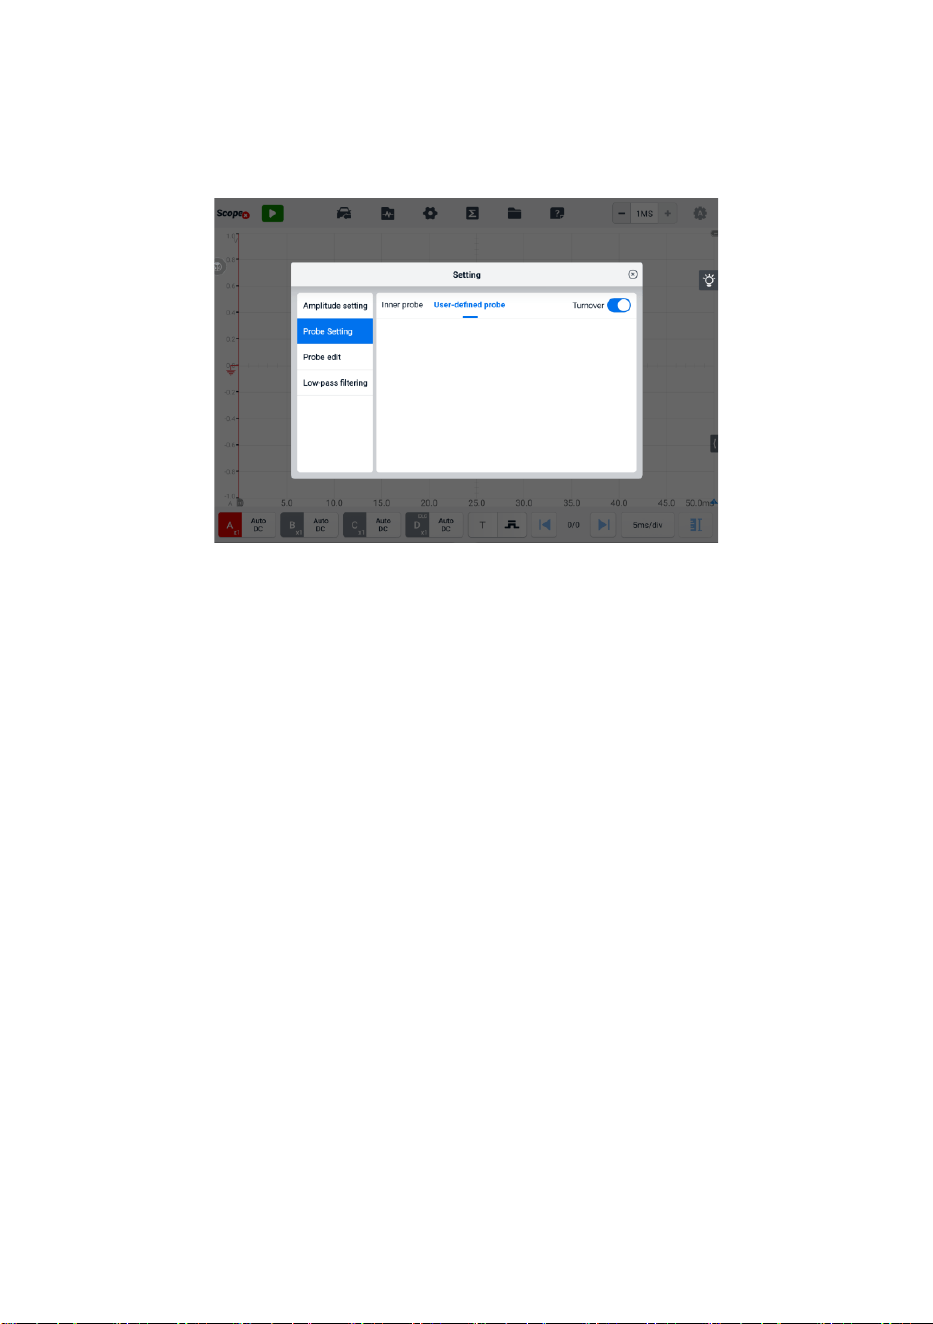
130
2. Select the Probe Edit option in the left column of the dialog box.
3. Tap each field to open the virtual keyboard and input the required information.
4. Tap Add to save the settings, or tap Clear to exit without saving.
5. The added probe will be listed in the Probe Setting window.
Figure 9-46 Probe Setting Screen (User-defined Probe)
LPF (Low-pass Filtering)
The Low-pass Filtering (LPF) is an independent digital low-pass filter for each
input channel used to remove noise from the signal.
This function is used to filter the high frequency signal of the selected input
channel for more accurate measurements. Take the two screenshots below as
an example to show the comparison with or without setting the low-pass filtering.
The following screenshots how the difference between waveforms with the low-
pass filtering and waveforms without the low-pass filtering.
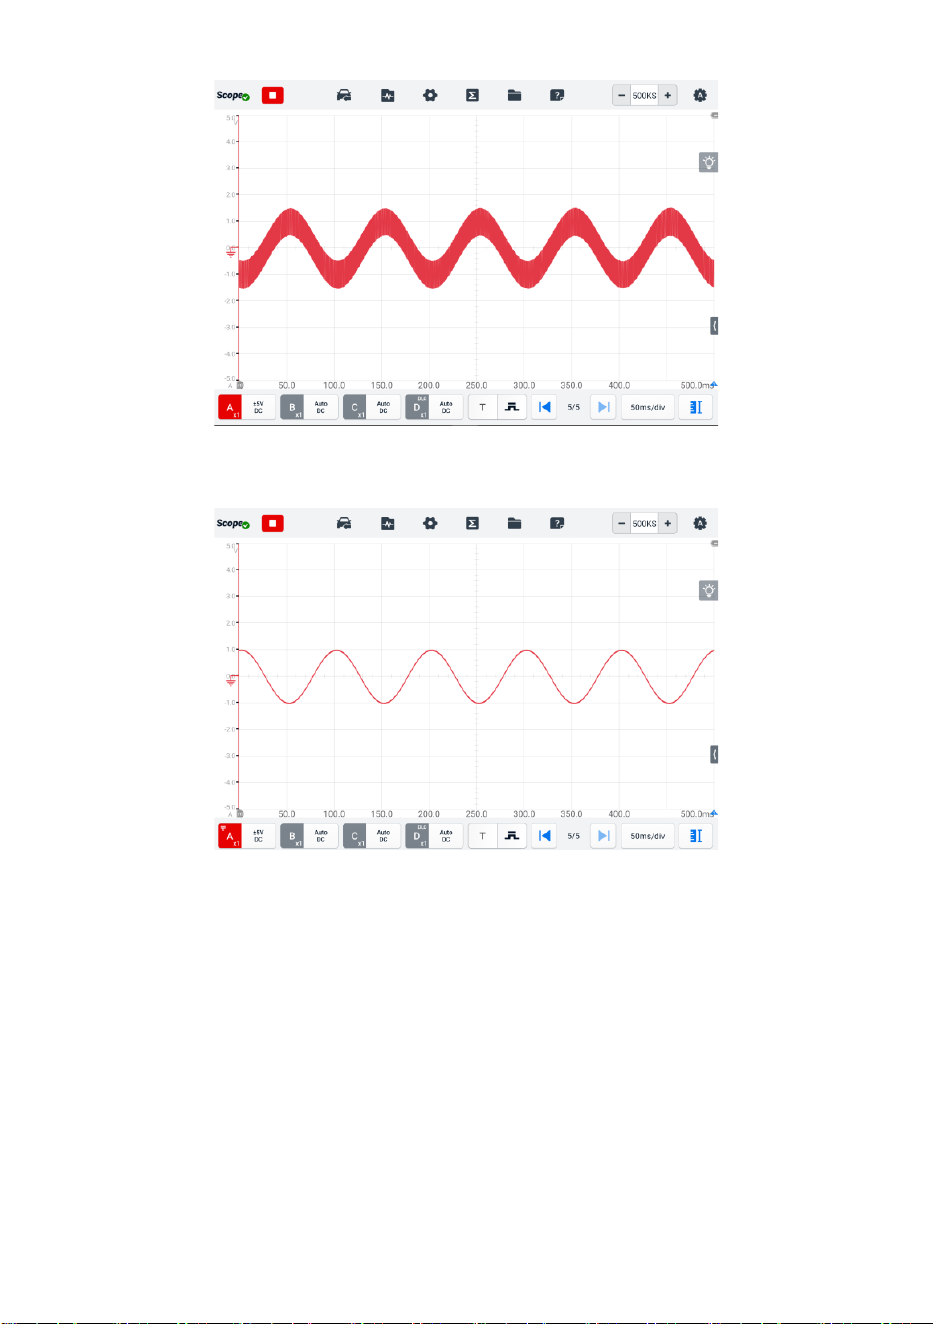
131
Figure 9-47 Before Setting Low-pass Filtering Screen
Figure 9-48 After Setting Low-pass Filtering Screen
➢ To configure the low-pass filtering settings
1. Tap the right column of the channel control button to open the setting dialog box.
2. Select the Low-pass Filtering option from the left column of the dialog box.
3. Tap the checkbox of the appropriate channel and adjust the frequency by
tapping the minus or plus. The unit can be switched to Hz, KHz or MHz from
the dropdown list.
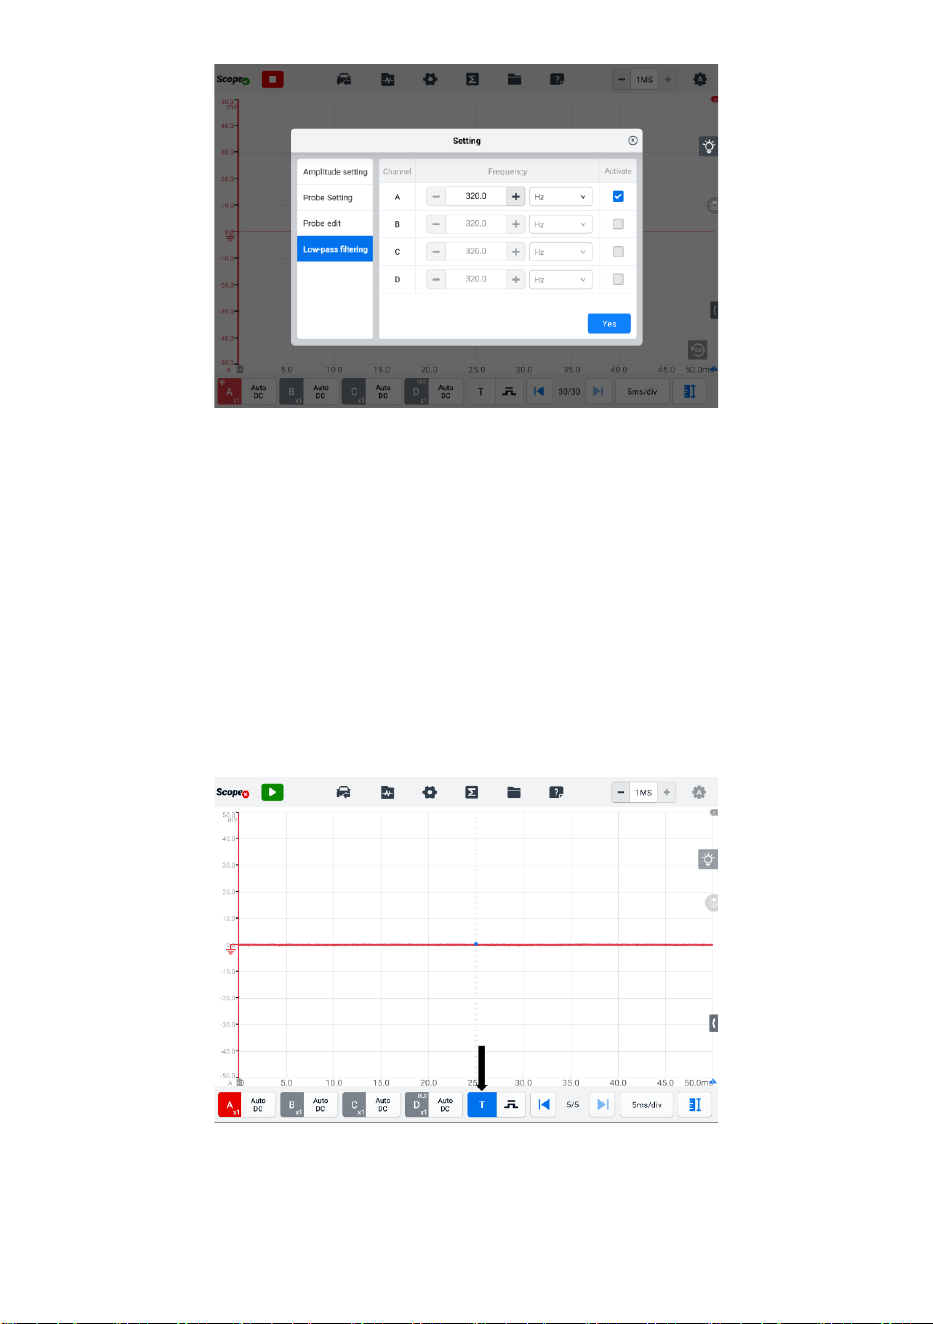
132
Figure 9-49 Low-pass Filtering Screen
4. Close the dialog box directly to exit without saving.
⚫ Trigger
The trigger feature is used to filter and capture specified waveform data.
According to the trigger setting condition, the trigger waveform will be captured when
the signal meets the trigger condition. When capturing waveforms, you can manually
set the trigger conditions.
When the oscilloscope is capturing the signal, tap the left column of the Trigger
button to activate the trigger function. A trigger point will be shown as a blue point.
Figure 9-50 Trigger Point Screen
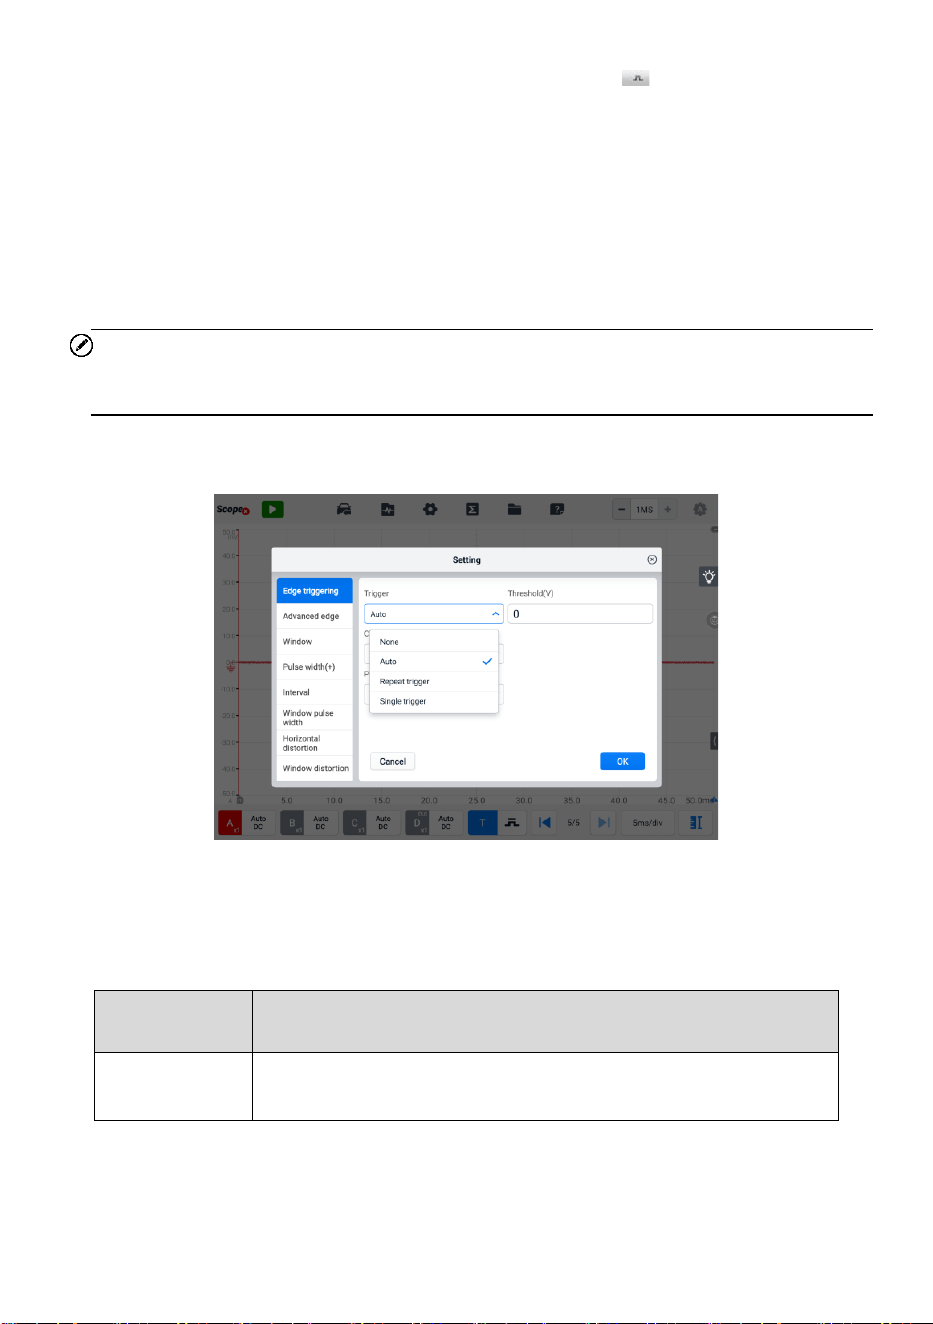
133
When the oscilloscope is capturing the signal, tap the icon to open the trigger
settings dialog box.
Edge Triggering
The edge trigger is one of the most common trigger modes and is activated
when voltage rises above or falls below a preset threshold. This trigger type
allows you to configure the trigger mode, threshold, trigger channel and pulse
direction settings. Tap OK to save the settings or tap Cancel to exit without
saving.
NOTE
The oscilloscope switches to the continuous mode if the time base is set to more than or
equal to 200 ms/div. The Edge Triggering is supported in the continuous mode.
⚫ Trigger Mode
Four trigger modes are available: None, Auto, Repeat, and Single.
Figure 9-51 Trigger Mode Screen
The table below offers brief descriptions for each trigger mode.
Table 9-7 Trigger Mode Table
Trigger Mode
Description
None
In this trigger mode, the oscilloscope can continuously capture
data, without waiting for a trigger event.

134
Trigger Mode
Description
Auto
In this trigger mode, the oscilloscope will wait for a trigger before
capturing data. It can automatically update after a short period,
even if the signal does not across the trigger point.
Repeat
In this trigger mode, the oscilloscope waits until a trigger event
occurs. If there is no trigger event, nothing will be displayed on
the screen.
Single
In this trigger mode, the oscilloscope stops capturing data once
a trigger event occurs.
⚫ Channel
Select the applicable trigger channel from the dropdown menu. The
selected channel is the one that the oscilloscope monitors for the trigger
condition.
⚫ Pulse Direction
Two pulse direction settings are available: Rise and Fall.
Rise Edge Trigger — indicates trigger is turned on to start the trace on the
rising edge of the waveform.
Fall Edge Trigger — indicates trigger is turned on to start the trace on the
falling edge of the waveform
⚫ Threshold
The Threshold allows you to set the voltage threshold for the trigger.
✓ To precisely position the trigger point, input the value in the Threshold
field in the trigger settings dialog box.
✓ To roughly position the trigger point, drag the trigger point to a desired
position.
➢ To configure the trigger settings
1. Tap the right column of the Trigger button to open the trigger settings dialog
box.
2. Select the trigger mode, trigger channel, and pulse direction in the dropdown
list.
3. Input the value in the Threshold field in the trigger settings dialog box.
4. Tap OK to save settings or tap Cancel to exit without saving.
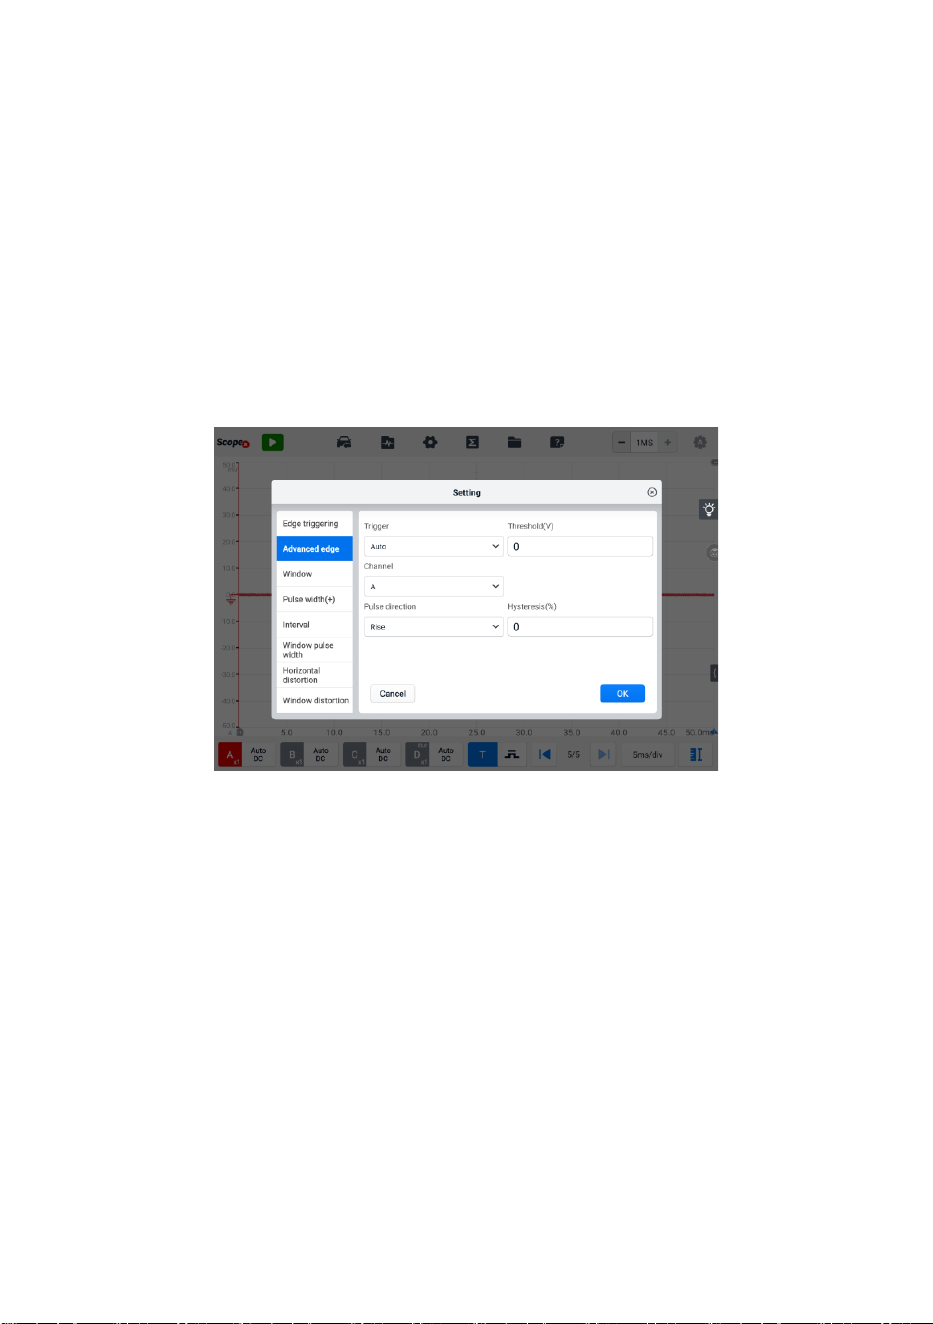
135
Advanced Edge
This trigger type includes all the functions of the edge trigger type, plus two
additional options: the Rising or Falling option and the hysteresis option.
Rising or Falling option in the dropdown menu of the pulse direction: Dual
edges of a waveform can be triggered. This mode is especially useful for
monitoring pulses of both polarities at once.
Hysteresis option: It is used to reduce false triggering on noisy signals. When
hysteresis is enabled, a second trigger threshold voltage is used in addition to
the main trigger threshold. The trigger fires only when the signal crosses the
two thresholds in the correct order. The first threshold arms the trigger, and the
second causes it to fire.
Figure 9-52 Advanced Edge Settings Screen
Window
This trigger type is used to monitor when the signal enters or exits a specified
voltage window.
Three options are available for the pulse direction: Entering, Exiting, Entering
or Exiting. Threshold 1 and Threshold 2 are the upper and lower voltage limits
of the window.
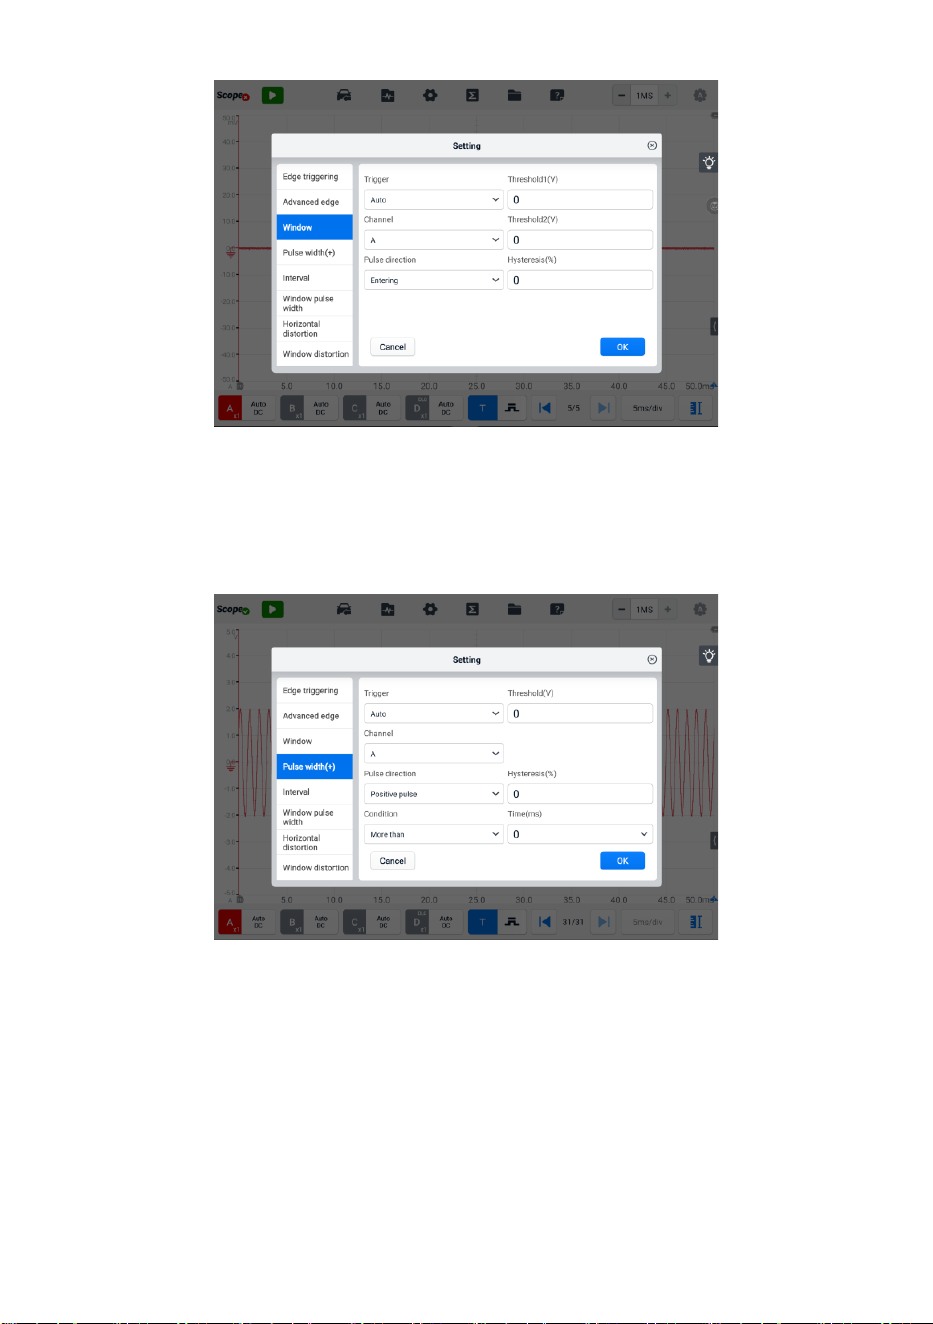
136
Figure 9-53 Window Settings Screen
Pulse Width (+)
This trigger type allows you to monitor pulses of a specified width.
Figure 9-54 Pulse Width Settings Screen
➢ To set the pulse width (+)
1. Tap the Trigger button at the bottom of the screen to open the Trigger Settings
dialog box.
2. Select the Pulse Width (+) in the left column of the dialog box.
3. Select the desired trigger mode and channel mode.
4. Set the pulse direction to either Positive pulse or Negative pulse according to

137
the polarity of the pulse.
5. Select one of the four Conditions:
⚫ More than: triggers on pulses wider than the specified time.
⚫ Less than: triggers on pulses narrower than the specified time.
⚫ In the time range: triggers on pulses wider than Time 1 and narrower than
Time 2.
⚫ Out of the time range: triggers on pulses narrower than Time 1 or wider
than Time 2.
6. Set the trigger Threshold and Hysteresis.
7. Set the Time 1 or Time 2 in minutes (if available) to define the pulse width.
8. Tap OK to save settings or tap Cancel to exit without saving.
Interval
This trigger type allows you to search for two consecutive edges of the same
polarity separated by a specified time interval.
For the setting operation, please refer to the operation steps of Pulse Width, but
the pulse direction with Rise or Fall selection instead of Positive or Negative.
Window Pulse Width
This trigger type combines with the window trigger and the pulse width trigger.
It detects when a signal enters or exits an input range and stays for a specified
period of time. Two Region options can be selected: In range and Out of range.
Horizontal Distortion
This trigger type can be monitored when the signal goes high or low for longer
than the specified time.
Window Distortion
This trigger type monitors when a signal enters a specified voltage range and
stays within that range for a specified period of time.
Underthrow
This trigger type monitors a pulse that exceeds one threshold and then drops
below the threshold without exceeding the second threshold. This type of trigger
is typically used to find pulses that do not reach a valid logic level.
⚫ Buffer
The buffer is used to store the captured waveform data for real-time and playback
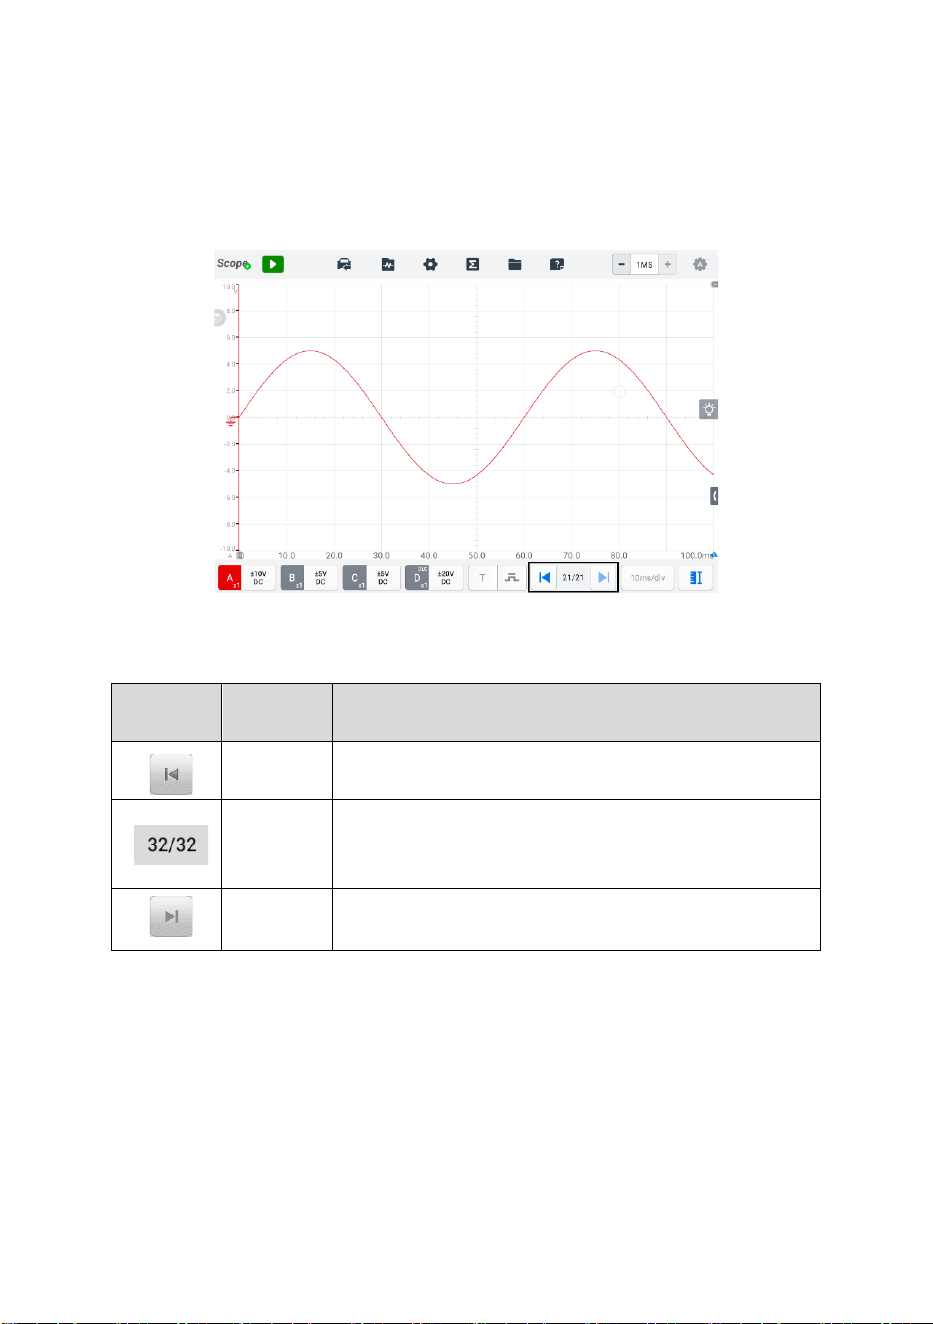
138
display.
The oscilloscope can capture and store waveforms. Select a waveform from the
waveform buffer by tapping the Previous or Next button.
The waveform buffer displays the current waveform number and the total number of
stored waveforms.
Figure 9-55 Buffer Screen
Button
Name
Description
Previous
Tap to display the previous waveform in the buffer.
Buffer
Index
Displays the number of the waveform currently
displayed onscreen out of the total number of
buffered waveforms.
Next
Tap to display the next waveform in the buffer.
⚫ Time Base
The Time Base controls the oscilloscope data sampling display time. Tap the Time
Base button at the bottom to open the setting dialog box.
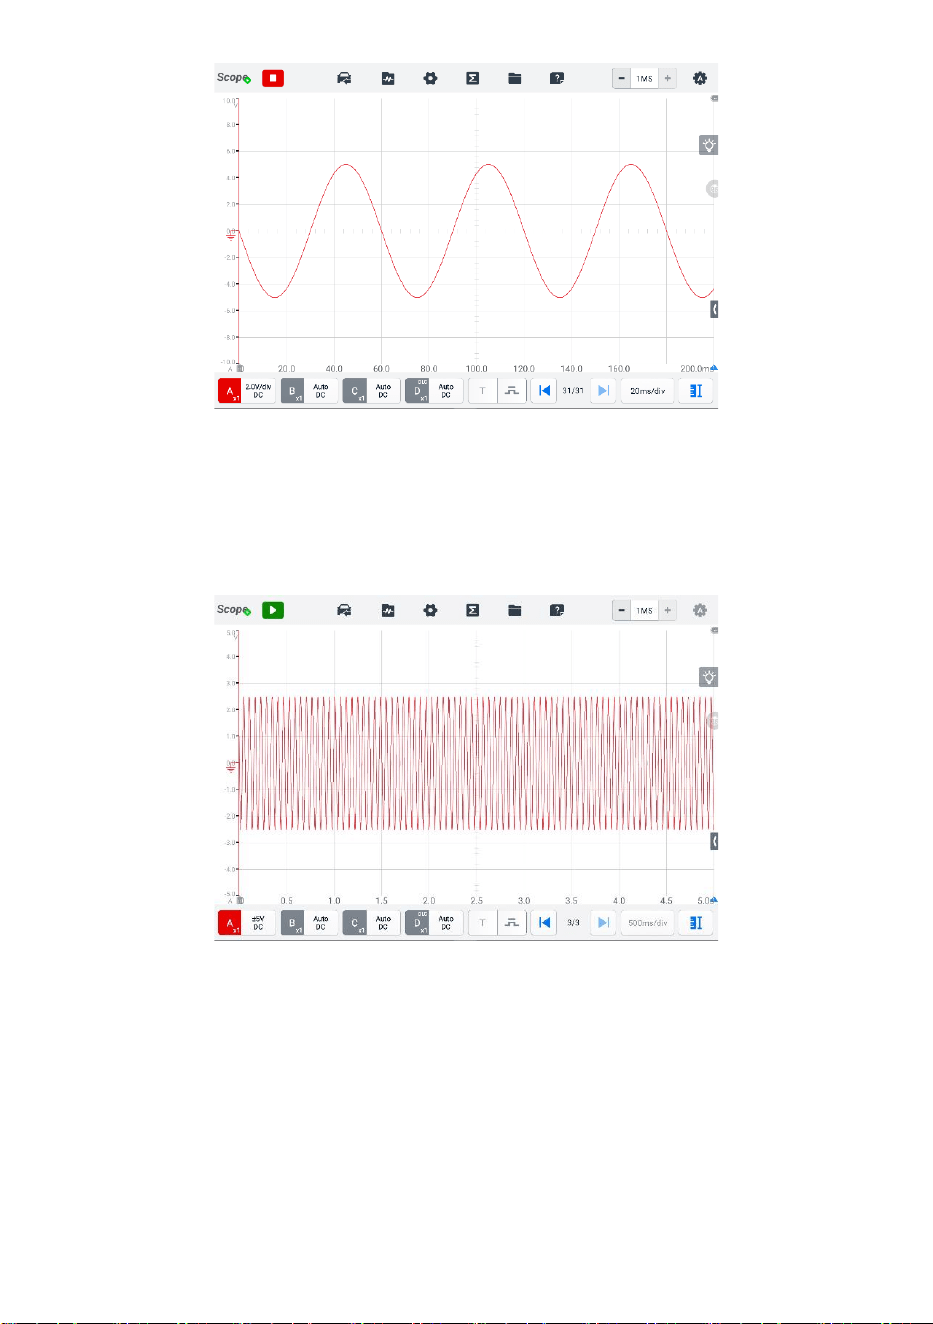
139
Figure 9-56 Time Base Screen 1 (Normal Mode)
Continuous Mode: if the time base is set to more than or equal to 200ms/div, the
oscilloscope switches to the continuous mode. In this mode, the oscilloscope
updates the trace continuously as each capture progresses, rather than waiting for
a complete capture before updating the trace.
Figure 9-57 Time Base Screen 2 (Continuous Mode)
⚫ Measurement
The available measurements for each channel are (from left to right):
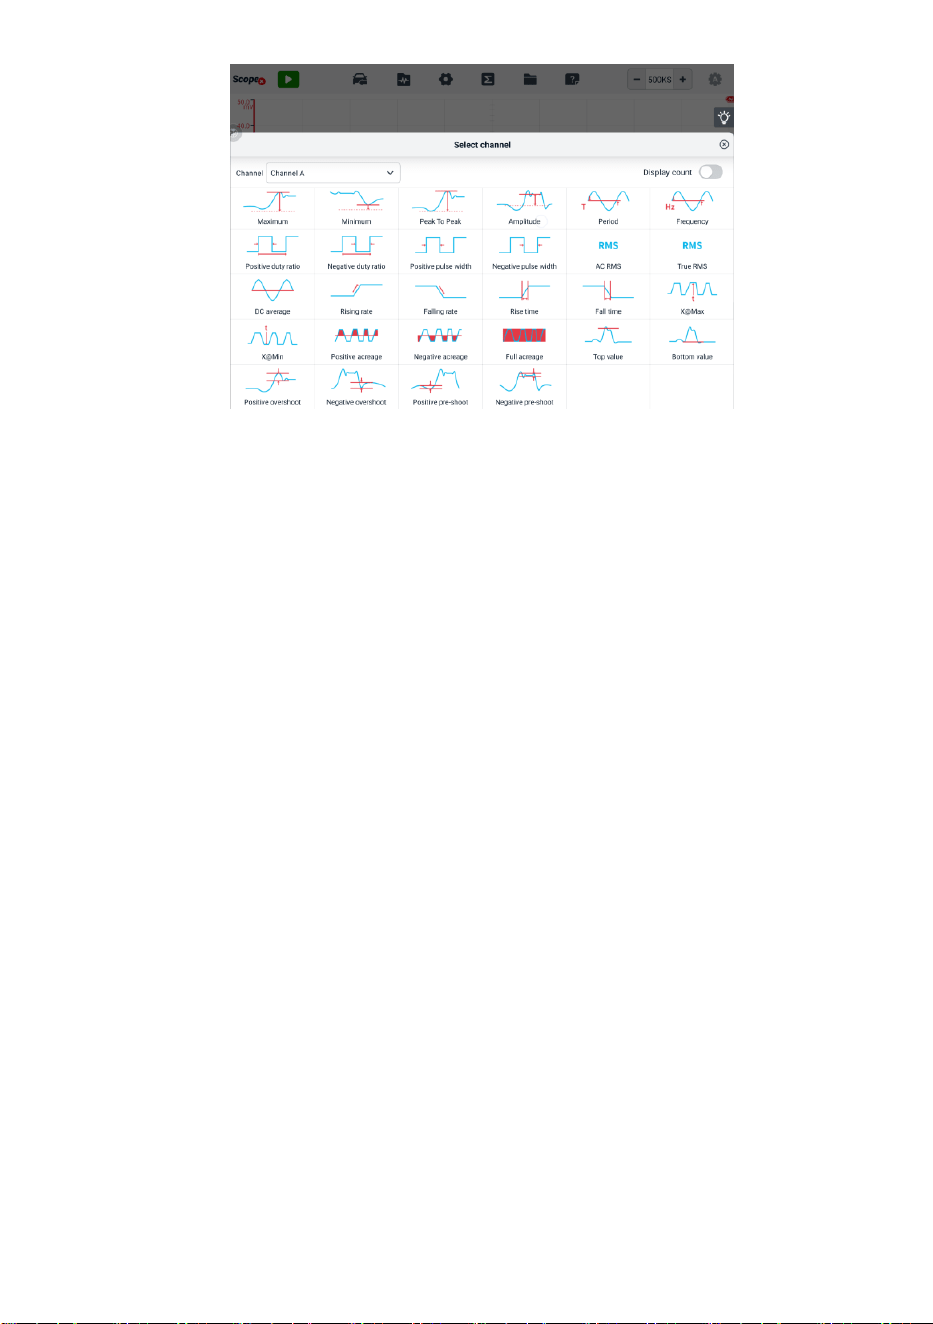
140
Figure 9-58 Measurement Screen
Maximum — the highest level that the signal reaches
Minimum — the lowest level that the signal reaches
Peak To Peak — the difference between maximum and minimum
Amplitude — the top value minus the bottom value
Period — the duration of one cycle in a repeated pattern in the waveform
Frequency — the number of signal occurrences per second
Positive Duty Ratio — the ratio of positive pulse width to period width
Negative Duty Ratio — the ratio of negative pulse width to period width
Positive Pulse Width — the amount of time that the signal spends above its
average value
Negative Pulse Width — the amount of time that the signal spends below its
average value
AC RMS — the root mean square (RMS) value of the waveform minus the DC
Average
True RMS — the root mean square (RMS) value of the waveform, including the
DC component
DC Average — the average value of the waveform
Rising Rate — the rate at which the signal level rises
Falling Rate — the rate at which the signal level falls
Rise Time — the time the signal takes to rise from the lower threshold to the
upper threshold
Fall Time — the time the signal takes to fall from the upper threshold to the

141
lower threshold
X@Max — the corresponding value of X axis when the amplitude is the
maximum
X@Min — the corresponding value of X axis when the amplitude is the minimum
Positive Acreage — the waveform acreage measured above the zero baseline
Negative Acreage — the waveform acreage measured below the zero baseline
Full Acreage — the positive acreage plus negative acreage
Top Value — 90% of the waveform maximum value
Bottom Value — 10% of the waveform minimum value
Positive Overshoot — the ratio of the difference between the maximum value
and the top value and the amplitude
Negative Overshoot — the ratio of the difference between the bottom value
and the minimum value and the amplitude
Positive Pre-shoot — the ratio of the difference between the bottom value and
the minimum value and the amplitude
Negative Pre-shoot — the ratio of the difference between the maximum value
and the top value and the amplitude
NOTE
When connecting via Wi-Fi , it only supports Maximum, Minimum, Peak To Peak,
Amplitude, Period, Frequency, Positive Duty Ratio, Negative Duty Ratio, Positive Pulse
Width, Negative Pulse Width, AC RMS, True RMS, DC Average, X@Max, X@Min, Top
Value and Bottom Value.
In the Spectrum View, the available measurements are as follows.
✓ Frequency Peak Value — the frequency of the peak signal value
✓ Amplitude Peak Value — the amplitude of the peak signal value
✓ Average Amplitude Peak Value — the amplitude of the peak signal value captured
over multiple times
✓ Total Power — the power of the entire signal captured in the spectrum view
✓ Total Harmonic Distortion Percentage (THD) — the ratio of the sum of harmonic
powers to the power of fundamental frequency
THD=
√
V
1
2
+V
2
2
+V
3
2
+V
4
2
+V
5
2
V
f
✓ Total Harmonic Distortion (THD) dB: the ratio of the sum of harmonic powers to

142
the power of fundamental frequency
THD=10log
10
(
√
V
1
2
+V
2
2
+V
3
2
+V
4
2
+V
5
2
V
f
)
✓ Total Harmonic Distortion and Noise (THD + N) — the ratio of the harmonic power
plus noise to the fundamental power
THD+N=10log
10
(
THD+N
V
f
)
✓ Spurious-free Dynamic Range (SFDR) - the ratio of the amplitude of the highest
peak in the spectrum to that of the second highest peak
✓ SINAD — signal to noise and distortion ratio. The ratio (in decibels) of the signal-
plus-noise-plus-distortion to noise-plus-distortion
SINAD=10log
10
(
Signal
Noise+noise
)
✓ Signal Noise Ratio (SNR) — the ratio (in decibels) of average signal power to
average noise power
SINAD=10log
10
(
Signal
Noise
)
✓ Inter-modulation Distortion (IMD) — a measure of distortion due to non-linear
mixing of two tones
IMD=
√
F
3
2
+F
4
2
F
1
2
+F
2
2
➢ To set the measurement
1. Tap the Measurement button at the bottom of the screen to open the
measurement dialog box.
2. Select the channel to be measured.
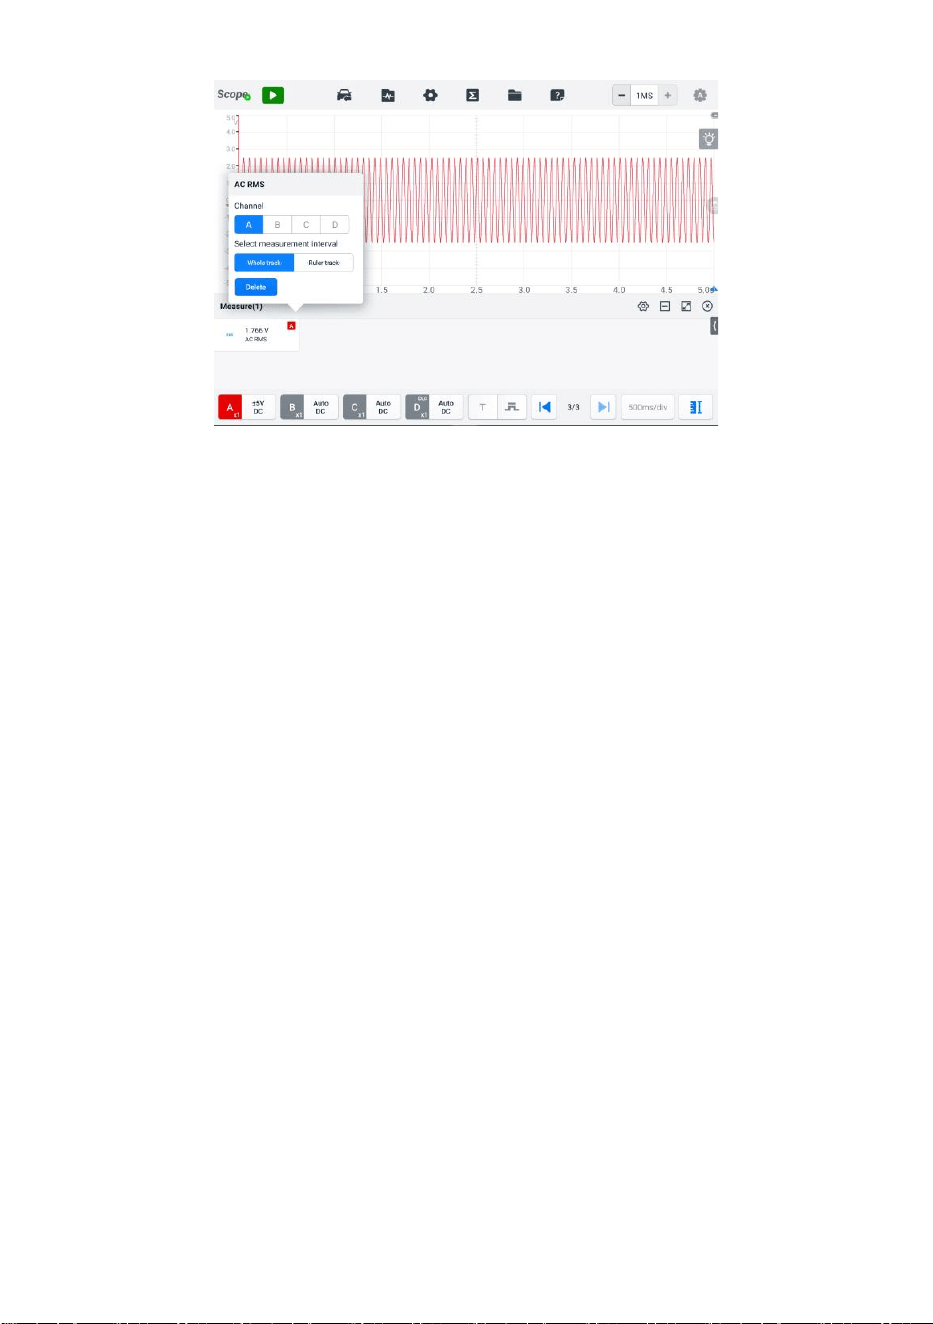
143
Figure 9-59 Measurement Setting Screen
3. Close the dialog box, and the corresponding measurement readings are
displayed on the lower side of the screen. The Whole Track and Ruler Track
can be toggled by tapping the reading. Adjust the whole track or ruler track on
the displayed screen, or tap Delete to delete the measurement.
➢ To set the measurements in Spectrum View
1. Tap the Settings button in the upper toolbar. A dialog box opens. Select the
Mode option in the dialog box, and then tap to select Spectrum View.
2. Tap the Measurement button at the bottom of the screen to open the
measurement dialog box.
3. Select the channel to be measured.
4. Select the appropriate measurement options.
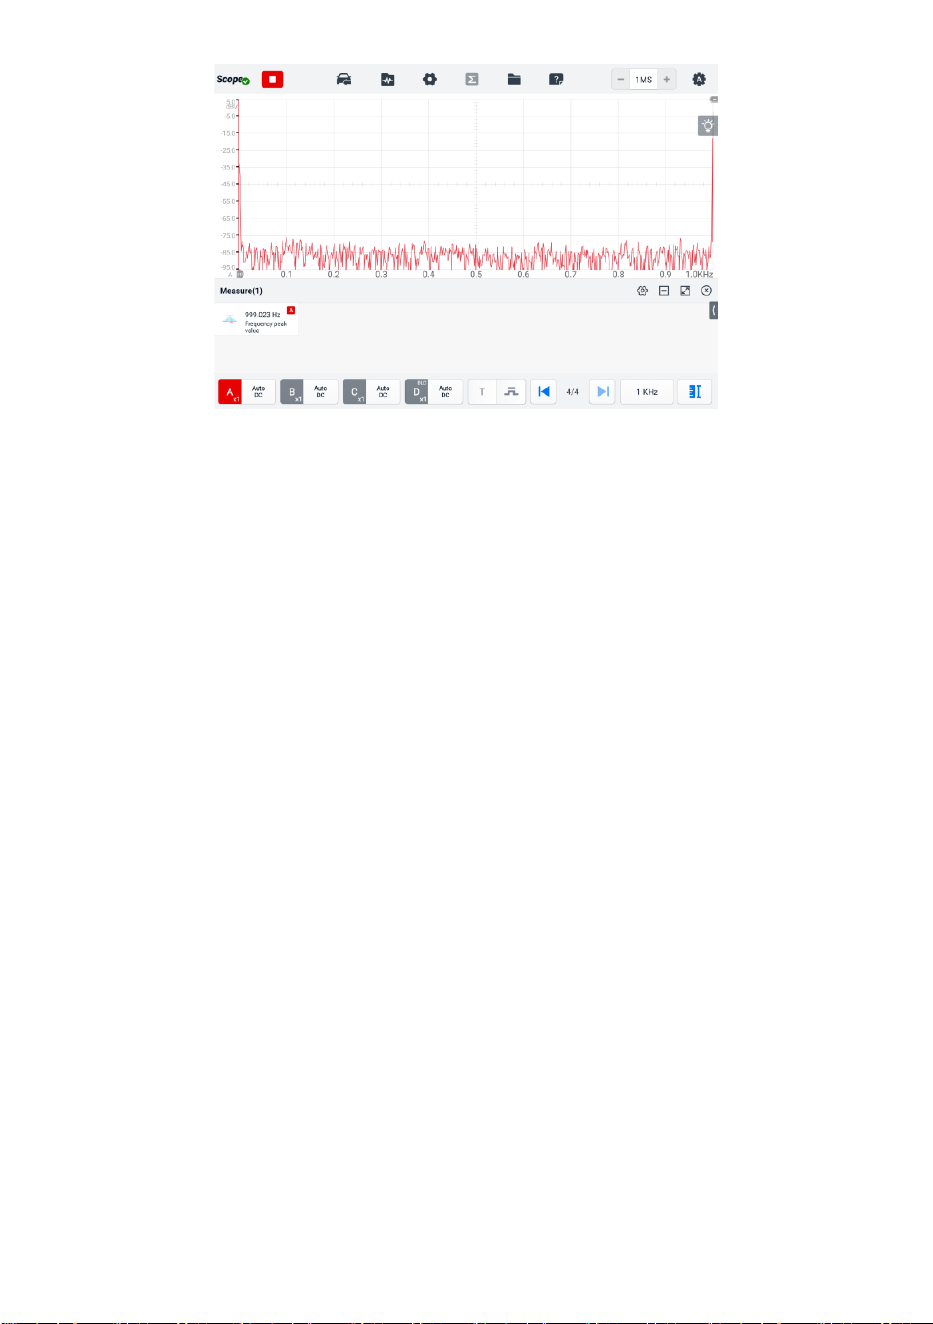
144
Figure 9-60 Measurement Setting Screen (Spectrum View)
5. Close the dialog box, and the corresponding measurement readings are
displayed on the lower side of the screen. Tap Delete to delete the
measurement.
9.1.6 Troubleshooting
A. If the oscilloscope cannot communicate with the MaxiSys tablet:
⚫ Ensure the VCMI2 is properly connected to the MaxiSys tablet via BT, Wi-Fi or
with the supplied USB cable.
⚫ Restart the MaxiSys tablet and reconnect the VCMI2 if communication between
the two continues to fail.
B. If unwanted signals are displayed or signals are distorted:
⚫ Use only the supplied test leads or probes to connect with the input channels.
⚫ Check the test leads or probes for damage.
⚫ Ensure the polarity of the test leads connections are correct.
⚫ Ensure the signal and ground connections are clean and secure.
⚫ Ensure the ground lead is providing a direct ground from the circuit to the input
channel.
⚫ Isolate the test leads from other components, leads, or systems that may induct
unwanted noise into the signal being tested including the electric motors,
secondary ignition components, relays, alternators.

145
9.1.7 Glossary
AC/DC Control
Each channel can be set to either AC coupling or DC coupling. With DC coupling, the
voltage displayed onscreen is equal to the true voltage of the signal with respect to
ground. With AC coupling, any DC component of the signal is filtered out, leaving only
the variations in the signal for the AC component.
Aliasing
When the signal frequency gets higher than half the scope's maximum sampling rate and
exceeds the limit, a distorted waveform displays. This distortion is called aliasing.
Amplitude
The maximum voltage generated from the zero volts line of the oscilloscope.
Analog Bandwidth
The frequency at which a displayed sine wave has half the power of the input sine wave
(about 71% of the amplitude).
Buffer Size/Cache Size
The size of the oscilloscope's buffer memory. The buffer memory is used by the
oscilloscope to temporarily store data. This helps to compensate for the differences in
data transfer rate from one device to another.
Frequency
The number of signal occurrences per second. Frequency is measured in Hz (hertz).
Peak to peak voltage
The difference in voltage between the minimum and maximum voltages occurring in the
waveform.
Time Base
The time interval across the scope display.
Voltage Range
The range between the maximum and minimum voltages that can be accurately captured
by the oscilloscope.

146
Sampling Rate
The number of samples per second captured by the oscilloscope. The faster the sampling
rate of the scope, the more frequently it measures the signal voltage, and so the more
detailed will be the trace that appears on the scope screen.
9.2 Multimeter
The multimeter is a multi-function and multi-range measuring instrument. When the
VCMI2 (Vehicle Communication and Measurement Interface 2) device is connected with
MaxiSys tablet, you can open the Multimeter application by tapping the Measurement
icon on the Job Menu of the tablet and then tapping the Multimeter icon, and perform the
multimeter-related functions, such as measuring voltage, current, resistance, frequency,
diode, duty cycle, pulse width, and continuity test.
9.2.1 Safety Information
Follow the instructions below to reduce the risk of injury from electric shock and prevent
equipment damage.
⚫ Use the multimeter only as specified in this manual.
⚫ Do not apply more than the rated voltage between connectors or between any
connector and earth ground.
⚫ Do not input a value beyond the range when measuring. Remember that the limit
value range of this multimeter is 200 V.
⚫ To prevent injury or death, do not use the multimeter if it appears to be damaged in
any way, and stop use immediately if you are concerned with any abnormal
operations.
⚫ To prevent injury or death, never ground yourself when taking electrical
measurements. Isolate yourself from ground by using dry rubber insulating mats to
cover all exposed/grounded metal. Ensure all clothing including gloves are dry.
Stand on rubber mats when using tool.
⚫ Use the test leads or probes supplied with the product, or proper and applicable
terminals. Inspect the test leads or probes for damage before use.
⚫ When using probes, keep fingers behind the finger guards on the probes.
⚫ Use the supplied replacement fuses or specified replacement parts.
⚫ Always consider electrical and electronic equipment to be energized (live). Never
assume any equipment is de-energized.
⚫ When making electrical connections, connect the common test lead before
connecting the live test lead; when disconnecting, disconnect the live test lead
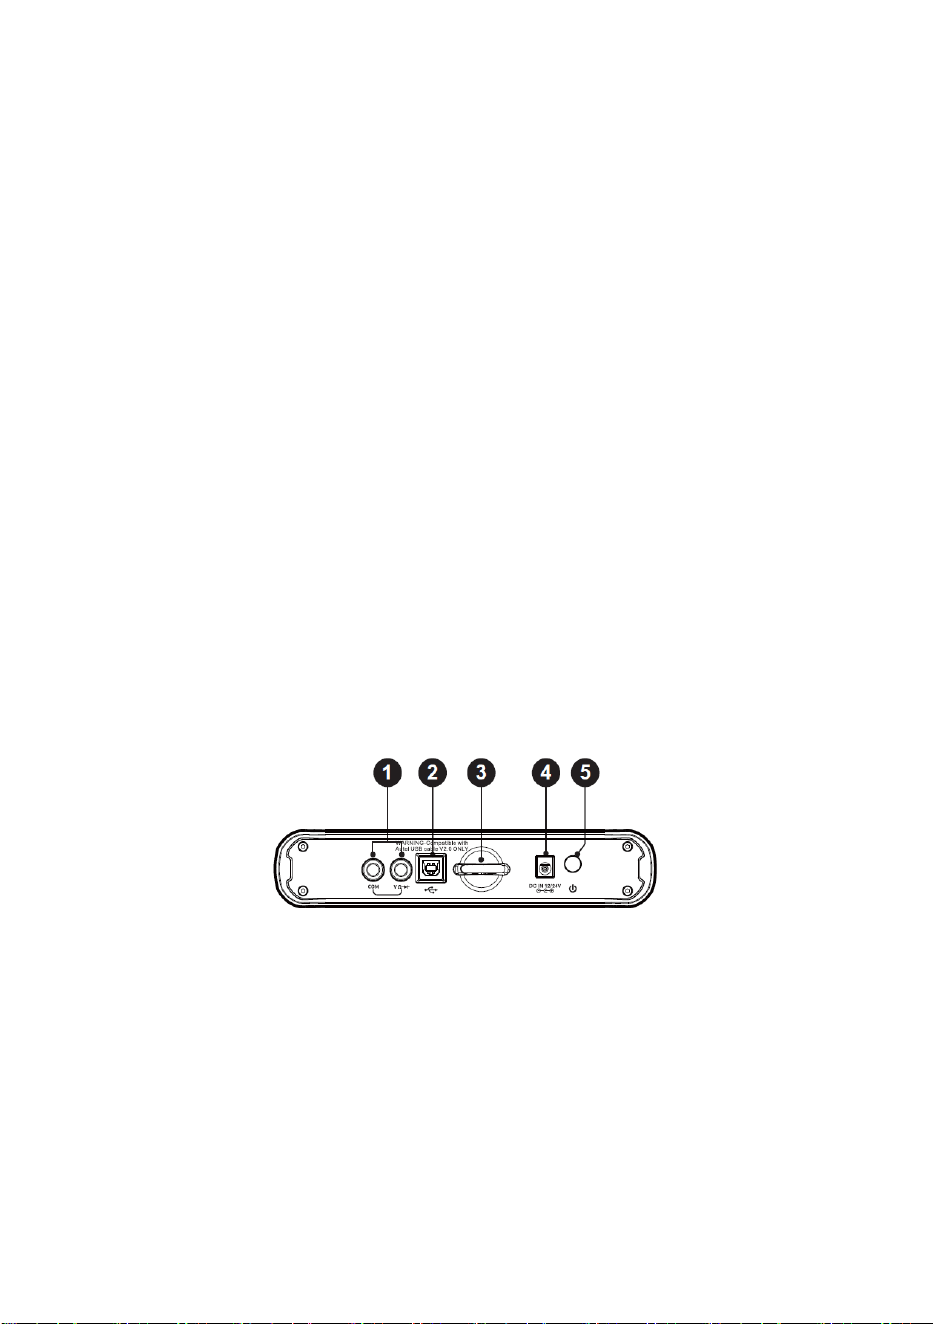
147
before disconnecting the common test lead.
⚫ When measuring current, turn off circuit power before connecting the multimeter to
the circuit. Remember to place the multimeter in series with the circuit.
⚫ After current measurement is finished, turn off the power to the circuit before
removing the test leads and before reconnecting any disconnected wires or devices.
⚫ Do not add voltage to the input terminal when measuring resistance.
⚫ To avoid electric shock, turn off the power to the component before connecting.
⚫ To prevent damage, always use and store your multimeter in appropriate
environments.
⚫ Do not use in wet or damp conditions, or around explosive gas or vapor.
⚫ Do not tamper with or disassemble the multimeter, connectors or accessories.
Internal damage will affect performance.
⚫ Before carrying out maintenance and cleaning of the multimeter, make sure the unit
is NOT connected to a power source, vehicle or computer.
⚫ When cleaning the multimeter, use a damp, soft cloth with mild detergent. Do not
allow water to enter the multimeter casing.
9.2.2 General Introduction
9.2.2.1 Component Locations
The multimeter jacks are located on the top of the VCMI2 while the input channels are
located at the bottom.
1. Multimeter Jacks — for ground and signal cables
2. USB Port
3. Hook
4. DC Power Supply Input Port
5. Power Button
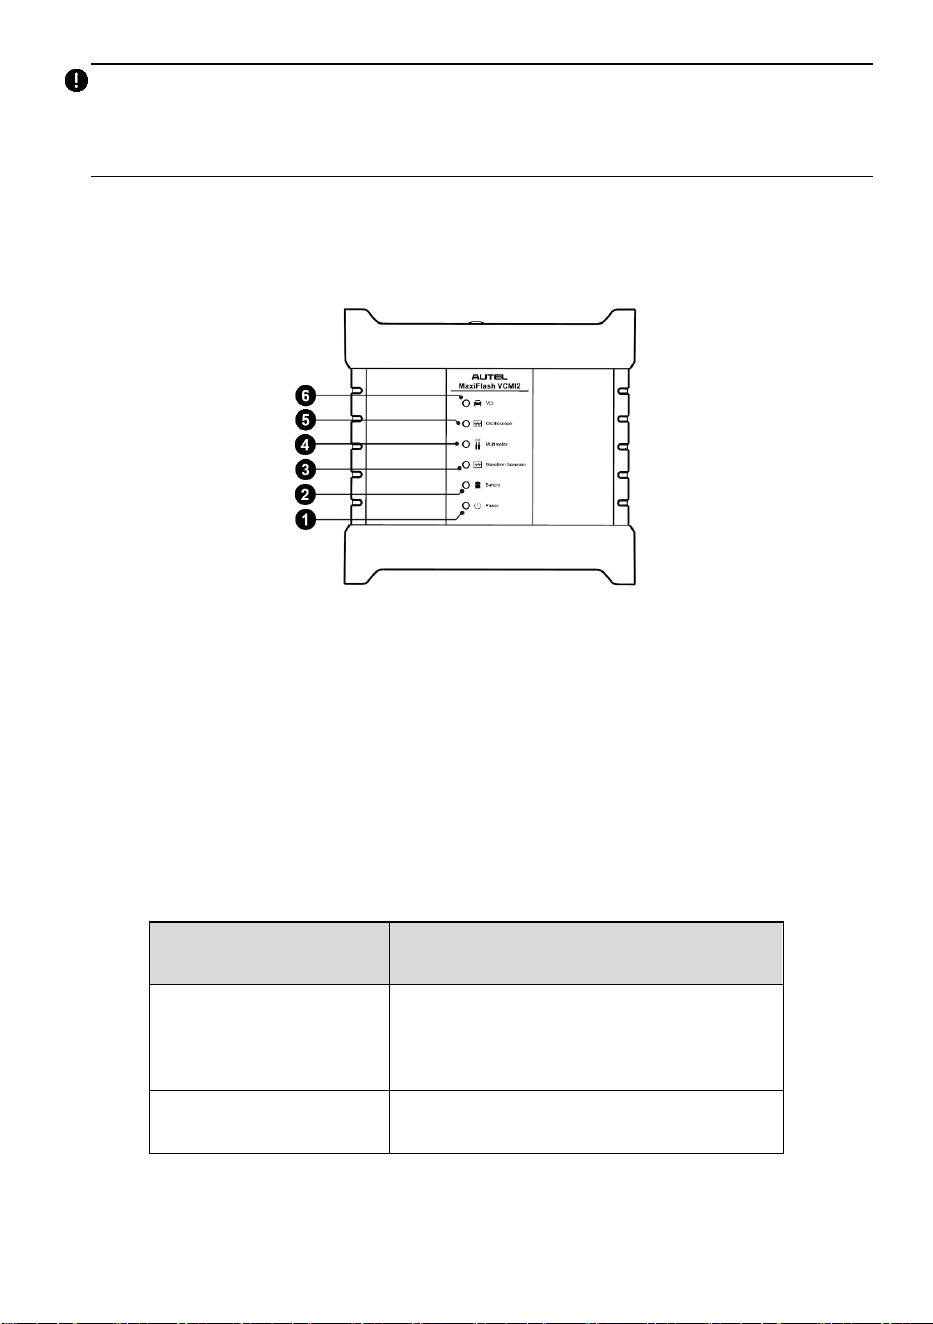
148
IMPORTANT
When using the multimeter function, please insert the supplied multimeter probes to the
multimeter probe jacks. When measuring the current, use a current clamp to connect to
the input channel A on the top of the VCMI2.
The multimeter LED is located on the front panel of the VCMI2. When the VCMI2 is
properly connected and powered on, the multimeter LED lights green when operating in
the multimeter mode.
1. Power LED
2. Battery LED
3. Waveform Generator LED
4. Multimeter LED
5. Oscilloscope LED
6. Vehicle LED
9.2.2.2 Technical Specifications
Table 9-8 Technical Specifications
Item
Description
Voltage Range
VDC 200 V
VAC 200 V
RMS
Resistance Range
1 Ω to 10 MΩ
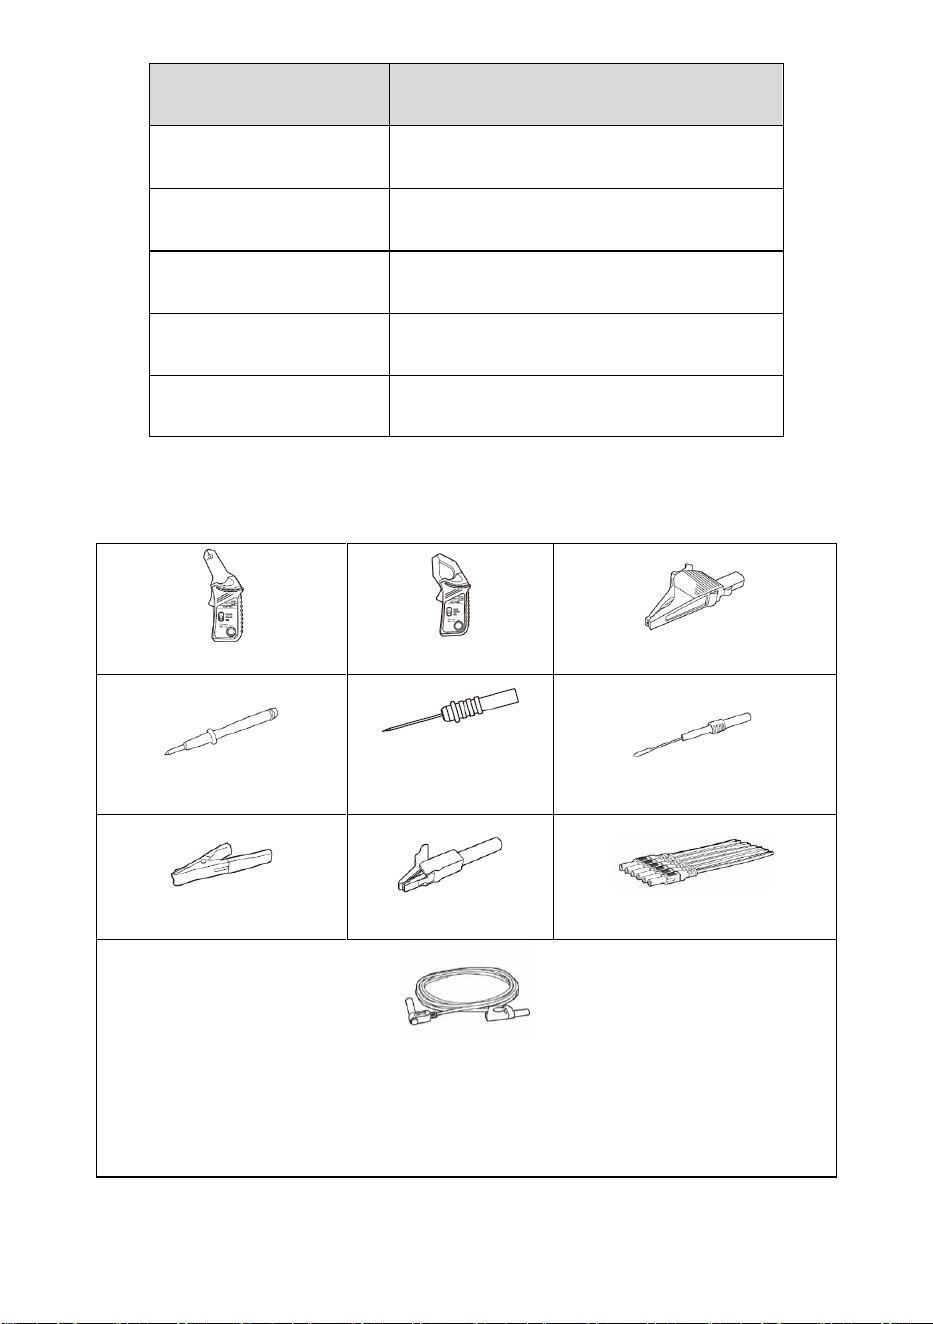
149
Item
Description
Diode
2 V
Frequency Range
1 Hz to 1 MHz
Duty Cycle Range
1% to 99 %
Pulse Width Range
1 us to 1000 ms
Current Range
0 to 65 A (65 A current clamp)
⚫ 0 to 650 A (650 A current clamp)
9.2.2.3 Accessories
The following accessories are compatible with the multimeter and oscilloscope.
65 A current clamp
650 A current clamp
Large Dolphin Clip
Multimeter Probe
Back-pinning Probe
Flexible Back-pinning Probe
Battery Clip
Small Alligator Clip
Breakout Lead
Multimeter Test Lead: used to connect the multimeter and multimeter probe.
NOTE: The two multimeter test leads (Red: SA015 / Black: SA016) are standard
for the multimeter and waveform generator.
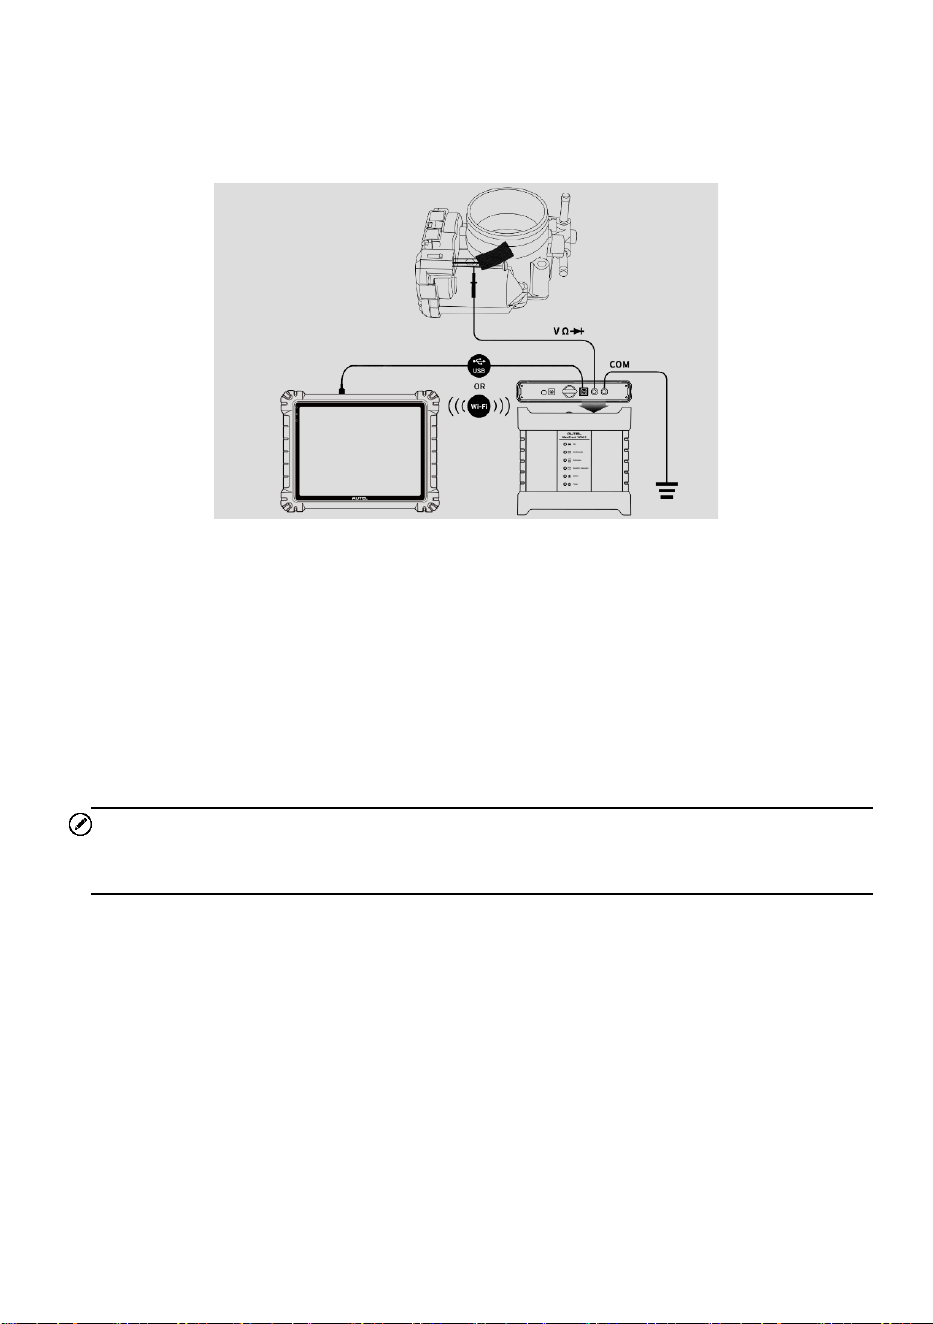
150
9.2.3 Getting Started
Before opening the Multimeter application, ensure the VCMI2 is connected to the tablet
via Wi-Fi or with the supplied USB cable.
Figure 9-61 Connection Diagram
➢ To open the multimeter application
1. Insert the applicable test leads or probe terminal ends into the multimeter jacks
to complete the connection.
2. Tap the Measurement icon on the MaxiSys Job Menu. The Measurement
screen opens.
3. Tap the Multimeter icon to open the Multimeter Menu.
4. Select a test to continue.
NOTE
Please check the multimeter LED status indicator on the front panel of VCMI2. The
multimeter LED lights green when operating in the multimeter mode.
9.2.4 Multimeter Update
The operating software of the multimeter is continually optimized. Tap the Help button in
the upper toolbar and then tap the Update the APK button in the dropdown list to update
the software.
Before updating the multimeter's software, please ensure the tablet has a stable Internet
connection.
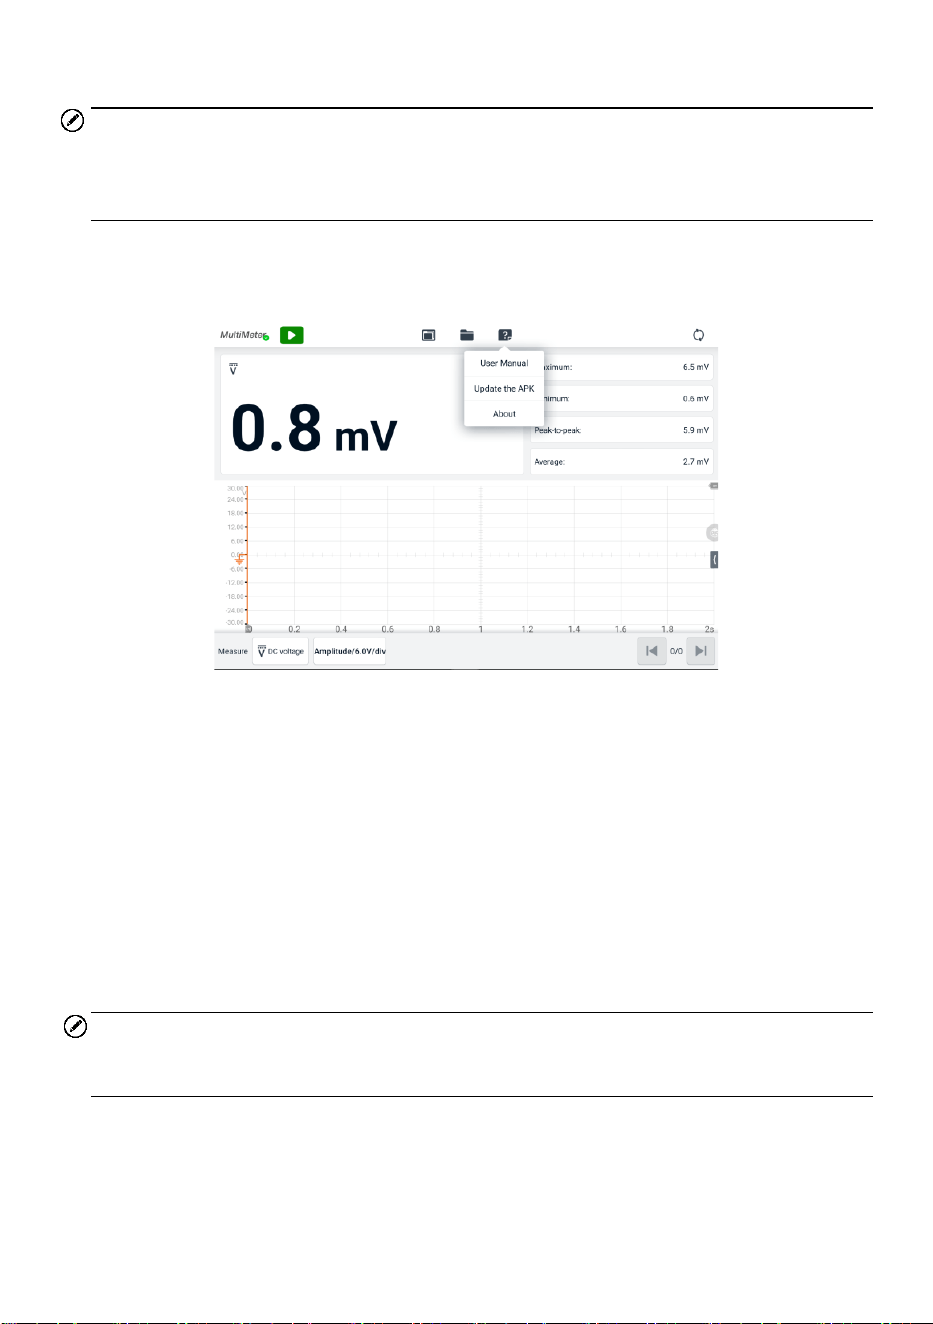
151
9.2.4.1 APK Update
NOTE
The acronym APK (Android Package Kit) is used on the tablet and in this manual. This
file contains all the assets of a particular app. To update the APK, is to install the latest
version of the app on your tablet.
➢ To update the APK
1. Tap the Help button on the upper half of the screen. A dropdown menu displays.
Figure 9-62 Help Screen
2. Tap the Update the APK in the dropdown menu. If the current APK is not the
latest version, a confirmation message will appear: An APK update is available.
Do you want to update? Restart the App after update.
3. Tap OK to update the software or tap Cancel to exit.
9.2.5 Screen Layout and Operations
Tap the Measurement icon on the Job Menu, then tap the Multimeter icon in the menu,
the multimeter page displays. The screen typically includes the following button sections.
NOTE
The Multimeter application can also be opened via the Android home screen. Tap the
Measurement icon at the top of the Android home screen. Tap Multimeter.
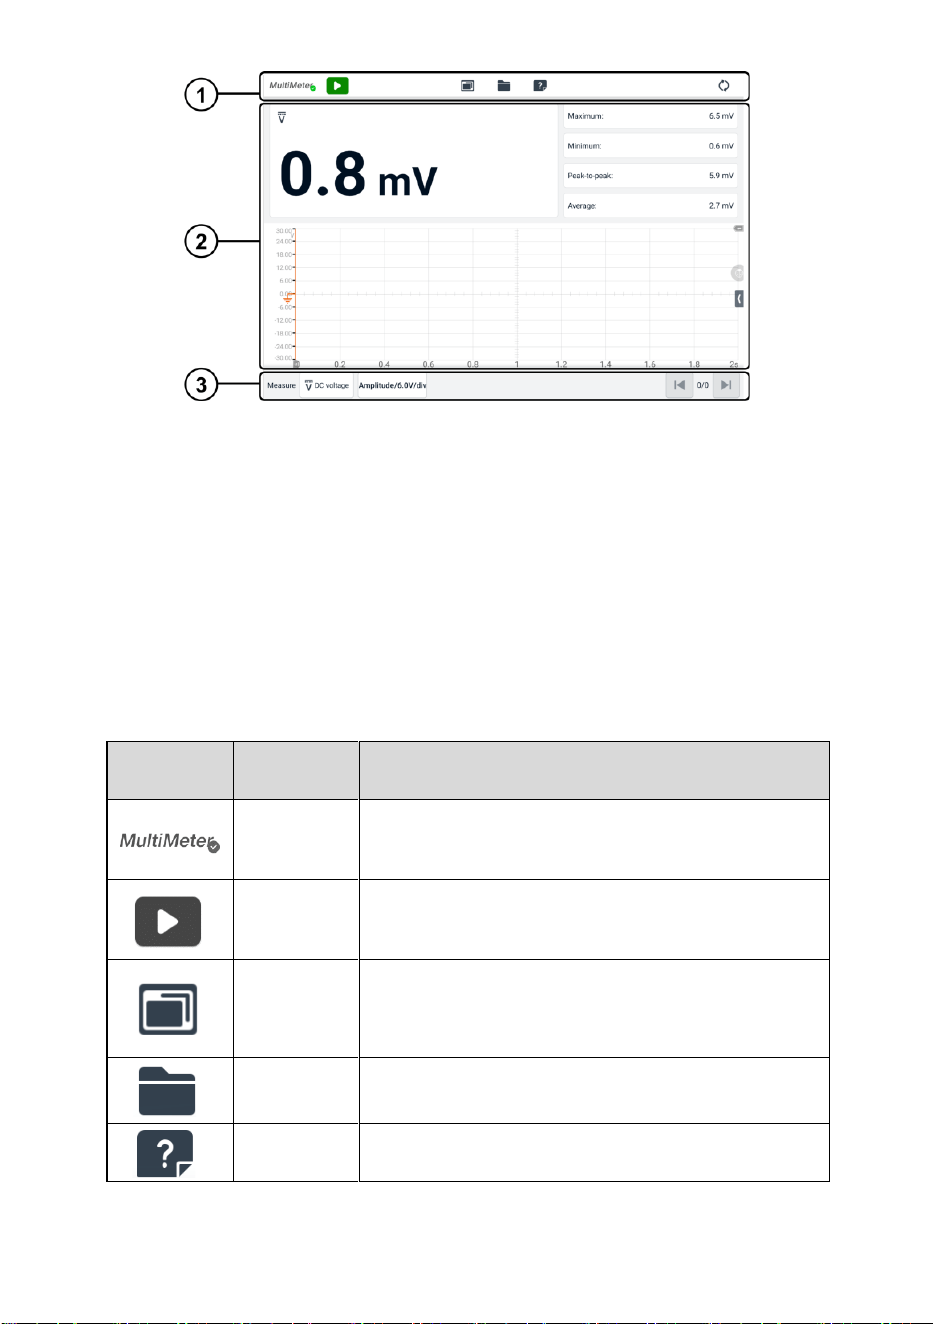
152
Figure 9-63 Multimeter Menu Screen
1. Upper Toolbar
2. Main Section
3. Lower Toolbar
9.2.5.1 Upper Toolbar
The upper toolbar is used for configurations of various settings and operations. The
following table provides brief descriptions of each button.
Table 9-9 Upper Toolbar
Button
Name
Description
Multimeter
Icon
Displays the multimeter connection status.
Start/Stop
Button
Start or stop the multimeter device.
Show
Mode
Set the display mode.
File
Print, open and save the waveform data.
Help
View the user manual, and update the APK.
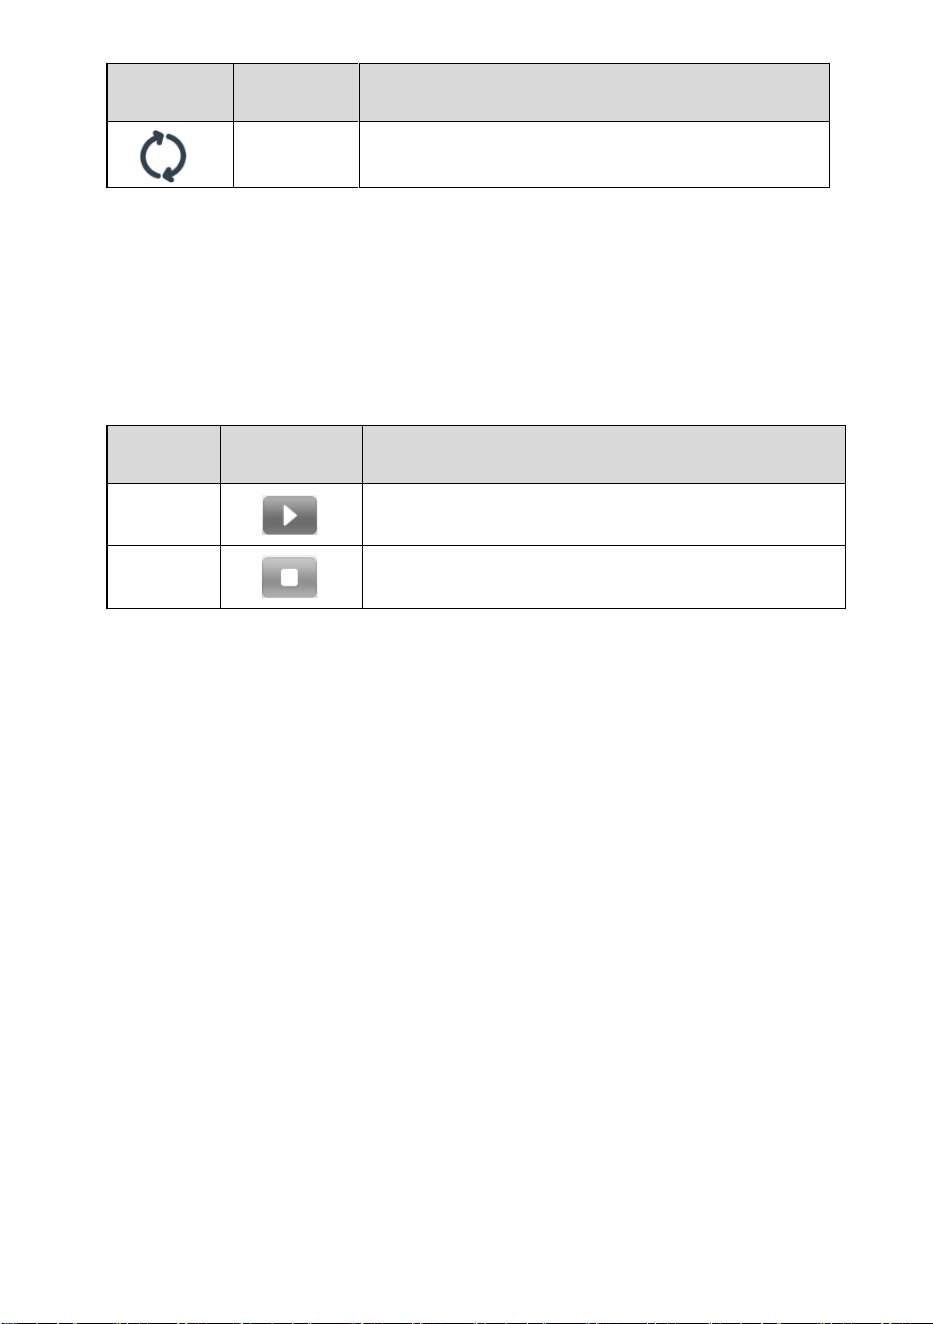
153
Button
Name
Description
Reset
Reset the digital readouts displayed in the figure
mode.
⚫ Multimeter Icon
This Multimeter status button displays the multimeter connection status. A green
check mark means the tablet and the Multimeter are connected; a red X means the
device and the tablet are not connected.
⚫ Start/Stop Button
Press this Start/Stop Button icon to start and stop the multimeter device.
Name
Button
Description
Start
Tap to start the multimeter.
Stop
Tap to stop the multimeter.
⚫ Show Mode Menu
The position of the digital readouts and waveform in the main view section can be
selected in the Show Mode Menu.
➢ To set the show mode
1. Tap the Show Mode button in the upper toolbar. A submenu opens.
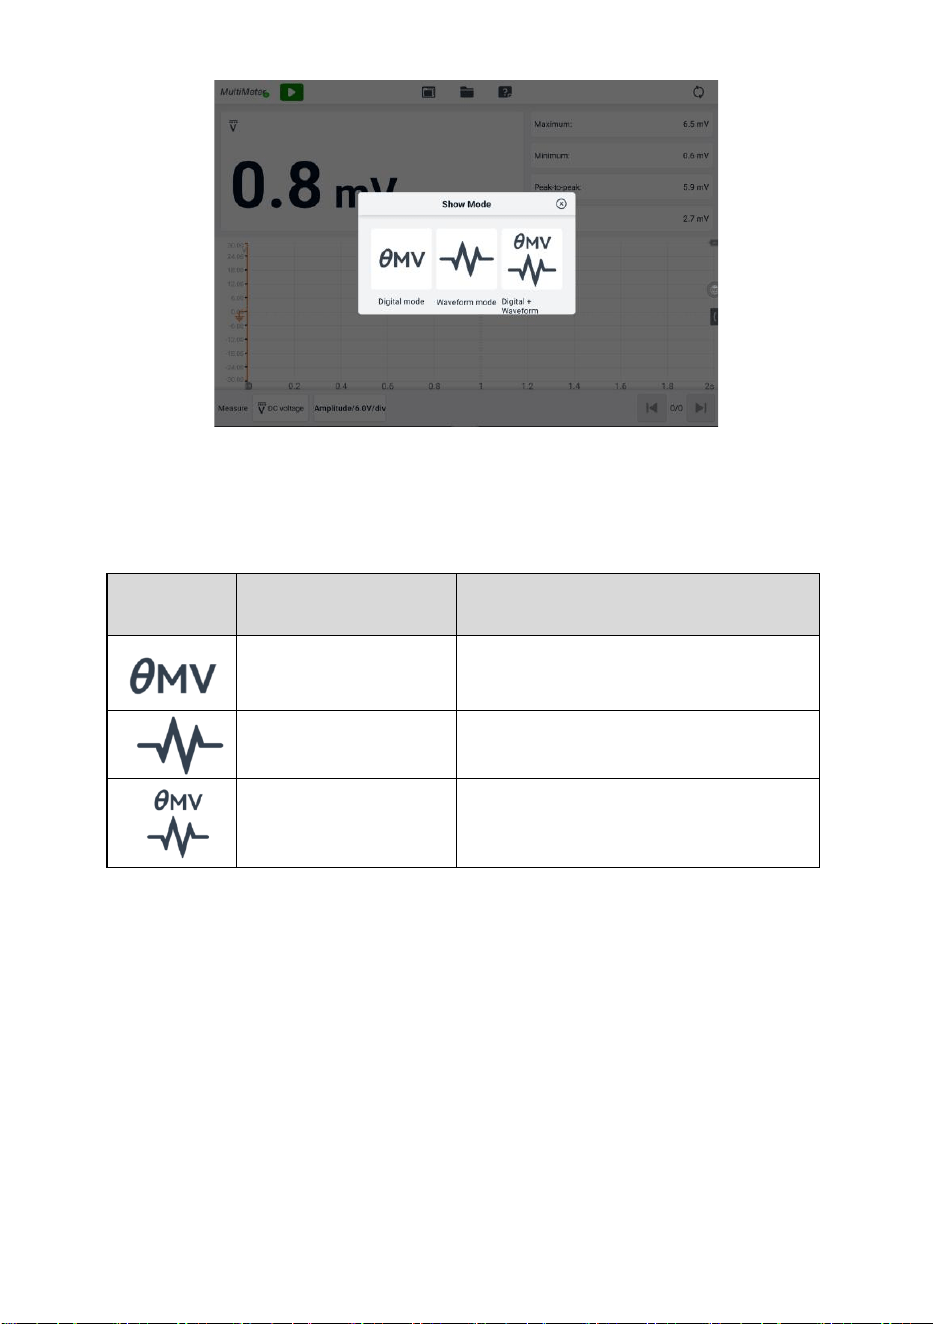
154
Figure 9-64 Show Mode Menu Screen
2. Select one of the three display modes.
3. The corresponding display mode will be shown on the screen.
Icon
Mode
Description
Digital Mode
Displays the digital readouts only.
Waveform Mode
Displays the waveform only.
Digital + Waveform
Mode
Displays both the digital readouts and
waveform.
⚫ File Menu
The File Menu supports the following functions.
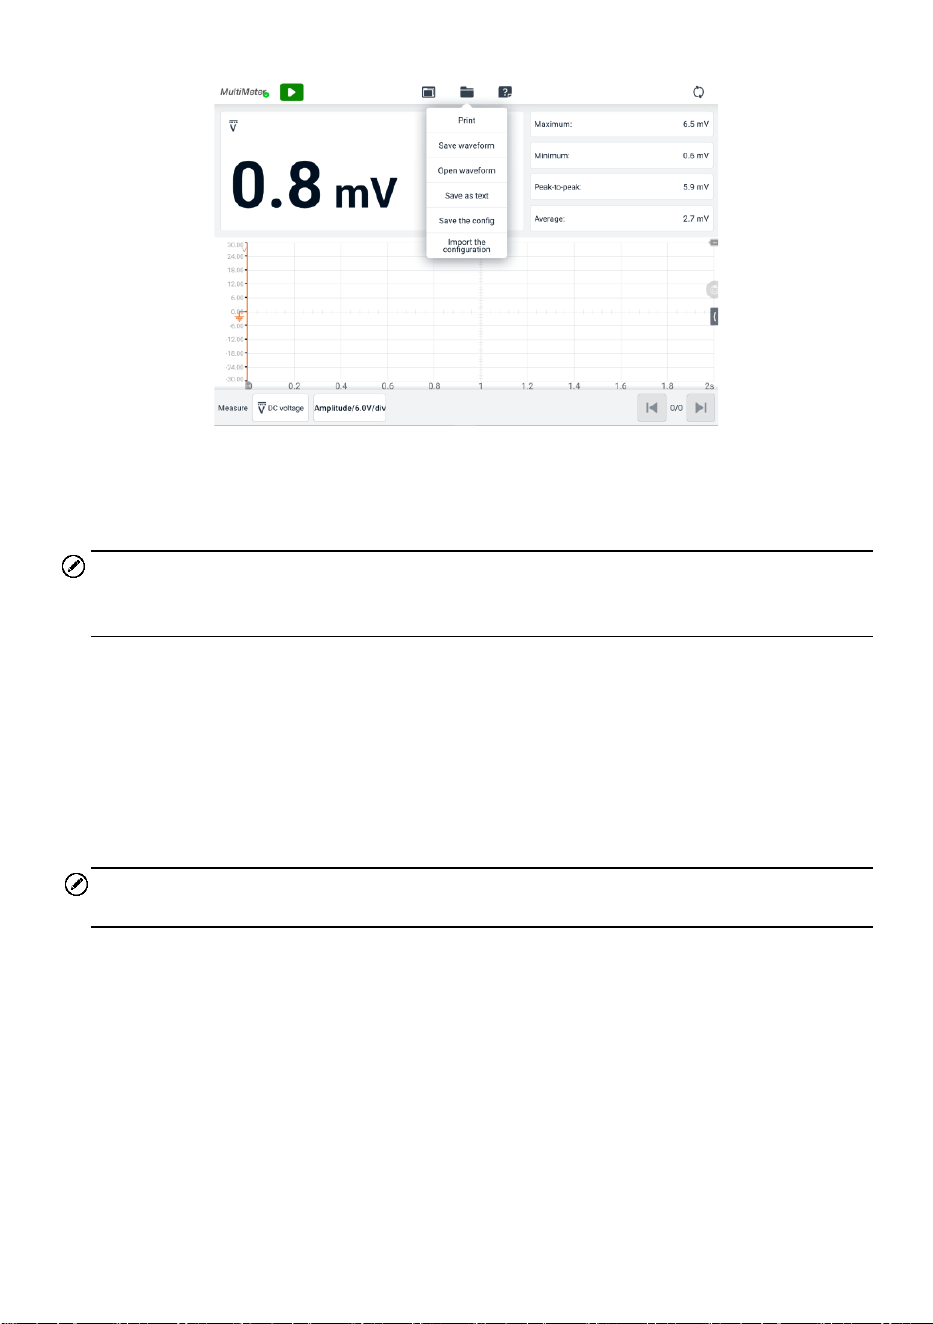
155
Figure 9-65 File Menu Screen
✓ Print — tap to create and print a temporary PNG picture of the current waveforms.
NOTE
Ensure the tablet is configured to print (see Printer setup instructions) and is connected
to the printer. Ensure the tablet and printer share the same network.
✓ Waveform File Operation
Save and open the waveform files in this section. Only Waveform mode and Digital
+ Waveform mode support this operation.
Save Waveform — Tap to capture and save the current waveforms. On the Save
File screen, tap each item to input the corresponding information and then tap Save
or Save Default to finish.
NOTE
The file name is required when saving waveforms.
Open Waveform — tap to retrieve the saved waveforms. Tap the Edit button in the
upper right corner of the screen to select and delete the saved waveform.
Save as text — tap to save the current waveform data to a text file. Use the ES File
Explorer app on the Android home screen to review the file: Home > ES File
Explorer > Local > Internal Storage > Scan > Data > Multimeter > txt.
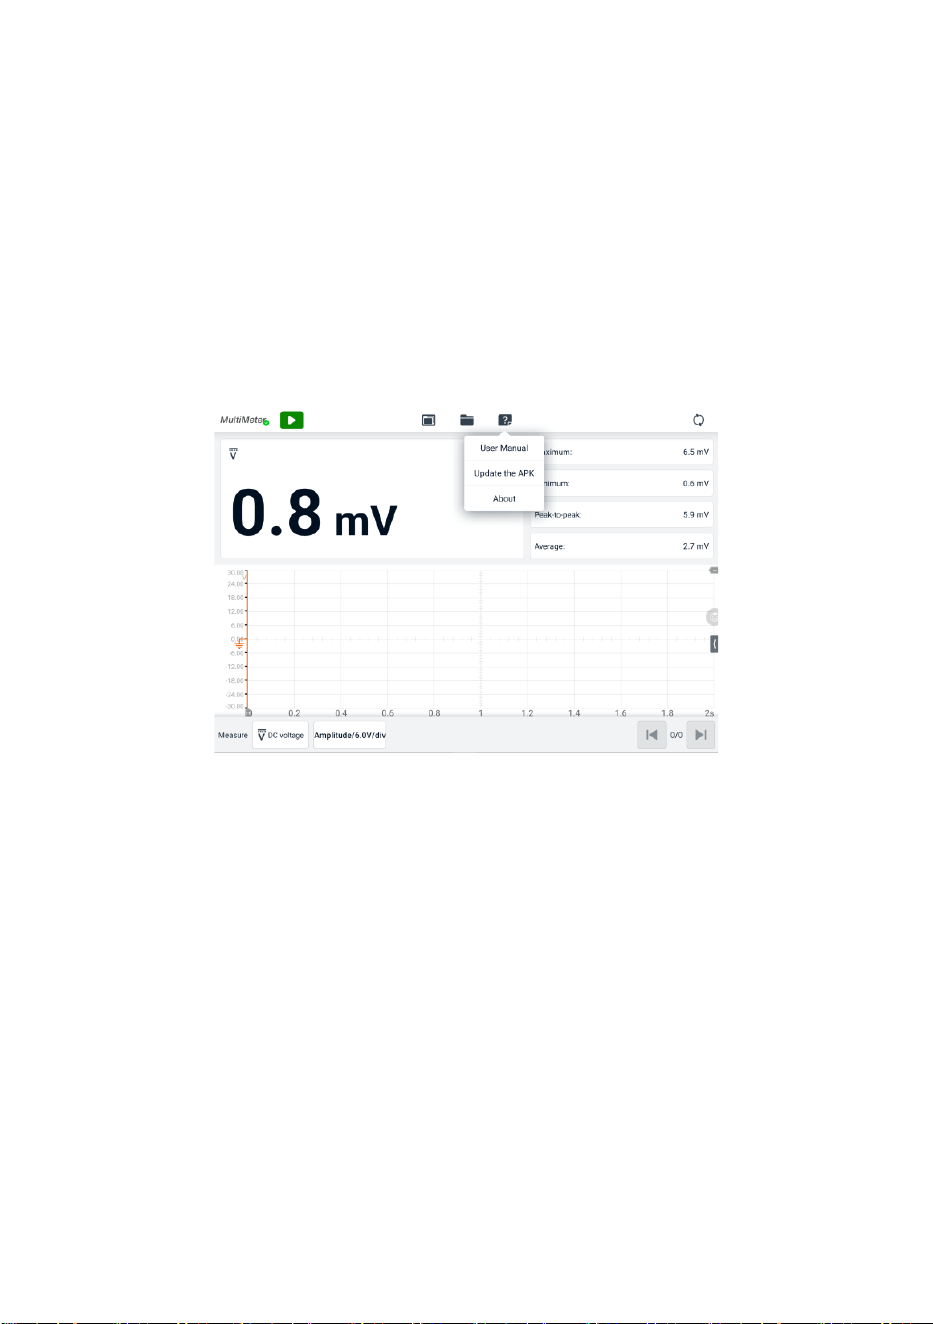
156
✓ Configuration Operation
The configurations can be saved and imported.
Save the Configuration — tap to save the configuration settings (i.e., the amplitude,
the time base) of waveforms on the current screen.
Import the Configuration — tap to import the saved configuration settings for
waveforms.
⚫ Help Menu
The Help Menu allows you to view the user manual, update the software, and view
versions of the device.
Figure 9-66 Help Menu Screen
User Manual — displays instructions for the proper use of the multimeter.
Update the APK — connects to the Autel server to get the latest application software
version.
About — displays the model number and version numbers of the installed software.
9.2.5.2 Main Section
The main view section displays differently depending on the selected mode.
⚫ Digital Mode
The main view section in the digital mode displays only the digital readouts such as
values of voltage measurement, maximum measurement, minimum measurement,
peak to peak measurement, and average measurement.
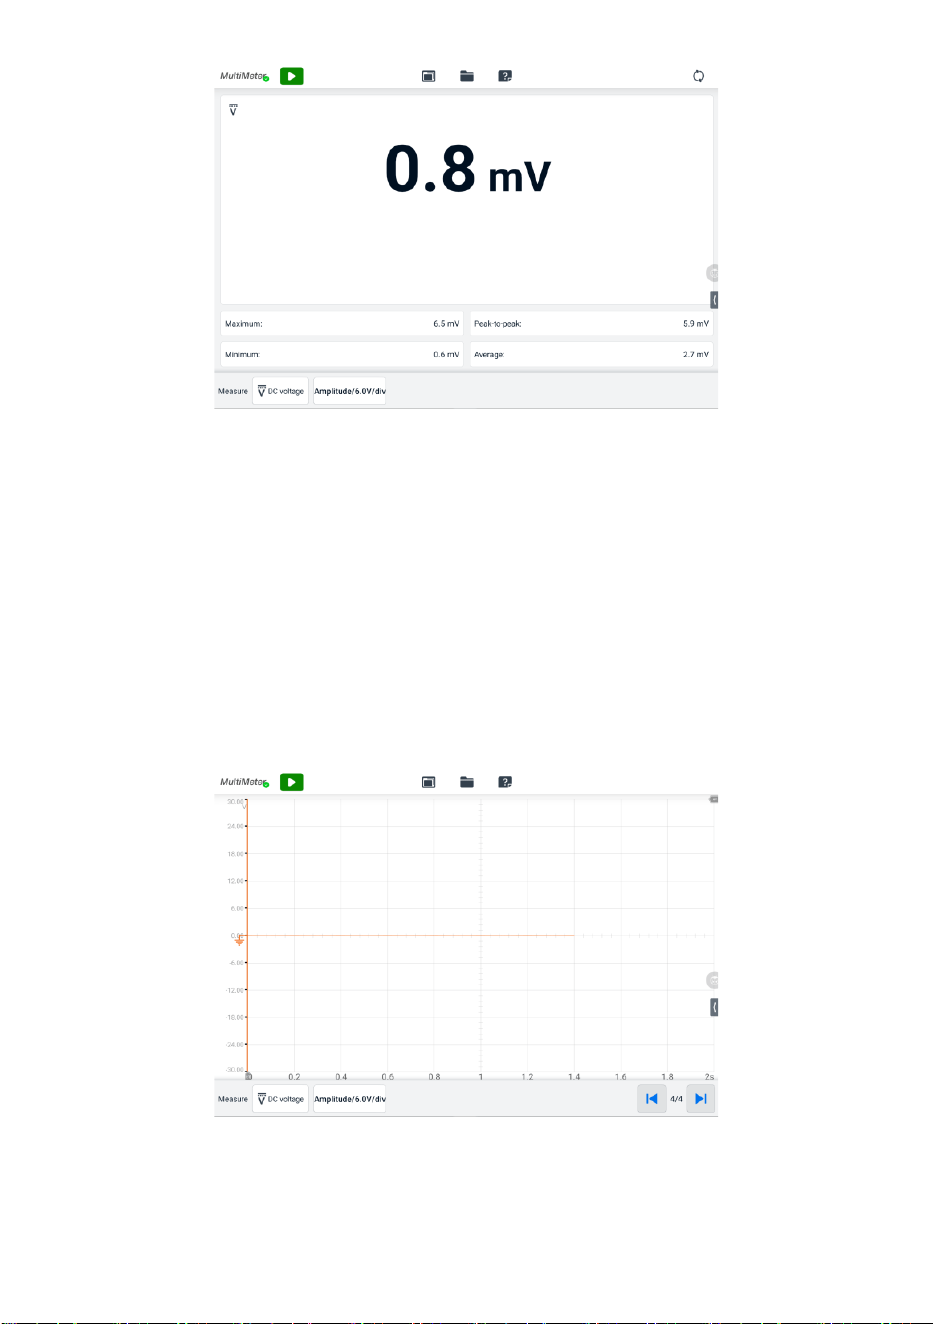
157
Figure 9-67 Main Section Screen (Digital Mode)
Current Value: the current value can be the AC voltage, DC voltage, resistance,
frequency, or duty cycle
Maximum: the recorded maximum value of the measurement
Minimum: the recorded minimum value of the measurement
Peak to Peak: the difference between the maximum and minimum values
Average: the average value of the measurements
⚫ Waveform Mode
The main section in the scope mode only displays the waveform.
Figure 9-68 Main Section Screen (Waveform Mode)

158
The main section features a coordinate grid with the X-axis representing the time
duration and the Y-axis representing the amplitude level. The amplitude level on the
Y-axis can be configured in the Amplitude Settings.
A. Channel Selection
In the main section, a channel has two conditions: selected and unselected. A
channel must be selected in order for the waveform to be movement, to use the
zoom-in or to add measurement rulers.
➢ To select and unselect the channel
1. Tap the Zero Baseline marker or the Y-axis (the line thickens when selected).
2. Tap the Zero Baseline marker or the Y-axis again to exit the channel selection.
B. Waveform Zooming
The zooming function allows you to change the size and position of a signal
during or after capturing a waveform to examine it in greater details. It does not
change the stored data, but the way it displays.
The X-axis and Y-axis can be zoomed using your fingertips. The waveform can
be zoomed during or after capturing the signal.
C. Measurement Rulers
In the coordinate grid, there are two kinds of measurement rulers, which allow
the amplitude and time duration of a waveform to be measured precisely. They
are useful when determining signal characteristics such as amplitude at specific
points, the cycle time (duration) and frequency.
The vertical Time Ruler — tap the Ruler Activator in the bottom left corner of
the grid and drag it across the screen to the desired position. A Time Ruler is
generated.
The horizontal Signal Ruler — the Signal Ruler can be generated in the similar
way by tapping the Ruler Activator in the upper right corner and dragging it
downwards.
NOTE
The horizontal signal ruler varies according to the settings of the voltage, current,
frequency, duty cycle, etc.
When dragging the Measurement Rulers, a Ruler Table showing time and
amplitude values for the corresponding channels will be displayed. The Delta
icon refers to the absolute difference between the values of the rulers, which
can be locked by tapping the Lock icon. Tap the X button in the upper right
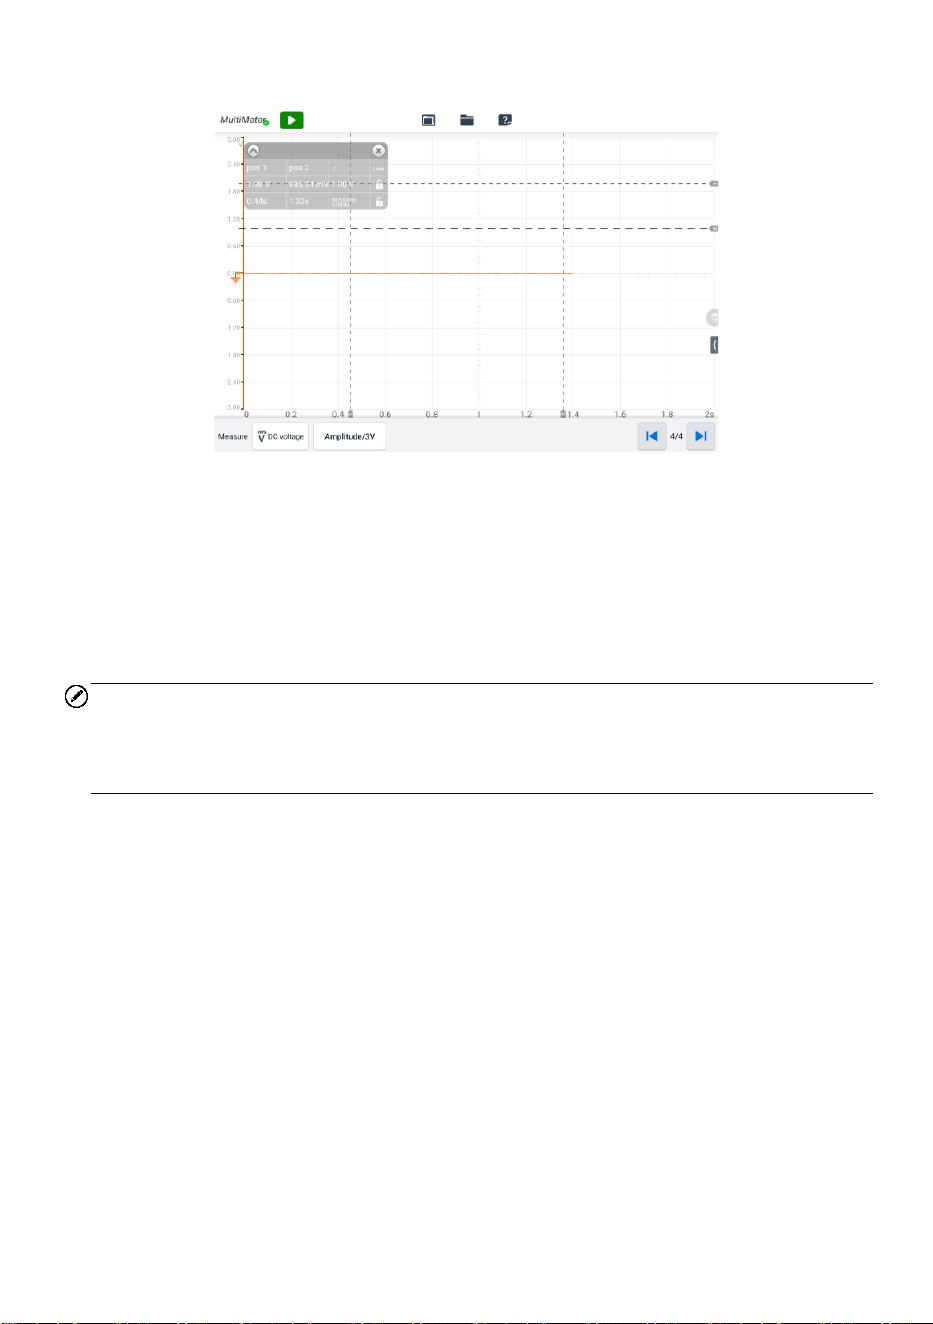
159
corner of the ruler table to delete all rulers.
Figure 9-69 Measurement Rulers Screen
D. Zero Baseline
The zero baseline is marked the 0 value in the Y-axis, showing the ground level
of each channel waveform. After the channel is selected, the zero baseline can
be adjusted by dragging the baseline marker up/down along the Y-axis, or
dragging the waveform up/down or moving the screen up/down in the grid.
NOTE
Tap the baseline marker to make the vertical scale line thicker. In this case, the channel
is selected. Tap the baseline marker again to unselect and the waveform cannot be
dragged.
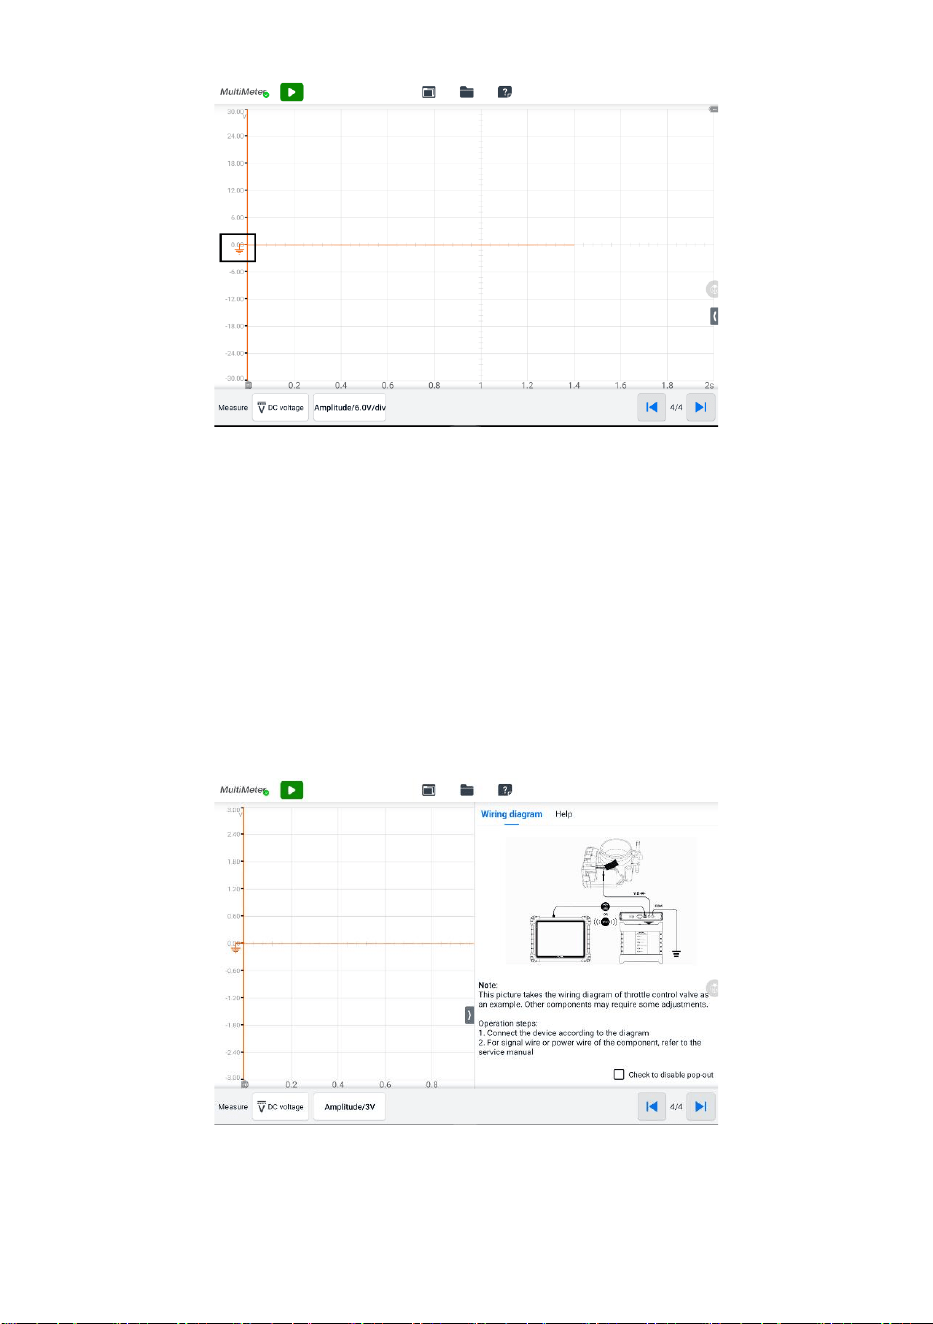
160
Figure 9-70 Zero Baseline Screen
E. Wiring Diagram and Help
Tap the arrow button in the lower-right corner of the screen to open the Wiring
Diagram and Help window.
The Wiring Diagram function provides the connection diagram, operation steps
and operation notes.
The Help function provides the user manual, displaying information relevant to
the procedure, operation or instructions.
Figure 9-71 Wiring Diagram and Help Screen
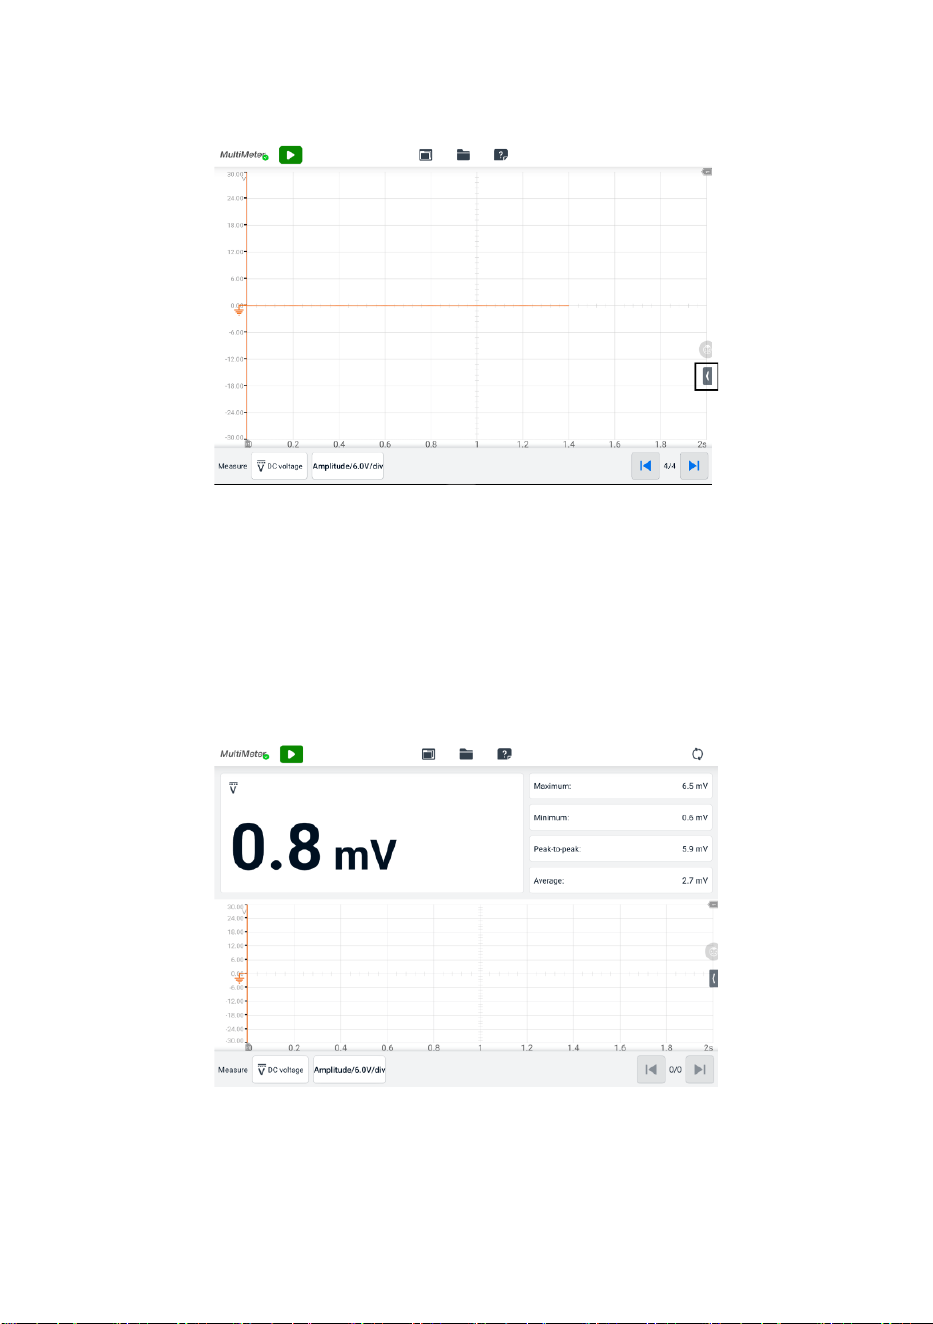
161
➢ To open and close the Wiring Diagram and Help window
1. Tap the arrow button on the right-hand side of the screen.
Figure 9-72 Arrow Button Position Screen
2. The Wiring Diagram and Help window displays.
3. Tap the arrow button again or tap any space outside of the window.
⚫ Digital + Waveform Mode
In this mode, the main section displays the digital readouts on the top and the
waveform in the grid.
Figure 9-73 Main Section Screen (Digital + Waveform Mode)
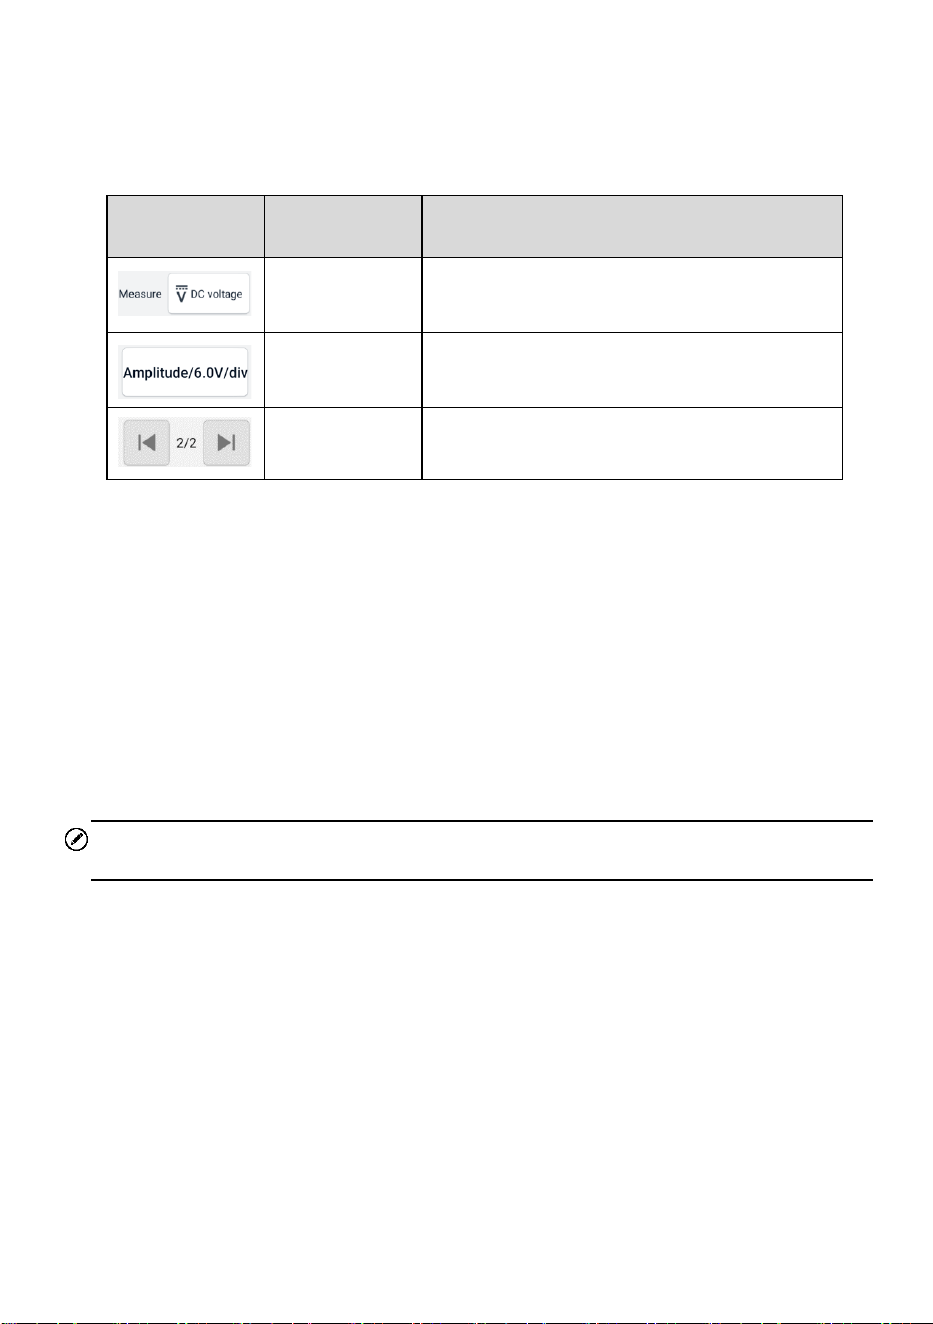
162
9.2.5.3 Lower Toolbar
The measurement, buffer and amplitude can be configured in the lower toolbar.
Table 9-10 Lower Toolbar
Button
Name
Description
Measurement
Tap to select an appropriate measurement.
Amplitude
Tap to select an appropriate amplitude value.
Buffer
Tap the Previous or Next button to switch to
the previous or the next waveform.
⚫ Measurement Setting
This multimeter can be used to measure AC voltage, DC voltage, resistance, AC
electricity, DC electricity, diode, frequency, duty cycle, pulse width, continuity, and
period.
The measurement types include:
AC/DC voltage: measures the voltage in the electrical circuit
Resistance: measures the resistance of the electrical circuit or the component
AC/DC current: measures current amperage through the input channel A by
using the optional current clamp
NOTE
The type of current clamp can be selected in the dropdown list.
Diode: conducts the diode test of the electrical circuit
Frequency: measures the frequency of the input signal
Duty Cycle (+)/(-): measures the (+) and (-) duty of the input signal
Connectivity: determines whether a low impedance exists two points in the
electrical circuit. If the impedance is less than 100 ohms, the circuit is "closed",
otherwise, the circuit is "open".
Period: measures the amount the time that one complete cycle of the input
signal endures
Pulse Width (+)/(-): measures the pulse width of the input signal
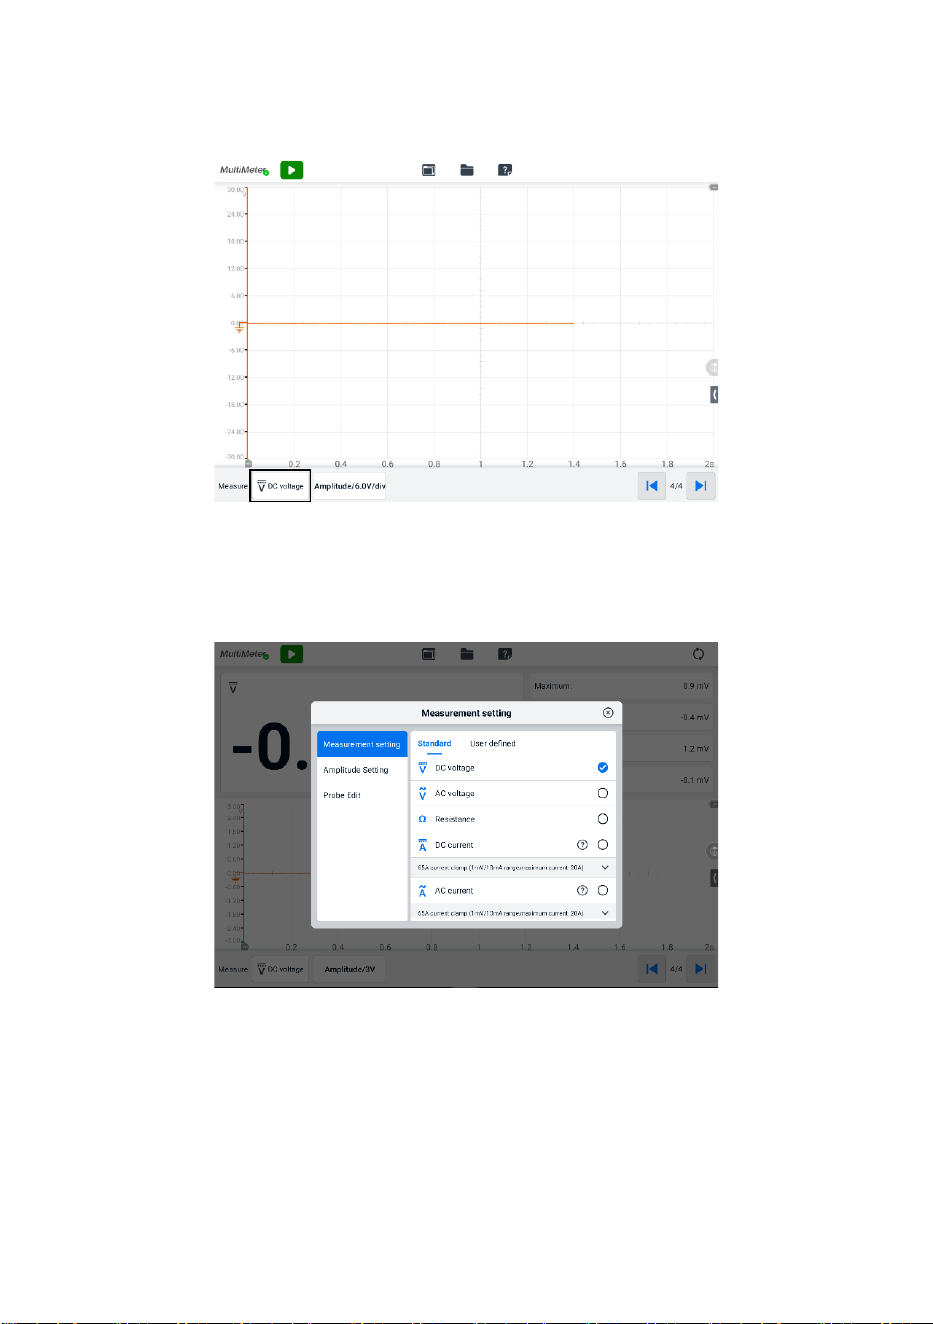
163
➢ To set the measurement setting
1. Tap the Measurement Setting button in the lower-left corner of the screen. A
dialog box appears.
Figure 9-74 Measurement Setting Position Screen
2. Select the measurement type you want to measure or test in the right column
of the dialog box. The blue color indicates the option is selected.
Figure 9-75 Measurement Setting Screen
3. Close the dialog box, the measurement type you set displays on the screen.
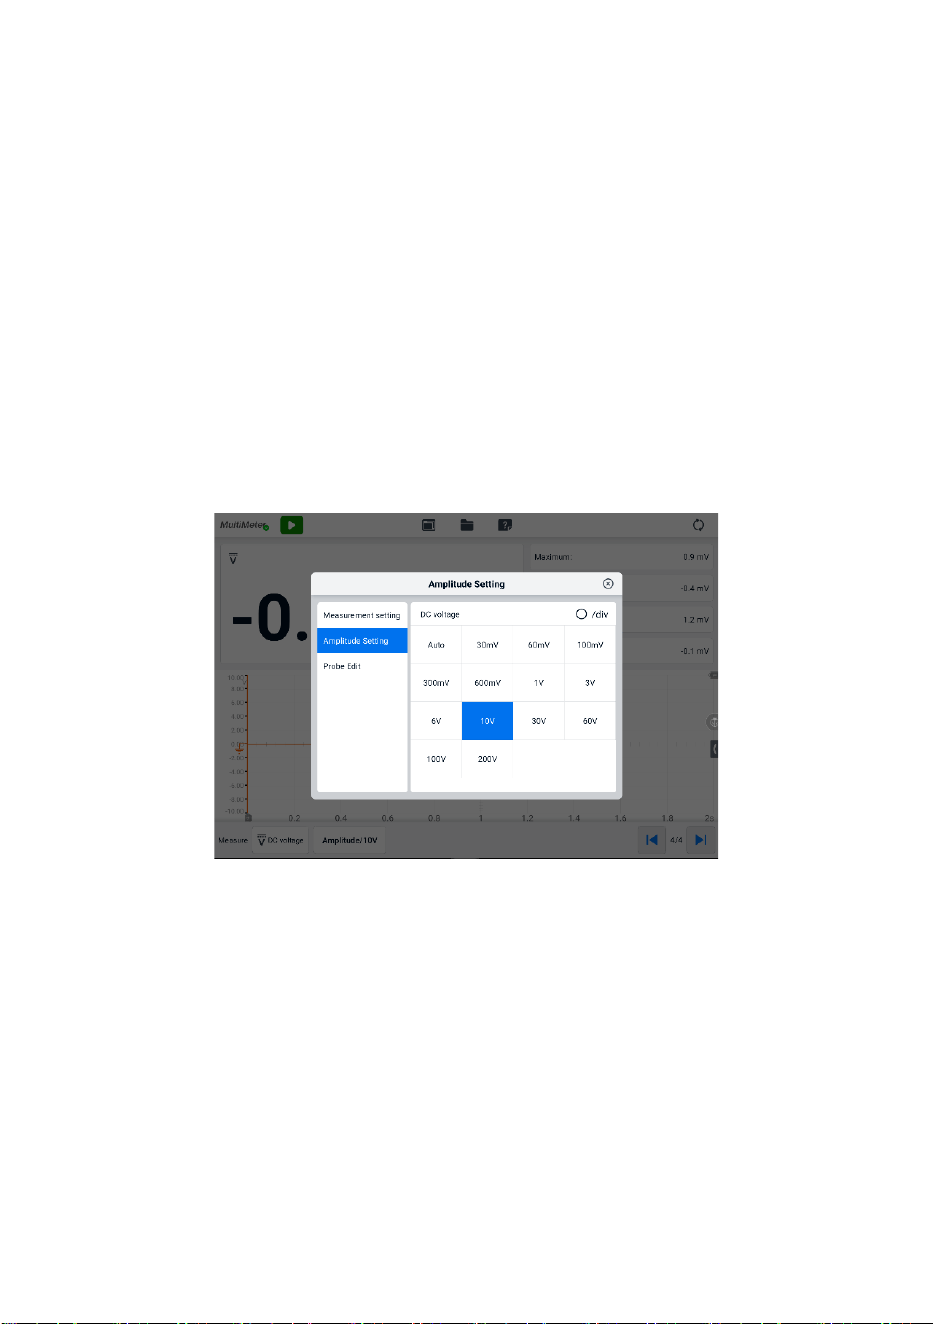
164
⚫ Amplitude Setting
Amplitude value can be configured for the selected measurement type excluding
resistance measurement.
The amplitude settings allow you to set up the multimeter to capture signals within
the specified range. If the input signal exceeds the selected range, an over-range
indicator will be displayed. Select Auto to enable the device to adjust the vertical
scale automatically.
There are two modes available to set the amplitude value.
Mode 1: For example, selecting DC voltage in Measurement setting screen sets
the measurement type to DC voltage, selecting 10 V in Amplitude setting screen sets
the amplitude to Amplitude 10 V (displays on the lower left corner of the screen).
The vertical scale range is from -10 V to +10 V. As the vertical scale is divided into
10 segments, each segment increases by 2 V.
Figure 9-76 Amplitude Setting Screen (DC 10 V)
Mode 2: Select the ## /div button to adjust the value increments of each division.
For example, selecting DC voltage in Measurement setting screen, sets the
measurement type to DC voltage. Selecting 2.0 V/div in Amplitude setting screen,
sets the amplitude to Amplitude 2.0 V/div (displays on the lower left corner of the
screen). Each segment increases by 2 V. As the vertical scale is divided into 10
segments, the entire vertical scale range is from -10 V to +10 V.
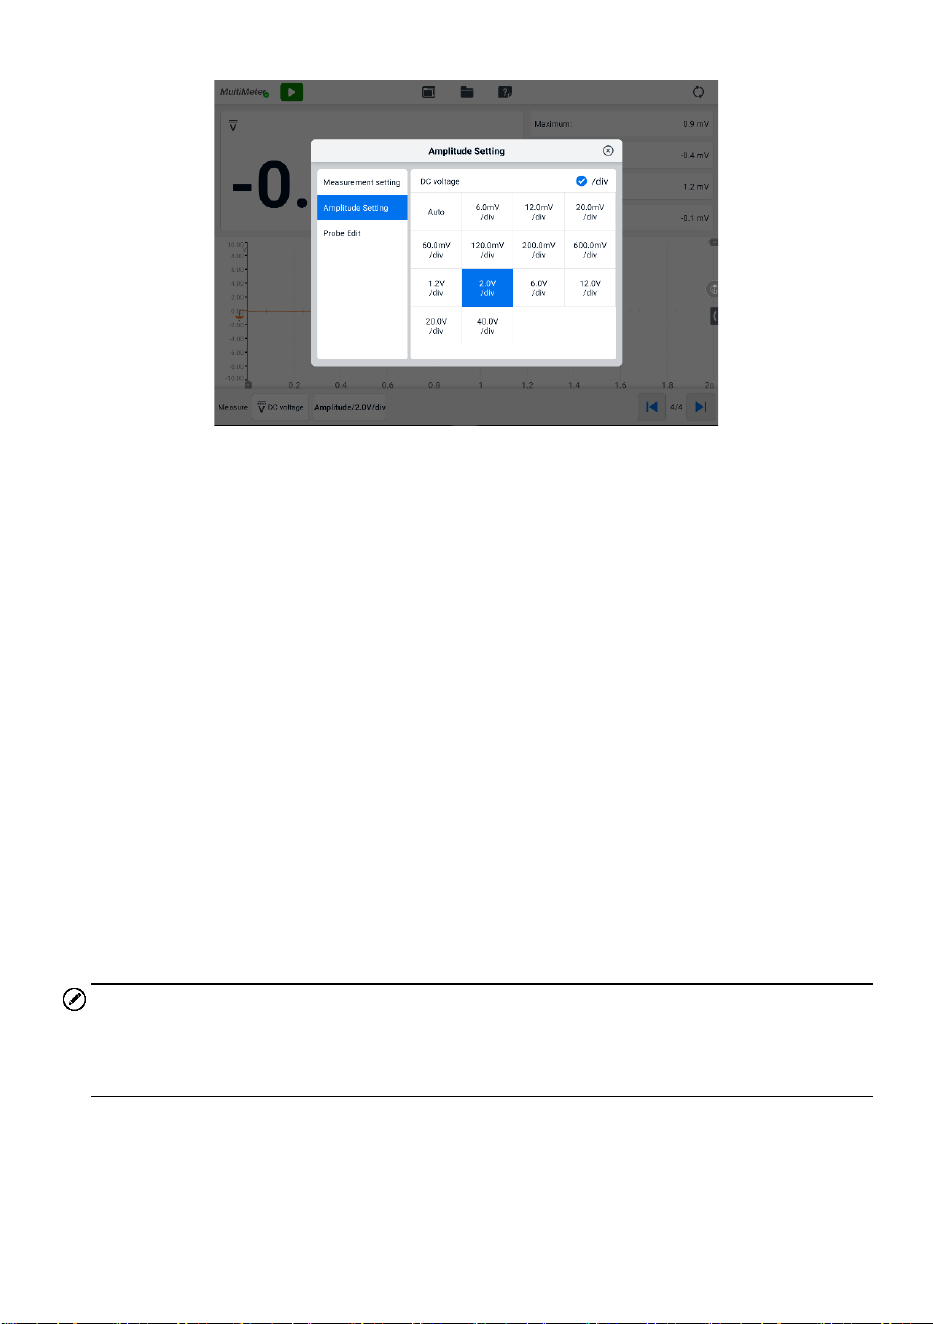
165
Figure 9-77 Amplitude Setting Screen (DC 2.0 V/div)
⚫ Testing Procedures
The following section describes how to use the multimeter. The testing procedures
are the same for each measurement type.
The following directions are for measuring AC voltage.
➢ To measure AC voltage
1. Tap the Measurement Setting button in the lower-left corner of the screen to
open the setting dialog box. Select AC voltage in the dialog box.
2. Set the proper amplitude value in the Amplitude Setting menu in the same
dialog box.
3. Connect the supplied multimeter test lead to the VCMI multimeter jacks. Insert
the multimeter probe into the test lead.
4. Hold the probes to the correct points of the circuit.
5. Tap the Start button on the upper-left corner of the screen to start the multimeter.
The voltage displays onscreen.
NOTE
Use the optional current clamp connected to the input channel A when measuring
currents. Use the supplied multimeter probes to connect with the multimeter jacks for
other measurement types.
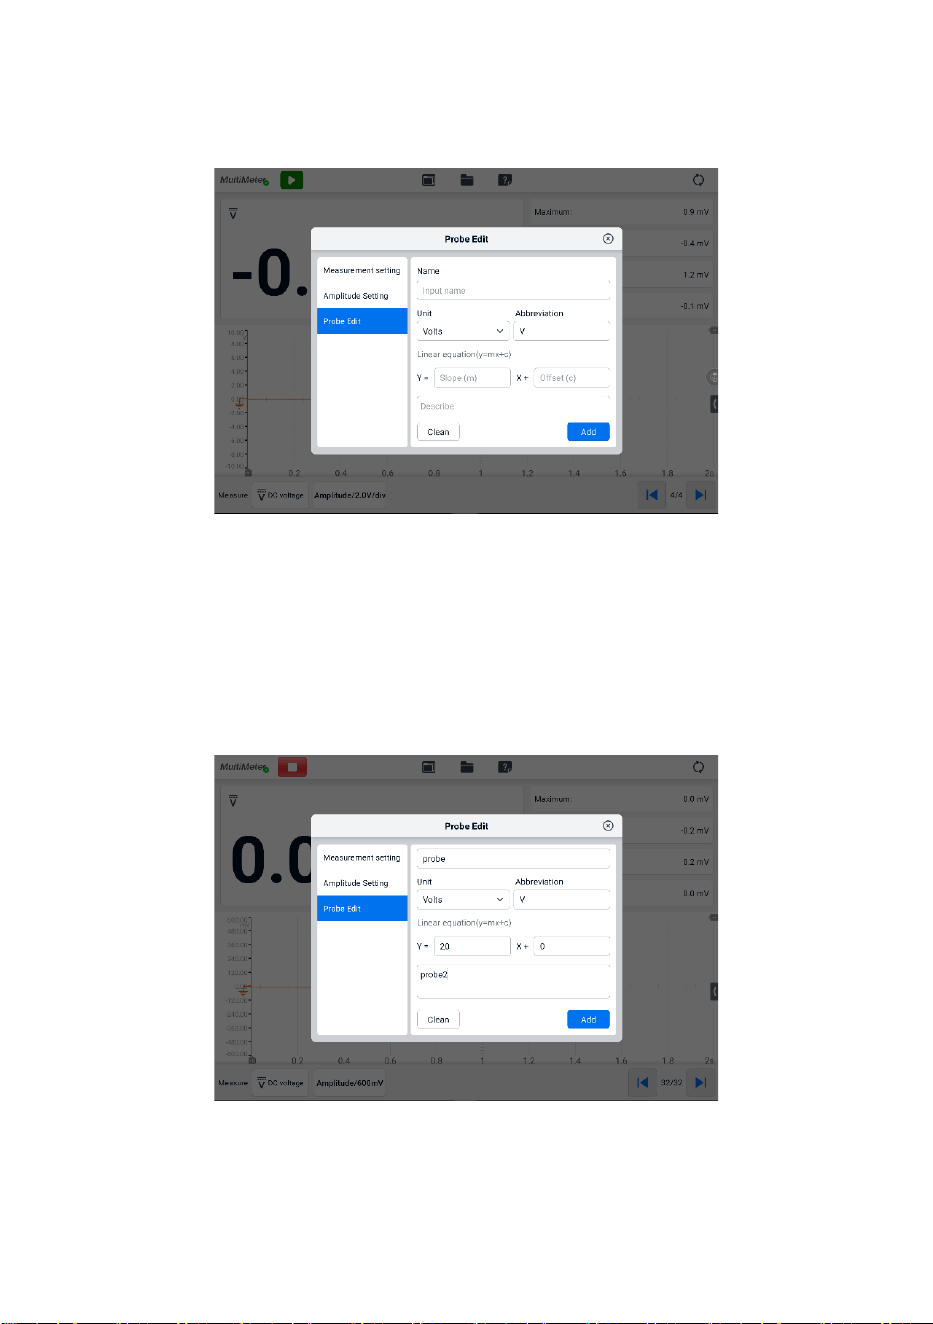
166
⚫ Probe Edit
Use the probe edit menu to add the not included probes into the probe menu.
Figure 9-78 Probe Edit Screen 1
➢ To add custom probes
1. Tap the Measurement Setting button in the lower left corner of the screen to
open the setting dialog box.
2. Select the Probe Edit option in the left column of the dialog box.
3. Tap each field to open the virtual keyboard and input the required information.
Figure 9-79 Probe Edit Screen 2
4. Tap Add to save the settings, or tap Clean to exit without saving.
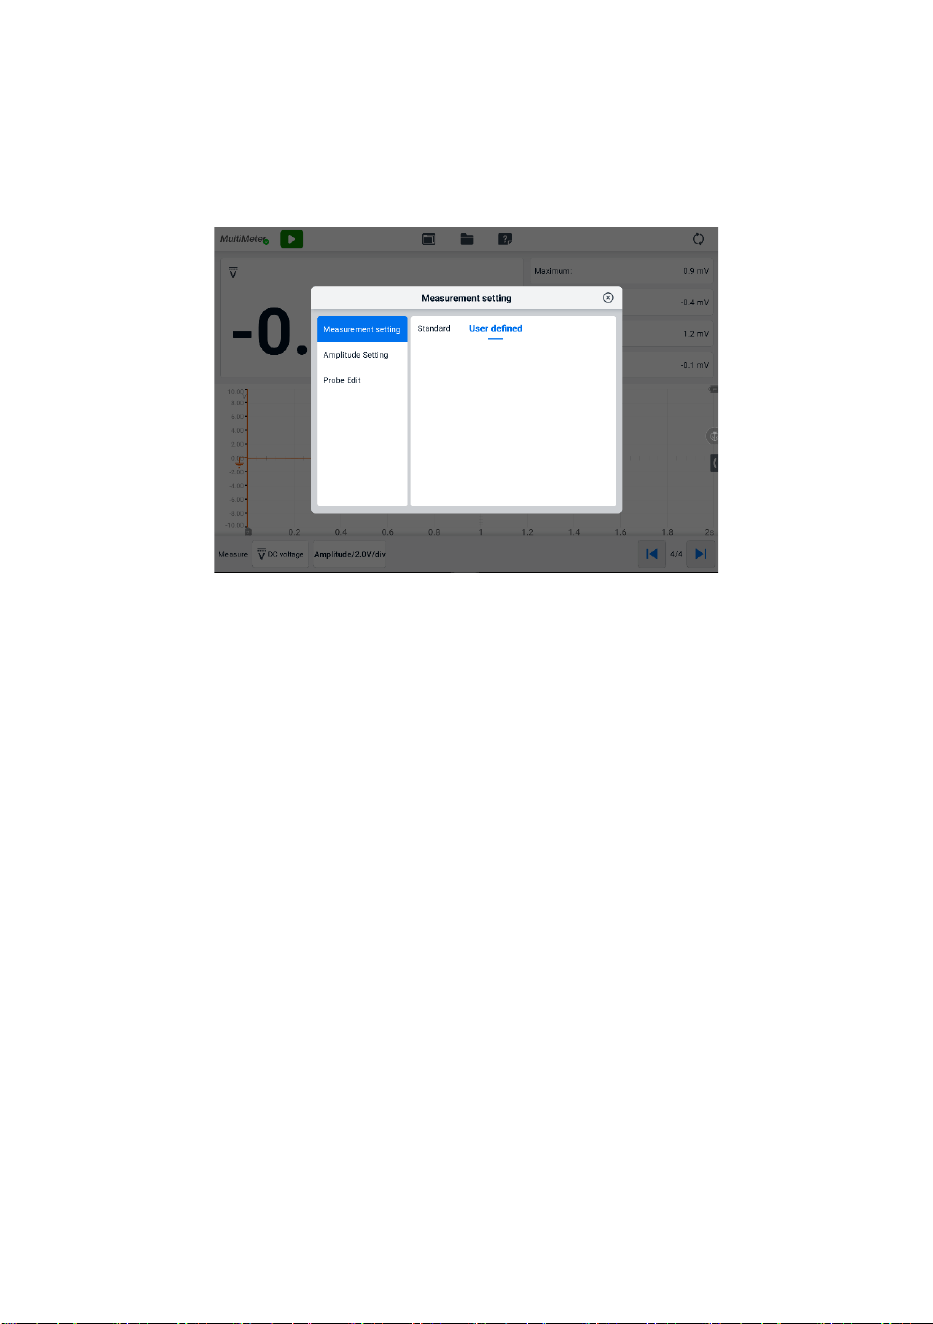
167
5. The added probe will be listed in the Measurement Settings window. Tap the “X”
button in the upper-right corner to close the dialog box.
6. After selecting the custom probe, connect a matching probe in the input channel
A. The probe is connected to the signal position to be measured for
measurement. At this time, the current measurement is displayed on the screen.
Figure 9-80 Probe Edit Screen 3
⚫ Buffer
The waveform buffer displays the current waveform number and the total number of
stored waveforms.
The multimeter can capture and store up to 32 waveforms. Tap the Previous or Next
button to review waveforms.
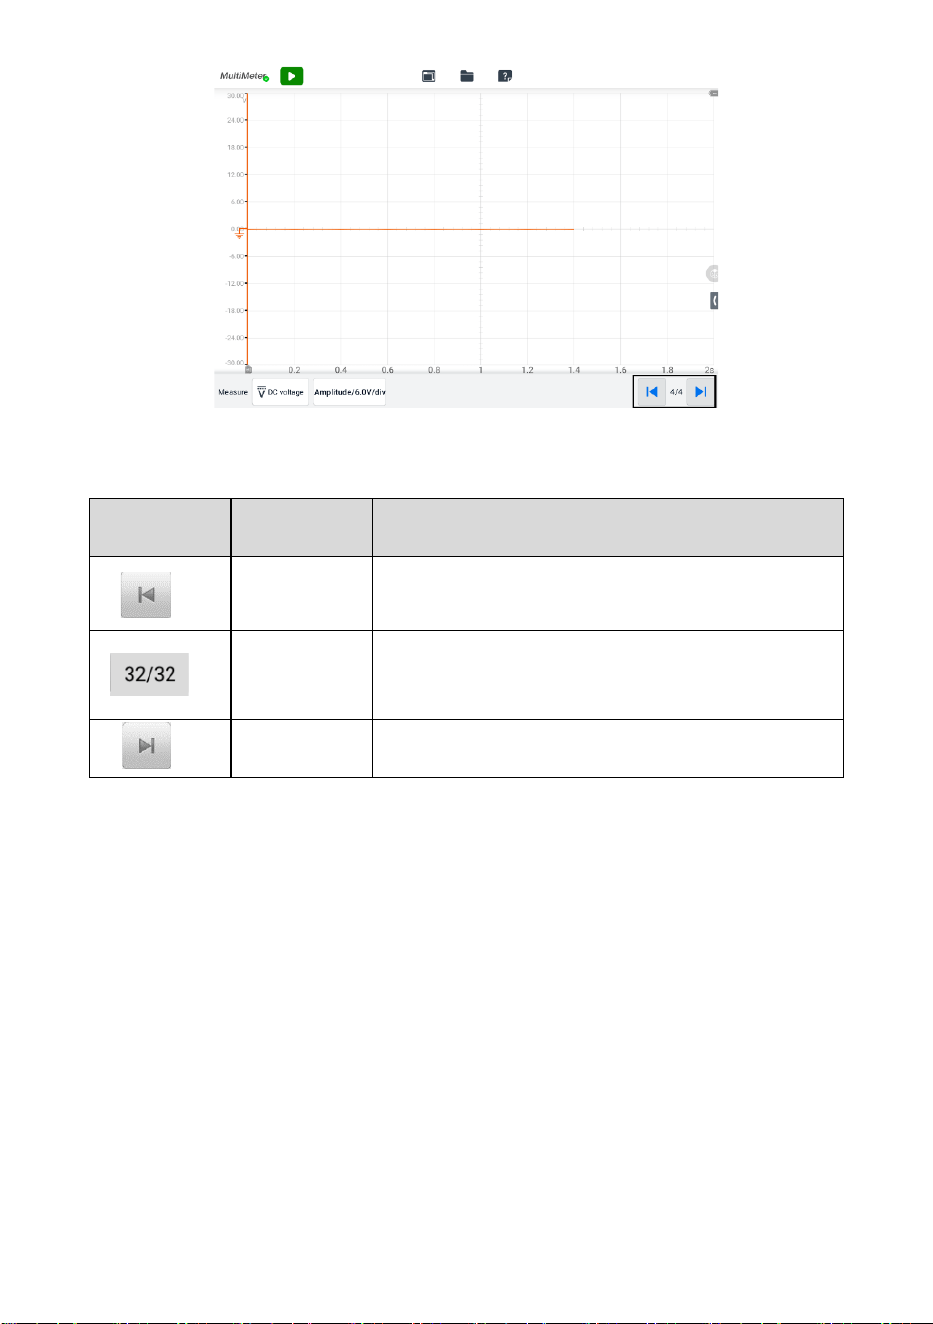
168
Figure 9-81 Buffer Screen
Button
Name
Description
Previous
Tap to display the previous waveform in the buffer.
Buffer Index
Displays the number of the waveform currently
displayed onscreen out of the total number of
buffered waveforms.
Next
Tap to display the next waveform in the buffer.
9.2.6 Troubleshooting
If the multimeter cannot communicate with the tablet:
⚫ Check if the VCMI2 is properly connected to the tablet via Wi-Fi or the supplied USB
cable.
⚫ If the communication between the VCMI2 and the tablet still fails, restart the tablet
and reconnect the VCMI2.
9.2.7 Glossary
AC
Alternating Current — electrical current that switches polarity at regular intervals.

169
DC
Direct Current — electrical current that flows in one direction only.
Amperage
The strength of an electric current, expressed in amperes.
Amplitude
The maximum voltage generated from the zero volts line of the multimeter.
Frequency
The number of signal occurrences per second. Frequency is measured in Hz (hertz).
Duty Cycle
The length of a signals on time. Specified as a percentage (ratio), of the total cycle time.
Peak to Peak
The difference between maximum and minimum value.
Diode
Diode is an electronic device made of semiconductor materials, with a single conductivity.
Grid
A network of horizontal and vertical scales displayed on the screen that aids in the
measuring of signal characteristics.
9.3 Waveform Generator
The signal generator is an instrument that simulates the signals of automotive electronic
components. When the VCMI2 (Vehicle Communication and Measurement Interface 2)
device is connected with MaxiSys tablet, you can open the Waveform Generator
application by taping the Measurement icon on the Home screen of the tablet and then
tapping the waveform generator icon, and perform the waveform generator-related
functions, including simulating automotive sensor signals and actuator signals.
9.3.1 Safety Information
Follow the instructions below to reduce the risk of injury from electric shock and prevent
equipment damage.

170
⚫ Use the waveform generator only as specified in this manual.
⚫ Do not apply more than the rated voltage between connectors or between any
connector and earth ground.
⚫ To minimize shock hazard, please connect the device ground input (chassis) to an
electrical ground.
⚫ Do not alter the ground connection. Without the protective ground connection, all
accessible conductive parts can render an electric shock.
⚫ To avoid electric shock hazard, disconnect power cable before removing covers.
⚫ To prevent injury or death, do not use the waveform generator if it appears to be
damaged in any way, and stop use immediately if you are concerned any abnormal
operations.
⚫ Inspect the test leads or probes for damage before use.
⚫ Use the accessories supplied with the product.
⚫ Use the supplied replacement fuses or specified replacement parts.
⚫ To prevent damage, always use and store your waveform generator in appropriate
environments.
⚫ Do not place the waveform generator in an area that is directly exposed to sunlight
or under high humidity.
⚫ Do not tamper with or disassemble the waveform generator, connectors or
accessories. Internal damage will affect performance.
⚫ Disconnect waveform generator from power source, vehicle and tablet before
cleaning.
⚫ When cleaning the waveform generator, use a damp, soft cloth with mild detergent.
Do not allow water to enter the waveform generator casing.
9.3.2 General Introduction
9.3.2.1 Component Locations
The multimeter jacks are used when operating the waveform generator. The two
multimeter jacks are located on the top of the VCMI2.
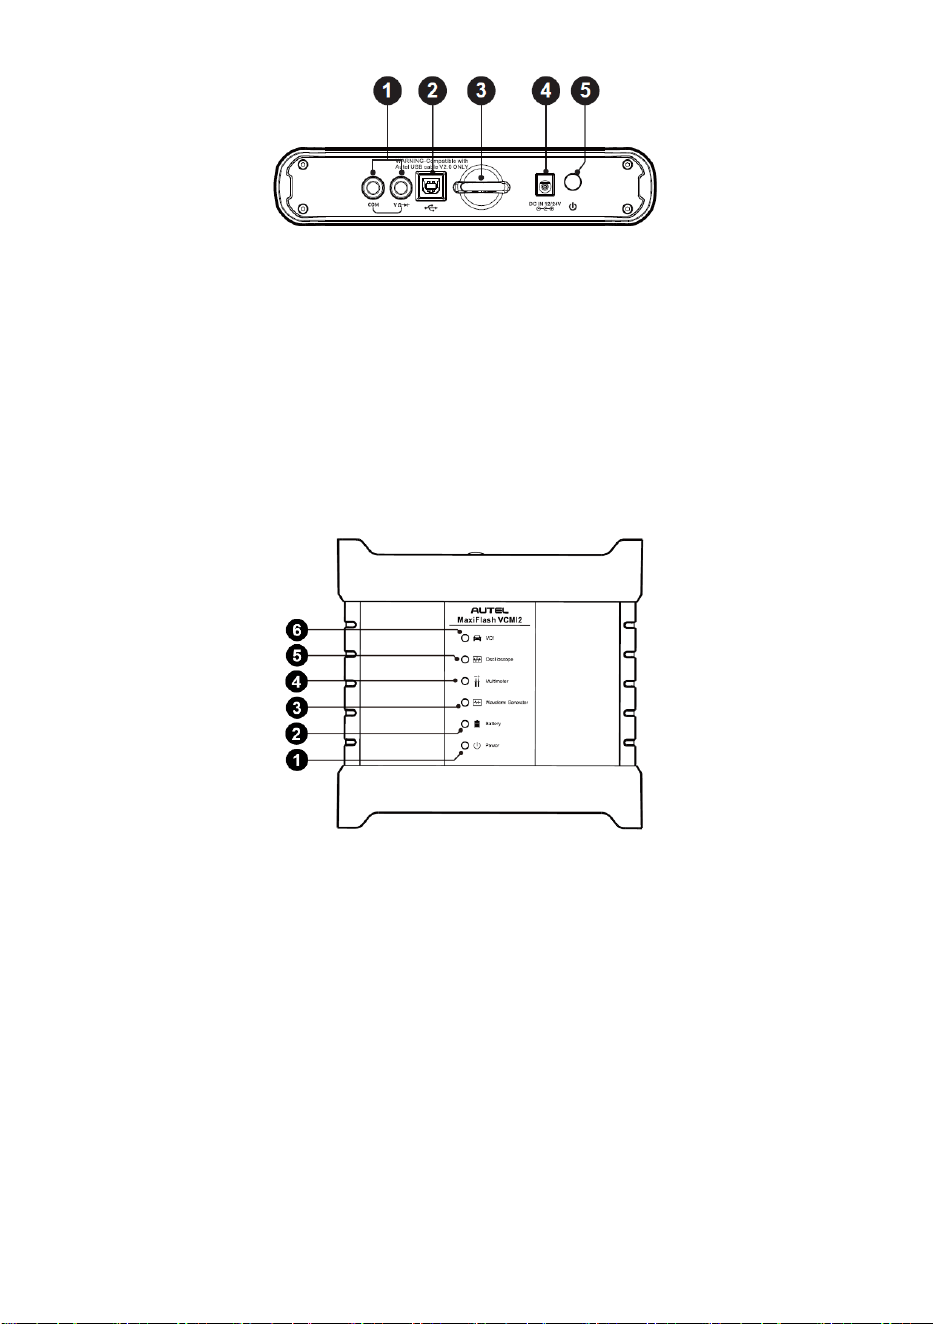
171
1. Multimeter Jacks — for ground and signal cables
2. USB Port
3. Hook
4. DC Power Supply Input Port
5. Power Button
The waveform generator LED is located on the front panel of the VCMI2. When the
VCMI2 is properly connected and powered on, the waveform generator LED lights green
when operating in the waveform generator mode.
1. Power LED
2. Battery LED
3. Waveform Generator LED
4. Multimeter LED
5. Oscilloscope LED
6. Vehicle LED
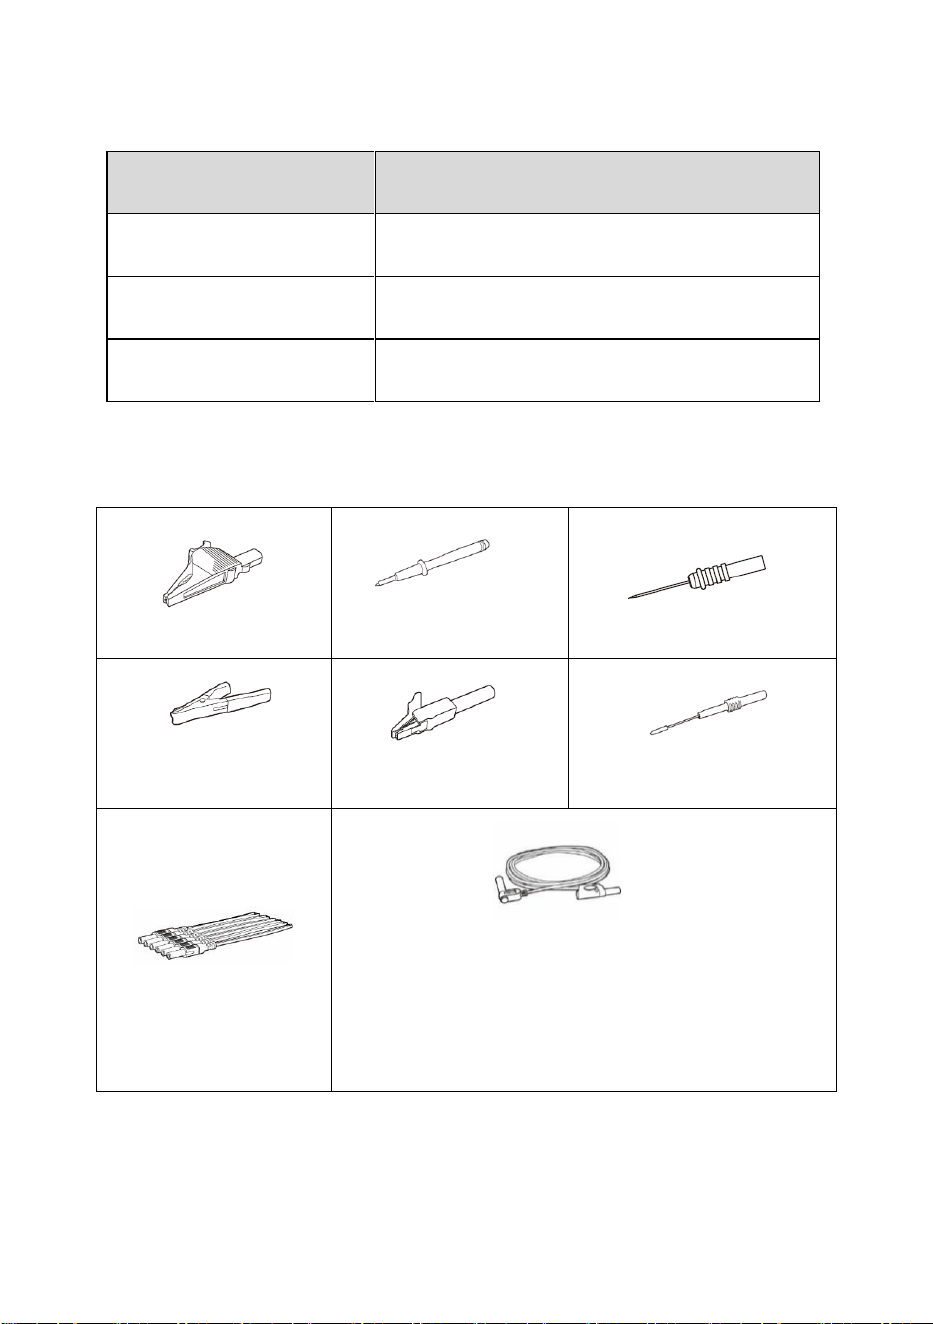
172
9.3.2.2 Technical Specifications
Table 9-11 Technical Specifications
Item
Description
Voltage Range
0.1 to 12 V
Frequency Output
1 Hz to 30 KHz
Duty Cycle Range
1 % to 99 % (1 Hz to 30 KHz)
9.3.2.3 Accessories
The following accessories are compatible with the waveform generator and oscilloscope.
Large Dolphin Clip
Multimeter Probe
Back-pinning Probe
Battery Clip
Small Alligator Clip
Flexible Back-pinning
Probe
Breakout Lead
Multimeter Test Lead: used to connect the waveform
generator and probe.
NOTE: The two multimeter test leads (Red: SA015 /
Black: SA016) are standard for the multimeter and
waveform generator.
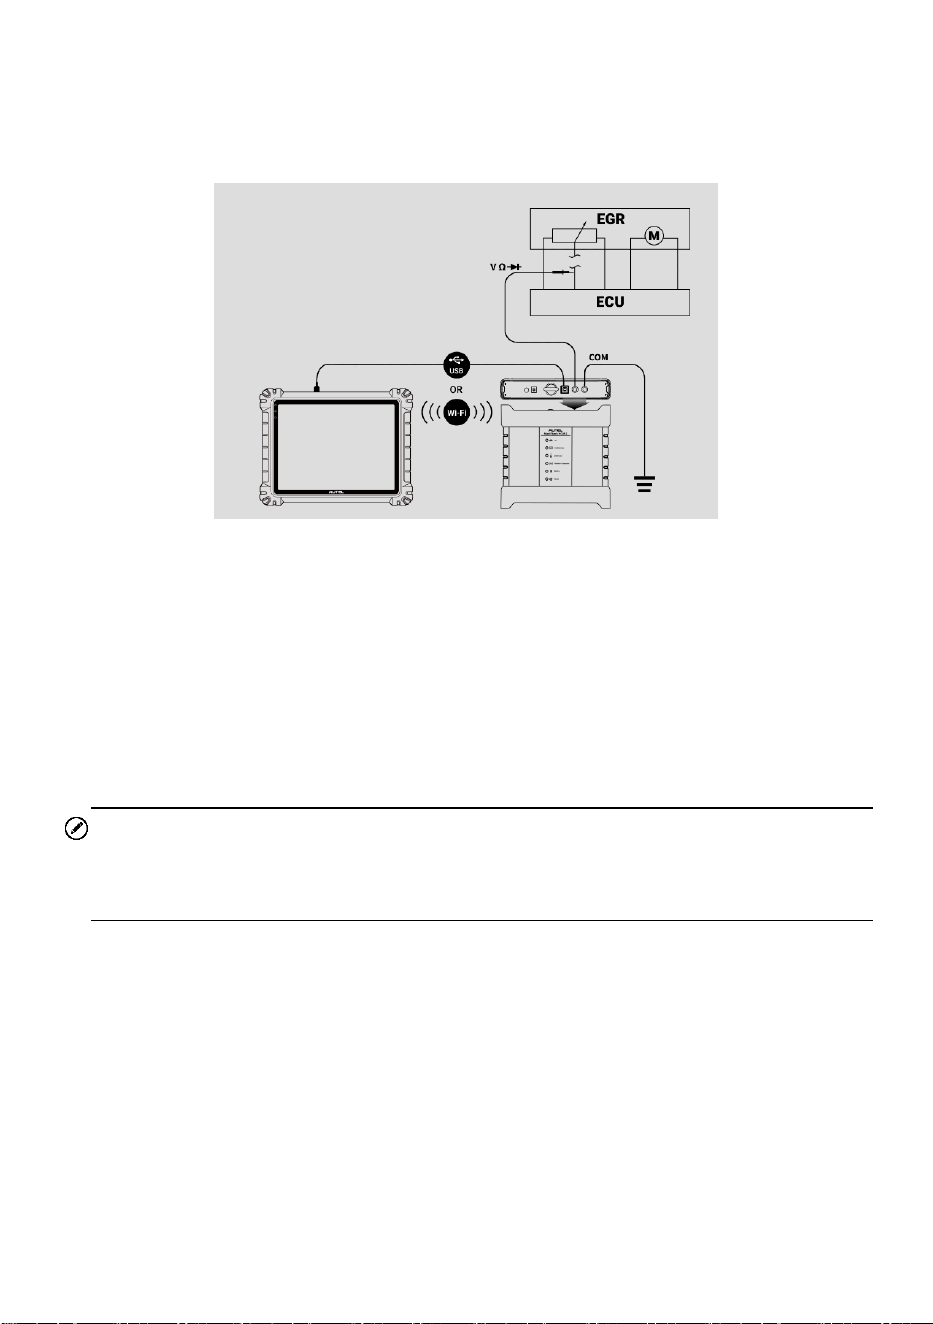
173
9.3.3 Getting Started
Before opening the waveform generator application, the VCMI2 must be connected to
the tablet via the provided USB cable or Wi-Fi network.
Figure 9-82 Connection Diagram
➢ To open the waveform generator application
1. Insert the multimeter test lead ends into the multimeter jacks on the top of the
VCMI2 to compete the connection.
2. Tap the Measurement icon on the Home screen of the MaxiSys tablet. The
Measurement screen displays.
3. Tap the Waveform generator icon to open the waveform generator menu.
4. Select a test to continue.
NOTE
Please check the waveform generator LED status indicator on the front panel of VCMI2.
The waveform generator LED lights green when operating in the waveform generator
mode.
9.3.4 Waveform Generator Update
The operating software of the waveform generator is continually optimized. Tap the Help
button in the top toolbar and then tap the Update the APK button in the dropdown list to
update the software.
Before updating the waveform generator's software, please make sure the tablet has a
stable Internet connection.
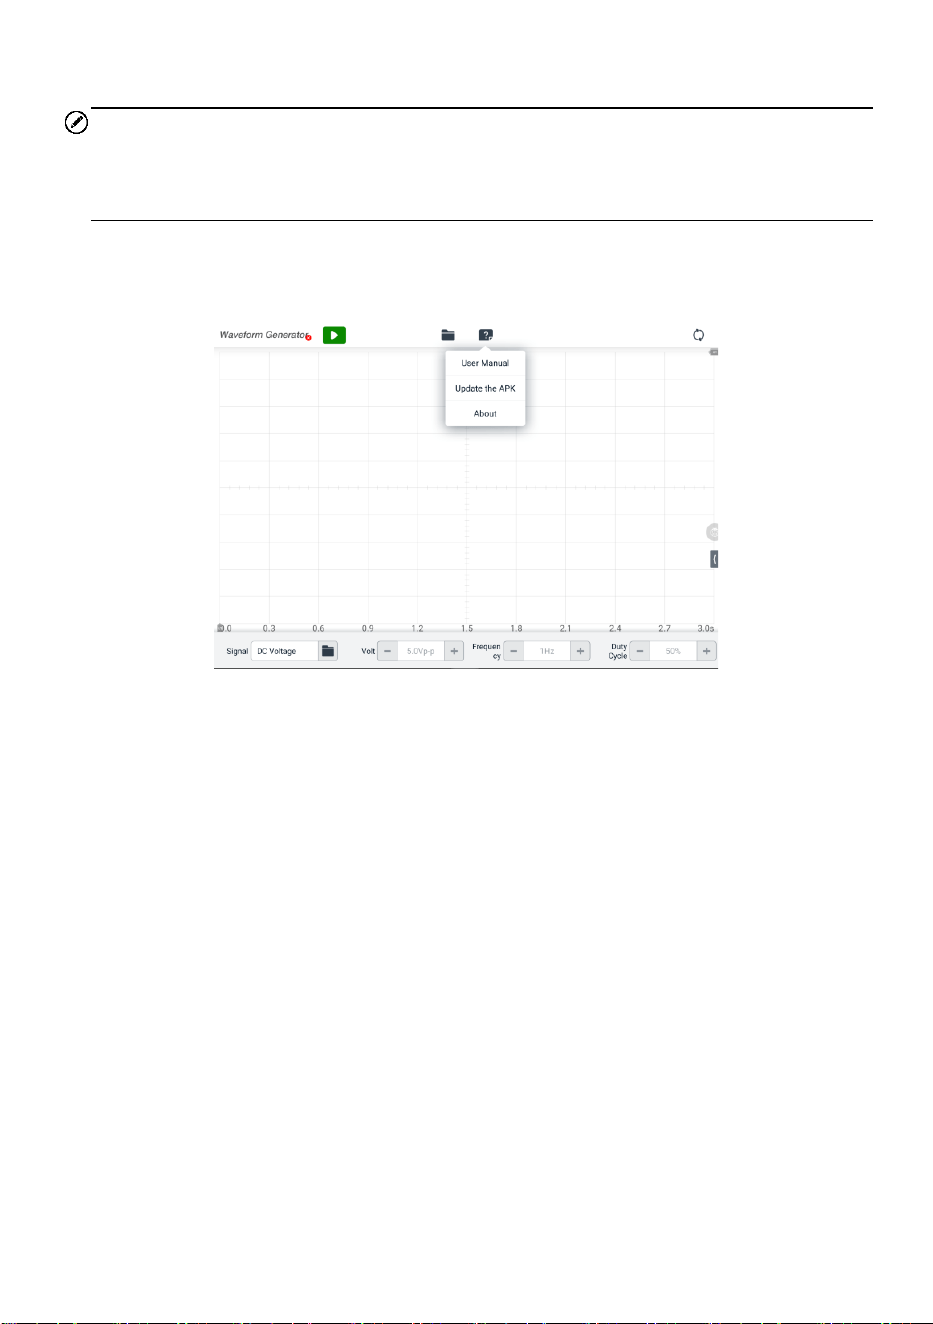
174
9.3.4.1 APK Update
NOTE
The acronym APK (Android Package Kit) is used on the tablet and in this manual. This
file contains all the assets of a particular app. To update the APK, is to install the latest
version of the app on your tablet.
➢ To update the APK
1. Tap the Help button on the upper half of the screen. A dropdown menu displays.
Figure 9-83 Help Screen
2. Tap the Update the APK in the dropdown menu. A confirmation message will
display.
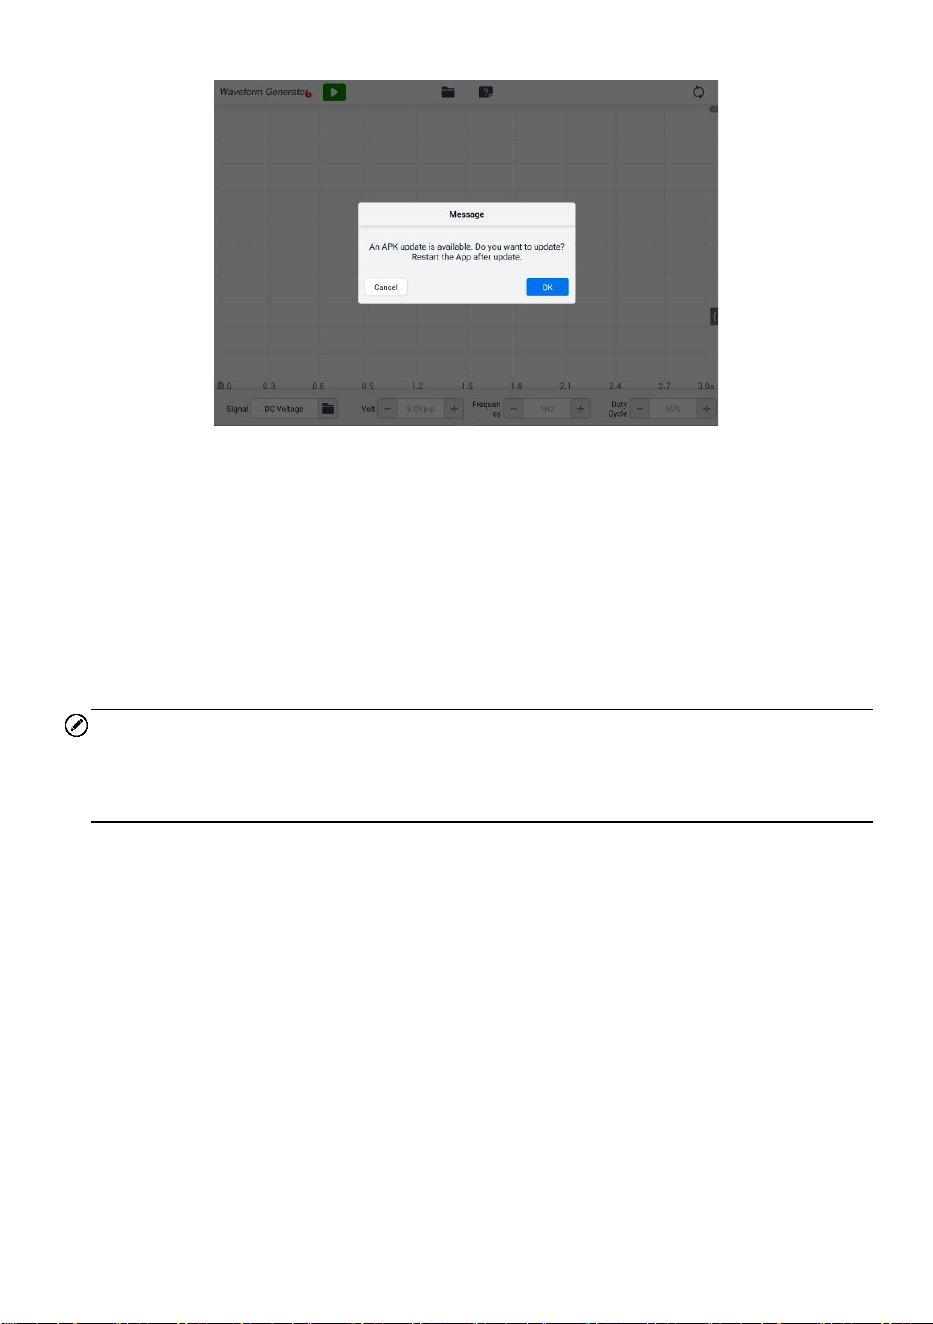
175
Figure 9-84 Update Confirmation Screen
3. Tap OK to update the software or tap Cancel to exit.
9.3.5 Screen Layout and Operations
Tap the Measurement icon on the Job Menu and select Waveform generator from the
menu, the waveform generator page displays. The screen typically includes the following
button sections.
NOTE
The Waveform Generator application can also be opened via the Android home screen.
Tap the Measurement icon at the top of the Android home screen. Tap Waveform
Generator icon.
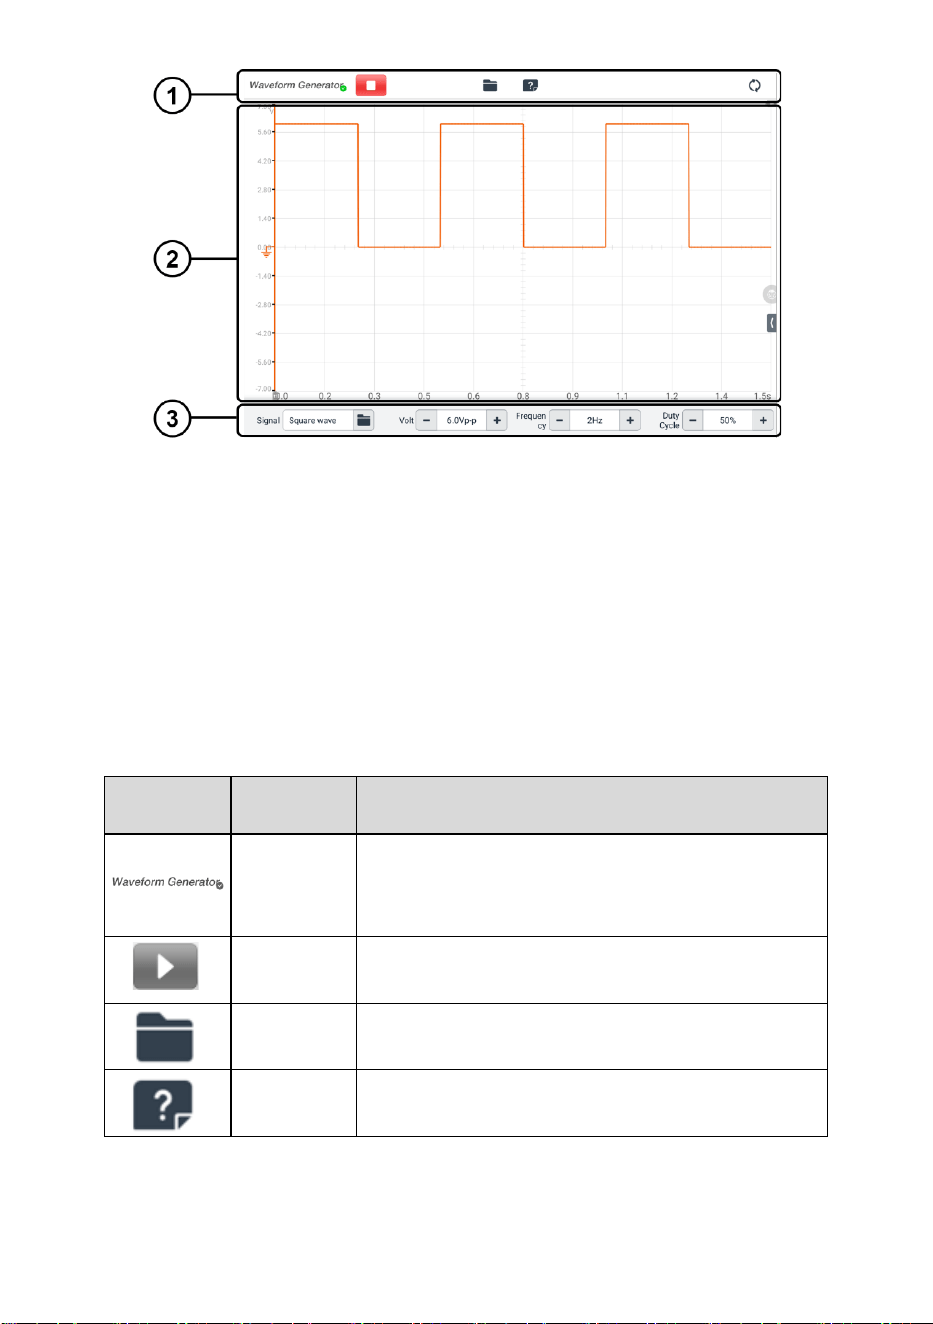
176
Figure 9-85 Waveform Generator Menu Screen
1. Upper Toolbar
2. Main Section
3. Lower Toolbar
9.3.5.1 Upper Toolbar
The upper toolbar is used to configure settings and operations. The following table
provides brief descriptions of each button.
Table 9-12 Upper Toolbar
Button
Name
Description
Waveform
generator
Icon
Displays the waveform generator connection
status.
Start/Stop
Start and stop the waveform generator device.
File
Print, open and save the waveform data.
Help
View the user manual, and update the software.
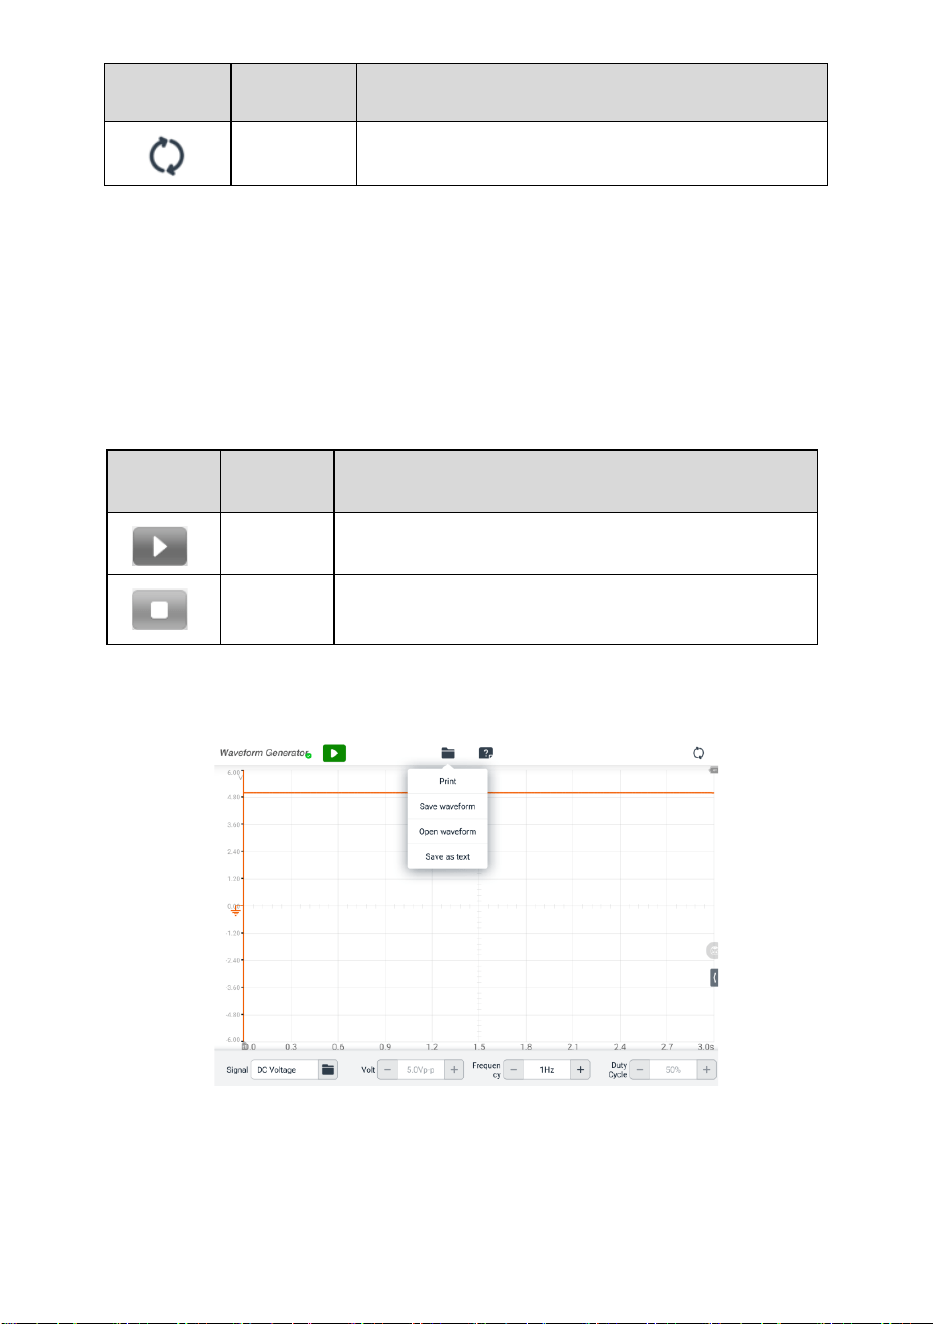
177
Button
Name
Description
Reset
Reset the configurations and refresh the screen.
⚫ Waveform Generator Icon
This Waveform Generator Icon displays the waveform generator connection status.
A green check mark means the tablet and the waveform generator are connected;
a red X means the device and the tablet are not connected.
⚫ Start/Stop Button
You can tap the Start/Stop Button icon to start or stop the waveform generator
device.
Button
Name
Description
Start
Tap to start the waveform generator.
Stop
Tap to stop the waveform generator.
⚫ File Menu
The file menu supports the following functions.
Figure 9-86 File Menu Screen
✓ Print — tap to create and print a temporary PNG picture of the current
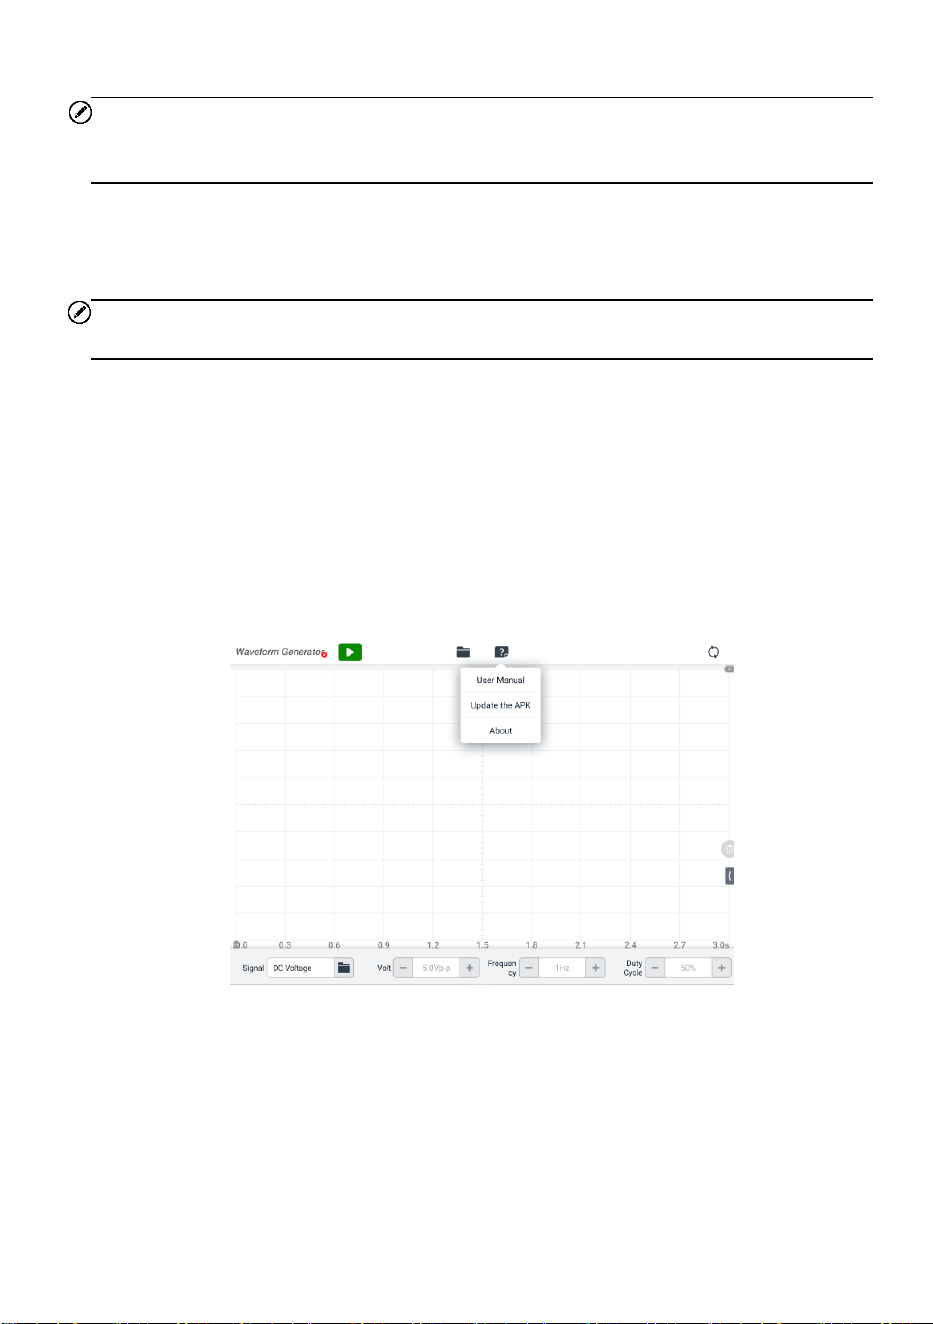
178
waveforms.
NOTE
Ensure the tablet is configure to print (see Printer setup instructions) and is connected to
the printer. Ensure the tablet and printer share the same network.
✓ Save Waveform — tap to capture and save the current waveform. On the Save
File screen, tap each item to input the corresponding information and then tap
Save or Save Default to finish.
NOTE
You must name the file to save the waveform.
✓ Open Waveform — tap to retrieve the saved waveforms. Tap the Edit button
in the upper right corner of the screen to select and delete the saved waveform.
✓ Save as text — tap to save the current waveform data to a text file. Use the ES
File Explorer app on the Android home screen to review file: Home > ES File
Explorer > Local > Internal Storage > Scan > Data > Signal > txt.
⚫ Help Menu
The Help Menu allows you to view the user manual, update the software, and view
versions of the device.
Figure 9-87 Help Menu Screen
✓ User Manual — displays instructions for the proper use of the waveform
generator.
✓ Update the APK — connects to the Autel server and get the latest application
software version.

179
✓ About — displays the model numbers and the installed versions of the software.
9.3.5.2 Main Section
The main section screen displays as a coordinate grid with X-axis and Y-axis,
representing the duration and amplitude level respectively.
⚫ Channel Selection
In the main section, a channel has two conditions: selected and unselected. A
channel must be selected in order for the waveform to be movement, to use the
zoom-in or to add measurement rulers.
➢ To select and unselect the channel
1. Tap the Zero Baseline marker or the Y-axis (the line thickens when selected).
2. Tap the Zero Baseline marker or the Y-axis again to exit the channel selection.
⚫ Waveform Zooming
The zooming function allows you to change the size and position of a signal during
or after capturing a waveform to examine it in greater details. It does not change the
stored data, only the way it displays.
The X-axis and Y-axis can be zoomed using your fingertips. The waveform can be
zoomed during or after capturing the signal.
⚫ Measurement Ruler
In the coordinate grid, there are two types of measurement rulers, which allow the
amplitude and duration of a waveform to be measured precisely. They are useful
when determining signal characteristics such as amplitude at specific points, and
the cycle time (duration).
The vertical Time Ruler — tap the Ruler Activator in the lower left corner of the
grid and drag it across the screen to the desired position. A Time Ruler is generated.
The horizontal Signal Ruler — the Signal Ruler can be generated in the similar
way by clicking the Ruler Activator in the upper right corner and dragging it
downwards.
When dragging the Measurement Rulers, a Ruler Table showing time and voltage
values will be displayed. The Delta icon refers to the absolute difference between
the values of the rulers, which can be locked by tapping the Lock icon. Tap the X
button in the upper right corner of the ruler table to delete all rulers.

180
Figure 9-88 Measurement Rulers Screen
⚫ Zero Baseline
The Zero Baseline is marked as the 0 value in the Y-axis, showing the ground level
of each channel waveform. After the channel is selected, the Zero Baseline can be
adjusted by dragging the Zero Baseline marker up/down along the Y-axis.
⚫ Wiring Diagram and Help
Tap the arrow button in the lower right corner of the screen to open the Wiring
Diagram and Help window.
The Wiring Diagram function provides the connection diagram, operation steps,
and operation notes.
The Help function provides content-sensitive help, displaying information relevant to
the procedure, operation or instructions.
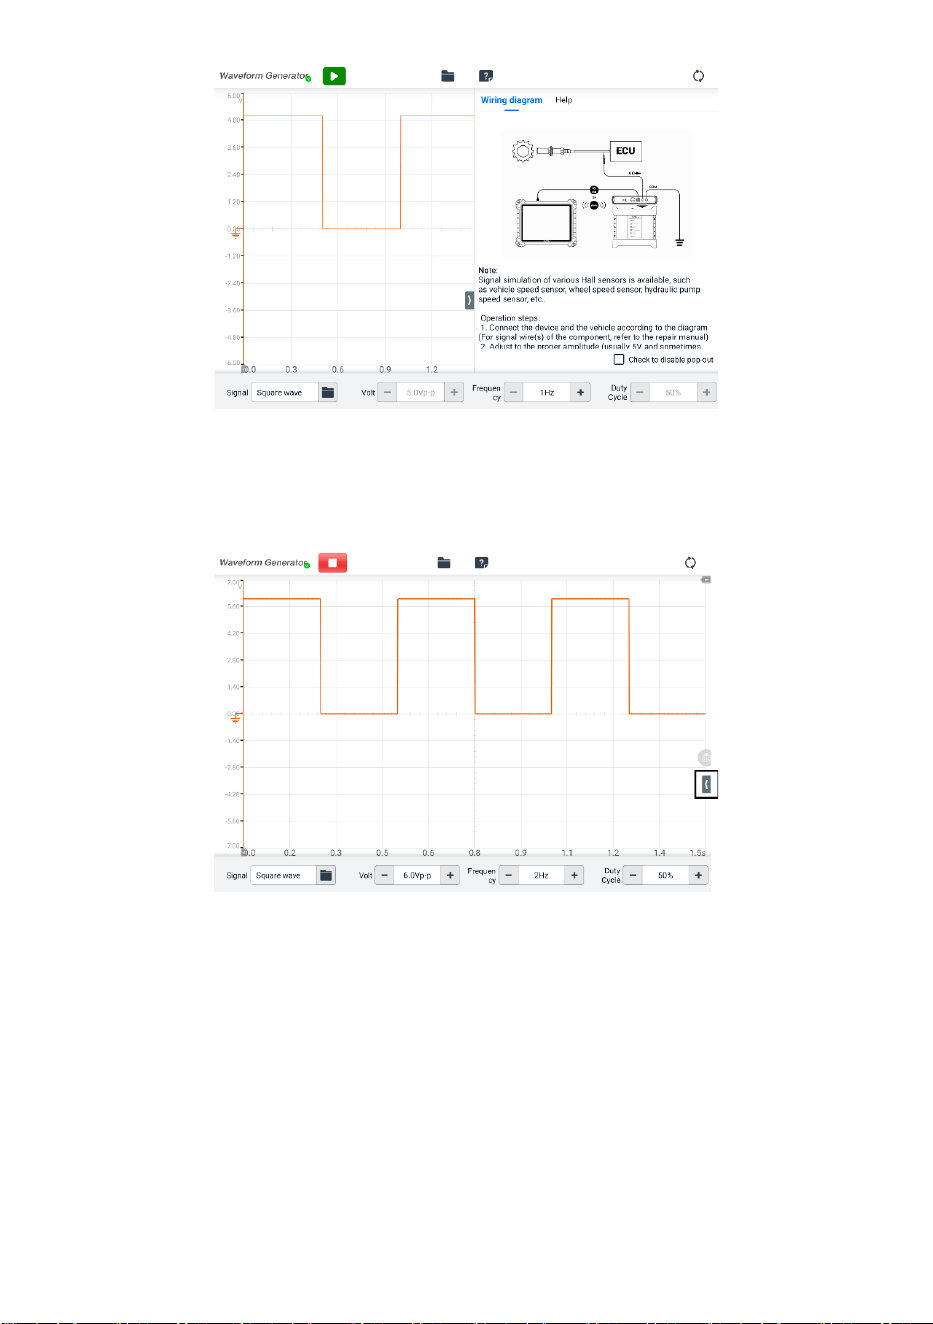
181
Figure 9-89 Wiring Diagram and Help Screen
➢ To open and close the Wiring Diagram and Help window
1. Tap the arrow button on the right-hand side of the screen.
Figure 9-90 Arrow Button Position Screen
2. The Wiring Diagram and Help window displays.
3. Tap the arrow button again or tap any space outside of the window.
9.3.5.3 Lower Toolbar
The signal mode, voltage, frequency and duty cycle can be configured via the lower
toolbar.
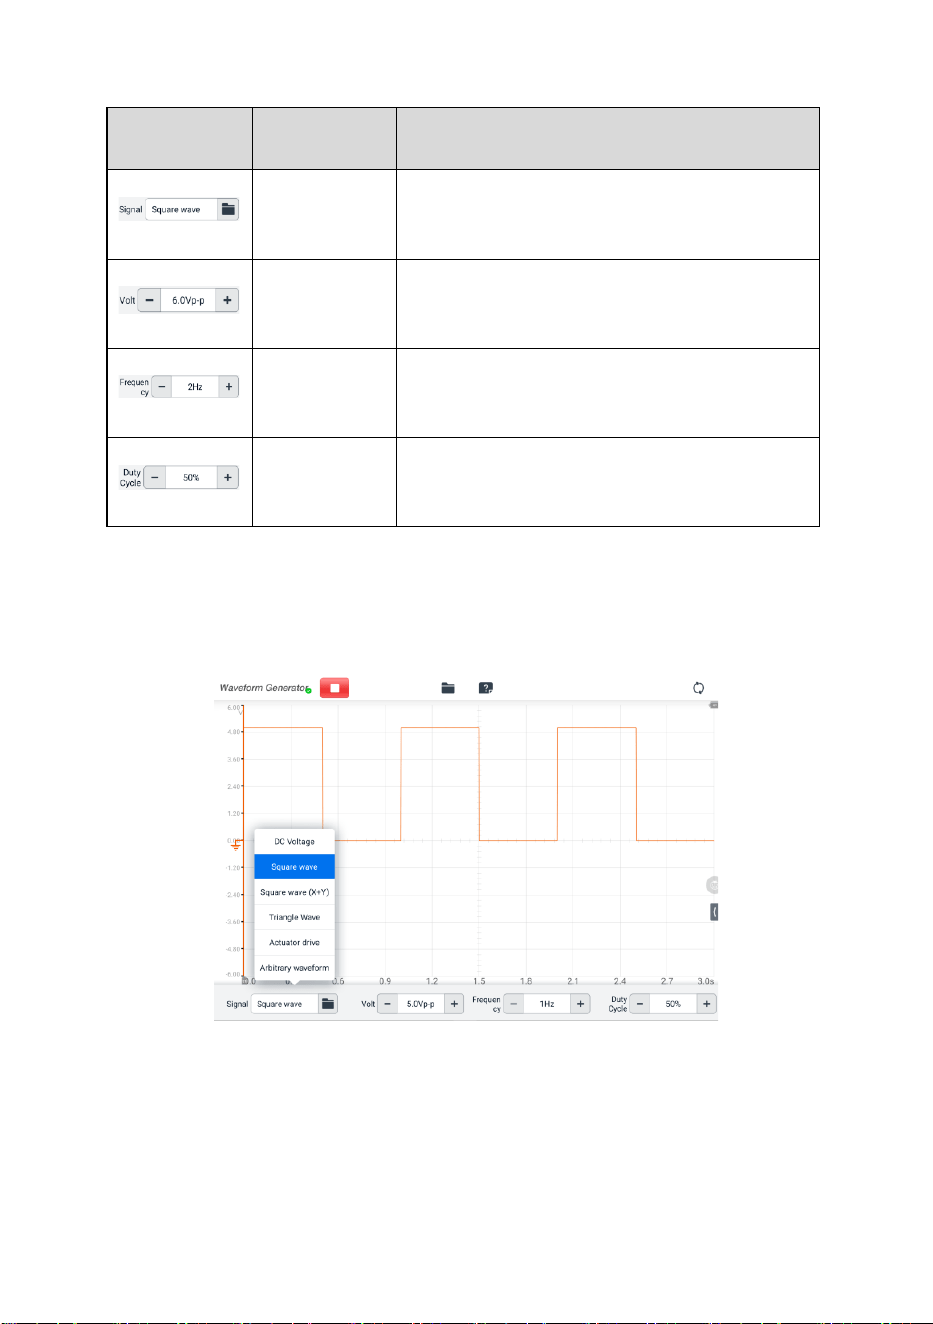
182
Table 9-13 Lower Toolbar
Button
Name
Description
Signal Mode
Setting
Tap to select an appropriate signal mode.
Voltage
Setting
Tap to select an appropriate voltage value.
Frequency
Setting
Tap to select an appropriate frequency value.
Duty Cycle
Setting
Tap to select an appropriate duty cycle value.
⚫ Signal Mode Setting
The waveform generator supports numerous signal modes including the DC voltage,
square wave, square wave (X+Y), triangle wave, and actuators drive, and arbitrary
waveform.
Figure 9-91 Signal Mode Setting Screen
DC Voltage
Set the DC voltage in the waveform generator interface. The waveform
generator can simulate the signals of numerous sensors including the water
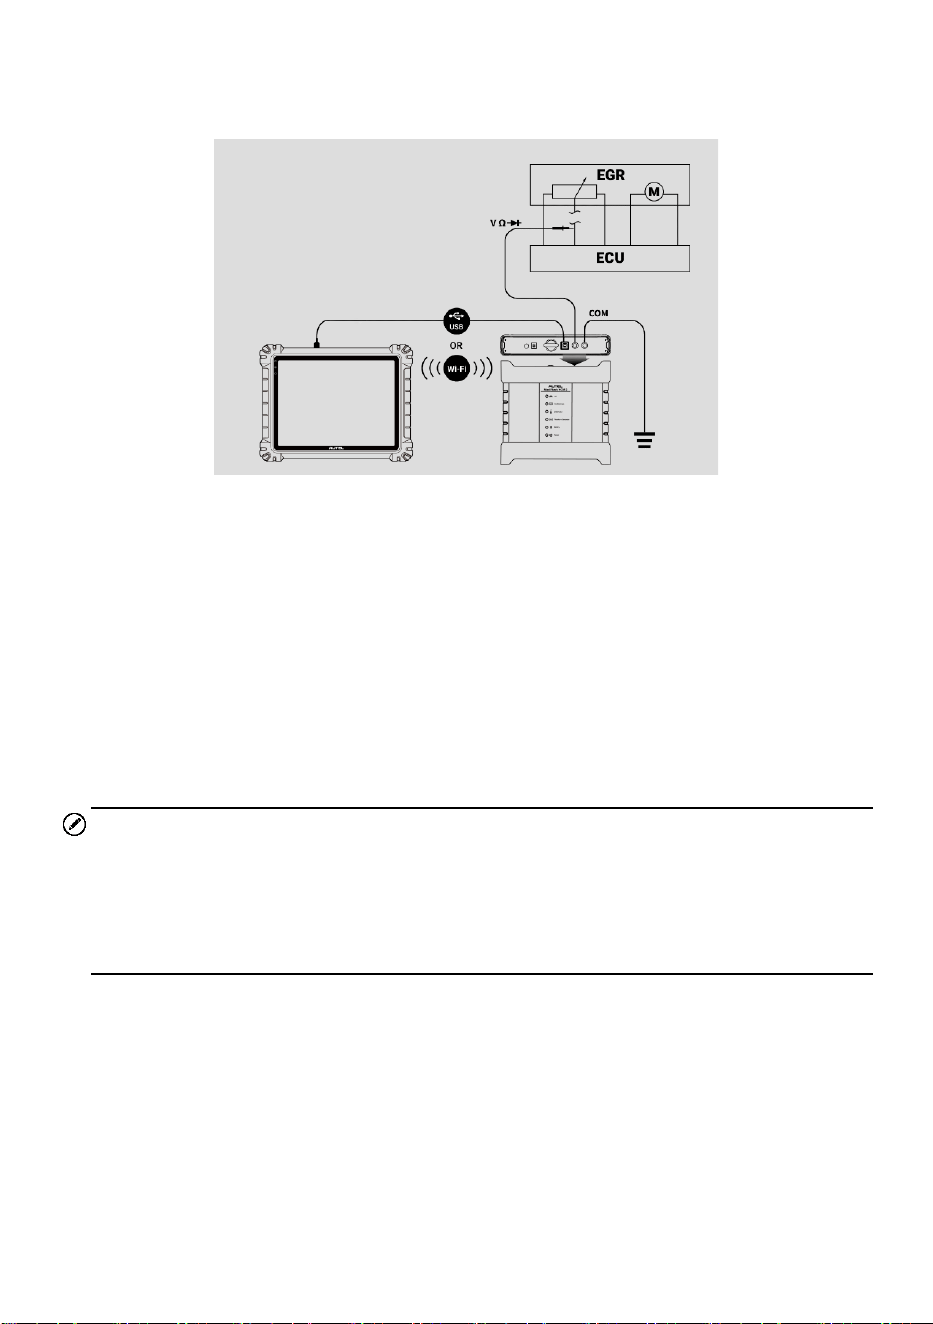
183
temperature sensor, oil pressure sensor, and position sensor and then feed
back to the engine ECU.
Figure 9-92 DC Voltage Connection Diagram
Actuator Drive
This function can drive 2-wire solenoid valve, solenoid coil, and low-power motor,
including the canister solenoid valve, injector solenoid valve, transmission
hydraulic valve, hydraulic control valve, ignition coil, idle motor, and throttle
motor.
It can change the operation speed and working time of the actuator by setting
the frequency and duty cycle. The higher the frequency, the faster the speed,
the higher the duty cycle, and the longer the working time, and vice versa.
NOTE
1. To avoid damaging the actuator, do not actuate it for a long time, and do not set too
high a frequency.
2. This function needs to be tested on the car. If the actuator is removed, it cannot be
driven individually.
3. The maximum current supported by Actuator Drive cannot exceed 1.9 A.
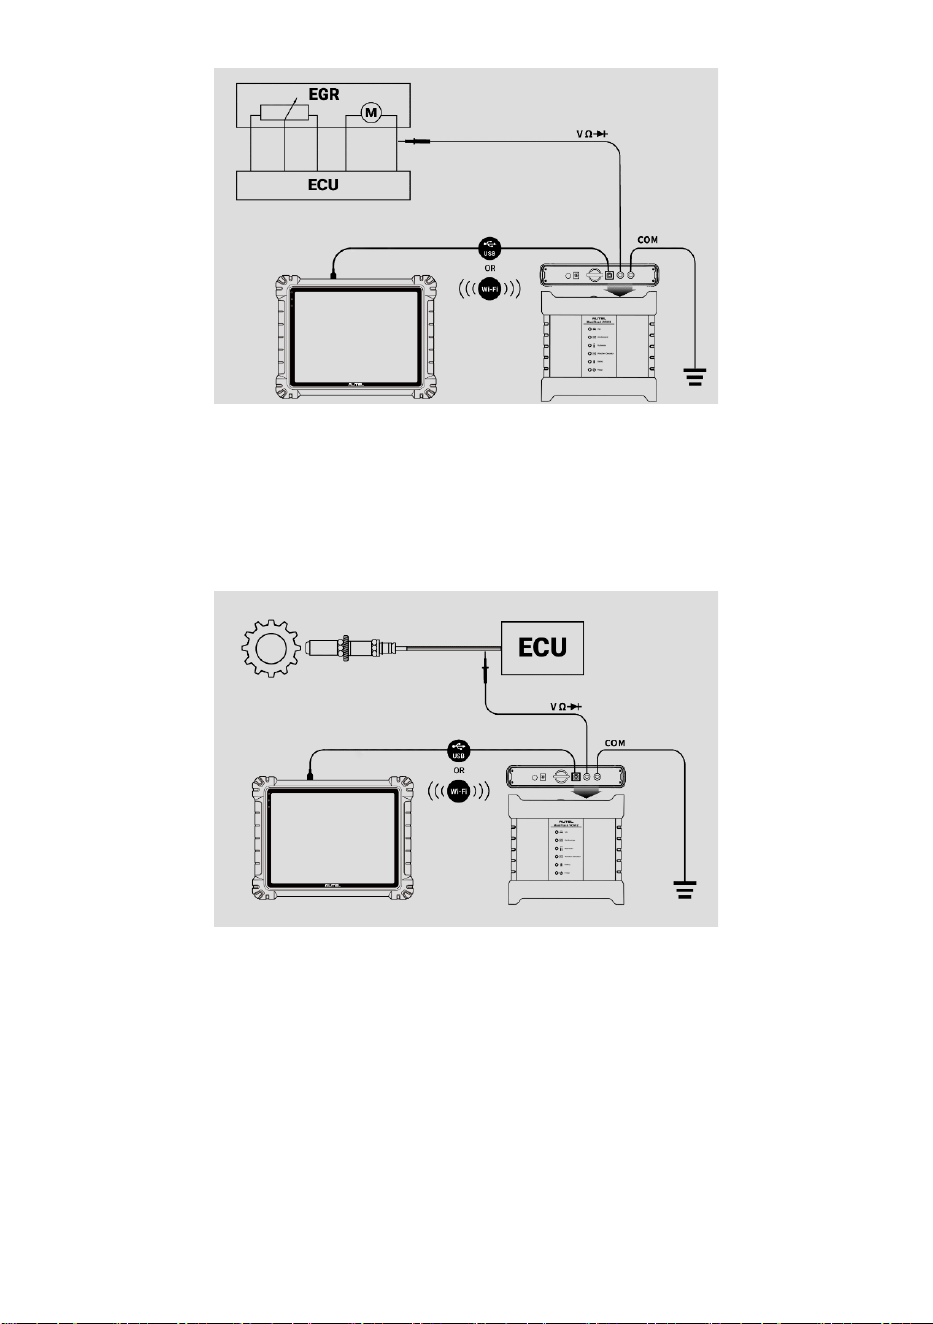
184
Figure 9-93 Actuator Drive Connection Diagram
Square Wave
Once the voltage and frequency are set in the waveform generator interface,
the square wave signals simulate the signals of various Hall sensors.
Figure 9-94 Square Wave Connection Diagram
Square Wave (X+Y)
This function is mainly used to simulate the missing tooth signals of Hall-type
crankshafts and camshafts. The X value represents the normal tooth signal and
the Y represents the missing tooth signal. The default setting is 58+2, which can
be adjusted as needed.
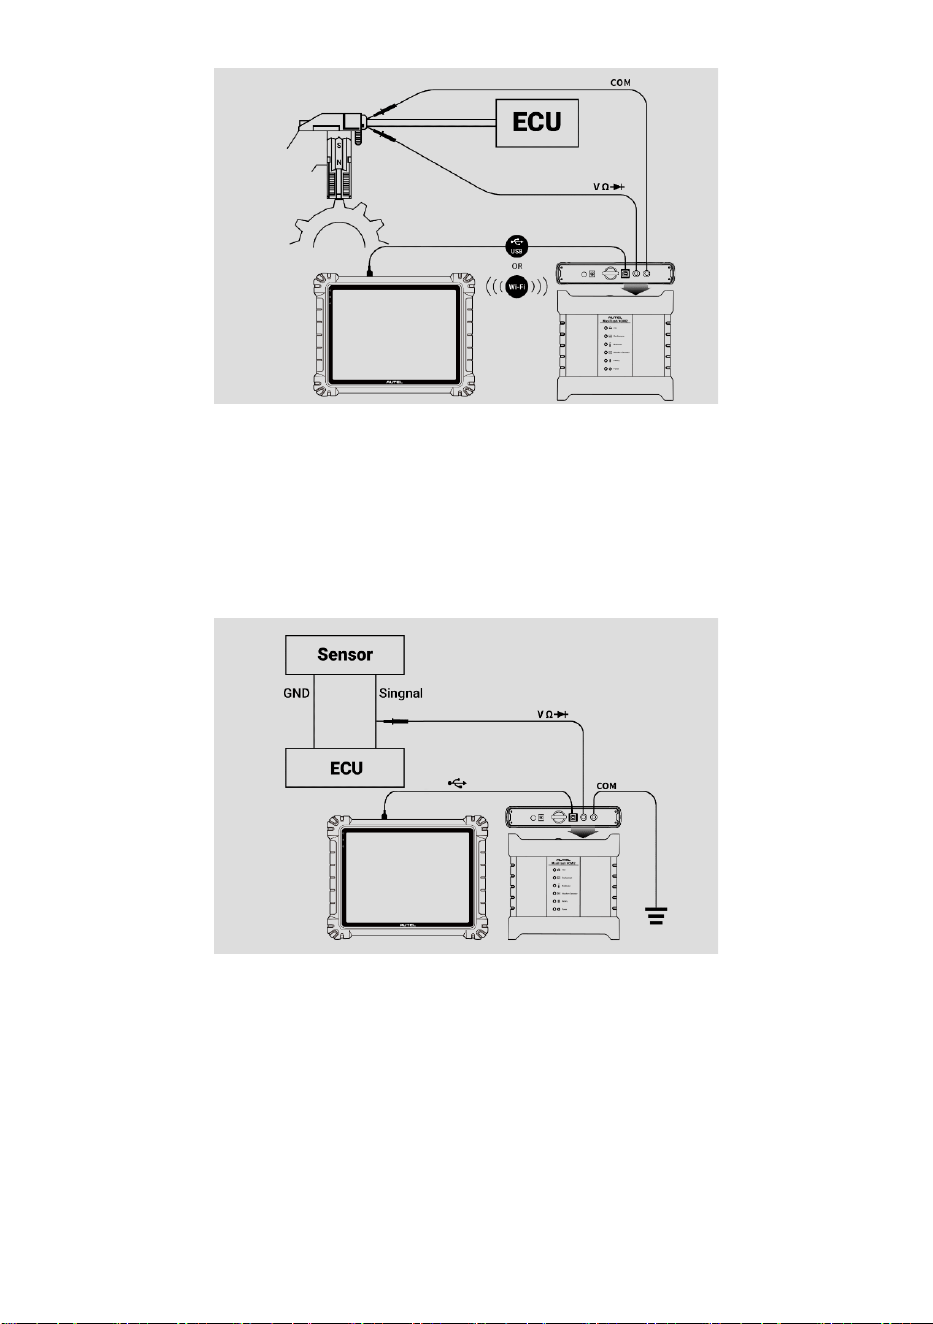
185
Figure 9-95 Square Wave (X+Y) Connection Diagram
Triangle Waveform
This is a symmetrical triangular waveform, which is mainly used to simulate the
triangle wave signals. The amplitude and frequency can be configured in this
waveform.
Figure 9-96 Triangle Waveform Connection Diagram
Arbitrary Waveform
Any type of the mentioned waveforms can be loaded again after the waveform
and parameter settings are saved.
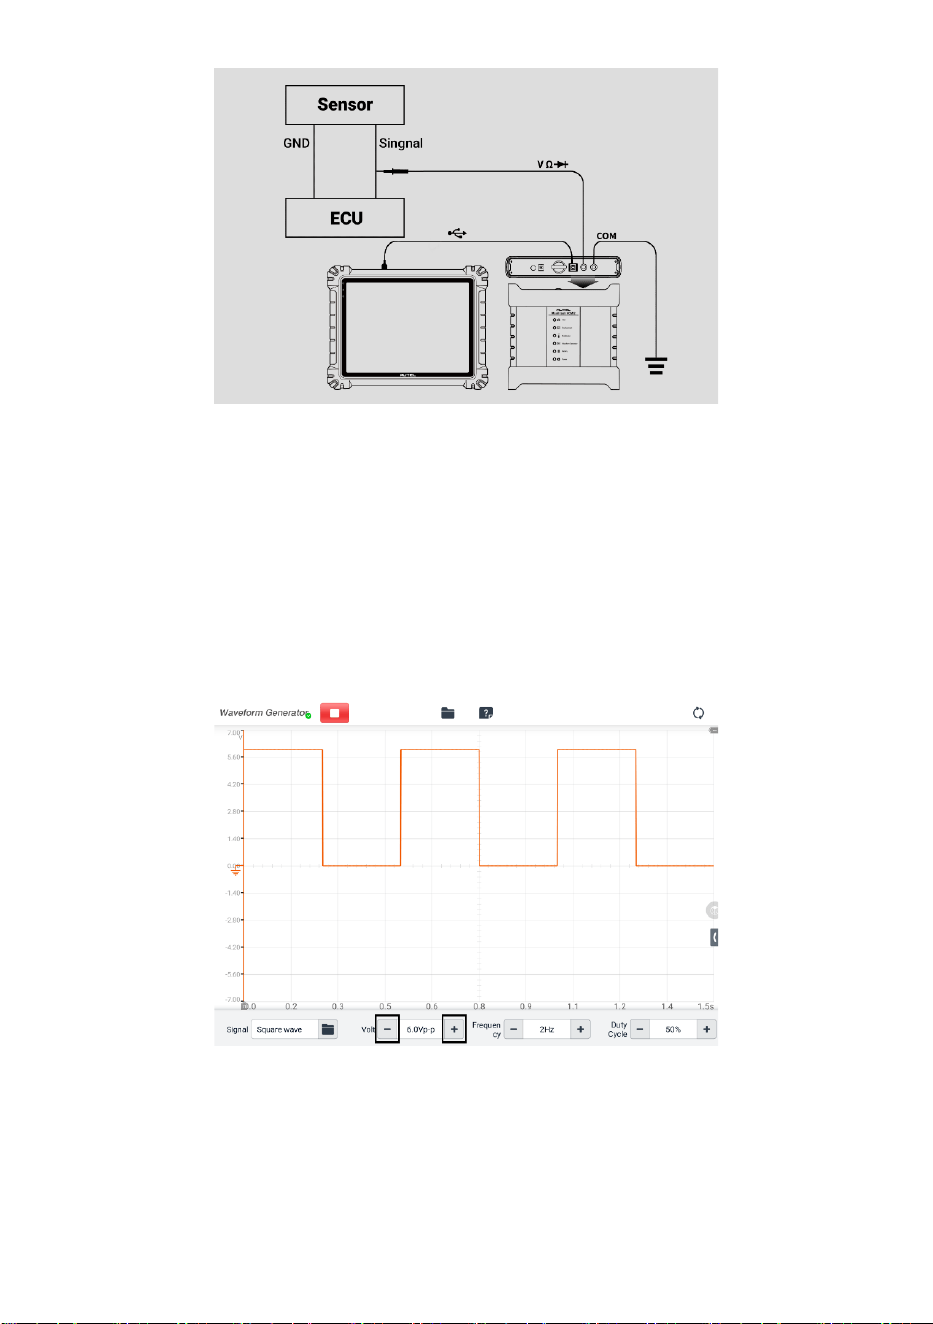
186
Figure 9-97 Arbitrary Waveform Connection Diagram
⚫ Voltage Setting
After you select the waveform mode, you can also set the amplitude value for that
mode.
There are three methods to adjust the voltage value:
Method 1: Tap the "+" and "-" buttons at the bottom of the screen in the Voltage
Setting.
Figure 9-98 Voltage Setting Screen 1
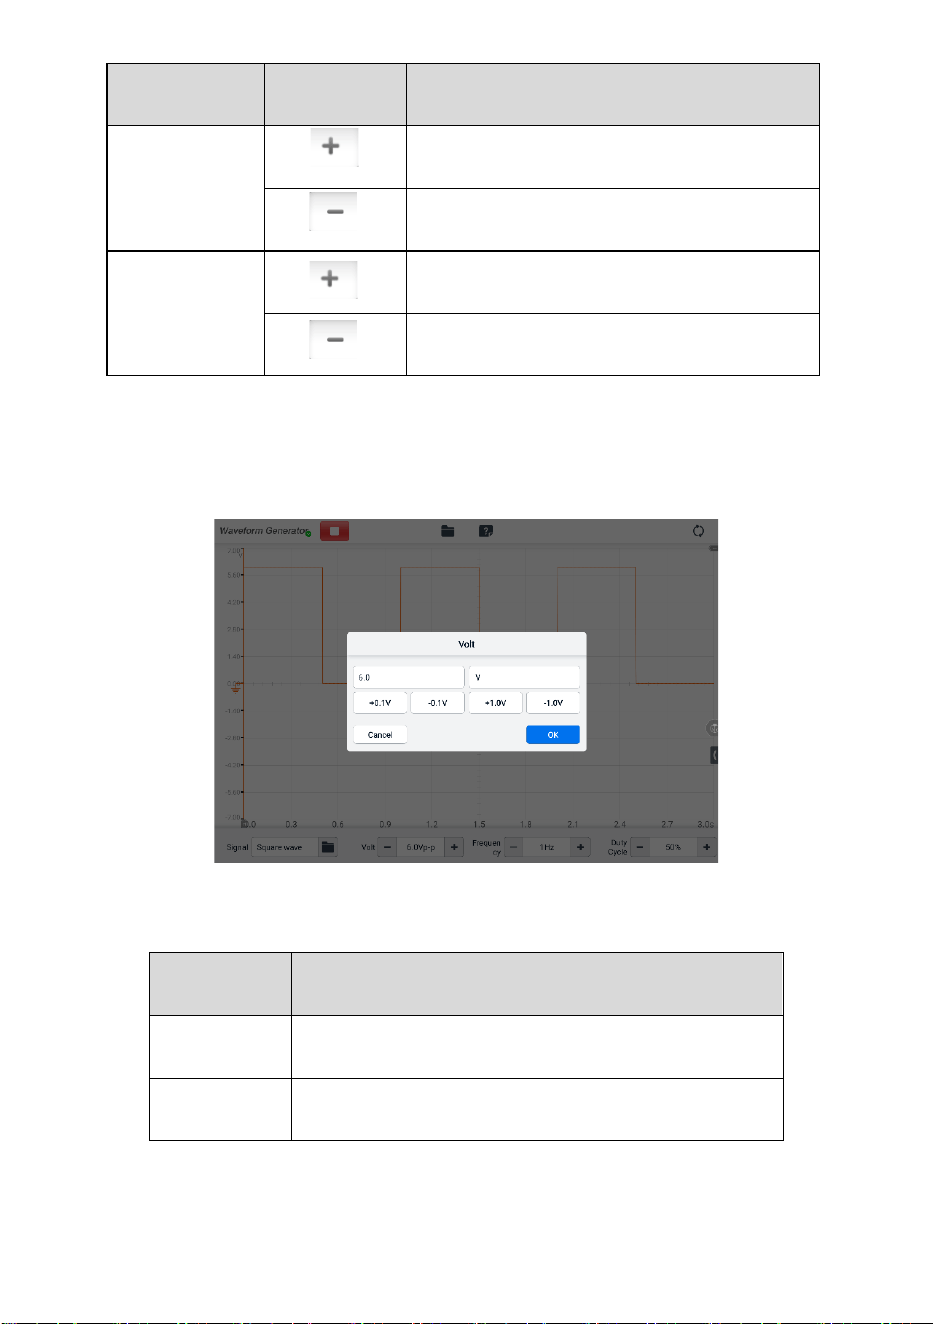
187
Range
Button
Description
0.1V to 0.9 V
Raises the voltage by 0.1 V
Lowers the voltage by 0.1 V
1V to 12 V
Raises the voltage by 1 V
Lowers the voltage by 1 V
Method 2: Tap the Voltage Setting button at the bottom of the screen to open a
dialog box. Adjust the voltage value by tapping the positive or negative value at
the bottom of the dialog box. Then tap OK to confirm or tap Cancel to exit without
saving.
Figure 9-99 Voltage Setting Screen 2
Value
Description
+0.1 V
Raises the voltage by 0.1 V
-0.1 V
Lowers the voltage by 0.1 V
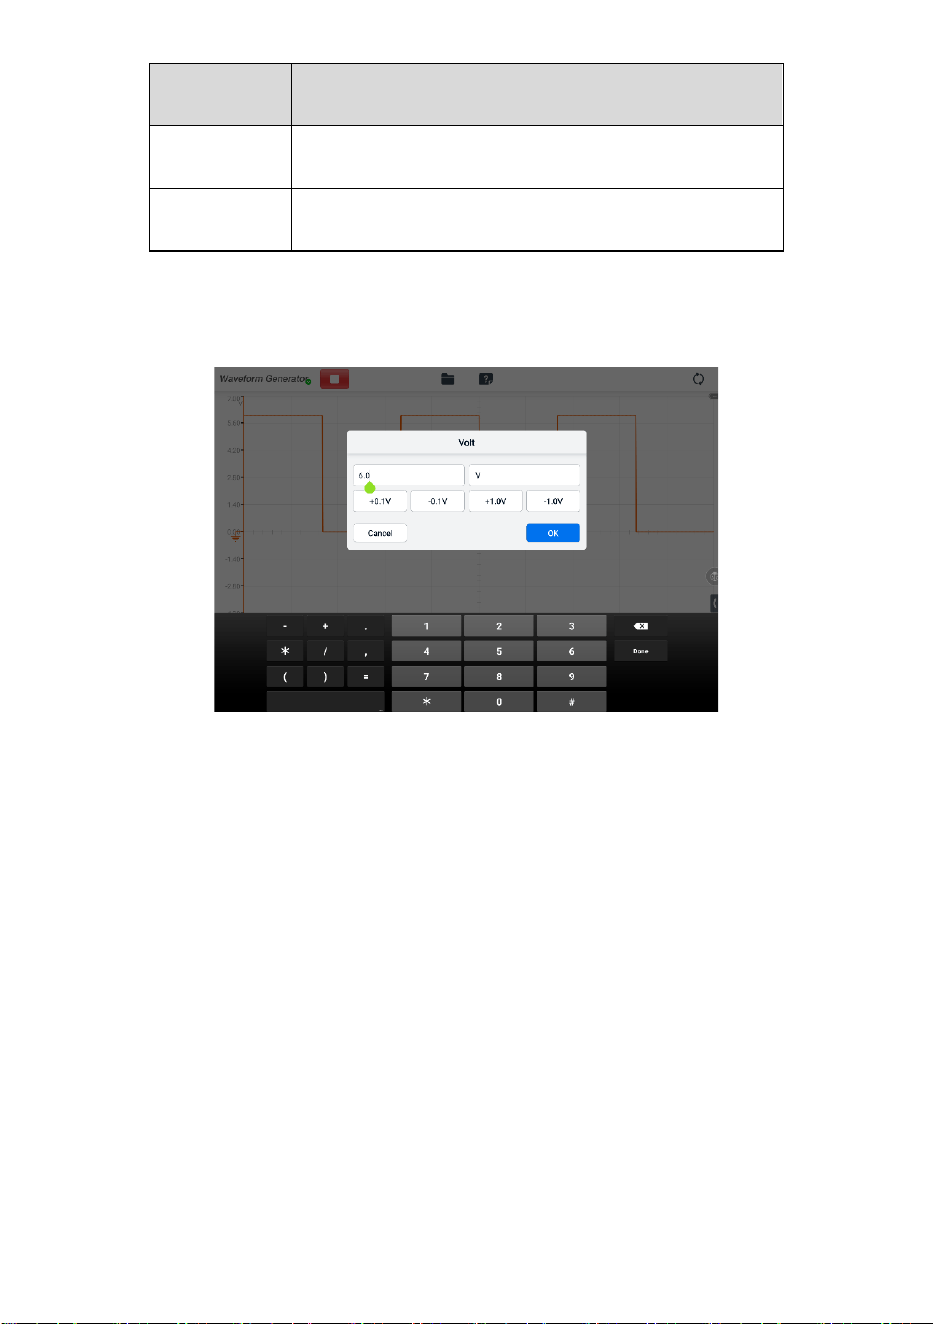
188
Value
Description
+1.0 V
Raises the voltage by 1 V
-1.0 V
Lowers the voltage by 1 V
Method 3: Input the voltage value using the virtual keyboard. Tap the voltage field
to clear the current value and input the new value. Tap OK to confirm or tap Cancel
to exit without saving.
Figure 9-100 Voltage Setting Screen 3
⚫ Frequency Setting
When the waveform mode is selected and the waveform generator is operating, you
can also set the frequency value for that mode.
There are also three methods to adjust the frequency value:
Method 1: Tap the “+” and “–” buttons at the bottom of the screen in the Frequency
Setting.
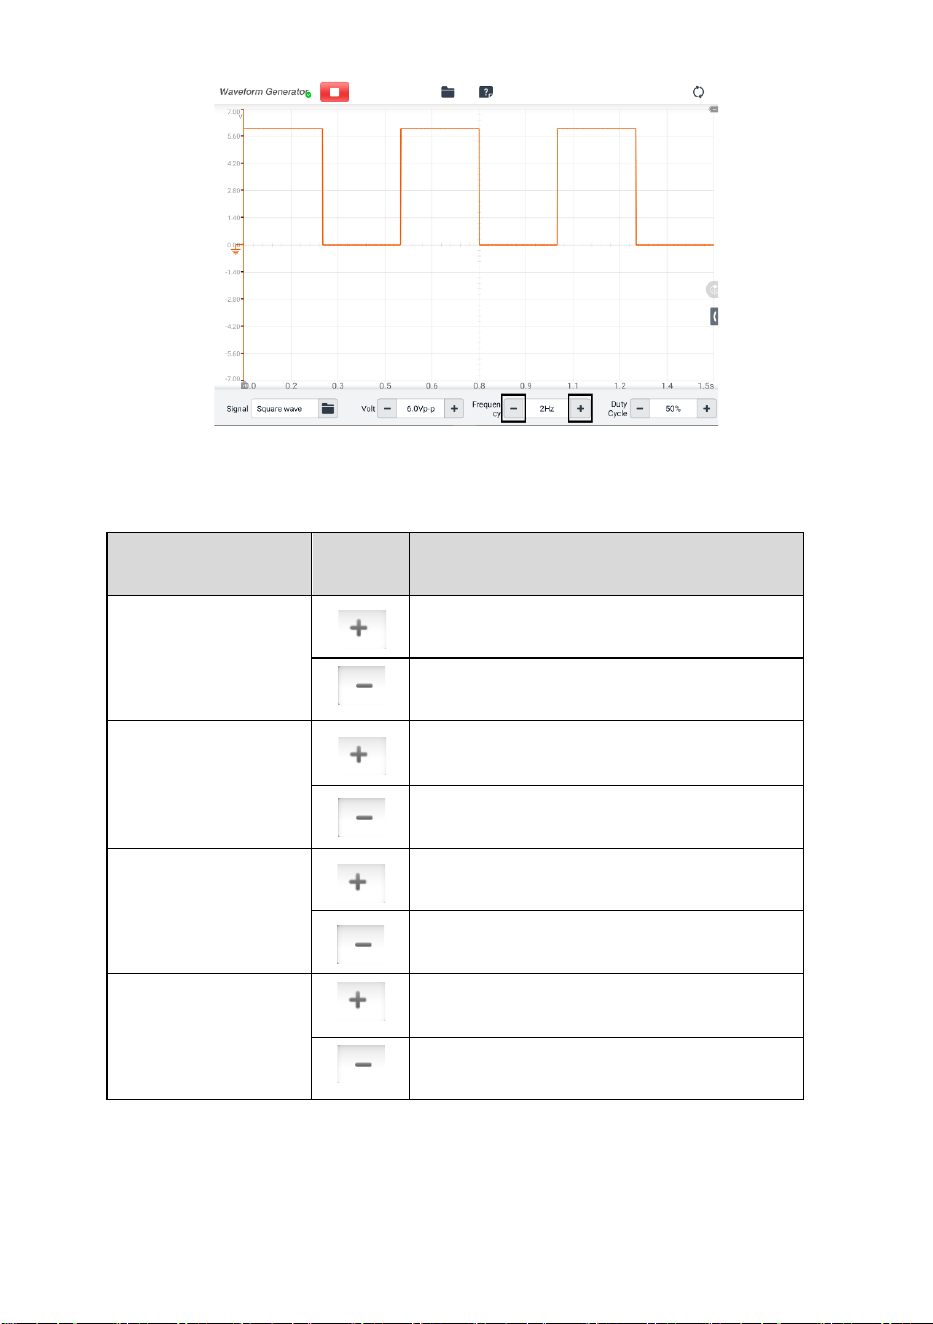
189
Figure 9-101 Frequency Setting Screen 1
Range
Button
Description
1 Hz to 10 Hz
Raises the frequency by 1 Hz
Lowers the frequency by 1 Hz
10 Hz to 100 Hz
Raises the frequency by 10 Hz
Lowers the frequency by 10 Hz
100 Hz to 1000 Hz
Raises the frequency by 100 Hz
Lowers the frequency by 100 Hz
1.0 KHz to 30.0 KHz
Raises the frequency by 1 KHz
Lowers the frequency by 1 KHz
Method 2: Tap the Frequency Setting button at the bottom of the screen to open a
dialog box. Adjust the frequency value by tapping the positive or negative value at
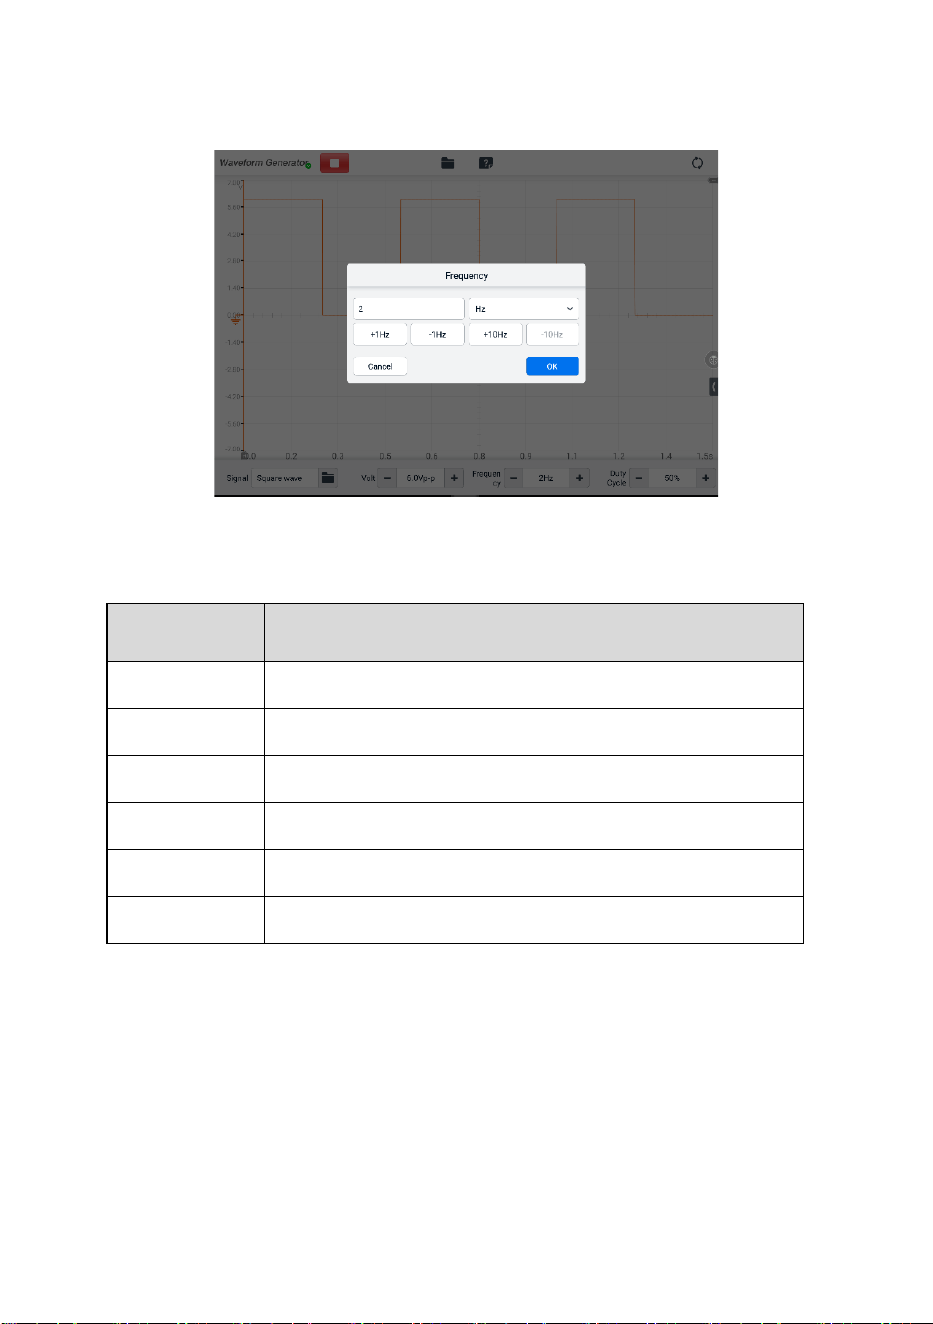
190
the bottom of the dialog box. The unit of the frequency can be switched Hz to KHz.
Tap OK to confirm or tap Cancel to exit without saving.
Figure 9-102 Frequency Setting Screen 2
Value
Description
+1.0 Hz
Raises the frequency by 1Hz
-1.0 Hz
Lowers the frequency by 1Hz
+10.0 Hz
Raises the frequency by 10Hz
-10.0 Hz
Lowers the frequency by 10Hz
+1.0 KHz
Raises the frequency by 1KHz
-1.0 KHz
Lowers the frequency by 1KHz
Method 3: Input the frequency value using the virtual keyboard. Tap the frequency
field to clear the current value and input the new value. Tap OK to confirm or tap
Cancel to exit without saving.
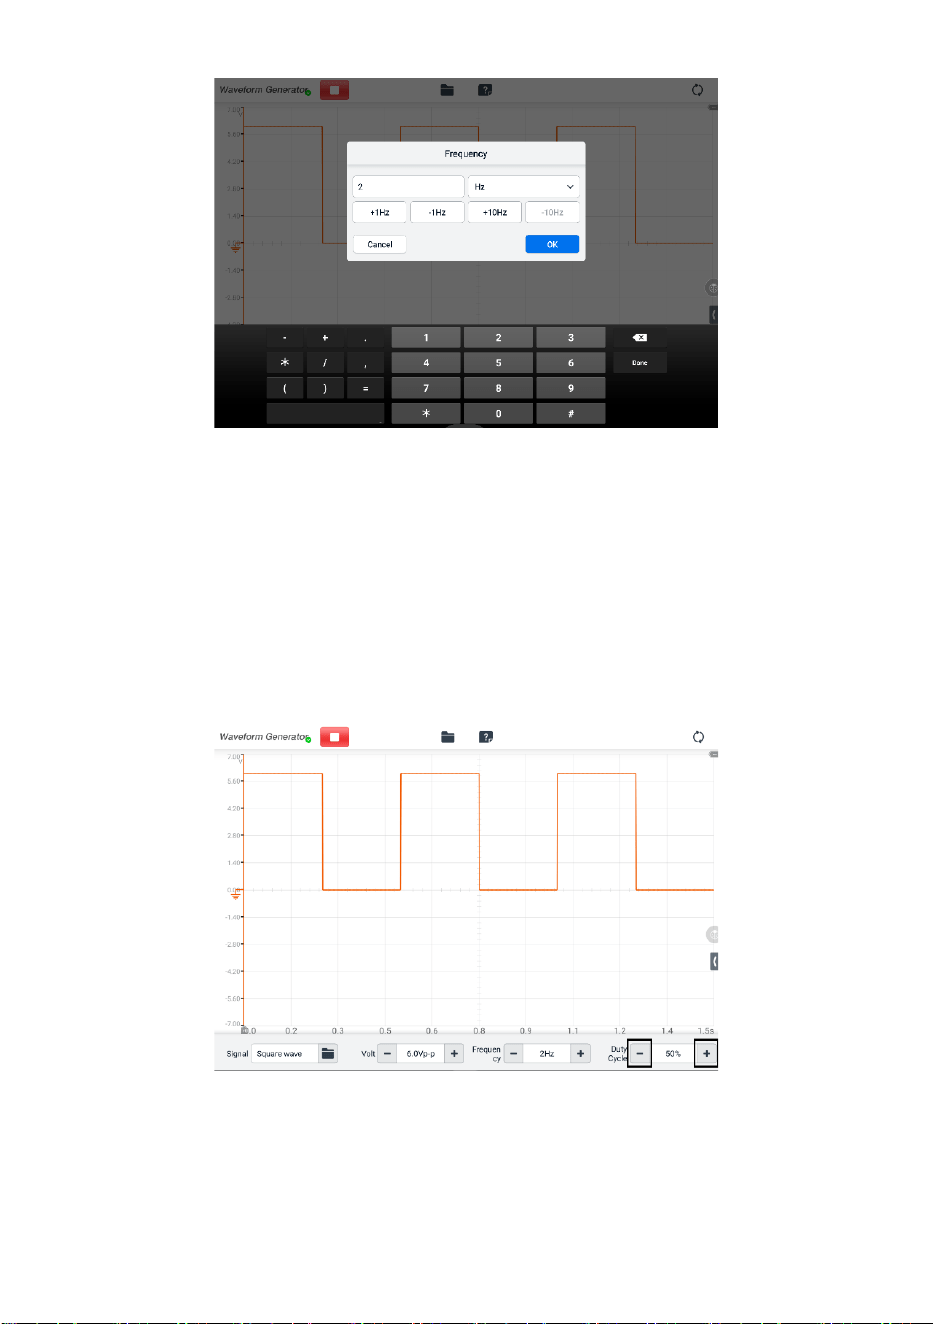
191
Figure 9-103 Frequency Setting Screen 3
⚫ Duty Cycle Setting
When the waveform mode is set, you can also set the duty cycle ratio for that mode.
There are three methods to adjust the duty cycle ratio:
Method 1: Tap the “+” and “–” buttons at the bottom of the screen in the Duty Cycle
Setting.
Figure 9-104 Duty Cycle Setting Screen 1
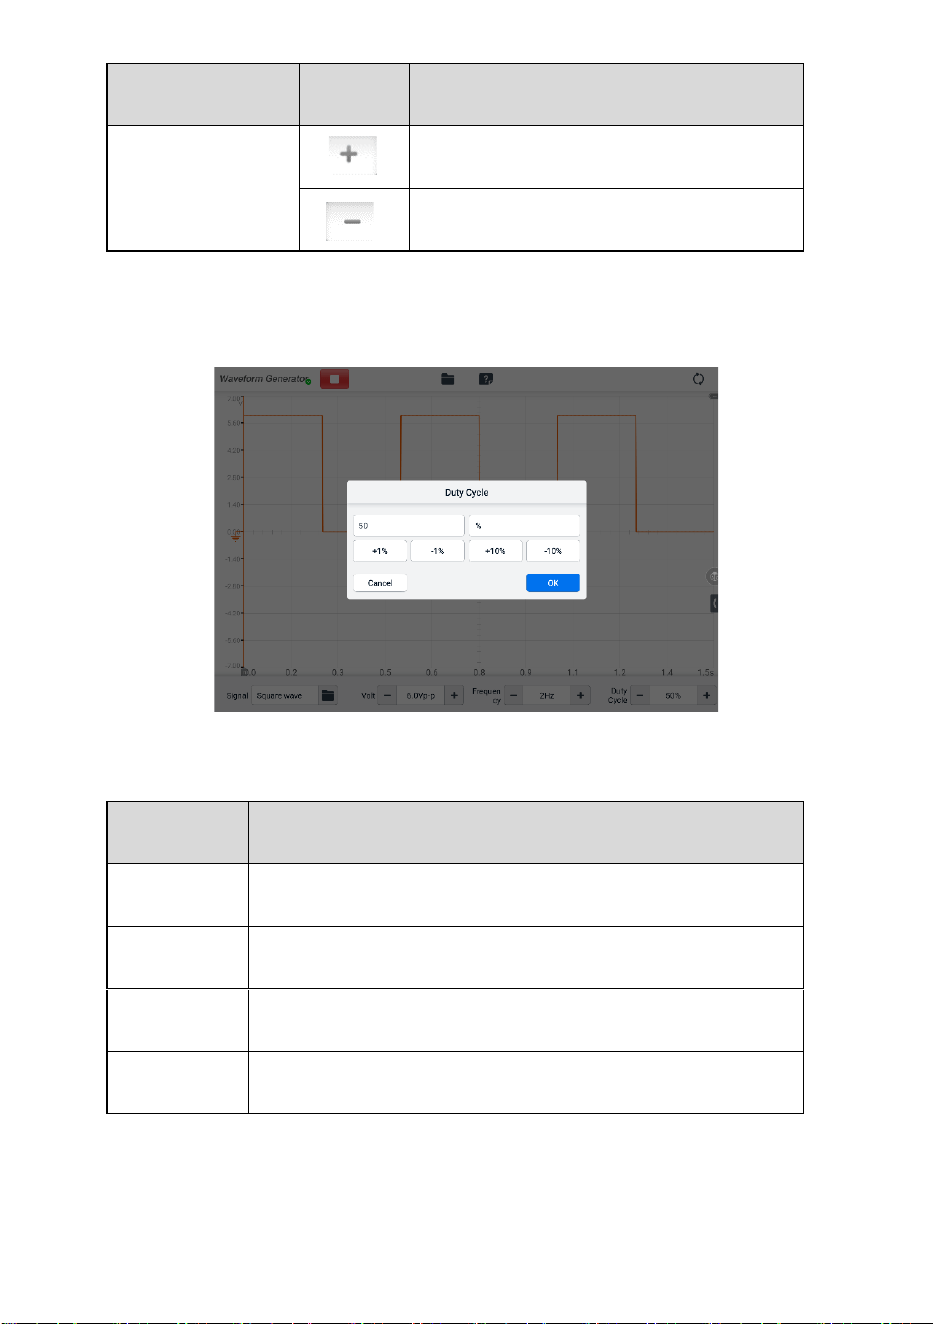
192
Range
Button
Description
1% to 99%
Raises the duty cycle ratio by 1%
Lowers the duty cycle ratio by 1%
Method 2: Tap the Duty Cycle Setting button at the bottom of the screen to open
a dialog box. Adjust the duty cycle by tapping the positive or negative ratio at the
bottom of the dialog box. Tap OK to confirm or tap Cancel to exit without saving.
Figure 9-105 Duty Cycle Setting Screen 2
Value
Description
+1.0%
Raises the duty cycle ratio by 1.0%
-1.0%
Lowers the duty cycle ratio by 1.0%
+10.0%
Raises the duty cycle ratio by 10%
-10.0%
Lowers the duty cycle ratio by 10%
Method 3: Input the duty cycle ratio using the virtual keyboard. Tap the duty cycle
field to clear the current value and input the new value. Tap OK to confirm or tap
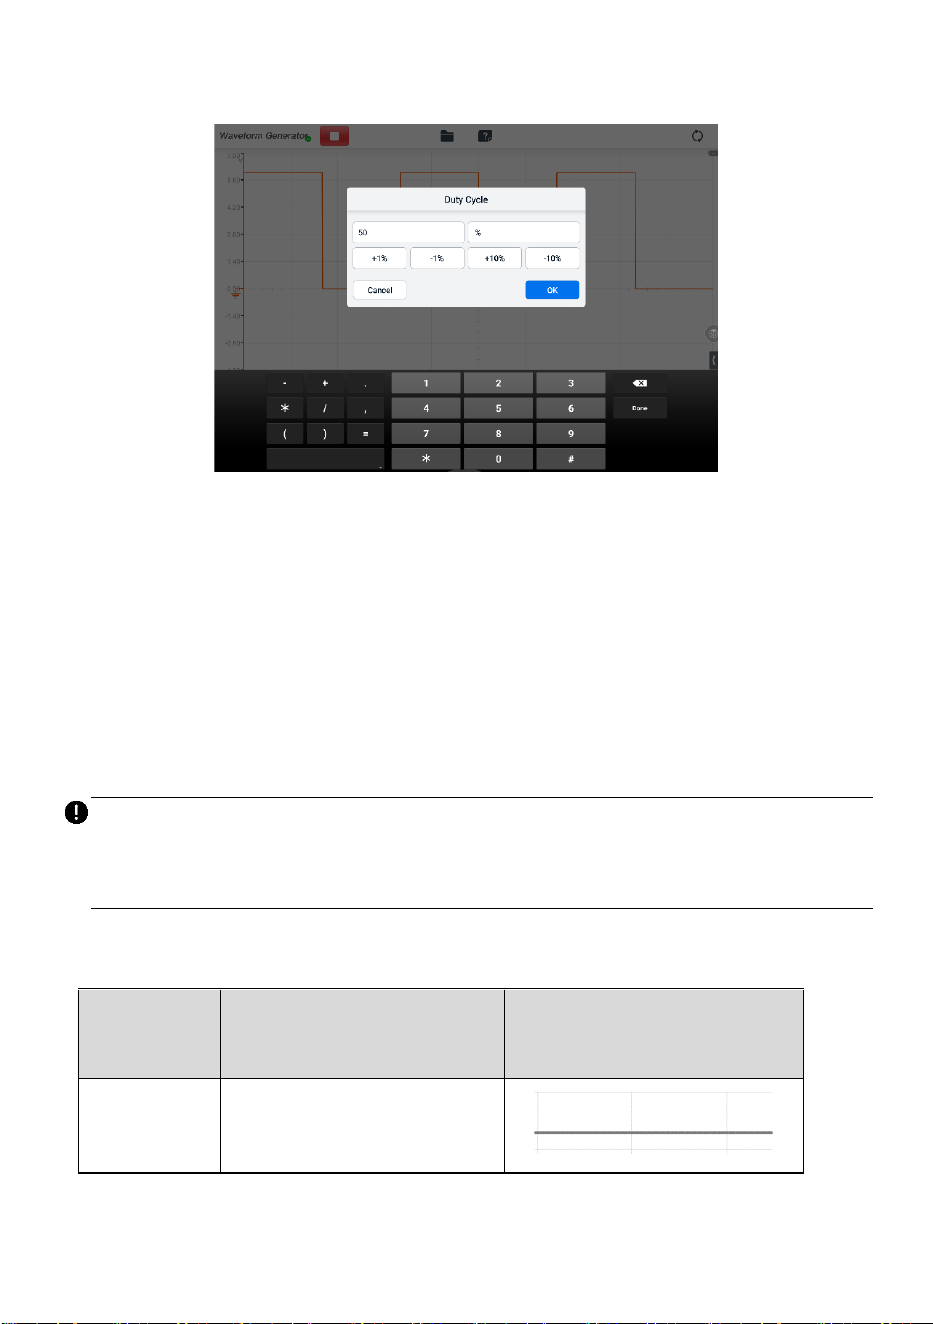
193
Cancel to exit without saving.
Figure 9-106 Duty Cycle Setting Screen 3
9.3.6 Troubleshooting
If the waveform generator cannot communicate with the tablet:
⚫ Check if the VCMI2 is properly connected to the tablet through the supplied USB
cable.
⚫ If the communication between the VCMI2 and the tablet still fails, restart the tablet
and reconnect the VCMI2.
IMPORTANT
To avoid damaging the vehicle and the equipment, all vehicle communications must be
terminated before resetting the connection. The Internet connection may be aborted
during resetting.
9.3.7 Glossary
Waveform
Type
Description
Sample Waveform
DC Voltage
A waveform with constant
voltage

194
Waveform
Type
Description
Sample Waveform
Square
Wave
The voltage waveform is a
rectangular periodic signal
Square
Wave (X+Y)
A waveform signal of
automobile crankshaft
Triangle
Wave
Periodic signal with triangular
voltage waveform
9.4 Bus Inspection
Bus Inspection is an instrument that detects the communication status of CAN Bus. When
the VCMI2 (Vehicle Communication and Measurement Interface 2) device is connected
with the MaxiSys tablet, you can open the Bus Inspection application by taping the
Measurement icon on the Home screen of the tablet and then tapping the OBD icon,
and perform the OBD-related functions including the signal detection. The indicator light
flashes if the signals are detected. The indicator light displays in gray if no signal is
detected.
Generally, the vehicle's electronic control systems are designed to comply with the
specific communication protocols. The control units in the electronic control systems
communicate with the Tablet through the OBDII (DLC) adapter.
With the Bus Inspection function, you can check whether the control units in vehicle's
electronic control systems work properly or not with the indicator light according to the
condition of sending out the communication signals.

195
9.4.1 Safety Information
Follow the instructions below to ensure proper CAN Bus check performance.
⚫ Different preconditions for different functions. Before checking, please read the
inspection guides carefully.
⚫ The pin number for OBDII varies by vehicle modes. Please check and confirm for
correct pin number and then proceed inspection.
⚫ Select OBDII connector's signal pins manually if the test vehicle's actual
communication signal pins are assigned differently.
⚫ Ensure the DLC main cable is connected to the vehicle before inspection.
⚫ Ensure the ignition key is in ON position when testing the vehicle's communication
line.
⚫ If the inspection fails due to no signal input, consult vehicle circuit diagram to ensure
correct communications are being tested.
⚫ Do not use in wet or damp conditions, or around explosive gas or vapor.
⚫ Do not tamper with or disassemble the product, connectors or accessories. Internal
damage will affect performance.
⚫ Disconnect the product from power source, vehicle and tablet before cleaning.
⚫ When cleaning the product, use a damp, soft cloth with mild detergent. Do not allow
water to enter the product casing, as this will cause damage to the electronics inside.
9.4.2 General Introduction
9.4.2.1 Component Locations
The main connectors are located at the bottom of the VCMI2.
1. Ethernet Connector
2. Vehicle Data Connector
3. Input Channel A
4. Input Channel B
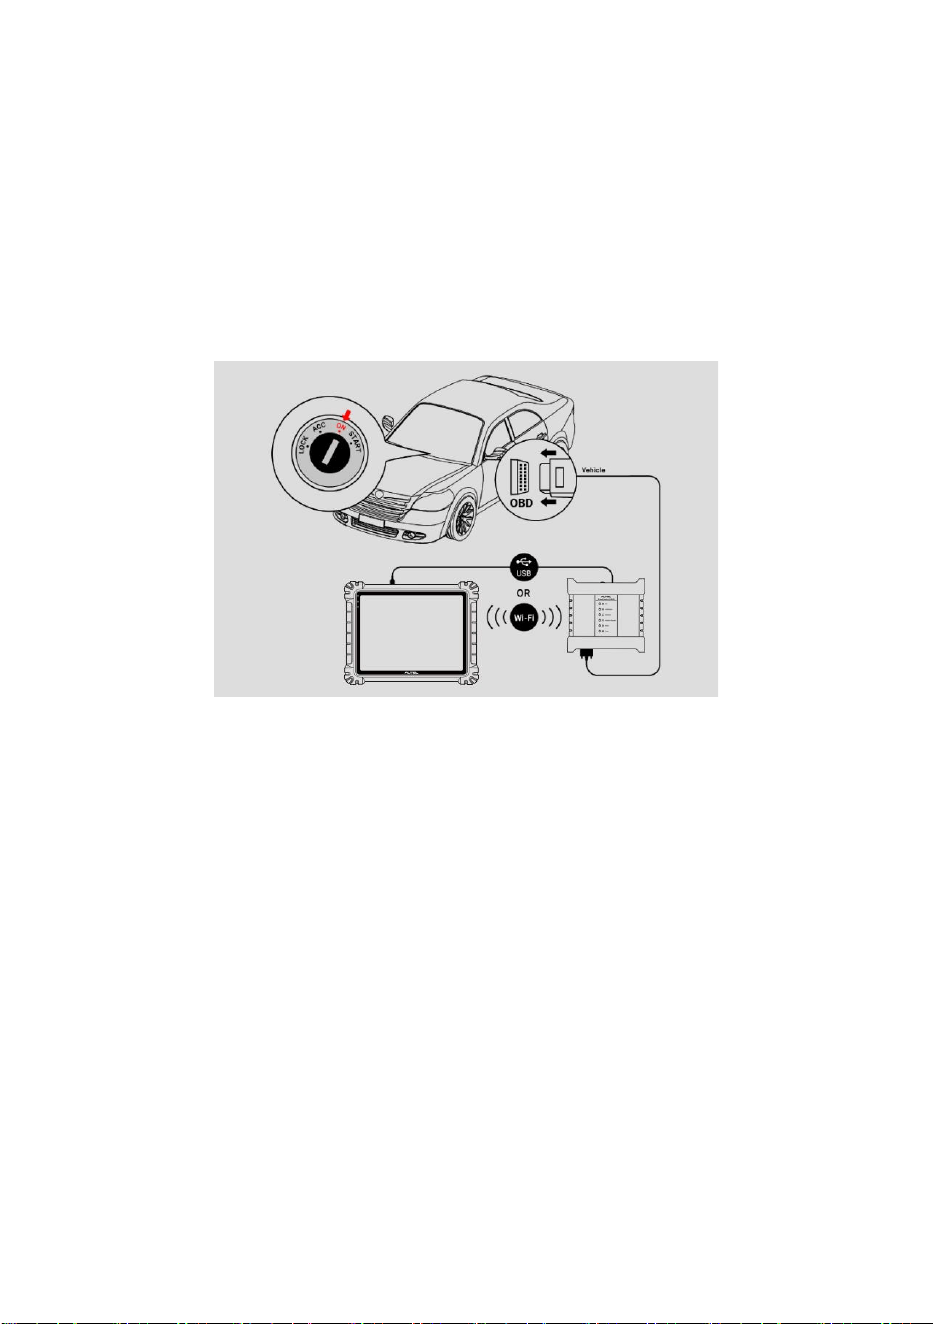
196
5. Input Channel C
6. Input Channel D
9.4.2.2 Getting Started
Before opening the OBDII CAN Bus Inspection application, you have to complete three
steps below:
1) Connect the VCMI2 to the tablet via Wi-Fi or the supplied USB cable.
2) Connect the VCMI2 to the vehicle's OBDII connector.
3) Place the ignition in the key on position.
Figure 9-107 Connection Diagram
➢ To open the Bus Inspection application
1. Please refer to Figure 9-107 Connection Diagram to complete the connection.
Place the ignition in the key on position.
2. Tap the Measurement icon on the Job Menu of the MaxiSys tablet. The
Measurement screen opens.
3. Tap the Bus Inspection icon to open the Bus Inspection Menu.
4. Select a communication protocol to test.
9.4.3 Bus Inspection
The operating software of the device is continually optimized. Tap the Help button in the
top toolbar and then tap the Update the APK button in the dropdown list to update the
software.
Before updating the device's software, please make sure the tablet has a stable Internet
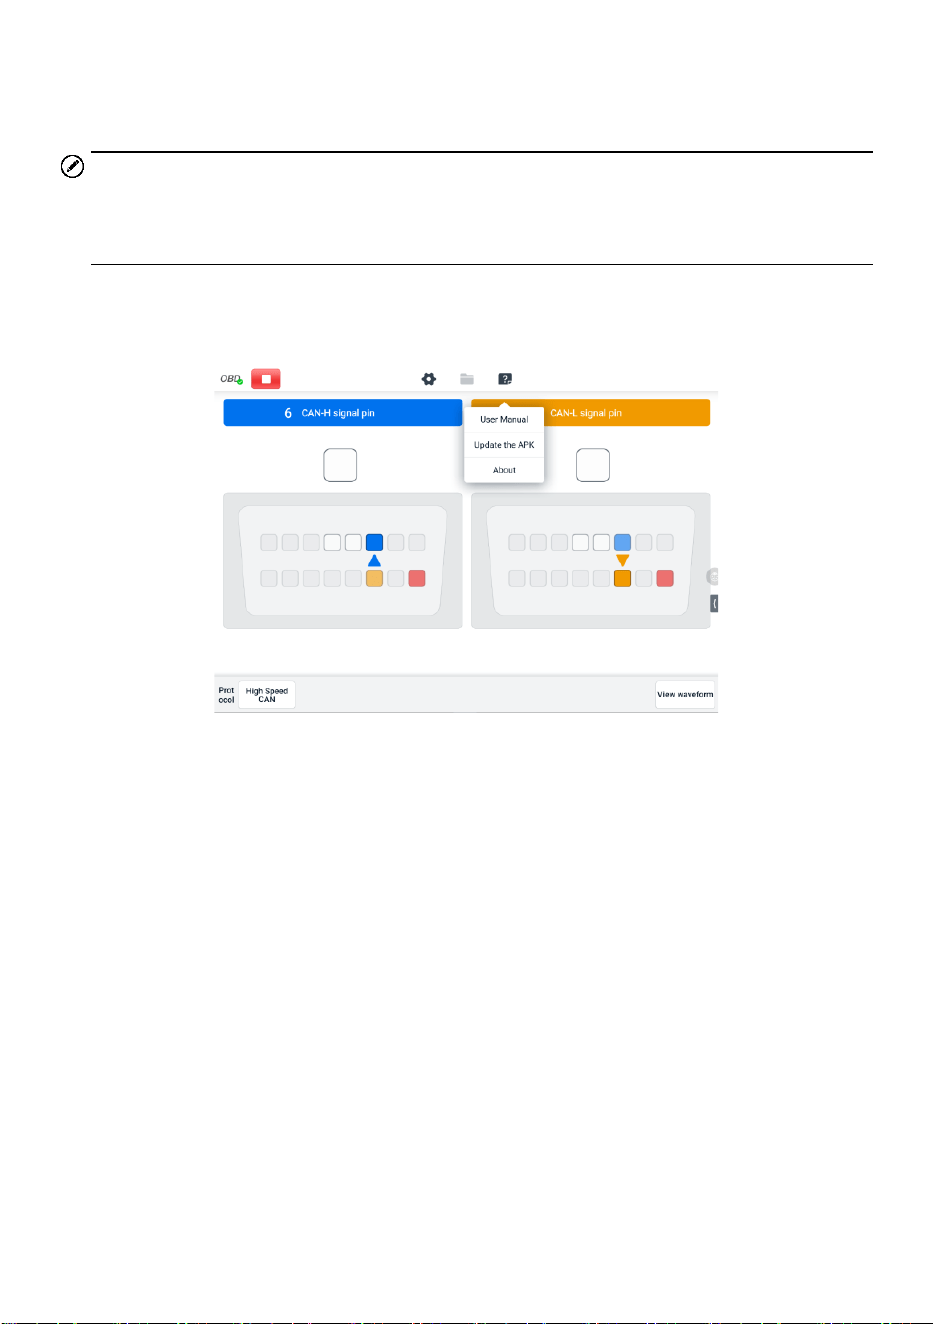
197
connection.
9.4.3.1 APK Update
NOTE
The acronym APK (Android Package Kit) is used on the tablet and in this manual. An
APK file contains all the assets of a particular app. Updating an APK means to install the
latest version of the app on your tablet.
➢ To update the APK
1. Tap the Help button on the upper half of the screen. A dropdown menu displays.
Figure 9-108 Help Screen
2. Tap Update the APK in the dropdown menu. A confirmation message will
display.
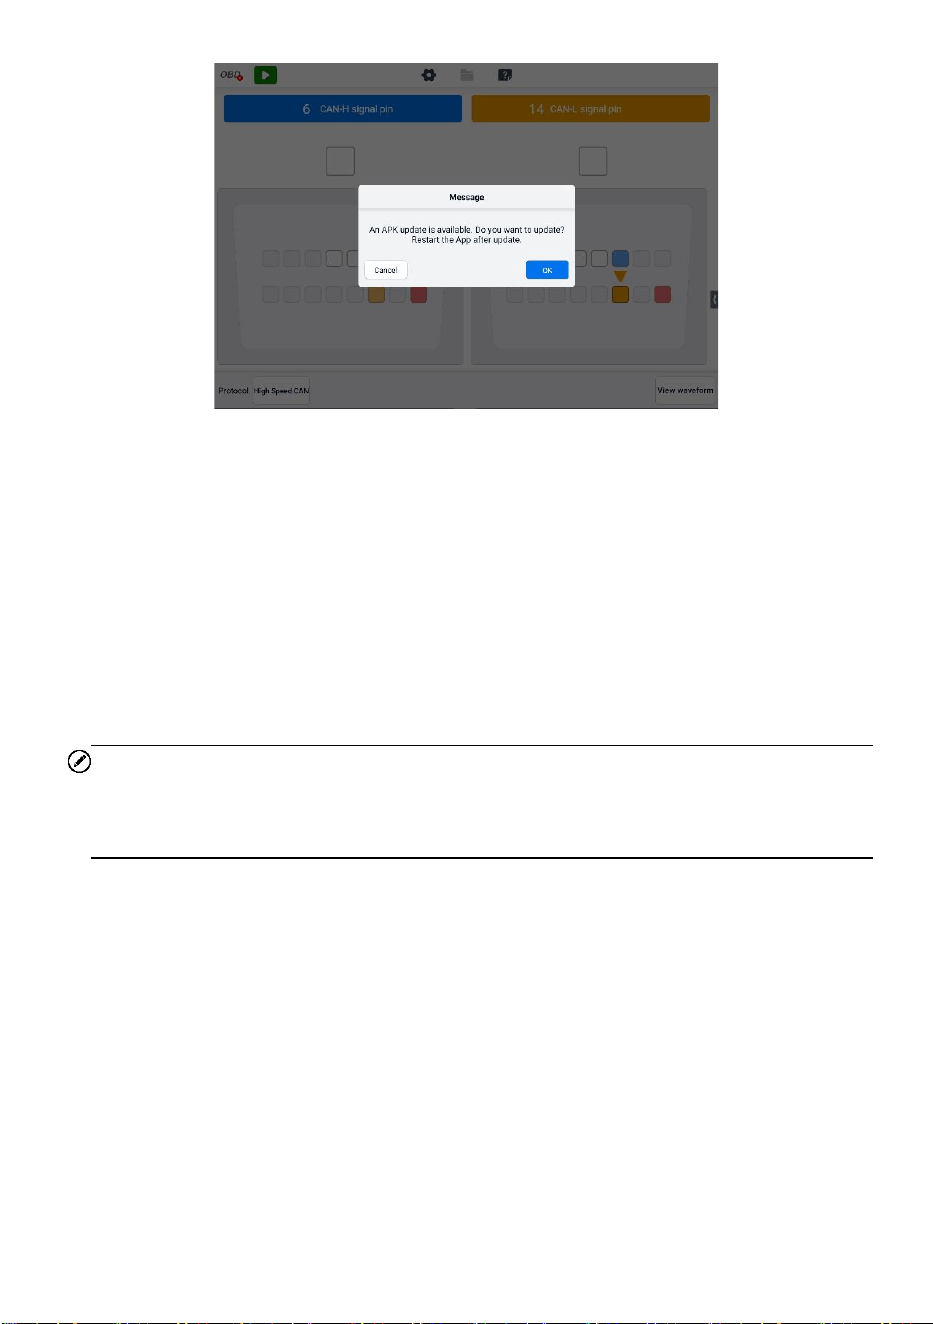
198
Figure 9-109 Update Confirmation Screen
3. Tap OK to update the software or tap Cancel to exit.
9.4.4 Screen Layout and Operations
The Bus Inspection application allows you to select the communication protocols, the
signal pins and voltage value for testing.
Tap the Measurement icon on the Job Menu and select Bus Inspection in the menu,
the Bus Inspection window displays. The screen typically includes the following button
sections.
NOTE
The Bus Inspection application can also be opened via the Android home screen. Tap
the Measurement icon at the top of the Android home screen. Tap the Bus Inspection
app icon.
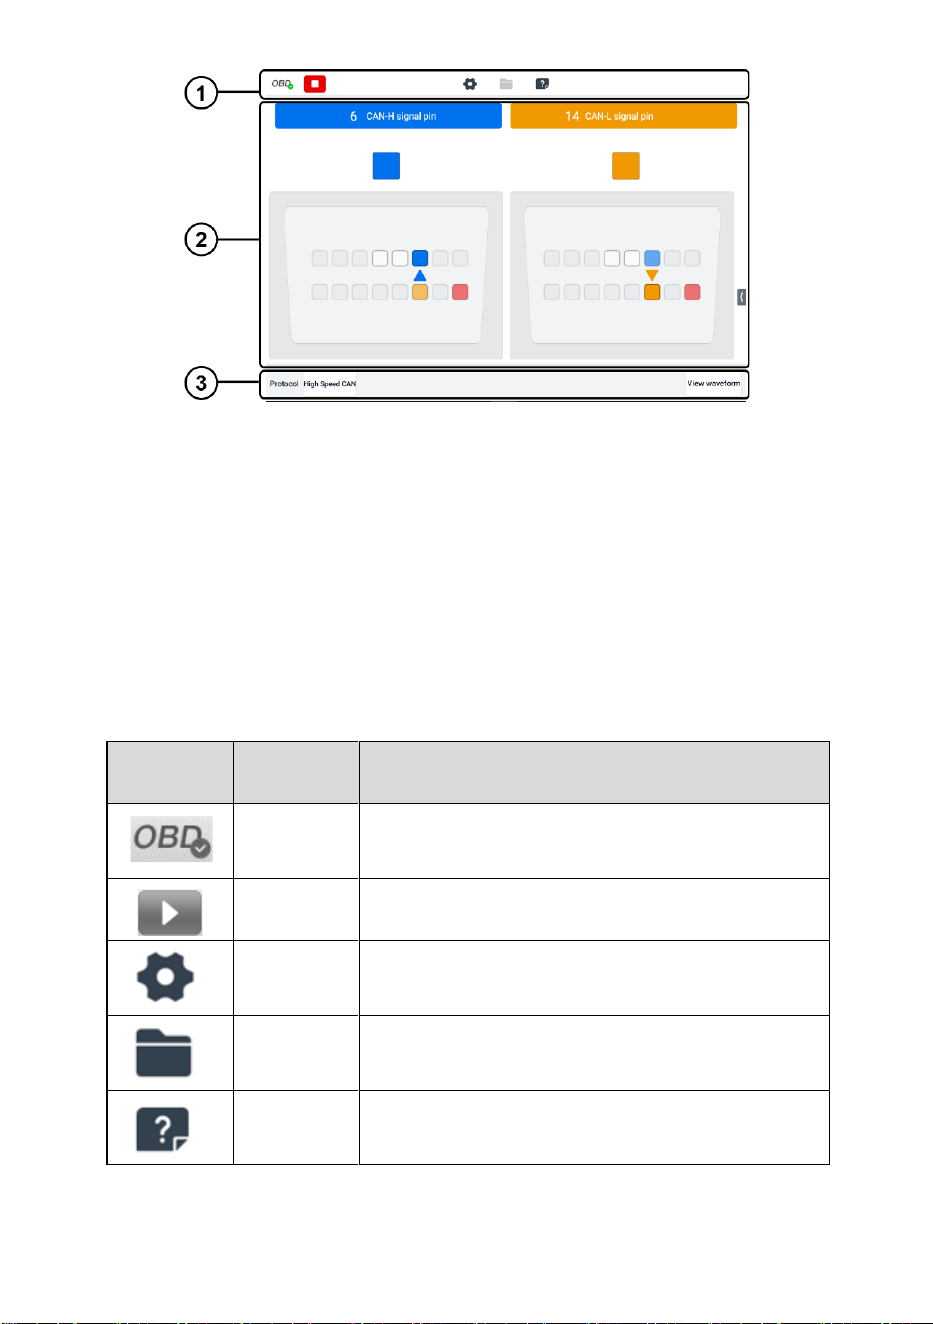
199
Figure 9-110 Bus Inspection Screen
1. Upper Toolbar
2. Main Section
3. Lower Toolbar
9.4.4.1 Upper Toolbar
The upper toolbar is used for configurations of various settings and operations. The
following table provides brief descriptions of each button.
Table 9-14 Upper Toolbar
Button
Name
Description
OBD Icon
Displays the device connection status.
Start/Stop
Starts or stops the device.
Settings
Sets the communication protocol pins manually.
File
Prints, opens and saves the waveform data.
Help
Views the user manual and update the software.
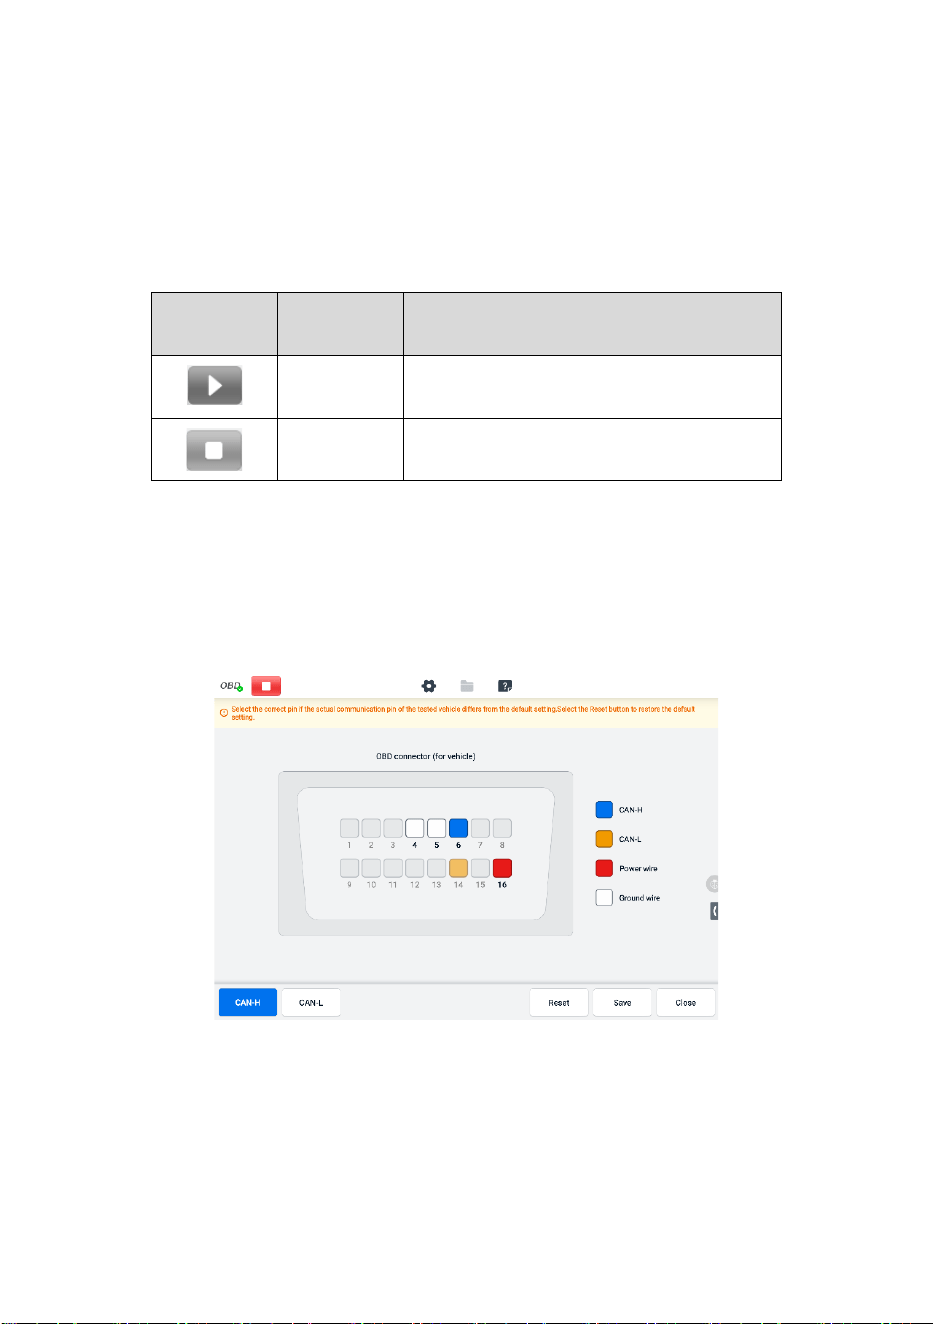
200
⚫ OBD Icon
This OBD button indicates the OBD device connection status. A green check mark
means the VCMI2 and the tablet are connected; a red “X” indicates no connection
has been established.
⚫ Start/Stop Button
You can tap the Start/Stop Button icon to start or stop the device.
Button
Name
Description
Start
Tap to start the device.
Stop
Tap to stop the device.
⚫ Settings Menu
Tap the gear-shaped icon in the top navigation bar to enter the Settings Menu.
The pin number for OBDII may be different for different vehicle modes. In Settings
Menu, you can select OBDII connector's signal pins manually if the test vehicle's
actual communication signal pins are assigned differently.
Figure 9-111 Settings Menu Screen 1
At the bottom of the settings menu screen, the Protocol, Reset, Save, and Close
buttons are displayed. The protocol varies according to the protocol you set.
Take CAN protocol as an example.
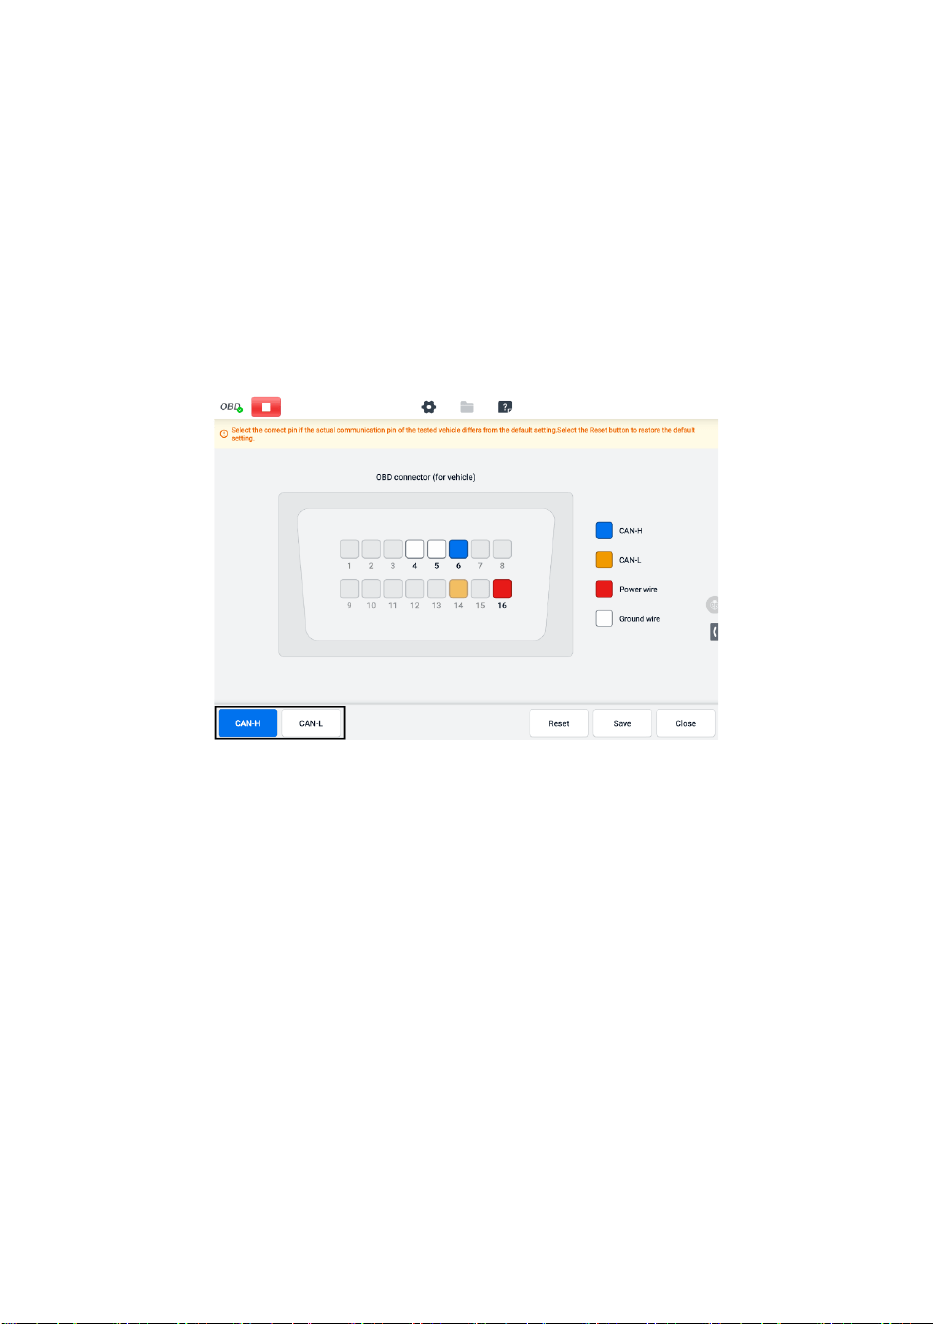
201
CAN-H: select the pin assigned for high-speed CAN-bus communication line
CAN-L: select the pin assigned for low-speed CAN-bus communication line
Reset: restore the default settings
Save: save the changes when custom pin assignment is set
Close: exit the settings menu screen
➢ To select the signal pins manually
1. Tap the gear-shaped icon in the upper toolbar to enter the Settings Menu.
2. Tap CAN-H or CAN-L to select the communication protocol pins.
Figure 9-112 Settings Menu Screen 2
3. Tap the correct pin number in the OBDII Connector Assignment image to match
the test vehicle's actual communication signal pins.
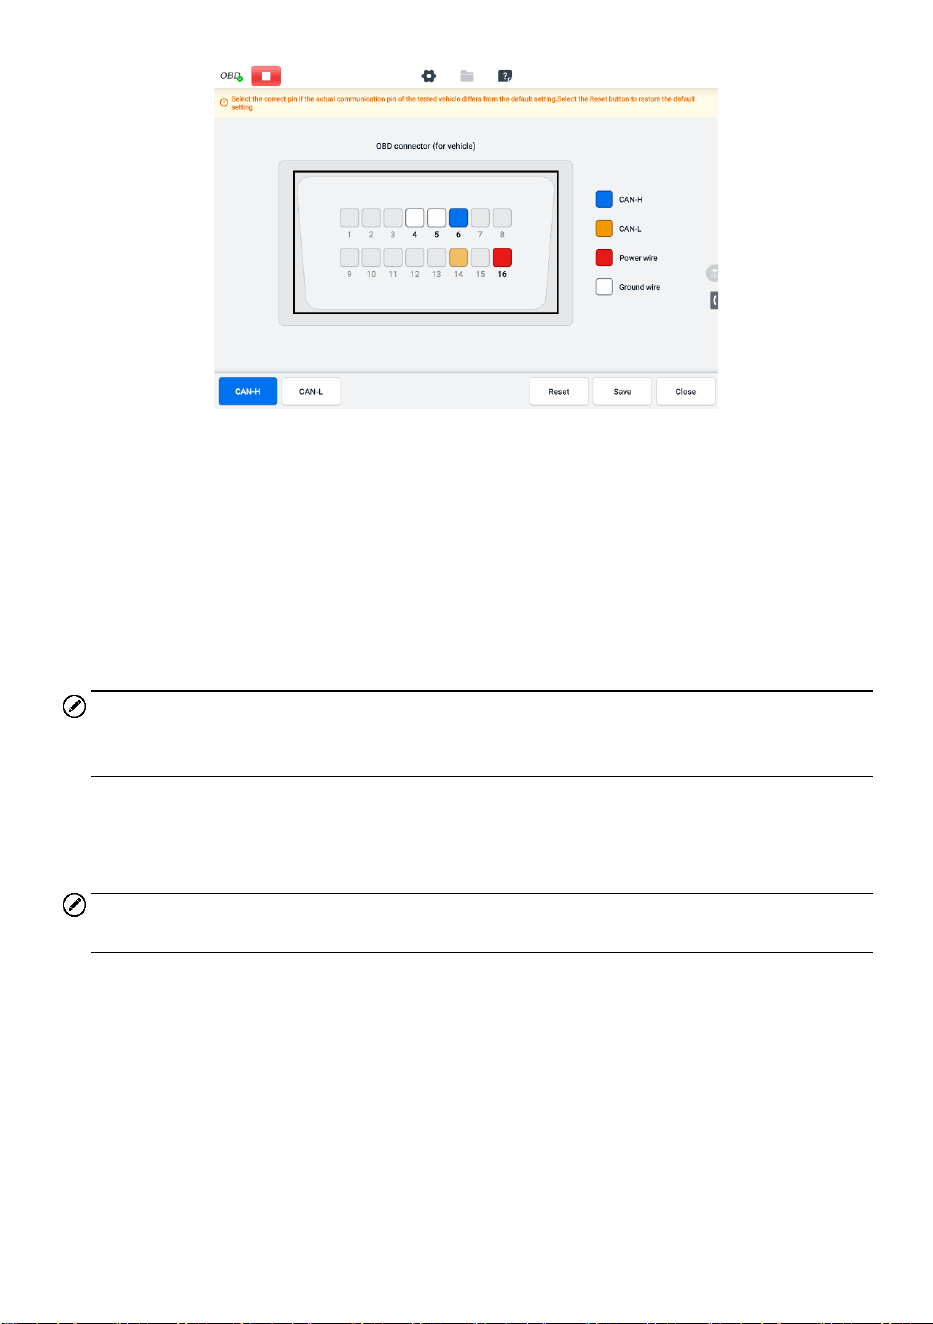
202
Figure 9-113 Settings Menu Screen 3
4. Tap Save to save changes or tap Close to exit.
⚫ File Menu
The File Menu allows you to print, open, and save the waveform data. The File
Menu is enabled in the Waveform Mode and supports the following functions.
✓ Print — tap to create and print a temporary PNG picture of the current
waveforms.
NOTE
Ensure the tablet is configured to print (see Printer setup instructions) and is connected
to the printer. Ensure the tablet and printer share the same network.
✓ Save Waveform — tap to capture and save the current waveforms. On the
Save File screen, tap each item to input the corresponding information and then
tap Save or Save Default to finish.
NOTE
A file name is required to save the waveform.
✓ Open Waveform — tap to retrieve the saved waveforms. To select and delete
the saved waveform, tap the Edit button in the upper right corner of the screen.
✓ Save as text — tap to save the current waveform data to a text file. Use the ES
File Explorer app on the Android home screen to review file: Home > ES File
Explorer > Local > Internal Storage > Scan > Data > OBD > txt.
⚫ Help Menu
The Help Menu allows you to view the user manual, update the software, and view
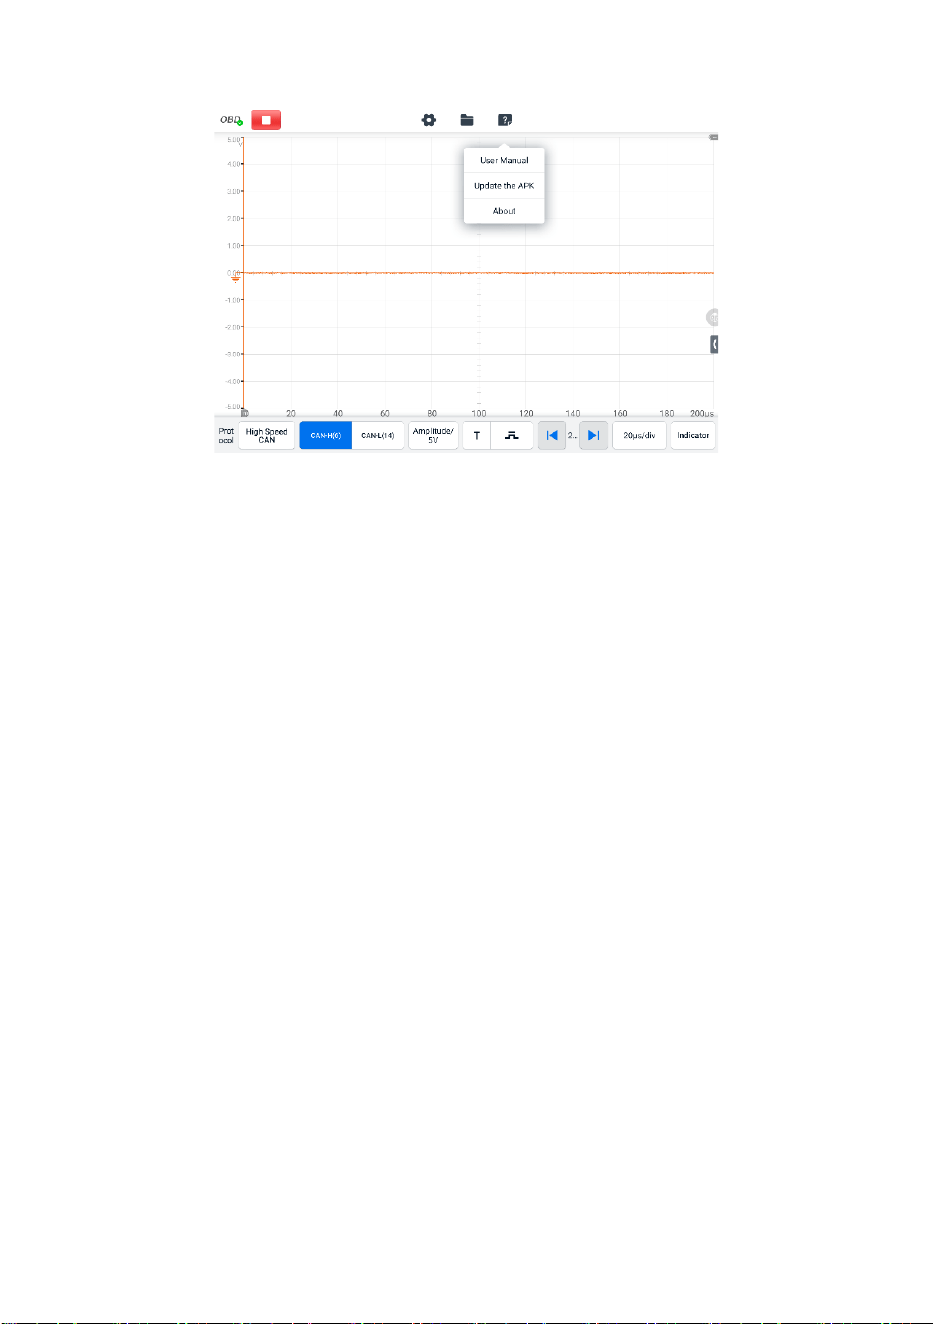
203
versions of the device.
Figure 9-114 Help Menu Screen
User Manual — displays instructions for the proper use of the OBDII CAN Bus
Check application and the MaxiSys tablet.
Update the APK — connects to the Autel server and get the latest application
software version.
About — displays the model number and the installed versions of the software.
9.4.4.2 Main Section and Lower Toolbar
Two modes are available in the OBD communication line inspection function: Indicator
Mode and Waveform Mode.
A. Indicator Mode
This mode is designed to show the condition of voltage fluctuation in vehicle's
communication lines. In this mode, the indicator light of a selected pin flashes when
the electronic control units are sending signals properly.
The Indicator Mode displays by default.
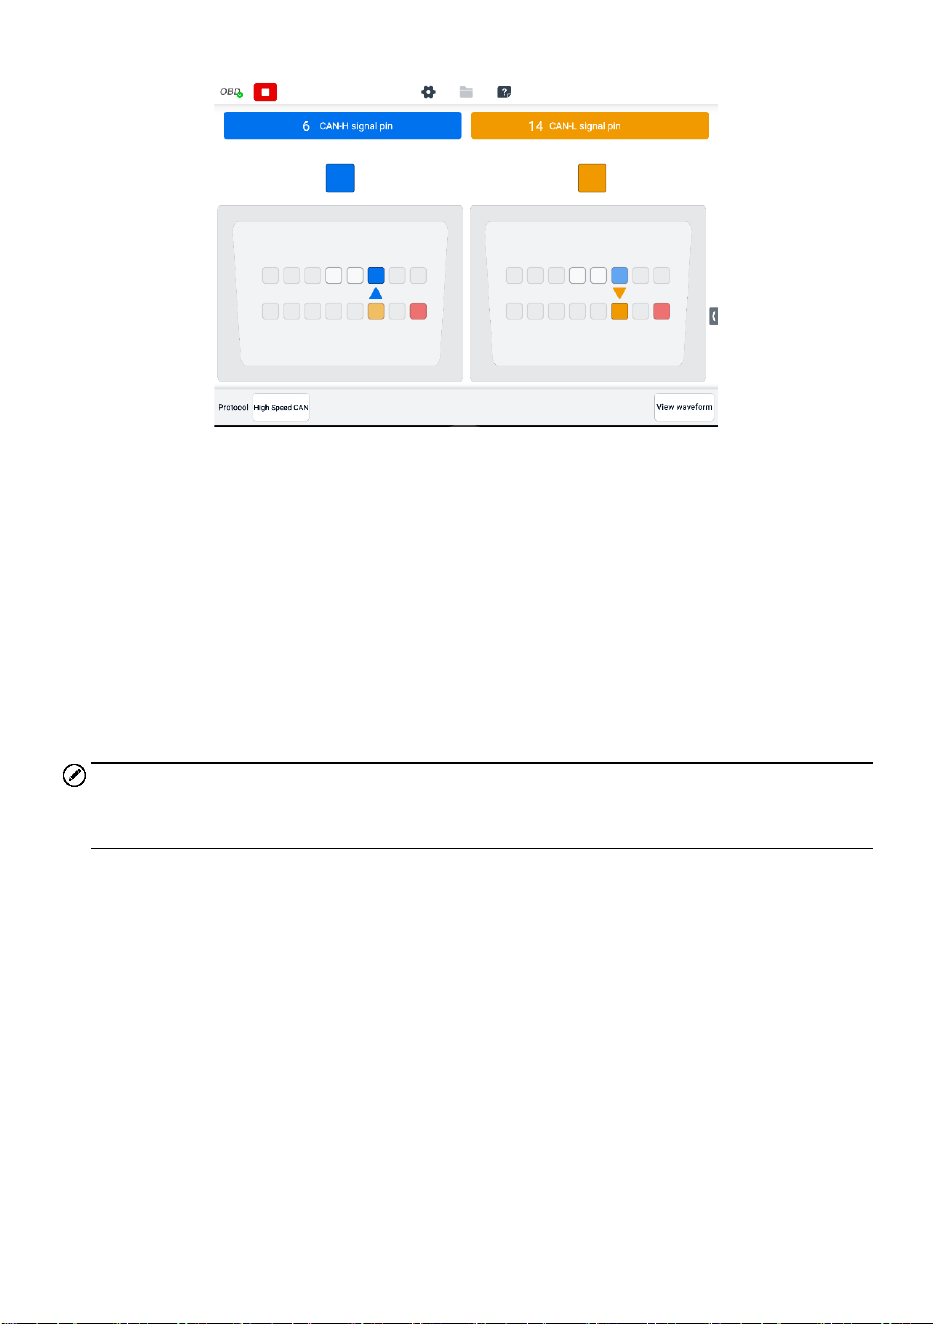
204
Figure 9-115 Indicator Mode Screen
Main Section
The CAN-High line is assigned to Pin 6 and the CAN-Low line is assigned to Pin
14 of the OBDII adapter by default according to the CAN-Bus standard protocol.
If the test vehicle's actual communication signal pins are assigned differently, you
can select OBDII connector's signal pins manually in the Settings menu.
When the electronic control units send out signals properly, the left and right indicator
lights will flash consecutively on the screen.
NOTE
The flashing indicator lights serve to confirm only that communication signals have been
detected.
Lower Toolbar
⚫ Protocol — in the left-lower corner of the screen, you can select the protocol
you want to test.
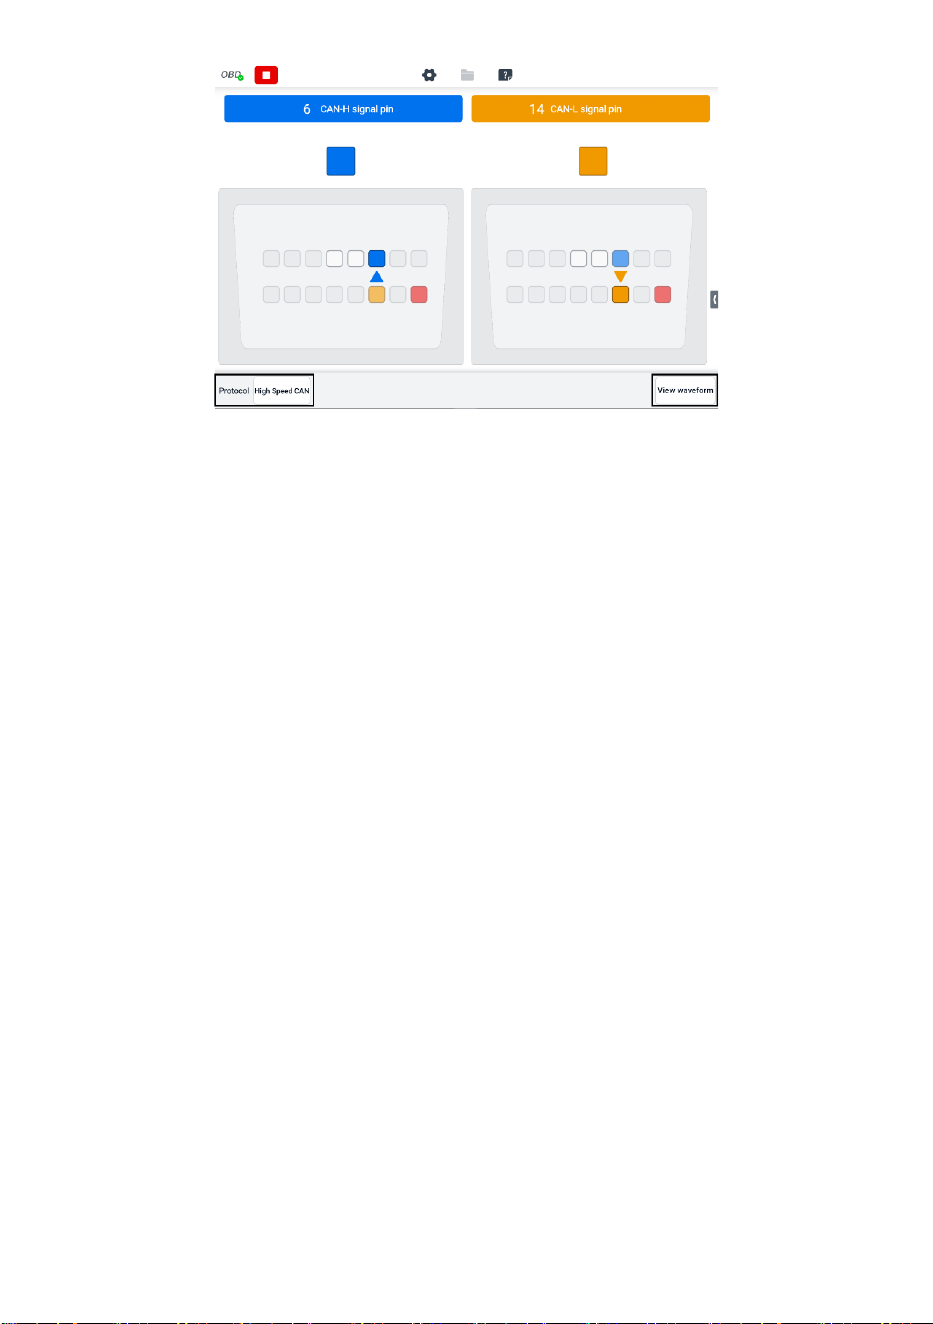
205
Figure 9-116 Protocol Button Screen
The following protocols are included:
High Speed CAN — offers baud rates from 40 Kbit/s to 1 Mbit/sec,
depending on cable length. This is the most popular standard for the
physical layer, since it allows for simple cable connection between devices.
High speed CAN networks are terminated with 120 ohm resistors on each
end of the network.
Low Speed CAN — offers baud rates from 40 Kbit/s to 125 Kbits/sec. This
standard allows CAN bus communication to continue in case of a wiring
failure on the CAN bus lines. In low speed CAN networks, each device has
its own termination.
Single CAN — offers baud rates up to 33.3 Kbit/s (up to 88.3 Kbit/s for
high-speed mode)
J1939 CAN — is used in the commercial vehicle area for communication
throughout the vehicle with the physical layer defined in ISO 11898. Under
J1939/11 and J1939/15, the data rate is specified as 250 Kbit/s, with
J1939/14 specifying 500 Kbit/s.
J1850 (PWM) — SAE J1850 pulse-width modulation offers baud rates up
to 41.6 Kbit/s, standard of the Ford Motor Company
J1850 (VPW) — SAE J1850 variable pulse width offers baud rates up to
10.4 Kbit/s, standard of the General Motors
J1708 (SAE) — the standard defines a double-wire 18-gauge cable that
can run up to 130 feet (40 m) and operates at 9600 bit/s
⚫ View Waveform — in the right-lower corner of the screen, you can enter to the
Waveform Mode by tapping the View Waveform button.

206
Test Procedure
The test procedure is the same for all the protocols.
➢ To test the communication line
Using High speed CAN-bus line as an example.
1. Make sure the VCMI2 is connected to the vehicle's OBDII connector. The
VCMI2 is connected with tablet successfully.
2. Place the ignition in the key ON position.
3. Tap the Measurement icon on the Job Menu of the MaxiSys tablet. The
Measurement screen opens. Tap the Bus Inspection icon to open the Bus
Inspection Menu. Select the High Speed CAN protocol in the lower corner of
the screen.
4. Tap the Start button on the upper-left corner of the screen to start the device.
The OBDII connector pin number that the signals are using is indicated, and the
indicator light flashes if the signals are detected. Otherwise, the indicator light
displays in gray.
NOTE
If the indicator light is not flashing, ensure the ignition is in the key ON position and that
signal pin assignment is correct.
B. Waveform Mode
This mode allows you to view the test result in a waveform form. This mode offers
greater details and offers a larger number of configuration options.
The screen is displayed in the Indicator Mode by default.
Tap the View Waveform button in the lower corner of the Indicator Mode screen to
switch to the Waveform Mode. The screen is shown as below.
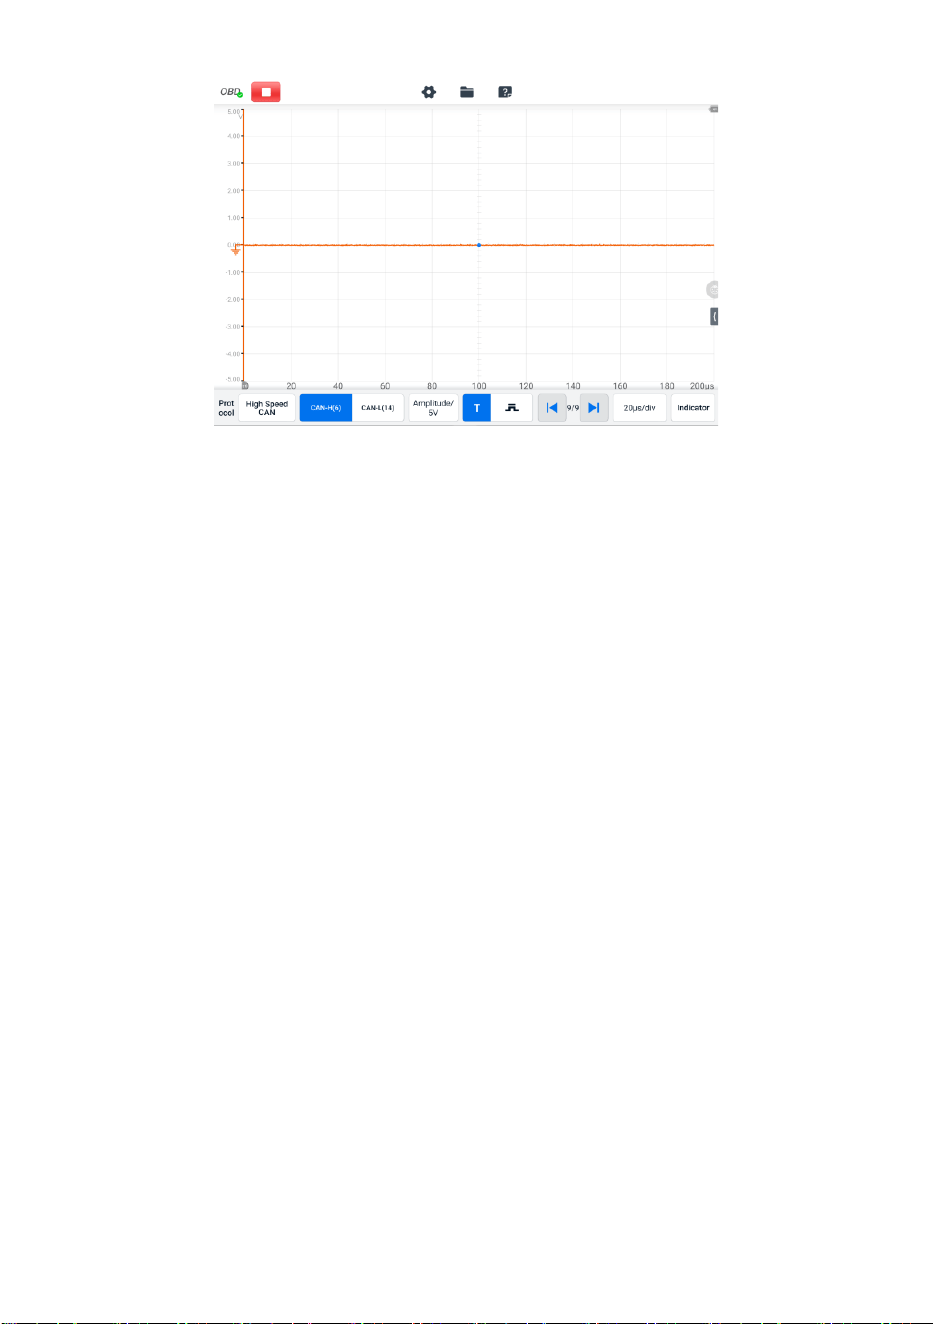
207
Figure 9-117 Waveform Mode Screen
Main Section
The main section features as a coordinate grid with X-axis and Y-axis, representing
the time duration and amplitude level respectively. The amplitude level can be
configured in the Amplitude Settings and the time duration can be set in the Time
Base Settings.
Channel Selection
Each channel has two conditions: selected and unselected. Some operations
depend on the selected condition of the channel, such as measurement rulers,
waveform movements, and waveform zooming.
➢ To select and unselect the channel
1. Tap the Zero Baseline marker or the Y-axis (the line thickens when selected).
2. Tap the Zero Baseline marker or the Y-axis again to exit the channel selection.
Waveform Zooming
The zooming function allows you to change the size and position of a signal
during or after capturing a waveform to examine. It does not change the stored
data, only the way it displays.
The X-axis and Y-axis can be zoomed using your fingertips. The waveform can
be zoomed during or after capturing the signal.
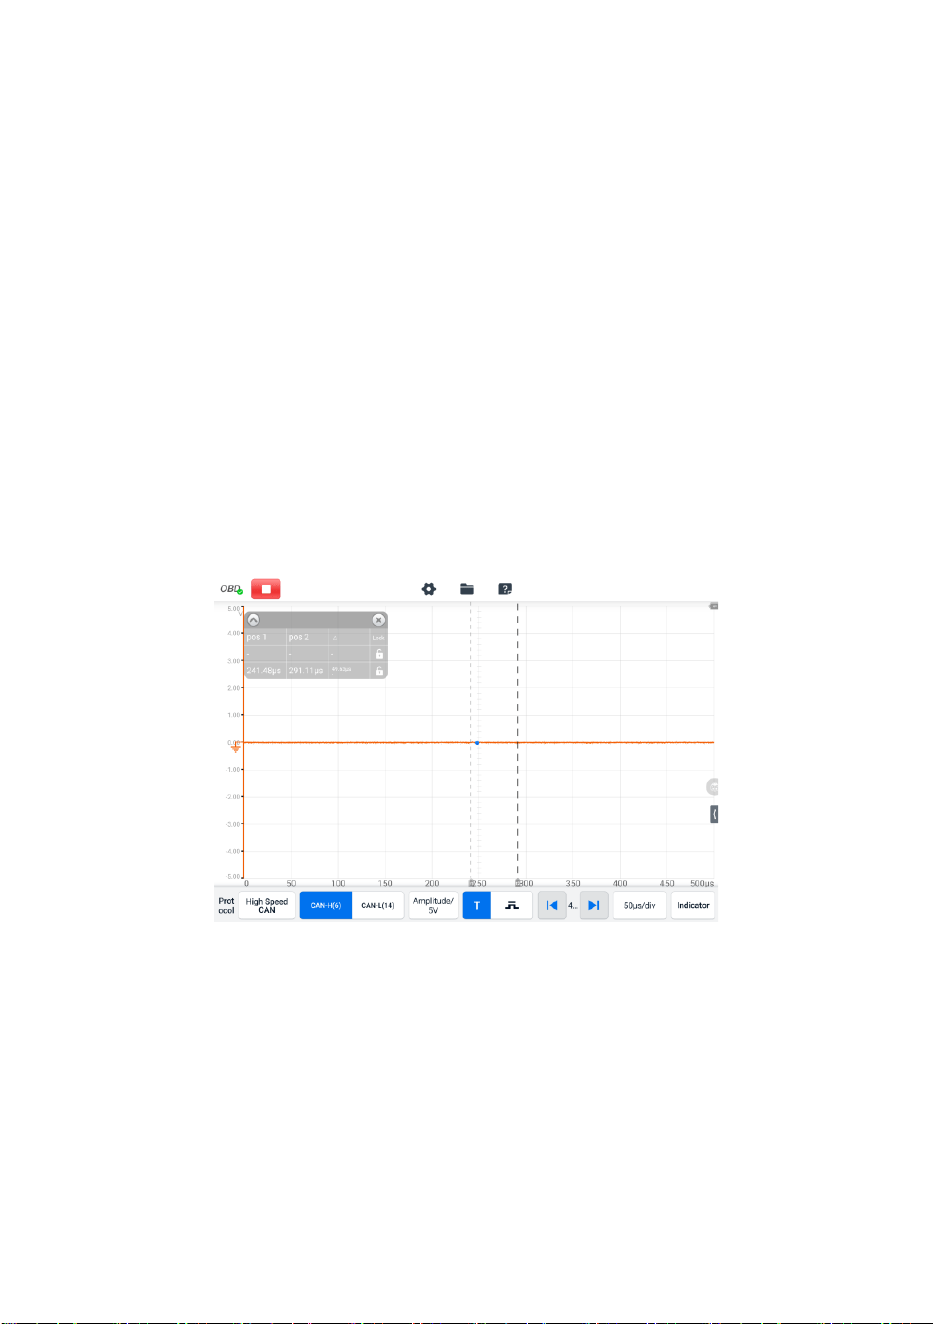
208
Measurement Rulers
In the coordinate grid, there are two types of measurement rulers, which allow
the amplitude and time duration of a waveform to be measured precisely. They
are useful when determining signal characteristics such as amplitude at specific
points, the cycle time (duration) and frequency.
The vertical Time Ruler — tap the Ruler Activator in the bottom left corner of
the grid and drag it across the screen to the desired position. A Time Ruler is
generated.
The horizontal Signal Ruler — the Signal Ruler can be generated in the similar
way by clicking the Ruler Activator in the top right corner and dragging it
downwards.
When dragging the Measurement Rulers, a Ruler Table showing time and
voltage values for the corresponding channels will be displayed. The Delta icon
refers to the absolute difference between the values of the rulers, which can be
locked by tapping the Lock icon. Tap the X button in the upper right corner of
the ruler table to delete all rulers.
Figure 9-118 Measurement Rulers Screen
Zero Baseline
The zero baseline is marked as the 0 value in the Y-axis, showing the base level
of each channel waveform. After the channel is selected, the zero baseline can
be adjusted by dragging the baseline marker up/down along the Y-axis, or
dragging the waveform up/down or moving the screen up/down in the grid.
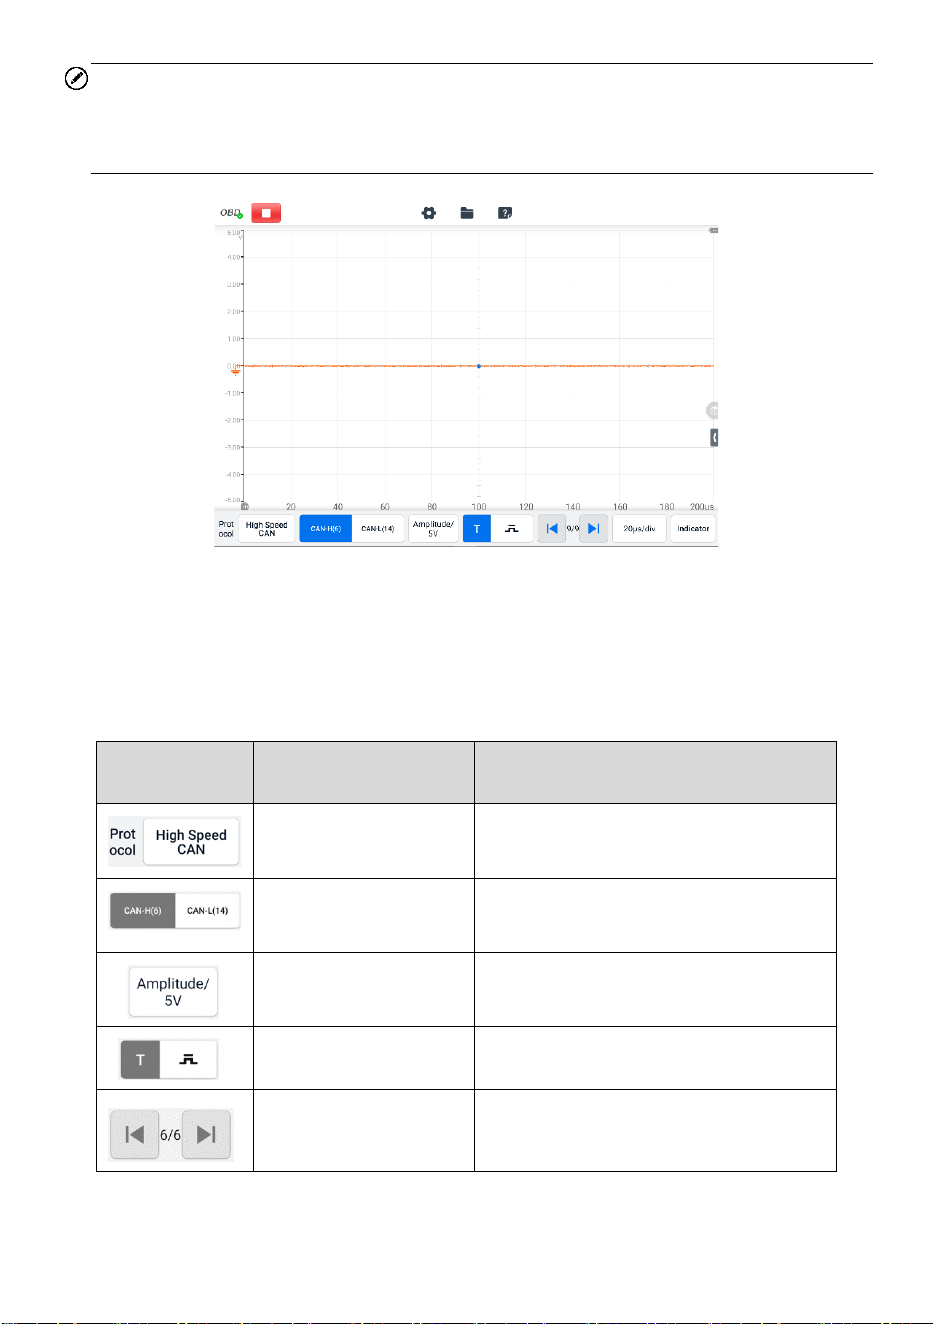
209
NOTE
Tap the baseline marker to make the vertical scale line thicker. In this case, the channel
is selected. Tap the baseline marker again to unselect and the waveform cannot be
dragged.
Figure 9-119 Zero Baseline Screen
Lower Toolbar
The protocol, buffer, and time base can be configured at the lower toolbar.
Table 9-15 Lower Toolbar
Button
Name
Description
Protocol
Tap to select an appropriate protocol.
Communication Line
Tap to select the appropriate
communication line.
Amplitude
Tap to select an appropriate amplitude
value.
Trigger
Tap to open the trigger setting menu.
Buffer
Tap the Previous or Next button to
switch to the previous or the next
waveform.
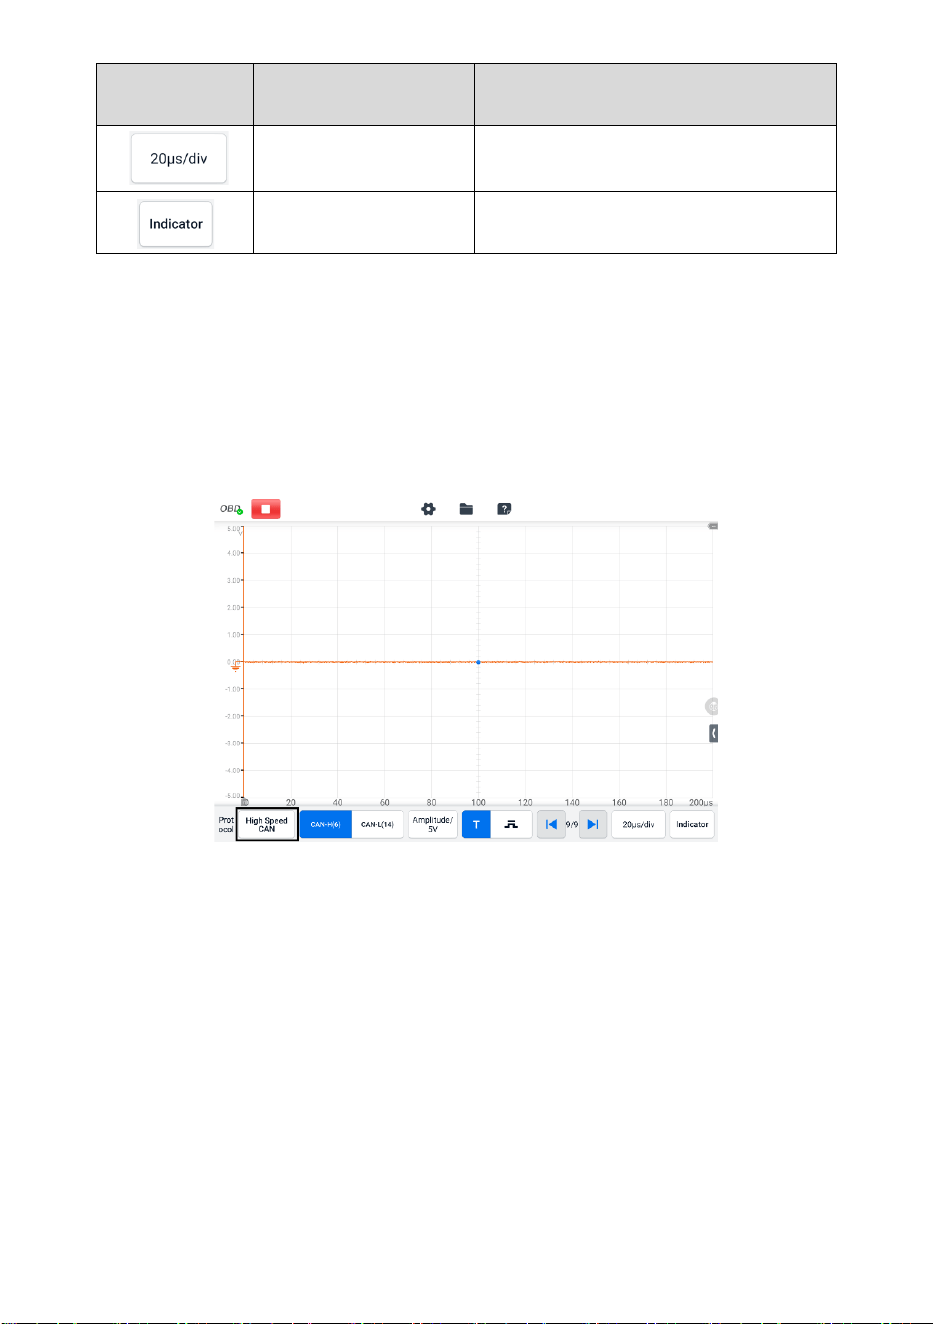
210
Button
Name
Description
Time Base
Tap to select an appropriate time per
division.
Indicator
Tap to switch to the Indicator mode.
⚫ Protocol Setting
Seven types of communication protocols are available: High Speed CAN, Low
Speed CAN, Single CAN, J1939 CAN, J1850 (PWM), J1850 (VPW), and J1708
(SAE).
➢ To select a protocol
1. Tap the Protocol in the lower-left corner of the screen. A dialog box opens.
Figure 9-120 Protocol Type Button Screen
2. Select the desired Protocol type in the dialog box.
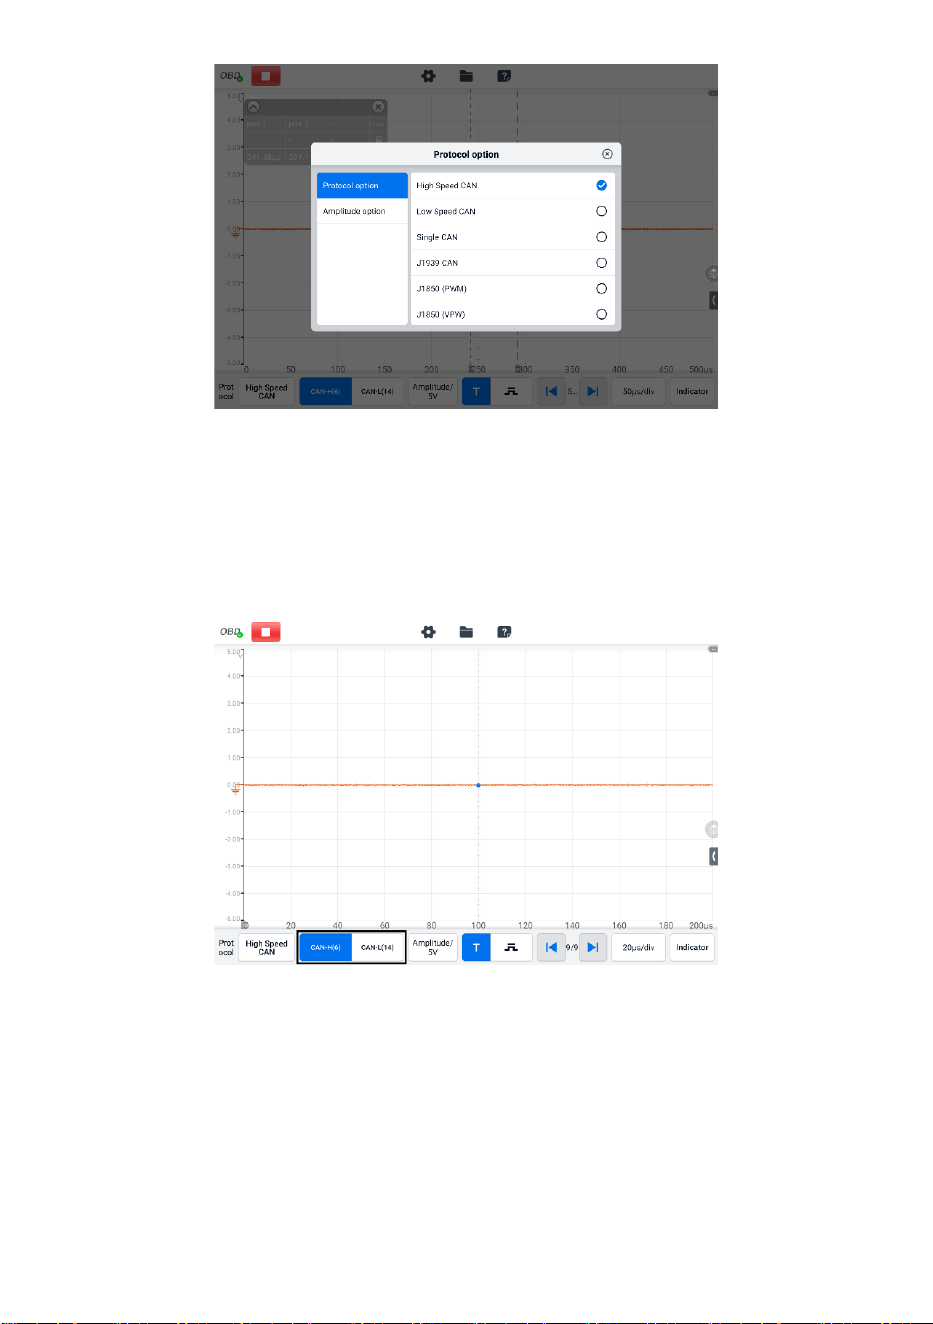
211
Figure 9-121 Protocol Setting Screen
3. Tap the “X” icon to close the dialog box.
⚫ Communication Line
The communication line selection varies according to the protocol selected. Tap
the appropriate communication line at the bottom of the screen.
Figure 9-122 Communication Line Button Screen
⚫ Amplitude Setting
After selecting the protocol type, you can also set the amplitude value for that
type.
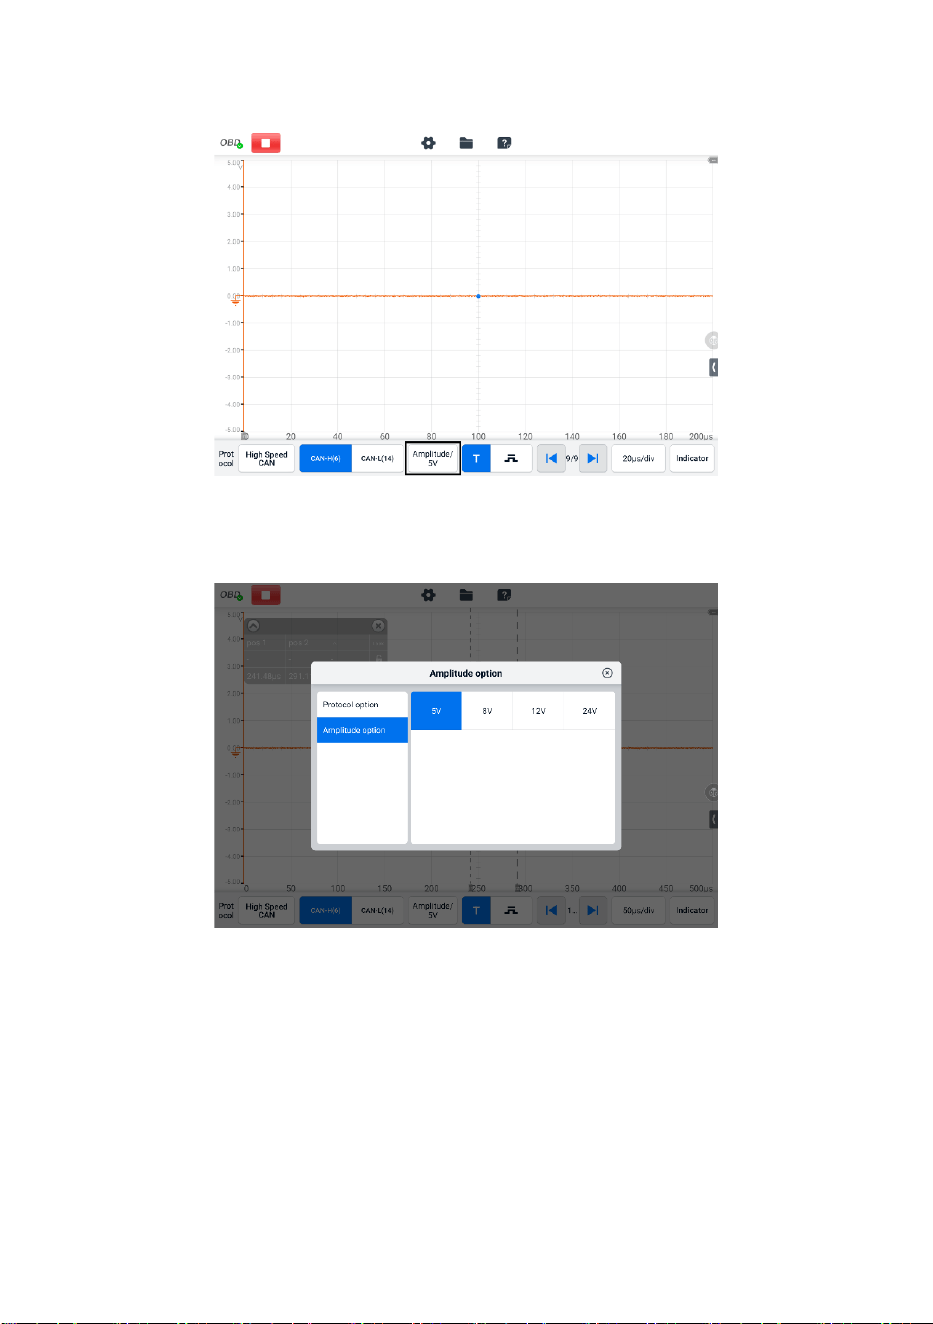
212
➢ To set the amplitude
1. Tap the Amplitude button at the bottom of the screen. A dialog box displays.
Figure 9-123 Amplitude Button Screen
2. Select the appropriate amplitude for the protocol.
Figure 9-124 Amplitude Setting Screen
3. Tap the “X” icon to close the dialog box.
⚫ Trigger
The trigger feature is used to filter and capture specified waveform data.
According to the trigger setting condition, the trigger waveform will be captured
when the signal meets the trigger condition. When capturing waveforms, you
can manually set the trigger conditions. When the device is capturing the signal,
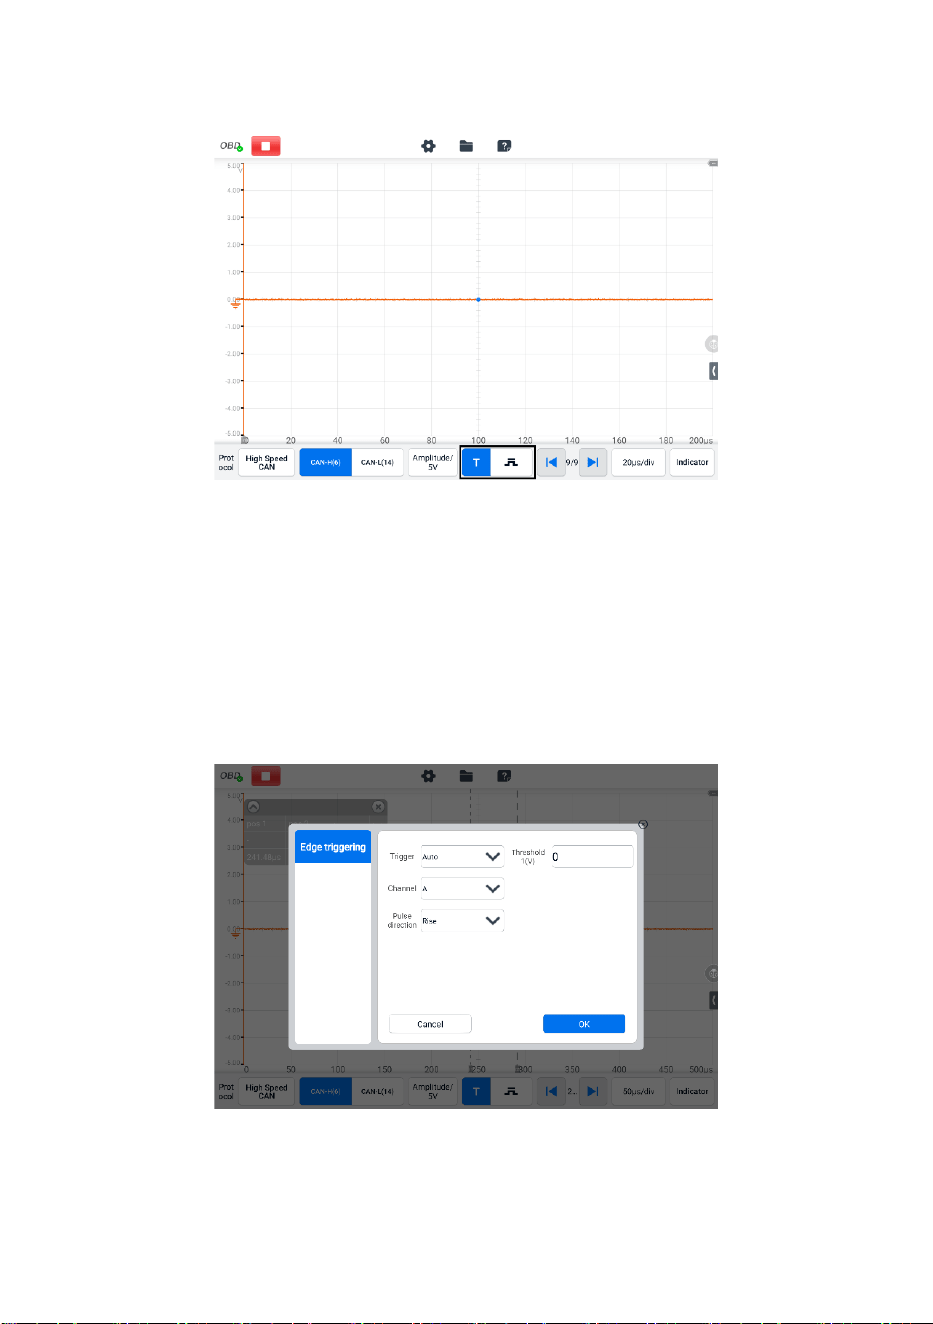
213
tap the left column of the Trigger button to activate the trigger function. A trigger
point displays as a blue point.
Figure 9-125 Trigger Button Screen
The edge trigger is one of the most common trigger modes and is activated
when voltage rises above or falls below a preset threshold. This trigger type
allows you to configure the trigger mode, threshold, trigger channel and pulse
direction settings. Tap Done to save the settings or tap Cancel to exit without
saving.
When the device is capturing the signal, tap the right column of the Trigger
button to open the trigger settings dialog box.
Figure 9-126 Trigger Settings Screen
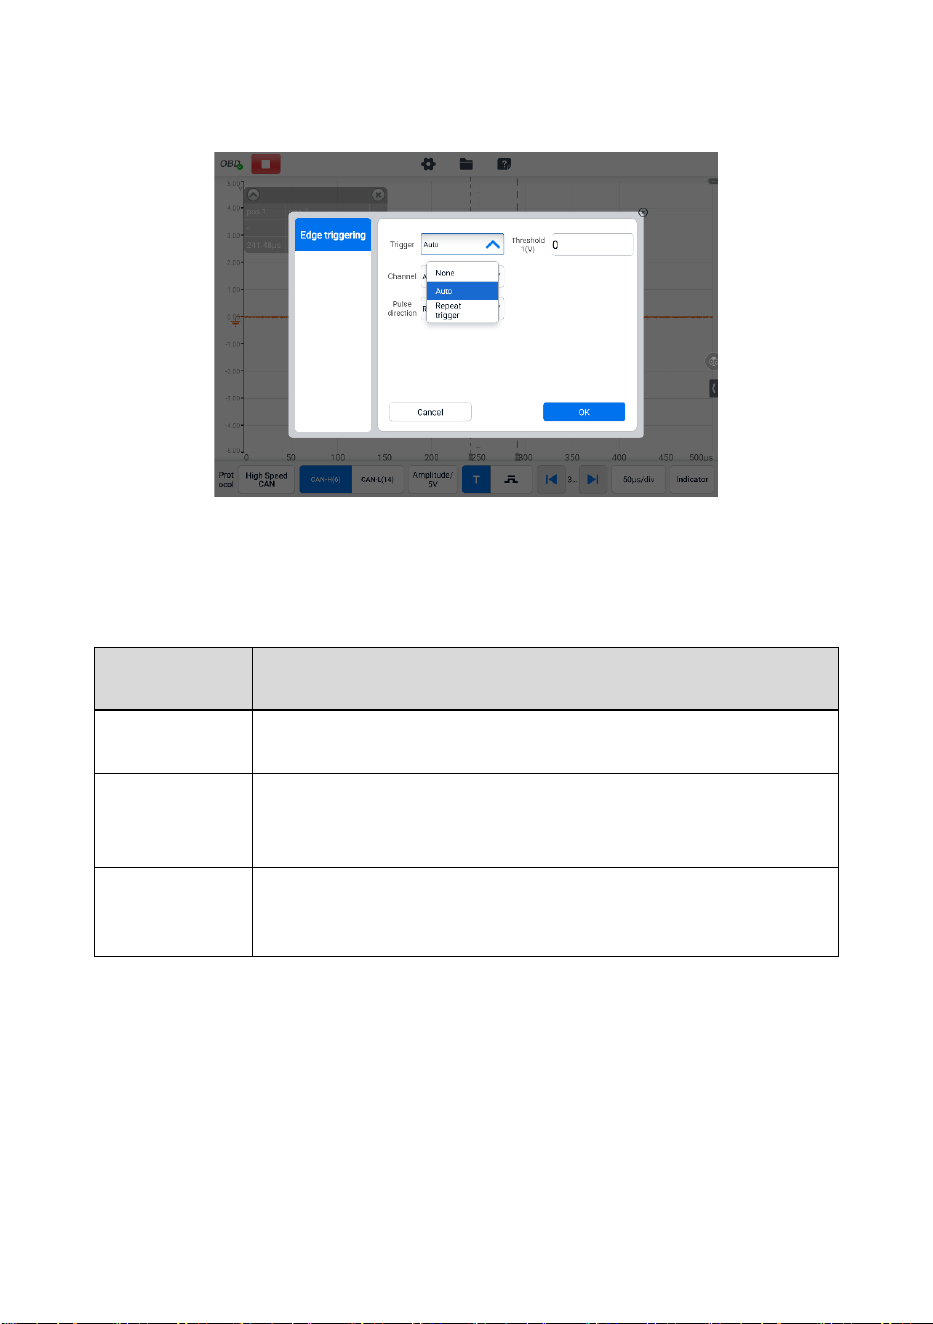
214
Trigger Mode
Three trigger modes are available: None, Auto, and Repeat.
Figure 9-127 Trigger Mode Screen
The table below offers a brief description of each trigger mode.
Table 9-16 Trigger Mode Table
Trigger Mode
Description
None
The oscilloscope can continuously capture data, without waiting
for a trigger event.
Auto
The oscilloscope will wait for a trigger before capturing data. It
can automatically update after a short period, even if the signal
does not across the trigger point.
Repeat
trigger
The oscilloscope waits until a trigger event occurs. If there is no
trigger event, nothing will be displayed on the screen.
Channel
Select the applicable trigger channel from the dropdown menu. The
selected channel is the communication line that the device monitors for the
trigger condition.
Pulse Direction
Two pulse direction settings are available: Rise and Fall.
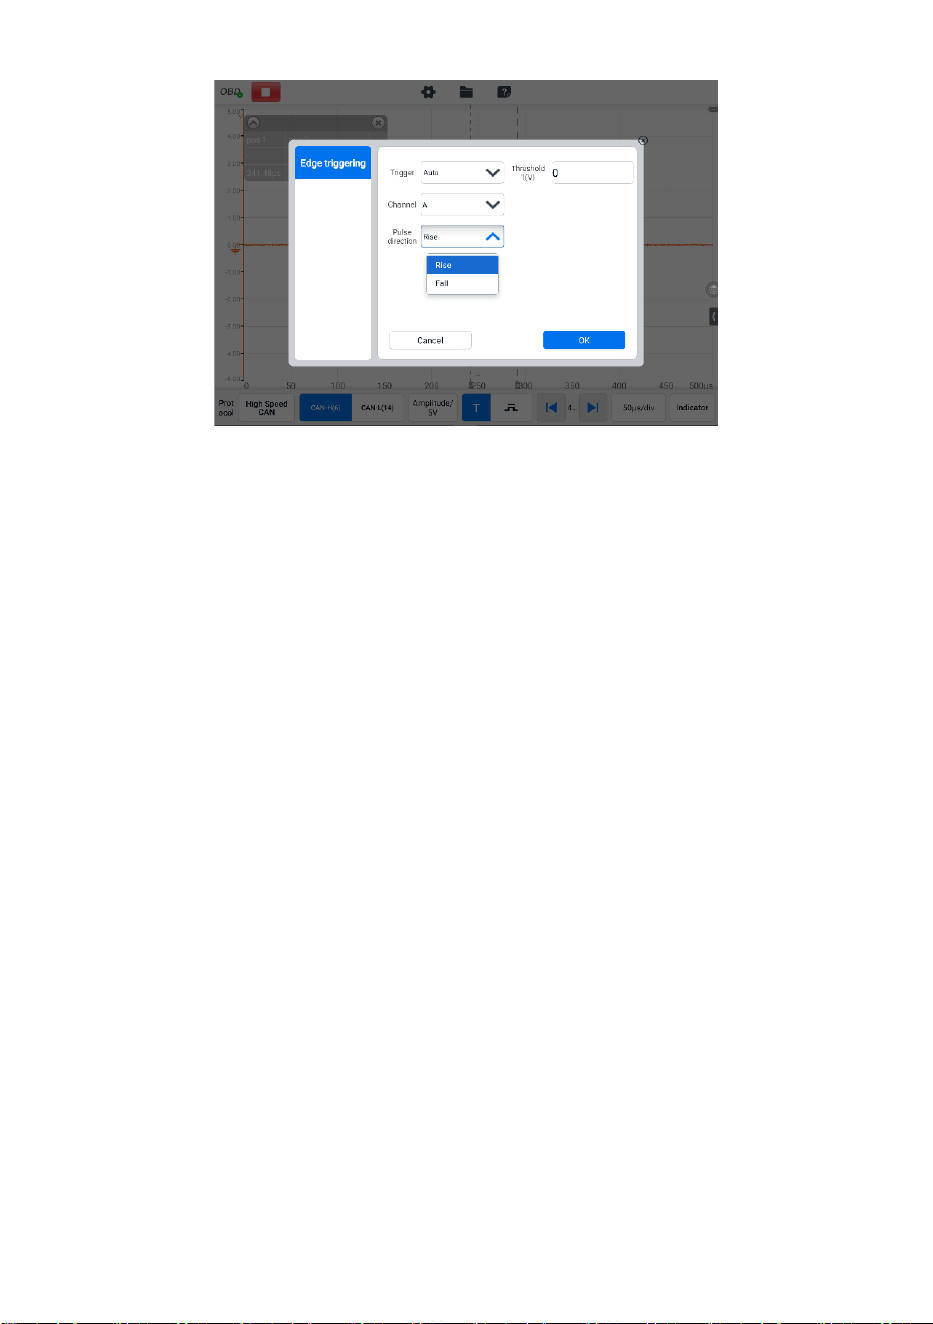
215
Figure 9-128 Pulse Direction Screen
Rising Edge Trigger — indicates trigger is turned on to start the trace on
the rising edge of the waveform.
Falling Edge Trigger — indicates trigger is turned on to start the trace on
the falling edge of the waveform.
Threshold
The Threshold allows you to set the voltage threshold for the trigger.
✓ To precisely position the trigger point, input the value in the Threshold
field in the trigger settings dialog box.
✓ To roughly position the trigger point, drag the trigger point to a desired
position.
➢ To configure the trigger settings
1. Tap the right column of the Trigger button to open the trigger settings dialog
box.
2. Select the trigger mode, trigger channel and pulse direction in the dropdown list.
3. Input the value in the Threshold field in the trigger settings dialog box.
4. Tap Done to save settings or tap Cancel to exit without saving.
⚫ Buffer
The waveform buffer shows which signal waveform is displayed on the current
screen and how many signal waveforms are captured and stored in the buffer
memory.
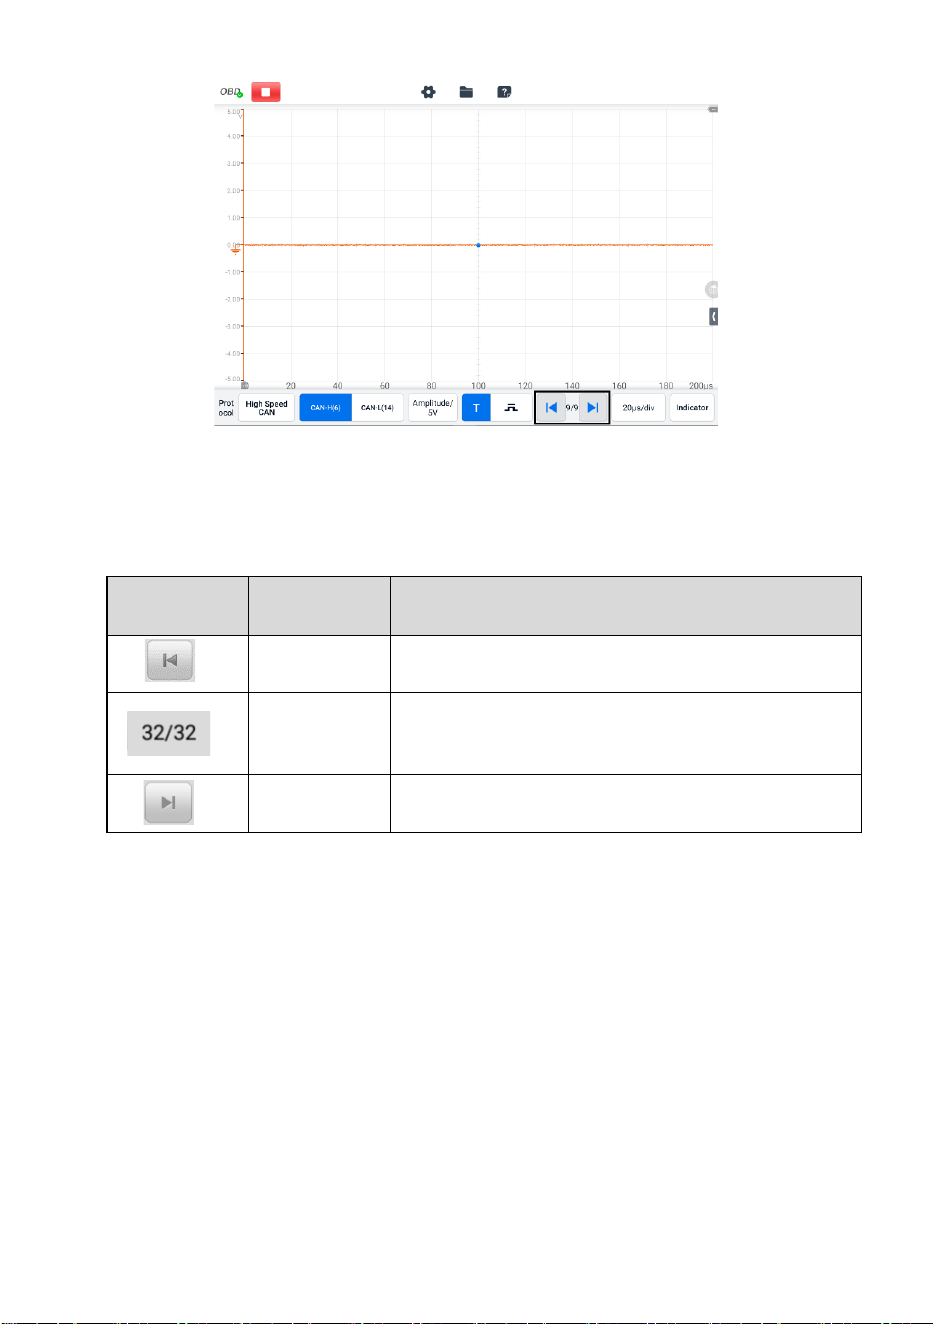
216
Figure 9-129 Buffer Screen
The device can capture and store waveforms. You can select a waveform from
the waveform buffer by tapping the Previous or Next button.
Button
Name
Description
Previous
Tap to display the previous waveform in the buffer.
Buffer Index
Shows which waveform is currently being
displayed and how many waveforms are in the
buffer.
Next
Tap to display the next waveform in the buffer.
⚫ Time Base
The time base controls the time interval across the device display. Tap the Time
Base button at the bottom to open the setting dialog box.
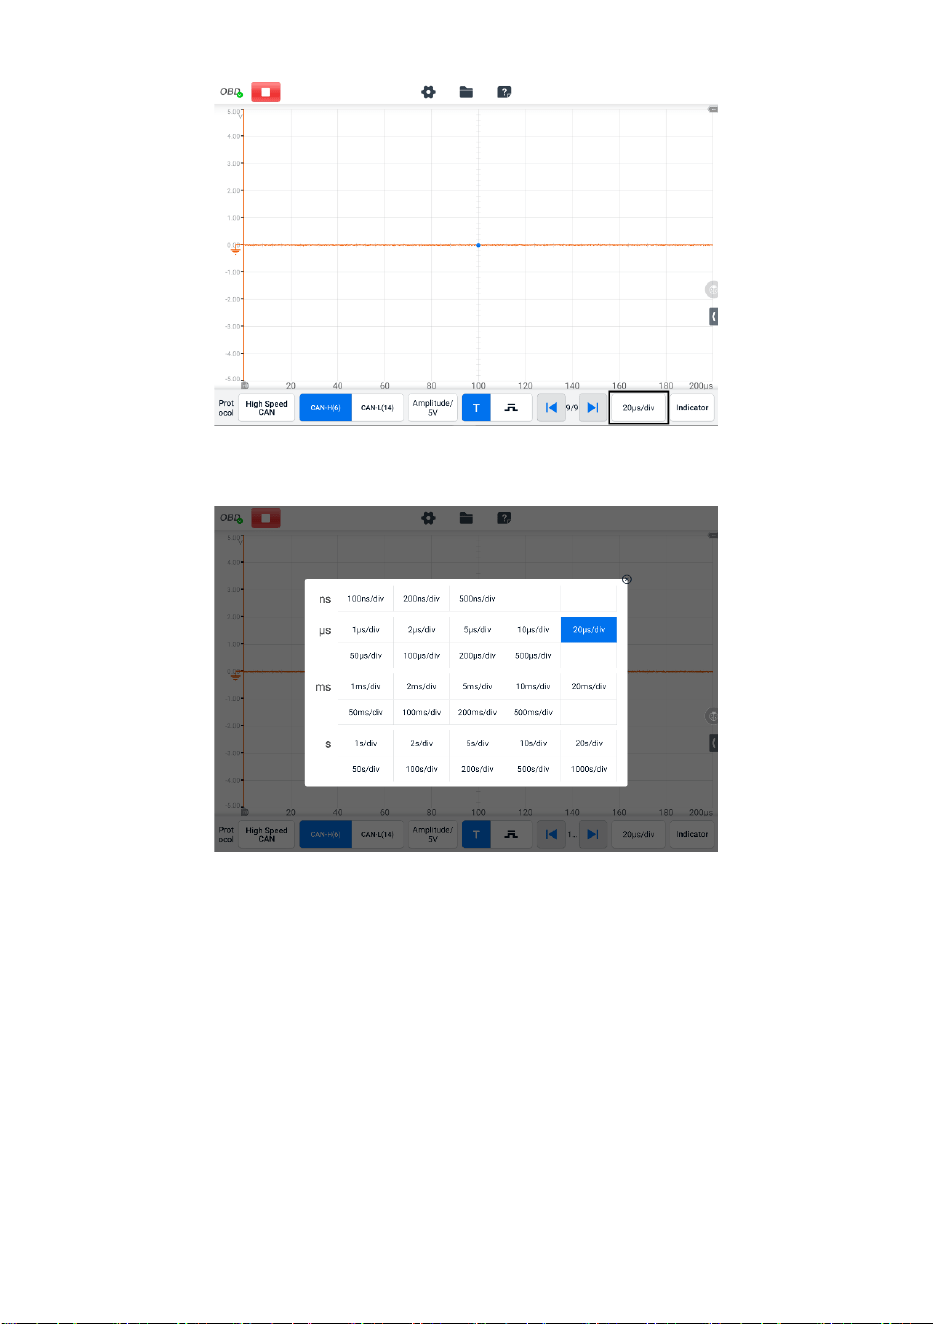
217
Figure 9-130 Time Base Screen 1
Figure 9-131 Time Base Screen 2
Continuous Mode: if the time base is set to more than or equal to 200ms/div,
the device switches to the continuous mode. In this mode, the device updates
the trace continuously as each capture progresses, rather than waiting for a
complete capture before updating the trace.
⚫ Indicator Button
In the lower corner of the screen, you can enter the Indicator Mode by tapping
the Indicator button.

218
Figure 9-132 Indicator Button Screen
9.4.5 Troubleshooting
If the VCMI2 cannot communicate with the MaxiSys tablet:
⚫ Ensure the VCMI2 is properly connected to the MaxiSys tablet via Wi-Fi or with the
supplied USB cable.
⚫ Ensure the pin number is set properly.
⚫ Ensure the ignition is in the Key ON position.
⚫ Restart the tablet and reconnect the VCMI2 if communication continues to fail.
9.4.6 Glossary
Vehicle Bus
A vehicle bus is a specialized internal communications network that interconnects
components inside a vehicle (e.g., automobile, bus, train, industrial or agricultural vehicle,
ship, or aircraft). Protocols include Controller Area Network (CAN), Local Interconnect
Network (LIN), and others.
CAN Bus
A Controller Area Network (CAN bus) is a robust vehicle bus standard designed to allow
microcontrollers and devices to communicate with each other in applications without a
host computer.
SAE International
Initially established as the Society of Automotive Engineers, is a U.S.-based, globally

219
active professional association and standards developing organization for engineering
professionals in various industries. Principal emphasis is placed on transport industries
such as automotive, aerospace, and commercial vehicles.
SAE J1708
SAE J1708 is a standard used for serial communications between ECUs on a heavy duty
vehicle and also between a computer and the vehicle. With respect to Open System
Interconnection model (OSI), J1708 defines the physical layer. Common higher layer
protocols that operate on top of J1708 are SAE J1587 and SAE J1922. The protocol is
maintained by SAE International.
SAE J1939
Society of Automotive Engineers standard SAE J1939 is the vehicle bus recommended
practice used for communication and diagnostics among vehicle components. It is used
in the commercial vehicle area for communication throughout the vehicle, with the
physical layer defined in ISO 11898.
J1850
Defines a serial data protocol. There are two variants- 10.4 Kbit/s (single wire, VPW) and
41.6 Kbit/s (two wire, PWM). Mainly used by US manufacturers, also known as PCI
(Chrysler, 10.4 Kbit/s), Class 2 (GM, 10.4 Kbit/s), and SCP (Ford, 41.6 Kbit/s).
OBD
On-board diagnostics (OBD) is an automotive term referring to a vehicle's self-diagnostic
and reporting capability. OBD systems give the vehicle owner or repair technician access
to the status of the various vehicle engine systems.
OBD-II diagnostic connector
The OBD-II DLC (post-1996 vehicles) is usually located under the instrument panel on
the driver side, though there are several exceptions. The SAE J1962 specification
provides for two standardized hardware interfaces, called type A and type B. Both are
female, 9-pin (2x8), D-shaped connectors, and both have a groove between the two rows
of pins.
DLC
The data link connector (DLC) is the multi-pin diagnostic connection port for automobiles,
trucks, and motorcycles used to interface a scan tool with the control modules of a given
vehicle and access on-board diagnostics and live data streams.
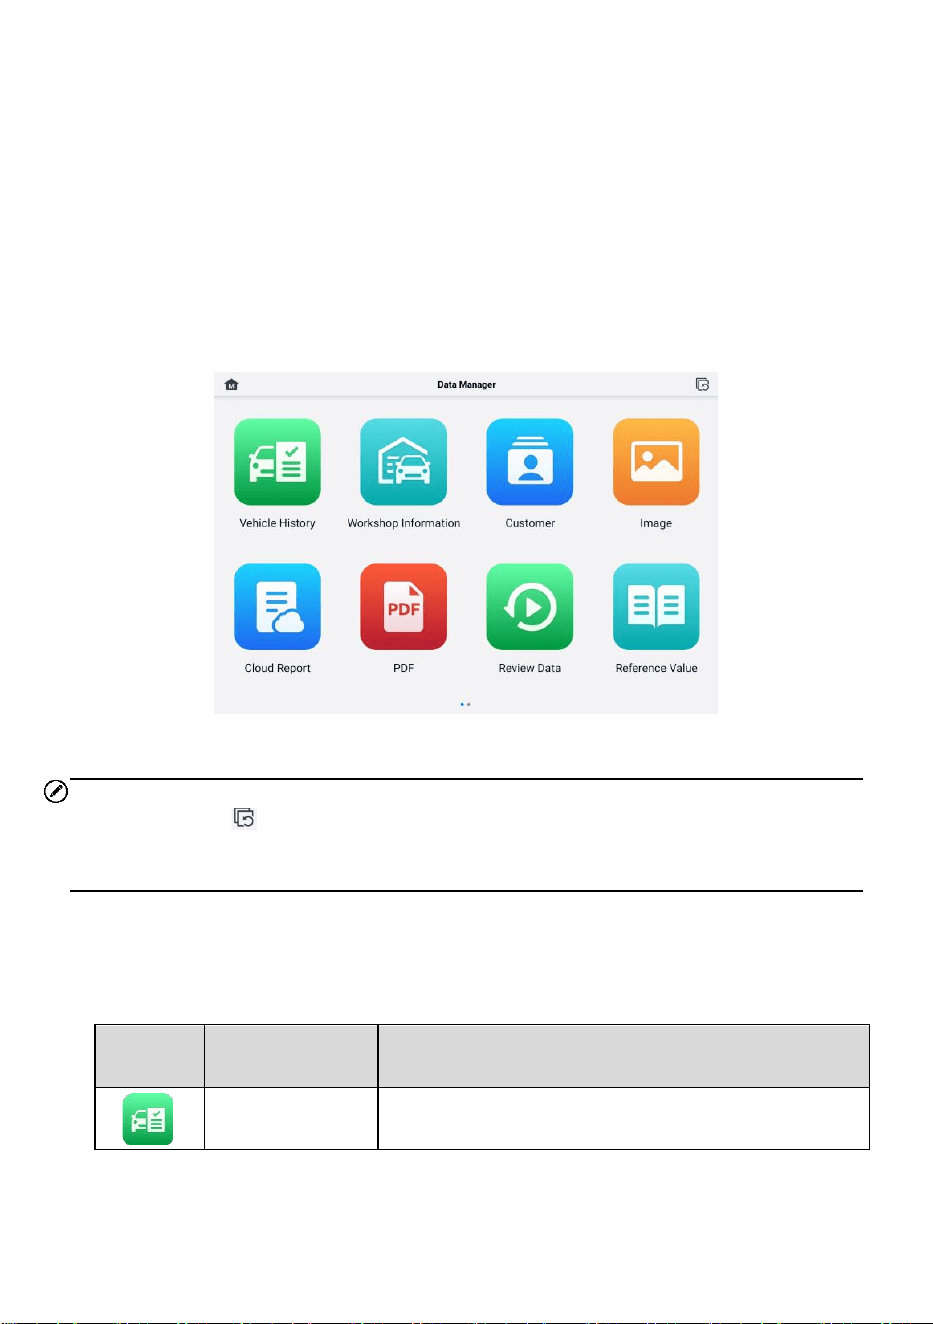
220
10 Data Manager
The Data Manager application allows you to store, print, and review the saved files,
manage the workshop information, and customer information records, and keep test
vehicle history records.
Selecting the Data Manager application opens the file system menu. There are ten main
functions available.
Figure 10-1 Data Manager Main Screen
NOTE
After tapping the icon on the top-right corner of the Data Manager Main screen, the
data including the live data, vehicle list, historical record, workshop information, and live
data reference can be added to the backup and restored.
The table below briefly describes each of the function buttons in the Data Manager
application.
Table 10-1 Buttons in Data Manager
Button
Name
Description
Vehicle History
Tap to review the diagnostics history record.
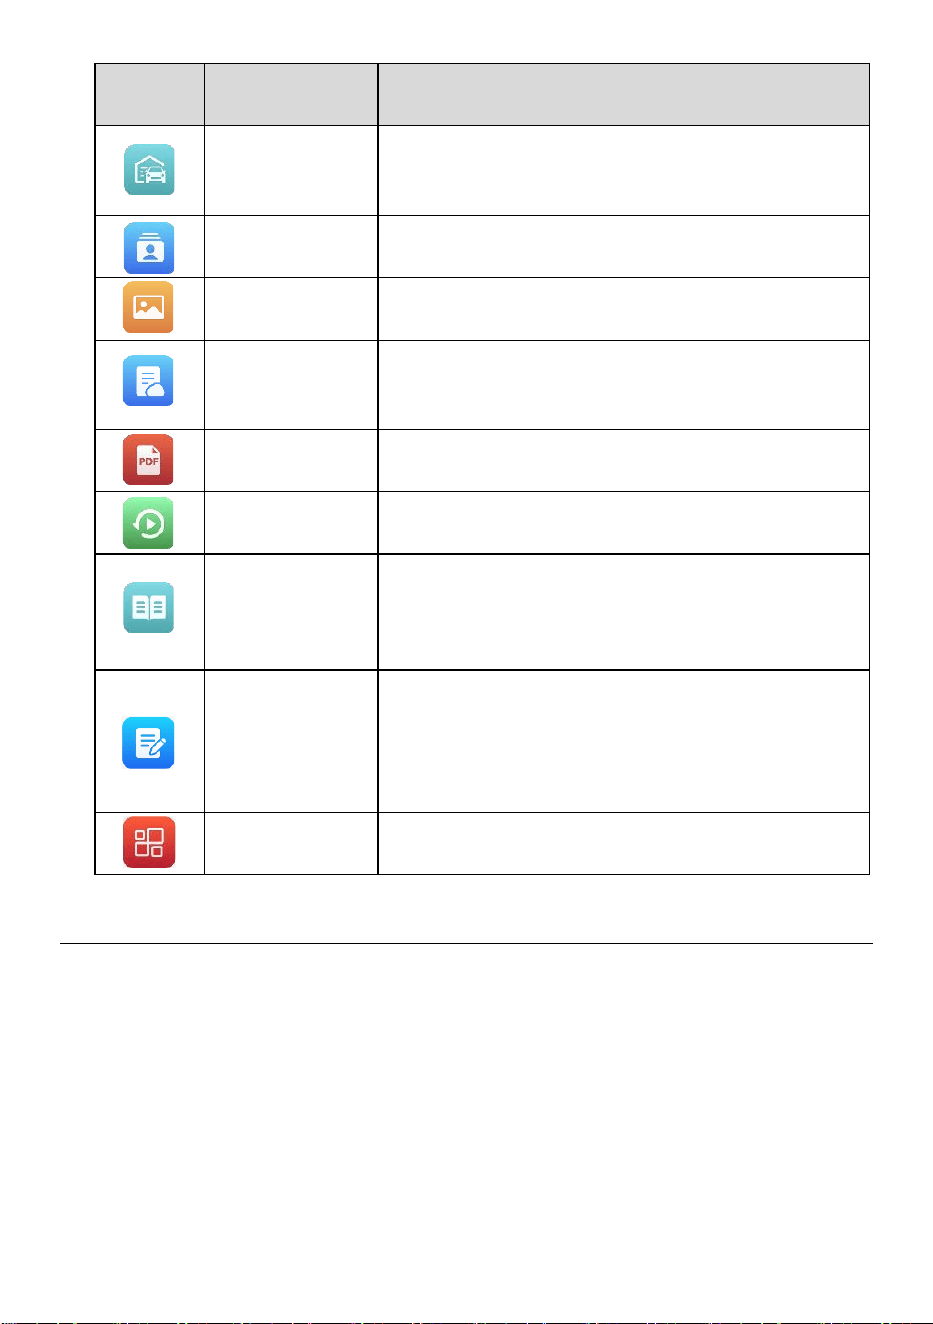
221
Button
Name
Description
Workshop
Information
Tap to edit the information of workshops.
Customer
Tap to create new customer information.
Image
Tap to review the screenshots.
Cloud Report
Tap to review the saved reports and share cloud
reports.
PDF
Tap to review the reports stored as PDF files.
Review Data
Tap to review the recorded data.
Reference
Value
Tap to view, edit, and share the data related to the live
data function reference values. Both local reference
values and cloud backups are included.
Data Logging
Tap to review the communication data and ECU
information of the vehicle. The saved data can be
reported and sent to the technical center via the
Internet.
Uninstall Apps
Tap to uninstall applications.
10.1 Vehicle History
This function stores records of test vehicle history, including vehicle information and the
retrieved DTCs from previous diagnostic sessions. Test information is summarized and
displayed in an easy-to-read table listing. The Vehicle History also provides direct access
to the previously tested vehicle and allows you to directly restart a diagnostic session
without needing to perform auto or manual vehicle selection.
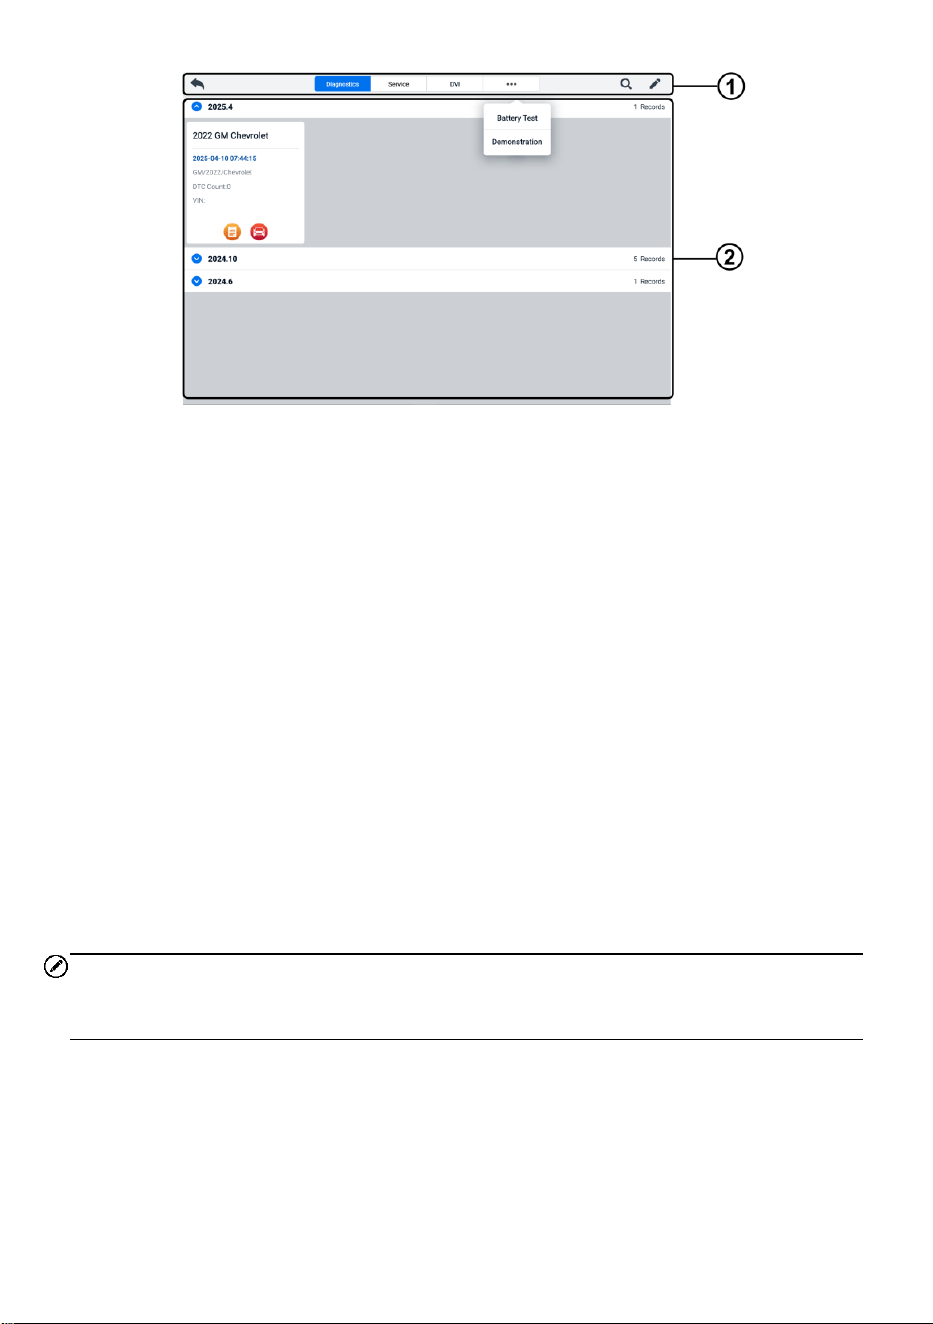
222
Figure 10-2 Vehicle History Screen
1. Top Toolbar Buttons — navigation and application controls.
2. Main Section — displays all the vehicle history records.
➢ To activate a test session for the recorded vehicle
1. Tap Data Manager on the MaxiSys Job Menu.
2. Select Vehicle History to open the screen. Tap the relevant application tab to
select the test record. For example, tap Diagnostics to select diagnostics test
records.
3. Tap the Diagnostics or DVI icon at the bottom of the thumbnail of a vehicle
record item.
4. The Diagnostics screen of the vehicle displays and a new diagnostics session
is activated after the Diagnostics icon is tapped. See Diagnostics to continue
the diagnostics. The DVI application opens after the DVI icon is tapped. See
Digital Vehicle Inspection to continue the inspections.
5. Or select a vehicle thumbnail to open a record. A Historical Test record sheet
displays. Review the recorded information of the test vehicle. Tap the
Diagnostics button or the DVI button on the upper-right corner.
NOTE
The MaxiSys tablet must establish a stable connection to the VCMI2 to restart test
sessions on the previously tested vehicles.
10.1.1 Historical Test Record
The Historical Test Record is a detailed data form of the vehicle, which includes general
vehicle information, service record, customer information, and the diagnostic trouble
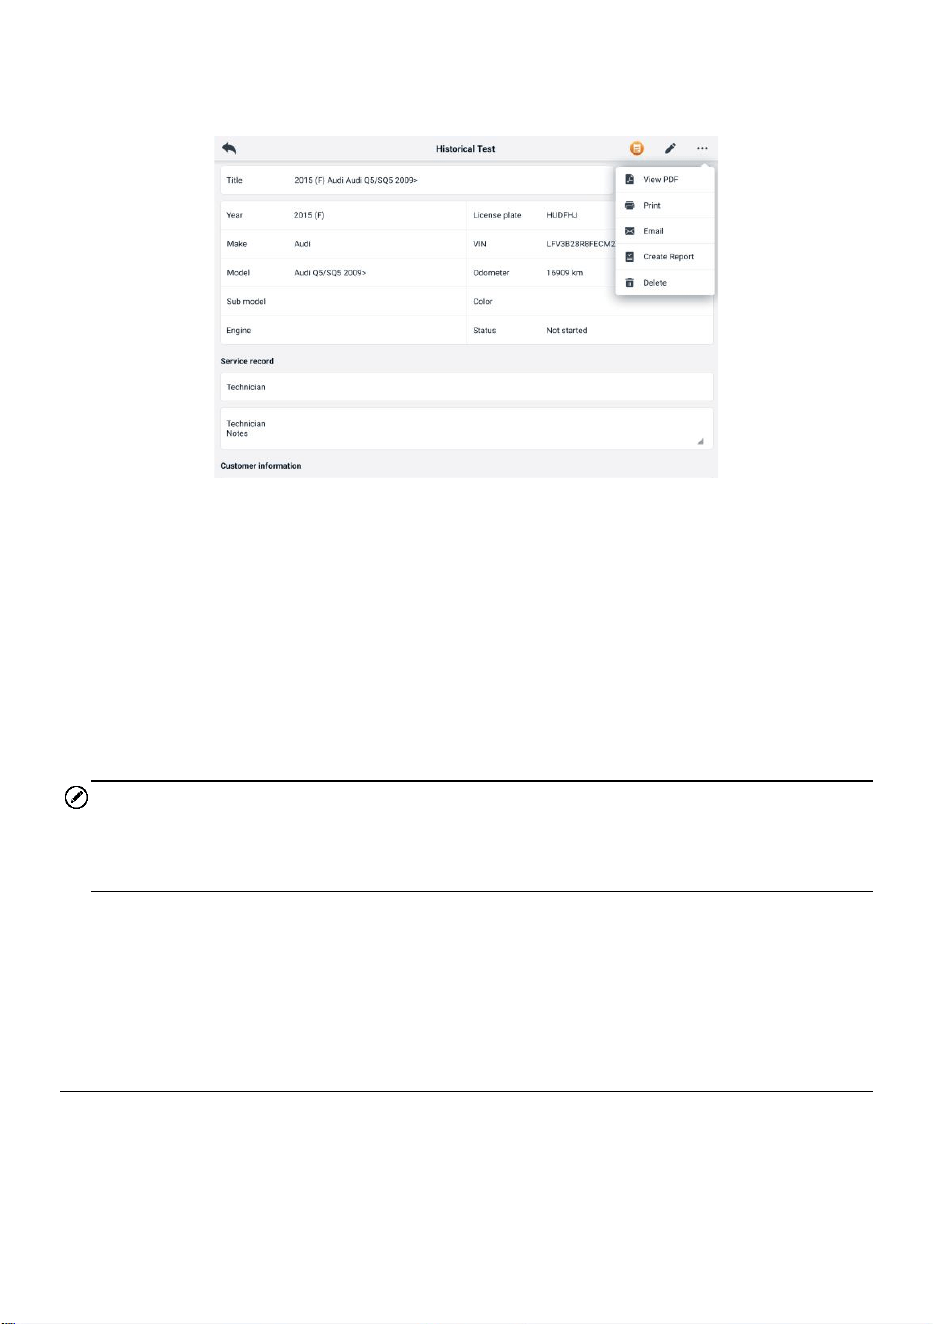
223
codes retrieved from the previous test sessions. Technician Notes will also appear if
present.
Figure 10-3 Historical Test Record Sheet
➢ To edit the Historical Test record
1. Tap Data Manager on the MaxiSys Job Menu.
2. Select Vehicle History.
3. Select the specific vehicle history record thumbnail from the main section. The
Historical Test record will display.
4. Tap Edit (a pen icon) to start editing.
5. Tap each item to input information or attach files or images.
NOTE
The vehicle VIN, license number, and customer account information are correlated by
default. Vehicle records will automatically be correlated using this vehicle and customer
identification.
6. Tap Add to Customer to correlate the Historical Test record sheet to an existing
customer account, or add a new associated account to be correlated with the
test vehicle record. See Customer for more information.
7. Tap Done to save the updated record, or tap Cancel to exit without saving.
10.2 Workshop Information
The Workshop Information form allows you to edit, input, and save the detailed workshop
information, such as shop name, address, phone number, and other remarks, which,
when printing vehicle diagnostic reports and other associated test file, will display as the
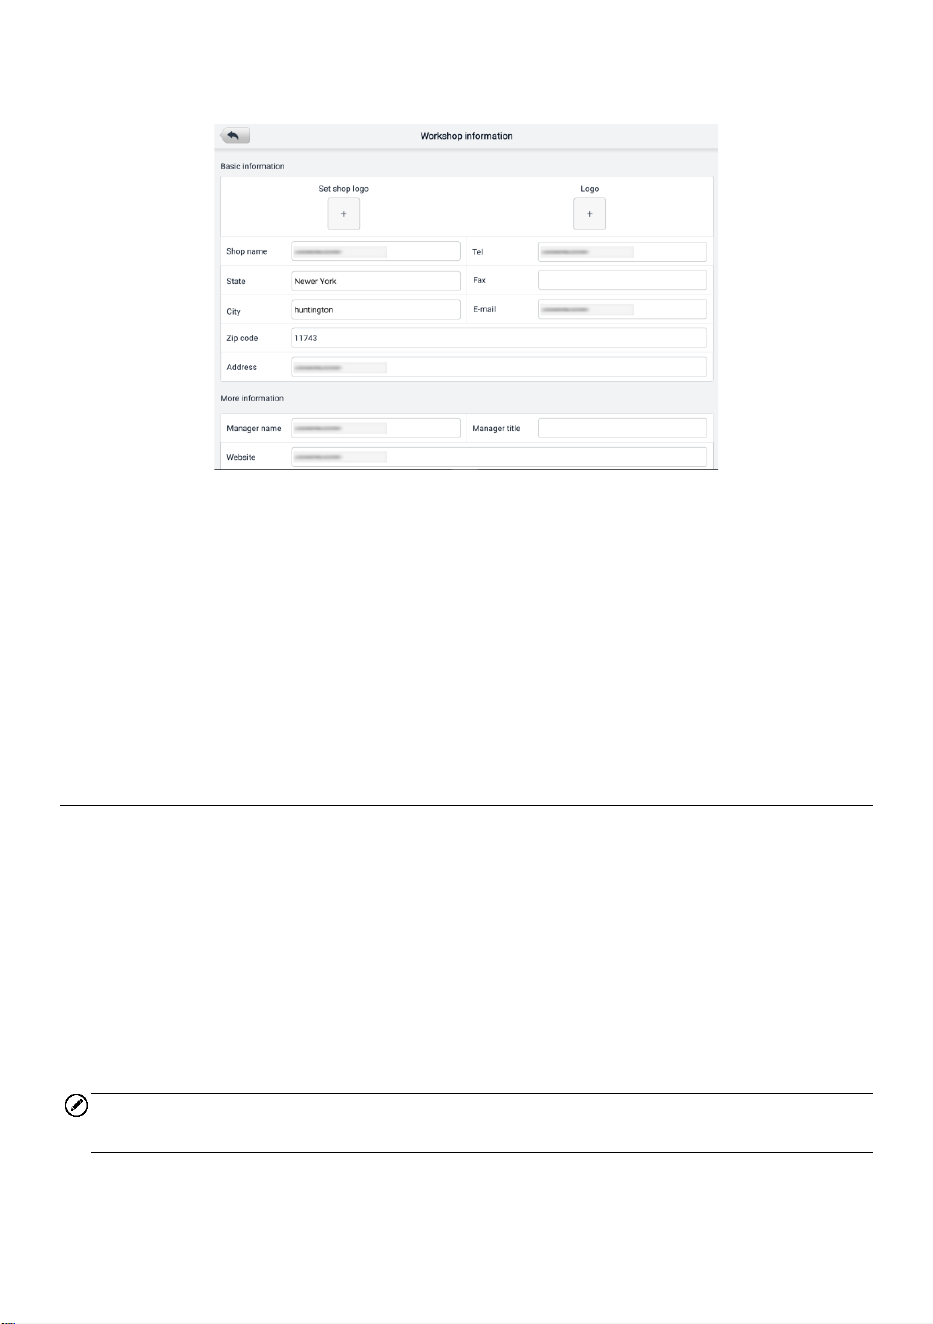
224
header of the printed documents.
Figure 10-4 Workshop Information Sheet
➢ To edit the Workshop Information sheet
1. Tap the Data Manager application on the MaxiSys Job Menu.
2. Select Workshop Information.
3. Tap on each field to input the appropriate information.
4. Tap Done to save the updated workshop information record, or tap Cancel to
exit without saving.
10.3 Customer
The Customer function allows you to create and edit customer accounts. It helps you to
save and organize all customer information accounts that are correlated with the
associated test vehicle history records.
➢ To create a customer account
1. Tap the Data Manager application on the MaxiSys Job Menu.
2. Select Customer.
3. Tap the Add a Customer button. An empty information form displays; tap each
field to input the appropriate information.
NOTE
The items that must be filled are indicated as required fields.
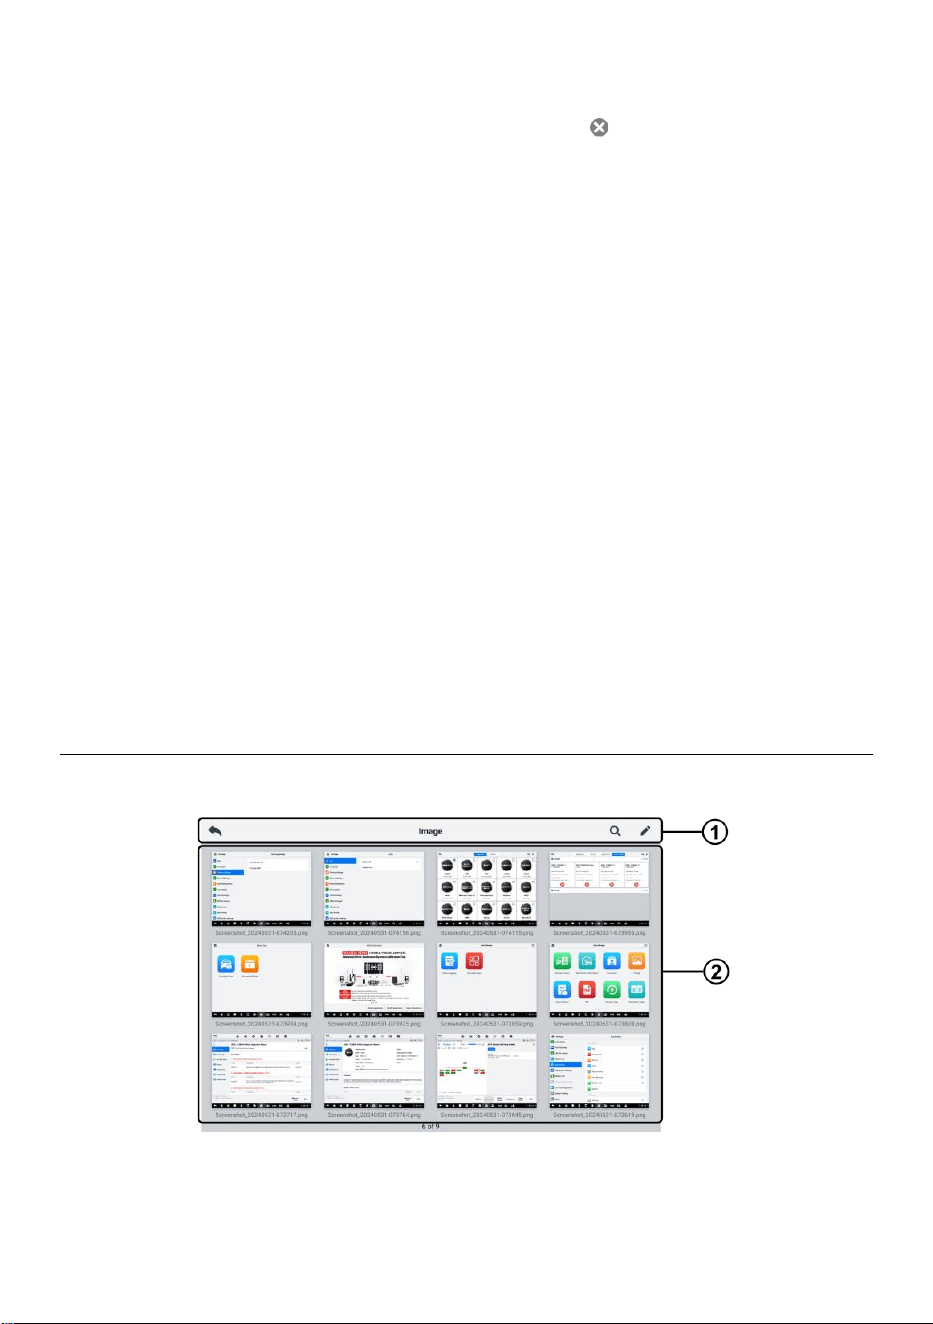
225
4. Some customers may have more than one vehicle for service; you can always
add new vehicle information to the account. Tap Add New Vehicle Information,
and then fill in the vehicle information. Tap the button to cancel.
5. Tap Complete to save the account, or tap Cancel to exit without saving.
➢ To edit a customer account
1. Tap Data Manager on the MaxiSys Job Menu.
2. Select Customer.
3. Select a customer account by tapping the corresponding name card. A
Customer Information record displays.
4. Tap the Edit icon on the top toolbar to start editing.
5. Tap on the input field to edit or amend information, and enter the updated
information.
6. Tap Complete to save the updated information, or tap Cancel to exit without
saving.
➢ To delete a customer account
1. Tap Data Manager on the MaxiSys Job Menu.
2. Select Customer.
3. Tap the Delete icon on the right of a customer account. A message displays.
4. Tap OK to confirm the command, and the account is deleted, or tap Cancel to
cancel the request.
10.4 Image
The Image section is a PNG database containing all captured screenshots.
Figure 10-5 Image Database Screen
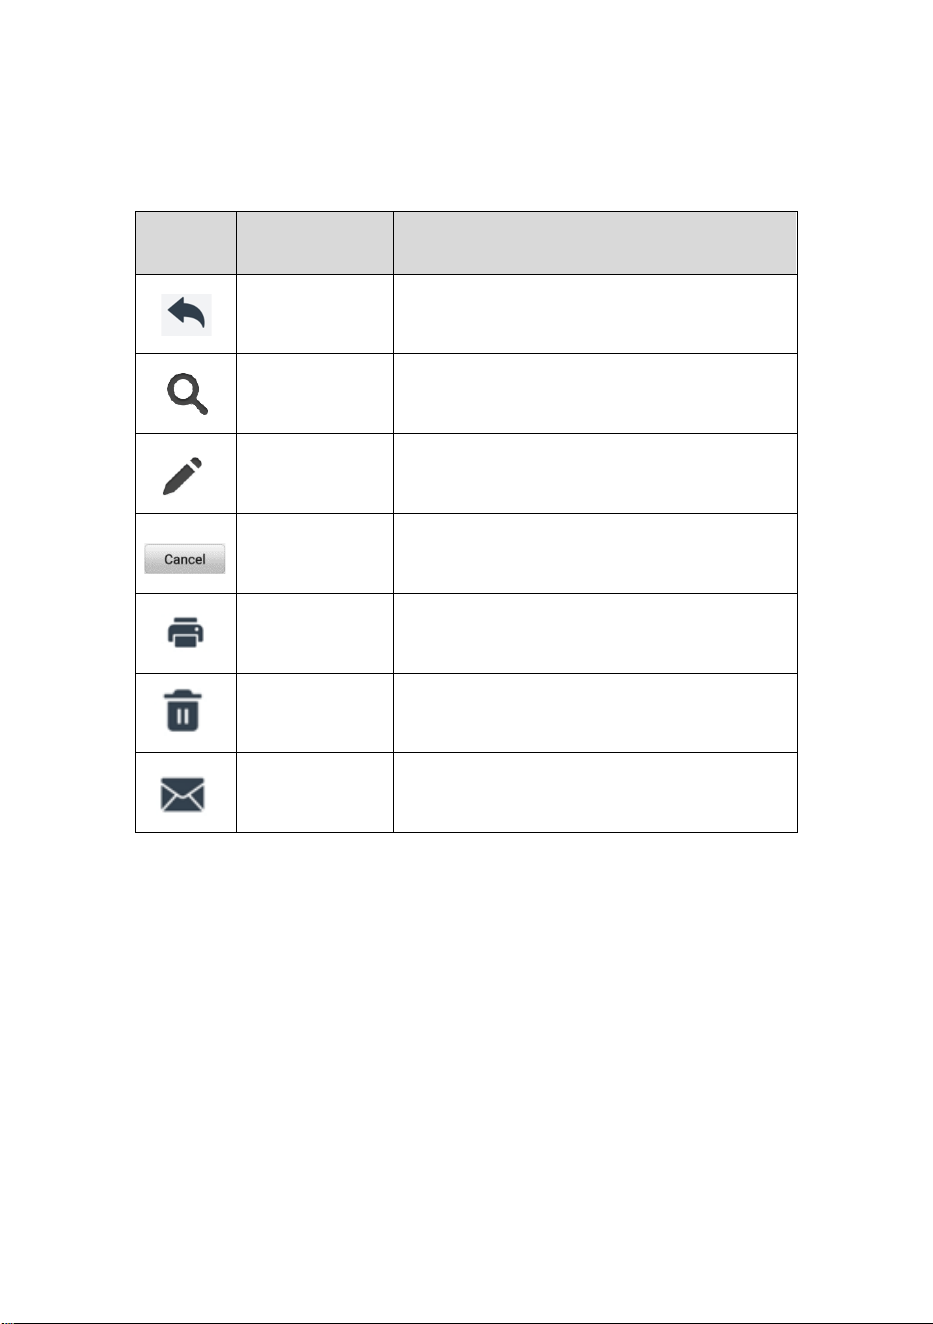
226
1. Toolbar Buttons — used to edit, print, or delete the image files. See the following
table for detailed information.
2. Main Section — displays the stored images.
Table 10-2 Toolbar Buttons in PNG Database
Button
Name
Description
Back
Returns to the previous screen.
Search
Tap to search the image by entering its
stored time.
Edit
Tap to display the editing toolbar to select,
delete, print, or email the image(s).
Cancel
Tap to close the editing toolbar or cancel file
search.
Print
Tap to print the selected image.
Delete
Tap to delete the selected image.
Email
Tap to send the selected image to an email.
➢ To edit/delete image(s)
1. Select Data Manager from the MaxiSys Job Menu.
2. Select Image to access the PNG database.
3. Tap Edit on the top-right corner of the window. The editing screen displays.
4. Select the image(s) you want to edit by tapping the check box at the bottom-
right corner of the image.
5. Tap the Delete icon to delete the selected images or delete all images. Tap the
Print icon to print the selected image(s). Tap the Email icon to send the selected
image(s) to an email.
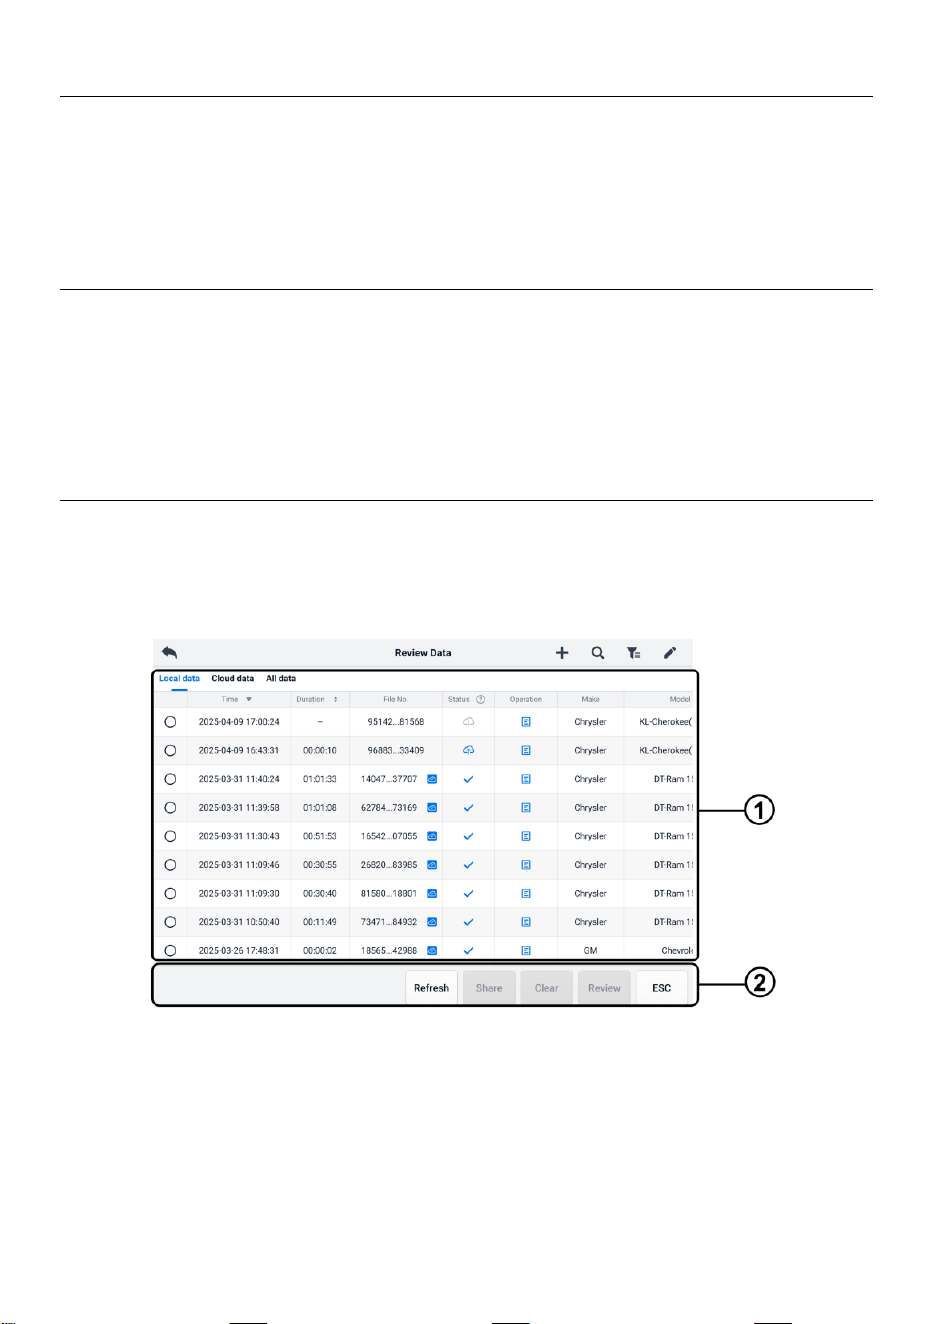
227
10.5 Cloud Report
This section displays the saved reports, which can be transferred to the Autel cloud
platform once a stable network connection is established. These reports can then be
viewed or shared with others. See Report Settings and Diagnostics Report Saving,
Viewing, and Sharing for further details.
10.6 PDF Files
The PDF files designated for local viewing are displayed in this section. Enter the PDF
database and select a file to access the saved information.
This section uses the standard Adobe Reader application for file viewing and editing.
Please refer to the associated Adobe Reader manual for more detailed instructions.
10.7 Review Data
The Review Data section allows you to play back or share the recorded data frames of
live data streams.
On the Review Data main screen, select a record file to play back.
Figure 10-6 Data Playback Screen
1. Main Section — displays the recorded data frames.
2. Navigation Toolbar — allows you to manipulate data playback.
Use the Navigation Toolbar buttons to play back the record data from frame to frame.
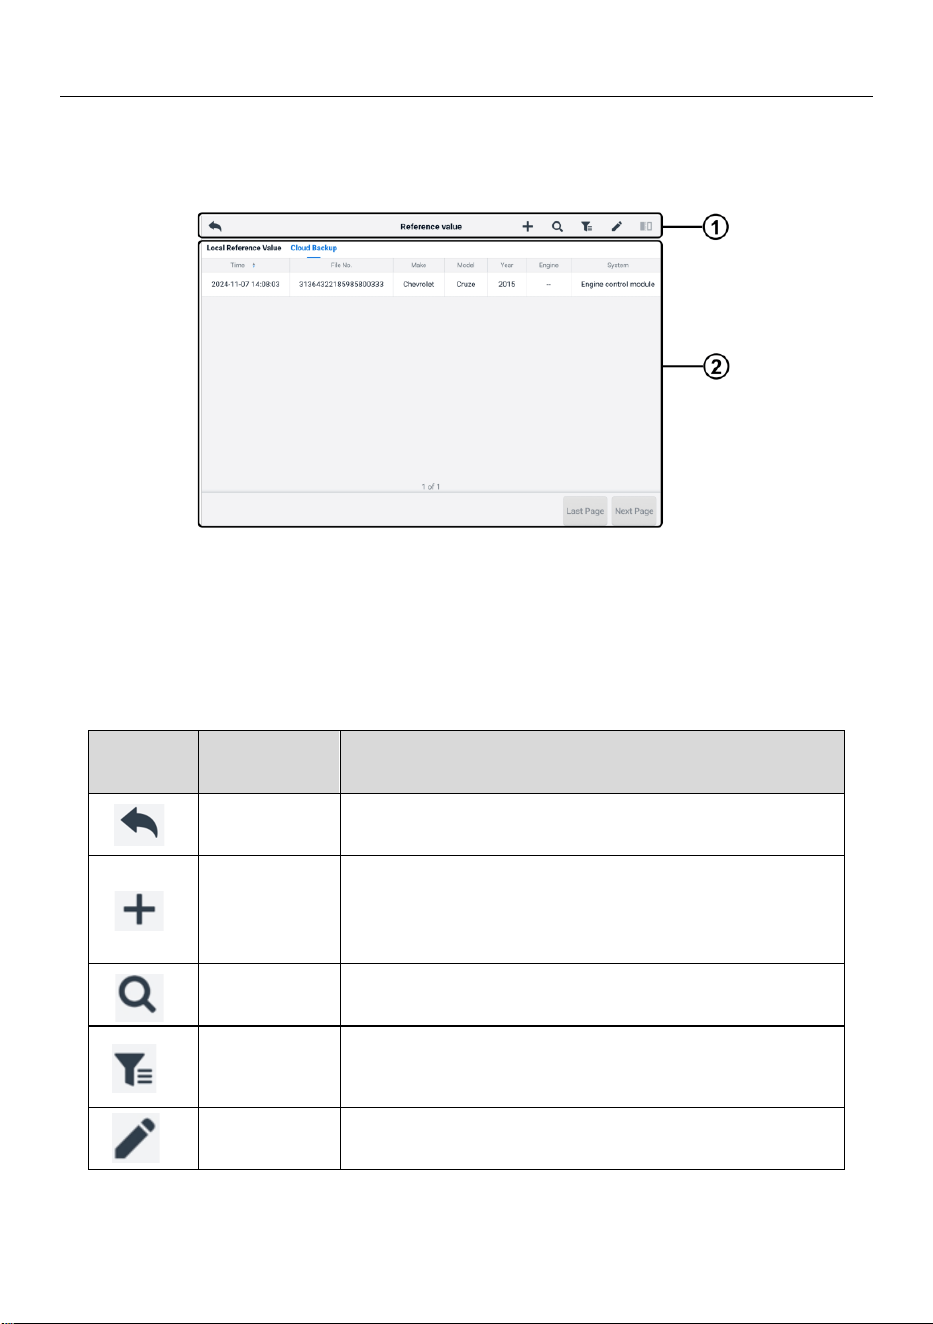
228
10.8 Reference Value
The Reference Value section allows you to view, search, edit, and share the data related
to the live data function reference values. Both local reference values and cloud backups
are included.
Figure 10-7 Reference Value Screen
1. Toolbar Buttons — see the following table for detailed information.
2. Main Section — displays the information including the time, file number, vehicle
make, year, engine, and system.
Table 10-3 Toolbar Buttons in Reference Value Screen
Button
Name
Description
Back
Returns to the previous screen.
Add
Adds a reference value file when scanning the
corresponding QR code after tapping the Share button
in the Reference Value list or just manually entering the
file number.
Search
Searches the reference value file once the file number
or MMY (Make, Model, Year) is entered.
Filter
Select the information such as the Make, Model, Year,
Engine, and System to locate the specified reference
value files.
Edit
Deletes the reference value files.

229
Button
Name
Description
Comparison
Select two reference value files and make a
comparison of the sampled maximum, minimum, and
average values. Only the local reference value files are
supported.
10.9 Data Logging
The Data Logging section allows you to launch the Support platform directly to view all
records of all feedback or no feedback data loggings on the diagnostic system. For more
details, see Data Logging.
10.10 Uninstall Apps
This section allows you to manage the software applications installed on the MaxiSys
diagnostics system. Selecting this section opens a managing screen, on which you can
check all available vehicle diagnostic applications.
Select the vehicle software you want to delete by tapping on the vehicle manufacturer
icon. The selected item will display a blue mark at the upper-right corner. Tap the Delete
button on the top toolbar to delete the software from the system database.
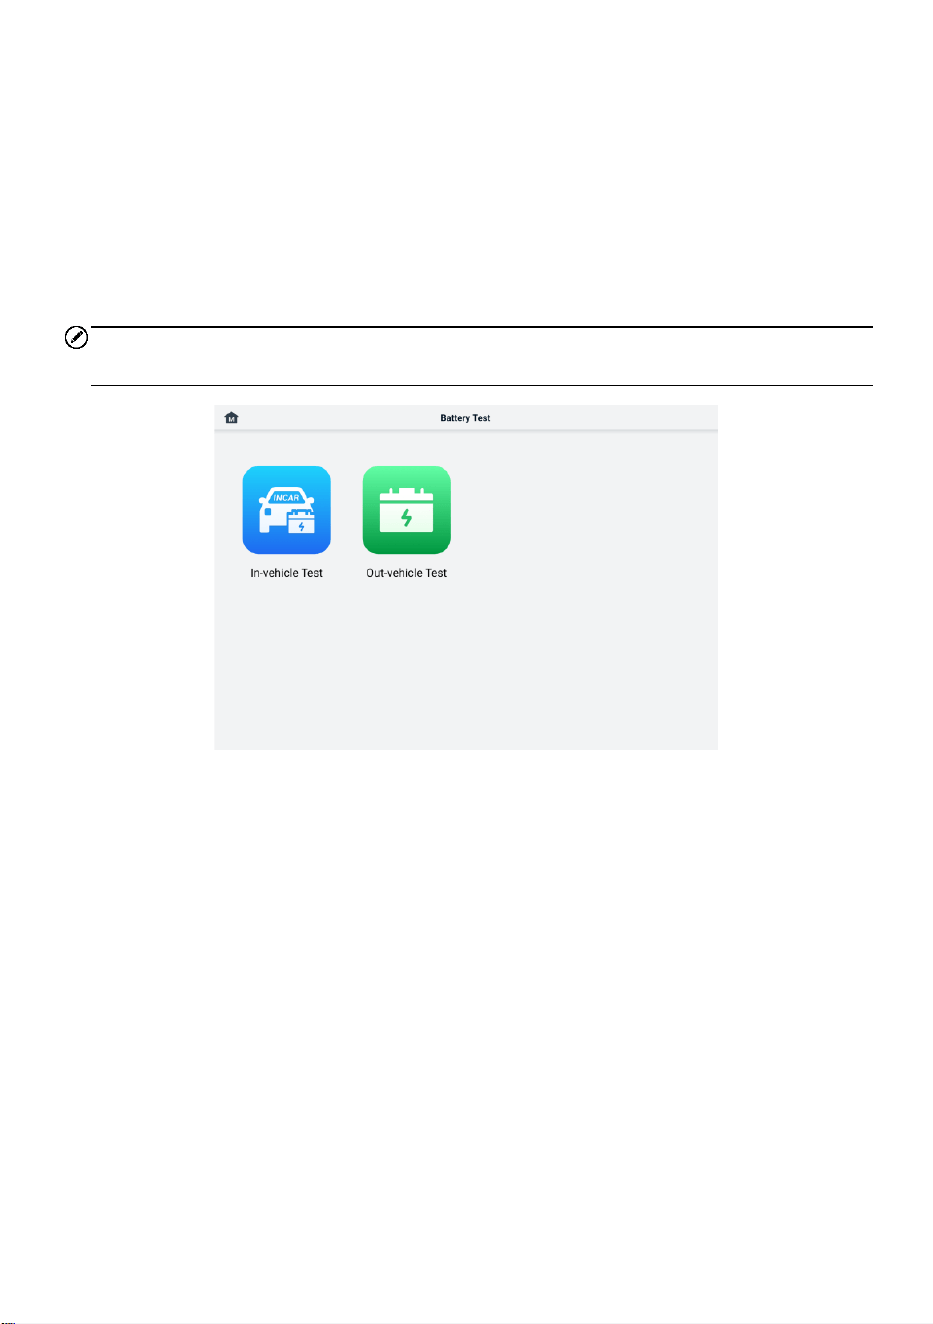
230
11 Battery Test
The Battery Test application allows the user to perform in-vehicle battery test and out-
vehicle battery test functions when the BT506 battery tester is connected to the MaxiSys
tablet and a battery. The BT506 battery tester enables technicians to view the health
status of the vehicle’s battery and electrical system.
NOTE
The BT506 battery tester needs to be purchased separately.
Figure 11-1 Battery Test Screen
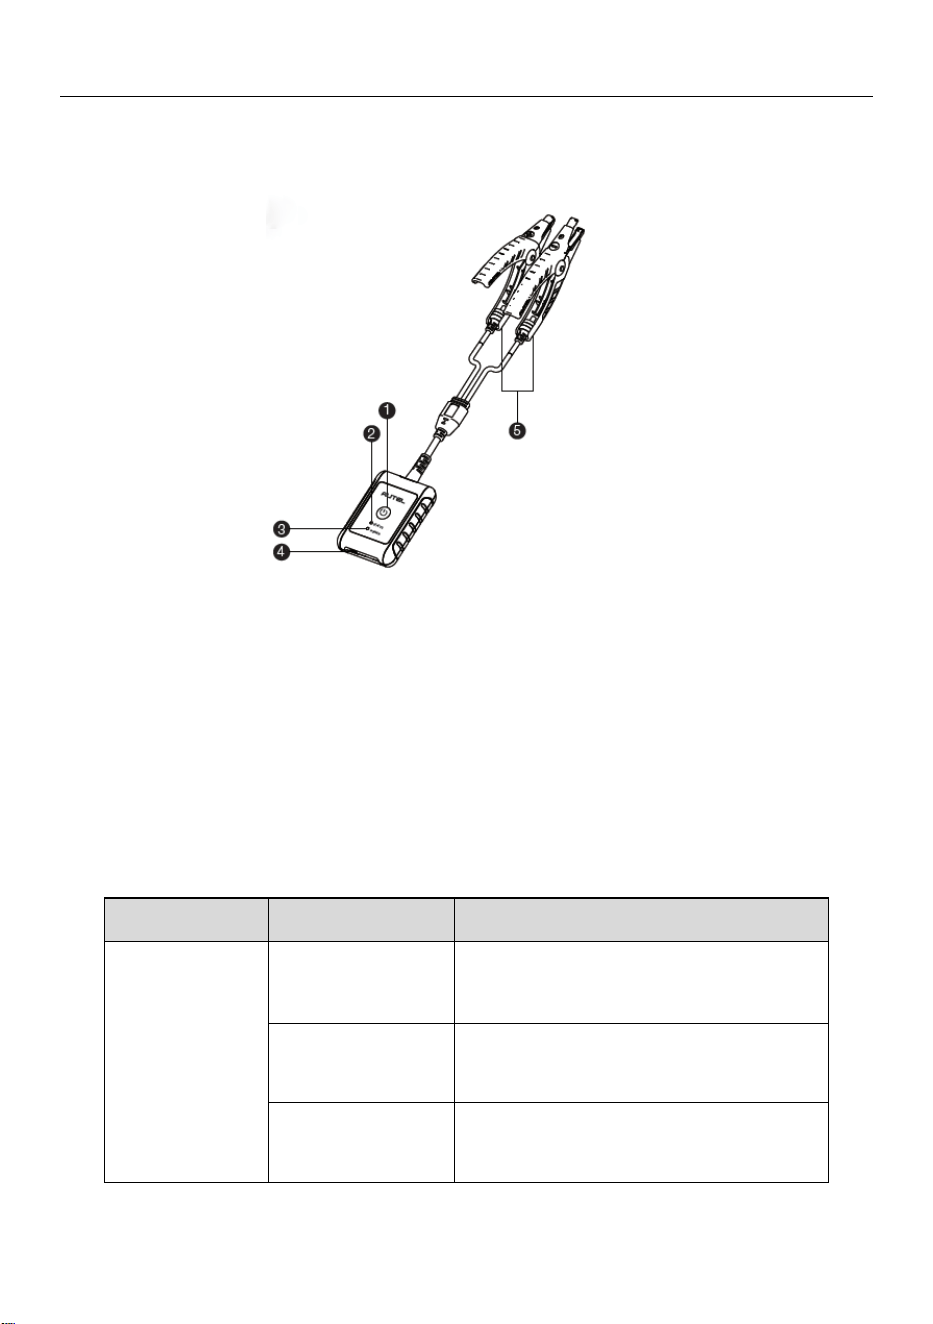
231
11.1 MaxiBAS BT506 Battery Tester
11.1.1 Function Description
Figure 11-2 MaxiBAS BT506 Tester
1. Power Button
2. Status LED
3. Power LED
4. USB Port
5. Battery Clamp Cable
Table 11-1 LED Description
LED
Color
Description
Status LED
Flashing Green
The tester is communicating via USB
cable.
Flashing Blue
The tester is communicating via
Bluetooth.
Flashing Red
Battery clamps are connected to the
wrong battery terminals.

232
LED
Color
Description
Power LED
Solid Green
The tester is powered on and the battery
is sufficiently charged.
Flashing Green
The tester is charging. (Turns solid
green when battery is fully charged.)
Solid Red
The device is in boot mode.
Flashing Red
The battery level is low. Please charge.
11.1.2 Power Sources
The MaxiBAS BT506 tester can receive power from the following sources:
⚫ Internal Battery Pack
⚫ AC/DC Power Supply
IMPORTANT
Do not charge the tester when the temperature is below 0 °C (32 °F) or above 45 °C
(113 °F).
11.1.2.1 Internal Battery Pack
The MaxiBAS BT506 battery tester can be powered with the internal rechargeable battery.
11.1.2.2 AC/DC Power Supply — Using Power Adapter
The MaxiBAS BT506 battery tester can be powered from an electrical outlet using the
AC/DC power adapter. The AC/DC power supply also charges the internal battery pack.
11.1.3 Technical Specifications
Table 11-2 Technical specifications
Item
Description
Connectivity
⚫ USB 2.0, Type C
⚫ Bluetooth 4.2
Input Voltage
5 V DC
Working Current
< 150 mA at 12 V DC

233
Item
Description
Internal Battery
3.7 V/800 mAh Lithium-ion Polymer battery
CCA Range
100 to 2000 A
Voltage Range
1.5 to 16 V
Working Temp.
-10 °C to 50 °C (14 °F to 122 °F)
Storage Temp.
-20 °C to 60 °C (-4 °F to 140 °F)
Dimension (L x W x H)
107 mm (4.21”) x 75 mm (2.95”) x 26 mm (1.02”) (clamp
cable not included)
Weight
320 g (0.7 lbs.)
11.2 Test Preparation
11.2.1 Inspect the Battery
Before starting a test, inspect the battery for:
⚫ Cracking, buckling or leaking. If you see any of these defects, replace the battery.
⚫ Corroded, loosen or damaged cables and connections. Repair or replace as needed.
⚫ Corrosion on the battery terminals, and dirt or acid on the case top. Clean the case
and terminals using a wire brush and a mixture of water and baking soda.
11.2.2 Connect the Battery Tester
➢ To pair with the MaxiSys tablet
1. Turn on both the MaxiSys tablet and the BT506 battery tester. Ensure that the
units are sufficiently charged before you begin.
2. Enable Bluetooth on the tablet by tapping VCMI Manager > BAS BT. Tap Scan
at the top-right corner. The device will start to search for available pairing units.
3. Depending on the type of battery tester, the device name may display as “Maxi”
suffixed with a serial number. Select the appropriate device for pairing.
4. When paired successfully, the connection status will read “Connected.”
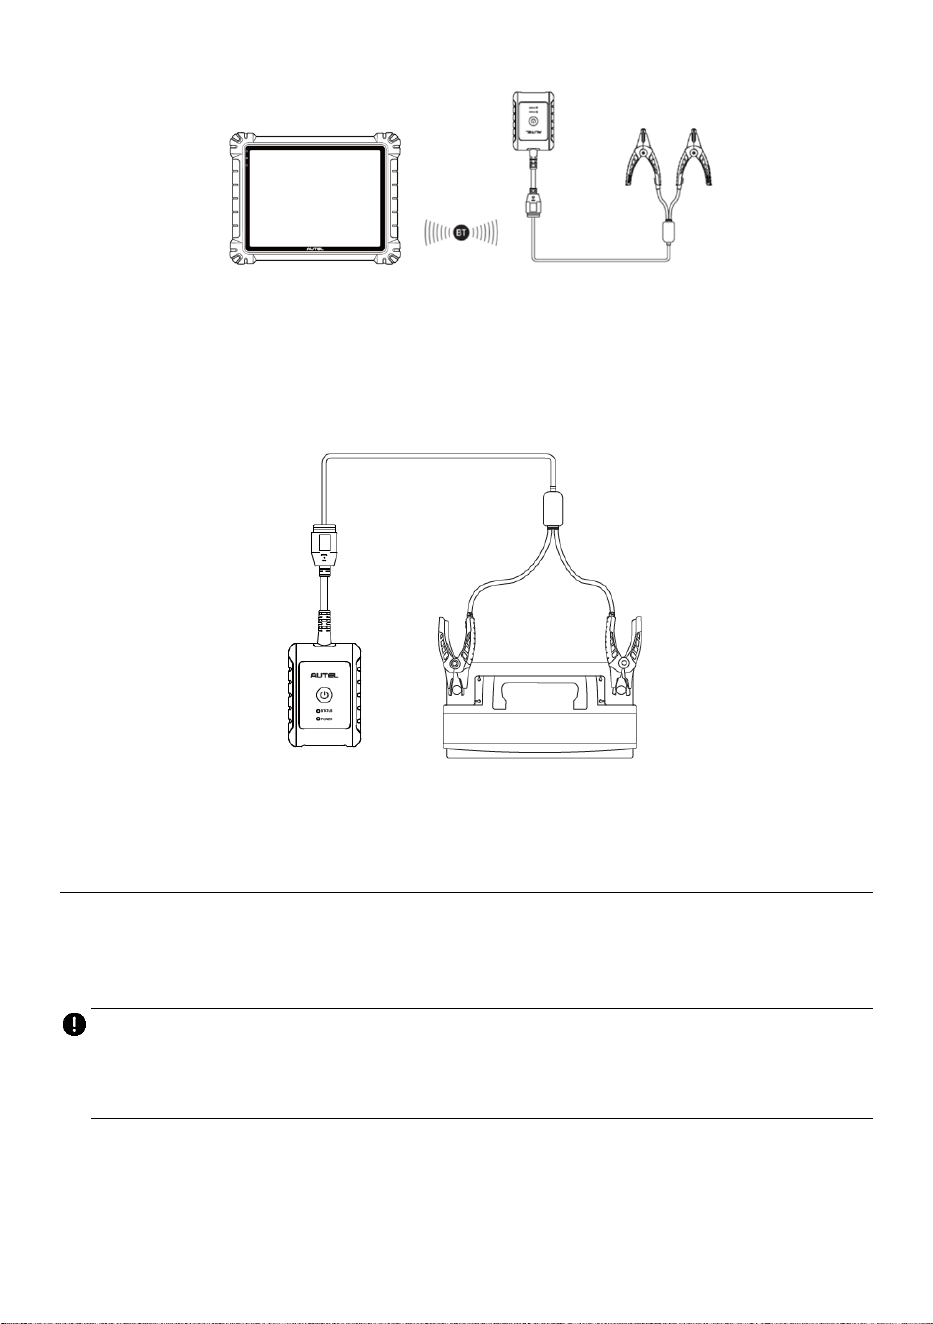
234
Figure 11-3 Battery Tester Connection Example 1
➢ To connect to a battery
1. Connect the red clamp to the positive (+) terminal of the battery.
2. Connect the black clamp to the negative (−) terminal of the battery.
Figure 11-4 Battery Tester Connection Example 2
11.3 In-vehicle Test
The In-vehicle Test is used for testing batteries that are installed in a vehicle. An in-vehicle
test includes the Battery Test, Starter Test, and Generator Test. These tests help
determine the health of the battery, the starter, and the generator.
IMPORTANT
A disclaimer will appear when first accessing any function on the Home screen. Please
read the end-user agreement and tap Accept to continue. If you tap Decline, you will not
be able to use the features properly.
Prior to testing any battery, ensure that the battery tester is paired with the tablet via
Bluetooth and connected properly to a battery.
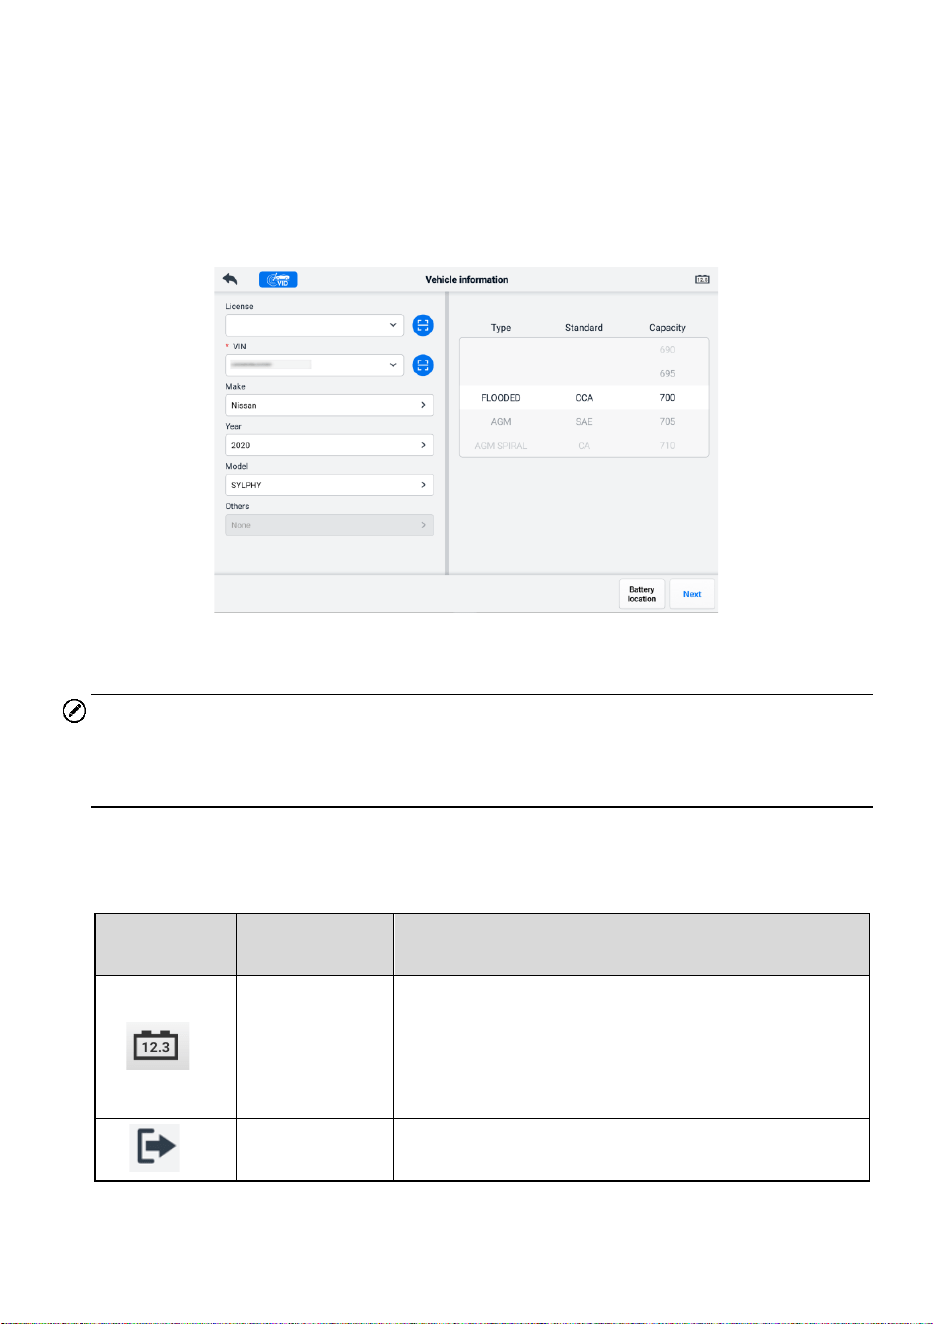
235
➢ To start the in-vehicle test
1. Tap Battery Test on the MaxiSys Job Menu. Select In-vehicle Test.
2. Confirm the vehicle information on the left side of the screen. Make sure the
VIN is entered.
3. Confirm your battery information, including voltage, type, standard, and capacity.
Tap Next to continue in-vehicle test functions.
Figure 11-5 Battery Information Screen
NOTE
In the Settings application, the Battery Test option allows you to change the requirement
for entering the VIN information. If the setting is enabled, supplying the VIN is no longer
mandatory.
Refer to the table below for a list of buttons that may appear when accessing the functions:
Table 11-3 Top Toolbar Buttons
Button
Name
Description
Battery
Connection
The value on the icon indicates the real-time
voltage of the tested battery. In the battery test, the
button will turn green if the battery is good;
otherwise, it will turn red.
Exit
Returns to the Job Menu.
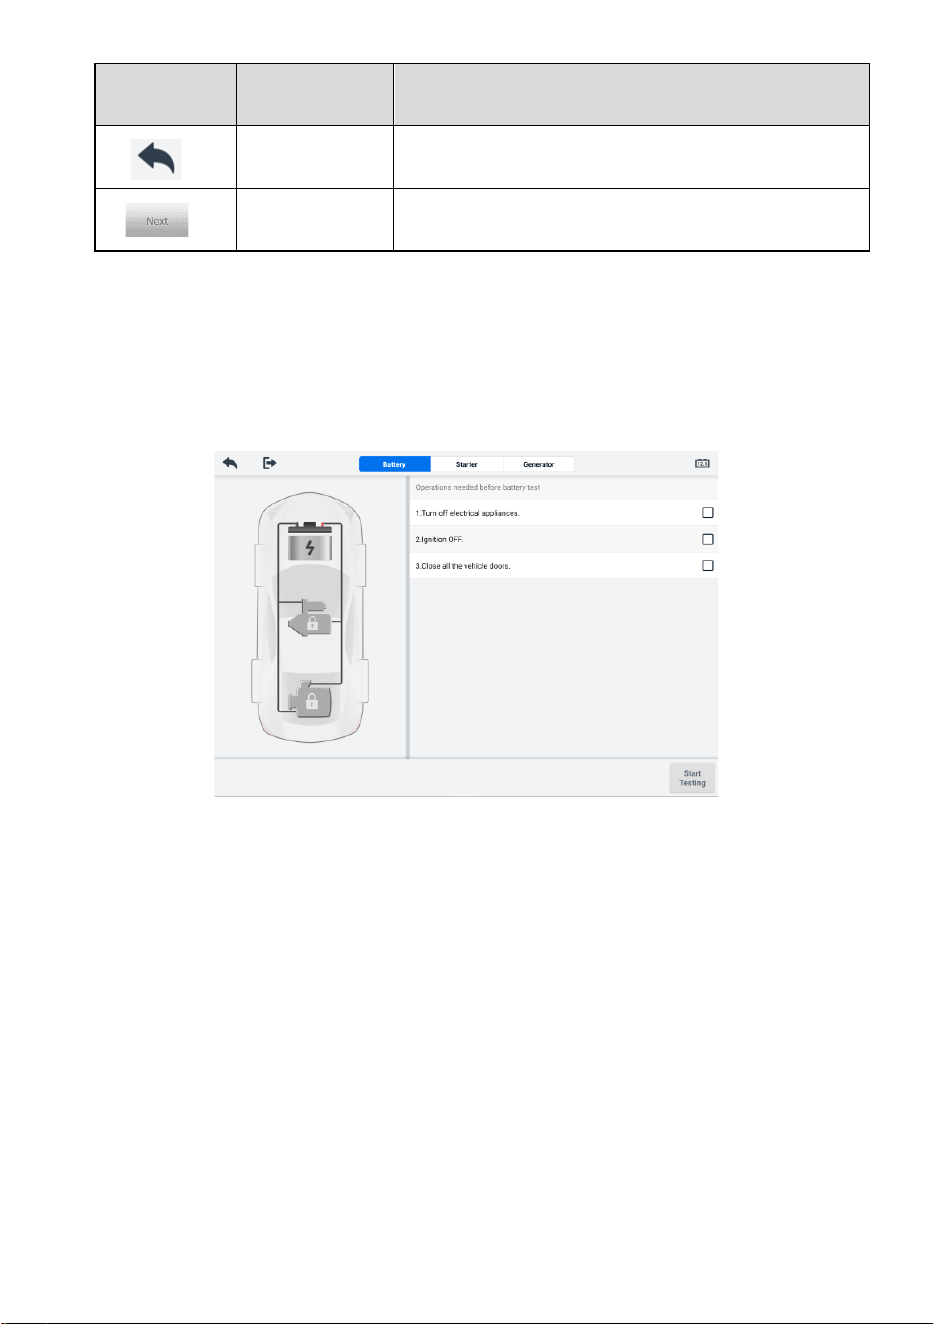
236
Button
Name
Description
Back
Returns to the previous screen.
Next
Tap to proceed.
11.3.1 Battery Test
1. Follow the on-screen instructions. Check the boxes once all required tasks are
completed, and tap Start Testing.
Figure 11-6 Battery Screen
2. Wait until the test is completed. The test results will be displayed on the tool.
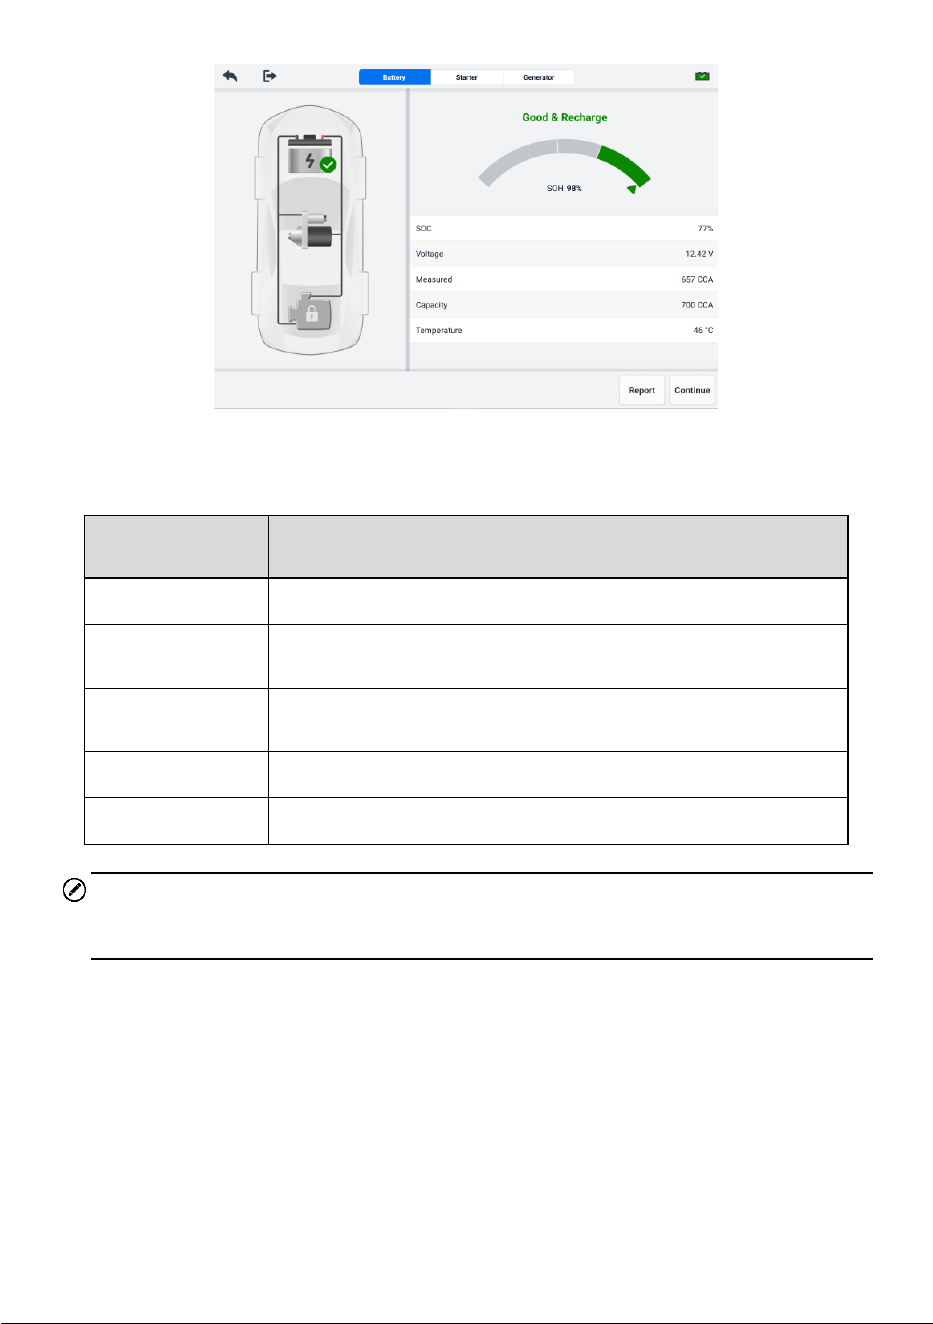
237
Figure 11-7 Battery Test Results Screen
Table 11-4 Test Results
Result
Description
Good Battery
Battery is good.
Good &
Recharge
Battery is good but insufficiently charged. Recharge the battery.
Charge & Retest
Battery requires charge to determine its condition.
Bad Cell
Replace the battery.
Replace Battery
Replace the battery.
NOTE
Please always complete the battery test before you proceed to the starter and generator
tests.
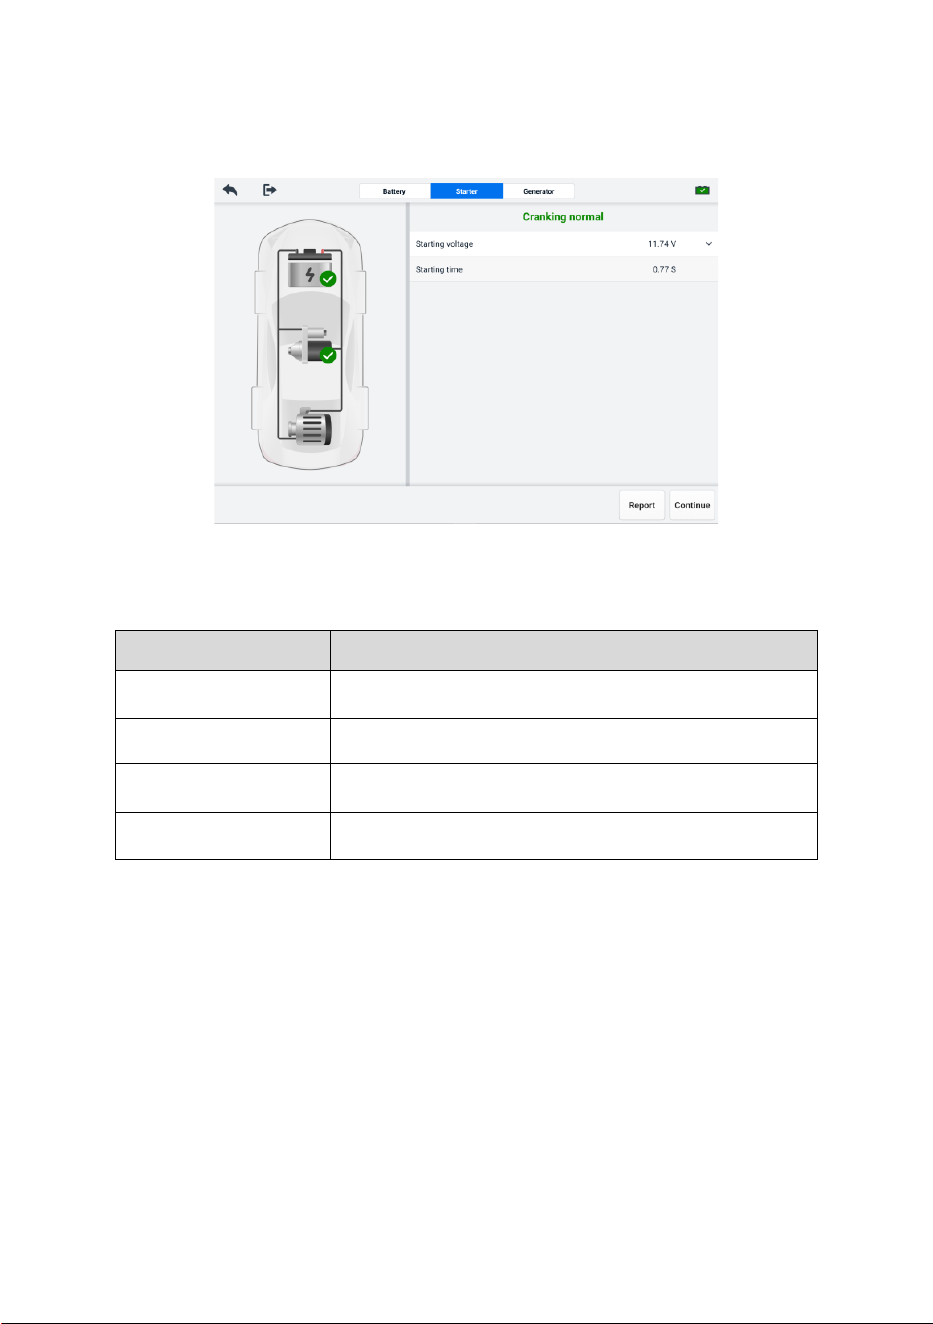
238
11.3.2 Starter Test
Follow the on-screen instructions to complete the test. Start the engine and let it idle. The
test results will appear as follows:
Figure 11-8 Starter Test Result Screen
Table 11-5 Starter Test Results
Result
Description
Cranking Normal
The starter is good.
Current Too Low
Low momentary discharge capacity.
Voltage Too Low
Low battery storage capacity.
Not Started
The starter is not detected for starting.
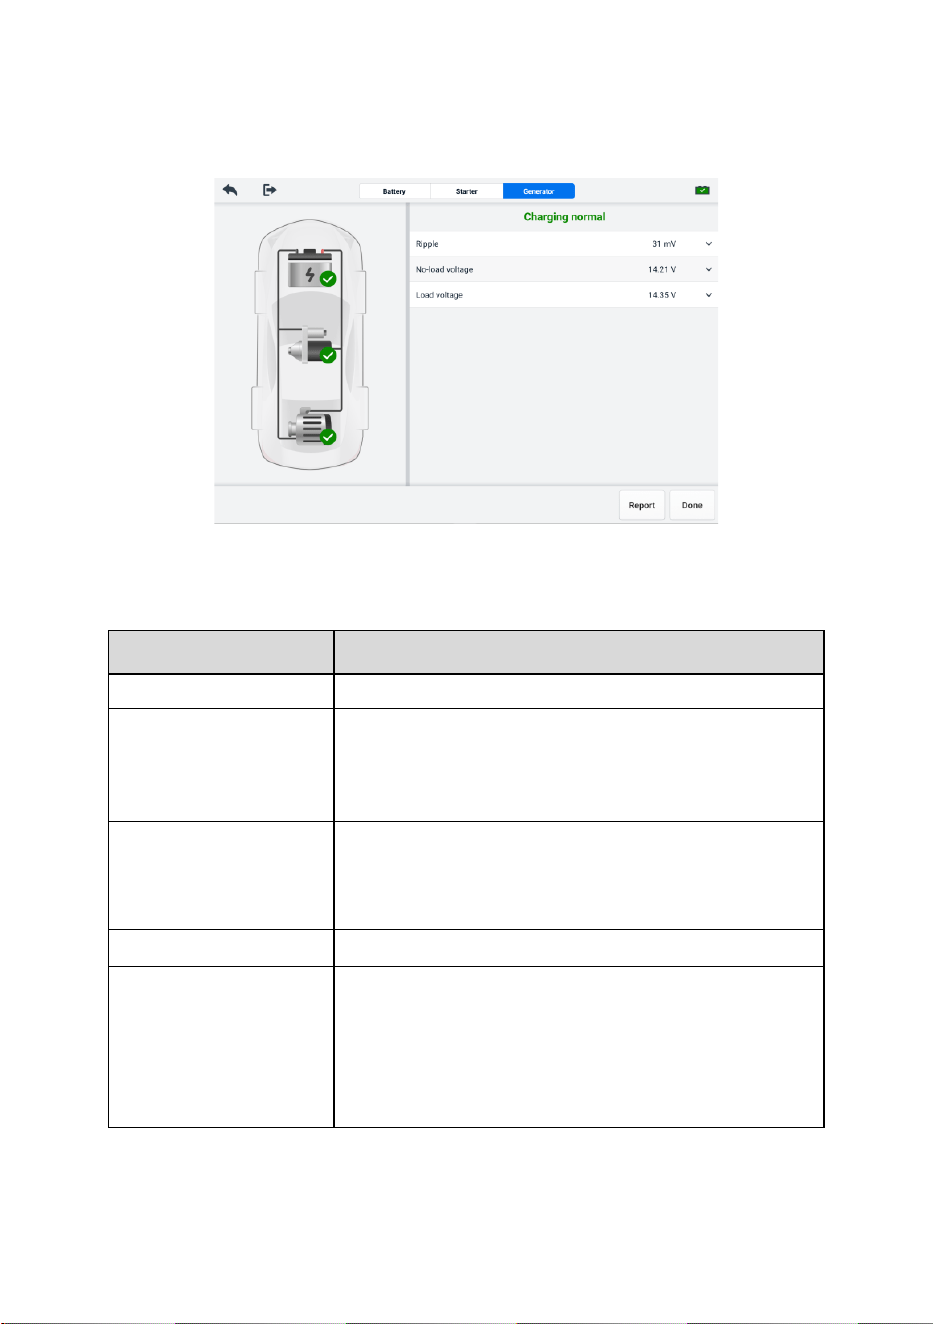
239
11.3.3 Generator Test
Follow the on-screen instructions to complete the test. The test results will appear as
follows:
Figure 11-9 Generator Test Results Screen
Table 11-6 Generator Test Results
Result
Description
Charging Normal
The generator is functioning normally.
Output Too Low
⚫ The belt linking the starter and the generator is
loose.
⚫ The cable linking the starter and battery is loose
or corroded.
Output Too High
⚫ The generator is not properly connected to the
ground.
⚫ The voltage adjuster is broken and needs
replacement.
Ripple Too Large
The commutation diode is broken.
No Output
⚫ The cable is loose.
⚫ Some vehicles with power management
systems do not provide path for charging due to
the sufficient load capacity of the battery.
⚫ The generator or the voltage adjuster is broken
and needs replacement.
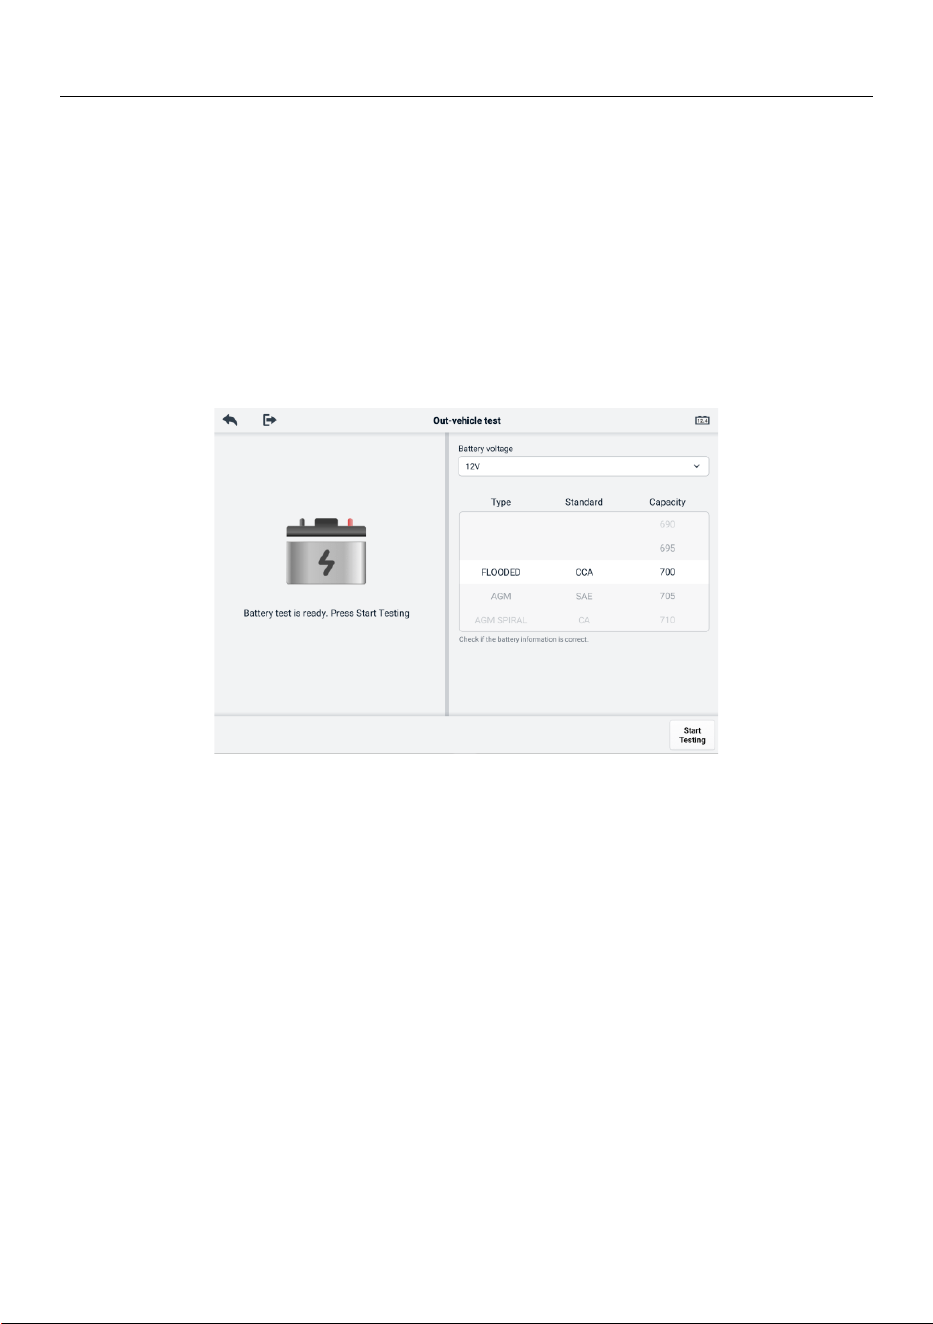
240
11.4 Out-vehicle Test
Out-vehicle Test is used to test the condition of batteries that are not connected to a
vehicle. This function aims to check the health status of the battery.
11.4.1 Test Procedure
➢ To start the out-vehicle test
1. Connect the tester clamps to the battery terminals.
2. Tap Battery Test on the MaxiSys Job Menu. Select Out-vehicle Test.
3. Select the appropriate battery type, rating standard, and CCA value. Tap Start
Testing to start the test.
Figure 11-10 Out-vehicle Test Screen
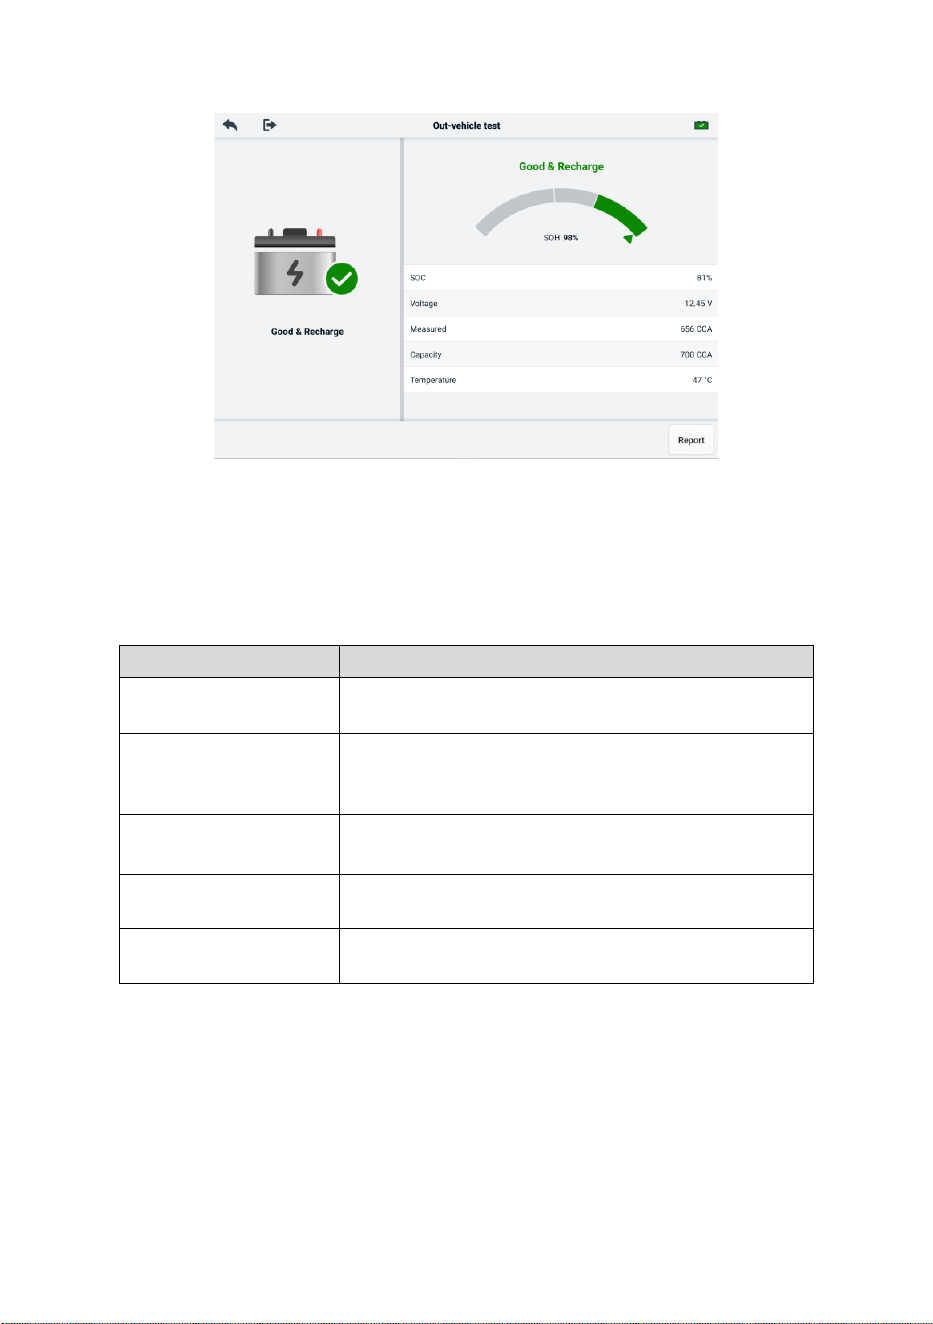
241
4. The test results will display in a few seconds.
Figure 11-11 Out-vehicle Test Results Screen
11.4.2 Test Results
Table 11-7 Out-Vehicle Test Results
Result
Description
Good Battery
Battery meets required standards.
Good & Recharge
Battery is good, but low on charge. Fully charge
the battery. Check for causes of low charge.
Charge & Retest
Battery requires charge to determine its condition.
Replace Battery
Battery fails to meet industry-accepted standards.
Bad Cell
Battery fails to meet industry-accepted standards.

242
12 Settings
Access the Settings menu to adjust default settings and view information about the
MaxiSys system. The following options are available for the MaxiSys system settings:
⚫ Unit
⚫ Language
⚫ Printing Settings
⚫ Report Settings
⚫ Push Notification
⚫ Auto Update
⚫ ADAS Settings
⚫ OBFCM Upload
⚫ Vehicle List
⚫ App Sorting
⚫ Battery Test
⚫ Country/Region Code
⚫ Laws and Regulations
⚫ System Settings
⚫ About
12.1 Unit
This option allows you to change the measurement unit for the diagnostic system.
➢ To adjust the unit setting
1. Tap the Settings application on the MaxiSys Job Menu.
2. Tap the Unit option on the left column.
3. Select the appropriate measurement unit. A check mark will display to the right
of the selected unit.
4. Tap the Home button on the top-left corner to return to the MaxiSys Job Menu,
or select another settings option for system setup.

243
12.2 Language
This option allows you to adjust the display language for the MaxiSys system.
➢ To adjust the language setting
1. Tap the Settings application on the MaxiSys Job Menu.
2. Tap the Language option on the left column.
3. Select the appropriate language. A check mark will display to the right of the
selected language.
4. Tap the Home button on the top-left corner to return to the MaxiSys Job Menu,
or select another settings option for system setup.
12.3 Print Settings
This option allows you to print from the tablet to a network printer via a computer.
➢ To setup the printer connection
1. Tap Settings on the MaxiSys Job Menu.
2. Tap Printing Settings on the left column.
3. Tap Print via PC-link or Print via Wi-Fi to activate the printing function, which
enables the device to send files to the printer through the PC via Wi-Fi or
Ethernet connection.
4. Tap the Home button on the top-left corner to return to the MaxiSys Job Menu,
or select another settings option for system setup.
12.3.1 Printing Operations
➢ To install the MaxiSys Printer driver
1. Download Maxi PC Suite from www.autel.com > Support > Downloads > Autel
Update Tools, and install it to a Windows-based PC.
2. Double click on Setup.exe.
3. Select the installation language and the wizard will load.
4. Follow the instructions on the screen and Click on Next to continue.
5. Click Install and the printer driver program will be installed onto the computer.
6. Click Finish to complete the installation.

244
NOTE
The MaxiSys printer runs automatically after the installation. The PC, printer and the
tablet must be connected to the same network.
This section describes how to receive file from the MaxiSys tablet and perform printing
through the PC.
NOTE
1. Make sure the tablet is connected to the same network with your computer, either
via Wi-Fi or LAN, before printing.
2. Make sure the computer installed with the Printing Services program is connected
to a printer.
➢ To perform printing through the computer
1. Ensure the tablet is connected to the computer network, either via Wi-Fi or LAN,
before printing.
2. Run the PC Link program on the computer.
3. Select the MaxiSys Printer tab.
4. Tap the Print button in the tablet top toolbar. A document will be sent to the
computer.
⚫ If the Auto Print option in the MaxiSys Printer is selected, the MaxiSys
Printer will print the received document automatically.
⚫ If the Auto Print option is not selected, click Open PDF File button to view
files. Select the file(s) to print and click Print.
NOTE
To confirm that the printer is functioning normally, you can click Test Print in the PC Link
program to test.
12.4 Report Settings
The options, such as Scan Report, Report Upload to Cloud, Insurance Information, and
OBD Ready Status, are available in the Report Settings function. Toggle the ON/OFF
button to enable/disable the required function. If the button displays blue, it indicates the
selected function is enabled. If the button displays gray, it indicates the selected function
is disabled.
➢ To enable the Report Upload to Cloud function
1. Tap the Settings application on the MaxiSys Job Menu.
2. Tap the Report Settings option on the left column.

245
3. Locate the Report upload to Cloud function, and then toggle the button to ON.
Select Manual or Automatic based on the actual situation.
4. Tap the Home button on the top-left corner to return to the MaxiSys Job Menu,
or select another settings option for system setup.
The OBD Ready Status is disabled by default. The OBD ready status will be automatically
read in the Auto Scan function once the OBD Ready Status button is enabled.
12.5 Push Notification
This option allows you to manage notifications. The Notification Preference is turned on
by default and cannot be turned off by users so that certain system notifications such as
system security warnings won’t be blocked. Internet access is required for receiving on-
line messages.
➢ To manage other notifications
1. Tap Settings on the MaxiSys Job Menu.
2. Tap Push Notifications on the left column.
3. Tap the button on the right to open a drop-down list.
4. There are four options: Enable all notifications, Limit to 3 notifications or less
per week, Limit to 1 notification per week, and Disable all notifications. Select
whichever you want.
5. Tap Home on the top-left corner to return to the MaxiSys Job Menu. Or select
another settings option for the system setup.
NOTE
1. Notifications will display on the screen. Slide the screen from top to check the
received messages. If the message list covers more than one screen, slide the list
up or down to view them.
2. Tapping a specific message launches the corresponding application. For example,
if you tap on an Update notification, the Update application will be launched.
12.6 Auto Update
The Auto Update allows the tool to automatically update the OS, the MaxiSys system,
and the vehicle coverage software. Each can be configured to update automatically at a
specified time. Tap the ON/OFF button to enable/disable the desired automatic update
time.
➢ To set auto system or vehicle update
1. Tap the Settings application on the MaxiSys Job Menu.

246
2. Tap the Auto Update option on the left column. The three auto update items
will display on the right of the screen.
3. Select the update type to schedule. Toggle the button to ON.
4. Tap on the time to set the time of the day for updating. If the update time is set
and the device is connected to the Internet, the selected software will be
automatically updated at the configured time.
12.7 OBFCM Upload
This option allows you to upload the carbon dioxide emissions-related data (OBFCM data)
of passenger vehicles and light commercial vehicles to the monitoring background of the
European country.
Toggle the button to ON to enable this function, and then select the corresponding
country and fill in the OBFCM monitoring server address. When the setting is completed,
select the EOBD software in the Diagnostics application. After reading the OBFCM data
in Vehicle information, the data can be sent to the monitoring server in the corresponding
country.
NOTE
Do not enable this function in non-European countries or when the OBFCM monitoring
data is not needed to submit.
12.8 ADAS Settings
➢ To activate the MaxiSys ADAS calibration
1. Confirm the registered MaxiSys tablet has available updates.
2. Select Settings on the MaxiSys Job Menu.
3. Tap on ADAS Settings.
4. Scan the QR code on the ADAS frame to bind, or manually input frame serial
number when QR code is not available.
5. Enter the validation code from the ADAS Calibration Card.
6. The system will be reset and the Job Menu will display once the registration has
been completed.
12.9 Vehicle List
This option allows you to sort the vehicles either by alphabetical order or by frequency of
use.

247
➢ To adjust the vehicle list setting
1. Tap the Settings application on the MaxiSys Job Menu.
2. Tap Vehicle List on the left column.
3. Select the required sort type. A check mark will display to the right of the
selected item.
4. Tap the Home button in the top-left corner to return to the MaxiSys Job Menu,
or select another settings option for system setup.
12.10 App Sorting
This option allows you to list the applications by want you need on each screen. Drag the
apps up and down to keep frequently-used applications on the first or second screen of
the MaxiSys Job Menu.
12.11 Battery Test
This function allows you to change the requirement for entering the VIN information. If
the setting is enabled, supplying the VIN is no longer mandatory.
12.12 Country/Region Code
This function provides Wi-Fi channel options for different country regions to ensure
reliable and stable Wi-Fi communication. Please connect the tablet with VCMI2 before
making adjustment.
➢ To adjust the country code setting
1. Tap the Settings application on the MaxiSys Job Menu.
2. Tap the Country/Region Code option on the left column.
3. Select the appropriate country/region. A confirmation message will display.
4. Tap the Home button on the top-left corner to return to the MaxiSys Job Menu,
or select another settings option for the system setup.
NOTE
If the tablet cannot find the VCMI2 via Wi-Fi connection after setting the country code,
please connect the VCMI2 with the tablet via USB cable or Bluetooth connection to retry.

248
12.13 Laws and Regulations
This function provides the law and regulation information, including the end-user license
agreement, disclaimer for products, and privacy policy. Please read these laws and
regulations carefully before using this product.
12.14 System Settings
This function provides you with direct access to the Android system settings interface,
where you can adjust various system settings for the Android system platform. Regarding
wireless and networks settings, various device settings such as sound and display, as
well as system security settings, and check related information about the Android system.
Refer to Android documentation for additional information.
12.15 About
The About function provides information of the MaxiSys diagnostic device including the
product name, version, hardware, and serial number.
➢ To check the MaxiSys product information in About
1. Tap the Settings application on the MaxiSys Job Menu.
2. Tap the About option on the left column. The product information screen
displays on the right.
3. Tap the Home button on the top-left corner to return to the MaxiSys Job Menu,
or select another settings option for system setup.

249
13 Updates
The Update application on the tablet downloads the latest version of the software. The
updates improve the MaxiSys applications’ capabilities, typically by adding new tests,
new model coverage or by adding new or enhanced applications.
The tablet automatically searches for available updates for all of the MaxiSys software
when it is connected to the Internet. Any updates that are found can be downloaded and
installed on the device.
NOTE
Ensure the tablet is registered before utilizing the Update application. See Autel User
Center for a comprehensive registration guide.
➢ To update the software
1. Power up the tablet, and ensure that it is connected to a power source and has
a steady Internet connection.
2. Tap the Update application button from the MaxiSys Job Menu. The Update
application screen displays.
3. On the Update screen, tap the Get button to update the specific item(s) or tap
the Update All button to update all available items.
4. Tap More to view the details of all the available updates. You can also tap the
Get or Update All button for update.
5. During the update, tap the icon to suspend the updating process. Tap the
icon to resume the update and the process will continue from the pause point.
6. When the updating process is completed, the software will be installed
automatically. The new version will replace the older version.
NOTE
For the account management, proceed to the Member Center tab.
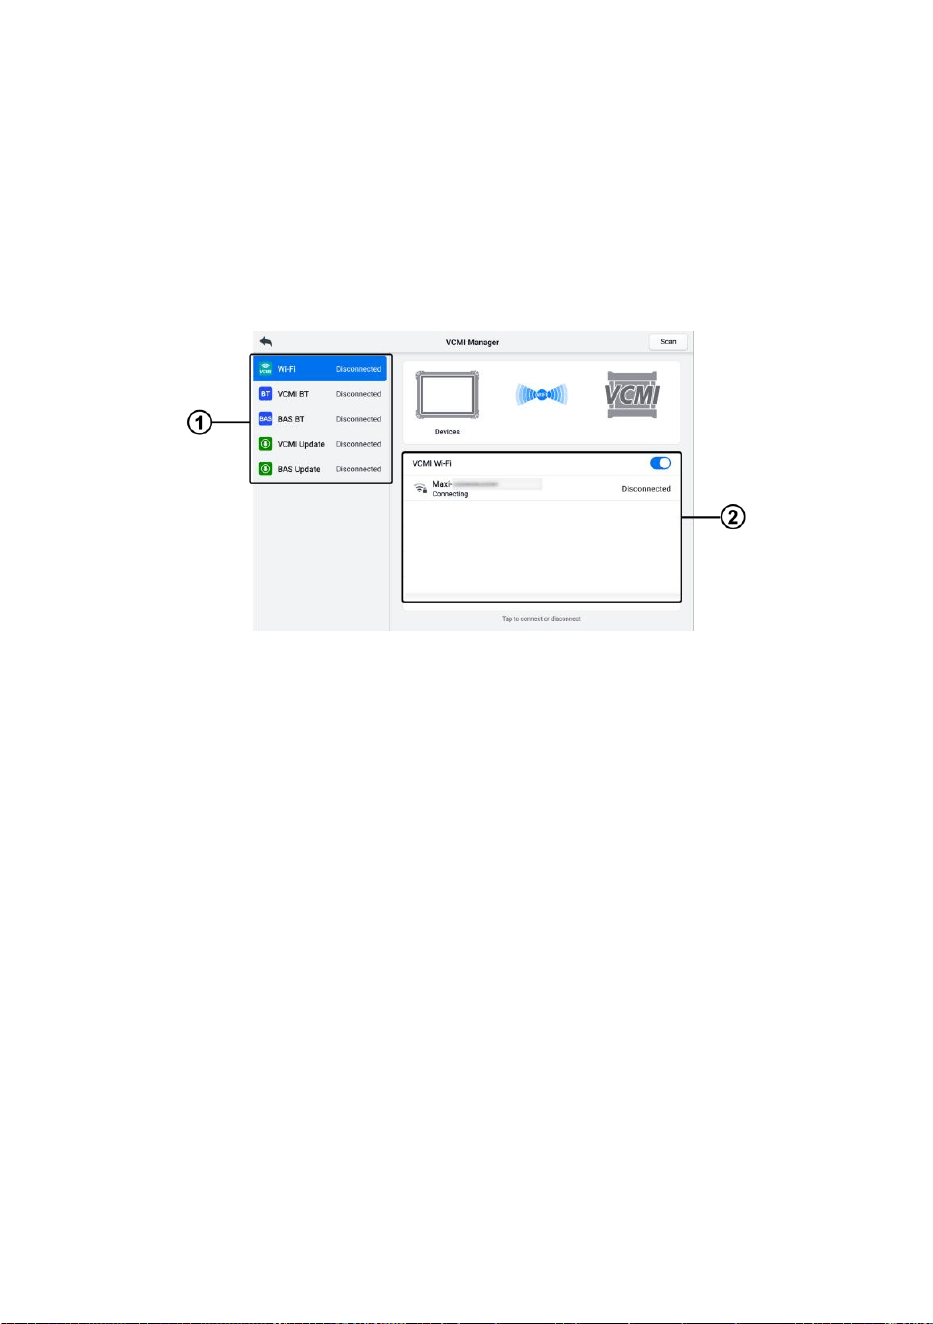
250
14 VCMI Manager
The VCMI Manager is an application for connecting the MaxiSys tablet with VCMI2. This
application allows you to pair the tablet with the VCMI2 and to check the communication
status. You can either build the connection via Bluetooth or Wi-Fi, of which the latter is
more stable and faster in speed for module operation.
Figure 14-1 VCMI Manager Screen
1. Connection Mode: five connection modes are available. The connection status
displays adjacent to each mode.
⚫ Wi-Fi Connection — when connected to a wireless device, the connection state
displays as “Connected.” Otherwise, it displays as “Disconnected.”
⚫ VCMI Bluetooth Pairing — when the VCMI2 is paired to the tablet via Bluetooth,
the connection status displays as “Connected.” Otherwise, it displays as
“Disconnected.”
⚫ BAS Bluetooth Pairing— when paired to a battery tester via Bluetooth, the
connection status displays as “Connected.” Otherwise, it displays as
“Disconnected.”
⚫ VCMI Update — connects the VCMI2 to the diagnostic tablet, then updates the
VCMI2 firmware through the tablet.
⚫ BAS Update — connects the battery tester to the diagnostic tablet, then updates
the battery tester’s firmware through the tablet.

251
2. Settings: this section allows you to manage wireless pairing or set up network
connection. Toggle the ON/OFF button to ON. The available devices for pairing will
display. Tap the needed one to start pairing.
14.1 Wi-Fi Connection
Wi-Fi Connection is an advanced function for quick linkage with VCMI2. Since Wi-Fi
connection supports 5G, the MaxiSys tablet and VCMI2 share a faster and more stable
connection when using this communication method.
The Wi-Fi connection is an ideal communication mode when using the oscilloscope
measurement function. See Oscilloscope for details.
➢ To connect the VCMI2 to the tablet via Wi-Fi
1. Power on the tablet.
2. Connect the 26-pin end of the main cable to the VCMI2's vehicle data connector.
3. Connect the 16-pin end of the main cable to the vehicle data link connector
(DLC).
4. Tap VCMI Manager on the MaxiSys Job Menu of the tablet.
5. Select Wi-Fi from the connection mode list.
6. Swipe the Wi-Fi toggle button to ON. Tap Scan at the top-right corner. The
device will start to search for available units.
7. Depending on the VCMI2 type you use, the device name may display as “Maxi”
suffixed with a serial number. Select the appropriate device for connection.
8. When the connection is established, the connection status displays as
“Connected”.
9. The VCMI2 button on the system navigation bar at the bottom of the screen
displays a green Wi-Fi icon, indicating the tablet is connected to the VCMI2.
10. Tap the connected device again to disconnect the device.
NOTE
To ensure a quick connection, please connect in a steady network environment.

252
14.2 VCMI Bluetooth Pairing
Bluetooth Paring is the basic way for wireless connection. The VCMI2 needs to be either
connected to a vehicle or to an available power source, so that it is powered up during
the synchronization procedure. Make sure the tablet has a charged battery or is
connected to an AC/DC power supply.
➢ To pair the VCMI2 with the tablet
1. Power on the tablet.
2. Connect the 26-pin end of the main cable to the VCMI2's vehicle data connector.
3. Connect the 16-pin end of the main cable to the vehicle data link connector
(DLC).
4. Tap VCMI Manager on the MaxiSys Job Menu of the tablet.
5. Select VCMI BT from the connection mode list.
6. Swipe the Bluetooth toggle button to ON. Tap Scan at the top-right corner. The
device will start to search for available pairing units.
7. Depending on the VCMI2 type you use, the device name may display as “Maxi”
suffixed with a serial number. Select the appropriate device for pairing.
8. When paired successfully, the connection status displays as “Connected.”
9. Wait a few seconds, and the VCMI2 button on the system navigation bar at the
bottom of the screen will display a green BT icon, indicating the tablet is
connected to the VCMI2.
10. Tap the connected device again to disconnect the device.
NOTE
A VCMI2 device can be paired to only one tablet at a time, and once it's been paired, the
device will not be discoverable for any other unit.

253
14.3 BAS Bluetooth Pairing
The BT506 battery tester device can be connected with the tablet via Bluetooth. Ensure
that the BT506 battery tester is sufficiently charged or is connected to the external power
supply before use.
➢ To pair the Battery Tester with the tablet
1. Power on the tablet and the battery tester.
2. Tap VCMI Manager on the MaxiSys Job Menu of the tablet.
3. Select BAS BT from the connection mode list.
4. Swipe the Bluetooth toggle button to ON. Tap Scan at the top-right corner of the
screen. The device will start to search for available units to pair with.
5. Depending on the type of battery tester, the device name may appear as "Maxi"
suffixed with the battery test’s serial number. Select the appropriate device for
pairing.
6. When paired successfully, the connection status reads “Connected.”
14.4 VCMI Update
VCMI Update provides the latest update for the connected VCMI2. Before updating the
VCMI2 firmware, make sure the tablet network is stable, and do not leave the VCMI
Update page during upgrade.
➢ To update the VCMI2
1. Power on the tablet.
2. Connect the VCMI2 to the tablet via USB cable.
3. Tap VCMI Manager on the MaxiSys Job Menu of the tablet.
4. Select VCMI Update from the connection mode list.
5. If the installed version is not the latest one, the current version and the latest
version will display on the screen after a few seconds. Tap Update Now to
update the VCMI2 if available.

254
14.5 BAS Update
Before updating the battery tester firmware, please make sure the network connection is
stable.
➢ To update the battery tester firmware
1. Power on the tablet and the battery tester.
2. Connect the battery tester to the tablet via Bluetooth or USB cable.
3. Tap the VCMI Manager application on the MaxiSys Job Menu of the tablet.
4. Select BAS Update from the connection mode list.
5. If the installed version is not the latest one, the current version and the latest
version will display on the screen after a few seconds. Tap Update Now to
update the BAS firmware if available.
NOTE
Do not leave the BAS Update page during upgrade.
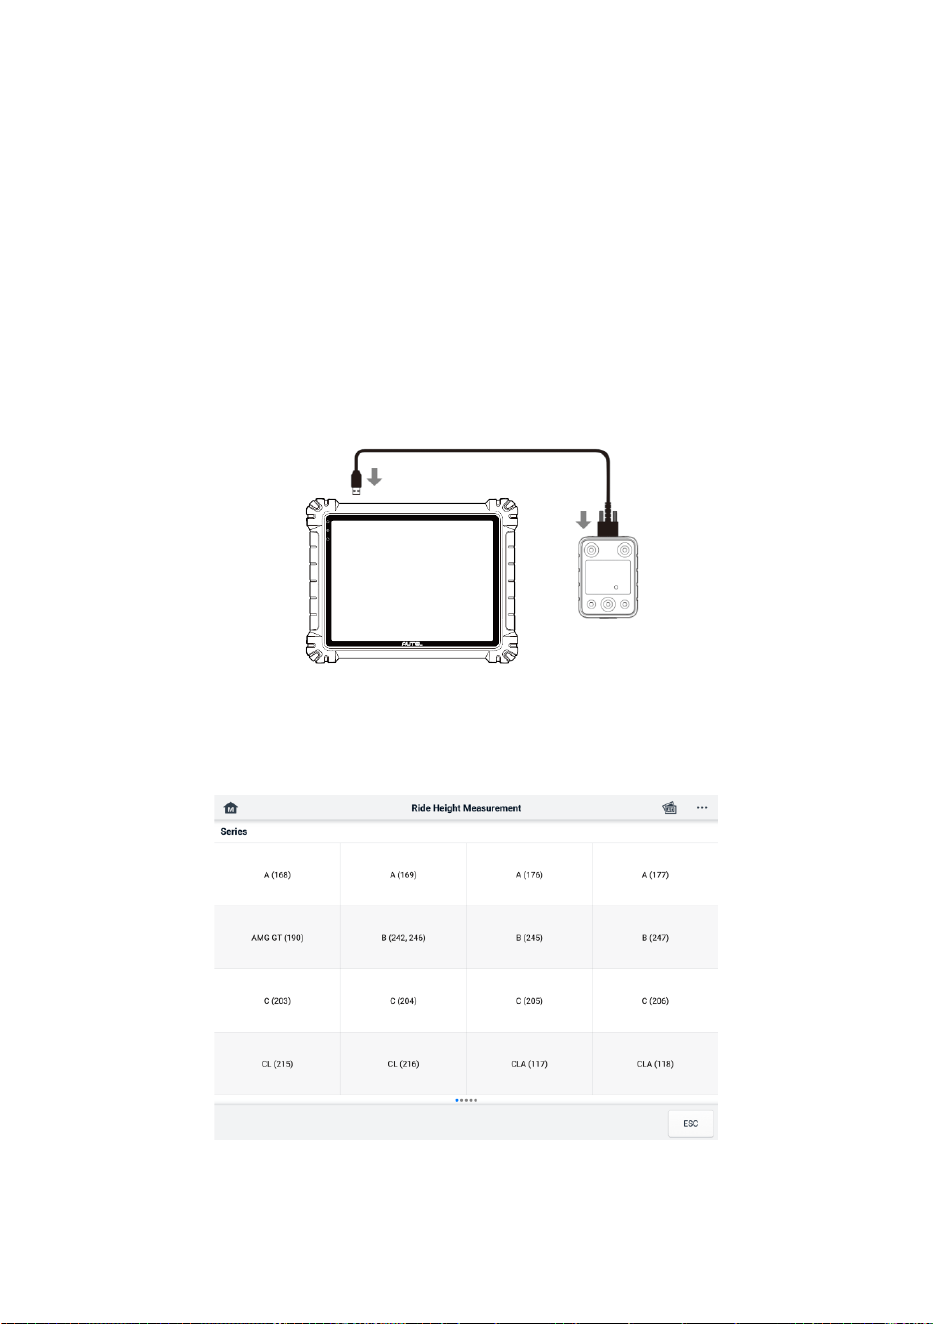
255
15 Hand-held Inclinometer
Connect the hand-held inclinometer to MaxiSys tablet and open the Hand-held
inclinometer application can accurately measure the Mercedes-Benz vehicles’ ride height,
which is a data basis for adjusting the values of wheel camber, caster, and toe during the
wheel alignment procedure.
➢ To measure the ride height of a Mercedes-Benz vehicle
1. Connect the hand-held inclinometer to the USB port on the MaxiSys tablet using
the supplied USB cable.
Figure 15-1 Connecting MaxiSys Tablet and Hand-held Inclinometer
2. Tap the Hand-held Inclinometer application button on the MaxiSys Job Menu
to open the vehicle series selection screen.
Figure 15-2 Vehicle Series Selection Screen
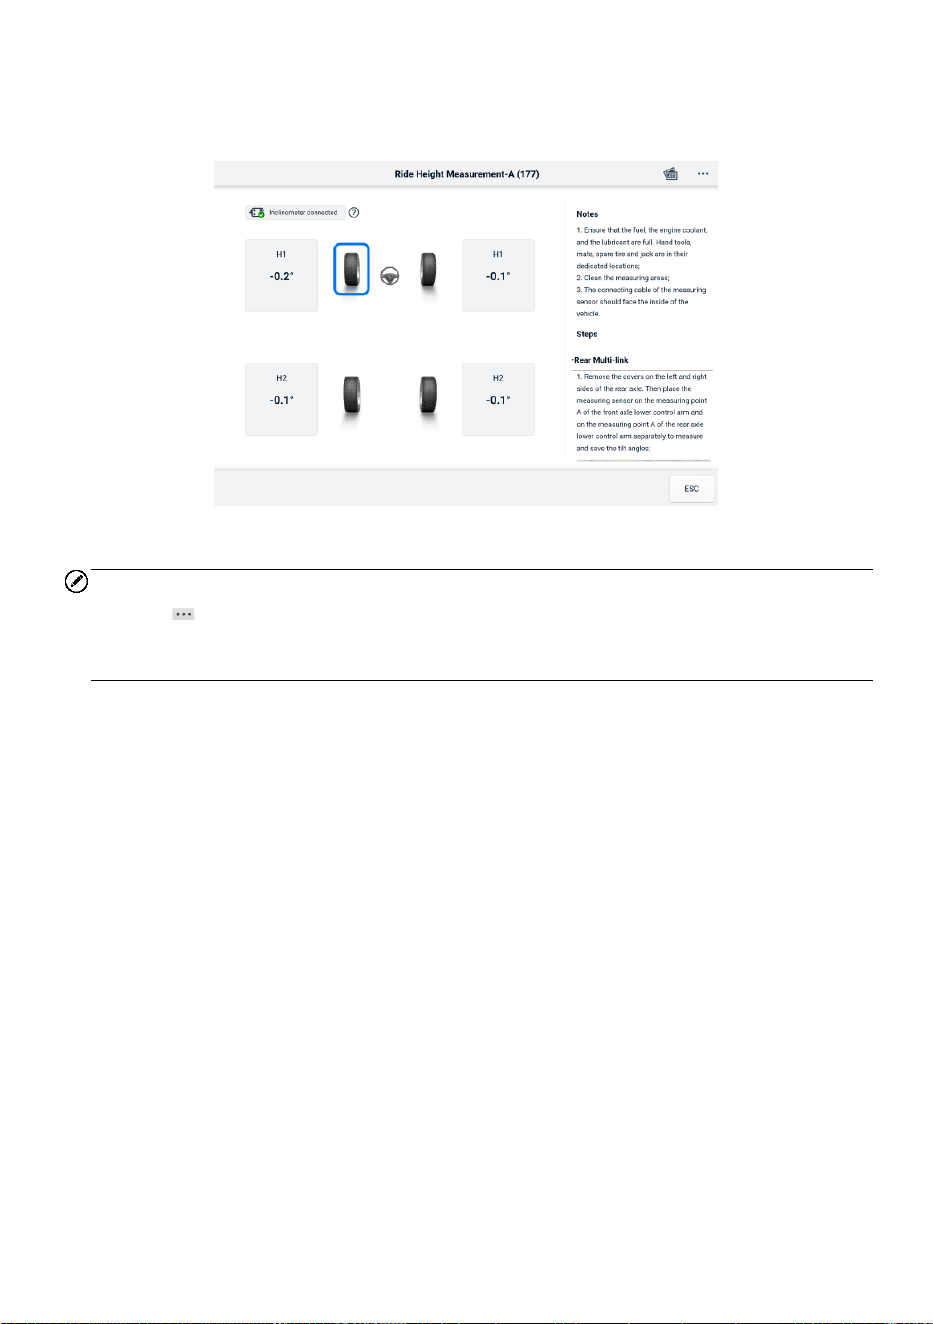
256
3. Follow the on-screen instructions to measure the ride height. The measured
results will be automatically uploaded to the tablet and displayed in the
corresponding input box.
Figure 15-3 Ride Height Measurement Result Screen
NOTE
Tap the button on the upper-right corner of the screen to open the drop-down menu
options: Calibrate, Update, Help. A quick reference guide on how to use the Autel hand-
held inclinometer will display after tapping the Help option.
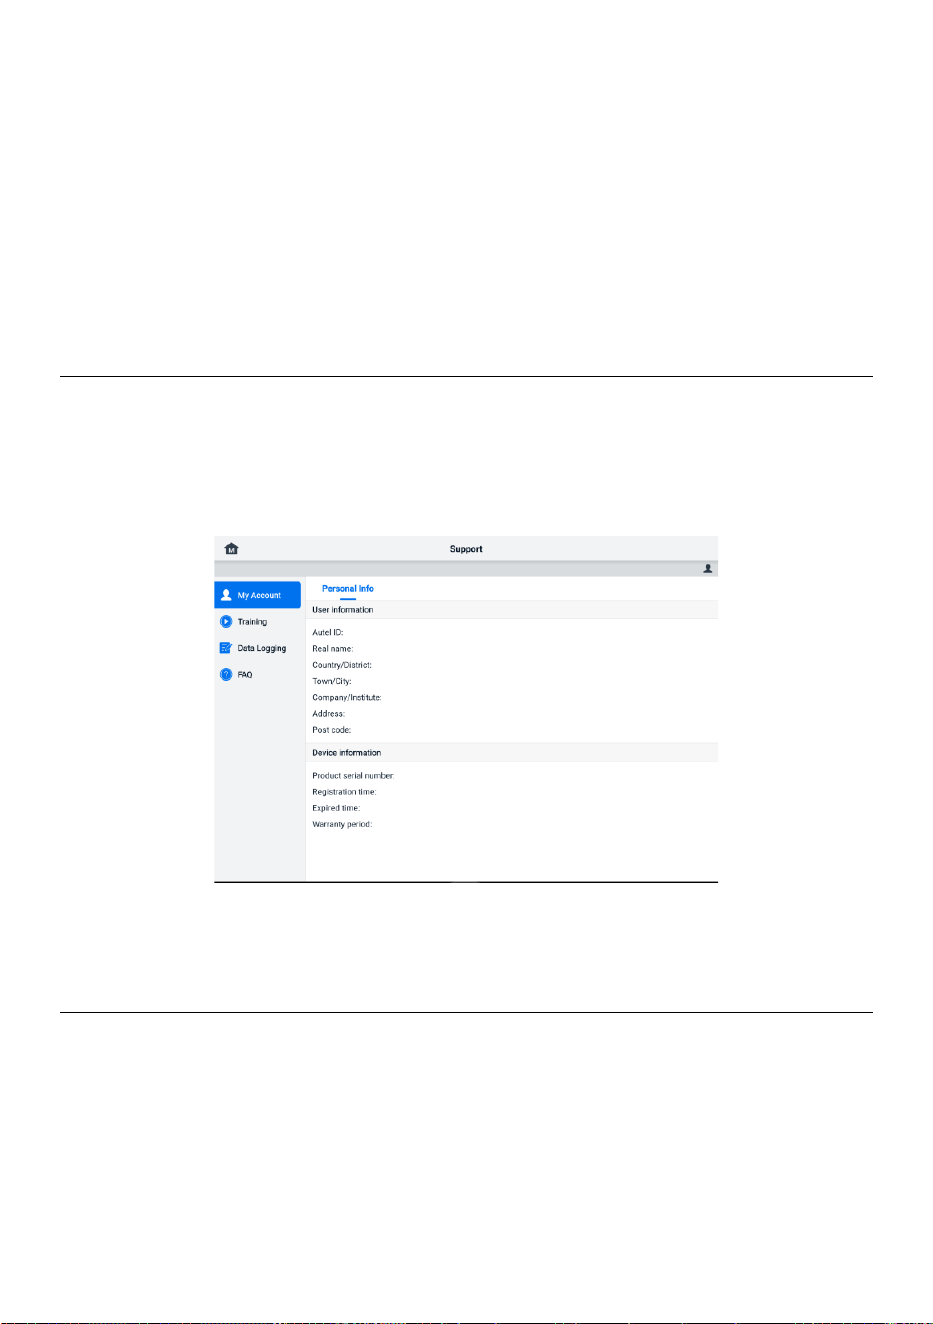
257
16 Support
This application launches the Support platform which synchronizes Autel’s online service
base station with the MaxiSys tablet. Connected to Autel’s service channel and online
communities, the Support application provides the quickest way for problem solutions,
allowing you to send help requests to obtain direct service and support.
16.1 Support Screen Layout
The Support application interface is navigated by the Home button on the top toolbar.
The main section of the Support screen is divided into two sections. The narrow column
on the left is the main menu; select one subject from the main menu to display the
corresponding function screen on the right.
Figure 16-1 Support Application Screen
16.2 My Account
The My Account screen displays the comprehensive information of the user and the
product, which is synchronized with the online registered account.
16.2.1 Personal Information
The User Information and Device Information are both included under the Personal

258
Information section.
⚫ User Information — displays detailed information of your registered online Autel
account, such as your Autel ID, name, address, and other contact information.
⚫ Device Information — displays the registered product information, including the
product serial number, registration time, expired time, and warranty period.
16.3 Training
The Training section provides quick links to Autel’s online video accounts. Select a video
channel by language to see all available Autel online tutorial videos on such topics as
product usage techniques and vehicle diagnostics practices.
16.4 Data Logging
The Data Logging section keeps records of all Feedback (submitted), No feedback (not
submitted but saved) or History (up to the latest 20 test records) data loggings on the
diagnostic system. The support personnel will receive and process the submitted reports
through the Support platform. The solution will be sent back as soon as possible. You
may continue to correspond with the Support platform until the issue is resolved.
➢ To make a reply in a Data Logging session
1. Tap on the Feedback tag to view the list of submitted data loggings.
2. Select a specific item to view the latest update of the processing progress.
3. Tap on the input field on the bottom of the screen and enter your reply, or tap
the Audio button to record a voice message, or tap the Camera button to take
a screenshot.
4. Tap Send to deliver your message to Autel Support.
16.5 FAQ
The FAQ section provides comprehensive references for all questions frequently asked
and answered about the use of Autel’s online member account and shopping and
payment procedures.
⚫ Account — displays questions and answers about the use of Autel's online user
account.
⚫ Shopping — displays questions and answers about online product purchase
methods or procedures.

259
⚫ Payment — displays questions and answers about online product payment methods
or procedures.
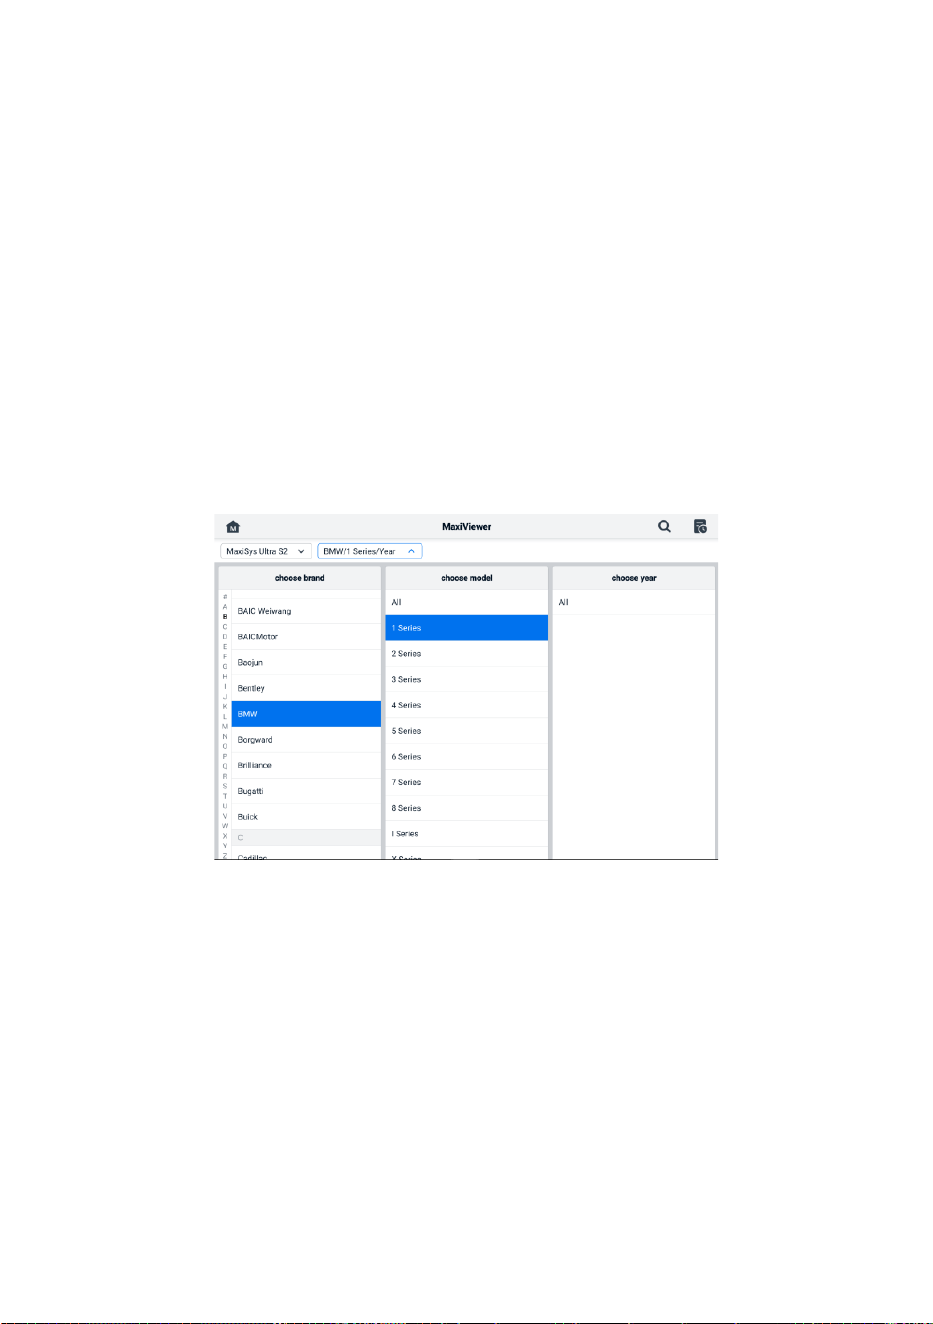
260
17 MaxiViewer
The MaxiViewer application allows you to search the functions supported by our tools
and the version information. There are two ways for searching, either by searching the
tool and the vehicle or searching the functions.
➢ To search by the vehicle
1. Tap the MaxiViewer application on the MaxiSys Job Menu. The MaxiViewer
application screen displays.
2. Tap the tool name on the top-left corner to drop down the tool list. Tap the one
you want to search.
3. Tap the vehicle brand, model, and year you want to search.
Figure 17-1 MaxiViewer Screen 1
4. All the functions supported by the selected tool for the selected vehicle display
as several columns.
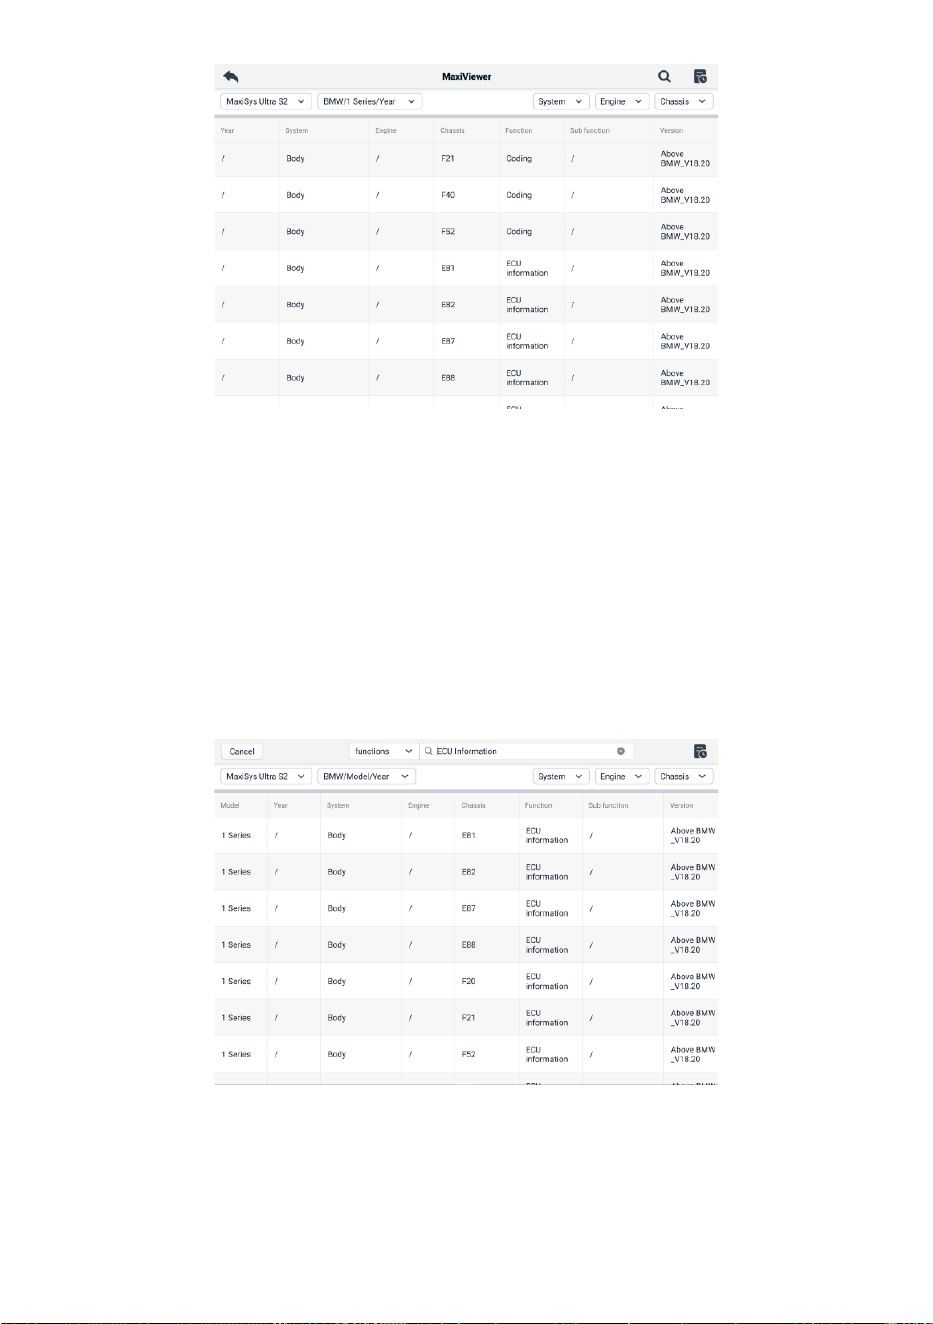
261
Figure 17-2 MaxiViewer Screen 2
➢ To search by the functions
1. Tap the MaxiViewer application on the MaxiSys Job Menu. The MaxiViewer
application screen displays.
2. Tap the tool name on the top-left corner to drop down the tool list. Tap the one
you want to search.
3. Tap the search icon in the top-right corner and enter the function you want to
search in the search box. The screen will display all vehicles that support this
function, along with information such as the vehicles' year, system, function,
sub-function, and version.
Figure 17-3 MaxiViewer Screen 3

262
NOTE
Fuzzy search is supported. Type in some part of the function-related keywords to find all
the available information.

263
18 MaxiVideo
The MaxiVideo application configures the MaxiSys tablet to operate as a digital video
scope by simply connecting the tablet to a MaxiVideo Digital Inspection Camera. This
function allows you to examine difficult-to-reach areas normally hidden from sight, with
the ability to record digital still images and videos, which offers you an economical
solution to inspect machinery, facilities, and infrastructure in a safe and quick way.
NOTE
1. The MaxiVideo Digital Inspection Camera and its fittings are additional accessories,
and need to be purchased separately. Both sizes (8.5 mm and 5.5 mm) of the imager
head are optional and available for purchase.
2. This function is compatible with the MaxiVideo Digital Inspection Camera in models
MV105S, MV108S, MV105, and MV108.
3. Connect the tablet with MaxiVideo Digital Inspection Camera using the USB cable.
For detailed operation instructions, please refer to the Quick Reference Guide for
the MaxiVideo Digital Inspection Camera.
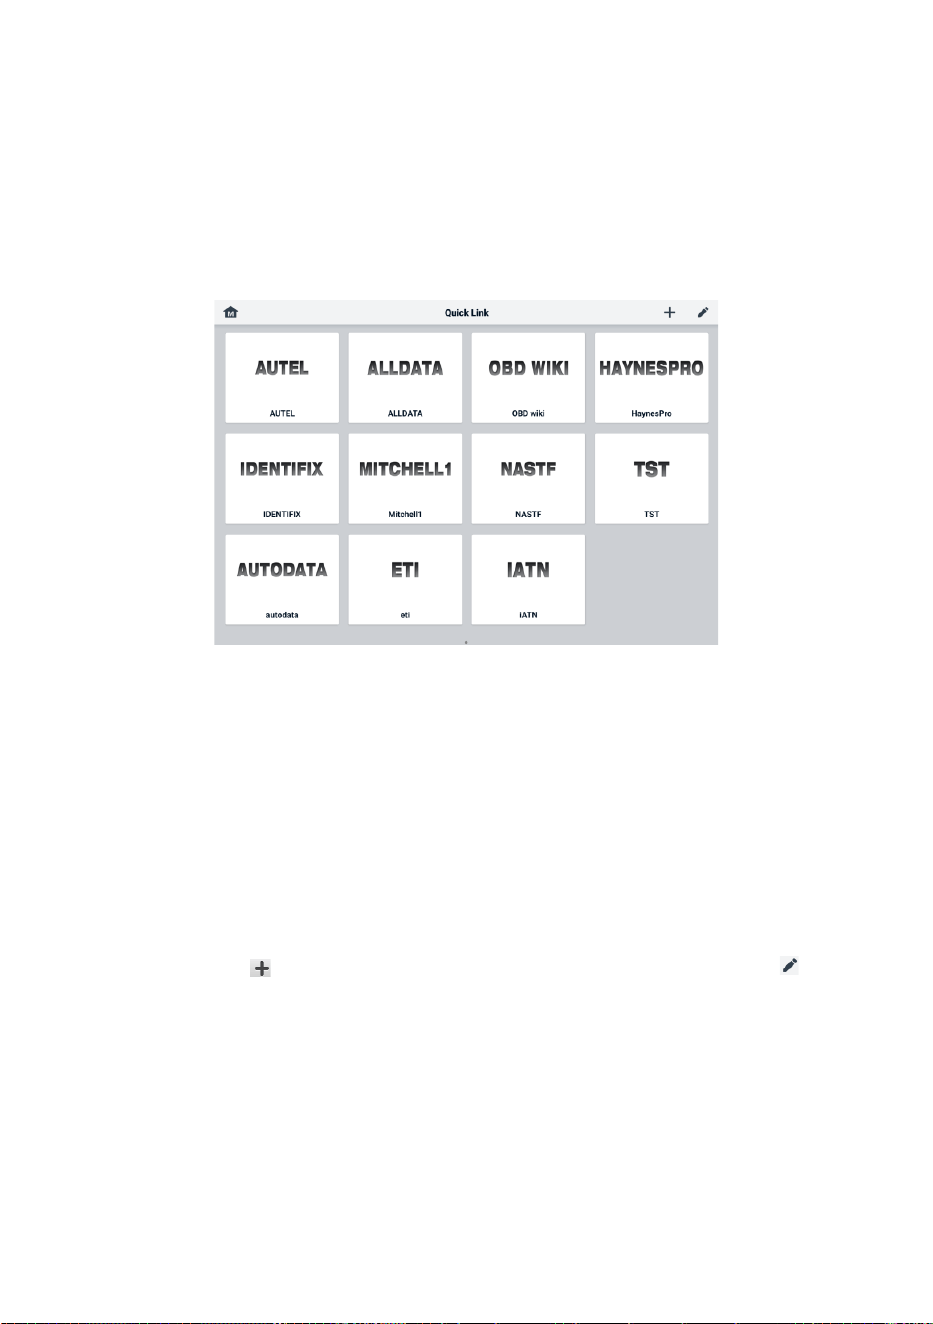
264
19 Quick Links
The Quick Link application provides you with convenient access to Autel’s official website
and many other well-known sites in the automotive service industry to provide technical
help, knowledge bases, forums, and training and expertise consultations.
Figure 19-1 Quick Link Screen
➢ To open a quick link
1. Tap Quick Link on the MaxiSys Job Menu. The Quick Link application screen
displays.
2. Select a website thumbnail from the main section. The Chrome browser will
launch and the selected website will open.
➢ To manage the quick links
1. Tap Quick Link on the MaxiSys Job Menu. The Quick Link application screen
will appear.
2. Tap the icon on the upper-right corner to add websites. Tap the icon to
delete websites.
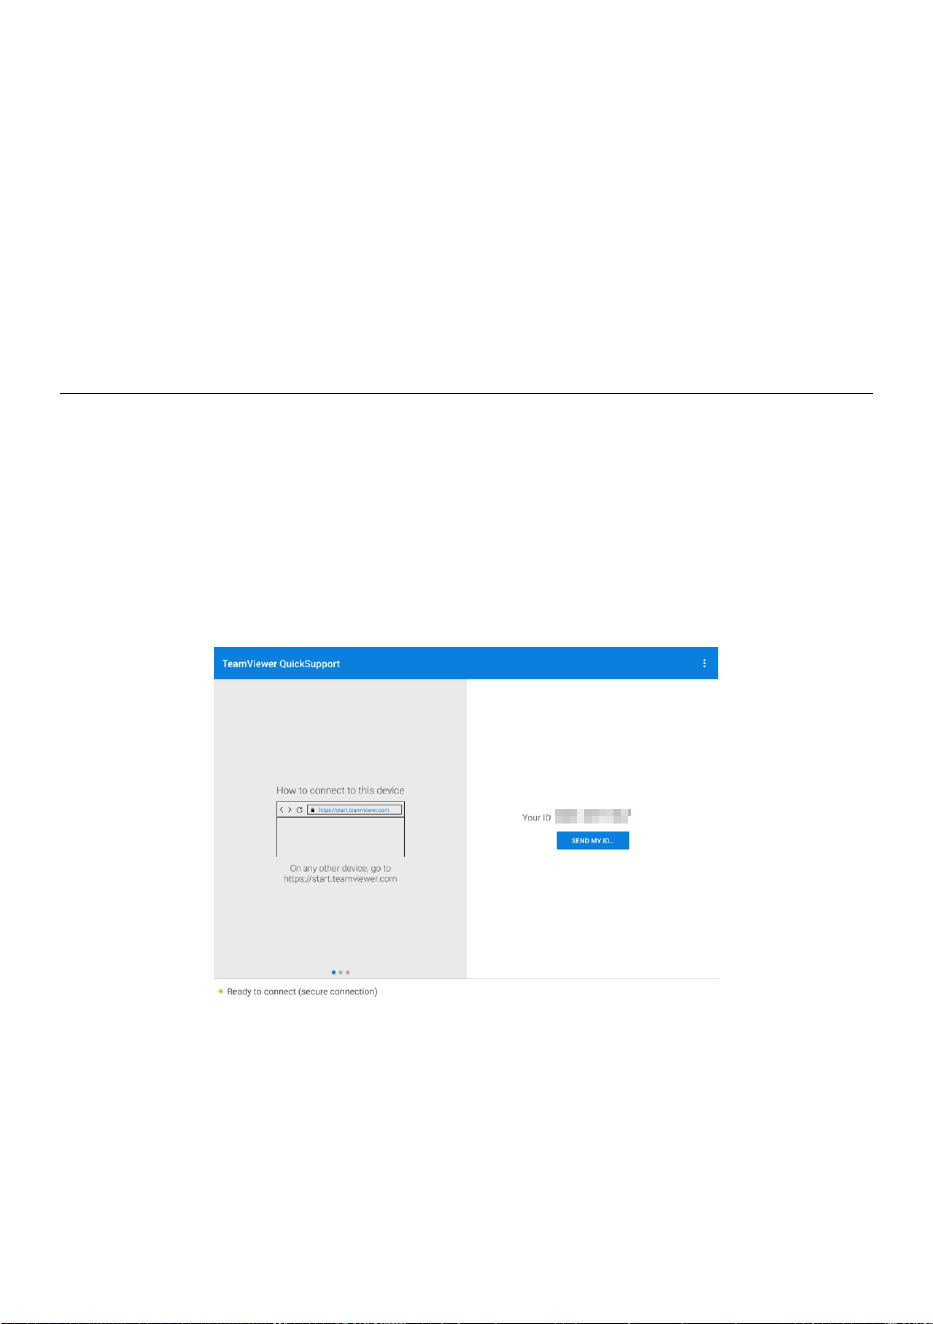
265
20 Remote Desktop
The Remote Desktop application launches the TeamViewer Quick Support program,
which is a simple, fast, and secure remote-control interface. You can use the application
to receive ad-hoc remote support from Autel's support center, colleagues, or friends, by
allowing them to control your MaxiSys tablet on their PC via the TeamViewer software.
20.1 Operations
If you think of a TeamViewer connection as a phone call, the TeamViewer ID would be
the phone number under which all TeamViewer Clients can be reached separately.
Computers and mobile devices that run TeamViewer are identified by a globally unique
ID. The first time the Remote Desktop application is started, this ID is generated
automatically based on the hardware characteristics and will not change.
Make sure the tablet is connected to the Internet before launching the Remote Desktop
application, so that the tablet is able to receive remote support from a third party.
Figure 20-1 Remote Desktop Screen

266
➢ To receive remote support from a partner
1. Power on the tablet.
2. Tap the Remote Desktop application on the MaxiSys Job Menu. The
TeamViewer interface displays and the device ID is generated and shown.
3. Your partner must install the Remote Control software to his/her computer by
downloading the TeamViewer full version program online
(http://www.teamviewer.com), and then launch the software.
4. Provide your ID to the partner, and wait for him/her to send you a remote-control
request.
5. A message will appear asking for your confirmation to allow remote-control on
your device.
6. Tap Allow to accept, or tap Deny to reject.
Refer to the associated TeamViewer documents for additional information.
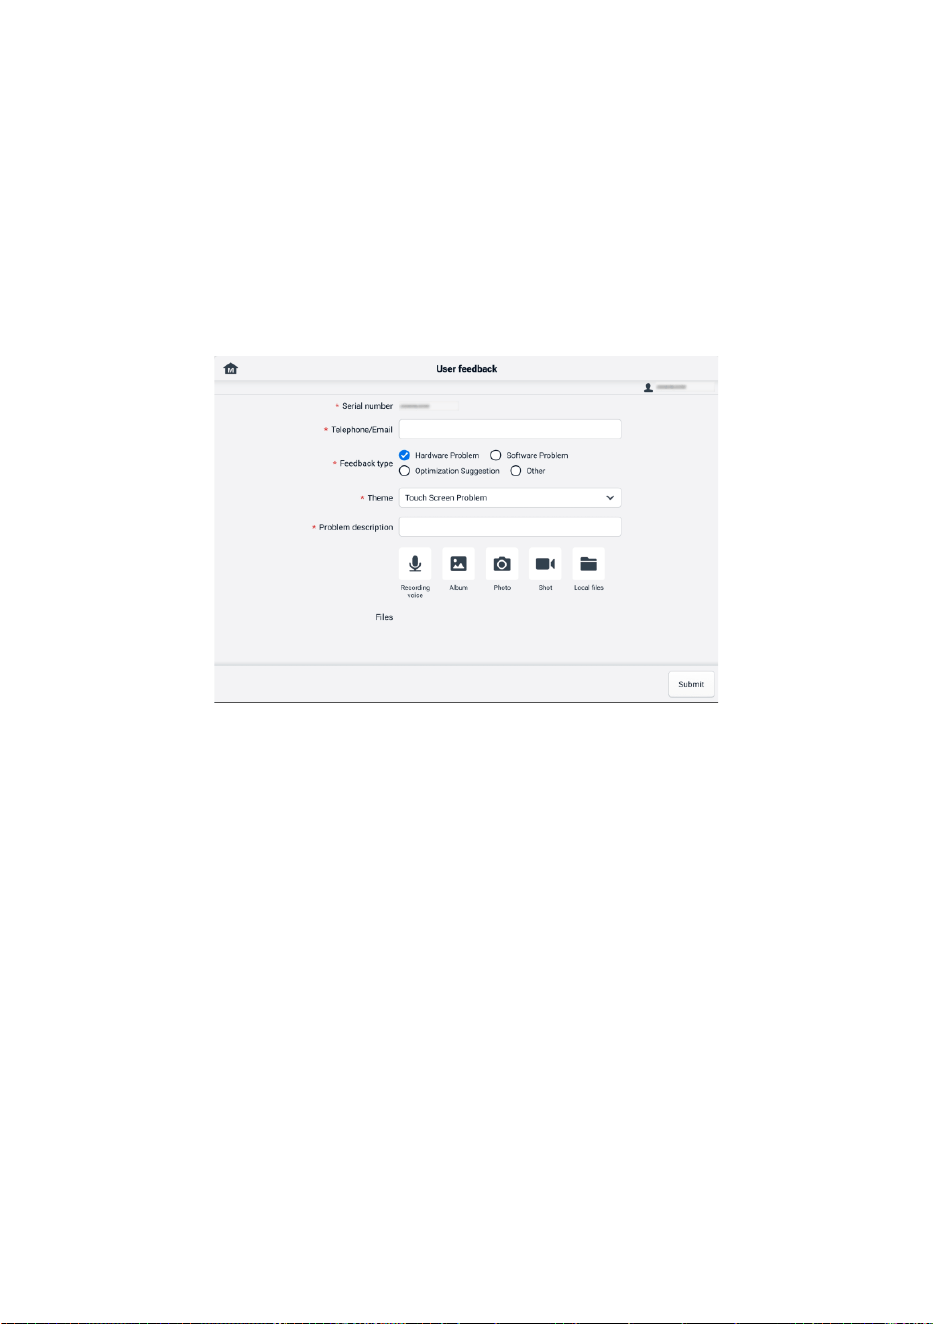
267
21 User Feedback
The User Feedback application allows you to submit questions related to this product.
➢ To send user feedback
1. Tap User Feedback on the MaxiSys Job Menu. The device information is
automatically synchronized.
Figure 21-1 User Feedback Screen
2. Set Telephone/Email, Feedback type, Theme, and Problem description.
You can also attach voice recordings, photos, screenshots, images or PDF files.
To resolve your issue more efficiently, we recommend you to complete the
information with as many details as possible.
3. Tap Submit to send the completed information to Autel's online service center.
The submitted feedback will be carefully read and handled by our service
personnel.
268
22 Autel User Center
Software updates are available for free for the first year from the date of purchase. The
Autel User Center application allows you to register your tool to download the latest
released software, thereby enhancing the functionality of the MaxiSys application by
adding new vehicle models or enhanced applications to the database.
There are two ways for product registration:
A. Via the MaxiSys tablet
➢ To log in with your account and register your Autel tool
1. Tap Autel User Center from the MaxiSys Job Menu. The following screen
displays.
Figure 22-1 Autel User Center Screen
2. If you already have an Autel ID, you can log in with your Autel ID and password,
or tap Log In with Verification Code to log in with your phone number and
verification code. If you don't have an Autle ID yet, tap Register to create an
Autel ID.
3. Once your account is successfully registered, you will enter the main menu of
the Autel User Center.
4. Select Device Management on the main menu.

269
5. Tap the Link Device button on the upper-right corner of the Device
Management screen. The serial number and password of the device will
automatically appear on the Link Device screen.
6. Tap the Link button to complete the product registration.
B. Via the Autel website
➢ To register your Autel tool
1. Visit the website: pro.autel.com.
2. If you have an Autel account, sign in with your account ID and password and
skip to step 7.
3. If you are a new member to Autel, click the Register button to create your Autel
ID.
4. Enter the required personal information in the input fields.
5. Enter your email address, then click Request. You will receive an email from
Autel with your verification code. Open the email and copy the code into the
proper input box.
6. Set a password for your account and enter the password again to confirm. Read
the Autel User Service Agreement and Autel Privacy Policy, then check the
box to accept the terms. After all the information is entered, click Register. A
Product Registration screen will appear.
7. Your product serial number and password are required to complete your
registration. To find your serial number and password on the tool: go to Settings
>About.
8. Enter your tool’s serial number and password on the Product Registration
screen. Enter the CAPTCHA code and click Submit to complete your
registration procedure.

270
23 Maintenance and Service
To ensure that the tablet and the combined VCMI unit perform at their optimum level, we
advise that the product maintenance instructions covered in this section are strictly
followed.
23.1 Maintenance Instructions
The following includes how to maintain your devices, together with precautions to take.
⚫ Use a soft cloth and alcohol or a mild window cleaner to clean the touchscreen of
the tablet.
⚫ Do not use any abrasive cleansers, detergent, or automotive chemicals to the tablet.
⚫ Keep the devices in dry conditions and within the specified operating temperatures.
⚫ Dry your hands before using the tablet. The touch screen of the tablet may not work
if the touch screen is moist or if you tap the touch screen with wet hands.
⚫ Do not store the devices in humid, dusty, or dirty areas.
⚫ Check the housing, wiring, and connectors for dirt and damage before and after each
use.
⚫ Check the housing, wiring, and connectors for dirt and damage before and after each
use.
⚫ Do not attempt to disassemble your tablet or the VCMI unit.
⚫ Do not drop or cause severe impact to the devices.
⚫ Use only authorized battery chargers and accessories. Any malfunction or damage
caused by the use of unauthorized battery chargers and accessories will void the
limited product warranty.
⚫ Ensure that the battery charger does not come in contact with conductive objects.
⚫ Do not use the tablet beside microwave ovens, cordless phones, and some medical
or scientific instruments to prevent signal interference.

271
23.2 Troubleshooting Checklist
A. When the tablet does not work properly:
⚫ Make sure the tablet has been registered online.
⚫ Make sure the system software and diagnostic application software are properly
updated.
⚫ Make sure the tablet is connected to the Internet.
⚫ Check all cables, connections, and indicators to see if the signal is being
received.
B. When battery life is shorter than usual:
⚫ This may happen when you are in an area with low signal strength. Turn off your
device if is not in use.
C. When you cannot turn on the tablet:
⚫ Make sure the tablet is connected to a power source or the battery is charged.
D. When you are unable to charge the tablet:
⚫ Your charger may be out of order. Contact your nearest dealer.
⚫ You may be attempting to use the device in an overly hot/cold temperature.
Charge the device in a cooler or warmer area.
⚫ Your device may not have been connected to the charger properly. Check the
connector.
NOTE
If the problems persist, please contact Autel's technical support personnel or your local
selling agent.
23.3 About Battery Usage
Your tablet is powered by a built-in lithium-ion polymer battery, which enables you to
recharge your battery when there is electricity left.
DANGER
The built-in Lithium-ion Polymer battery is factory replaceable only; incorrect replacement
or tampering with the battery pack may cause an explosion.

272
⚫ Do not use a damaged battery charger.
⚫ Do not disassemble, open, crush, bend, deform, puncture, or shred the battery.
⚫ Do not modify, remanufacture, or attempt to insert foreign objects into the battery, or
expose the battery to fire, explosion, or other hazards.
⚫ Only use the specified charger and USB cables. Use of non-Autel-authorized chargers
or USB cables may lead to device malfunction or failure.
⚫ Use of an unqualified battery or charger may present a risk of fire, explosion, leakage,
or other hazards.
⚫ Avoid dropping the tablet. If the tablet is dropped, especially on a hard surface, and
you suspect damage, take the tablet to a service center for inspection.
⚫ Try to keep closer to your wireless router to reduce battery usage.
⚫ The time needed to recharge the battery varies depending on the remaining battery
capacity.
⚫ Battery life inevitably shortens over time.
⚫ Unplug the charger once the tablet is fully charged since overcharging may shorten
battery life.
⚫ Keep the battery in temperate environments. Do not place it inside a car when it is too
hot or too cold, which may reduce the capacity and life of the battery.
23.4 Service Procedures
This section provides information on technical support, repair service, and application for
replacement or optional parts.
23.4.1 Technical Support
If you have any question or problem on the operation of the product, please contact us.
Autel China Headquarters
⚫ Phone: +86 (0755) 8614-7779 (Monday-Friday, 9AM-6PM Beijing Time)
⚫ Email: [email protected]
⚫ Address: Floor 2, Caihong Keji Building, 36 Hi-tech North Six Road, Songpingshan
Community, Xili Sub-district, Nanshan District, Shenzhen City, China
⚫ Web: www.autel.com

273
Autel North America
⚫ Phone: 1-855-288-3587 (Monday-Friday, 9AM-6PM Eastern Time)
⚫ Email: [email protected]
⚫ Address: 36 Harbor Park Drive, Port Washington, New York, USA 11050
⚫ Web: www.autel.com/us
Autel Europe
⚫ Phone: +49(0)89 540299608 (Monday-Friday, 9AM-6PM Berlin Time)
⚫ Email: [email protected]
⚫ Address: Landsberger Str. 408, 81241 München, Germany
⚫ Web: www.autel.eu
Autel APAC
Japan:
⚫ Phone: +81-045-548-6282
⚫ Email: [email protected]
⚫ Address: 6th Floor, Ari-nadoribiru 3-7-7, Shinyokohama, Kohoku-ku, Yokohama-
shi, Kanagawa-ken, 222-0033 Japan
⚫ Web: www.autel.com/jp
Australia:
⚫ Email: [email protected]
⚫ Address: Unit 5, 25 Veronica Street, Capalaba
Autel IMEA
⚫ Phone: +971 585 002709 (in UAE)
⚫ Email: [email protected]
⚫ Address: 906-17, Preatoni Tower (Cluster L), Jumeirah Lakes Tower, DMCC, Dubai,
UAE
⚫ Web: www.autel.com
Autel Latin America
Mexico:
⚫ Phone: +52 33 1001 7880 (Spanish in Mexico)
⚫ Email: [email protected]

274
⚫ Address: Avenida Americas 1905, 6B, Colonia Aldrete, Guadalajara, Jalisco,
Mexico
Brazil:
⚫ Email: [email protected]
⚫ Address: Avenida José de Souza Campos n° 900, sala 32 Nova Campinas
Campinas – SP, Brazil
⚫ Web: www.autel.com/br
23.4.2 Repair Service
If it becomes necessary to return your device for repair, please download the repair
service form from www.autel.com, and fill in the form. The following information must be
included:
⚫ Contact name
⚫ Return address
⚫ Telephone number
⚫ Product name
⚫ Complete description of the problem
⚫ Proof-of-purchase for warranty repairs
⚫ Preferred method of payment for non-warranty repairs
NOTE
For non-warranty repairs, payment can be made with Visa, Master Card, or with
approved credit terms.
Send the device to your local agent, or to the address below:
Floor 2, Caihong Keji Building, 36 Hi-tech North Six Road, Songpingshan Community,
Xili Sub-district, Nanshan District, Shenzhen City, China

275
23.4.3 Other Services
You can purchase the optional accessories directly from Autel's authorized tool suppliers,
and/or your local distributor or agent.
Your purchase order should include the following information:
⚫ Contact information
⚫ Product or part name
⚫ Item description
⚫ Purchase quantity

276
24 Compliance Information
FCC Compliance
This equipment has been tested and found to comply with the limits for a Class B digital
device, pursuant to part 15 of the FCC Rules. These limits are designed to provide
reasonable protection against harmful interference in a residential installation. This
equipment generates, uses and can radiate radio frequency energy and, if not installed
and used in accordance with the instructions, may cause harmful interference to radio
communications. However, there is no guarantee that interference will not occur in a
particular installation. If this equipment does cause harmful interference to radio or
television reception, which can be determined by turning the equipment off and on, the
user is encouraged to try to correct the interference by one or more of the following
measures:
⚫ Reorient or relocate the receiving antenna.
⚫ Increase the separation between the equipment and receiver.
⚫ Connect the equipment into an outlet on a circuit different from that to which the
receiver is connected.
⚫ Consult the dealer or an experienced radio/TV technician for help.
WARNING
Changes or modifications not expressly approved by the party responsible for
compliance would void the user’s authority to operate the equipment.
This device complies with Part 15 of the FCC Rules. Operation is subject to the following
two conditions:
1. This device may not cause harmful interference.
2. This device must accept any interference received, including interference that may
cause undesired operation.
RF Exposure Information
FCC RF Exposure requirements: The highest SAR value reported under this standard
during product certification for use next to the head with the minimum separation distance
of 5mm. This transmitter must not be collocated or operating in conjunction with any other
antenna or transmitter.

277
This product is compliance to FCC RF Exposure requirements and refers to FCC website
https://apps.fcc.gov/oetcf/eas/reports/GenericSearch.cfm. Search for FCC ID: WQ8-
DV2377.
IC NOTICE TO CANADIAN USERS
This device contains licence-exempt transmitter(s)/receiver(s) that comply with
Innovation, Science and Economic Development Canada’s licence-exempt RSS(s).
Operation is subject to the following two conditions:
(1) This device may not cause interference.
(2) This device must accept any interference, including interference that may cause
undesired operation of the device.
L’émetteur/récepteur exempt de licence contenu dans le présent appareil est conforme
aux CNR d’Innovation, Sciences et Développement économique Canada applicables
aux appareils radio exempts de licence. L’exploitation est autorisée aux deux conditions
suivantes:
(1) l'appareil nedoit pas produire de brouillage;
(2) l'utilisateur de l'appareil doit accepter tout brouillage radioélectrique subi, même si le
brouillage est susceptible d'en compromettre le fonctionnement.
Operation of this device is restricted to indoor use only. (5150-5250MHz)
Le fonctionnement de cet appareil est limité à une utilisation en intérieur uniquement.
(5150-5250MHz)
This EUT is compliance with SAR for general population/uncontrolled exposure limits in
IC RSS-102 and had been tested in accordance with the measurement methods and
procedures specified in IEEE 1528 and IEC 62209. This equipment should be installed
and operated with minimum distance 5 mm between the radiator and your body. This
device and its antenna(s) must not be co-located or operating in conjunction with any
other antenna or transmitter.
Cet EST est conforme au SAR pour la population générale/limites d'exposition non
contrôlées dans IC RSS-102 et a été testé conformément aux méthodes et procédures
de mesure spécifiées dans IEEE 1528 et CEI 62209. Cet équipement doit être installé et
utilisé à une distance minimale de 5 mm entre le radiateur et votre corps. Cet appareil
et ses antennes ne doivent pas être situés ou fonctionner en conjonction avec une autre
antenne ou un autre émetteur.

278
CE Compliance
RED Directive 2014/53/EU.
RoHS Compliance
This device is declared to be in compliance with the European RoHS Directive
2011/65/EU.

279
25 Warranty
12-Month Limited Warranty
Autel Intelligent Technology Corp., Ltd. (the Company) warrants to the original retail
purchaser of this MaxiSys tablet that should this product or any part thereof during normal
usage and under normal conditions be proven defective in material or workmanship that
results in product failure within twelve (12) months period from the date of purchase, such
defect(s) will be repaired, or replaced (with new or rebuilt parts) with Proof of Purchase,
at the Company's option, without charge for parts or labor directly related to the defect(s).
NOTE
If the warranty period is inconsistent with local laws and regulations, please comply with
the relevant local laws and regulations.
The Company shall not be liable for any incidental or consequential damages arising
from the use, misuse, or mounting of the device. Some states do not allow limitation on
how long an implied warranty lasts, so the above limitations may not apply to you.
This warranty does not apply to:
a) Products subjected to abnormal use or conditions, accident, mishandling, neglect,
unauthorized alteration, misuse, improper installation or repair or improper storage;
b) Products whose mechanical serial number or electronic serial number has been
removed, altered or defaced;
c) Damage from exposure to excessive temperatures or extreme environmental
conditions;
d) Damage resulting from connection to, or use of any accessory or other product not
approved or authorized by the Company;
e) Defects in appearance, cosmetic, decorative or structural items such as framing and
non-operative parts.
f) Products damaged from external causes such as fire, dirt, sand, battery leakage,
blown fuse, theft or improper usage of any electrical source.
IMPORTANT
All contents of the product may be deleted during the process of repair. You should create
a back-up copy of any contents of your product before delivering the product for warranty
service.

V1.0 | 2025.04