
Loading ...
Loading ...
Loading ...
MDO-2000A series User Manual
212
Display Overview
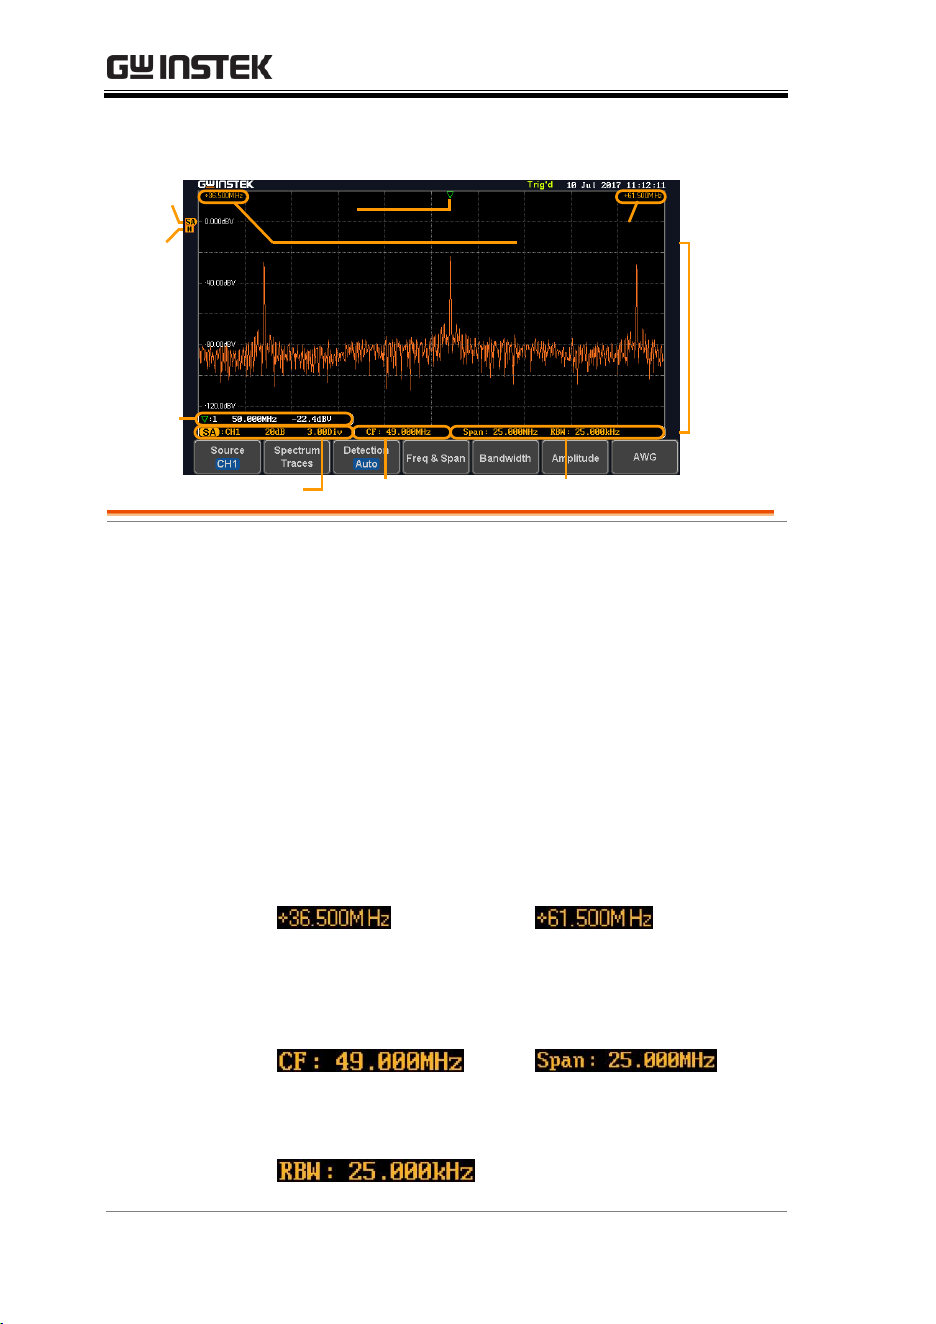
Waveform in
frequency
domain
Zero
level
Peaks
Events
State
View
Start and stop
frequencies
Source and V scale
Center frequency
Span and resolution
Trace
type
Main
display
Main display
The Spectrum Analyzer main display can show
various spectrum traces of the selected analog
source channel, such as the normal, max-hold,
min-hold and averaged trace. The start and stop
frequency of the span are displayed at both top
sides. The remaining frequency span information
is displayed at the bottom as well as the vertical
scale. The zero level is shown for reference on the
Y axis on the left. When the search function is
enabled, frequency peaks will be detected and
summarized in the Events State View window at
the bottom left of the display.
Frequency
domain
information
Start
frequency (shown on the
upper left corner of the
main spectrum display)
Stop
frequency (shown on the
upper right corner of the
main spectrum display)
Center frequency of the
span
Width of the span
Resolution bandwidth
Loading ...
Loading ...
Loading ...