
September 2015, Rev. 1, 1/17
©2015-2017 Fluke Corporation. All rights reserved.
All product names are trademarks of their respective companies.
1736/1738
Power Logger
Users Manual
1.888.610.7664 sales@GlobalTestSupply.com
Fluke-Direct
.com

LIMITED WARRANTY AND LIMITATION OF LIABILITY
Each Fluke product is warranted to be free from defects in material and workmanship under normal use and service. The warranty period is two years and begins on
the date of shipment. Parts, product repairs, and services are warranted for 90 days. This warranty extends only to the original buyer or end-user customer of a
Fluke authorized reseller, and does not apply to fuses, disposable batteries, or to any product which, in Fluke's opinion, has been misused, altered, neglected,
contaminated, or damaged by accident or abnormal conditions of operation or handling. Fluke warrants that software will operate substantially in accordance with its
functional specifications for 90 days and that it has been properly recorded on non-defective media. Fluke does not warrant that software will be error free or operate
without interruption.
Fluke authorized resellers shall extend this warranty on new and unused products to end-user customers only but have no authority to extend a greater or different
warranty on behalf of Fluke. Warranty support is available only if product is purchased through a Fluke authorized sales outlet or Buyer has paid the applicable
international price. Fluke reserves the right to invoice Buyer for importation costs of repair/replacement parts when product purchased in one country is submitted for
repair in another country.
Fluke's warranty obligation is limited, at Fluke's option, to refund of the purchase price, free of charge repair, or replacement of a defective product which is returned
to a Fluke authorized service center within the warranty period.
To obtain warranty service, contact your nearest Fluke authorized service center to obtain return authorization information, then send the product to that service
center, with a description of the difficulty, postage and insurance prepaid (FOB Destination). Fluke assumes no risk for damage in transit. Following warranty repair,
the product will be returned to Buyer, transportation prepaid (FOB Destination). If Fluke determines that failure was caused by neglect, misuse, contamination,
alteration, accident, or abnormal condition of operation or handling, including overvoltage failures caused by use outside the product’s specified rating, or normal
wear and tear of mechanical components, Fluke will provide an estimate of repair costs and obtain authorization before commencing the work. Following repair, the
product will be returned to the Buyer transportation prepaid and the Buyer will be billed for the repair and return transportation charges (FOB Shipping Point).
THIS WARRANTY IS BUYER'S SOLE AND EXCLUSIVE REMEDY AND IS IN LIEU OF ALL OTHER WARRANTIES, EXPRESS OR IMPLIED, INCLUDING BUT
NOT LIMITED TO ANY IMPLIED WARRANTY OF MERCHANTABILITY OR FITNESS FOR A PARTICULAR PURPOSE. FLUKE SHALL NOT BE LIABLE FOR
ANY SPECIAL, INDIRECT, INCIDENTAL OR CONSEQUENTIAL DAMAGES OR LOSSES, INCLUDING LOSS OF DATA, ARISING FROM ANY CAUSE OR
THEORY.
Since some countries or states do not allow limitation of the term of an implied warranty, or exclusion or limitation of incidental or consequential damages, the
limitations and exclusions of this warranty may not apply to every buyer. If any provision of this Warranty is held invalid or unenforceable by a court or other decision-
maker of competent jurisdiction, such holding will not affect the validity or enforceability of any other provision.
11/99
1.888.610.7664 sales@GlobalTestSupply.com
Fluke-Direct
.com

i
Title Page
Introduction. . . . . . . . . . . . . . . . . . . . . . . . . . . . . . . . . . . . . . . . . . . . . . . . . . . . . . . . . . . . . . . . . . . . . . . . . . . . . .1
How to Contact Fluke . . . . . . . . . . . . . . . . . . . . . . . . . . . . . . . . . . . . . . . . . . . . . . . . . . . . . . . . . . . . . . . . . . . . . .2
Safety Information . . . . . . . . . . . . . . . . . . . . . . . . . . . . . . . . . . . . . . . . . . . . . . . . . . . . . . . . . . . . . . . . . . . . . . . .2
Before You Start . . . . . . . . . . . . . . . . . . . . . . . . . . . . . . . . . . . . . . . . . . . . . . . . . . . . . . . . . . . . . . . . . . . . . . . . . .5
WiFi and WiFi/BLE-to-USB Adapter . . . . . . . . . . . . . . . . . . . . . . . . . . . . . . . . . . . . . . . . . . . . . . . . . . . . . . . . 6
Magnet Hanger Kit. . . . . . . . . . . . . . . . . . . . . . . . . . . . . . . . . . . . . . . . . . . . . . . . . . . . . . . . . . . . . . . . . . . . . . 7
Voltage Test Leads . . . . . . . . . . . . . . . . . . . . . . . . . . . . . . . . . . . . . . . . . . . . . . . . . . . . . . . . . . . . . . . . . . . . . 7
Thin-Flexi Current Probe . . . . . . . . . . . . . . . . . . . . . . . . . . . . . . . . . . . . . . . . . . . . . . . . . . . . . . . . . . . . . . . . .8
Kensington Lock . . . . . . . . . . . . . . . . . . . . . . . . . . . . . . . . . . . . . . . . . . . . . . . . . . . . . . . . . . . . . . . . . . . . . . . 9
Accessories . . . . . . . . . . . . . . . . . . . . . . . . . . . . . . . . . . . . . . . . . . . . . . . . . . . . . . . . . . . . . . . . . . . . . . . . . . . .10
Storage . . . . . . . . . . . . . . . . . . . . . . . . . . . . . . . . . . . . . . . . . . . . . . . . . . . . . . . . . . . . . . . . . . . . . . . . . . . . . . . .11
Tilt Stand . . . . . . . . . . . . . . . . . . . . . . . . . . . . . . . . . . . . . . . . . . . . . . . . . . . . . . . . . . . . . . . . . . . . . . . . . . . . . .11
Power Supply . . . . . . . . . . . . . . . . . . . . . . . . . . . . . . . . . . . . . . . . . . . . . . . . . . . . . . . . . . . . . . . . . . . . . . . . . . .11
Battery Operation . . . . . . . . . . . . . . . . . . . . . . . . . . . . . . . . . . . . . . . . . . . . . . . . . . . . . . . . . . . . . . . . . . . . . . . .12
Navigation and User Interface . . . . . . . . . . . . . . . . . . . . . . . . . . . . . . . . . . . . . . . . . . . . . . . . . . . . . . . . . . . . . .13
Connector Panel Decal. . . . . . . . . . . . . . . . . . . . . . . . . . . . . . . . . . . . . . . . . . . . . . . . . . . . . . . . . . . . . . . . . . . .15
Power . . . . . . . . . . . . . . . . . . . . . . . . . . . . . . . . . . . . . . . . . . . . . . . . . . . . . . . . . . . . . . . . . . . . . . . . . . . . . . . . .16
Mains Power Source . . . . . . . . . . . . . . . . . . . . . . . . . . . . . . . . . . . . . . . . . . . . . . . . . . . . . . . . . . . . . . . . . . . 16
Measurement Line Power Source . . . . . . . . . . . . . . . . . . . . . . . . . . . . . . . . . . . . . . . . . . . . . . . . . . . . . . . . .16
Battery Power Source . . . . . . . . . . . . . . . . . . . . . . . . . . . . . . . . . . . . . . . . . . . . . . . . . . . . . . . . . . . . . . . . . .17
Table of Contents
1.888.610.7664 sales@GlobalTestSupply.com
Fluke-Direct
.com

1736/1738
Users Manual
ii
Touch Screen . . . . . . . . . . . . . . . . . . . . . . . . . . . . . . . . . . . . . . . . . . . . . . . . . . . . . . . . . . . . . . . . . . . . . . . . . . .18
Brightness Button . . . . . . . . . . . . . . . . . . . . . . . . . . . . . . . . . . . . . . . . . . . . . . . . . . . . . . . . . . . . . . . . . . . . . 18
Calibration . . . . . . . . . . . . . . . . . . . . . . . . . . . . . . . . . . . . . . . . . . . . . . . . . . . . . . . . . . . . . . . . . . . . . . . . . . . 18
Basic Navigation . . . . . . . . . . . . . . . . . . . . . . . . . . . . . . . . . . . . . . . . . . . . . . . . . . . . . . . . . . . . . . . . . . . . . .18
First-time Use/Setup Wizard. . . . . . . . . . . . . . . . . . . . . . . . . . . . . . . . . . . . . . . . . . . . . . . . . . . . . . . . . . . . . . . .19
First Measurements . . . . . . . . . . . . . . . . . . . . . . . . . . . . . . . . . . . . . . . . . . . . . . . . . . . . . . . . . . . . . . . . . . . . . .20
Function Selection Buttons. . . . . . . . . . . . . . . . . . . . . . . . . . . . . . . . . . . . . . . . . . . . . . . . . . . . . . . . . . . . . . . . .22
Meter . . . . . . . . . . . . . . . . . . . . . . . . . . . . . . . . . . . . . . . . . . . . . . . . . . . . . . . . . . . . . . . . . . . . . . . . . . . . . . .22
Live Trend . . . . . . . . . . . . . . . . . . . . . . . . . . . . . . . . . . . . . . . . . . . . . . . . . . . . . . . . . . . . . . . . . . . . . . .22
Scope . . . . . . . . . . . . . . . . . . . . . . . . . . . . . . . . . . . . . . . . . . . . . . . . . . . . . . . . . . . . . . . . . . . . . . . . . .22
Harmonics . . . . . . . . . . . . . . . . . . . . . . . . . . . . . . . . . . . . . . . . . . . . . . . . . . . . . . . . . . . . . . . . . . . . . . .22
Measurement Configuration . . . . . . . . . . . . . . . . . . . . . . . . . . . . . . . . . . . . . . . . . . . . . . . . . . . . . . . . .23
Study Type . . . . . . . . . . . . . . . . . . . . . . . . . . . . . . . . . . . . . . . . . . . . . . . . . . . . . . . . . . . . . . . . . . . . . .24
Power Quality . . . . . . . . . . . . . . . . . . . . . . . . . . . . . . . . . . . . . . . . . . . . . . . . . . . . . . . . . . . . . . . . . . . . 24
Topology (Distribution System) . . . . . . . . . . . . . . . . . . . . . . . . . . . . . . . . . . . . . . . . . . . . . . . . . . . . . . .25
Auxiliary Input . . . . . . . . . . . . . . . . . . . . . . . . . . . . . . . . . . . . . . . . . . . . . . . . . . . . . . . . . . . . . . . . . . . . 32
Connection Verification and Correction . . . . . . . . . . . . . . . . . . . . . . . . . . . . . . . . . . . . . . . . . . . . . . . . . 35
Power. . . . . . . . . . . . . . . . . . . . . . . . . . . . . . . . . . . . . . . . . . . . . . . . . . . . . . . . . . . . . . . . . . . . . . . . . . . . . . . 36
Logger . . . . . . . . . . . . . . . . . . . . . . . . . . . . . . . . . . . . . . . . . . . . . . . . . . . . . . . . . . . . . . . . . . . . . . . . . . . . . . 37
Memory/Settings Button . . . . . . . . . . . . . . . . . . . . . . . . . . . . . . . . . . . . . . . . . . . . . . . . . . . . . . . . . . . . . . . .47
Logging Sessions . . . . . . . . . . . . . . . . . . . . . . . . . . . . . . . . . . . . . . . . . . . . . . . . . . . . . . . . . . . . . . . . . 47
Screen Capture . . . . . . . . . . . . . . . . . . . . . . . . . . . . . . . . . . . . . . . . . . . . . . . . . . . . . . . . . . . . . . . . . . .47
Instrument Settings . . . . . . . . . . . . . . . . . . . . . . . . . . . . . . . . . . . . . . . . . . . . . . . . . . . . . . . . . . . . . . . . 47
Status Information . . . . . . . . . . . . . . . . . . . . . . . . . . . . . . . . . . . . . . . . . . . . . . . . . . . . . . . . . . . . . . . . .50
Firmware Version . . . . . . . . . . . . . . . . . . . . . . . . . . . . . . . . . . . . . . . . . . . . . . . . . . . . . . . . . . . . . . . . .50
Installed Licenses . . . . . . . . . . . . . . . . . . . . . . . . . . . . . . . . . . . . . . . . . . . . . . . . . . . . . . . . . . . . . . . . . 50
Touch Screen Calibration . . . . . . . . . . . . . . . . . . . . . . . . . . . . . . . . . . . . . . . . . . . . . . . . . . . . . . . . . . . 51
WiFi Configuration . . . . . . . . . . . . . . . . . . . . . . . . . . . . . . . . . . . . . . . . . . . . . . . . . . . . . . . . . . . . . . . . . 51
Copy Service Data to USB . . . . . . . . . . . . . . . . . . . . . . . . . . . . . . . . . . . . . . . . . . . . . . . . . . . . . . . . . . 51
Reset to Factory Defaults . . . . . . . . . . . . . . . . . . . . . . . . . . . . . . . . . . . . . . . . . . . . . . . . . . . . . . . . . . .51
Firmware Update . . . . . . . . . . . . . . . . . . . . . . . . . . . . . . . . . . . . . . . . . . . . . . . . . . . . . . . . . . . . . . . . . . 52
1.888.610.7664 sales@GlobalTestSupply.com
Fluke-Direct
.com

Contents (cont.)
iii
Licensed Features . . . . . . . . . . . . . . . . . . . . . . . . . . . . . . . . . . . . . . . . . . . . . . . . . . . . . . . . . . . . . . . . . . . . . . . 52
WiFi Infrastructure . . . . . . . . . . . . . . . . . . . . . . . . . . . . . . . . . . . . . . . . . . . . . . . . . . . . . . . . . . . . . . . . . . . . . 52
1736/Upgrade . . . . . . . . . . . . . . . . . . . . . . . . . . . . . . . . . . . . . . . . . . . . . . . . . . . . . . . . . . . . . . . . . . . . . . . . 53
IEEE 519/Report . . . . . . . . . . . . . . . . . . . . . . . . . . . . . . . . . . . . . . . . . . . . . . . . . . . . . . . . . . . . . . . . . . . . . . 53
License Activation . . . . . . . . . . . . . . . . . . . . . . . . . . . . . . . . . . . . . . . . . . . . . . . . . . . . . . . . . . . . . . . . . . . . . 53
Maintenance. . . . . . . . . . . . . . . . . . . . . . . . . . . . . . . . . . . . . . . . . . . . . . . . . . . . . . . . . . . . . . . . . . . . . . . . . . . . 54
How to Clean . . . . . . . . . . . . . . . . . . . . . . . . . . . . . . . . . . . . . . . . . . . . . . . . . . . . . . . . . . . . . . . . . . . . . . . . . 54
Battery Replacement . . . . . . . . . . . . . . . . . . . . . . . . . . . . . . . . . . . . . . . . . . . . . . . . . . . . . . . . . . . . . . . . . . . 54
Calibration . . . . . . . . . . . . . . . . . . . . . . . . . . . . . . . . . . . . . . . . . . . . . . . . . . . . . . . . . . . . . . . . . . . . . . . . . . . 54
Service and Parts . . . . . . . . . . . . . . . . . . . . . . . . . . . . . . . . . . . . . . . . . . . . . . . . . . . . . . . . . . . . . . . . . . . . . . . . 55
Energy Analyze Plus Software . . . . . . . . . . . . . . . . . . . . . . . . . . . . . . . . . . . . . . . . . . . . . . . . . . . . . . . . . . . . . .57
System Requirements . . . . . . . . . . . . . . . . . . . . . . . . . . . . . . . . . . . . . . . . . . . . . . . . . . . . . . . . . . . . . . . . . . 57
PC Connections . . . . . . . . . . . . . . . . . . . . . . . . . . . . . . . . . . . . . . . . . . . . . . . . . . . . . . . . . . . . . . . . . . . . . . 58
WiFi Support. . . . . . . . . . . . . . . . . . . . . . . . . . . . . . . . . . . . . . . . . . . . . . . . . . . . . . . . . . . . . . . . . . . . . . . . . . . . 58
WiFi Setup. . . . . . . . . . . . . . . . . . . . . . . . . . . . . . . . . . . . . . . . . . . . . . . . . . . . . . . . . . . . . . . . . . . . . . . . . . . 58
WiFi Direct Connection . . . . . . . . . . . . . . . . . . . . . . . . . . . . . . . . . . . . . . . . . . . . . . . . . . . . . . . . . . . . . . . . . 59
WiFi-Infrastructure . . . . . . . . . . . . . . . . . . . . . . . . . . . . . . . . . . . . . . . . . . . . . . . . . . . . . . . . . . . . . . . . . . . . . 59
Remote Control . . . . . . . . . . . . . . . . . . . . . . . . . . . . . . . . . . . . . . . . . . . . . . . . . . . . . . . . . . . . . . . . . . . . . . . . . 60
Wireless Access to PC Software . . . . . . . . . . . . . . . . . . . . . . . . . . . . . . . . . . . . . . . . . . . . . . . . . . . . . . . . . . . . 61
Fluke Connect
Wireless System . . . . . . . . . . . . . . . . . . . . . . . . . . . . . . . . . . . . . . . . . . . . . . . . . . . . . . . . .61
Fluke Connect
App . . . . . . . . . . . . . . . . . . . . . . . . . . . . . . . . . . . . . . . . . . . . . . . . . . . . . . . . . . . . . . . . . . . 61
Wiring Configurations . . . . . . . . . . . . . . . . . . . . . . . . . . . . . . . . . . . . . . . . . . . . . . . . . . . . . . . . . . . . . . . . . . . . 62
Glossary . . . . . . . . . . . . . . . . . . . . . . . . . . . . . . . . . . . . . . . . . . . . . . . . . . . . . . . . . . . . . . . . . . . . . . . . . . . . . . . 65
General Specifications . . . . . . . . . . . . . . . . . . . . . . . . . . . . . . . . . . . . . . . . . . . . . . . . . . . . . . . . . . . . . . . . . . . . 66
Environmental Specifications . . . . . . . . . . . . . . . . . . . . . . . . . . . . . . . . . . . . . . . . . . . . . . . . . . . . . . . . . . . . . . . 66
Electrical Specifications . . . . . . . . . . . . . . . . . . . . . . . . . . . . . . . . . . . . . . . . . . . . . . . . . . . . . . . . . . . . . . . . . . . 68
1.888.610.7664 sales@GlobalTestSupply.com
Fluke-Direct
.com

1
Introduction
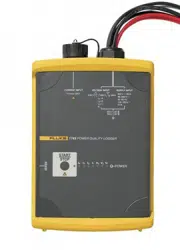
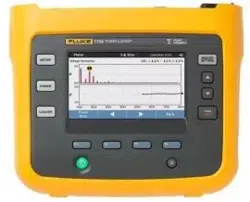
The 1736 and 1738 Power Loggers (the Logger or Product) are
compact devices for energy and power quality surveys. With a built-in
touch screen and USB flash drive support, it is easy to configure,
verify, and download measurement sessions without the need of a
computer at the measurement location. All illustrations in this manual
show the 1738.
The Logger makes these measurements:
•
Basic Measurements: Voltage (V), Current (A), Frequency (Hz),
Phase rotation indication, 2 dc channels (supports user-supplied
external sensor for other measurements such as temperature,
humidity, and air speed)
•
Power: Active Power (W), Apparent Power (VA), Nonactive
Power, (var), Power Factor
•
Fundamental Power: Fundamental Active Power (W),
Fundamental Apparent Power (VA), Fundamental Reactive Power
(var), DPF (CosΦ)
•
Energy: Active Energy (Wh), Apparent Energy (VAh), Non-active
Energy (varh)
•
Demand: Demand (Wh), Maximum Demand (Wh), Energy costs
•
Harmonics: Harmonic components up to and including the 50th
and Total Harmonic Distortion of Voltage and Current
Fluke Energy Analyze Plus software is included with the Product for a
thorough energy analysis and professional report of the measurement
results.
1.888.610.7664 sales@GlobalTestSupply.com
Fluke-Direct
.com

1736/1738
Users Manual
2
Safety Information
A Warning identifies hazardous conditions and procedures that are
dangerous to the user. A Caution identifies conditions and procedures
that can cause damage to the Product or the equipment under test.
Warning
To prevent possible electrical shock, fire, or personal
injury:
•
Read all safety information before you use the Product.
•
Do not alter the Product and use only as specified, or
the protection supplied by the Product can be
compromised.
•
Comply with local and national safety codes. Use
personal protective equipment (approved rubber
gloves, face protection, and flame-resistant clothes) to
prevent shock and arc blast injury where hazardous
live conductors are exposed.
•
Examine the case before you use the Product. Look for
cracks or missing plastic. Carefully look at the
insulation around the terminals.
•
Replace the mains power cord if the insulation is
damaged or if the insulation shows signs of wear.
1.888.610.7664 sales@GlobalTestSupply.com
Fluke-Direct
.com

Power Logger
Safety Information
3
•
Use Product-approved measurement category (CAT),
voltage, and amperage rated accessories (probes, test
leads, and adapters) for all measurements.
•
Do not use test leads if they are damaged. Examine the
test leads for damaged insulation and measure a
known voltage.
•
Do not use the Product if it is altered or damaged.
•
The battery door must be closed and locked before you
operate the Product.
•
Do not work alone.
•
Use this Product indoors only.
•
Do not use the Product around explosive gas, vapor, or
in damp or wet environments.
•
Use only the external mains power supply included
with the Product.
•
Do not exceed the Measurement Category (CAT) rating
of the lowest rated individual component of a Product,
probe, or accessory.
•
Keep fingers behind the finger guards on the probes.
•
Do not use a current measurement as an indication
that a circuit is safe to touch. A voltage measurement is
necessary to know if a circuit is hazardous.
•
Do not touch voltages >30 V ac rms, 42 V ac peak, or
60 V dc.
•
Do not apply more than the rated voltage, between the
terminals or between each terminal and earth ground.
•
Measure a known voltage first to make sure that the
Product operates correctly.
•
De-energize the circuit or wear personal protective
equipment in compliance with local requirements
before you apply or remove the flexible current probe.
•
Remove all probes, test leads, and accessories before
the battery door is opened.
•
Do not use USB accessories when the Product is
installed in environment with wires or exposed metal
parts with hazardous live voltage such as in cabinets.
•
Do not operate the touch screen with sharp objects
•
Do not use the Product if the protection film on the
touch panel is damaged.
•
Do not touch the metal parts of one test lead when the
other is still connected to hazardous voltage.
Table 1 is a list of symbols used on the Product or in this manual.
1.888.610.7664 sales@GlobalTestSupply.com
Fluke-Direct
.com
1736/1738
Users Manual
4
Table 1. Symbols
Symbol Description Symbol Description
Consult user documentation.
Conforms to relevant South Korean EMC standards.
WARNING. RISK OF DANGER.
Conforms to relevant Australian EMC standards.
WARNING. HAZARDOUS VOLTAGE. Risk of
electric shock.
Certified by CSA Group to North American safety standards.
Earth
Conforms to European Union directives.
Battery
Double Insulated
Measurement Category II is applicable to test and measuring circuits connected directly to utilization points (socket outlets and
similar points) of the low-voltage MAINS installation.
Measurement Category III is applicable to test and measuring circuits connected to the distribution part of the building’s low-voltage
MAINS installation.
Measurement Category IV is applicable to test and measuring circuits connected at the source of the building’s low-voltage MAINS
installation.
This product contains a Lithium-ion battery. Do not mix with the solid waste stream. Spent batteries should be disposed of by a
qualified recycler or hazardous materials handler per local regulations. Contact your authorized Fluke Service Center for recycling
information.
This product complies with the WEEE Directive marking requirements. The affixed label indicates that you must not discard this
electrical/electronic product in domestic household waste. Product Category: With reference to the equipment types in the WEEE
Directive Annex I, this product is classed as category 9 "Monitoring and Control Instrumentation" product. Do not dispose of this
product as unsorted municipal waste.
1.888.610.7664 sales@GlobalTestSupply.com
Fluke-Direct
.com
Power Logger
Before You Start
5
Before You Start
Below is a list of the items included with your purchase. Carefully
unpack and inspect each of the items:
•
Power Logger
•
Power Supply
•
Voltage Test Lead, 3-phase + N
•
4x Dolphin Clips, Black
•
4x i173x-flex1500 Thin-Flexi Current Probe, 30.5 cm (12 in)
•
Set of color-coded Wire Clips
•
Mains Power Cable (see Table 2)
•
Set of 2 test leads with stackable plugs, 10 cm (3.9 in)
•
Set of 2 test leads with stackable plugs, 1.5 m (6.6 ft)
•
DC Power Cable
•
USB Cable A, Mini-USB
•
Soft Storage Bag/Case
•
Input Connector Decal (see Table 6)
•
Documentation Info Pack (Quick Reference Card, Safety
Information, Battery Pack Safety Information, iFlex Probe Safety
Information)
•
4 GB USB Flash Drive (includes Users Manual and PC application
software, Fluke Energy Analyze Plus)
Note
The power cord and input connector decal are country
specific and vary according to the order destination.
The 1738 Power Logger also includes these items in the standard
purchase list:
•
WiFi/BLE to USB Adapter
•
Magnet Hanger Kit
•
Set of 4 Magnet Probes for 4 mm Banana Plugs
These items are available for the 1736 Power Logger as optional
accessories.
Note
The WiFi/BLE adapter is included only when the radio
certification is available for your country. Check
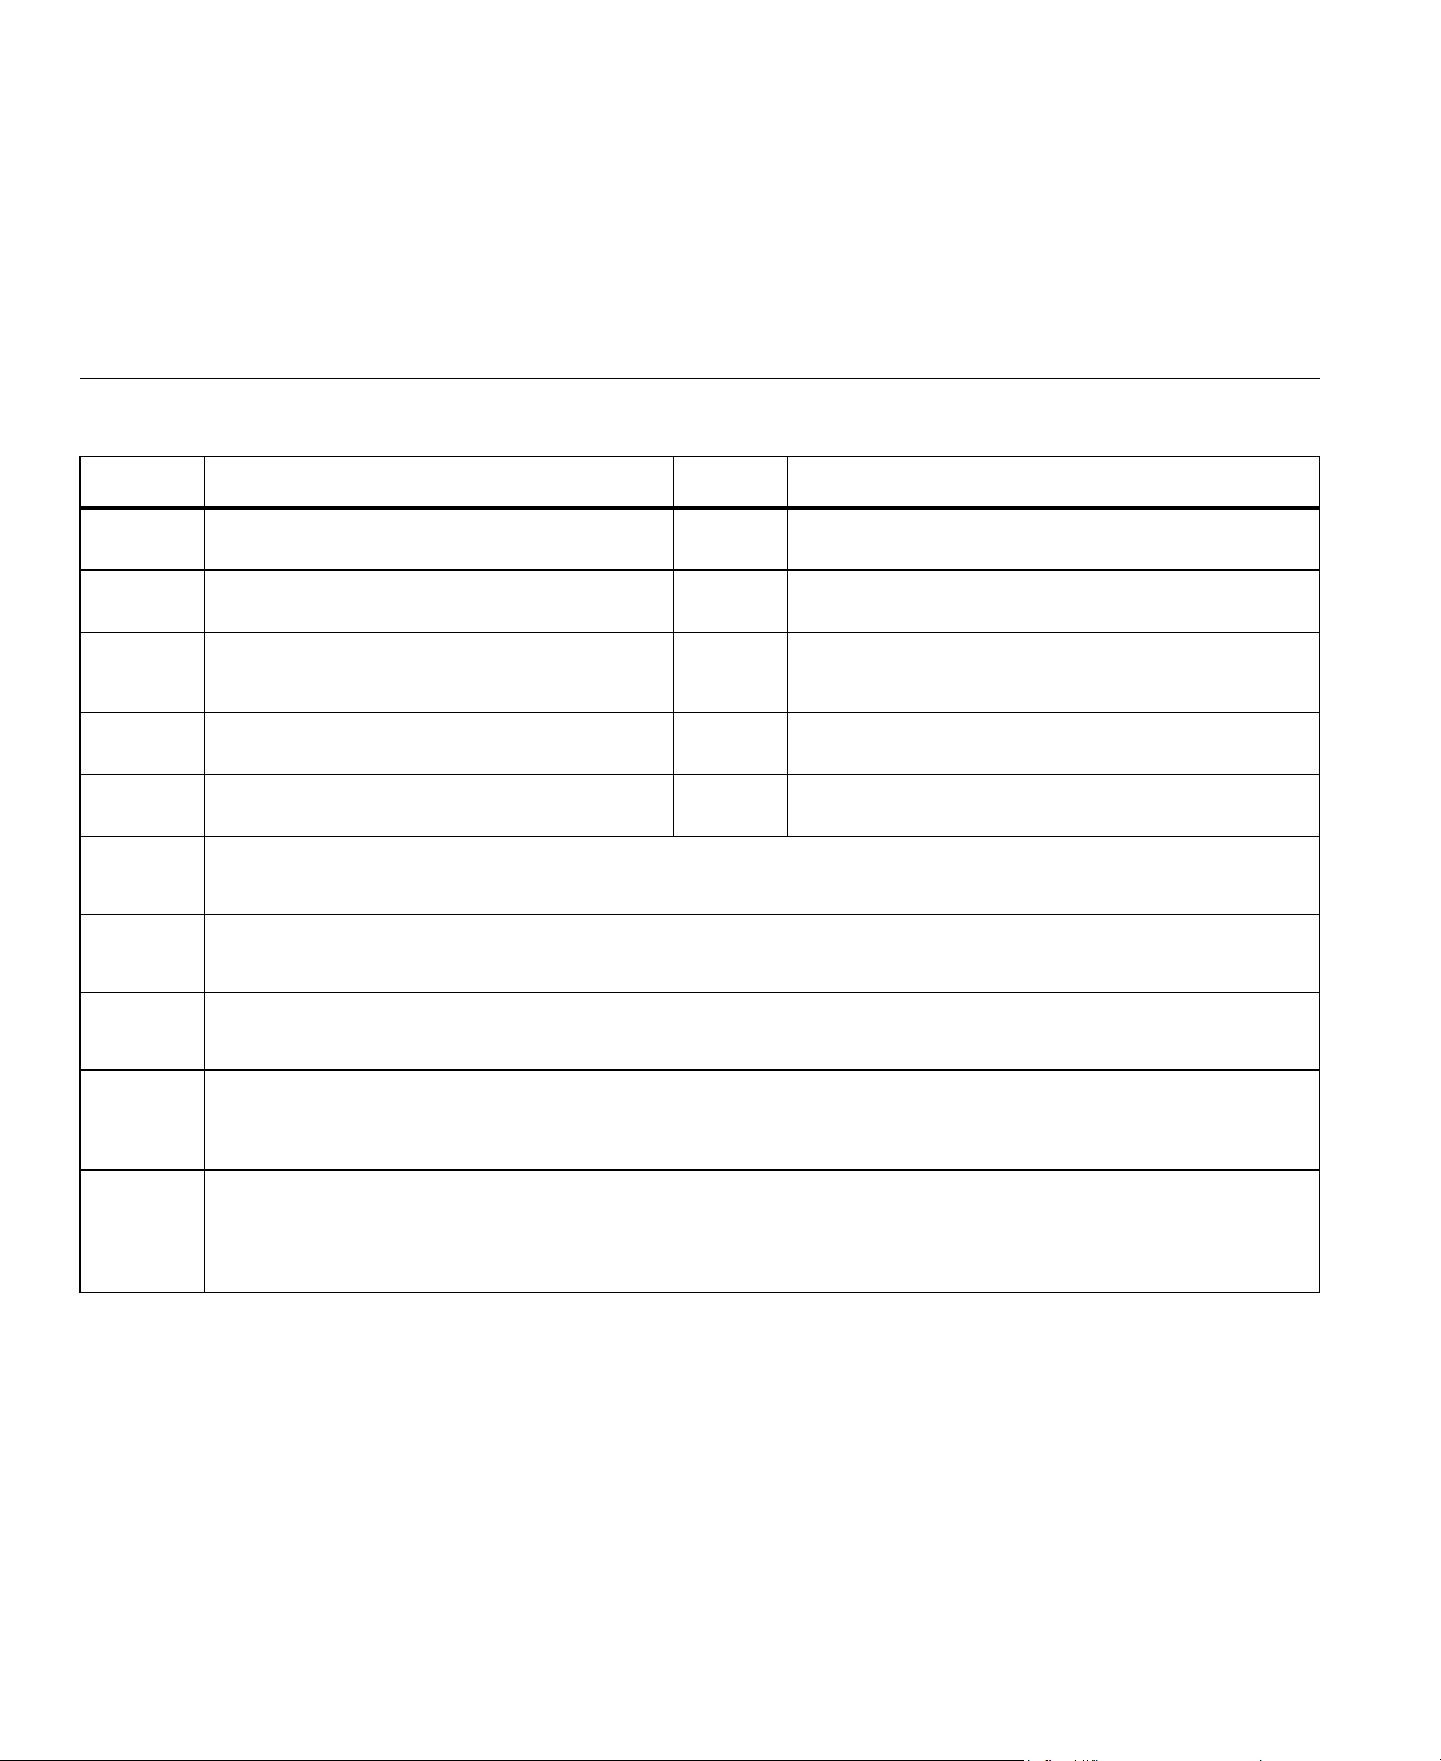
Table 2. Country-Specific Mains Power Cable
Item Location Part Number
North America/Japan 1552374
Universal Euro 1552388
United Kingdom 1552342
Australia/China 1552339
Brazil 4322049
1
2
3
4
5
1.888.610.7664 sales@GlobalTestSupply.com
Fluke-Direct
.com
1736/1738
Users Manual
6
WiFi and WiFi/BLE-to-USB Adapter
The USB adapter enables the wireless connectivity of the Logger:
•
Connection to the Fluke Connect
smartphone app for easy asset
management and data sharing.
•
Data transfer to "Energy Analyze Plus" PC software.
•
Remote control via Virtual Network Computing (VNC). See
Remote Control on page 60 for more information about VNC.
•
Display and store data of up to 2 modules of the Fluke FC 3000
series together with the instrument data into logging sessions
(requires WiFi/BLE adapter feature, available with firmware
version 2.0).
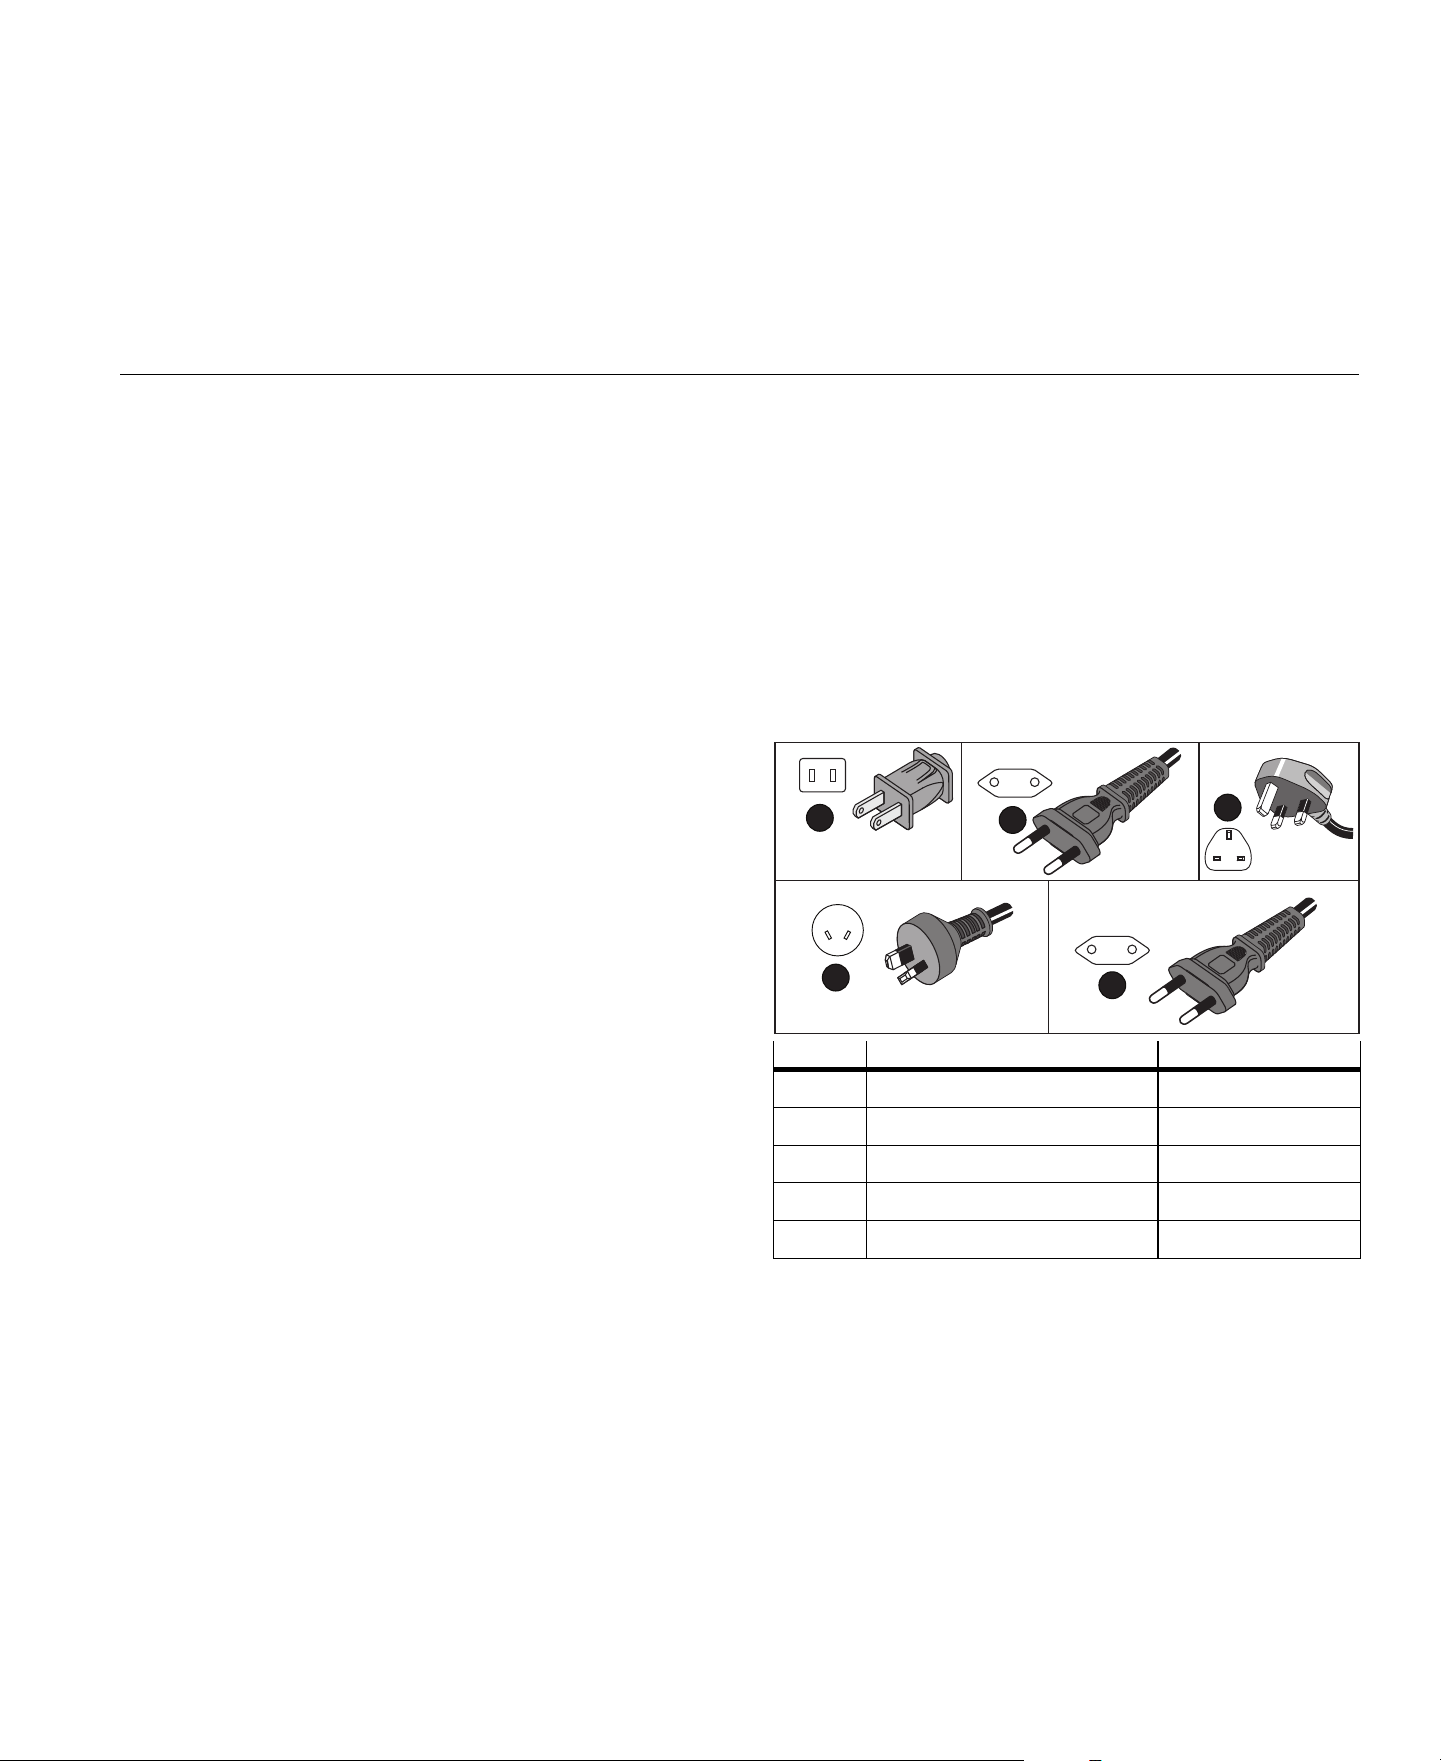
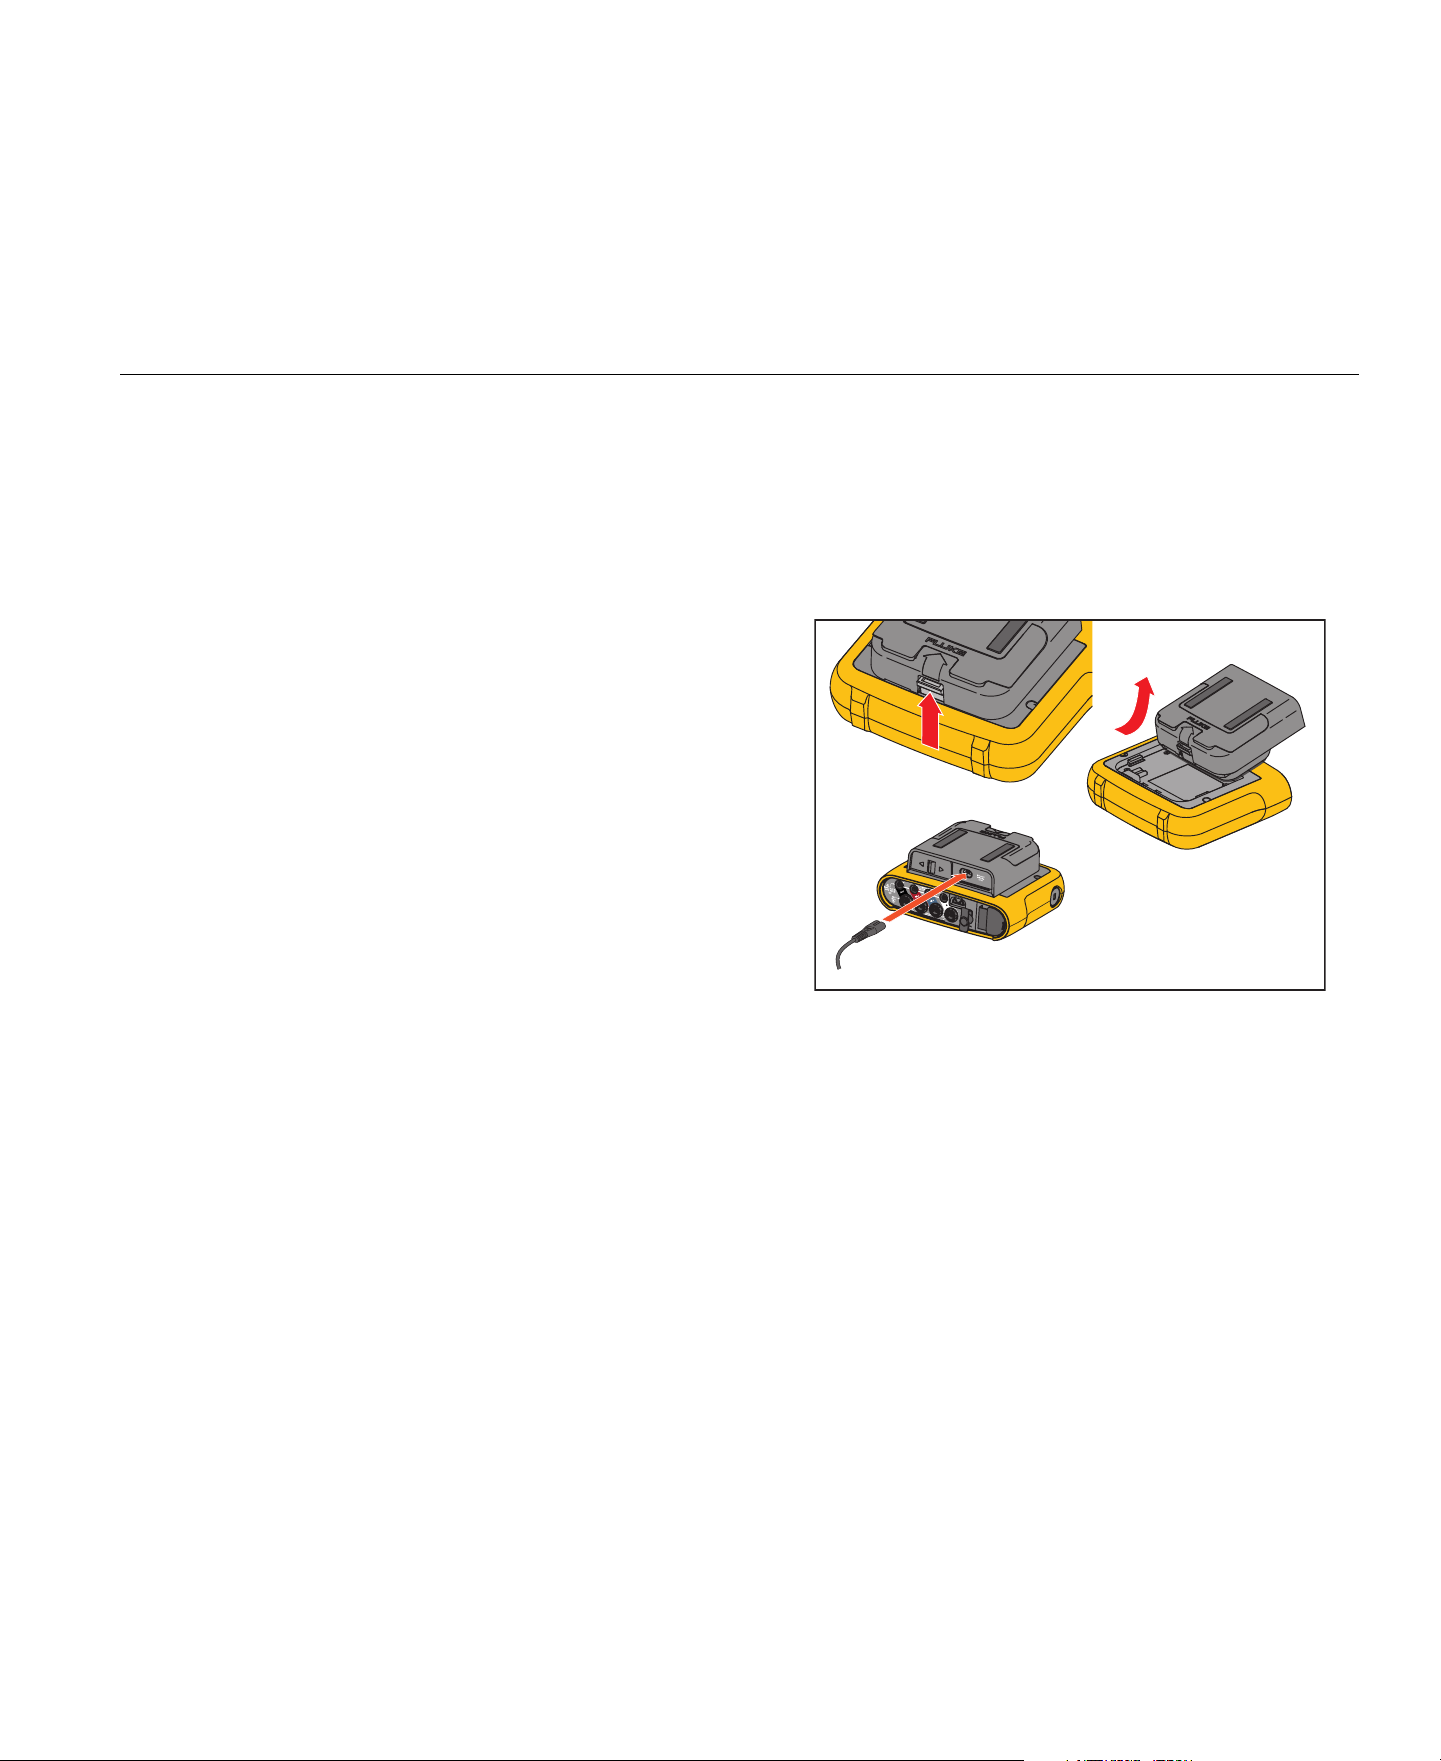
To install the adapter in the Logger:
1.
Remove the Power Supply. See Figure 1.
2.
Unscrew the four screws.
3.
Remove the battery door.
4.
Remove the battery.
5.
Insert the WiFi/BLE adapter in the compartment with the serial
number visible.
6.
Connect the WiFi/BLE adapter to the USB port by sliding it gently
to the right until the adapter snaps into the USB socket of the
Logger. About 3.5 mm (0.14 in) of the metal shield should be
visible.
7.
Insert the battery.
8.
Fasten the battery door.
Figure 1. Adapter Installation
1 2
3
5
4
1.888.610.7664 sales@GlobalTestSupply.com
Fluke-Direct
.com
Power Logger
Before You Start
7
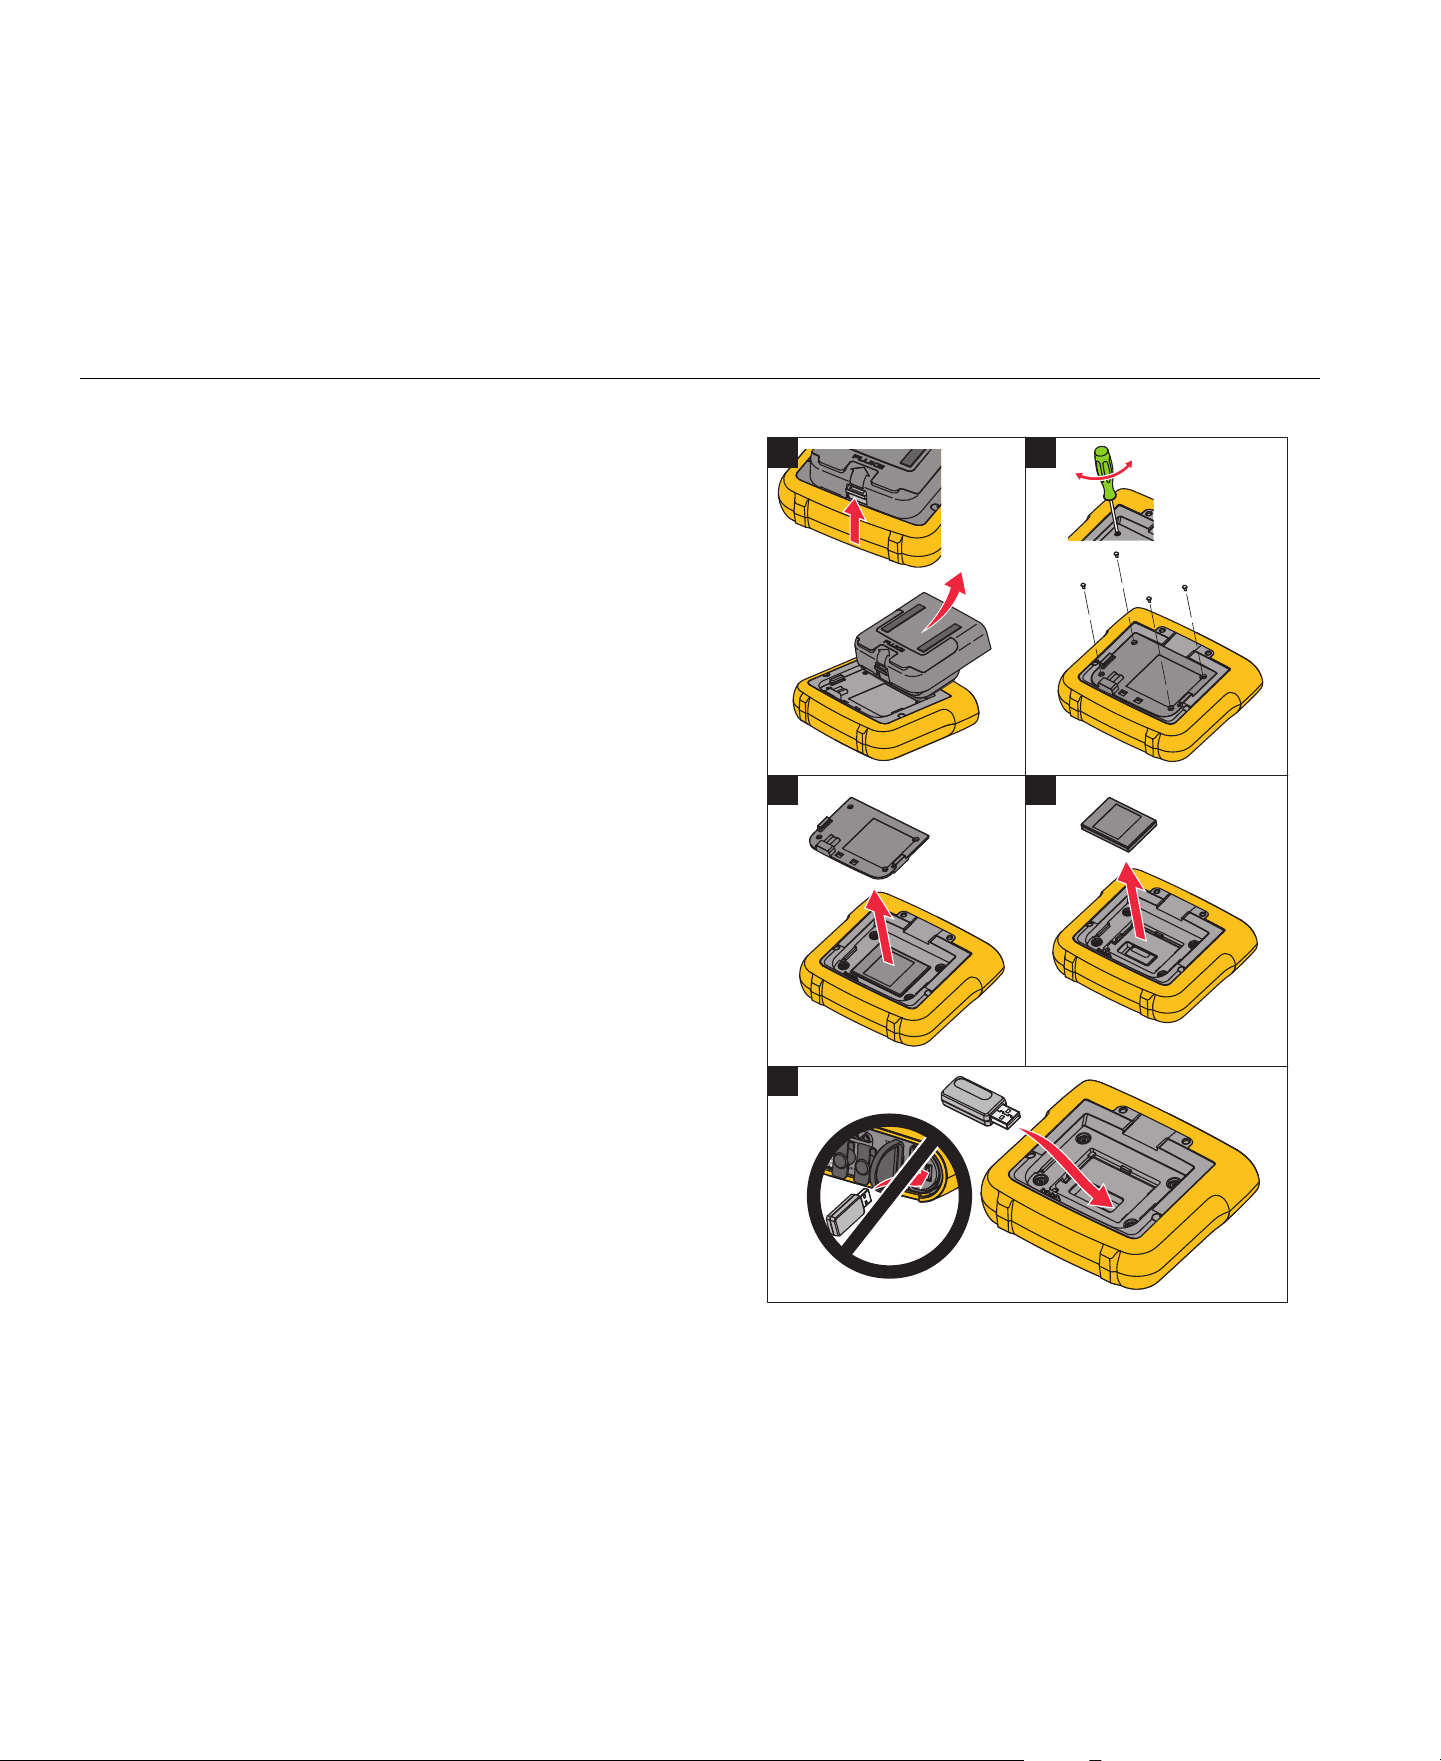
Magnet Hanger Kit
The accessory shown in Figure 2 is used to:
•
Hang the Logger with power supply attached (use two magnets)
•
Hang the Logger separately (use two magnets)
•
Hang the power supply separately (use one magnet)
Voltage Test Leads
Voltage test leads are four-core, flat, test leads that do not tangle and
can be installed in tight spaces. On installations where the access to
Neutral is out of reach with the three-phase test lead, use the black
test lead to extend the Neutral lead.
For single phase measurements use the red and black test leads.
Figure 2. Magnet Hanger Kit
1.888.610.7664 sales@GlobalTestSupply.com
Fluke-Direct
.com
1736/1738
Users Manual
8
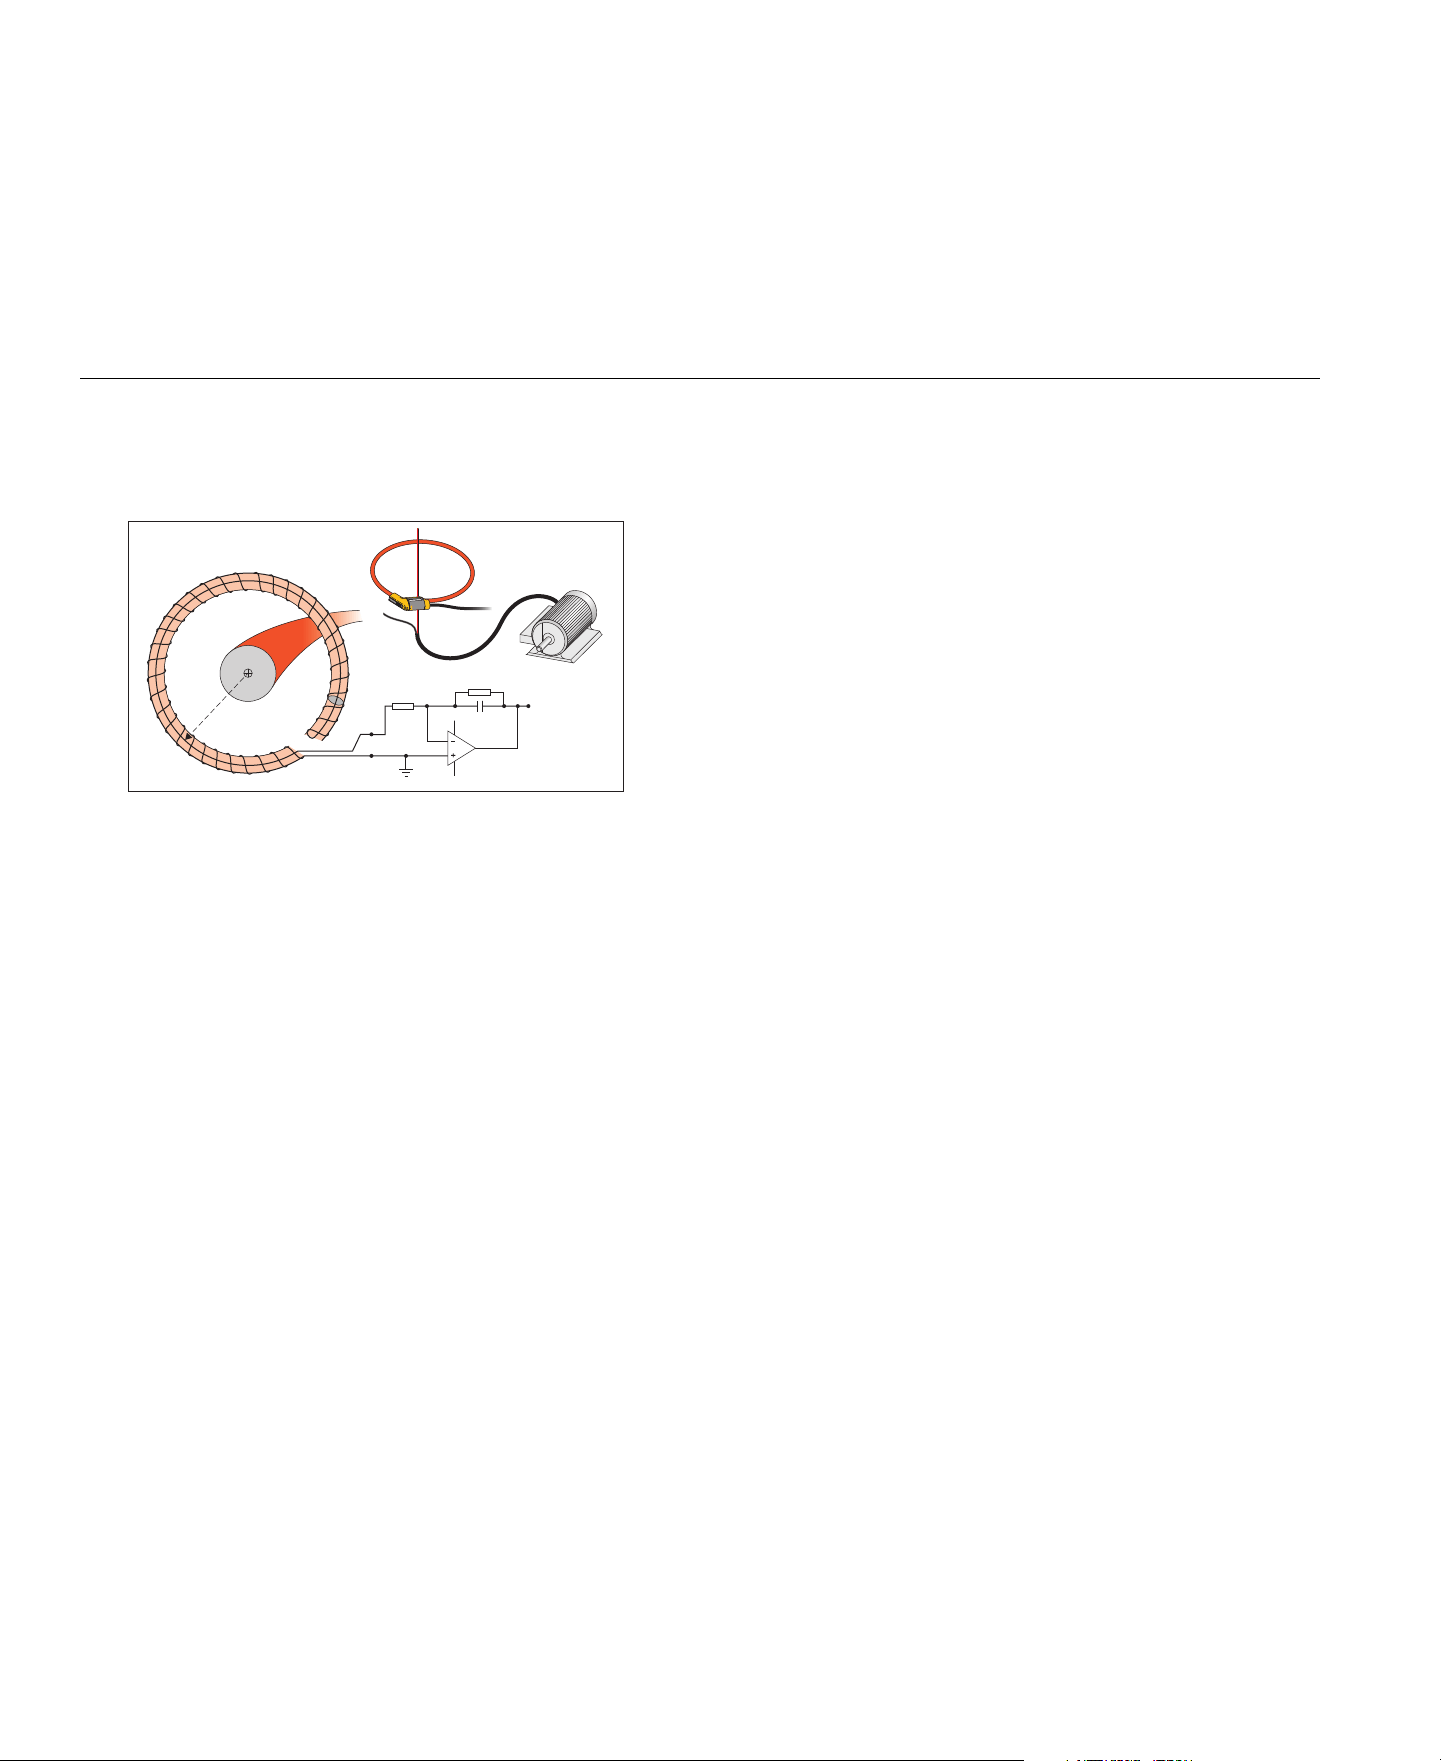
Thin-Flexi Current Probe
The Thin-Flexi Current Probe works on the Rogowski coil (R-coil)
principle that is a toroid of wire used to measure an alternating current
through a wire encircled by the toroid. See Figure 3.
Figure 3. R-Coil Operation Principle
The R-coil has advantages over other types of current transformers:
•
It is not a closed loop. The second terminal is passed back through
the center of the toroid core (commonly a plastic or rubber tube)
and connected along the first terminal. This allows the coil to be
open-ended, flexible, and able to be wrapped around a live
conductor without disturbing it.
•
It has an air core rather than an iron core. It has a low inductance
and can respond to fast-changing currents.
•
Because it has no iron core to saturate, it is highly linear even
when subjected to large currents, such as those used in electric
power transmission or pulsed-power applications.
A correctly formed R-coil, with equally spaced windings, is largely
immune to electromagnetic interference.
i(t)
v(t)
A
r
10 k R3
330 k R1
10 nF C1
LF347
UI:A
1
GND
2
114
3
V
in
V
out
1.888.610.7664 sales@GlobalTestSupply.com
Fluke-Direct
.com
Power Logger
Before You Start
9
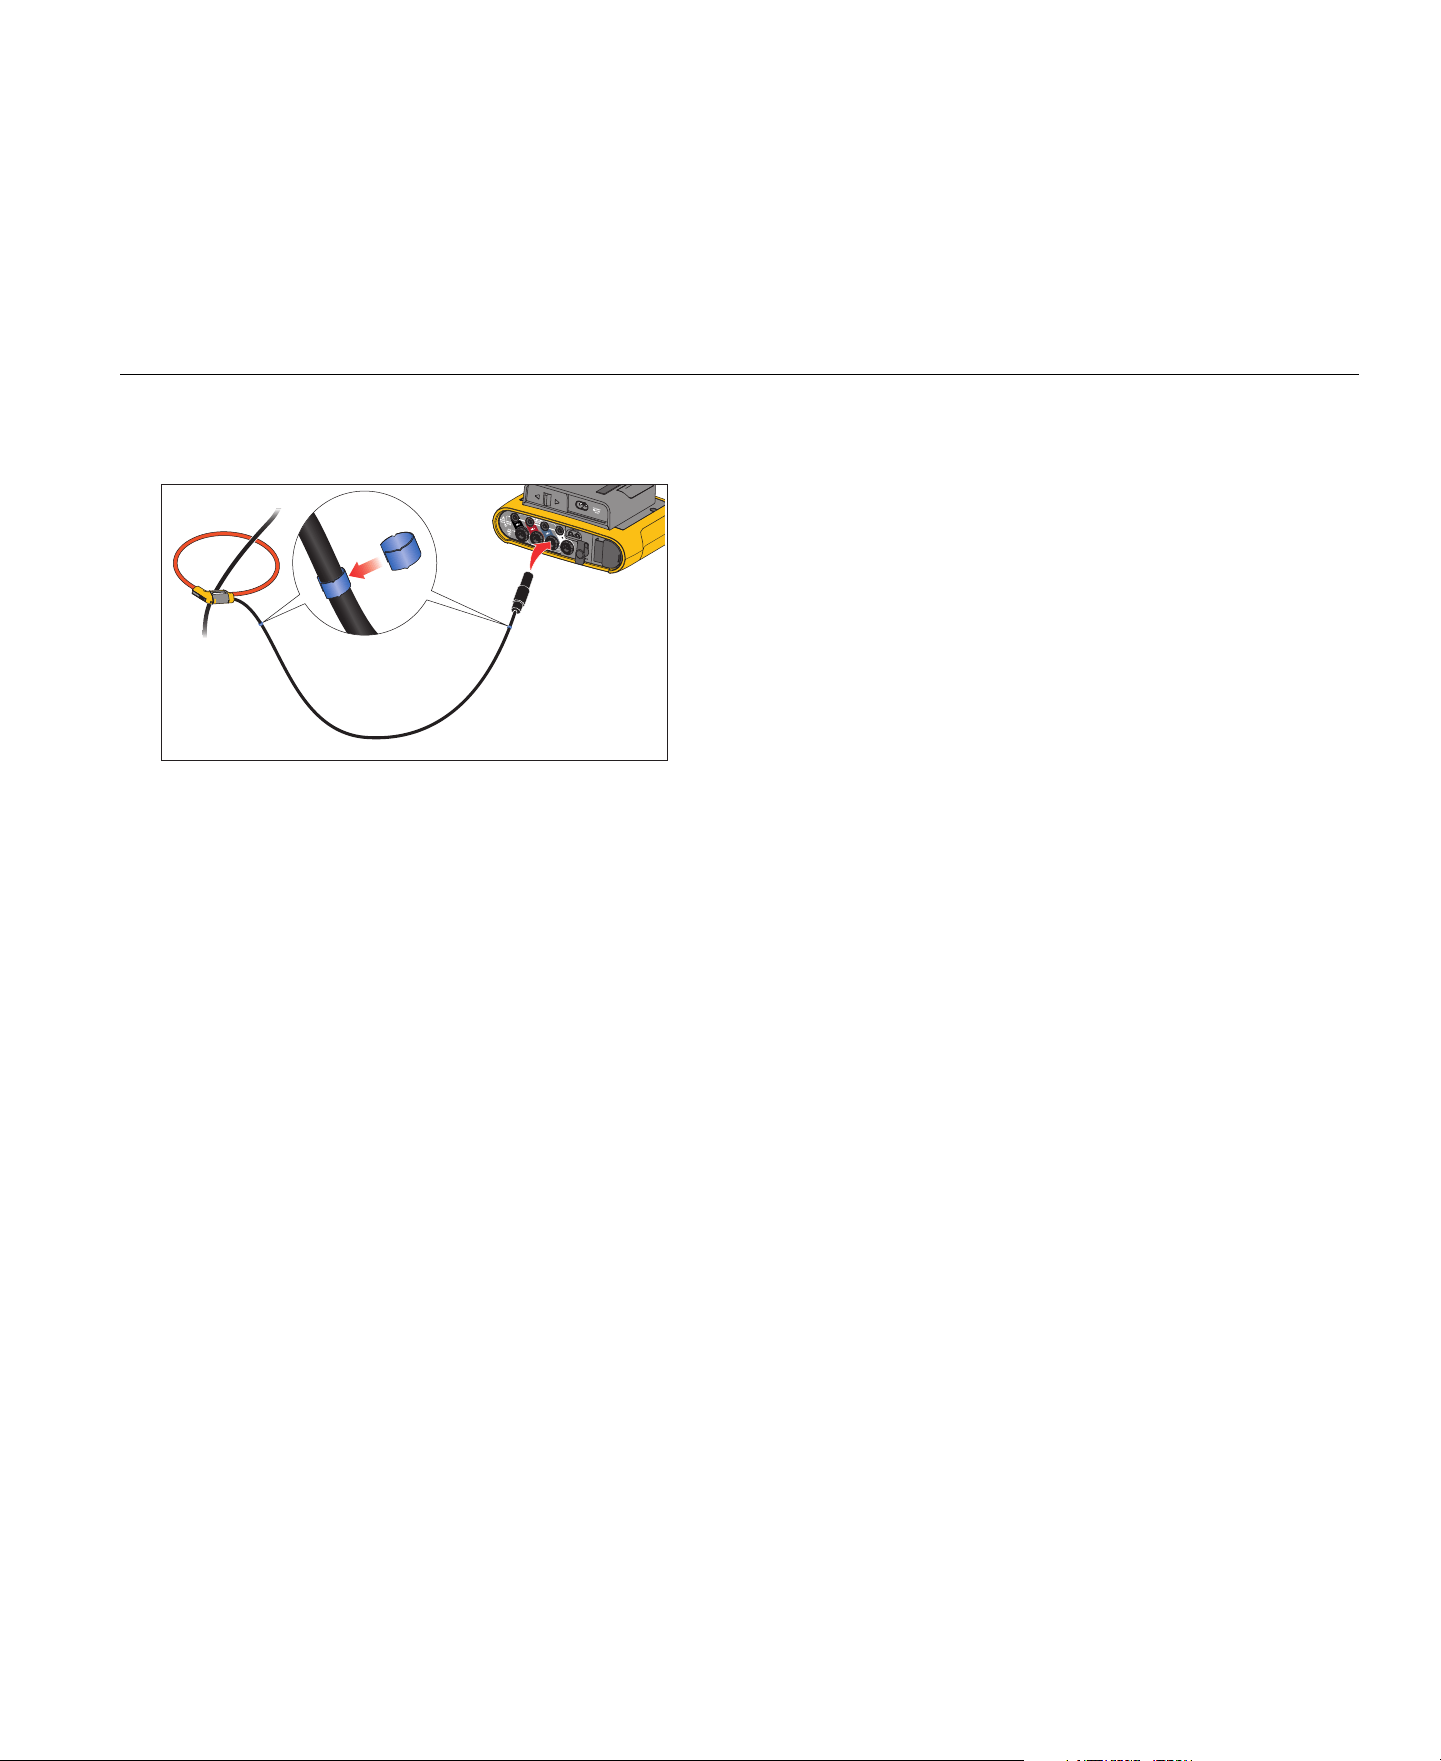
Use the color clips for easy identification of the four current probes.
Apply the clips that are appropriate for your local wiring codes on both
ends of the current probe cable. See Figure 4.
Figure 4. Test Leads with Color Coding
Kensington Lock
A Kensington Security Slot (also called a K-Slot or Kensington lock) is
part of a built-in anti-theft system. It is a small, metal-reinforced, oval
hole found on the right side of the Logger (see item 6 in Table 4). It is
used for attaching a lock-and-cable apparatus. The lock is secured in
place with a key or combination lock attached to a plastic-cover metal
cable. The end of the cable has a small loop that allows the cable to
be looped around a permanent object, such as a cabinet door, to
secure it in place. This lock is available from most electronics and
computer suppliers.
1.888.610.7664 sales@GlobalTestSupply.com
Fluke-Direct
.com

1736/1738
Users Manual
10
Accessories
Table 3 is a list of the accessories that are available and sold
separately for the Logger. The warranty on included accessories is
1 year. For the most up-to-date information on accessories, go to
Table 3. Accessories
Part ID Description
i17xx-flex 1500 Thin-Flexi Current Probe (single) 1500 A, 30.5 cm (12 in.)
i17xx-flex 1500/3PK Set of 3 Thin-Flexi Current Probes
i17xx-flex 1500/4PK Set of 4 Thin-Flexi Current Probes
i17xx-flex 3000 Thin-Flexi Current Probe (single) 3000 A, 61 cm (24 in)
i17xx-flex 3000/3PK Set of 3 Thin-Flexi Current Probes
i17xx-flex 3000/4PK Set of 4 Thin-Flexi Current Probes
i17xx-flex 6000 Thin-Flexi Current Probe (single) 6000 A 90.5 cm (36 in)
i17xx-flex 6000/3PK Set of 3 Thin-Flexi Current Probes
i17xx-flex 6000/4PK Set of 4 Thin-Flexi Current Probes
Fluke-17xx Test Lead 0.1 m Test Lead
Fluke-17xx Test Lead 1.5 m Test Lead
3PHVL-1730 Voltage Test Lead 3-phase + N
i40s-EL Current Clamp 40 A (single) Current Clamp
i40s-EL/3PK Set of 3 Current Clamps, 40 A
Fluke-1730-Hanger Kit Hanger Kit
C17xx Soft Case
FLUKE-1736/UPGRADE Upgrade Kit for 1736 to 1738 (includes: Hanger, Magnet Probes, 1736 to 1738 Upgrade Kit, and Software License)
IEEE 519/REPORT Software License for IEEE 519 Reporting
FLK-WIFI/BLE WiFi/BLE to USB Adapter
17xx AUX Input Adapter Auxiliary Input Adapter for up to 2 DC voltages (0 V to 10 V and 0 V to 1000 V)
MP1-MAGNET PROBE 1 Set of 4 Magnet Probes for 4 mm banana plugs
1.888.610.7664 sales@GlobalTestSupply.com
Fluke-Direct
.com
Power Logger
Storage
11
Storage
When not in use, keep the Logger in the protective storage bag/case.
The bag/case has sufficient space for the Logger and all the
accessories.
If the Logger is stored for an extended period of time or is not in use
for a long time, you should charge the battery at least once every six
months.
Tilt Stand
The power supply includes a tilt stand. When used, the tilt stand
positions the display at a good angle for use on a tabletop surface. To
use, attach the power supply to the Logger and open the tilt stand.
Power Supply
The Logger includes a removable power supply, see Figure 5. The
power supply is either attached to the Logger or used externally with a
dc power cable. The configuration with the externally connected
power supply is preferred in locations where the Logger with the
power supply attached is too big to fit in a cabinet.
When the power supply is connected with the Logger and connected
to line power, it:
•
converts line power to dc power and is used directly by the Logger
•
automatically turns on the Logger and continuously powers the
Logger from the external source (after initial power on, the power
button turns on and turns off the Logger)
•
recharges the battery
The power cord/measurement line cover slides to select the input
source.
Warning
To prevent possible electrical shock, fire, or personal
injury, do not use the power supply if the mains power
cable/measurement line slide-cover is missing.
Figure 5. Power Supply and Battery
1.888.610.7664 sales@GlobalTestSupply.com
Fluke-Direct
.com

1736/1738
Users Manual
12
Battery Operation
Caution
To prevent damage to the Product:
•
Do not leave batteries unused for extended periods of
time, either in the product or in storage.
•
When a battery has not been used for six months,
check the charge status and charge the battery as
appropriate.
•
Clean battery packs and contacts with a clean, dry
cloth.
•
Battery packs must be charged before use.
•
After extended storage, it can be necessary to charge
and discharge a battery pack to obtain maximum
performance.
•
Dispose of the batteries properly.
The Logger also operates on an internal rechargeable Lithium-ion
battery. After you unpack and inspect the Logger, fully charge the
battery before first use. Afterwards, charge the battery when the
battery icon on the screen indicates that power is low. The battery
automatically charges when the Logger is connected to the mains
power. The Logger continues to charge when turned off and
connected to mains power.
Note
The battery charge is faster when the Logger is turned off.
To charge the battery:
1.
Connect the mains cord to the ac input socket on the power
supply.
2.
Fit the power supply to the Logger or use the dc power cord to
connect the power supply to the Logger.
3.
Connect to mains power.
Note
• Li-ion batteries keep a charge longer if stored at room
temperature.
• The clock resets when the battery is completely
discharged.
• When the Logger shuts off because of a low battery,
enough battery capacity is available to back up the real-
time clock for up to 2 months.
1.888.610.7664 sales@GlobalTestSupply.com
Fluke-Direct
.com
Power Logger
Navigation and User Interface
13
Navigation and User Interface
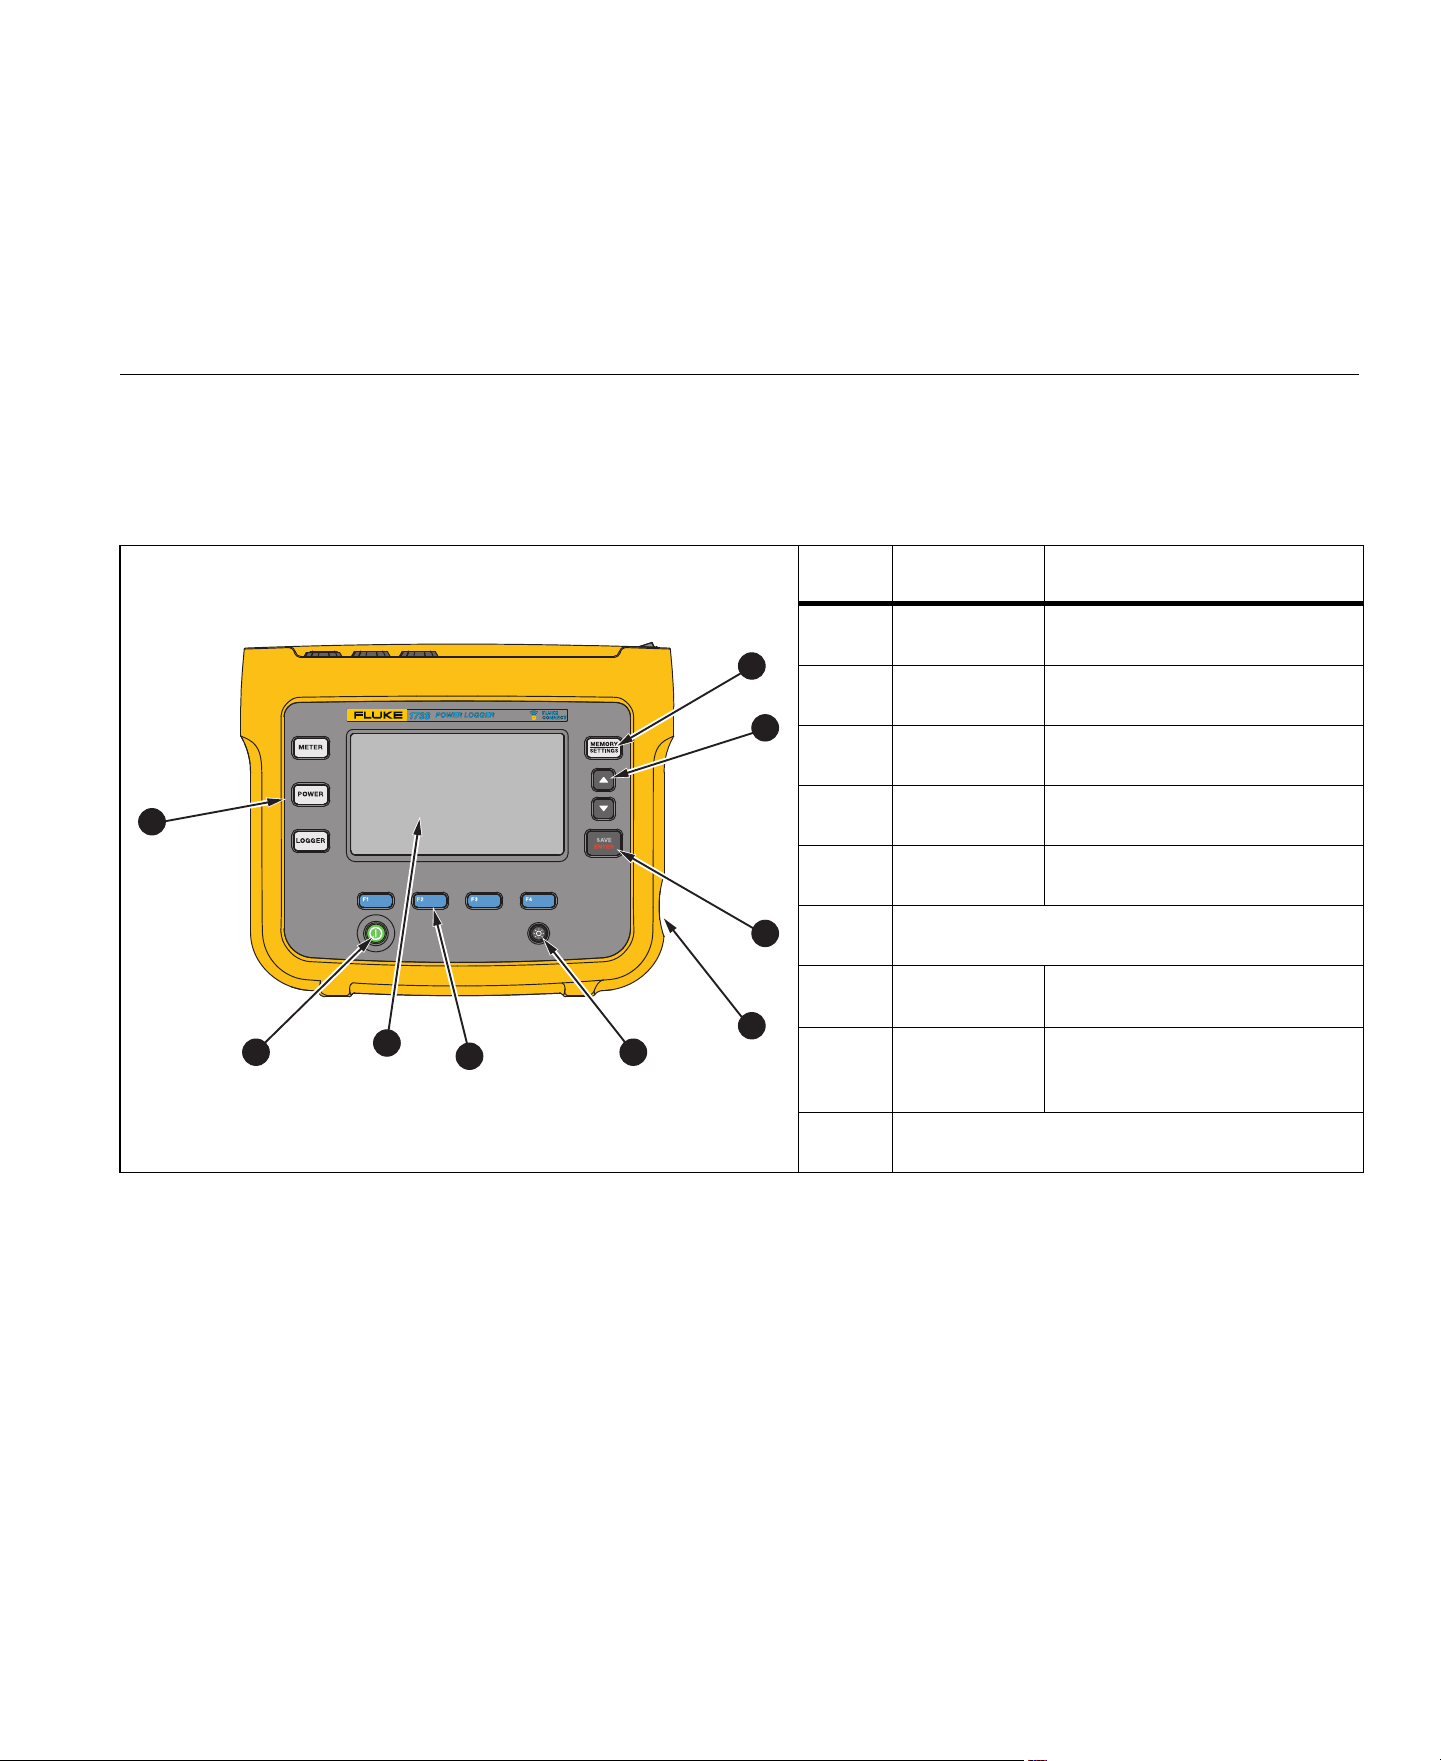
See Table 4 for a list of the front-panel controls and their functions.
See Table 5 for a list of the connectors and their functions.
Table 4. Front Panel
Item Control Description
Power on/off and status
Function selection
Memory/Setup selection
Cursor control
Selection control
Kensington Lock
Backlight on/off
Softkey selection
Touch screen display
1
2
3
4
5
6
7
8
9
1.888.610.7664 sales@GlobalTestSupply.com
Fluke-Direct
.com
1736/1738
Users Manual
14
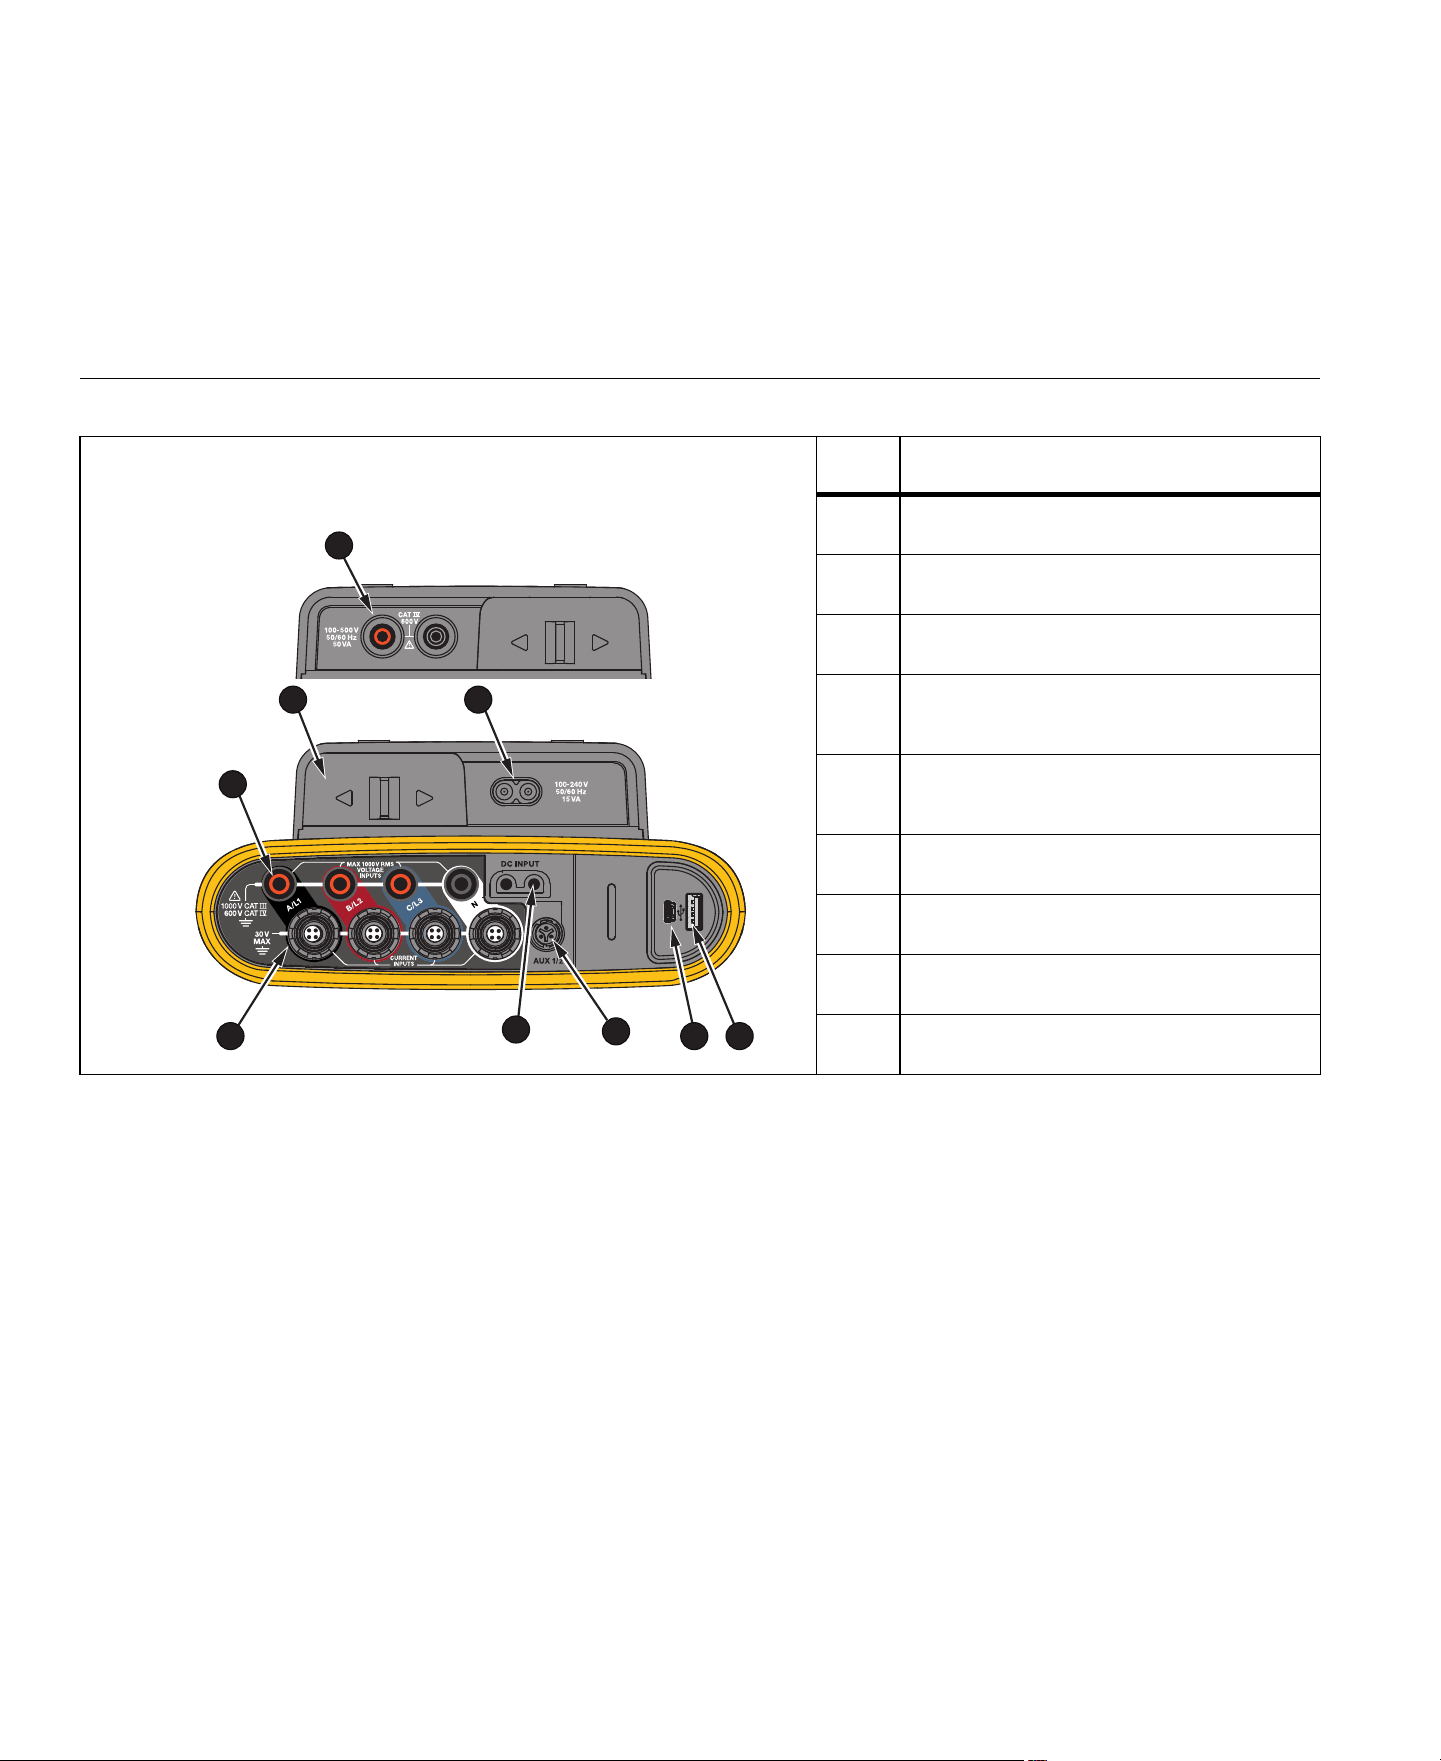
Table 5. Connector Panel
Item Description
Current measurement inputs (3 phases + N)
Voltage measurement inputs (3 phases + N)
Power Cord/Measurement Line Slide-Cover
Power Cord AC Input
100-240 V 50/60 Hz 15 VA
Measurement Line AC Input
100-500 V 50/60 Hz 50 VA
USB connector
Mini-USB connector
Aux 1/2 Connector
DC Power Input
1
2
3 4
5
67
9
8
1.888.610.7664 sales@GlobalTestSupply.com
Fluke-Direct
.com
Power Logger
Connector Panel Decal
15
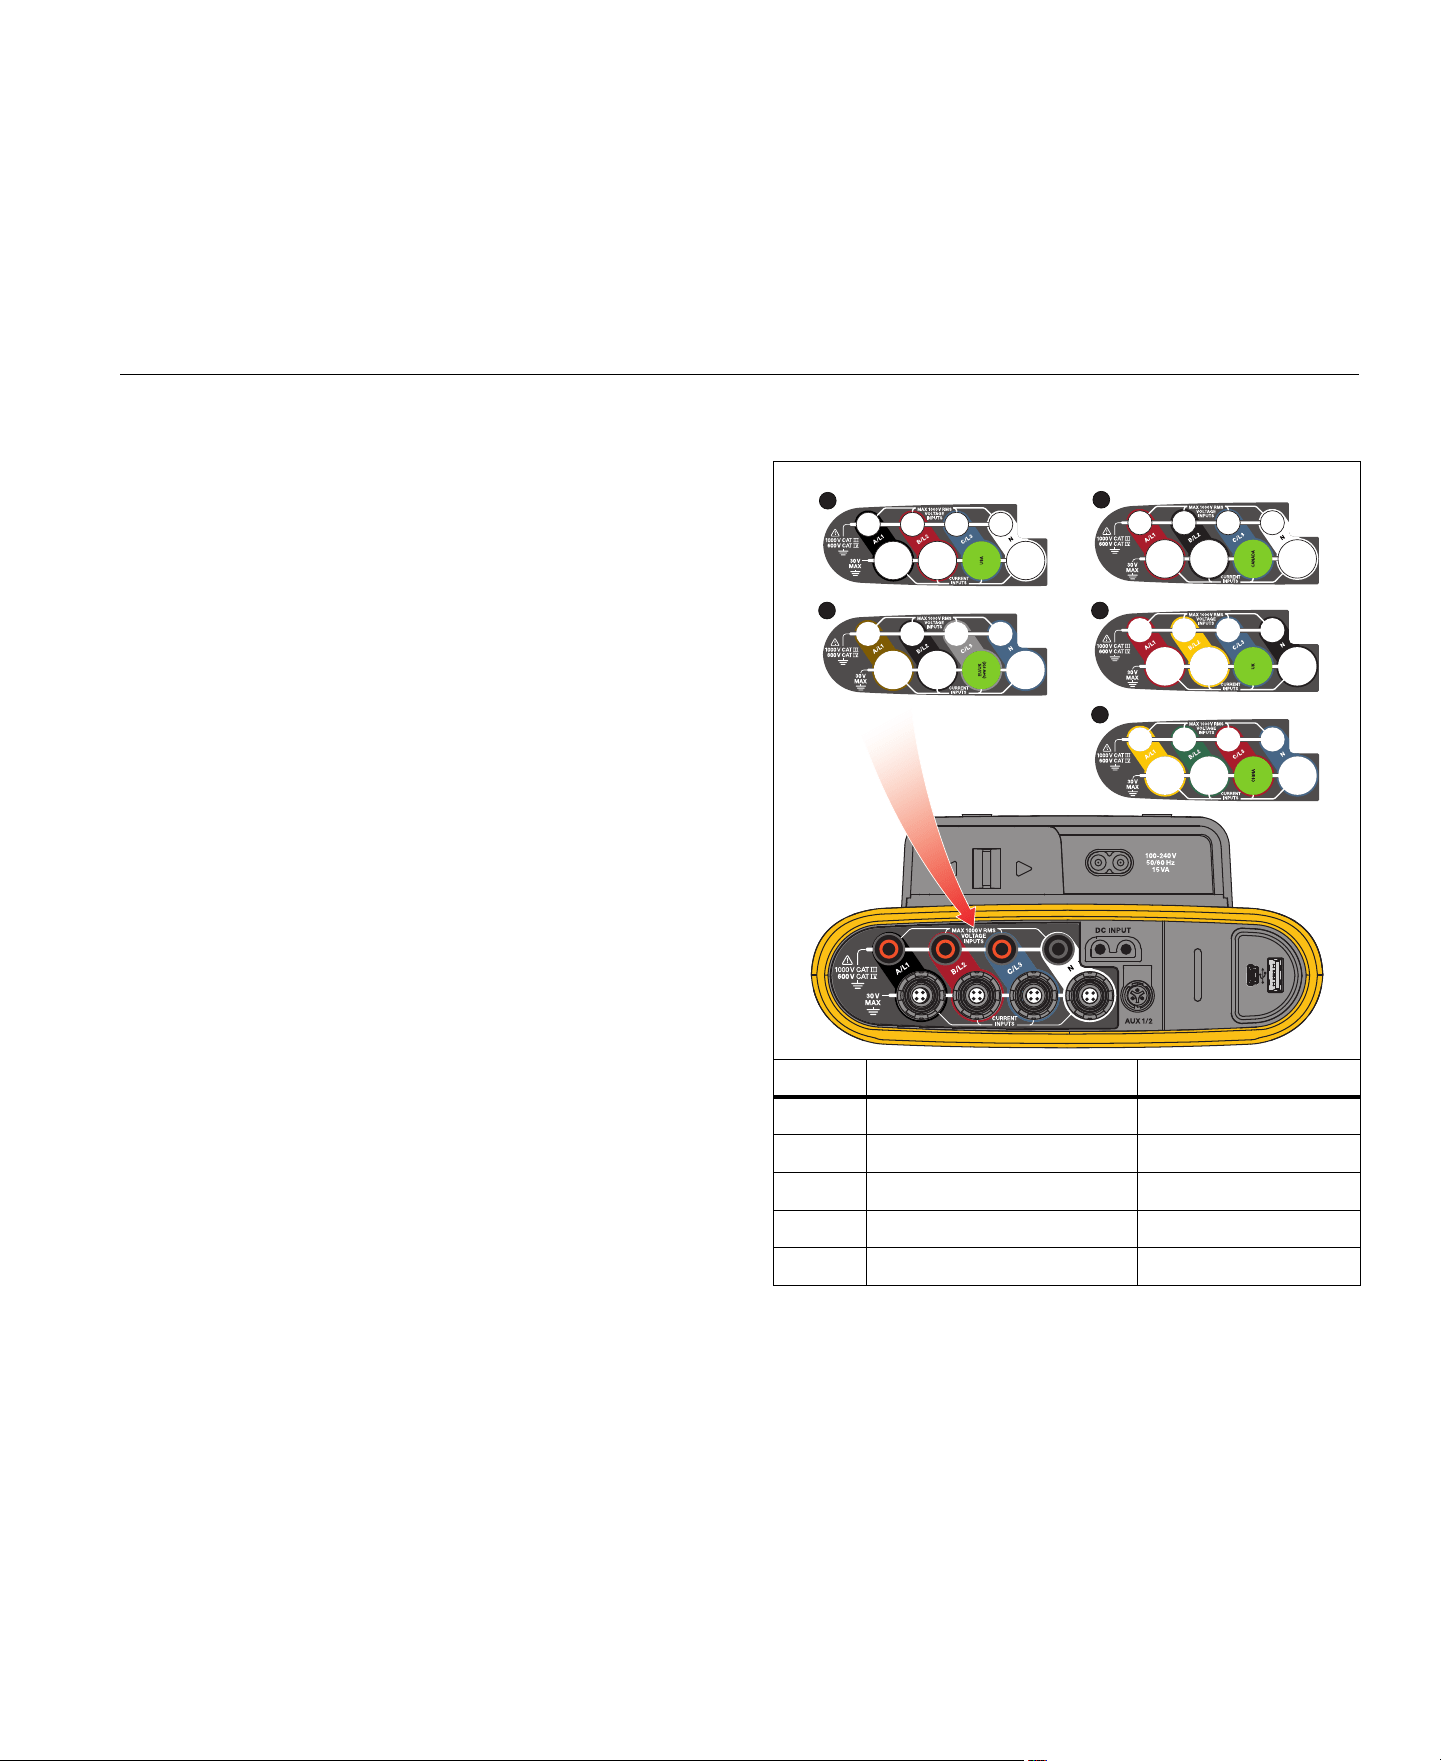
Connector Panel Decal
A self-adhesive decal is supplied with the Logger. The decal
corresponds to the wiring color codes used in your local area of
operation. Apply the decal around the current and voltage inputs on
the connector panel as shown in Table 6.
Table 6. Decal for Connector Panel
Item Location Part Number
USA 4275029
Europe/UK 4280531
Canada 4280546
UK 4280554
China 4280568
1
3
2
4
5
1.888.610.7664 sales@GlobalTestSupply.com
Fluke-Direct
.com

1736/1738
Users Manual
16
Power
The Logger has options for power source:
•
mains
•
measurement line
•
battery
The front panel LED shows the status. See Table 7 for more
information.
Mains Power Source
1.
Attach the power supply to the Logger or use the dc power cord to
connect the power supply to the Logger.
2.
Move the slide-cover on the power supply to access the mains
socket and connect the power cord into the Logger.
The Logger automatically turns on and is ready to use in
<30 seconds.
3.
Push to turn on and turn off the Logger.
Measurement Line Power Source
1.
Attach the Power Supply to the Logger or use the dc power cord to
connect the Power Supply to the Logger.
2.
Move the slide-cover on the power supply to access the safety
sockets and connect these sockets with the voltage input sockets
A/L1 and N.
For 3-phase delta systems connect the safety sockets of the
power supply with the input sockets A/L1 and B/L2.
Use the short test leads for all applications where the
measured voltage does not exceed the rated input voltage of
the power supply.
3.
Connect the voltage inputs to the test points.
The Logger automatically turns on and is ready to use in
<30 seconds.
Caution
To prevent damage to the product, make sure the
measured voltage does not exceed the input rating of
the power supply.
Warning
To prevent injury, do not touch the metal parts of one
test lead when the other is still connected to hazardous
voltage.
1.888.610.7664 sales@GlobalTestSupply.com
Fluke-Direct
.com
Power Logger
Power
17
Battery Power Source
The Logger can operate on battery power without a connection to the
power supply or dc power cord.
Push . The Logger turns on and is ready to use in <30 seconds.
The battery symbol in the status bar and the power LED indicate the
battery status. See Table 7.
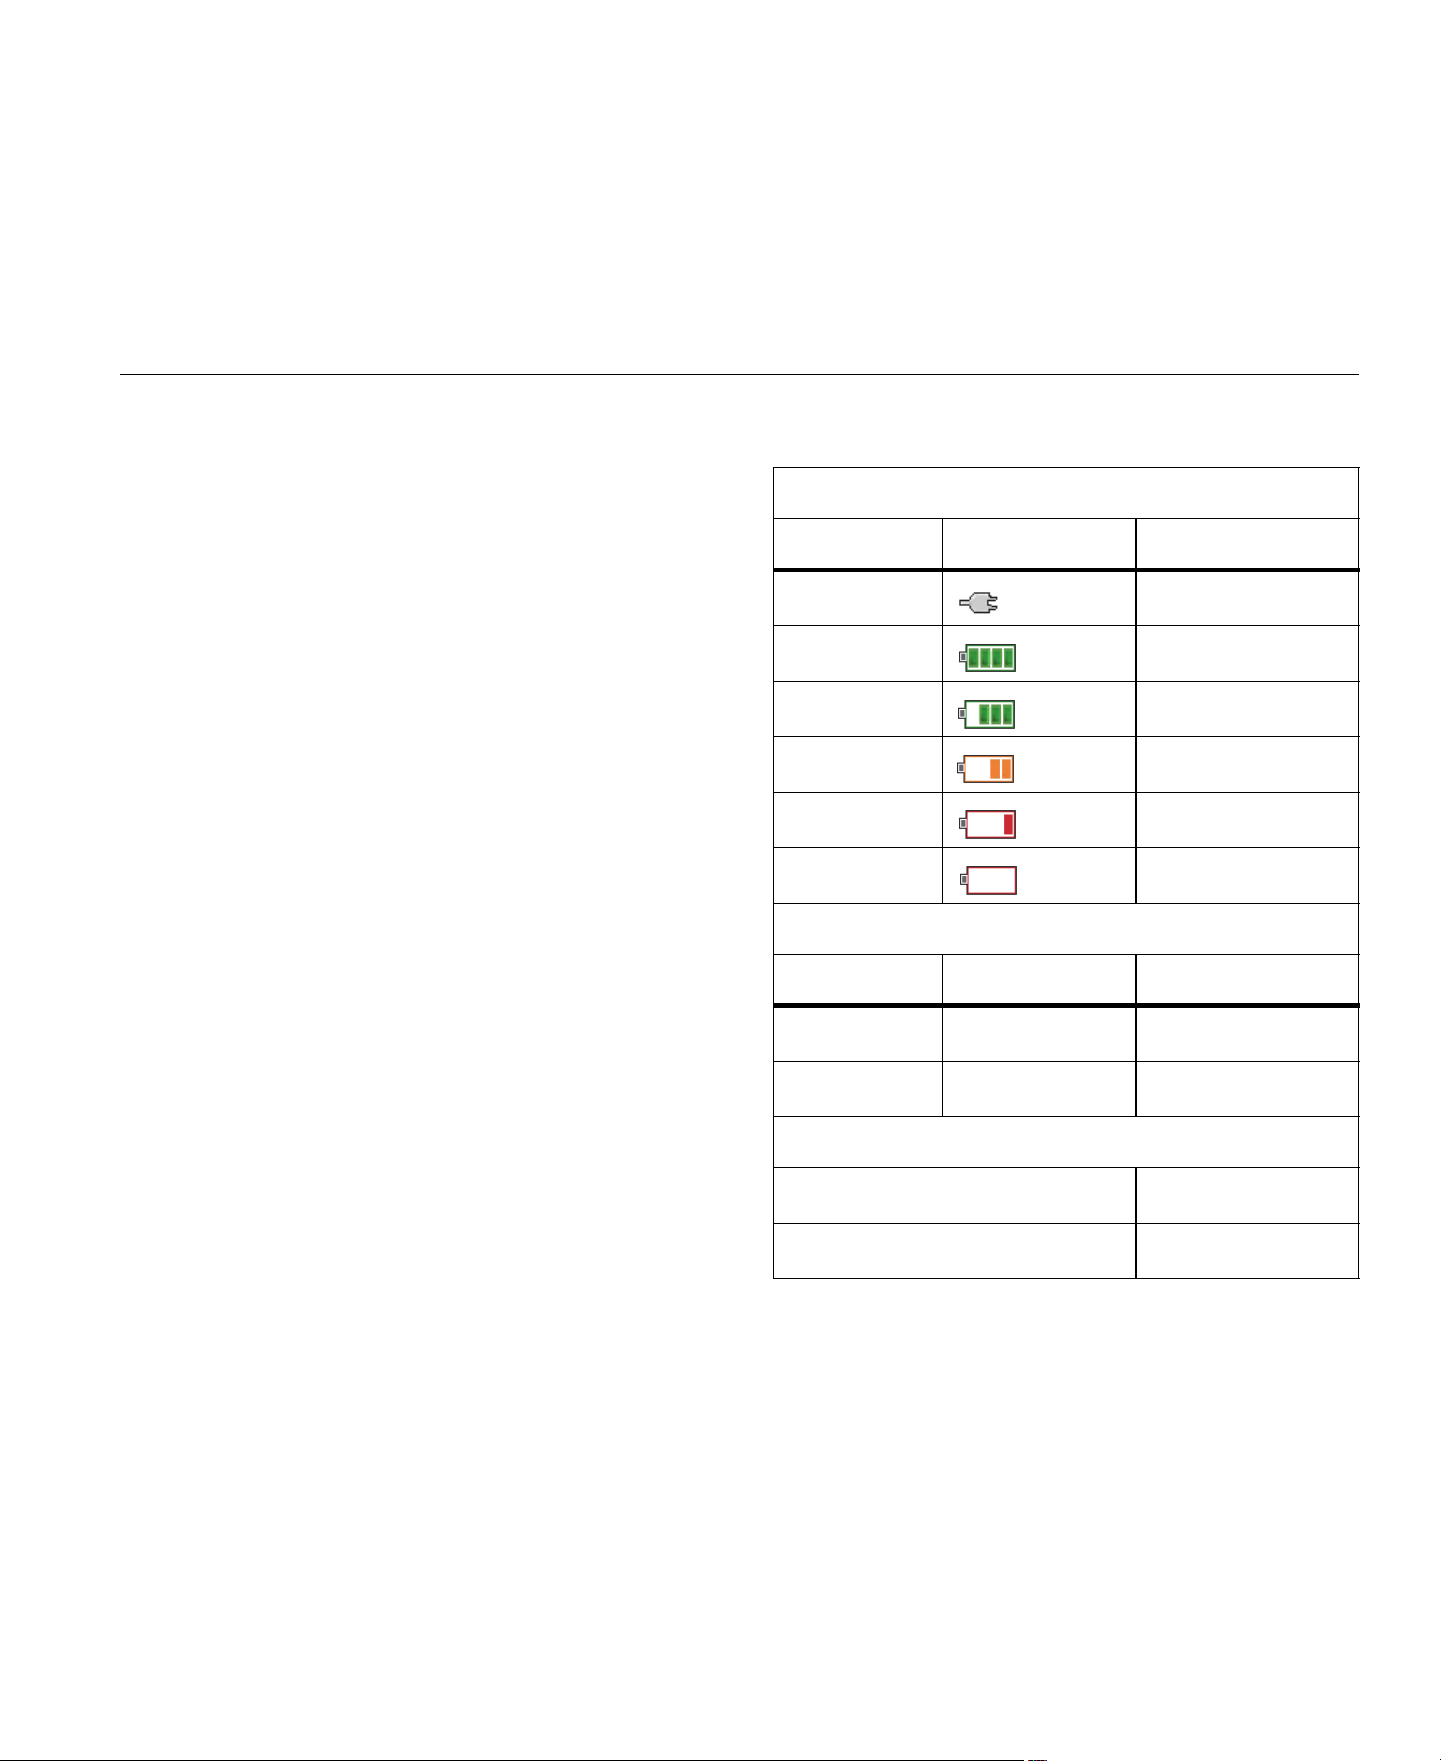
Table 7. Power/Battery Status
Logger On
Power Source Battery Symbol Power LED Color
Mains green
Battery yellow
Battery yellow
Battery yellow
Battery yellow
Battery red
Logger Off
Power Source Battery Status Power LED Color
Mains charging blue
Mains off off
Logger Status
not logging steady
logging flashing
1.888.610.7664 sales@GlobalTestSupply.com
Fluke-Direct
.com

1736/1738
Users Manual
18
Touch Screen
The touch screen lets you interact directly with what is on the display.
To change parameters, touch a target on the display. Touch targets
are easy to recognize, such as large buttons, items in menus, or keys
of the virtual keyboard. The Product can be operated with insulating
gloves on (resistive touch).
Brightness Button
The touch screen has a backlight for work in dimly lit spaces. See
Table 4 for the location of the Brightness (
) button. Push to
adjust the brightness in two levels and to turn on and turn off the
display.
The brightness is set to 100 % when the Logger is powered from
mains. When powered from battery, the default brightness is set to the
power-save level of 30 %. Push
to toggle between the two
brightness levels.
Push and hold for 3 seconds to turn off the display. Push to turn
on the display.
Calibration
The touch screen is pre-calibrated. If you notice that the targets do not
align with your touch on the display, you can calibrate the display.
Calibration of the touch screen is available in the
menu. See
Touch Screen Calibration on page 51 for more information.
Basic Navigation
When an option menu shows on the display, use / to move
within the menu.
has a dual use:
•
In the Configuration and Setup screens, push to confirm the
selection.
•
On all screens, push for 2 seconds to take a screen shot.
A beep and the camera symbol on the display confirm the action.
See Screen Capture on page 47 for more information about how
to review, manage, and copy the screen shots.
Along the bottom of the display, a row of labels shows the available
functions. Push or below the display label
to start that function. These labels also work as touch targets.
1.888.610.7664 sales@GlobalTestSupply.com
Fluke-Direct
.com

Power Logger
First-time Use/Setup Wizard
19
First-time Use/Setup Wizard
To start the Logger:
1.
Install WiFi/BLE or WiFi only adapter (see WiFi and WiFi/BLE-to-
USB Adapter on page 6).
2.
Attach the power supply to the Logger or use the dc power cable
to connect the power supply with the Logger.
3.
Connect the power cord into the power supply.
The Logger starts up in <30 seconds and the Setup Wizard
starts.
4.
Pick the language (see Language on page 48).
5.
Push (Next) or to navigate to the next page.
6.
Push (Cancel) to close the setup wizard. If you cancel, the
setup wizard starts again on next startup of the logger.
7.
Pick the work standards for your region. This action selects the
color codes and the phase descriptor (A, B, C, N or L1, L2, L3,
N).
This is the best time to apply the correlating decal on the
connector panel. The decal helps you to quickly identify the
appropriate voltage test lead and current probe for the
different phases and neutral.
8.
Attach the color clips to the current probe cables.
9.
Pick your time zone and date format. Confirm that the correct
date and time are shown on-screen.
10.
Pick the currency sign or currency code.
The Logger is now ready for the first measurements or energy study.
Note
Be aware that for power measurements in 3-phase systems:
• Total Active Power (W) is the sum of the individual
phases.
• Total Apparent Power (VA) also includes the neutral
current that can result in a very different result than the
sum of the three phases. This is especially noticeable
when a signal is connected to all three phases (for
example, a calibrator) the total value is approximately
41 % higher than the sum of each phase.
• Total Fundamental Power (W and var) only delivers the
sum of each phase when the phase rotation is
clockwise. It is zero when the phase rotation is counter-
clockwise.
For more information, see the white paper, Measurement Theory
Formulas, at
for a list of formulas.
1.888.610.7664 sales@GlobalTestSupply.com
Fluke-Direct
.com

1736/1738
Users Manual
20
First Measurements
At the energy study site, look at the information in the panel and the
rating plates on the machines. Based on knowledge of the electrical
supply in the facility, determine the configuration.
To start measurements:
1.
Connect the Logger to mains power.
Note
See Measurement Line Power Source on page 16 if you want
to power the Logger from the measurement line.
The Logger starts and shows the Meter screen with Volts,
Amps, and Hz readings.
2.
Push Change Configuration. Confirm the study type and the
wiring configuration is correct. For most applications the current
range is set to Auto and the voltage and current ranges are 1:1.
Configure the gain, offset, and engineering unit of measurement
for the sensors attached to the Auxiliary inputs.
3.
Push Configuration Diagram for guidance on the voltage test
lead and current probe connections.
4.
Plug the voltage test leads into the Logger.
5.
Use the Thin-Flexi current probes and plug the phase A current
probe into the phase A/L1 input jack on the logger, the phase
B/L2 current probe into the phase B/L2 input jack on the logger,
and the phase C/L3 current probe into the phase C/L3 input jack
on the logger.
6.
Apply the iFlex Probes to the wires in the electrical panel. Make
sure the arrow on the probe points to the load.
7.
Connect the voltage test leads to neutral, phase A/L1, phase
B/L2, and phase C/L3.
8.
With all of the connections done, check that the voltages for
phases A/L1, B/L2, and C/L3 are as expected.
9.
Read the current measurements for phases A/L1, B/L2, C/L3,
and N.
10.
Push Verify Connection to check and correct the phase rotation,
phase mapping, and polarity of current probes.
Most installations use a clockwise rotation.
11.
Push Live-Trend to display a chart of the last 7 minutes.
1.888.610.7664 sales@GlobalTestSupply.com
Fluke-Direct
.com

Power Logger
First Measurements
21
12.
Push to determine the power values, especially active
power and power factor.
13.
Push Live-Trend to display a chart of the last 7 minutes.
14.
Push for 2 seconds to take a screen shot of the
measurements.
15.
Push and change the default configuration with Edit Setup.
Typical setup:
•
1 week duration
•
1 minute for average calculation interval
•
5 minutes for demand interval
16.
Push Start Logging.
You can review the live data with
or . Return to the
active logging session with
. Once the logging session is
complete, it is accessible in Memory/Settings - Logging
Sessions.
17.
Review the logged data using the softkeys V, A, Hz, +, Power,
and Energy.
18.
To prevent unwanted operation, touch the Lock Screen target.
The default PIN to lock/unlock the screen is 1234.
See Screen Lock on page 50 for more information.
19.
To transfer and analyze the data using the PC software, attach
the USB flash drive to the Logger and copy the logging session
and screenshot.
Note
You can also use the USB cable or the USB WiFi dongle to
transfer the measurement data.
To analyze the data using the PC software:
1.
Attach the USB flash drive to a PC with Energy Analyze installed.
2.
In the software, click Download Data and copy the logging
session and screenshot from the USB flash drive.
3.
Open the downloaded session and view the measured data.
4.
Go to the Project Manager tab and click Add Image to add the
screenshot.
For more information about how to use the Energy Analyze, see the
online help for the software.
1.888.610.7664 sales@GlobalTestSupply.com
Fluke-Direct
.com

1736/1738
Users Manual
22
Function Selection Buttons
The Logger has three buttons that switch between the Meter, Power,
and Logger function modes. The current mode shows in the upper left
corner of the display.
Meter
– The Meter mode shows measurement readings for:
•
Voltage (VRMS)
•
Current (A RMS)
•
Frequency (Hz)
•
Wave Shape of Voltage and Current
•
THD (%) and Harmonics of Voltage (%, V RMS)
•
THD (%) and Harmonics of Current (%, A RMS)
•
AUX Input
Push to show the additional values.
Live Trend
You can determine the values or display a trend chart of the last
7 minutes. In the chart:
1.
Use or the cursor keys to show the list of available
parameters.
2.
Push (Reset) to clear the graph and restart.
It is also possible to log the values with the logger function.
Scope
The scope screen shows about 1.5 periods of voltage and current.
The exact number of shown periods depends on the input frequency.
The scope screen is helpful to:
•
identify the maximum peak value on current channels
•
as a guide for the selection of the current sensor and range
•
identify the phase sequence of voltage and current
•
visually inspect the phase shift between voltage and current
•
understand the consequence of high harmonics on the signal
Use or the cursor keys to show the list of available
parameters.
Harmonics
Use (Harmonics) to access the harmonics analysis screens for
voltage and current.
Harmonics Spectrum
The harmonics spectrum is a bar chart of the harmonics h02 ... h50.
When % of the fundamental is selected, THD is included in the chart.
The bar chart in absolute units (V RMS, A RMS) includes the
fundamental. Use the trend chart to show the exact value.
Trend Chart
The trend chart is a chart of the fundamental, a selectable harmonic,
or THD. A split screen shows the harmonics spectrum in the upper
graph and the trend chart in the lower graph. Touch the bar chart or
use
and to select the parameter of interest. Push
(Trend only) to expand the trend chart to full screen.
1.888.610.7664 sales@GlobalTestSupply.com
Fluke-Direct
.com

Power Logger
Function Selection Buttons
23
Harmonics Spectrum Relative to Harmonic Limits
This feature is available on 1738 or 1736 with 1736/Upgrade on
installation of the IEEE 519/Report license. The screen shows the
harmonics relative to the individual limit defined by a user-selected
standard. The standard is selected in the Measurement Configuration.
Each bar is green when the measurement is below the individual limit
for this harmonic or THD, otherwise, the bar turns red. The number of
displayed harmonics varies in accordance with the selected standard.
Note
This screen provides quick feedback about the harmonic
levels compared to Power Quality standards. It is no proof of
compliance to the standard. The average calculation interval
of 1 second is much more frequent compared to the
10 minutes required by applicable standards. A limit violation
in this screen does not necessarily result in a standards
violation. For example, when the measurement values
surpass the maximum allowed tolerance during a short time
period. Use the feature to record data in logging sessions and
perform standard compliance measurements. For more
information, see Logging Sessions on page 47.
The side menu in the harmonics screens has dual use. First, select
the parameter to display and confirm with
. The selector bar jumps
to the lower section for the phase selection. The number of available
phases and the Neutral current depends on the selected topology.
See Measurement Configuration below for details. Make your choice
and confirm again with
.
Some screens do not include (Show Menu) to access the side
menu. Use / instead.
Measurement Configuration
Use the Change Configuration touch button to access the
measurement configuration screen. The configuration screen allows
you to change the parameters for:
•
Study type
•
Topology
•
Nominal voltage
•
Current range
•
Scale factors for external PTs or CTs
•
Nominal Frequency
•
Auxiliary input configuration
•
Review the voltage event limits
•
Configure the inrush current limit
•
Select the standard for harmonics compliance assessment
(available on 1738 or 1736 with 1736/Upgrade or IEEE 519/Report
license)
Use to navigate between the sub-screens.
1.888.610.7664 sales@GlobalTestSupply.com
Fluke-Direct
.com

1736/1738
Users Manual
24
Study Type
Depending on the application, select either Load Study or Energy
Study.
•
Energy Study: Select this study type when voltage
measurements for a power quality assessment and power and
energy values that include active power (W) and PF are required.
•
Load Study: For convenience, some applications require you to
measure only the current that makes the connection to the point to
measure.
Typical applications are:
•
Verify the circuit capacity before adding additional load.
•
Identify situations where the allowable load can be exceeded.
Optionally, a nominal voltage can be configured to get pseudo-
apparent power readings.
Power Quality
Select the power quality standard (available on 1738 or 1736 with
1736/Upgrade or IEEE 519/Report license) for compliance evaluation.
EN 50160: voltage characteristics of electricity supplied by
public distribution networks.
The Logger supports these parameters:
•
Frequency
•
Voltage Variations
•
Voltage Harmonics and Voltage THD
•
Unbalance
•
Events
IEEE 519: recommended practice and requirements for harmonic
control in electric power systems.
The standard defines limits for voltage harmonics, voltage THD,
current harmonics, and TDD (total demand distortion). The limits for
current harmonics and TDD depend on the ratio of maximum demand
load current I
L
to the short circuit current I
SC
. Set the values with
and .
Note
If the values of I
SC
and I
L
are not currently available, you can
update these values at a later time with the Energy Analyze
Plus software.
Set the Harmonics Standard to off when the harmonics compliance
evaluation is not required.
1.888.610.7664 sales@GlobalTestSupply.com
Fluke-Direct
.com
Power Logger
Function Selection Buttons
25
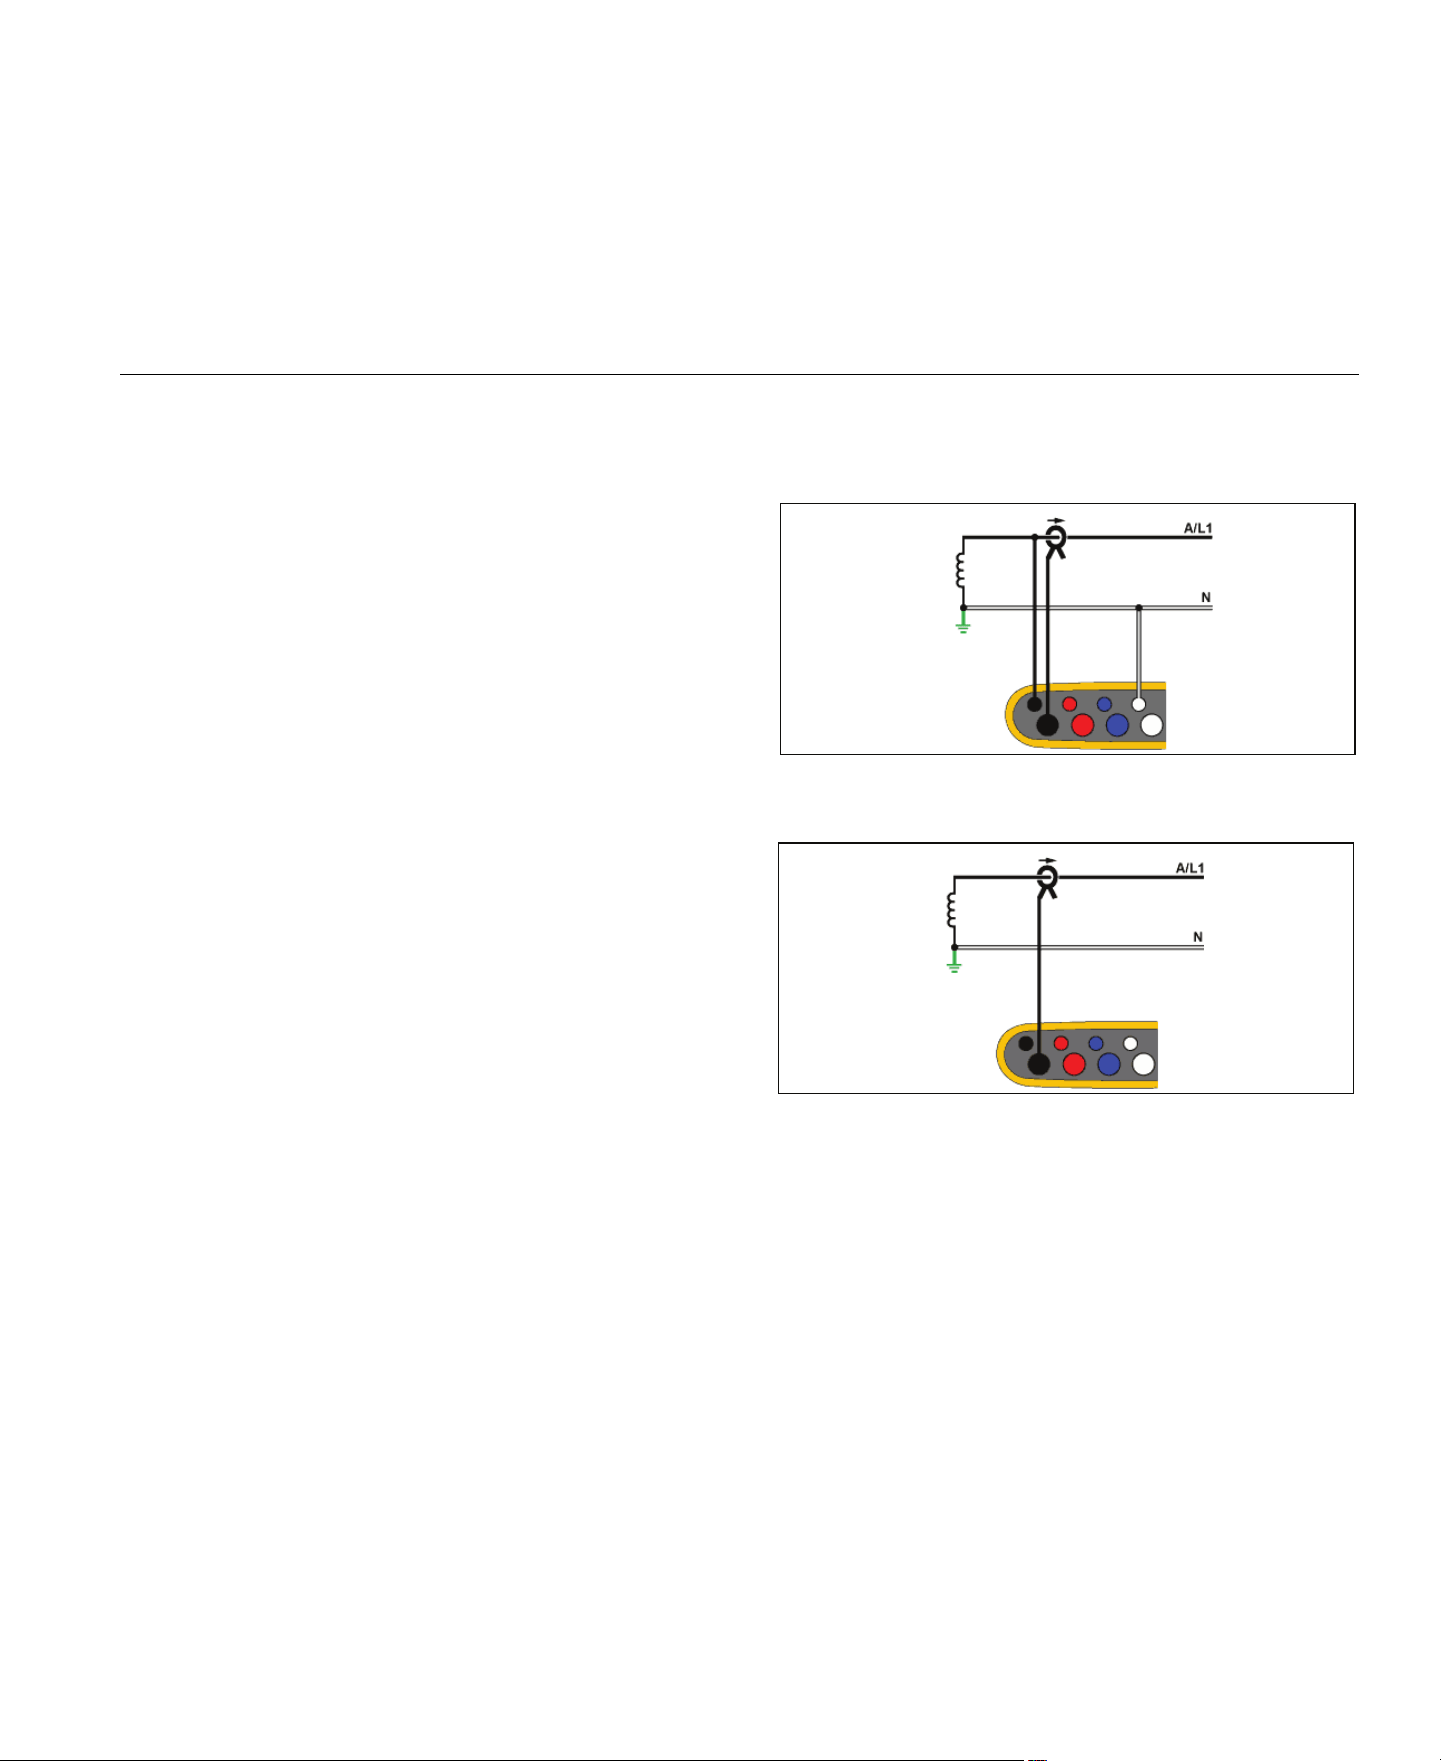
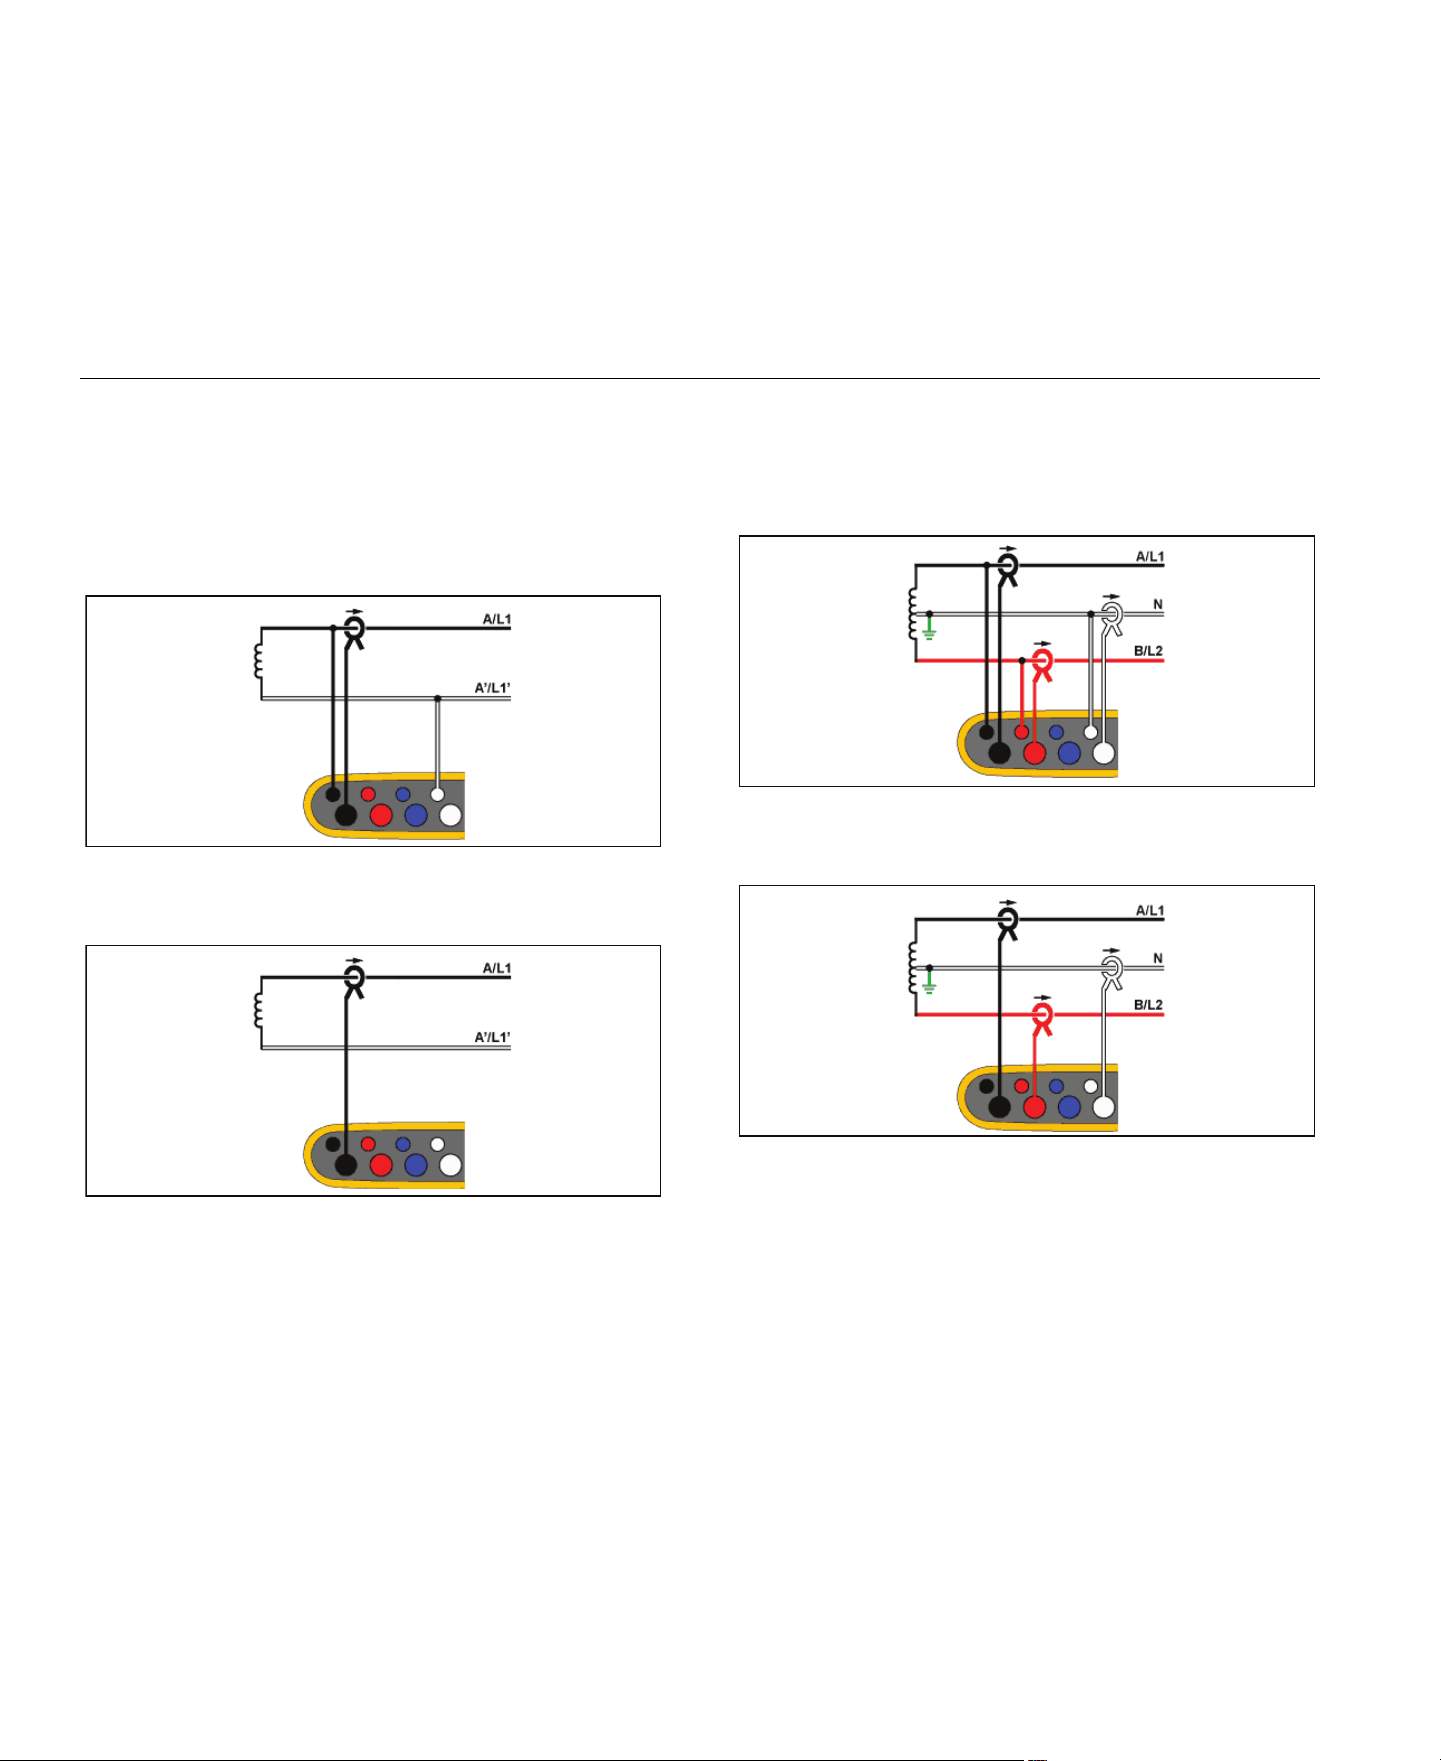
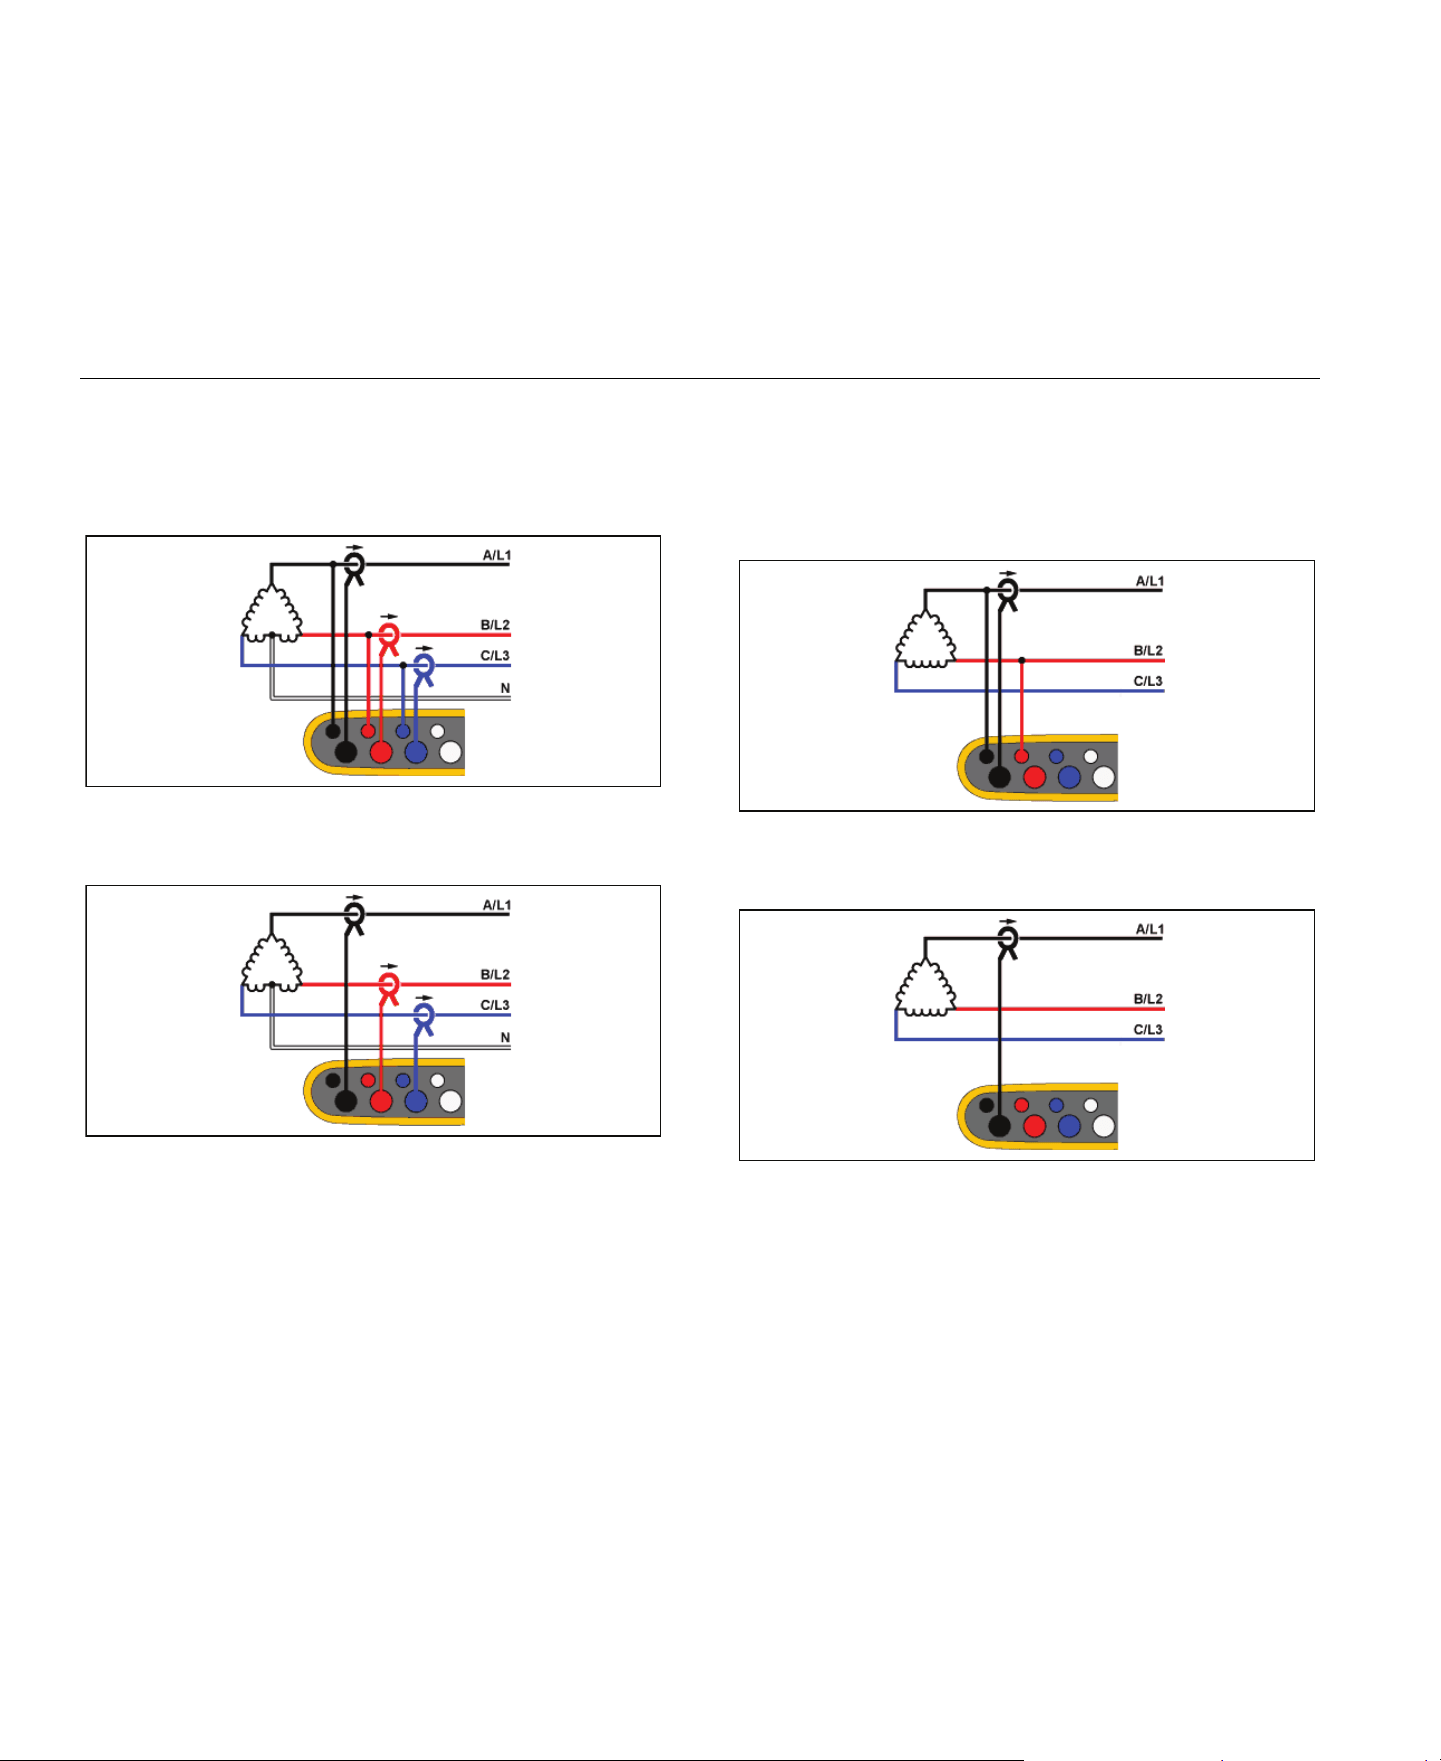
Topology (Distribution System)
Select the appropriate system. A connection diagram for the voltage
test leads and current sensors is shown on the Logger.
A diagram is also available with (Connection diagram) from the
Change Configuration menu. Examples of these diagrams are
shown on the following pages.
Single Phase
Example: Branch circuit at an outlet.
Energy Study
Load Study (no voltage measurement)
1.888.610.7664 sales@GlobalTestSupply.com
Fluke-Direct
.com
1736/1738
Users Manual
26
Single Phase IT
The logger has a galvanic isolation between the voltage inputs and
ground based signals like USB and mains input.
Example: Used in Norway and in some hospitals. This would be the
connection at a branch circuit.
Energy Study
Load Study (no voltage measurement)
Split Phase
Example: A North American residential installation at the service
entrance.
Energy Study
Load Study (no voltage measurement)
1.888.610.7664 sales@GlobalTestSupply.com
Fluke-Direct
.com
Power Logger
Function Selection Buttons
27
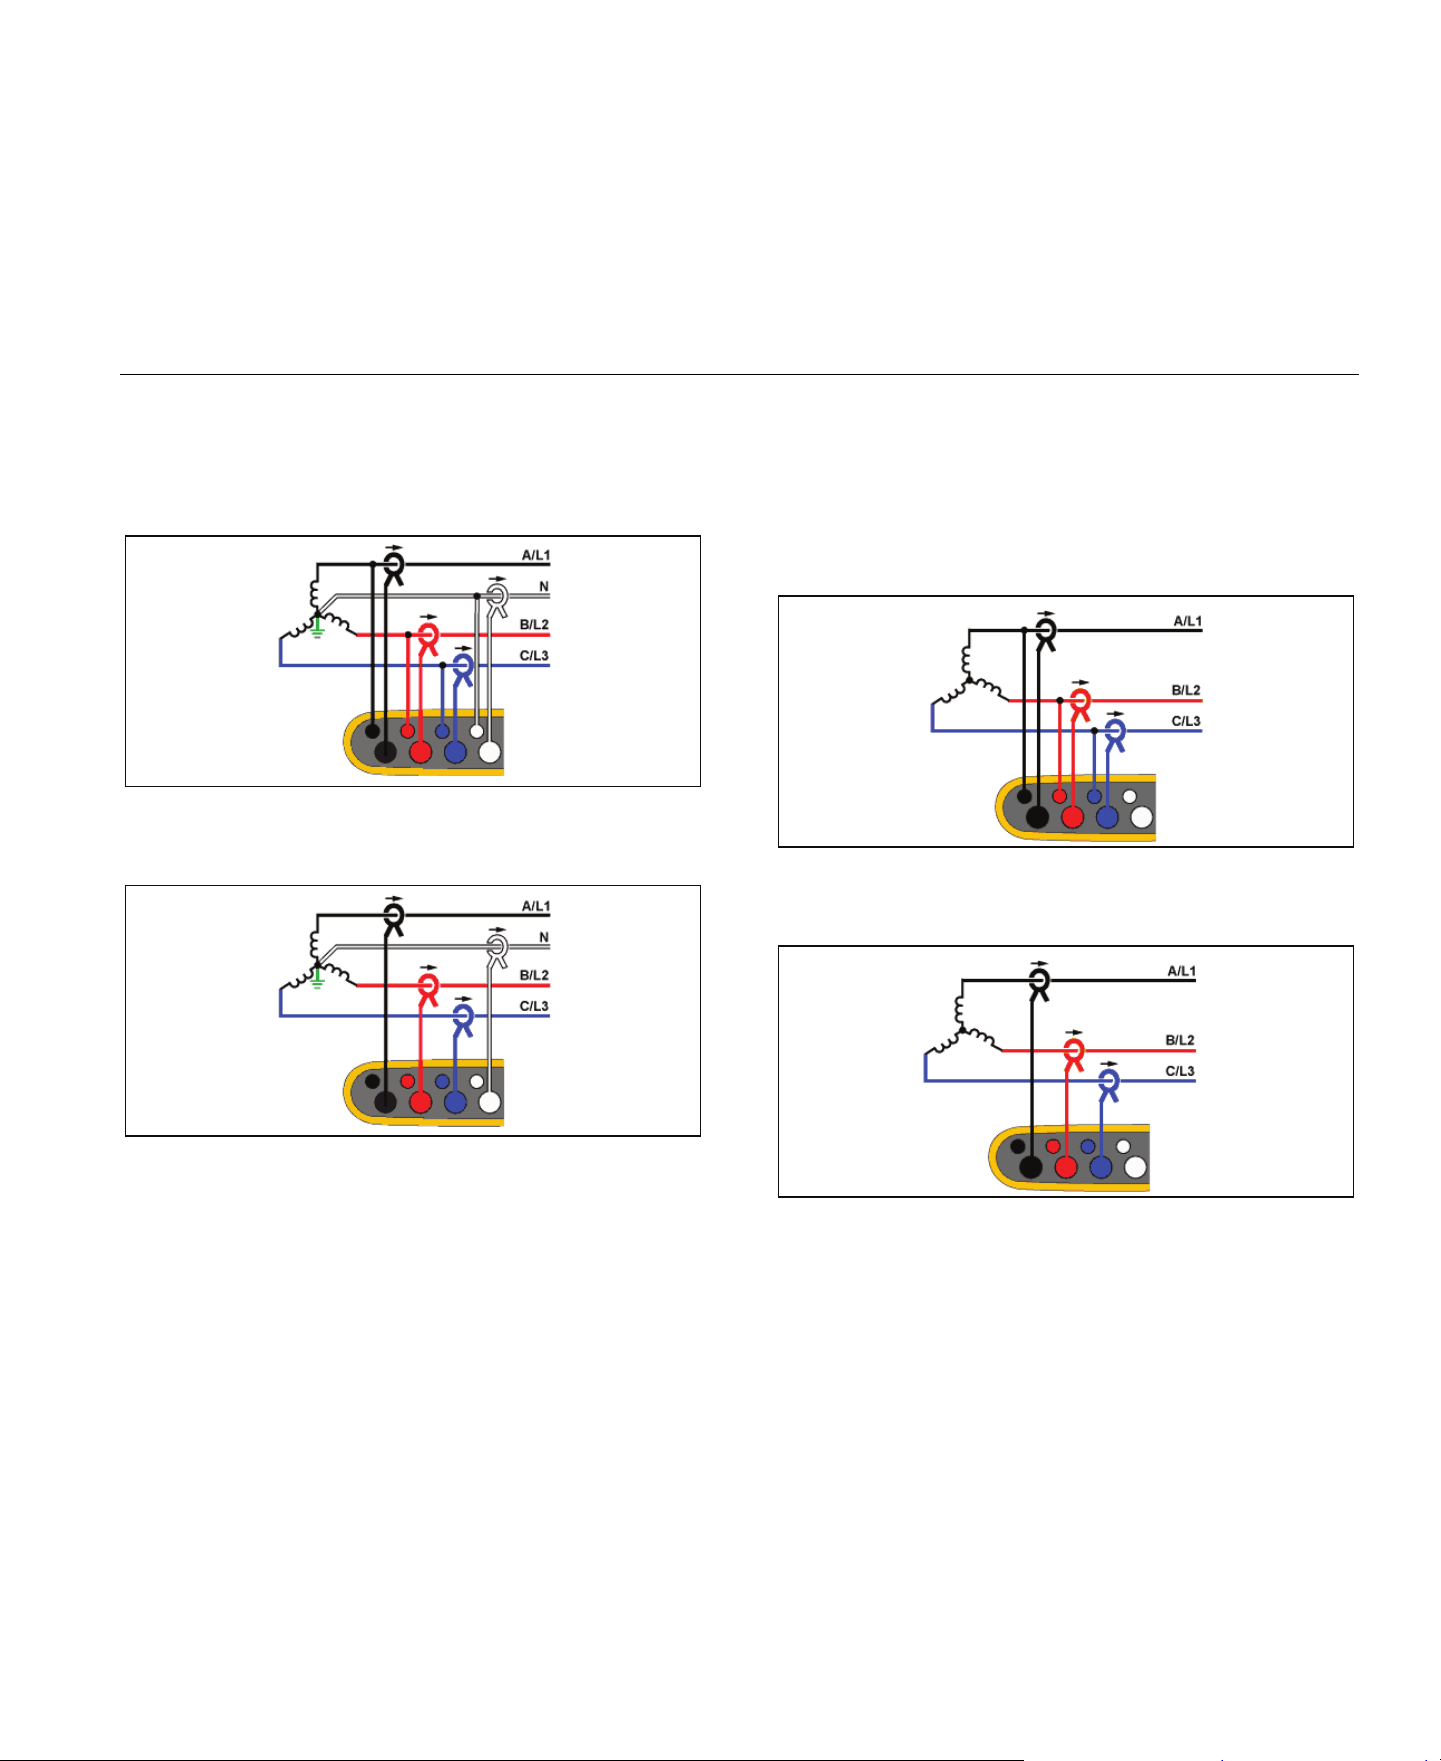
3-Ф Wye
Example: Also called “Star” or four-wire connection. Typical
commercial building power.
Energy Study
Load Study (no voltage measurement)
3-Ф Wye IT
The logger has a galvanic isolation between the voltage inputs and
ground based signals like USB and mains input.
Example: Industrial power in countries that use the IT (Isolated Terra)
system, such as Norway.
Energy Study
Load Study (no voltage measurement)
1.888.610.7664 sales@GlobalTestSupply.com
Fluke-Direct
.com
1736/1738
Users Manual
28
3-Ф Wye Balanced
Example: For symmetrical loads like motors the connection can be
simplified by measuring only one phase and assuming the same
voltages/currents on the other phases. As an option, you can measure
harmonics with a current probe on the neutral line.
Energy Study
Load Study (no voltage measurement)
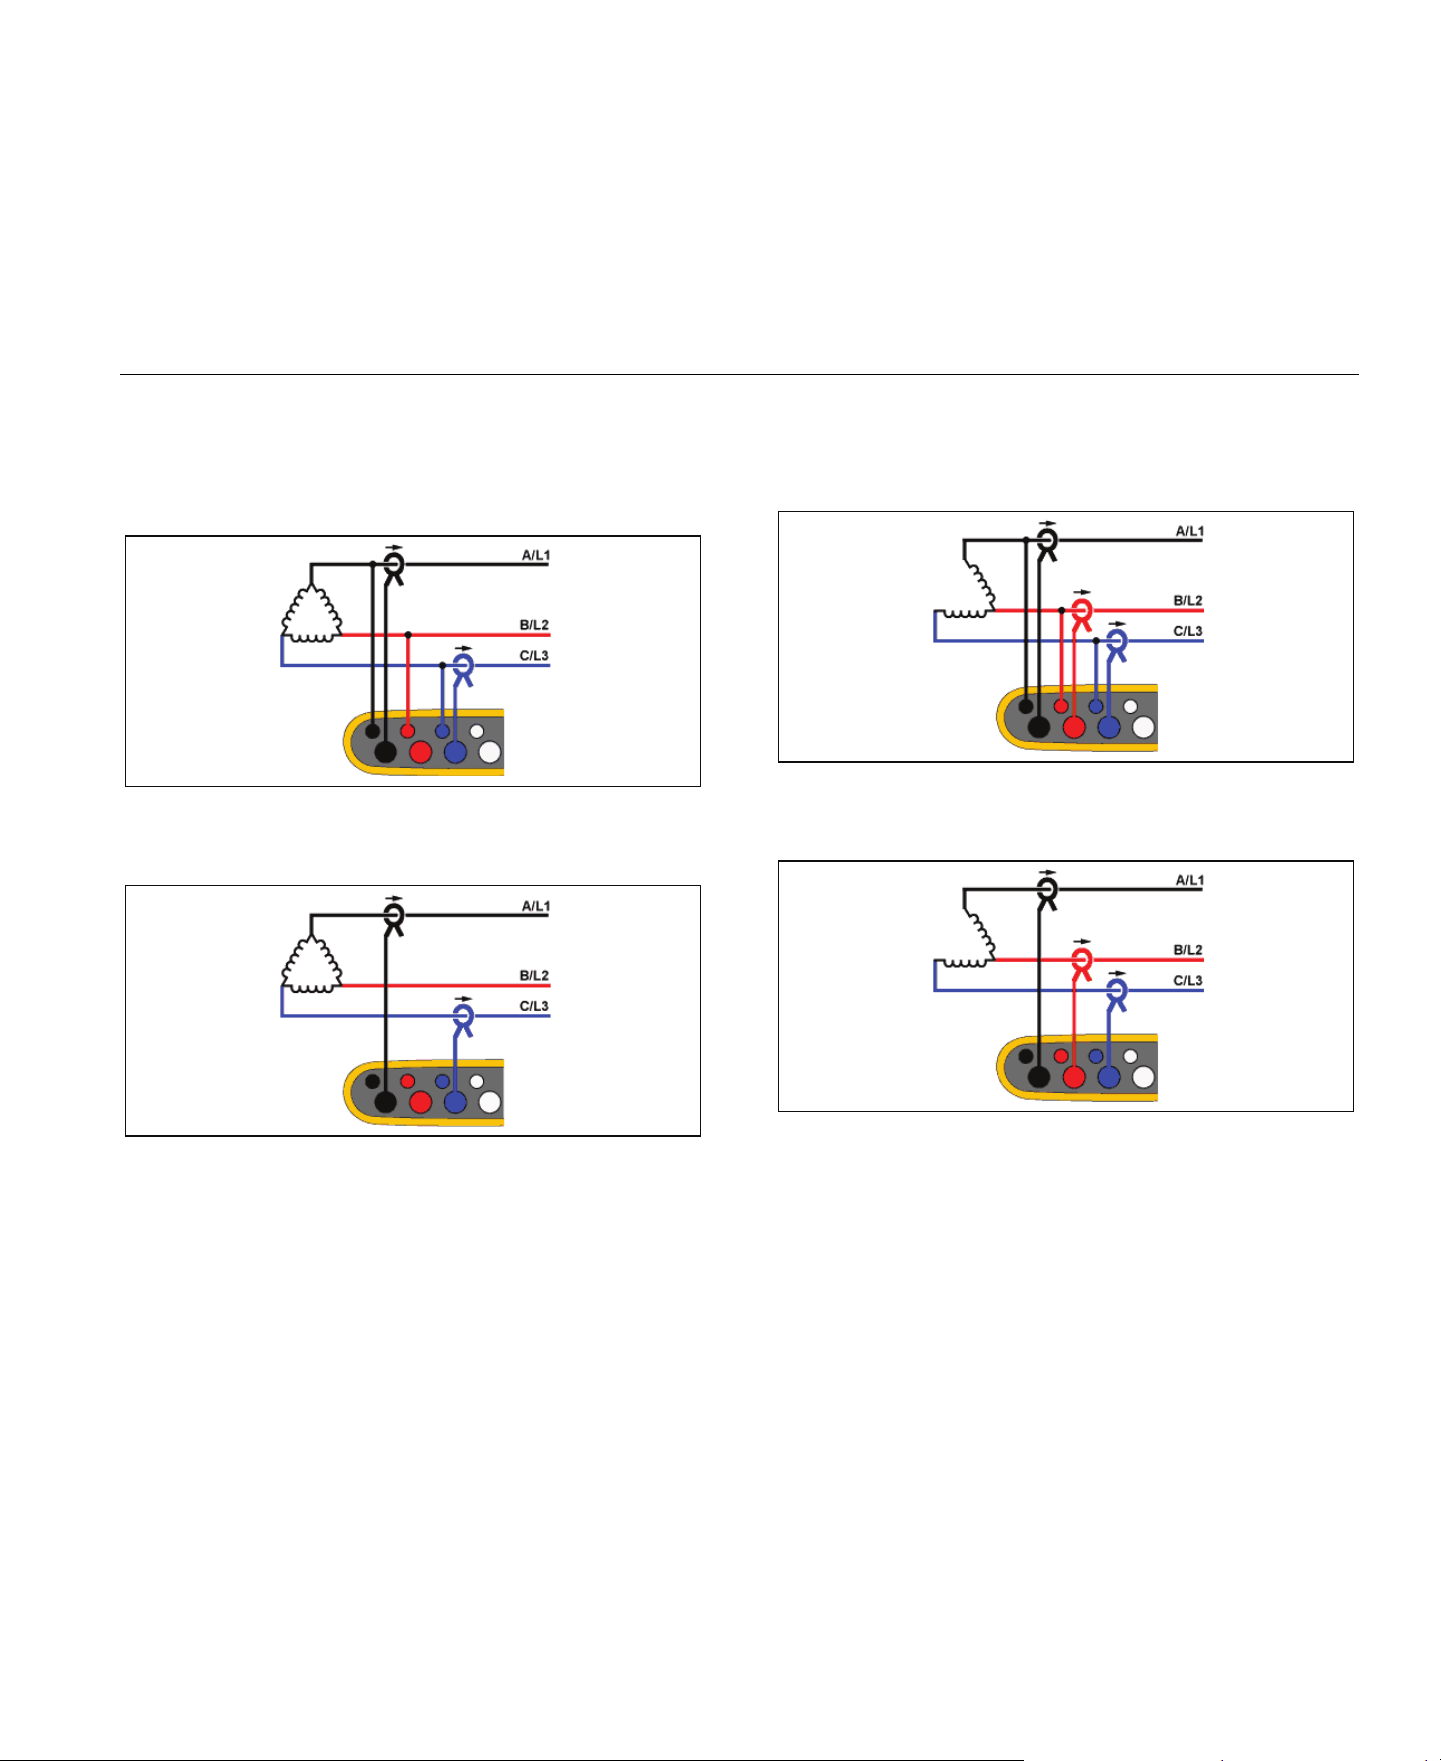
3-Ф Delta
Example: Often found in industrial settings where electric motors are
used.
Energy Study
Load Study (no voltage measurement)
1.888.610.7664 sales@GlobalTestSupply.com
Fluke-Direct
.com
Power Logger
Function Selection Buttons
29
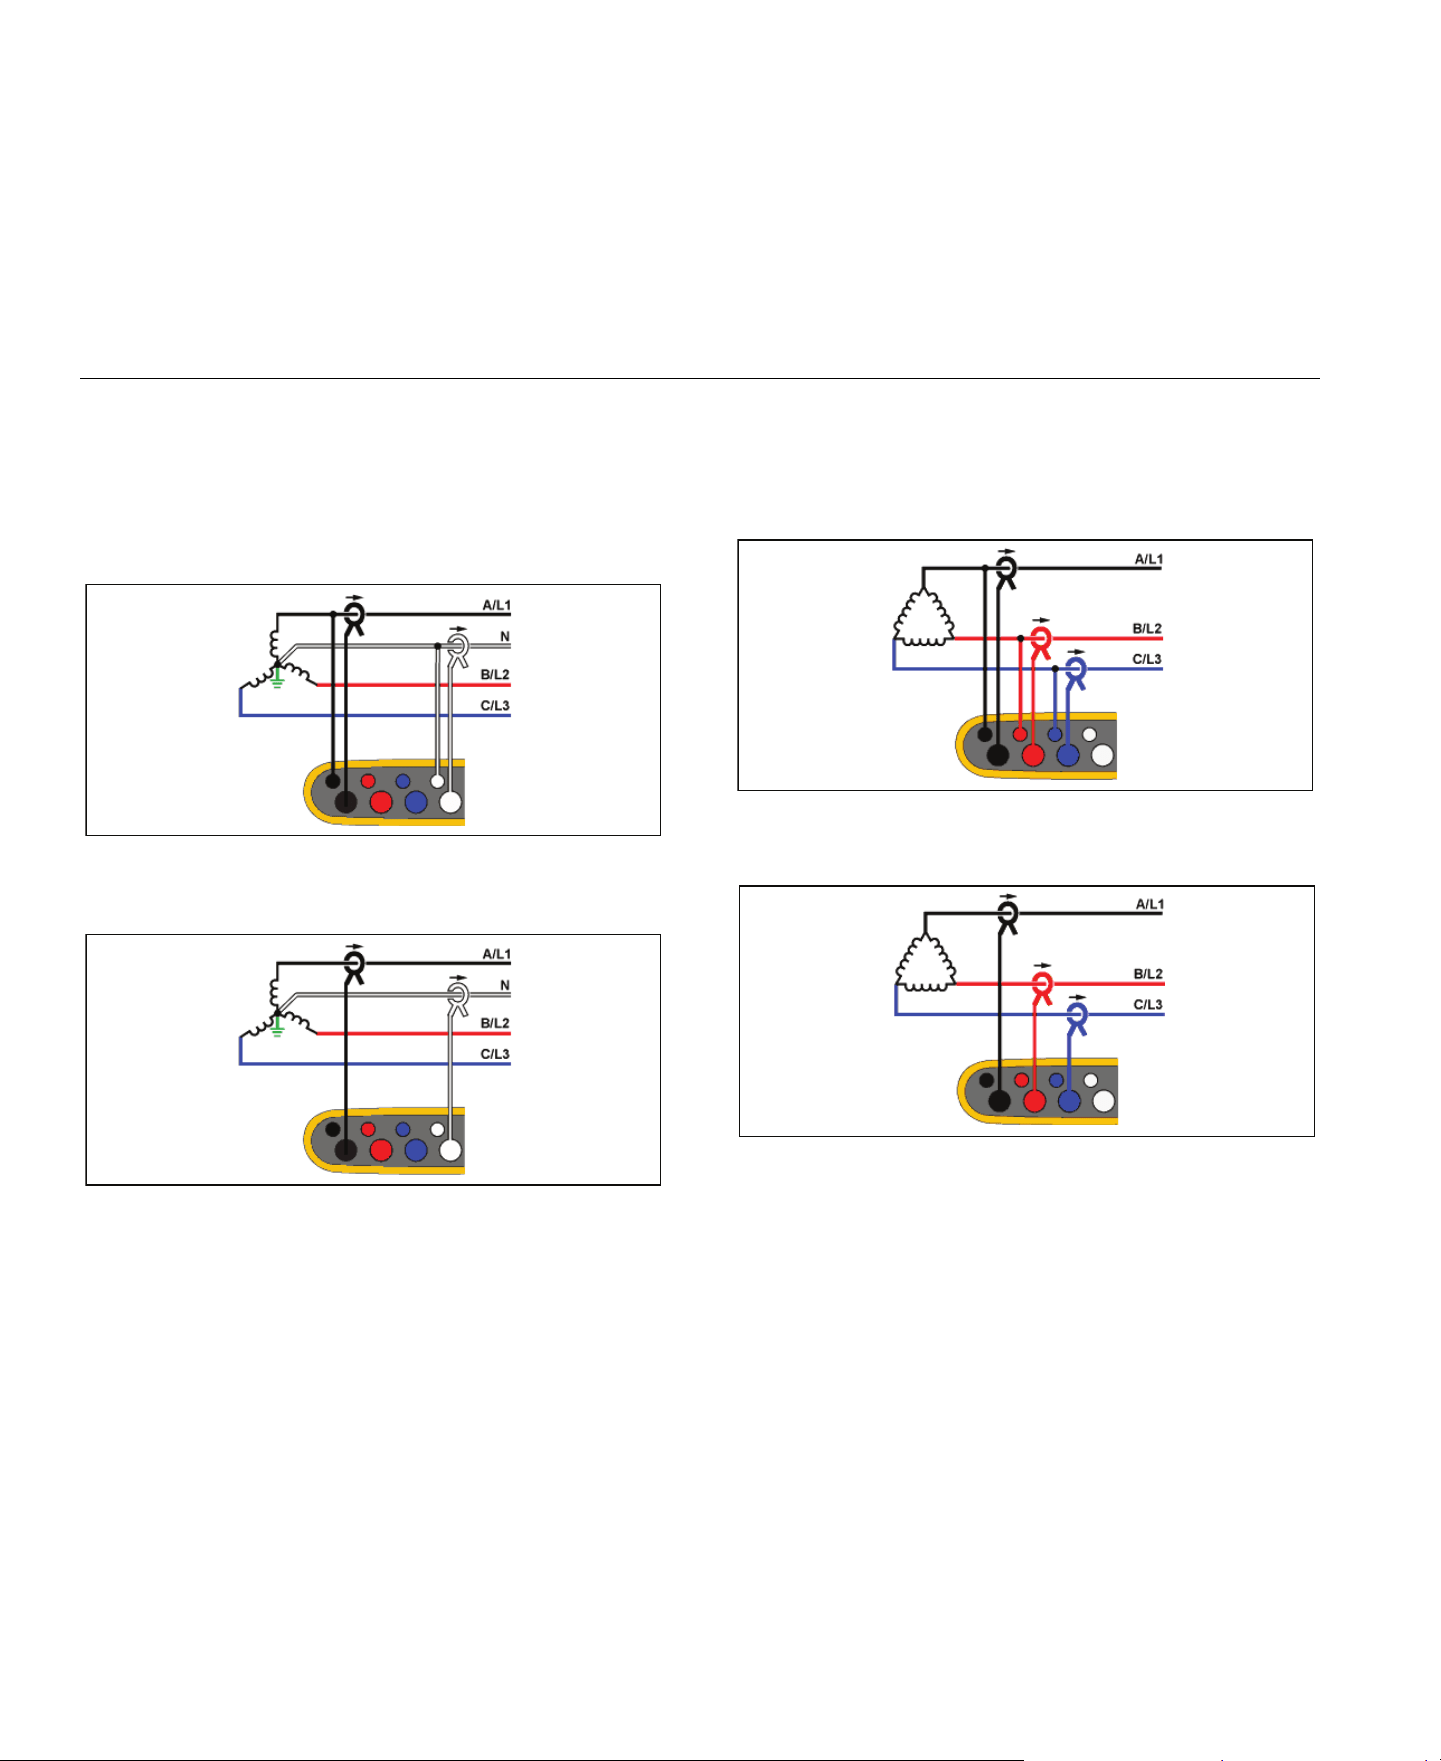
2 Element Delta (Aron/Blondel)
Example: Blondel or Aron connection, simplifies the connection by the
use of only two current sensors.
Energy Study
Load Study (no voltage measurement)
Note
Make sure that the current arrow on the sensor is directed
towards the load to provide positive power values. The
current sensor direction can be corrected digitally in the
Connection Verification screen.
3-Ф Delta Open Leg
Example: A variant of power transformer winding type.
Energy Study
Load Study (no voltage measurement)
1.888.610.7664 sales@GlobalTestSupply.com
Fluke-Direct
.com
1736/1738
Users Manual
30
3-Ф High Leg Delta
Example: This topology is used to provide an additional voltage that is
half the phase to phase voltage.
Energy Study
Load Study (no voltage measurement)
3-Ф Delta Balanced
Example: For symmetrical loads like motors, the connection is
simplified with only one phase measurement and assuming the same
voltages/currents on the other phases.
Energy Study
Load Study (no voltage measurement)
1.888.610.7664 sales@GlobalTestSupply.com
Fluke-Direct
.com

Power Logger
Function Selection Buttons
31
Nominal Voltage
Select a nominal voltage from the list. If a voltage is not shown in the
list, enter a custom voltage. On energy studies, the nominal voltage is
required to determine the limits for dips, swells, and interruptions.
The nominal voltage on load studies is used to calculate the pseudo
apparent power:
nominal voltage x measured current
Set the nominal voltage to off if the apparent power readings are not
required.
Voltage Ratio (only in energy studies)
Configure a ratio factor for the voltage inputs when a potential
transformer (PT) is in series with the voltage connections such as
when you want to monitor a medium-voltage network. The default
value is 1:1.
Nominal Frequency
Set the nominal frequency to be the same as the power line
frequency, 50 Hz or 60 Hz.
Current Range
Configure the current range of the attached sensor. Three ranges are
available:
•
Auto
•
Low Range
•
High Range
When set to Auto, the current range is set automatically and depends
on the measured current.
Low Range is 1/10 of the nominal range of the attached current
sensor. For example, the low range of an iFlex1500-12 is 150 A.
High Range is the nominal range of the attached current sensor. For
example, 1500 A is the nominal range on an iFlex1500-12.
Note
Set the current range to Auto when you are not sure about
the maximum current during the logging session. A specific
application can require you to set the current range to a fixed
range rather than Auto. This can occur because the Auto
range is not gapless and may lose too much information in
the case of a highly fluctuating current.
Current Ratio
Configure a ratio factor for the current sensors when a current
transducer (CT) is used to measure the much higher level on the
primary side at a substation or step-down transformer that has a built-
in metering current transformer.
The current ratio can be used to increase the sensitivity of the iFlex
sensor. Wrap the iFlex sensor around the primary conductor, for
example 2X, and enter a ratio factor of 1:2 to get correct readings. The
default value is 1:1.
1.888.610.7664 sales@GlobalTestSupply.com
Fluke-Direct
.com

1736/1738
Users Manual
32
Auxiliary Input
The Logger supports up to two additional measurement channels with
either the wired AUX input or wireless radio signals from Fluke
Connect sensors.
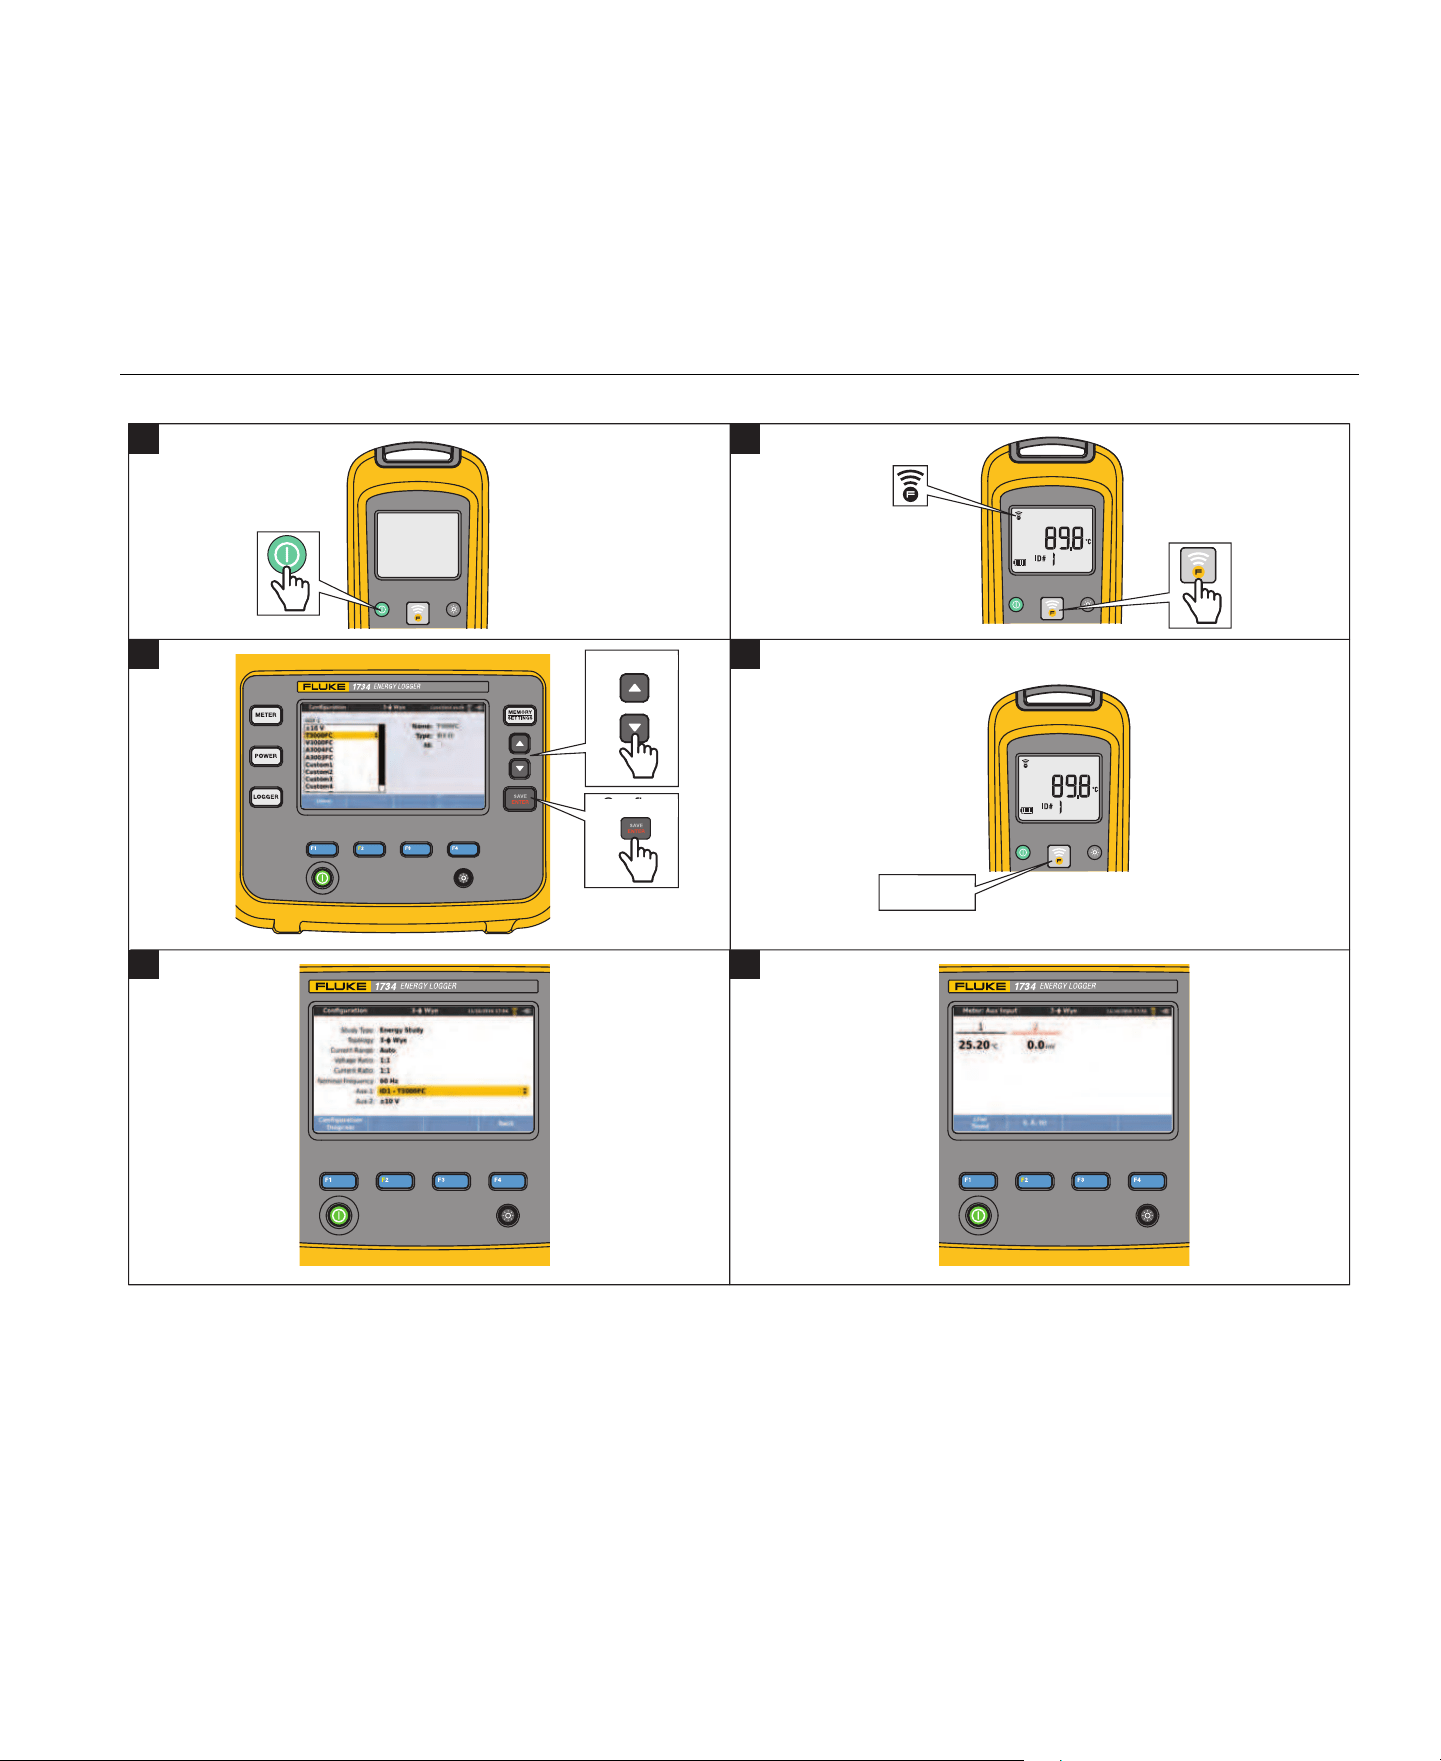
Wireless Connection to Fluke Connect Modules
The Logger supports wireless radio communication with Fluke
3000-series modules to remotely monitor equipment. See Figure 6.
Wireless communication requires that the USB-1 FC WiFi-BLE
adapter is installed. See WiFi and WiFi/BLE-to-USB Adapter on
page 6 for more information.
To set up a module:
1.
Turn on the module.
2.
Push on the module to turn on the radio. The display shows
.
3.
On the Logger, select AUX 1 or AUX 2. Active FC sensors within
a 10 m range show in the selection list on the Logger. Highlight
the FC module and push
. The Logger assigns an ID number
to the module.
4.
Verify on the module:
•
ID number shows on the module
•
flashes to confirm the connection
Note
FC modules that are connected to another device are not
available and do not show in the selection list.
5.
Verify that the Measurement Configuration screen shows the ID
number and module type in the AUX field.
If the module moves out of range, the ID number does not
show in the Measurement Configuration screen to indicate that
the connection is broken. The connection is re-established when
the module moves back into range.
6.
On the Logger, go to the Meter screen to view the measurements
from the connected module.
Note
You cannot change the measurement parameter or unit on
the module during a logging session.
For more information about FC module support with the Logger, go to
1.888.610.7664 sales@GlobalTestSupply.com
Fluke-Direct
.com
Power Logger
Function Selection Buttons
33
Figure 6. Wireless Connection to Fluke Connect Modules
Select
Confirm
1
Flashes
1 2
3
5
6
4
Select
Confirm
Flashes
1.888.610.7664 sales@GlobalTestSupply.com
Fluke-Direct
.com

1736/1738
Users Manual
34
Wired Connection
Configure the Auxiliary input to show the readings for the attached
sensor. In addition to the default setting of ±10 V, up to five custom
sensors can be configured and selected for the Auxiliary input
channels.
To configure custom sensors:
1.
Select one of the five custom sensors.
2.
When the sensor has not been configured, push (Edit) to
access the configuration screen.
3.
Configure name, sensor type, unit, gain and offset. Confirm the
settings with
(Back).
4.
Select the sensor for the Auxiliary input with .
The configuration includes name, sensor type, unit, gain and offset:
•
Change the Name from Custom1...5 to any clear identification of
the sensor with up to 16 characters.
•
Select the Sensor Type from a list that includes 0-1 V, 0-10 V,
4-20 mA, and other.
Use the 0-1 V and 0-10 V settings for sensors with a voltage
output directly connected to the Aux input. The commonly
used sensors that provide an output current of 4-20 mA can be
used. In this case, an external resistor parallel to the Aux input
(+) and Aux input (-) is required. A resistor value of 50 Ω is
recommended. Resistor values >500 Ω are not supported. The
resistor value is entered in the sensor configuration dialog and
is a convenient method for configuration of the sensor
measurement range.
•
Use up to 8 characters to configure the measurement Unit of the
parameter.
•
Configure the gain and offset. For sensor types 0-1 V, 0-10 V, and
4-20 mA, the Gain and Offset are automatically calculated with
the measurement range of the sensor. In the Minimum field, enter
the measurement value that the sensor supplies on the output, 0 V
for 0-1 V and 0-10 V sensors or 4 mA for 4-20 mA sensors. In the
Maximum field, enter the measurement value when the sensor
supplies 1 V for 1 V sensors, 10 V for 10 V sensors, or 20 mA for
20 mA sensors.
For all other sensors types, use Other. For this sensor type use a gain
and offset.
Example 1:
Temperature sensor ABC123
Measurement range: -30 °C to 70 °C
Output: 0-10 V
The configuration for this sensor looks like this:
- Name: Change the name from Custom1 to ABC123 (°C)
- Sensor Type: Select 0-10 V
- Unit: Change Unit1 to °C
- Minimum: Enter -30
- Maximum: Enter 70
1.888.610.7664 sales@GlobalTestSupply.com
Fluke-Direct
.com

Power Logger
Function Selection Buttons
35
Example 2:
Fluke 80TK Thermocouple Module
Output: 0.1 V/°C, 0.1 V/°F
Settings in sensor configuration:
- Sensor type: Other
- Unit: °C or °F
- Gain: 1000 °C/V or 1000 °F/V
- Offset: 0 °C or 0 °F
Events
The Events screen shows the settings for:
•
Dip
•
Swell
•
Interruption
•
Inrush Current
The Dip, Swell, and Interruption settings on this screen are information
only, but you can edit the Inrush Current setting:
1.
Highlight Inrush Current.
2.
Push to open a numeric keypad.
3.
Use / to input a new limit value.
Connection Verification and Correction
Once the measurement is configured and the voltage and current
inputs are connected to the system under test, go back to the Meter
mode and use the Verify Connection touch button to confirm the
connection.
The verification detects:
•
Too low signal
•
Voltage level mismatch with nominal voltage setting
•
Phase rotation for voltage and current
•
Inverted current probes
•
Wrong phase map
Push (Show Menu) to navigate through the Verify, Correct
Digitally, and Phasor screens.
Verify
1.
Push (Show Menu) and select Verify.
Push
to toggle between Generator Mode and Motor
Mode.
Usually the current flow direction is toward the load. Use
Motor Mode for these applications.
Use the Generator Mode when the current sensors are
connected intentionally to the generator. An example is during
the time that energy goes into the grid from a regenerative
braking system of an elevator or on-site wind turbines.
The current flow arrow indicates the correct flow:
•
Normal condition is shown in Motor Mode with a black arrow
pointing upwards
•
In Generator Mode the black arrow is pointing downwards.
•
If the arrow is shown in red, the current flow direction is
inverted.
1.888.610.7664 sales@GlobalTestSupply.com
Fluke-Direct
.com

1736/1738
Users Manual
36
If the Logger is able to determine a better phase map or polarity, push
(Auto Correct) to apply the new settings.
Auto Correct is not available if the algorithm is not able to detect a
better phase map or when no errors are detected.
Note
It is not possible to detect all incorrect hook-ups automatically.
You must verify the suggested modifications carefully before
you apply the digital correction. Applications with single-
phase energy generation can deliver the wrong results when
you apply the Auto Correct feature.
In three-phase systems, the algorithm creates a sequence with a
clockwise phase rotation.
Correct Digitally
Push (Show Menu) and select Correct Digitally to access the
connection correction screen. This screen allows you to virtually swap
phases and invert the current inputs instead of a manual correction.
Phasor
The Phasor screen shows the phase relation between voltages and
currents in a vector diagram. Additional numerical values are RMS
and fundamental phase voltages, currents, and phase angles.
1.
Push (Show Menu) and select Phasor to access this
screen.
The reference channel with 0° is the voltage phase A/L1 in
Energy studies and the current channel A/L1 in Load studies.
2.
Push (Absolute Angles) to display the current phase
angles with their values in the three phase system.
3.
Push (Relative Angles) again to toggle the display and
show the current phase angles relative to the corresponding
voltage.
Power
– In the Power mode you can get the values and a live trend
chart for each phase (A, B, C or L1, L2, L3) and total as:
•
Active Power (P) in W
•
Apparent Power (S) in VA
•
Non-active Power (D) in var
•
Power Factor (PF)
Use
(Fundamental/RMS) to toggle between full bandwidth
power values and power of the fundamental.
In the fundamental power screen you see these values:
•
Fundamental Active Power (P
fund
+) in W
•
Fundamental Apparent Power (S
fund
) in VA
•
Fundamental Reactive Power (Q
fund
) in var
•
Displacement Power Factor (DPF) / cosϕ
Push
(Show Menu) to open a list of simplified Power screens
that show all phases and total of one parameter, all parameters of one
phase, or total.
1.888.610.7664 sales@GlobalTestSupply.com
Fluke-Direct
.com

Power Logger
Function Selection Buttons
37
The menu also provides the access to live values of Energy as:
•
Active Energy (Ep) Wh
•
Reactive Energy (E
Q
r) in varh
•
Apparent Energy (E
s
) in V Ah
To display a trend chart of the last 7 minutes of Power values:
1.
Push (Live-Trend).
2.
Use or the cursor keys to show the list of available
parameters.
3.
Push (Reset) to clear the graph and restart.
Note
In the user interface, the term Fundamental is sometimes
shortened to “Fund.” or “h01.”
Logger
– In Logger mode, you can:
•
Configure a new logging session
•
Review the data of an ongoing logging session in memory
•
Review the data of a completed logging session (as long as no
new session has been started)
Push
and then (Logging Sessions) to review a logging
session.
Logging Session Setup
When no logging session is active, push
to display the Setup
Summary screen for logging. This screen lists all logging parameters
such as:
•
Session name
•
Duration and optional recording date and time for start/stop
•
Interval of the average calculation
•
Demand interval (not available for load studies)
•
Energy costs (not available for load studies)
•
Description
1.888.610.7664 sales@GlobalTestSupply.com
Fluke-Direct
.com

1736/1738
Users Manual
38
To select between Load Study and Energy Study:
1.
Go to Meter > Change Configuration. This Configuration screen
contains the measurement configuration parameters such as
Topology, current range, voltage, and current ratios.
2.
See Measurement Configuration on page 23 for more
information.
3.
After you review these parameters, push the Start Logging
touch target to start recording.
4.
If you want to modify the parameters, push Edit Setup touch
target. The settings are kept during a power cycle. This allows
you to configure the logging session in the office when more
convenient and avoid this time-consuming task in the field.
Name
The Logger auto-generates a file name with the format ES.xxx or
LS.xxx.
ES ... Energy Study
LS ... Load Study
xxx ... incremental file number
The counter resets when the Logger is set to factory defaults. See
Reset to Factory Defaults on page 51 for details. You can also choose
a custom file name with up to 31 characters.
Duration and Recording Start/Stop Date and Time
You can set the duration of the measurement from a list. No end
configures the maximum possible duration based on the available
memory.
For a duration not shown in the list, select Custom to enter the
duration in number of hours or days.
The logging session stops automatically when the time duration has
elapsed. You can manually stop the logging session at any time.
A logging session starts to record immediately when you push the
Start Logging touch target. Or, you can configure a scheduled
recording. It is either configured by the duration and the start date and
time or by the start date and time and stop date and time.
This is a convenient method for how to set up the Logger to measure
a full week profile starting on Monday 0:00 and ending on Sunday
24:00.
Note
Even when a start date and time has been configured, you
must push the Start Logging button.
1.888.610.7664 sales@GlobalTestSupply.com
Fluke-Direct
.com

Power Logger
Function Selection Buttons
39
Options to configure the logging session:
•
Duration and manual start
•
Duration and set start date/time
•
Set start date/time and set end date/time
A memory gauge shows the memory used by recorded sessions and
stored screenshots in black. The memory required for the new
session is shown in green. When the new logging session will not fit in
the available memory, the gauge turns from green to red. If you
confirm the selection, the Logger will adjust the averaging interval
accordingly.
Interval of the average calculation
Select the time interval when a new average value is added to the
logging session. The available intervals are: 1 s, 5 s, 10 s, 30 s, 1 min,
5 min, 10 min, 15 min, 30 min.
A shorter interval provides more details at the cost of higher memory
consumption.
Examples of when a short interval is useful:
•
Identify duty cycle of frequently switching loads
•
Energy cost calculation of production steps
The Logger recommends an interval based on the duration to get the
best balance between resolution and data size.
A memory gauge shows the memory used by recorded sessions and
stored screenshots in black. The memory required for the new
session is shown in green. In the case where the new logging session
will not fit in the available memory, the gauge turns from green to red.
It is still possible to confirm the selection but the Logger will adjust the
duration accordingly.
Demand Interval
Electrical suppliers use this interval to measure the customer demand.
Select an interval to get energy costs and the maximum demand
value (average power measured over a demand interval).
A value of 15 minutes is normal. If you don't know the average
interval, select 5 minutes. You can recalculate other interval lengths
offline using the Energy Analyze Plus software.
Note
This value is not available for load studies.
1.888.610.7664 sales@GlobalTestSupply.com
Fluke-Direct
.com

1736/1738
Users Manual
40
Energy costs
Enter the costs/kWh for demand energy. The energy costs are applied
to forward energy (positive energy) using the demand interval and can
be reviewed in the Logger detail screen Energy - Demand.
Energy costs can be entered using a resolution of 0.001. The currency
unit is changed in Instrument Settings. See Instrument Settings on
page 47 for more information.
Note
This value is not available for load studies.
Description
Enter more details about the measurement, such as customer,
location, and load-rating plate data with the virtual keyboard. This
description field is limited to 127 characters.
After you download a logging session with Energy Analyze software,
use more advanced inputs to support line breaks and up to 1000
characters.
Logging Session Review
When a logging session is started, or when you review a completed
session, the Logging home screen is shown. During active recording,
this screen can be accessed when you push
.
The Logger home screen shows the progress of an active recording.
Use (Show Menu) to review the logging setup. On energy
studies, you can select one of the available overview screens:
•
Power
Screen provides access to V, A, Hz, + (A, Hz, + for load
studies), power, and energy
•
PQ Health (available on 1738 or 1736 with 1736/Upgrade or IEEE
519/Report license)
Screen provides access to Power Quality graphs, harmonics,
and events
•
Quality
Screen provides access to Power Quality graphs, harmonics,
and events
Power/Load Study Overview
The screen shows the overview chart with active power and PF for
energy studies and currents for load studies. Total energy is available
also in energy studies.
The screen updates with each new average calculation interval at a
maximum of every 5 seconds.
From the Logger home screen you have access to:
•
V, A, Hz, + (A, Hz, + for load studies)
•
Power
•
Energy
•
Details
1.888.610.7664 sales@GlobalTestSupply.com
Fluke-Direct
.com

Power Logger
Function Selection Buttons
41
In the "V, A, Hz, +", "Power" and "Energy" screens, use (Show
Menu) or the cursor keys to see a list of available parameters. Use
/ to select a parameter and confirm the selection with .
Tables update with each new average calculation interval at a
maximum of every 5 seconds. Push (Refresh) to update charts
on request.
V, A, Hz, + (Load studies: A, Hz, +)
You can determine the average value measured over the logging
duration as well as minimum/maximum values with high resolution.
Note
+ available with the Logger and the PC software
0 available with the PC software
The algorithm to calculate Voltage min/max values is in accordance to
established power quality standards to detect dips, swells, and
interruptions.
Watch for values exceeding ±15 % of the nominal voltage. This is an
indicator of power quality problems.
High maximum values on Currents can be an indicator for tripping
circuit breakers.
Push
(Graph) to display the measured values in a chart. The
table on the right side of the screen shows the highest and lowest
value of the graph measured with the average calculation interval.
Triangular indicators point to the measurement value.
Power
Note
Not available on load studies without a nominal voltage.
Review the power values in tabular format and as a time chart.
Depending on the power parameter or the average value measured
over the logging duration, additional values are available:
For all power values, except PF and DPF, the three highest values
during the logging session are available. Use
(Reverse
Power/Forward Power) to toggle between Top-3 forward and Top-3
reverse values.
Push (Graph) to display the measured values in a chart. The
table on the right side of the screen shows the highest and lowest
value of the graph measured with the average calculation interval.
Triangular indicators point to the measurement value.
Parameter Min Max Resolution
A++
Sliding half-cycle (typ. 20 ms @
50 Hz, 16.7 ms @ 60 Hz)
V0+
Sliding half-cycle (typ. 10 ms @
50 Hz, 8.3 ms @ 60 Hz)
Hz + +
200 ms
AUX + +
200 ms
THD-V/THD-A 0 +
200 ms
Parameter
Min/M
ax Top 3
Top 3
Forward/Re
verse
Active Power (W)
--
+/+
Apparent Power (VA)
-+
-
Non-active Power (var)
-+
-
Power Factor
+-
-
Active Power fund. (W)
--
+/+
Apparent Power fund. (VA)
-+ -
Reactive Power (var)
-- +/+
Displacement Power Factor/cosϕ +- -
1.888.610.7664 sales@GlobalTestSupply.com
Fluke-Direct
.com

1736/1738
Users Manual
42
Energy
Note
Not available on load studies without a nominal voltage.
Determine the energy consumed/delivered since the logging session
has been started.
The Demand screen shows the values for:
•
Consumed energy (= forward energy) in Wh
•
Maximum Demand in W. Maximum demand is the highest active
power measured over the demand interval and is often part of the
contract with the electricity supplier.
•
Energy cost. The currency can be configured in instrument
settings. See Instrument Settings on page 47 for more information.
PQ Health Overview
The PQ Health Overview is available on 1738 or 1736 with
1736/Upgrade or IEEE 519/Report license. This screen shows a
pass/fail analysis based on limits defined by the power quality
standard EN 50160.
The screen includes the parameters for:
•
Frequency
•
Voltage Variations
•
Voltage Harmonics
•
Unbalance
•
Events
The frequency, unbalance, and events have a single bar. Voltage
variations and voltage harmonics are shown in three bars that depend
on the configured topology.
The length of a bar increases if the related parameter is further away
from its nominal value. The bar turns from green to red if a maximum
allowed tolerance requirement is surpassed. When the standard
defines two limits for a parameter (for example, voltage variations
have a limit for 95 % of the time and limit for 100 % of the time) the bar
changes from green to orange when the parameter surpasses the 95
% limit but does not exceed the 100 % limit. For more information go
to
and search for the white paper,
Measurement Methods.
Parameter
Forward/Reverse
Energy
Total
Energy
Active Energy (Wh) +/+ +
Apparent Energy (VAh) -/- +
Reactive Energy (varh) -/- +
1.888.610.7664 sales@GlobalTestSupply.com
Fluke-Direct
.com

Power Logger
Function Selection Buttons
43
The screen updates with each new average calculation interval of
10 minutes.
From the PQ Health Home screen you have access to:
•
PQ Graphs
•
Harmonics
•
Events
Quality Overview
The Quality Overview screen shows an average of voltage THD and
the first 25 voltage harmonics of up to three phases and the number of
voltage events. The screen updates with each new average
calculation interval of 10 minutes.
PQ Graphs
Use
(PQ Graphs) to review the graphs of the power quality
parameters: Voltage, Frequency, and Supply Voltage Unbalance. The
Voltage and Unbalance values are averaged every 10 minutes and
the interval begins with the 10-minute clock tick. The time stamp of the
interval represents the end of the interval. The frequency is averaged
over an interval of 10 seconds. New values are available every
10 minutes.
The unbalance value u2 (negative sequence ratio) is the ratio of
negative sequence divided by positive sequence and is shown as a
percentage.
In the case of a counter-clockwise rotating system, the unbalance
would show values exceeding 100 %. In this case the ratio positive
sequence divided by negative system is calculated which results in
values lower or equal to 100 %.
Note
The unbalance is only available in three phase delta and Wye
systems, excluding the balanced systems.
Harmonics
Use
(Harmonics) to access the harmonics analysis screens for
voltage and current.
Harmonics Spectrum
The harmonics spectrum is a bar chart of the harmonics h02 ... h50.
When % of the fundamental is selected, THD is included in the chart.
The bar chart in absolute units (V RMS, A RMS) includes the
fundamental. Use the trend chart to show the exact value.
Trend Chart
The trend chart is a chart of the fundamental, a selectable harmonic,
or THD. A split screen shows the harmonics spectrum in the upper
graph and the trend chart in the lower graph. Touch the bar chart or
use
and to select the parameter of interest. Press
(Trend only) to expand the trend chart to full screen.
1.888.610.7664 sales@GlobalTestSupply.com
Fluke-Direct
.com

1736/1738
Users Manual
44
Harmonics Spectrum Relative to Harmonic Limits
This screen is available on 1738 or 1736 with 1736/Upgrade or
IEEE519/Report license) and shows the harmonics relative to the
individual limit defined by the standard selected in the measurement
configuration. Each bar is green when the measurement is below the
individual limit for this harmonic or THD. When the standard defines
two limits, for example, a limit for 95 % of all values and a limit for 99 %
of all limits, the bar turns orange when the measurement values
comply with the 99 % limit but violate the 95 % limit. When both limits
are exceeded the bar turns red. When the standard defines only one
limit for each harmonic or THD, the bar turns from green to red when
this limit is exceeded. The number of displayed harmonics varies in
accordance with the selected standard.
The side menu in the harmonics screens has a dual use. First, select
the parameter to display and confirm with
. The selector bar jumps
to the lower section for the phase selection. The number of available
phases and the Neutral current depends on the selected topology.
See Measurement Configuration on page 23 for details. Make your
choice and confirm again with
.
Some screens do not include
(Show Menu) to access the side
menu. Use
/ instead.
Events
The Logger captures events on voltage and current. The events are
shown in a table with the columns ID, Start Time, End Time, Duration,
Event Type, Extreme Value, Severity, and Phase. Touch the arrows
left and right of the table to view all available columns. Use / to
highlight an event of interest. On the 1738 or the 1736 with
1736/Upgrade license, use
(Waveshape) and (RMS
Profile) to review the recordings triggered with the start of the event.
The voltage events are classified in dips, swells, and interruptions and
are measured according to the standard IEC 61000–4–30
"Electromagnetic compatibility (EMC) - Part 4-30: Testing and
measurement techniques - Power quality measurement methods".
According to this standard the Logger applies the polyphase event
detection on split phase and three phase systems with the exception
of the topologies 3-phase Delta balanced and the 3-phase Wye
balanced. The events are captured and reported for phase A/L1 only.
Note
The polyphase event detection simplifies the event table
because events on multiple phases are combined when they
occur at the same time or overlap. In the Energy Analyze
Plus software you can select to get either a table with
combined events using the polyphase event detection or a
table with events for each individual phase in order to review
details, like start time, end time, or the extreme value on an
individual phase of interest.
1.888.610.7664 sales@GlobalTestSupply.com
Fluke-Direct
.com
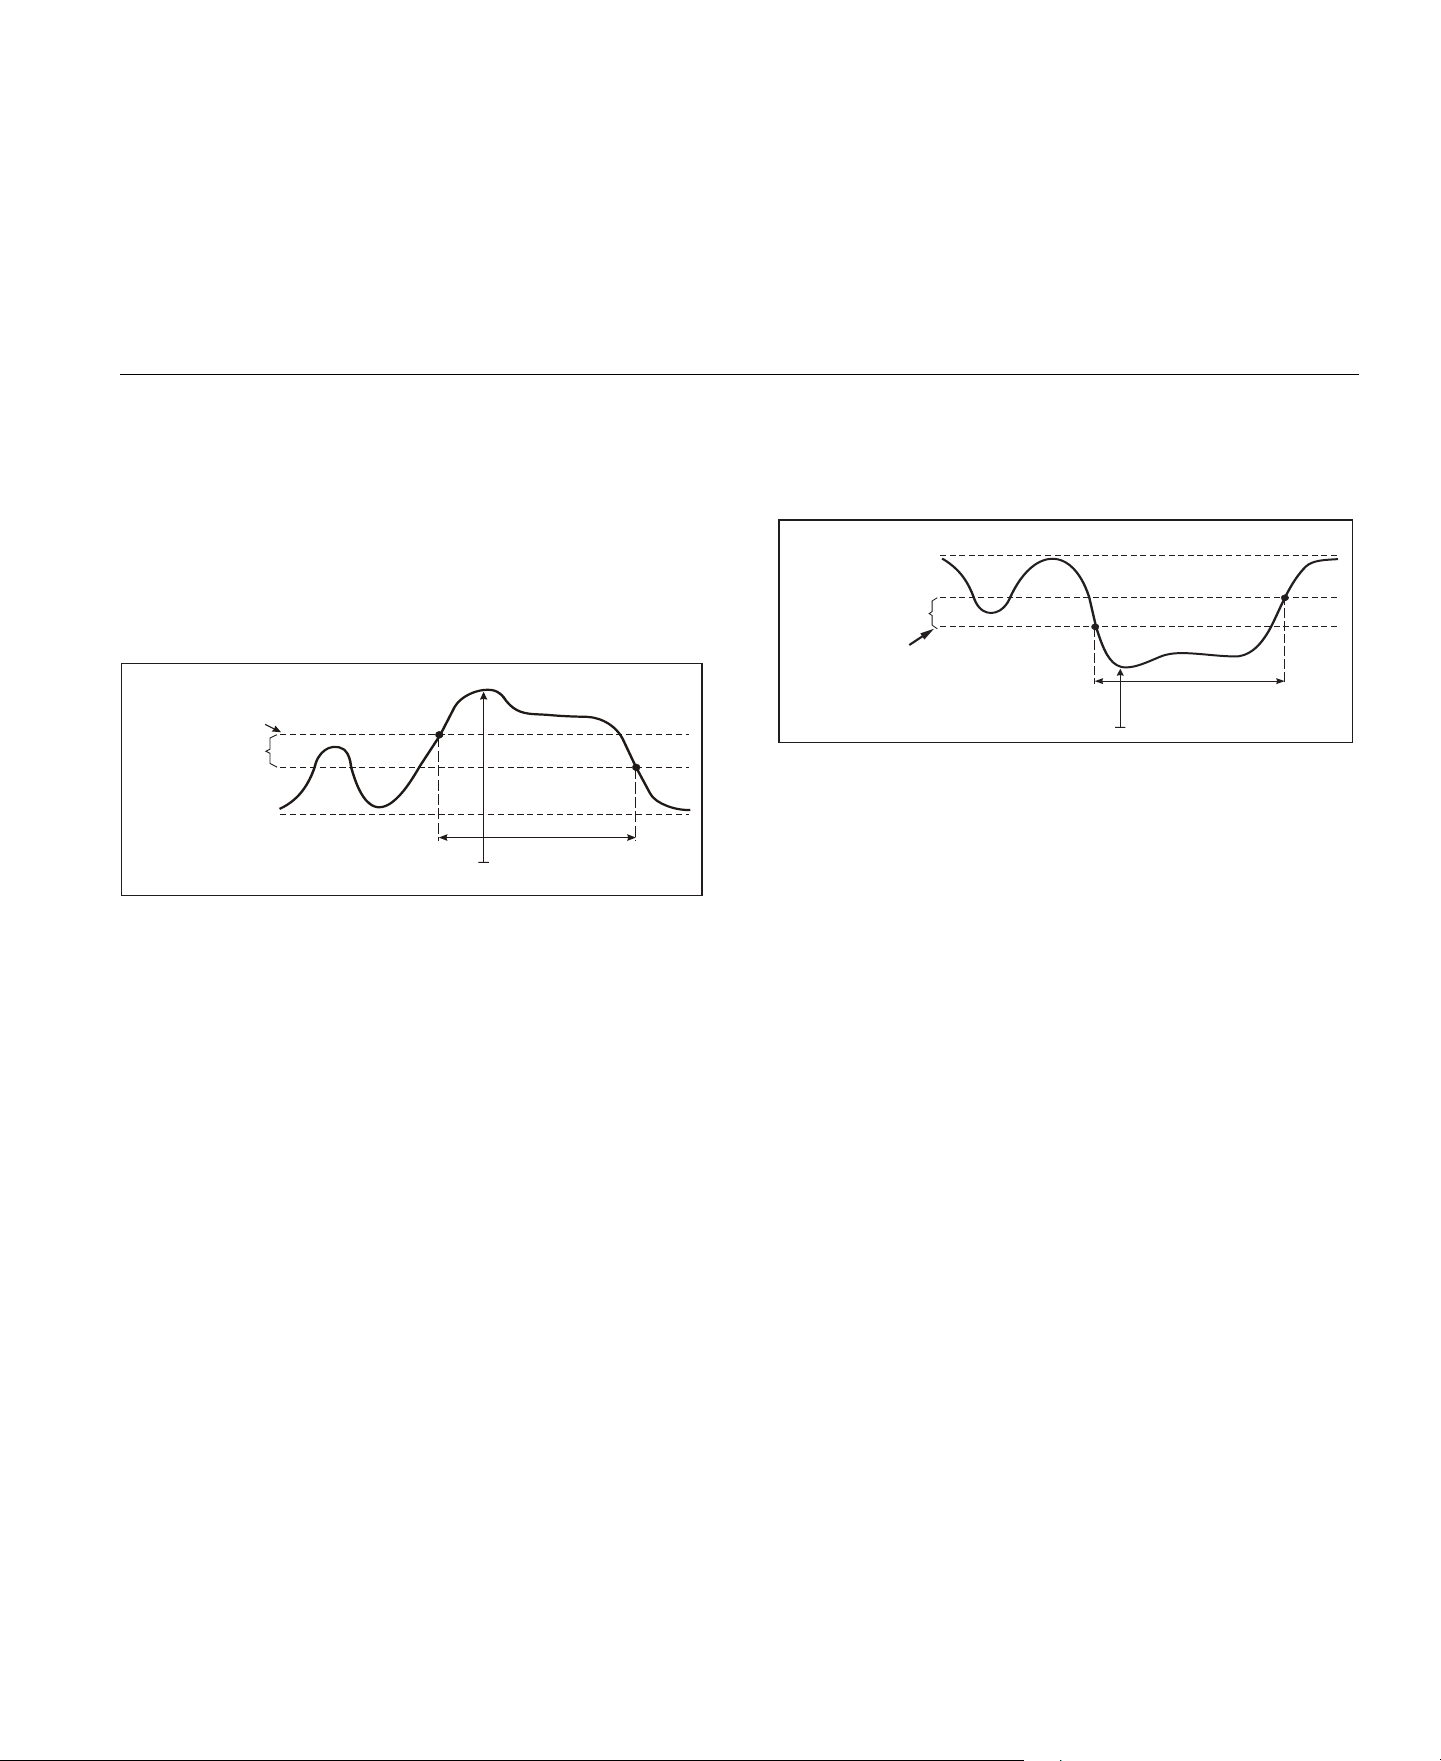
Power Logger
Function Selection Buttons
45
Supply Voltage Swells
On single-phase systems, a swell begins when the voltage rises
above the swell threshold, and ends when the voltage is equal to or
below the swell threshold minus the hysteresis voltage. See Figure 7.
On polyphase systems, a swell begins when the voltage of one or
more channels is above the swell threshold and ends when the
voltage on all measured channels is equal to or below the swell
threshold minus the hysteresis voltage.
Figure 7. Characteristics of a Voltage Swell
On single-phase systems, a voltage dip begins when the voltage falls
below the dip threshold, and ends when the voltage is equal to or
above the dip threshold plus the hysteresis voltage. See Figure 8.
Figure 8. Characteristics of a Voltage Dip
On polyphase systems, a dip begins when the voltage of one or more
channels is below the dip threshold and ends when the voltage on all
measured channels is equal to or above the dip threshold plus the
hysteresis voltage.
Threshold
Hysteresis
Reference Voltage
Time
Magnitude
Duration
Reference Voltage
Hysteresis
Threshold
Time
Magnitude
Duration
1.888.610.7664 sales@GlobalTestSupply.com
Fluke-Direct
.com
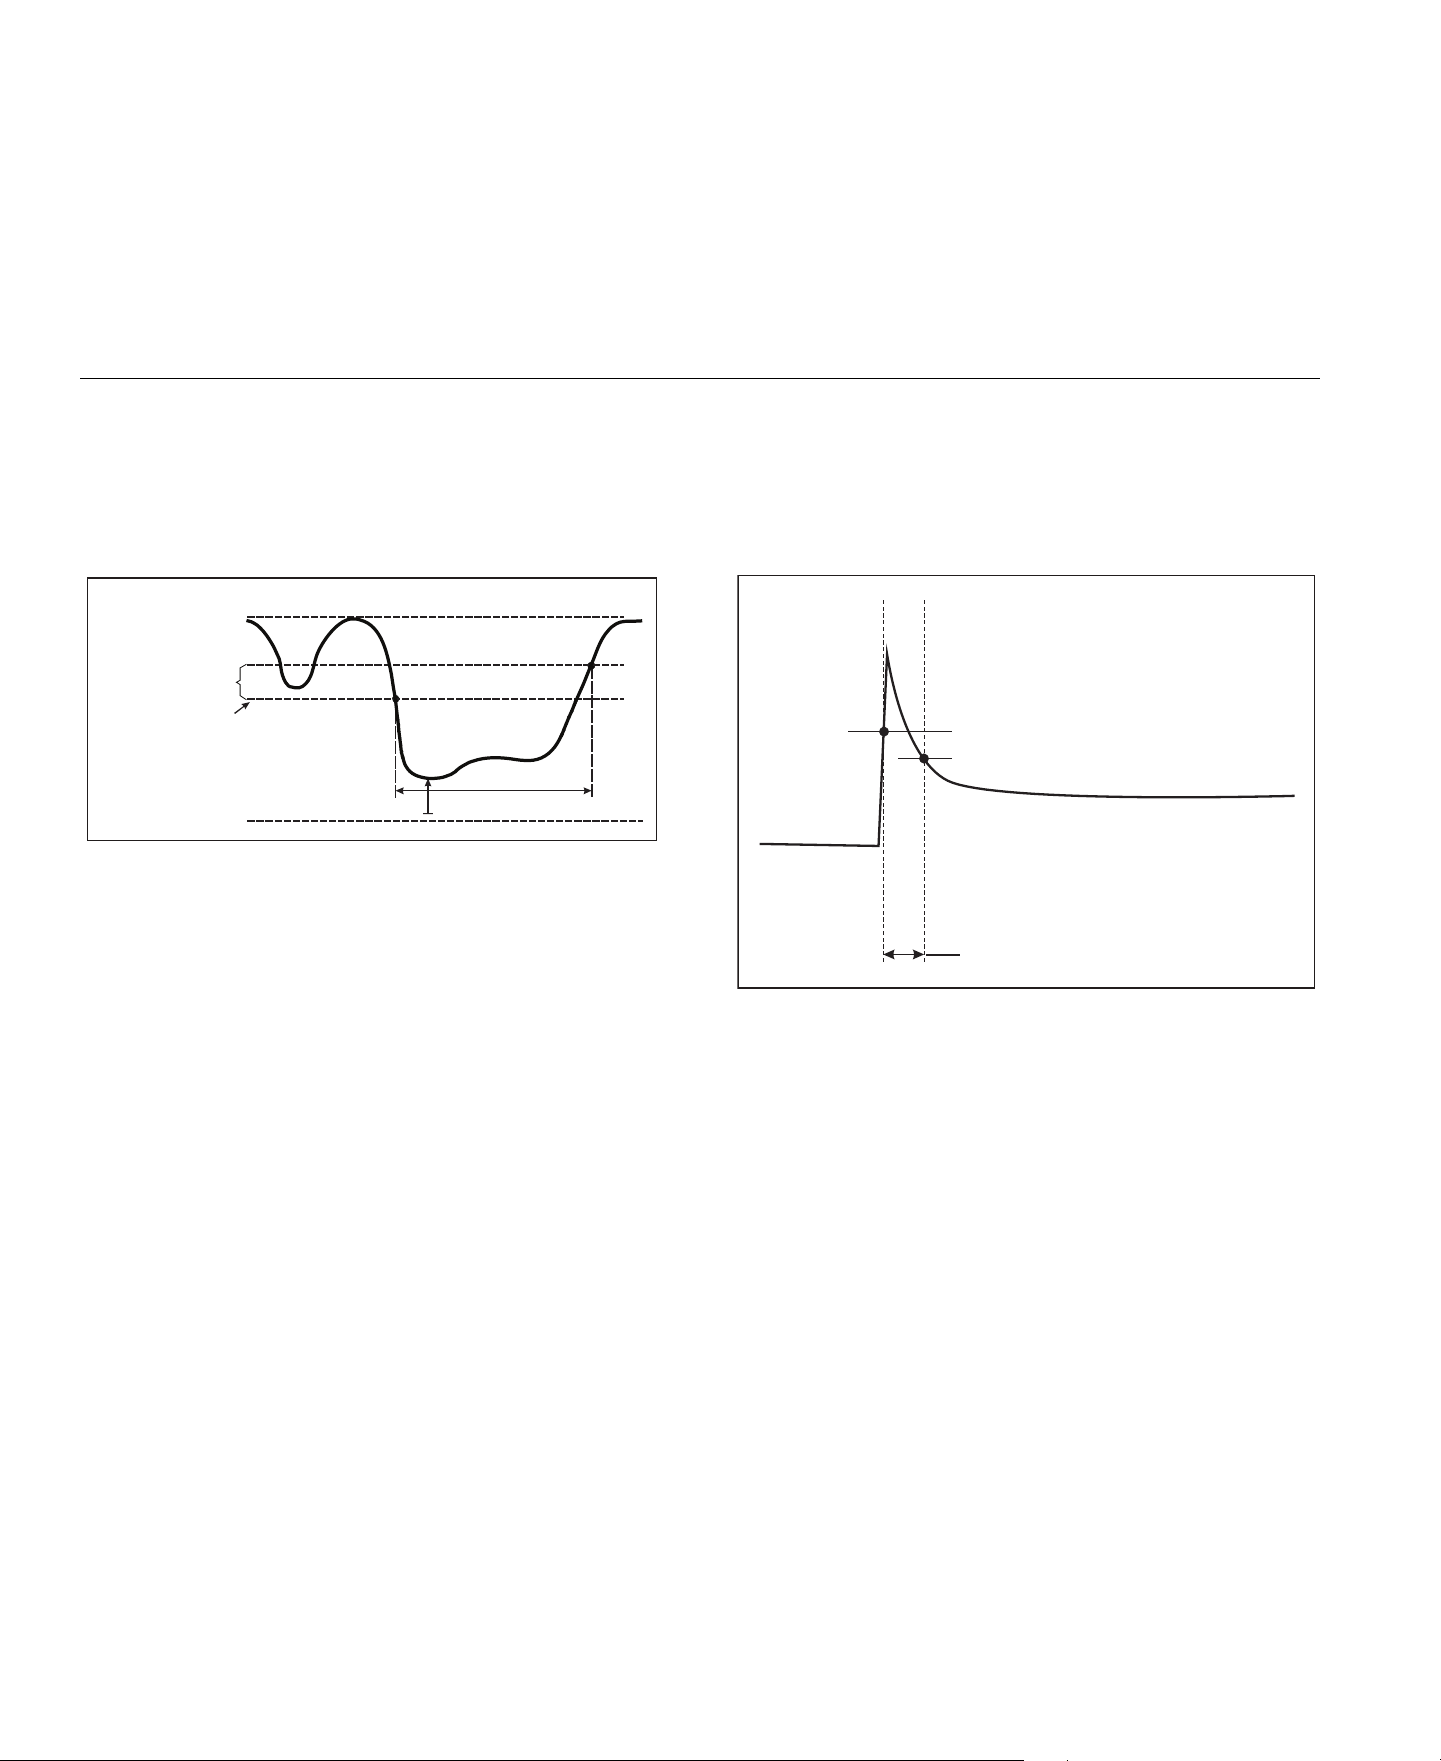
1736/1738
Users Manual
46
Supply Voltage Interruptions
On single-phase systems, a voltage interruption begins when the
voltage falls below the voltage interruption threshold and ends when
the value is equal to or greater than the voltage interruption threshold
plus the hysteresis. See Figure 9.
Figure 9. Characteristics of a Voltage Interruption
On polyphase systems, a voltage interruption begins when the
voltages of all channels fall below the voltage interruption threshold
and ends when the voltage on any one channel is equal to, or greater
than, the voltage interruption threshold plus the hysteresis.
Note
On polyphase systems, the event is still classified as a dip
when the voltage of only one or two phases falls below the
interruption limit.
Inrush Current
Inrush currents are surge currents that occur when a large, or low-
impedance load comes on line. Normally the current will stabilize after
some time when the load has reached normal working condition. For
example the start-up current in induction motors can be 10x the
normal working current. See Figure 10.
The inrush current begins when the 1/2-cycle RMS current rises
above the inrush threshold, and ends when the 1/2-cycle RMS current
is equal to or below the inrush threshold minus the hysteresis value. In
the event table the extreme value is the highest 1/2-cycle RMS value
of the event.
Figure 10. Inrush Characteristics and Relation with Start Menu
Details
The details screen provides an overview of the logging setup. During
an active session or when reviewing an already completed session,
you can modify the description and the cost/kWh with the Edit Setup
touch target.
Push View Configuration to review the measurement configuration
for the logging session.
Duration
Nominal Voltage
Hysteresis
Threshold
0 Volt
Time Magnitude
Threshold
(=Trigger)
Hysteresis
}
Duration
1.888.610.7664 sales@GlobalTestSupply.com
Fluke-Direct
.com

Power Logger
Function Selection Buttons
47
Memory/Settings Button
In this menu you can:
•
Review and erase the data from completed logging sessions
•
Review and erase screen captures
•
Copy measurement data and screen captures to the USB flash
drive
•
Make adjustments to the instrument settings
Logging Sessions
The list of stored logging sessions is available with (Logging
Sessions). Push / to move the screen highlight to the logging
session of interest. Additional information such as start and end time,
duration, logging description, and file size are shown.
1.
Push to review the logging session. See View Logging
Sessions for more details.
Note
It is not possible to review a completed logging session when
another session is active.
2.
Push (Delete) to remove the selected logging session.
Push
to remove all logging sessions.
Note
An active logging session cannot be deleted. Stop the logging
session before you delete.
3.
Push (Save to USB) to copy the selected logging session
to an attached USB flash drive. The session is stored on the USB
flash drive in the folder: \Fluke173x\<serialnumber>\sessions
Screen Capture
In this screen you can review, erase, and copy saved screens to a
USB flash drive.
1.
Push .
2.
Push (Screen Capture) to show the list of all screens. See
Basic Navigation on page 18 for more information about how to
capture screens.
3.
Push / to move the screen highlight to a screen of interest.
A thumbnail image of the screen is shown for easy identification.
4.
Use (Delete) to delete the selected screen. Push
to delete all screens.
5.
Push or (Save All to USB) to copy all screens to an
attached USB flash drive.
Instrument Settings
The Logger has settings for:
•
Name
•
Language
•
Date and time
•
Phase information
•
Currency
•
PIN setting for screen lock
•
Firmware version and update
•
WiFi configuration
•
License information
•
Touch screen calibration
To change the settings:
1.
Push .
2.
Push (Instrument Settings).
1.888.610.7664 sales@GlobalTestSupply.com
Fluke-Direct
.com
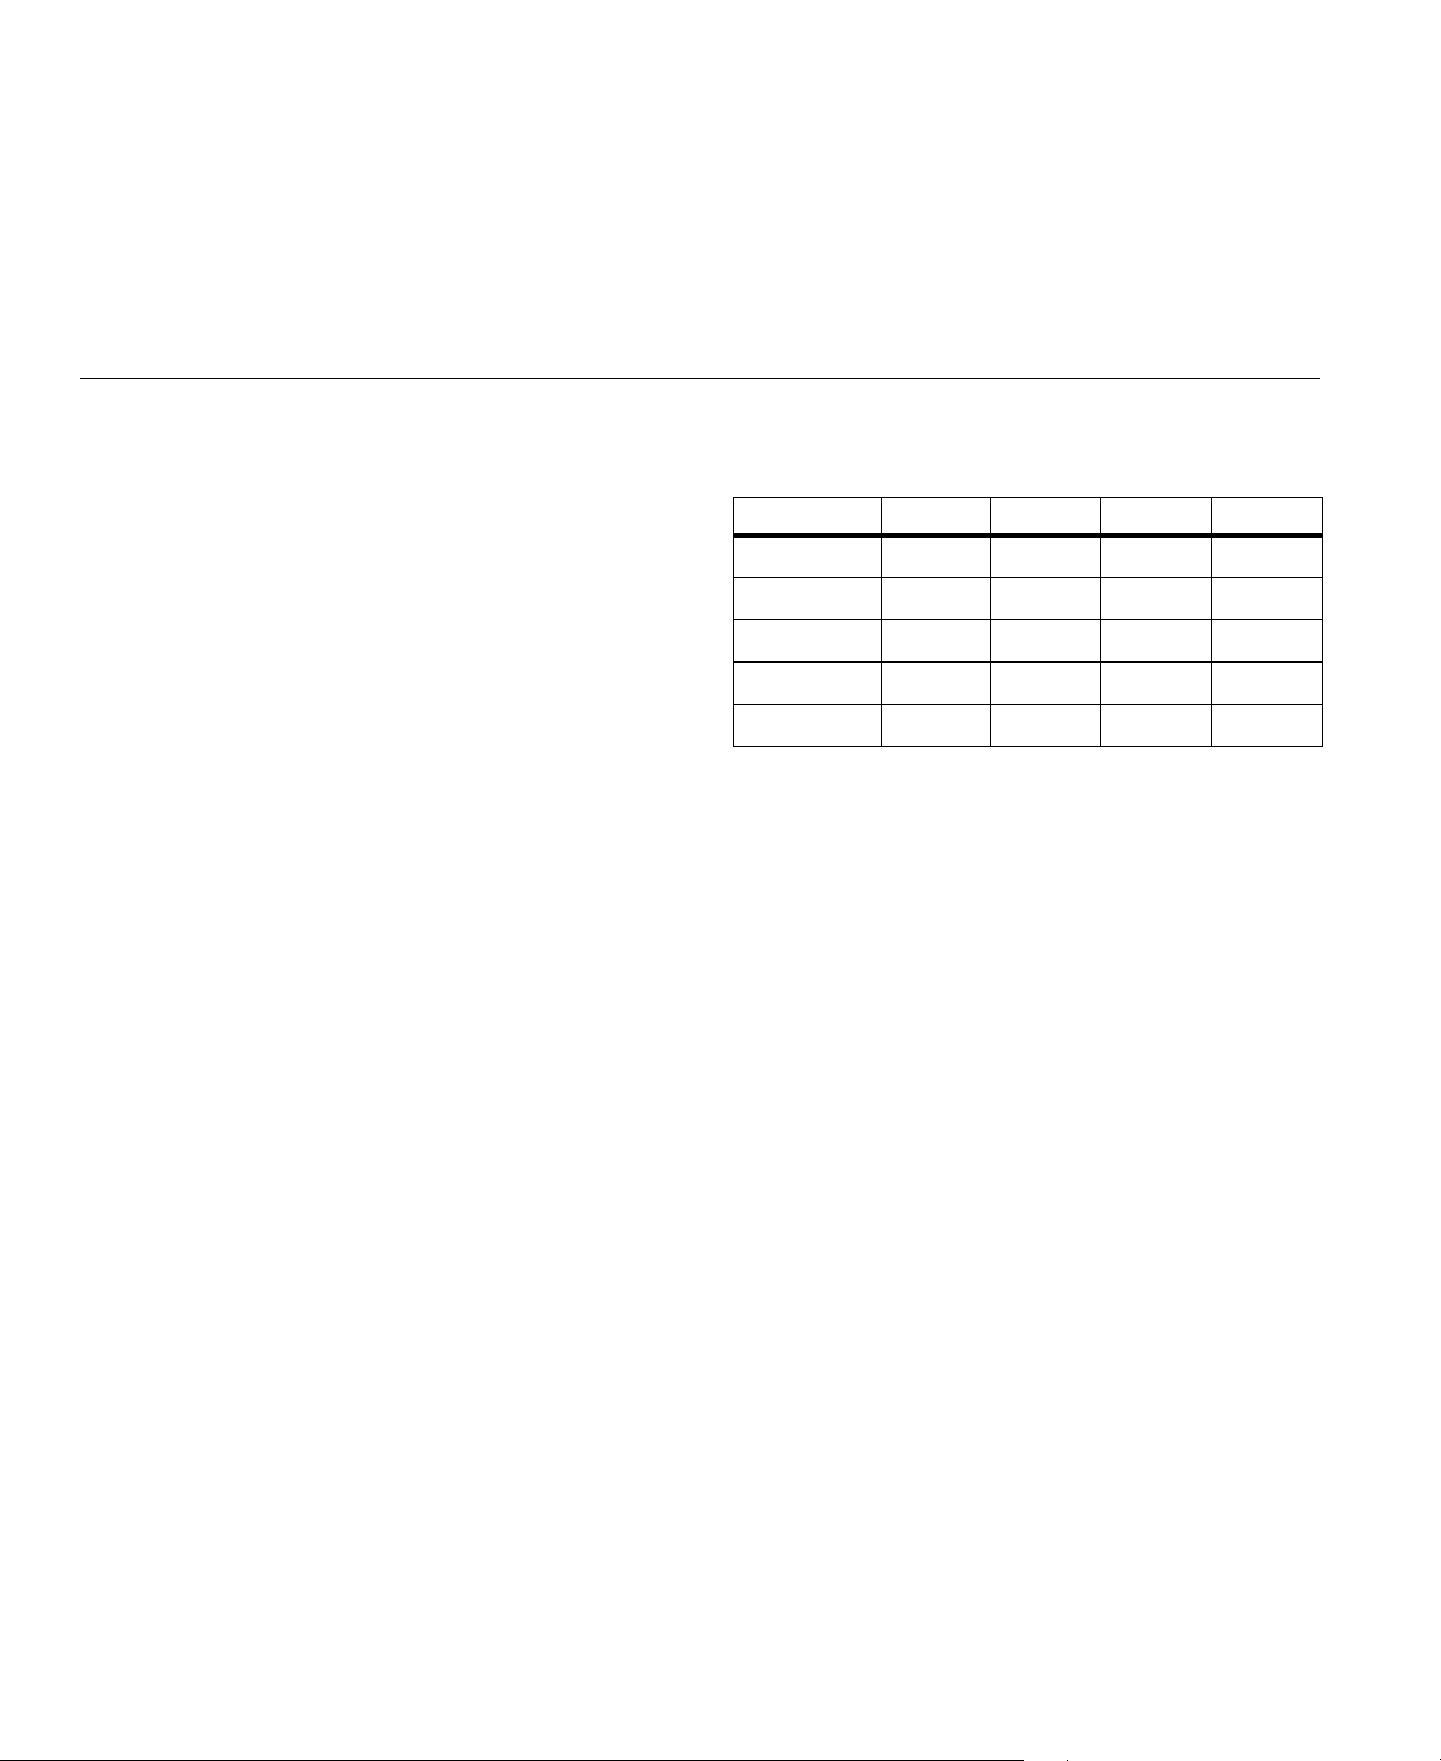
1736/1738
Users Manual
48
Name for Instrument
You can assign a name to the Logger. This name is attached to the
measurement files when you review these files in Energy Analyze
Plus software. The default name is FLUKE173x<serial number>, for
example: FLUKE1736<12345678>.
To change the instrument name:
1.
Push .
2.
Push (Instrument Settings).
3.
Push / to highlight Instrument Name field and push or
touch the Instrument Name target.
Revert to the default name by a reset to factory defaults. See Reset to
Factory Defaults on page 51 for more information.
Language
The user interface of the Logger is available in multiple languages.
To change the display language:
1.
Push .
2.
Push (Instrument Settings).
3.
Push / to move the screen highlight to language field and
push or touch the Language target.
4.
Push / to move through the language list.
5.
Push to activate the new language.
The language immediately updates on the screen.
Phase Color/Phase Labels
The phase colors are configurable to match with the connector panel
decal:
To change the phase color/phase labels:
1.
Push .
2.
Push (Instrument Settings).
3.
Push / to highlight Phases and push or touch Phases
target.
4.
Select one of the available schemes.
5.
Push to toggle the phase label between A-B-C and L1-L2-
L3.
6.
Push to confirm the selection.
Scheme A/L1 B/L2 C/L3 N
US black red blue white
Canada red black blue white
EU brown black gray blue
UK (old) red yellow blue black
China yellow green red blue
1.888.610.7664 sales@GlobalTestSupply.com
Fluke-Direct
.com

Power Logger
Function Selection Buttons
49
Date/Time Zone
The logger stores the measurement data in universal time coordinate
(UTC) to ensure continuity in time and accounts for time changes due
to daylight saving time (DST).
To display the time stamps of the measurement data correctly, it is
required to set the time zone. The Logger adjusts automatically to
DST. For example, a 1-week measurement started on 2-Nov-2013
8:00 am ends on 9 Nov-2013 08:00 am even though the clock was set
back on 3-Nov-2013 from 02:00 to 01:00.
To set the time zone:
1.
Push .
2.
Push (Instrument Settings).
3.
Push / to highlight Time Zone and push or touch Time
Zone target.
4.
Select the regions/continents.
5.
Push .
6.
Continue to select the country/city/time zone until the time zone
configuration is done and the Instrument Settings menu shows.
To set the date format:
1.
Push .
2.
Push (Instrument Settings).
3.
Push / to highlight the Date Format target and push or
touch the Date Format target.
4.
Select one of the available date formats.
5.
Push to toggle between a 12 hour or 24 hour format. A
preview of the configured date format shows on the display.
6.
Push to confirm the selection.
To change the time:
1.
Push .
2.
Push (Instrument Settings).
3.
Push / to highlight the Time target and push or touch
the Time target.
4.
Touch the + and – targets for each field.
5.
Push to confirm the change and exit the screen.
1.888.610.7664 sales@GlobalTestSupply.com
Fluke-Direct
.com

1736/1738
Users Manual
50
Currency
The currency symbol used for energy cost values is configurable.
To set the currency:
1.
Push .
2.
Push (Instrument Settings).
3.
Push / to highlight the Currency target and push or
touch the Currency target.
4.
Select one of the currency symbols and push .
5.
If a currency is not in the list, select Custom and push or
touch Edit Custom target.
6.
Enter a three-letter currency code with the keyboard and accept
with .
7.
Push to confirm the selection.
Screen Lock
During active logging sessions the user interface can be locked to
protect the Logger from unwanted operation. To lock/unlock the
Logger, a PIN is required. The default PIN is 1234.
To set up a new PIN:
1.
Push .
2.
Push (Instrument Settings).
3.
Push / to highlight the Lock PIN target and push or touch
the Lock PIN target.
4.
Enter the old PIN. If the PIN has not been changed before, use
the default PIN 1234.
5.
Enter the new PIN. The PIN can have up to 8 digits. An empty
PIN is also supported.
Status Information
The screen provides information and status about the Logger, such as
the serial number, attached current probes, battery status, and
installed licenses.
To go to the status information:
1.
Push .
2.
Push (Instrument Settings).
3.
Push (Info).
4.
Push to exit the screen.
Firmware Version
To find the firmware version installed on your Logger:
1.
Push .
2.
Push (Instrument Settings).
3.
Push (Info).
4.
Push (Firmware Version).
5.
Push to exit the screen.
Installed Licenses
To show the list of installed licenses:
1.
Push .
2.
Push (Instrument Settings).
3.
Push (Info).
4.
Push (Licenses).
All installed licenses are listed on the screen.
5.
Push to exit the screen.
1.888.610.7664 sales@GlobalTestSupply.com
Fluke-Direct
.com

Power Logger
Function Selection Buttons
51
Touch Screen Calibration
The touch screen has been calibrated at the factory before shipment.
In case you do experience misalignment with the touch targets, use
the touch screen calibration feature.
To calibrate:
1.
Push .
2.
Push (Instrument Settings).
3.
Push (Tools).
4.
Push / to highlight Touch Screen Calibration and push
or touch the Touch Screen Calibration target.
5.
Touch the five cross hair targets as exactly as possible.
WiFi Configuration
To configure the first-time WiFi connection of a PC/smartphone/tablet
to the Logger, setup the WiFi details in the Tools screen.
To view the WiFi setup parameters:
1.
Push .
2.
Push (Instrument Settings).
3.
Push (Tools).
4.
Push / to highlight the WiFi configuration target and push
or touch the WiFi configuration target to view the WiFi
connection details.
Note
This feature is only available when a supported USB WiFi
Adapter is attached to the Logger.
Copy Service Data to USB
If requested for customer support, use this function to copy all
measurement files in raw format and system information to a USB
flash drive.
To copy the service data:
1.
Attach a USB flash drive with sufficient available memory
(depending on the file size of stored logging sessions, maximum
2 GB).
2.
Push .
3.
Push (Instrument Settings).
4.
Push (Tools).
5.
Push / to highlight the Copy service data to USB target
and push or touch Copy service data to USB target to start
the copy process.
Reset to Factory Defaults
The reset function deletes all user data, such as logging sessions and
screen captures. It also deletes the WiFi access point connection
credentials, and sets the instrument settings to default values. It also
enables the first-time use wizard the next time the instrument restarts.
To rese t:
1.
Push .
2.
Push (Instrument Settings).
3.
Push (Tools).
4.
Push / to highlight Reset to Factory Defaults and push
or touch Reset to Factory Defaults target.
A display message prompts you to continue or cancel the
reset.
Note
A reset to factory defaults from the Instrument Settings menu
does not affect the licenses installed on the Logger.
The Logger is reset to factory defaults also when you simultaneously
push and hold the buttons
, , and while the Logger
starts.
1.888.610.7664 sales@GlobalTestSupply.com
Fluke-Direct
.com
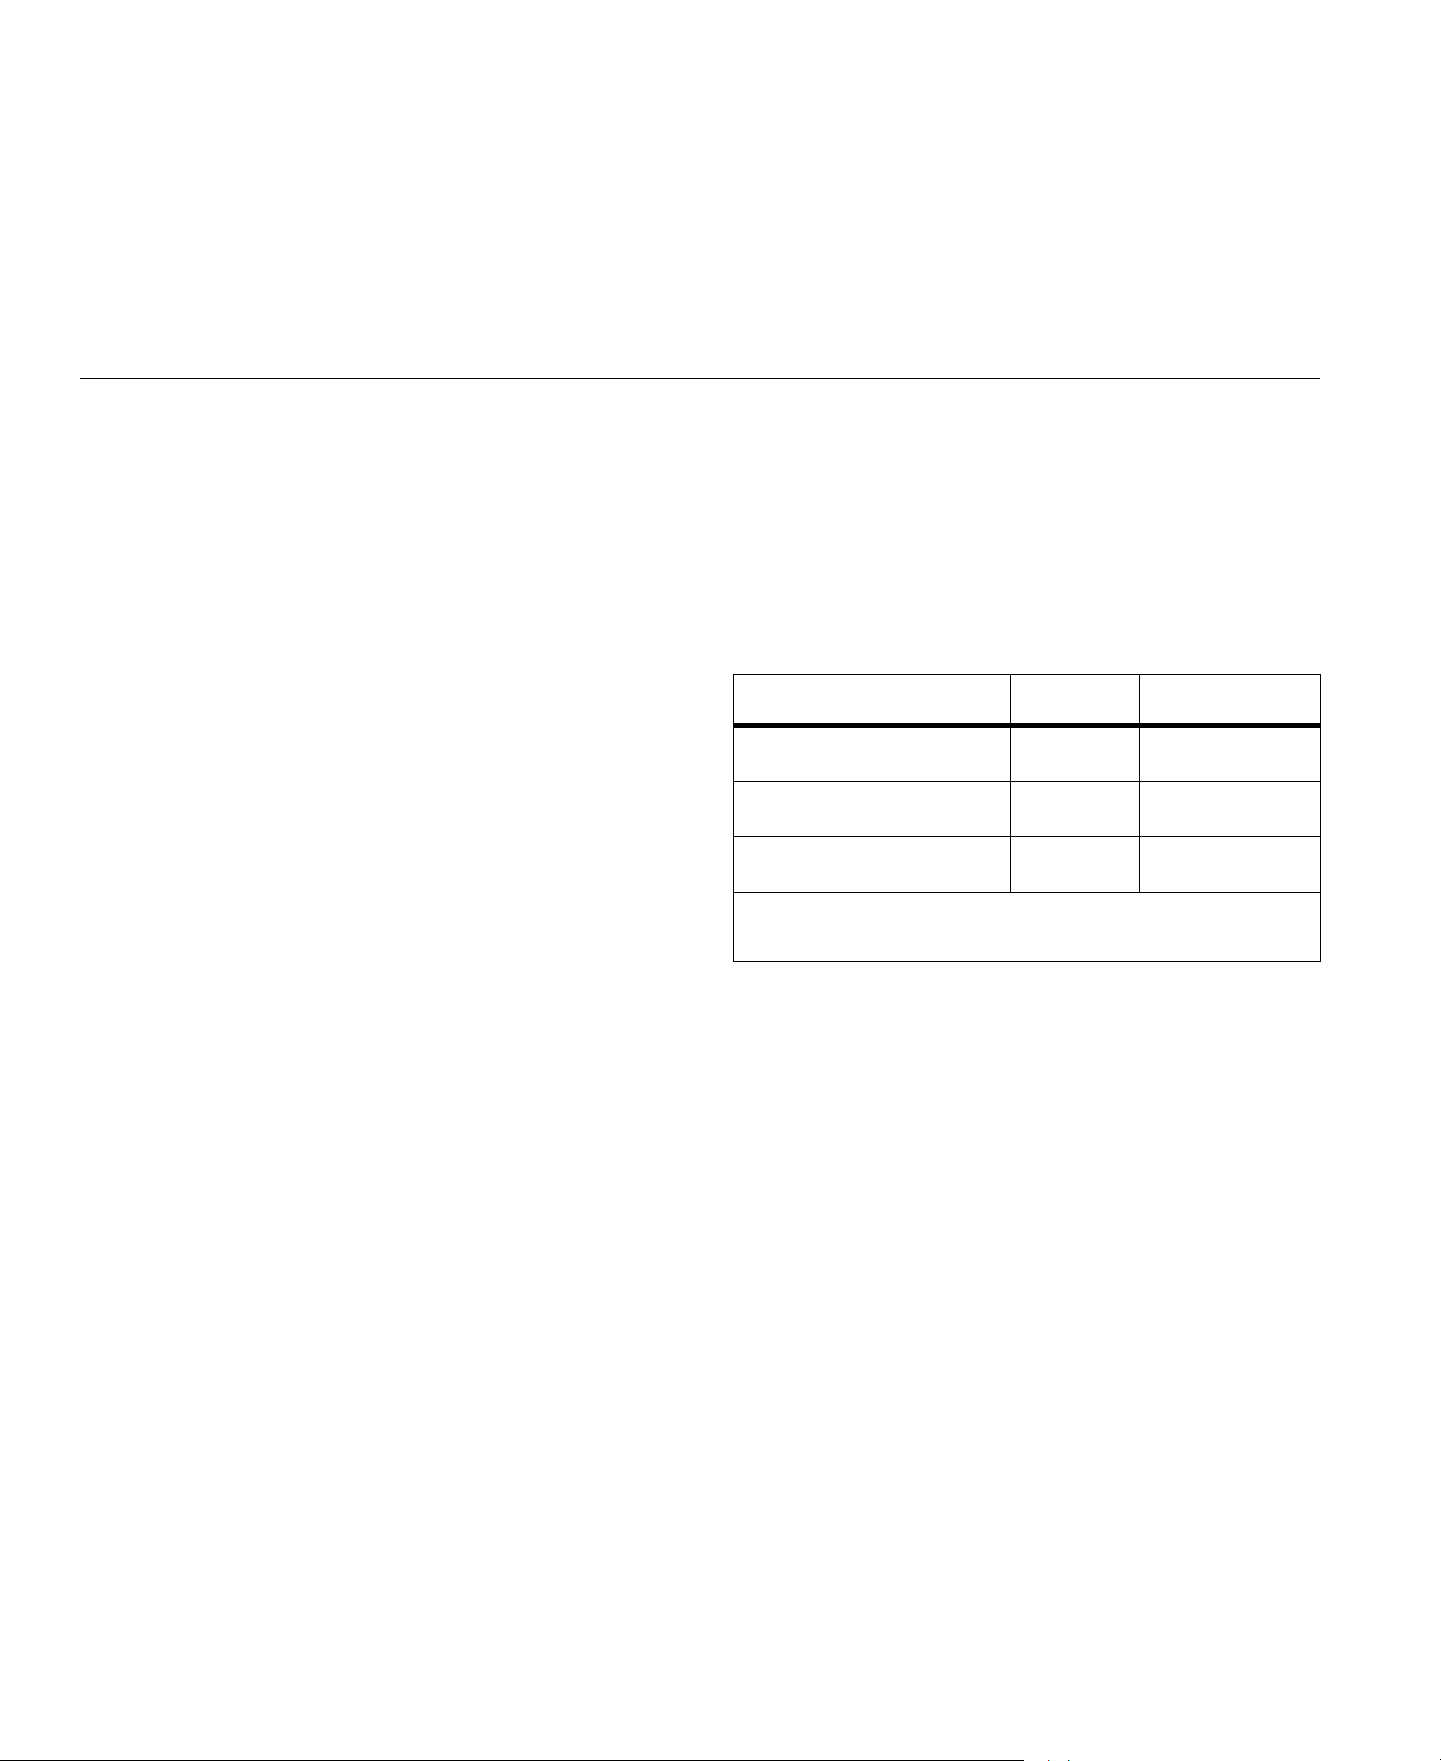
1736/1738
Users Manual
52
Note
The "3-button" reset to factory defaults removes all licenses
installed on the Logger.
Firmware Update
To update:
1.
On a USB flash drive with at least 80 MB of free space available,
create a folder called "Fluke173x" (no spaces in file name).
Note
Make sure the USB flash drive is formatted with FAT or
FAT32 file system. In Windows, USB flash drives ≥32GB can
be formatted with FAT/FAT32 only by using 3rd party tools.
2.
Copy the firmware file (*.bin) into this folder.
3.
Make sure the Logger is powered from mains and turned on.
4.
Plug the flash drive into the Logger. The USB Transfer screen
pops up and offers the firmware update.
5.
Push / to select the firmware update and push .
6.
Follow the instructions. When the firmware update is complete
the Logger restarts automatically.
Note
A firmware update deletes all user data such as
measurement data and screen captures.
This firmware update works only when the firmware version on the
USB flash drive is newer than the installed version.
To install the same version or an older version:
1.
Push .
2.
Push (Instrument Settings).
3.
Push (Tools).
4.
Push / to select Firmware Update and push or touch
the Firmware Update target.
Note
If more than one firmware file (*.bin) is located in the
\Fluke173xfolder, the newest version is used for the update.
Licensed Features
License keys are available as optional accessories to extend the
functionality of the Logger with licensed features.
Table 8 shows the available licensed features:
WiFi Infrastructure
This license activates the connection to a WiFi infrastructure. See
WiFi-Infrastructure on page 59 for details.
Table 8. Optional License Features
Feature 1736 1738
WiFi Infrastructure
[1]
1736/Upgrade
IEEE 519/Report
[1] The WiFi Infrastructure license is complimentary and enabled when you
register the Logger at
1.888.610.7664 sales@GlobalTestSupply.com
Fluke-Direct
.com

Power Logger
Licensed Features
53
1736/Upgrade
The upgrade license activates the advanced analysis features of the
1738 on a 1736 Logger.
Features are:
•
Power Quality assessment according to EN 50160: "voltage
characteristics of electricity supplied by public distribution
networks."
This includes the PQ Health logging overview screen with
pass/fail indication of all supported PQ parameters and the
detailed harmonic limits validation in firmware and software.
•
RMS profile and wave shape recordings on voltage or current
events
IEEE 519/Report
The IEEE 519/Report license enables a validation of voltage and
current harmonics according to the standard IEEE519: "IEEE
recommended practice and requirements for harmonic control in
electric power systems."
License Activation
To activate a license from a PC:
1.
Go to
2.
Go to the product registration page and select your region,
country, and language.
3.
Select Brand > Fluke Industrial.
4.
Select Product Family > Power Quality Tools.
5.
Select Model Name > Fluke 1736 or Fluke 1738.
6.
Enter the serial number of the Logger.
Note
You must enter the serial number correctly (no blank
characters allowed). The serial number is found in the Status
Information screen or on the back decal of the Logger. See
Status Information on page 50 for more information. Do not
use the serial number of the power supply module.
7.
Enter the license key from the license activation letter. The web
form supports up to two license keys. You can enable licensed
features at a later time by returning to the web registration page.
Note
The activation of the WiFi Infrastructure does not require a
license key.
8.
Complete all the fields and submit the form.
An e-mail with the license file is sent to your e-mail address.
9.
Create a folder named "Fluke173x" on a USB flash drive. Do not
use spaces in the file name. Make sure the USB is formatted with
FAT or FAT32 file system. (In Windows, USB flash drives ≥32 GB
can be formatted with FAT/FAT32 only with 3rd party tools.)
10.
Copy the license file (*.txt) to this folder.
11.
Make sure the Logger is powered from mains and turned on.
12.
Insert the flash drive into the Logger. The USB Transfer screen
pops up and offers the license activation.
13.
Proceed with . A message window informs you when the
activation is complete.
1.888.610.7664 sales@GlobalTestSupply.com
Fluke-Direct
.com

1736/1738
Users Manual
54
Maintenance
If the Logger is used appropriately it does not require special
maintenance. Maintenance should only be done at a company related
service center by trained and qualified personnel within the guarantee
period. See
for locations and contact information of
Fluke Service Centers worldwide.
Warning
To prevent possible electrical shock, fire, or personal
injury:
•
Do not operate the Product with covers removed or the
case open. Hazardous voltage exposure is possible.
•
Remove the input signals before you clean the
Product.
•
Use only specified replacement parts.
•
Have an approved technician repair the Product.
How to Clean
Caution
To avoid damage, do not use abrasives or solvents on
this instrument.
If the Logger is dirty, clean it carefully with a damp cloth (without
cleaning agents). Mild soap may be used.
Battery Replacement
The Logger has an internal rechargeable Lithium-ion battery.
To replace the battery:
1.
Remove the Power Supply.
2.
Unscrew the four screws and remove the battery door.
3.
Replace the battery.
4.
Fasten the battery door.
Caution
To prevent damage to the Product, use only original
Fluke batteries.
Calibration
As an additional service Fluke offers the regular examination and
calibration of your Logger. The recommended calibration cycle is
2 years. For more information see How to Contact Fluke on page 2.
1.888.610.7664 sales@GlobalTestSupply.com
Fluke-Direct
.com
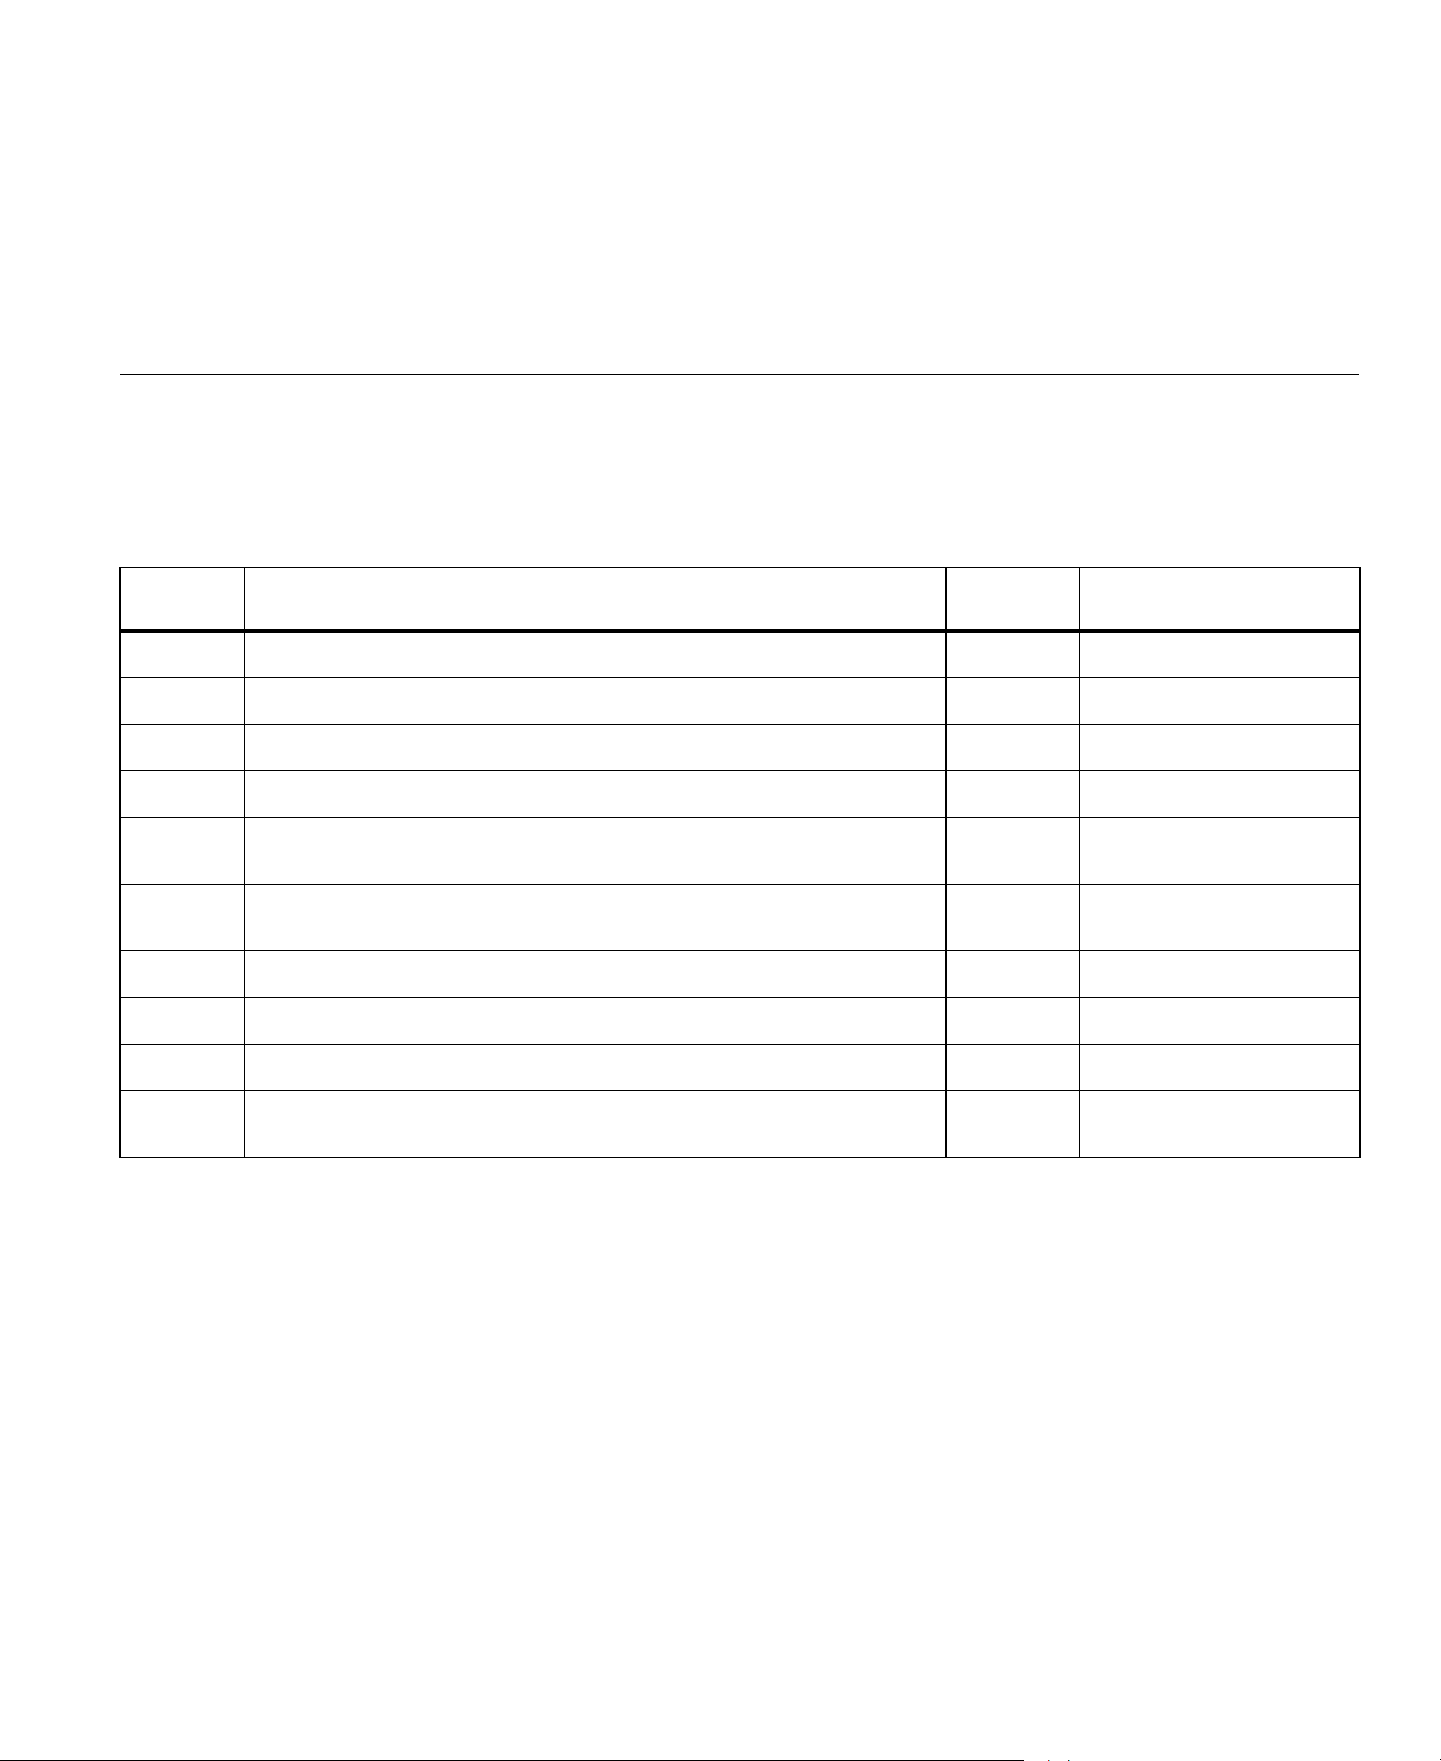
Power Logger
Service and Parts
55
Service and Parts
Replacement parts are listed in Table 9 and shown in Figure 11. To
order parts and accessories, see How to Contact Fluke on page 2.
Table 9. Replacement Parts
Ref. Description Qty.
Fluke Part or
Model Number
Power Supply 1 4743446
Battery Door 1 4388072
Battery Pack, Li ion 3.7 V 2500 mAh 1 4146702
USB Cable 1 4704200
Input Decal, country specific
(US, Canada, Europe/UK, UK/old, China)
1 see Table 6 on page 15
Line Cord, country specific
(N. American, Europe, UK, Australia, Japan, India/S. Africa, Brazil)
1 see Table 2 on page 5
Test Leads 0.1 m Red/Black, 1000 V CAT III 1 set 4715389
Test Leads 1.5 m Red/Black, 1000 V CAT III 1 set 4715392
Color-coded Wire Clips 1 set 4394925
USB Flash Drive
(includes User Manuals and installer for PC software)
1NA
1.888.610.7664 sales@GlobalTestSupply.com
Fluke-Direct
.com
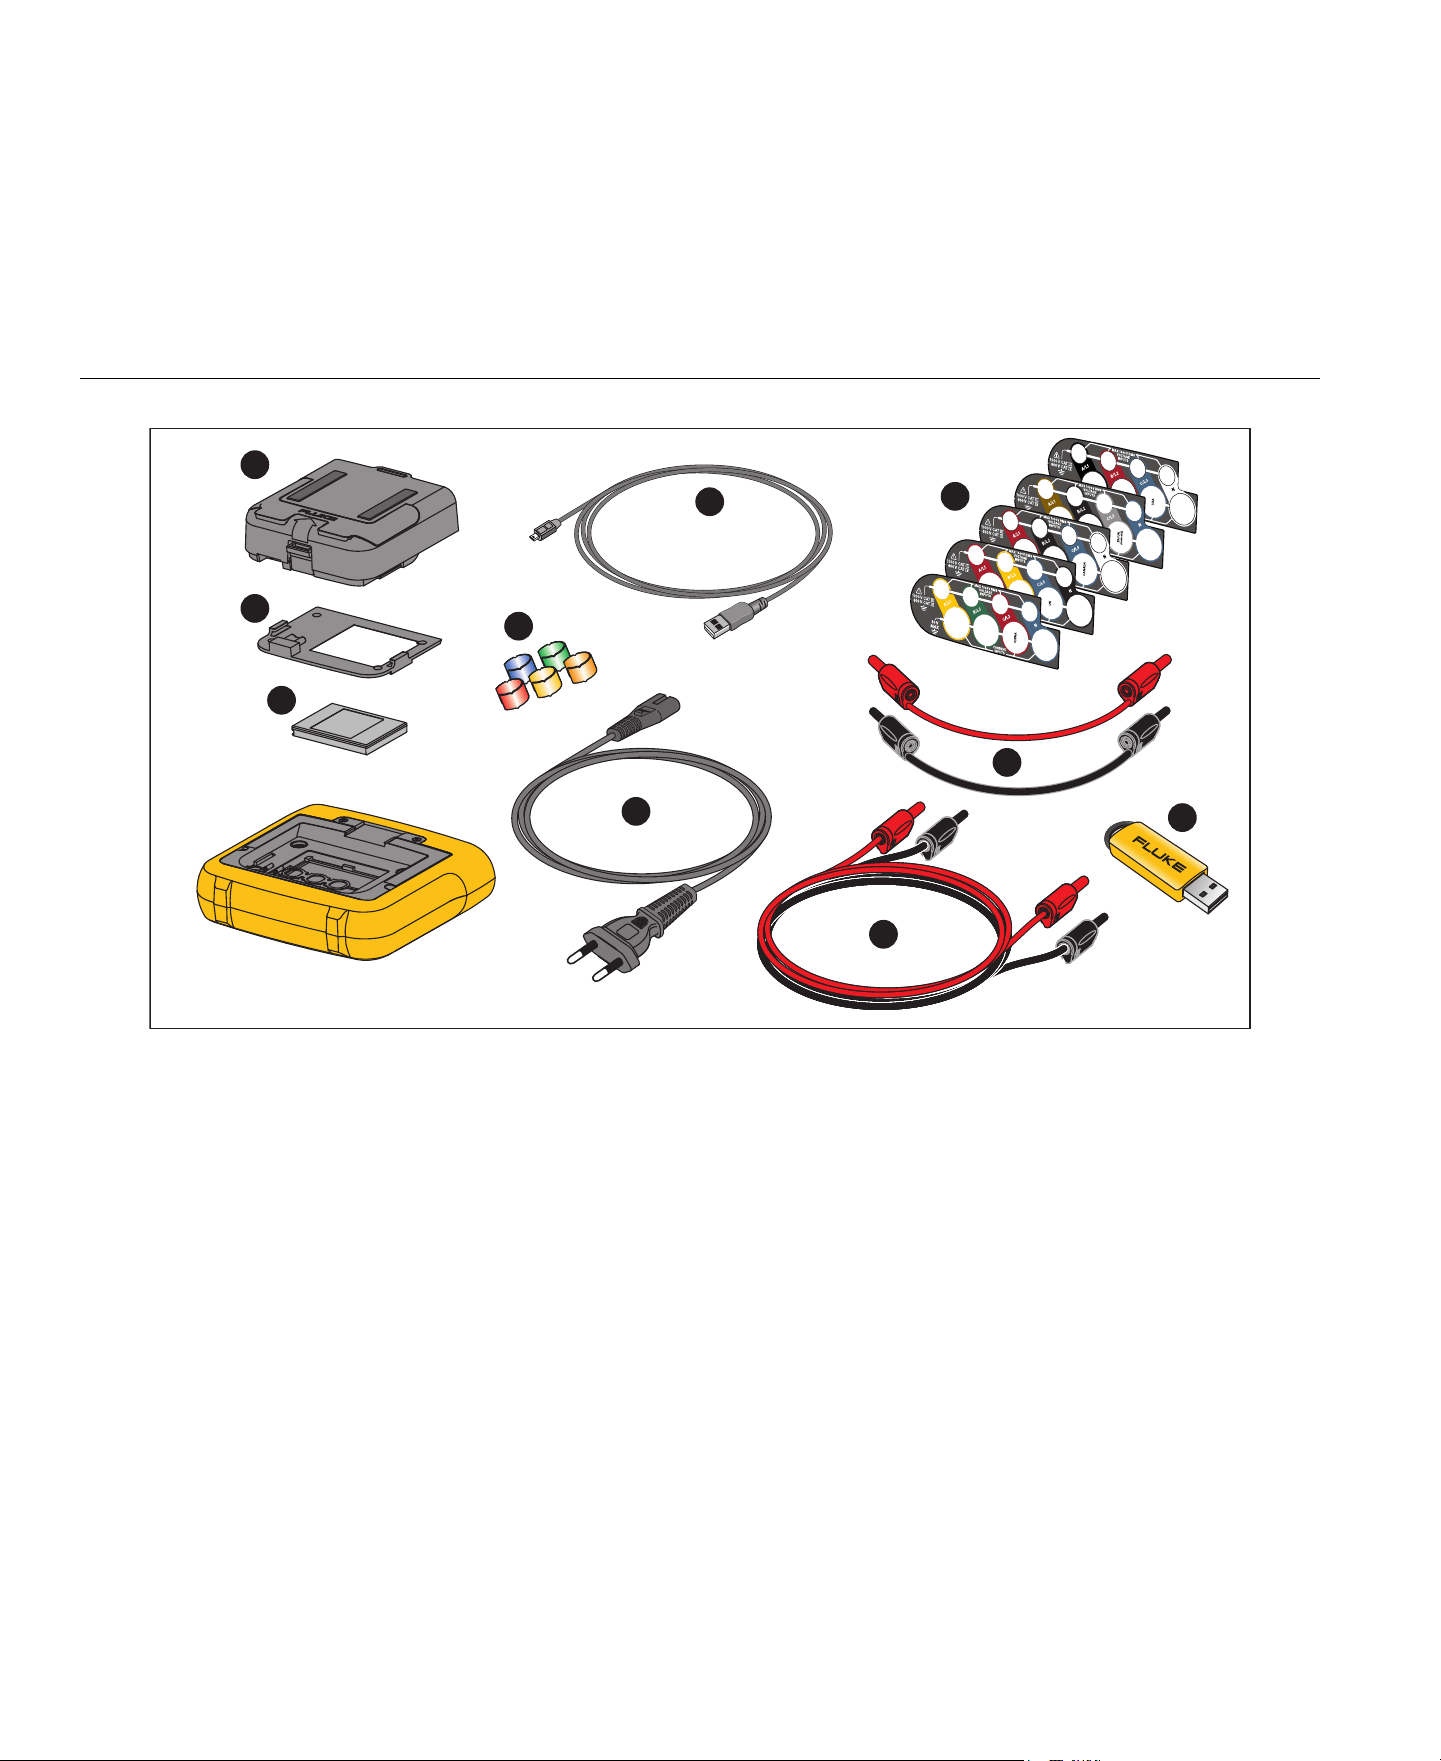
1736/1738
Users Manual
56
Figure 11. Replacement Parts
4
5
9
6
1
2
3
8
7
10
1.888.610.7664 sales@GlobalTestSupply.com
Fluke-Direct
.com

Power Logger
Energy Analyze Plus Software
57
Energy Analyze Plus Software
Purchase of the Logger includes Fluke Energy Analyze Plus software.
With the software, you can do many tasks from a computer:
•
Download campaign results for further processing and archiving.
•
Analyze energy or load profiles, including zoom-in and zoom-out
on details.
•
Analyze voltage and current harmonics.
•
Review the voltage and current events that occur during the
campaign.
•
Analyze the RMS profile and wave shapes recorded on events
(1738 or 1736 with 1736/Upgrade license).
•
Review the key power quality parameters.
•
Create a EN 50160 compliance report(1738 or 1736 with
1736/Upgrade license)
•
Perform an IEEE 519 analysis and create a pass/fail report
(requires IEEE 519/Report license).
•
Add comments, annotations, pictures, and other supplementary
information to campaign data.
•
Overlay data from different campaigns to identify and document
changes.
•
Create a report from the analysis you performed.
•
Export measurement results for further processing using a third
party tool.
System Requirements
The computer hardware requirements for the software are:
•
Free Hard Disk space 50 MB, >10 GB (for measurement data)
recommended
•
Installed Memory:
•
1 GB minimum for 32-bit systems
•
≥2 GB recommended for 32-bit systems,
•
≥4 GB recommended for 64-bit systems
•
Monitor, 1280 x 1024 (@4:3) or 1440 x 900 (@16:10), wide-screen
(16:10) at higher resolution recommended
•
USB 2.0 ports
•
Windows 7, Windows 8.x, and Windows 10 (32/64-bit)
Note
Windows 7 Starter edition and Windows 8 RT are not
supported.
1.888.610.7664 sales@GlobalTestSupply.com
Fluke-Direct
.com
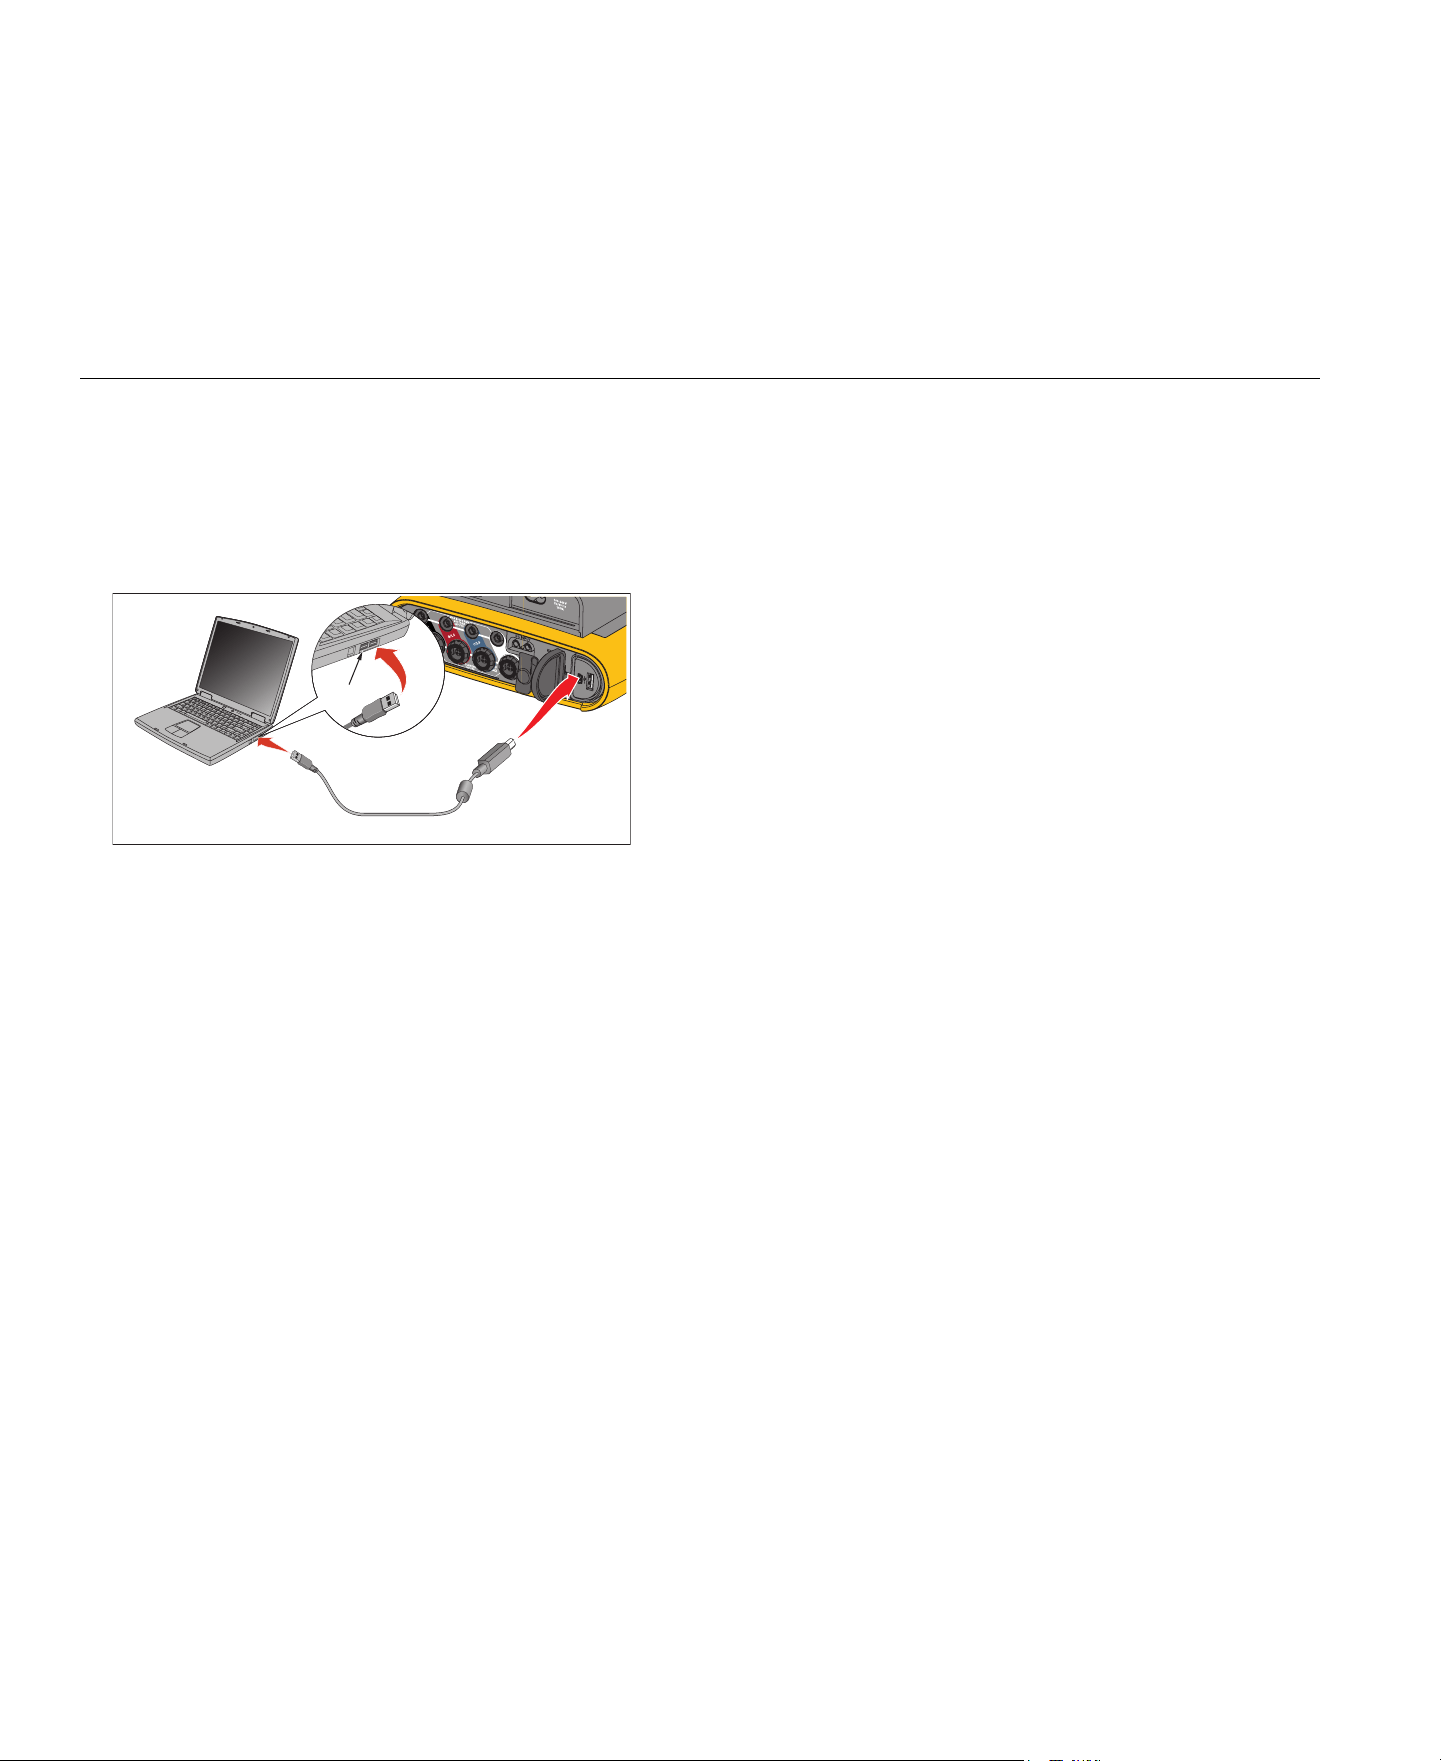
1736/1738
Users Manual
58
PC Connections
To connect the PC to the Logger:
1.
Turn on the computer and the Logger.
2.
Install the Energy Analyze Plus Software.
3.
Connect the USB cable to the USB ports of the computer and the
Logger. See Figure 12.
Figure 12. Power Logger to PC Connections
See the Energy Analyze Plus Online Help for information about how to
use the software.
WiFi Support
With the USB WiFi Adapter you can use the Fluke Connect App for
asset management, trending and sharing measurement data,
wirelessly control the Logger with a PC/smartphone/tablet, and
download measurement data and screenshots to the Energy Analyze
Plus software.
WiFi Setup
The Logger supports a direct connection between a PC, smartphone,
or tablet. It also supports a connection from the Logger to an access
point of a WiFi infrastructure.
Note
Connection to the WiFi infrastructure requires the license for
WiFi Infrastructure.
Before you setup a connection, see WiFi and WiFi/BLE-to-USB
Adapter on page 6 for information about how to install the adapter.
Make sure the Logger is turned on and in the range of 5 to 10 meters
(depends on the connection mode) to the client or access point.
To set the connection mode and see the WiFi connection details from
the Logger:
1.
Push .
2.
Push (Instrument Settings).
3.
Push (Tools).
4.
Push / to highlight WiFi Configuration and push to
confirm. Or, touch WiFi Configuration touch target.
5.
Push / to highlight Mode and push .
6.
Select Direct Connection or WiFi-Infrastructure in the list and
confirm with .
USB Port
1.888.610.7664 sales@GlobalTestSupply.com
Fluke-Direct
.com

Power Logger
WiFi Support
59
WiFi Direct Connection
The WiFi direct connection uses WPA2-PSK (pre-shared key) with
AES encryption. The passphrase shown on the screen is required to
establish a connection from a client to the device.
1.
On the client, go to the list of available WiFi networks and look for a
network with the name:
“Fluke173x<serial-no>”
for example: “Fluke1736<123456789>”.
2.
Enter the passphrase provided on the WiFi Configuration screen
when you are asked. Depending on the operating system of the
client, the passphrase is also called Security Key, Password, or
similar.
After a few seconds the connection is established.
Note
On Windows, the WiFi icon in the notification area of the
task bar is shown with an exclamation mark. The exclamation
mark indicates that this WiFi interface does not provide an
Internet access. This is normal since the Logger is not a
gateway to the Internet.
WiFi-Infrastructure
The WiFi connection requires the WiFi-Infrastructure license and
supports WPA2-PSK. This connection requires a DHCP service
running in the access point to assign IP addresses automatically.
To establish a connection with a WiFi-access point:
1.
In WiFi Configuration screen, push / to highlight Name
(SSID) and push
.
A list of access points within range shows. Icons show the
field strength. Avoid access points with no or only one green
bar since they are too far away for a reliable connection.
2.
Push / to highlight an access point and push to
confirm.
3.
In WiFi Configuration screen, push / to highlight
Passphrase and push
.
4.
Enter the passphrase (also called Security Key or Password) and
push . The passphrase has 8 to 63 characters and is
configured in the access point.
The assigned IP address shows when the connection is
successful.
1.888.610.7664 sales@GlobalTestSupply.com
Fluke-Direct
.com
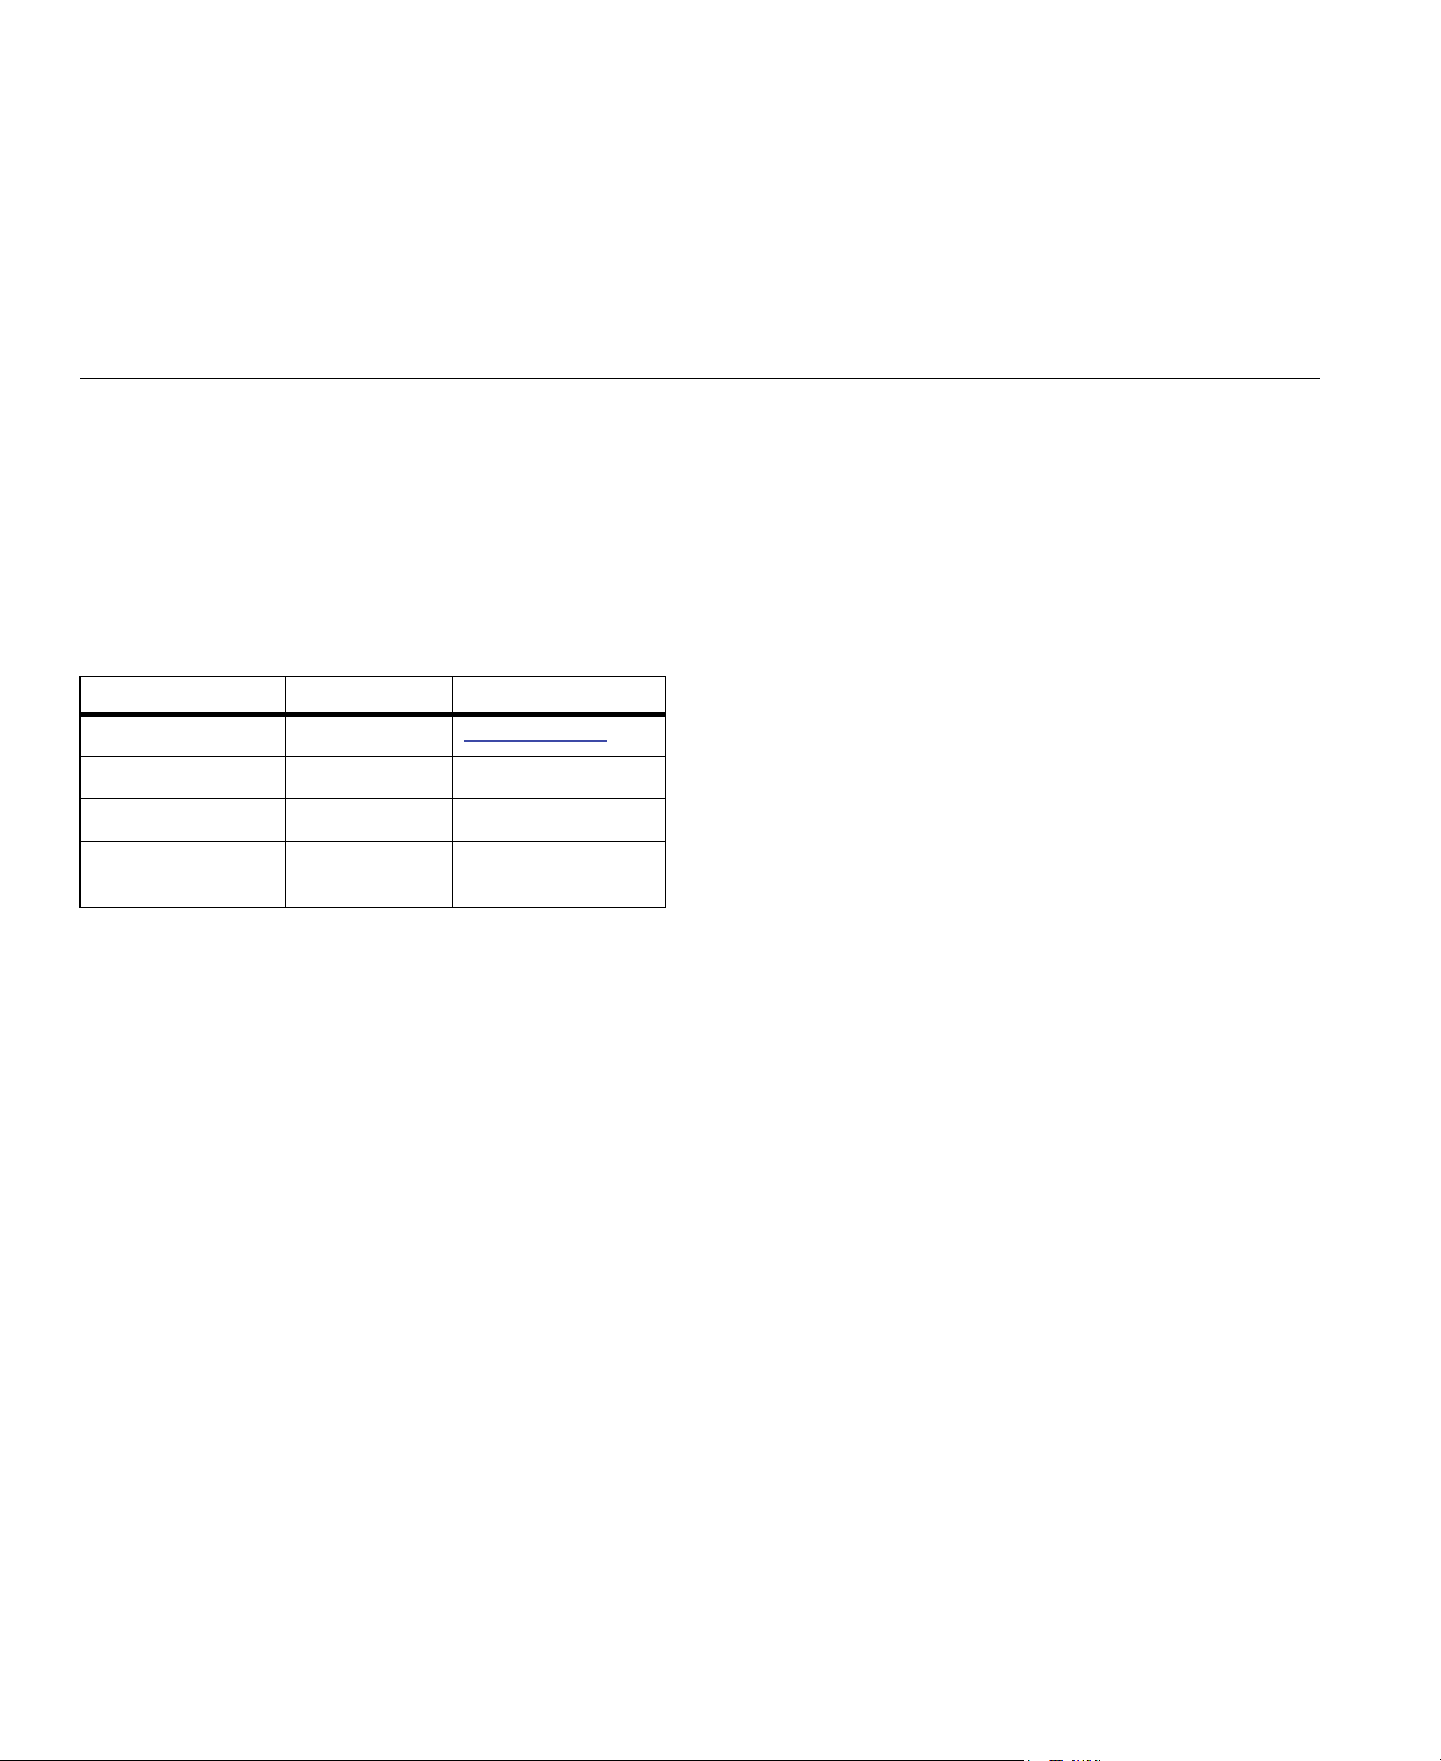
1736/1738
Users Manual
60
Remote Control
You can remotely control the instrument with a free third-party VNC
client available for Windows, Android, Apple iOS, and Windows
Phone after the WiFi connection is setup. VNC (Virtual Network
Computing) allows you to see the screen content, push the buttons,
and touch the targets.
Tested VNC clients that work with the Logger are listed in Table 10.
Table 10. VNC Clients
Configuration
IP Address
Direct Connection ......................... 10.10.10.1
WiFi Infrastructure......................... use IP address shown in WiFi
configuration screen
Port ................................................... 5900 (default)
The VPN user name and password fields are not configured and can
be left blank.
Operating System Program Available from:
Windows 7/8.x/10 TightVNC
www.tightvnc.org
Android bVNC Google Play Store
iOS (iPhone, iPad) Mocha VNC Apple App Store
Windows Phone Mocha VNC
Windows Phone
Market
1.888.610.7664 sales@GlobalTestSupply.com
Fluke-Direct
.com
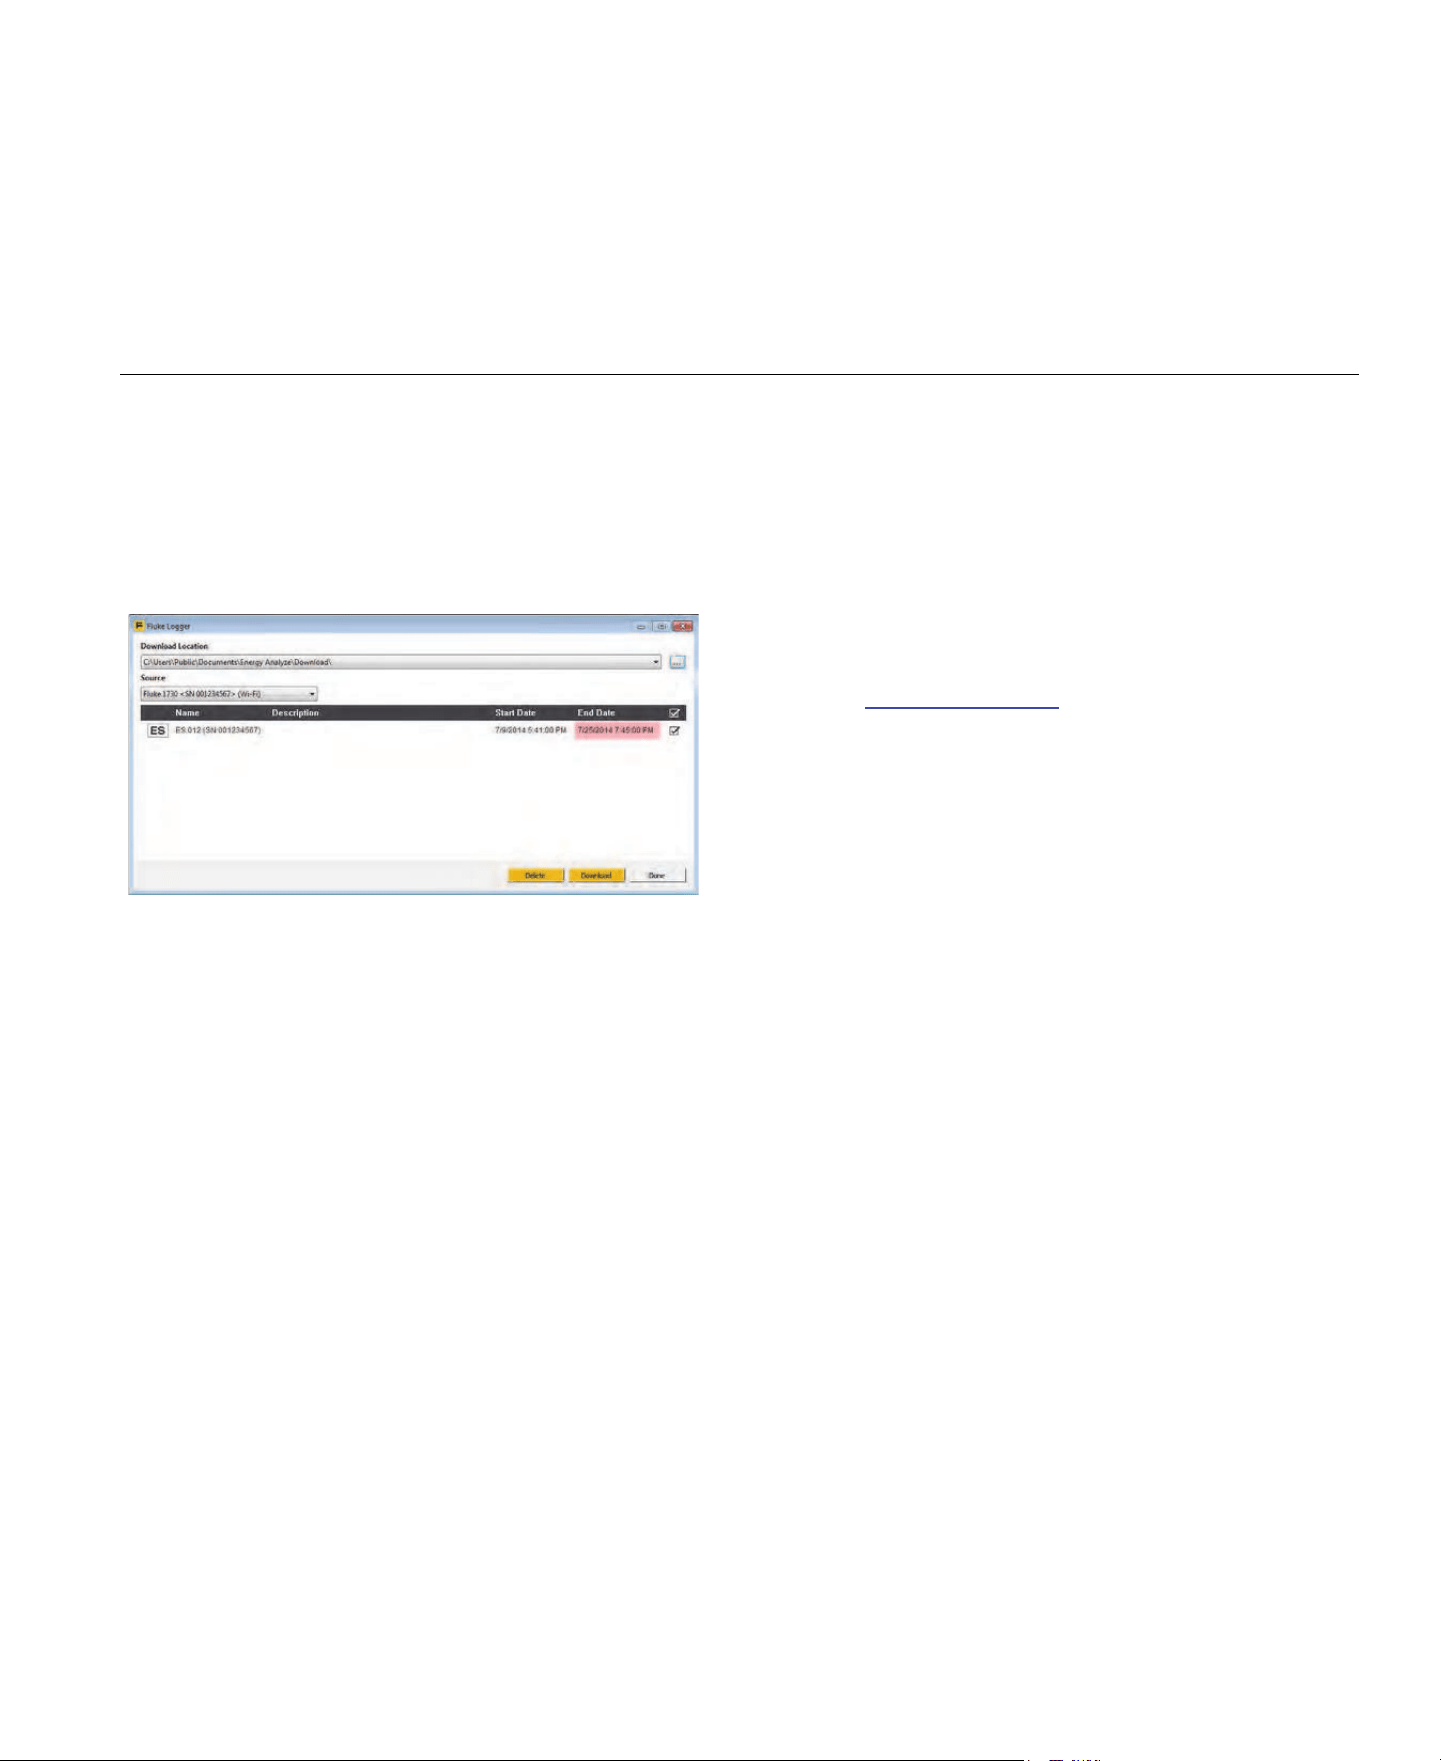
Power Logger
Wireless Access to PC Software
61
Wireless Access to PC Software
Once the WiFi connection to the device is setup, no further setup is
required to use WiFi communication with the Fluke Energy Analyze
Plus software. The WiFi connection supports downloading the
measurement files and screenshots and synchronizing the time. The
selected communication media is shown in brackets. Refer to the
online help for details about how to use the PC software.
Fluke Connect
Wireless System
The Logger supports the Fluke Connect
Wireless System (may not
be available in all regions). Fluke Connect is a system that wirelessly
connects your Fluke test tools with an app on your smartphone or
tablet. It can show measurements from the Logger on your
smartphone or tablet screen, save measurements to the asset's
Equipment Log™ history in the Fluke Cloud™ storage, and share the
measurements with your team.
For more information about how to enable the radio, see WiFi
Configuration on page 51.
Fluke Connect
App
The Fluke Connect
app works with the Apple and Android products.
The app is available for download from the Apple App Store and
Google play.
How to access Fluke Connect:
1.
Turn on the Logger.
2.
On your smartphone, go to Settings > WiFi.
3.
Select the WiFi network that begins with "Fluke173x<serial-no>".
4.
Go to the Fluke Connect App and select the Logger from the list.
5.
Go to for more information about how to
use the app.
1.888.610.7664 sales@GlobalTestSupply.com
Fluke-Direct
.com

1736/1738
Users Manual
62
Wiring Configurations
V, A, Hz, +
Single Phase
Single Phase IT
Split Phase
(2P-3W)
3-Ф Wye
3-Ф Wye IT
(3P-4W)
3-Ф Wye
Balanced
3-Ф Delta
(3P-3W)
2 Element
Delta Aron/
Blondel
3-Ф Delta
Open Leg
(3P-3W)
3-Ф High
Leg Delta
Balanced
3-Ф Delta
V
AN
[1]
V
V
BN
[1]
V
V
CN
[1]
V
V
AB
[1]
V
[2]
[2]
[2]
V
BC
[1]
V
[2]
[2]
V
CA
[1]
V
[2]
[2]
unbal %
I
A
A
I
B
A
I
C
A
I
N
A
X
fHz
Aux 1, 2 mV, user defined
h01-50
[3]
THD V
A
[3]
V, %
%
h01-50
[3]
THD V
B
[3]
V, %
%
h01-50
[3]
THD V
C
[3]
V, %
%
h01-50
[3]
THD V
AB
[3]
V, %
%
h01-50
[3]
THD V
BC
[3]
V, %
%
1.888.610.7664 sales@GlobalTestSupply.com
Fluke-Direct
.com

Power Logger
Wiring Configurations
63
h01-50
[3]
THD V
CA
[3]
V, %
%
h01-50
THD I
A
TDD I
A
[4]
A, %
%
%
h01-50
THD I
B
TDD I
B
[4]
A, %
%
%
h01-50
THD I
C
TDD I
C
[4]
A, %
%
%
h01-50
THC I
N
A
A
X
● Measured values
[1] Simulated in load studies if U
nom
is specified
[2] Secondary displayed values
[3] Not available in load studies
[4] Requires IEEE 519/Report License
X Optional for harmonics analysis
Calculated values
○ Simulated values (derived from phase 1)
V, A, Hz, + (continued)
Single Phase
Single Phase IT
Split Phase
(2P-3W)
3-Ф Wye
3-Ф Wye IT
(3P-4W)
3-Ф Wye
Balanced
3-Ф Delta
(3P-3W)
2 Element
Delta Aron/
Blondel
3-Ф Delta
Open Leg
(3P-3W)
3-Ф High
Leg Delta
Balanced
3-Ф Delta
1.888.610.7664 sales@GlobalTestSupply.com
Fluke-Direct
.com

1736/1738
Users Manual
64
Power
Single Phase
Single Phase IT
Split Phase
(2P-3W)
3-Ф Wye
3-Ф Wye IT
(3P-4W)
3-Ф Wye
Balanced
3-Ф Delta
(3P-3W)
2 Element
Delta Aron/
Blondel
3-Ф Delta
Open Leg
(3P-3W)
3-Ф High
Leg Delta
Balanced
3-Ф Delta
P
A
, P
A fund
[3]
W
P
B
, P
B fund
[3]
W
P
C
, P
C fund
[3]
W
P
Total
, P
Total fund
[3]
W
Q
A
, Q
A fund
[3]
var
Q
B
, Q
B fund
[3]
var
Q
C
, Q
C fund
[3]
var
Q
Total
, Q
Total fund
[3]
var
S
A
[1]
VA
S
B
[1]
VA
S
C
[1]
VA
S
TOTAL
[1]
VA
PF
A
[3]
PF
B
[3]
PF
C
[3]
PF
Total
[3]
● Measured values
[1] Simulated in load studies if Unom is specified
[2] Secondary displayed values
[3] Not available in load studies
○ Simulated values (derived from phase 1)
1.888.610.7664 sales@GlobalTestSupply.com
Fluke-Direct
.com

Power Logger
Glossary
65
Glossary
[1] Requires IEEE 519/Report License.
Unbalance (u2) Supply Voltage Unbalance
Condition in a three phase system in which the RMS. values of the line-to-line voltages (fundamental component), or the phase angles between
consecutive line voltages, are not all equal. The unbalance value is the ratio of the negative sequence to the positive sequence in percent and is
typically in the range between 0% and 2%.
h01 Fundamental Frequency Component
RMS value of the fundamental frequency component of voltage or current. Sub grouping according to IEC 61000-4-7 is applied.
h02 … h50 Harmonic Component
RMS value of the harmonic component of voltage or current. Sub grouping according to IEC 61000-4-7 is applied.
THD Total Harmonic Distortion
The ratio of the RMS value of the sum of all the voltage or current harmonic components h02 … h50 to the RMS value of the fundamental
component h01 of voltage or current.
THC Total Harmonic Content
The RMS value of the sum of all the voltage or current harmonic components h02 … h50.
TDD
[1]
Total Demand Distortion
The ratio of the RMS value of the sum of all the current harmonic components h02 … h50 to I
L
, the maximum demand current.
I
L
[1]
Maximum Demand Load Current
The current value is established at the point of common coupling and should be taken as the sum of the currents corresponding to the maximum
demand during each of the twelve previous months divided by 12.
This value is required to calculate TDD and to determine the applicable current harmonic limits defined by IEEE 519. It is a user input in
measurement configuration.
I
SC
[1]
Maximum Short Circuit Current at Point of Common Coupling
This value is required to determine the applicable current harmonic limits defined by IEEE 519. It is a user input in measurement configuration.
1.888.610.7664 sales@GlobalTestSupply.com
Fluke-Direct
.com

1736/1738
Users Manual
66
General Specifications
Color LCD Display.................................................4.3-inch active matrix color TFT, 480 pixels x 272 pixels, resistive touch panel
Power/Charging.....................................................LED Indicator
Warranty
1736/1738 and Power Supply .............................2 years (battery not included)
Accessories.........................................................1 year
Calibration Cycle ...................................................2 years
Dimensions
1736/1738 ...........................................................19.8 cm x 16.7 cm x 5.5 cm (7.8 in x 6.6 in x 2.2 in)
Power Supply ......................................................13.0 cm x 13.0 cm x 4.5 cm (5.1 in x 5.1 in x 1.8 in)
1736/1738 with power supply attached ...............19.8 cm x 16.7 cm x 9 cm (7.8 in x 6.6 in x 4.0 in)
Weight
1736/1738 ...........................................................1.1 kg (2.5 lb)
Power Supply ......................................................400 g (0.9 lb)
Tamper Protection.................................................Kensington lock
Environmental Specifications
Operating Temperature.........................................-10 °C to +50 °C (+14 °F to +122 °F)
Storage Temperature ............................................-20 °C to +60 °C (-4 °F to +140 °F), with battery: -20 °C to +50 °C (-4 °F to +122 °F)
Operating Humidity ...............................................<10 °C (<50 °F) non condensing
10 °C to 30 °C (50 °F to 86 °F) ≤95 %
30 °C to 40 °C (86 °F to 104 °F) ≤75 %
40 °C to 50 °C (104 °F to 122 °F) ≤45 %
Operating Altitude .................................................2000 m (up to 4000 m derate to 1000 V CAT II/600 V CAT III/300 V CAT IV)
Storage Altitude.....................................................12 000 m
IP Rating.................................................................IEC 60529:IP50, in connected condition with protection caps in place
Vibration.................................................................MIL-T-28800E, Type 3, Class III, Style B
1.888.610.7664 sales@GlobalTestSupply.com
Fluke-Direct
.com

Power Logger
Environmental Specifications
67
Safety
IEC 61010-1
IEC Mains Input...............................................Overvoltage Category II, Pollution Degree 2
Voltage Terminals ...........................................Overvoltage Category IV, Pollution Degree 2
IEC 61010-2-033.................................................CAT IV 600 V / CAT III 1000 V
Electromagnetic Compatibility (EMC)
International ........................................................IEC 61326-1: Industrial
CISPR 11: Group 1, Class A
Group 1: Equipment has intentionally generated and/or uses conductively-coupled radio frequency
energy that is necessary for the internal function of the equipment itself.
Class A: Equipment is suitable for use in all establishments other than domestic and those directly
connected to a low-voltage power supply network that supplies buildings used for domestic purposes.
There may be potential difficulties in ensuring electromagnetic compatibility in other environments due
to conducted and radiated disturbances.
Caution: This equipment is not intended for use in residential environments and may not provide adequate
protection to radio reception in such environments.
Emissions that exceed the levels required by CISPR 11 can occur when the equipment is connected to
a test object.
Korea (KCC)........................................................Class A Equipment (Industrial Broadcasting & Communication Equipment)
Class A: Equipment meets requirements for industrial electromagnetic wave equipment and the seller
or user should take notice of it. This equipment is intended for use in business environments and not to
be used in homes.
USA (FCC) ..........................................................47 CFR 15 subpart B. This product is considered an exempt device per clause 15.103.
Wireless Radio with Adapter
Frequency Range................................................2412 MHz to 2462 MHz
Output Power ......................................................<100 mW
1.888.610.7664 sales@GlobalTestSupply.com
Fluke-Direct
.com

1736/1738
Users Manual
68
Electrical Specifications
Power Supply
Voltage Range ....................................................nominal 100 V to 500 V (85 V min to 550 V max) using safety plug input
Mains Power .......................................................nominal 100 V to 240 V (85 V min to 265 V max) using IEC 60320 C7 input (figure 8 power cord)
Power consumption.............................................Maximum 50 VA (max. 15 VA when powered using IEC 60320 input)
Standby Power....................................................<0.3 W only when powered using IEC 60320 input
Efficiency............................................................. ≥68.2 % (in accordance with energy efficiency regulations)
Mains Frequency.................................................50/60 Hz ±15 %
Battery Power......................................................Li-ion 3.7 V, 9.25 Wh, customer-replaceable
On-Battery Runtime ............................................Up to 4 hr (up to 5.5 hr in energy saving mode)
Charging Time.....................................................<6 hr
Voltage Inputs
Number of Inputs.................................................4 (3 phases and neutral)
Maximum Input Voltage ......................................1000 V
rms
(1700 V
pk
) phase to neutral
Input Impedance .................................................10 MΩ each phase to neutral
Bandwidth ...........................................................42.5 Hz – 3.5 kHz
Scaling ............................................................1:1, variable
Current Inputs
Number of Inputs.................................................4, mode selected automatically for attached sensor
Current Sensor Output Voltage
Clamp..............................................................500 mV
rms
/ 50 mV
rms
; CF 2.8
Rogowski Coil .................................................150 mV
rms
/ 15 mV
rms
at 50 Hz, 180 mV
rms
/ 18 mV
rms
at 60 Hz; CF 4;
all at nominal probe
range
Range..................................................................1 A to 150 A / 10 A to 1500 A with iFlex1500-12
3 A to 300 A / 30 A to 3000 A with iFlex3000-24
6 A to 600 A / 60 A to 6000 A with iFlex6000-36
40 mA to 4 A / 0.4 A to 40 A with 40 A clamp i40s-EL
Bandwidth ...........................................................42.5 Hz – 3.5 kHz
Scaling ................................................................1:1, variable
1.888.610.7664 sales@GlobalTestSupply.com
Fluke-Direct
.com

Power Logger
Electrical Specifications
69
Auxiliary Inputs
Wired Connection
Number of Inputs.............................................2
Input Range.....................................................0 V dc to ± 10 V dc
Wireless Connection (requires WiFi/BLE adapter USB1 FC)
Number of Inputs.............................................2
Supported Modules .........................................Fluke Connect 3000 series
Acquisition...........................................................1 reading/s
Scale factor .........................................................Format: mx + b (Gain and offset) user configurable
Displayed units....................................................User configurable (up to 8 characters, for example °C, psi, or m/s)
Data Acquisition
Resolution ...........................................................16-bit synchronous sampling
Sampling Frequency ...........................................10.24 kHz at 50/60 Hz, synchronized to mains frequency
Input Signal Frequency .......................................50/60 Hz (42.5 Hz to 69 Hz)
Wiring Configurations..........................................1-Φ, 1-Φ IT, Split phase, 3-Φ wye, 3-Φ wye IT, 3-Φ wye balanced, 3-Φ delta, 3-Φ Aron/Blondel (2-element
delta), 3-Φ delta open leg, 3-Φ high leg delta, 3-Φ delta balanced. Currents only (load studies)
Data Storage .......................................................Internal flash memory (not user replaceable)
Memory Size .......................................................Typical 10 logging sessions of 8 weeks with 1-minute intervals and 100 events The number of possible
logging sessions and logging period depends on user requirements.
Basic Interval
Measured Parameter ..........................................Voltage, Current, Aux, Frequency, THD V, THD A, Power, Power Factor, fundamental Power, DPF, Energy
Averaging Interval ...............................................User selectable: 1 sec, 5 sec, 10 sec, 30 sec, 1 min, 5 min, 10 min, 15 min, 30 min
Total Harmonic Distortion....................................THD for voltage and current is calculated on 25 harmonics
Averaging time min/max values
Voltage ............................................................Full cycle RMS (20 ms at 50 Hz, 16.7 ms at 60 Hz)
Current ............................................................Half cycle RMS (10 ms at 50 Hz, 8.3 ms at 60 Hz)
Aux, Power......................................................200 ms
Demand Interval (Energy Meter Mode)
Measured Parameter ..........................................Energy (Wh, varh, VAh), PF, Maximum Demand, Cost of Energy
Averaging Interval ...............................................User selectable: 5 min, 10 min, 15 min, 20 min, 30 min, off
1.888.610.7664 sales@GlobalTestSupply.com
Fluke-Direct
.com

1736/1738
Users Manual
70
Power Quality Measurements
Measured Parameter ..........................................Voltage, Frequency, Unbalance, Voltage Harmonics, THD V, Current Harmonics, THD A, and TDD
(requires IEEE519/Report license)
Averaging Interval ...............................................10 min
Individual Harmonics...........................................2
nd
… 50
th
Total Harmonic Distortion....................................Calculated on 50 harmonics
Events .................................................................Voltage: Dips, Swells, Interruptions
Current: Inrush Current
Triggered Recordings..........................................1738 or 1736 with 1736/Upgrade license
Half cycle RMS of Voltage and Current
Waveform of Voltage and Current
Standards Compliance
Harmonics ...........................................................IEC 61000-4-7: Class 1
IEEE 519 (short time harmonics, requires IEEE519/Report license)
Power Quality......................................................IEC 61000-4-30 Class S, IEC62586-1 (PQI-S device)
Power ..................................................................IEEE 1459
Power Quality Compliance..................................1738 or 1736 with 1736/Upgrade license
EN50160 (for measured parameters)
Interfaces
USB-A .................................................................File transfer via USB Flash Drive, Firmware updates, max. supply current: 120 mA
WiFi
Supported modes............................................Direct connection and connection to infrastructure (requires WiFi-Infrastructure license)
Security ...........................................................WPA2-AES with pre-shared key
Bluetooth .............................................................read auxiliary measurement data from Fluke Connect 3000 series modules (requires WiFi/BLE adapter
USB1 FC)
USB-mini .............................................................Data download device to PC
Extension port .....................................................Accessories
1.888.610.7664 sales@GlobalTestSupply.com
Fluke-Direct
.com

Power Logger
Electrical Specifications
71
Accuracy at Reference Conditions
Parameter Range Maximum Resolution
Intrinsic Accuracy at Reference Conditions
(% of Reading + % of Range)
Voltage 1000 V 0.1 V ±(0.2 % + 0.01 %)
Current
Direct Input
Rogowski Mode
15 mV 0.01 mV ±(0.3 % + 0.02 %)
150 mV 0.1 mV ±(0.3 % + 0.02 %)
Clamp Mode
50 mV 0.01 mV ±(0.2 % + 0.02 %)
500 mV 0.1 mV ±(0.2 % + 0.02 %)
1500 A Flexi
150 A 0.01 A ±(1 % + 0.02 %)
1500 A 0.1 A ±(1 % + 0.02 %)
3000 A Flexi
300 A 1 A ±(1 % + 0.03 %)
3000 A 10 A ±(1 % + 0.03 %)
6000 A Flexi
600 A 1 A ±(1.5 % + 0.03 %)
6000 A 10 A ±(1.5 % + 0.03 %)
40 A
4 A 1 mA (0.7 % + 0.02 %)
40 A 10 mA (0.7 % + 0.02 %)
Frequency 42.5 Hz to 69 Hz 0.01 Hz ±0.1 %
Aux Input ±10 Vdc 0.1 mV ±(0.2 % + 0.02 %)
Voltage Min/Max 1000 V 0.1 V ±(1 % + 0.1 %)
Current Min/Max defined by accessory defined by accessory ±(5 % + 0.2 %)
THD on Voltage 1000 % 0.1 % ±(2.5 % + 0.05 %)
THD on Current 1000 % 0.1 % ±(2.5 % + 0.05 %)
Voltage Harmonic 2 to 50 1000 % 0.1 % ±(2.5 % + 0.05 %)
Unbalance 100 % 0.1 % ±0.15 %
1.888.610.7664 sales@GlobalTestSupply.com
Fluke-Direct
.com

1736/1738
Users Manual
72
Power/Energy
Parameter Direct Input
[1]
iFlex1500-12 iFlex3000-24 iFlex6000-36 i40S-EL
Power Range W, VA, var
Clamp: 50 mV/500 mV
Rogowski: 15 mV/150 mV
150 A / 1500 A 300 A / 3000 A 600 A / 6000 A 4 A / 40 A
Clamp: 50 W/500 W
Rogowski: 15 W/150 W
150 kW / 1.5 MW 300 kW / 3 MW 600 kW / 6 MW 4 kW / 40 kW
Max. Resolution W, VA, var 0.1 W 0.01 kW / 0.10 kW 1 kW / 10 kW 1 kW / 10 kW 1 W / 10 W
Max. Resolution PF, DPF 0.01
Phase (Voltage to Current)
[1]
±0.2 ° ±0.28 ° ±1 °
[1] Only for calibration laboratories
1.888.610.7664 sales@GlobalTestSupply.com
Fluke-Direct
.com

Power Logger
Electrical Specifications
73
Intrinsic Uncertainty ±(% of measurement value + % of power range)
Parameter
Influence
Quantity
Direct Input
[1]
iFlex1500-12 iFlex3000-24 iFlex6000-36 i40S-EL
Clamp: 50 mV/500 mV
Rogowski: 15 mV/150 mV
150 A / 1500 A 300 A / 3000 A 600 A / 6000 A 4 A / 40 A
Active Power P
Active Energy E
a
PF ≥0.99 0.5 % + 0.005 % 1.2 % + 0.005 % 1.2 % + 0.0075 % 1.7 % + 0.0075 % 1.2 % + 0.005 %
0.1≤PF <0.99 see Formula 1 see Formula 2 see Formula 3 see Formula 4 see Formula 5
Apparent Power S
Apparent Energy E
ap
0 ≤ PF ≤1 0.5 % + 0.005 % 1.2 % + 0.005 % 1.2 % + 0.0075 % 1.2 % + 0.0075 % 1.2 % + 0.005 %
Reactive Power Q
Reactive Energy E
r
0 ≤ PF ≤1 2.5 % of measured apparent power/energy
Power Factor PF
Displacement
Power Factor
DPF/cosφ
- Reading ±0.025
Additional uncertainty
(% of power high-range)
V
P-N
>250 V 0.015 % 0.015 % 0.0225 % 0.0225 % 0.015 %
[1] Only for calibration laboratories
Reference Conditions:
Environmental: 23 °C ±5 °C, instrument operating for at least 30 minutes, no external electrical/magnetic field, RH <65 %
Input conditions: CosΦ/PF=1, Sinusoidal signal f=50/60 Hz, power supply 120 V/230 V ±10 %.
Current and power specifications: Input voltage 1ph: 120 V/230 V or 3ph wye/delta: 230 V/400 V
Input current >10 % of current range
Primary conductor of clamps or Rogowski coil in center position
Temperature Coefficient: Add 0.1 x specified accuracy for each degree C above 28 °C or below 18 °C
1.888.610.7664 sales@GlobalTestSupply.com
Fluke-Direct
.com

1736/1738
Users Manual
74
Formula 1: % +0.005 %
Formula 2: % +0.005 %
Formula 3: % +0.0075 %
Formula 4: % +0.0075 %
Formula 5: % +0.005 %
Example:
Measurement at 120 V/16 A using an iFlex1500-12 in low range. Power Factor is 0.8
Active power uncertainty :
The uncertainty in W is
Apparent power uncertainty :
The uncertainty in VA is
Reactive/non-active power uncertainty :
In case of a measured voltage that is >250 V, the additional error is calculated with:
0.5
1 PF
2
–
3 PF×
-------------------------+
1.2
1 PF
2
–
2 PF×
-------------------------+
1.2
1 PF
2
–
2 PF×
-------------------------+
1.7
1 PF
2
–
2 PF×
-------------------------+
1.2 1.7
1 PF
2
–
PF
-------------------------
×+
σ
P
σ
P
1.2 %
10.8
2
–
20.8×
-------------------------+
0.005 % P
Range
×+
±= 1.575 % 0.005 % 1000 V× 150 A×+()± 1.575 % 7.5 W+()±==
1.575 % 120 V× 16 A× 0.8 7.5 W+×()± 31.7± W=
σ
S
σ
S
1.2 % 0.005 % S
Range
×+()± 1.2 % 0.005 % 1000 V× 150 A×+()± 1.2 % 7.5 VA+()±== =
1.2 % 120 V× 16 A 7.5VA+×()± 30.54 VA±=
σ
Q
σ
Q
2.5 % S×()± 2.5 % 120 V× 16 A×()± 48 var±== =
Adder 0.015 % S
High Range
× 0.015 % 1000 V× 1500 A× 225 W/VA/var== =
1.888.610.7664 sales@GlobalTestSupply.com
Fluke-Direct
.com

Power Logger
Electrical Specifications
75
iFlex Probe Specifications
Measuring range
iFlex 1500-12 ......................................................1 to 150 A ac / 10 to 1500 A ac
iFlex 3000-24 ......................................................3 to 300 A ac / 30 to 3000 A ac
iFlex 6000-36 ......................................................6 to 600 A ac / 60 to 6000 A ac
Nondestructive current ........................................100 kA (50/60 Hz)
Intrinsic Error at reference condition
[1]
................. ±0.7 % of reading
Accuracy 173x + iFlex
iFlex 1500-12 & iFlex 3000-24 ........................ ±(1 % of reading + 0.02 % of range)
iFlex 6000-36 .................................................. ±(1.5 % of reading + 0.03 % of range)
Temperature Coefficient over operating temperature range
iFlex 1500-12 & iFlex 3000-24 ............................0.05 % of reading / °C (0.09 % of reading / °F)
iFlex 6000-36 ......................................................0.1 % of reading / °C (0.18 % of reading / °F)
1.888.610.7664 sales@GlobalTestSupply.com
Fluke-Direct
.com
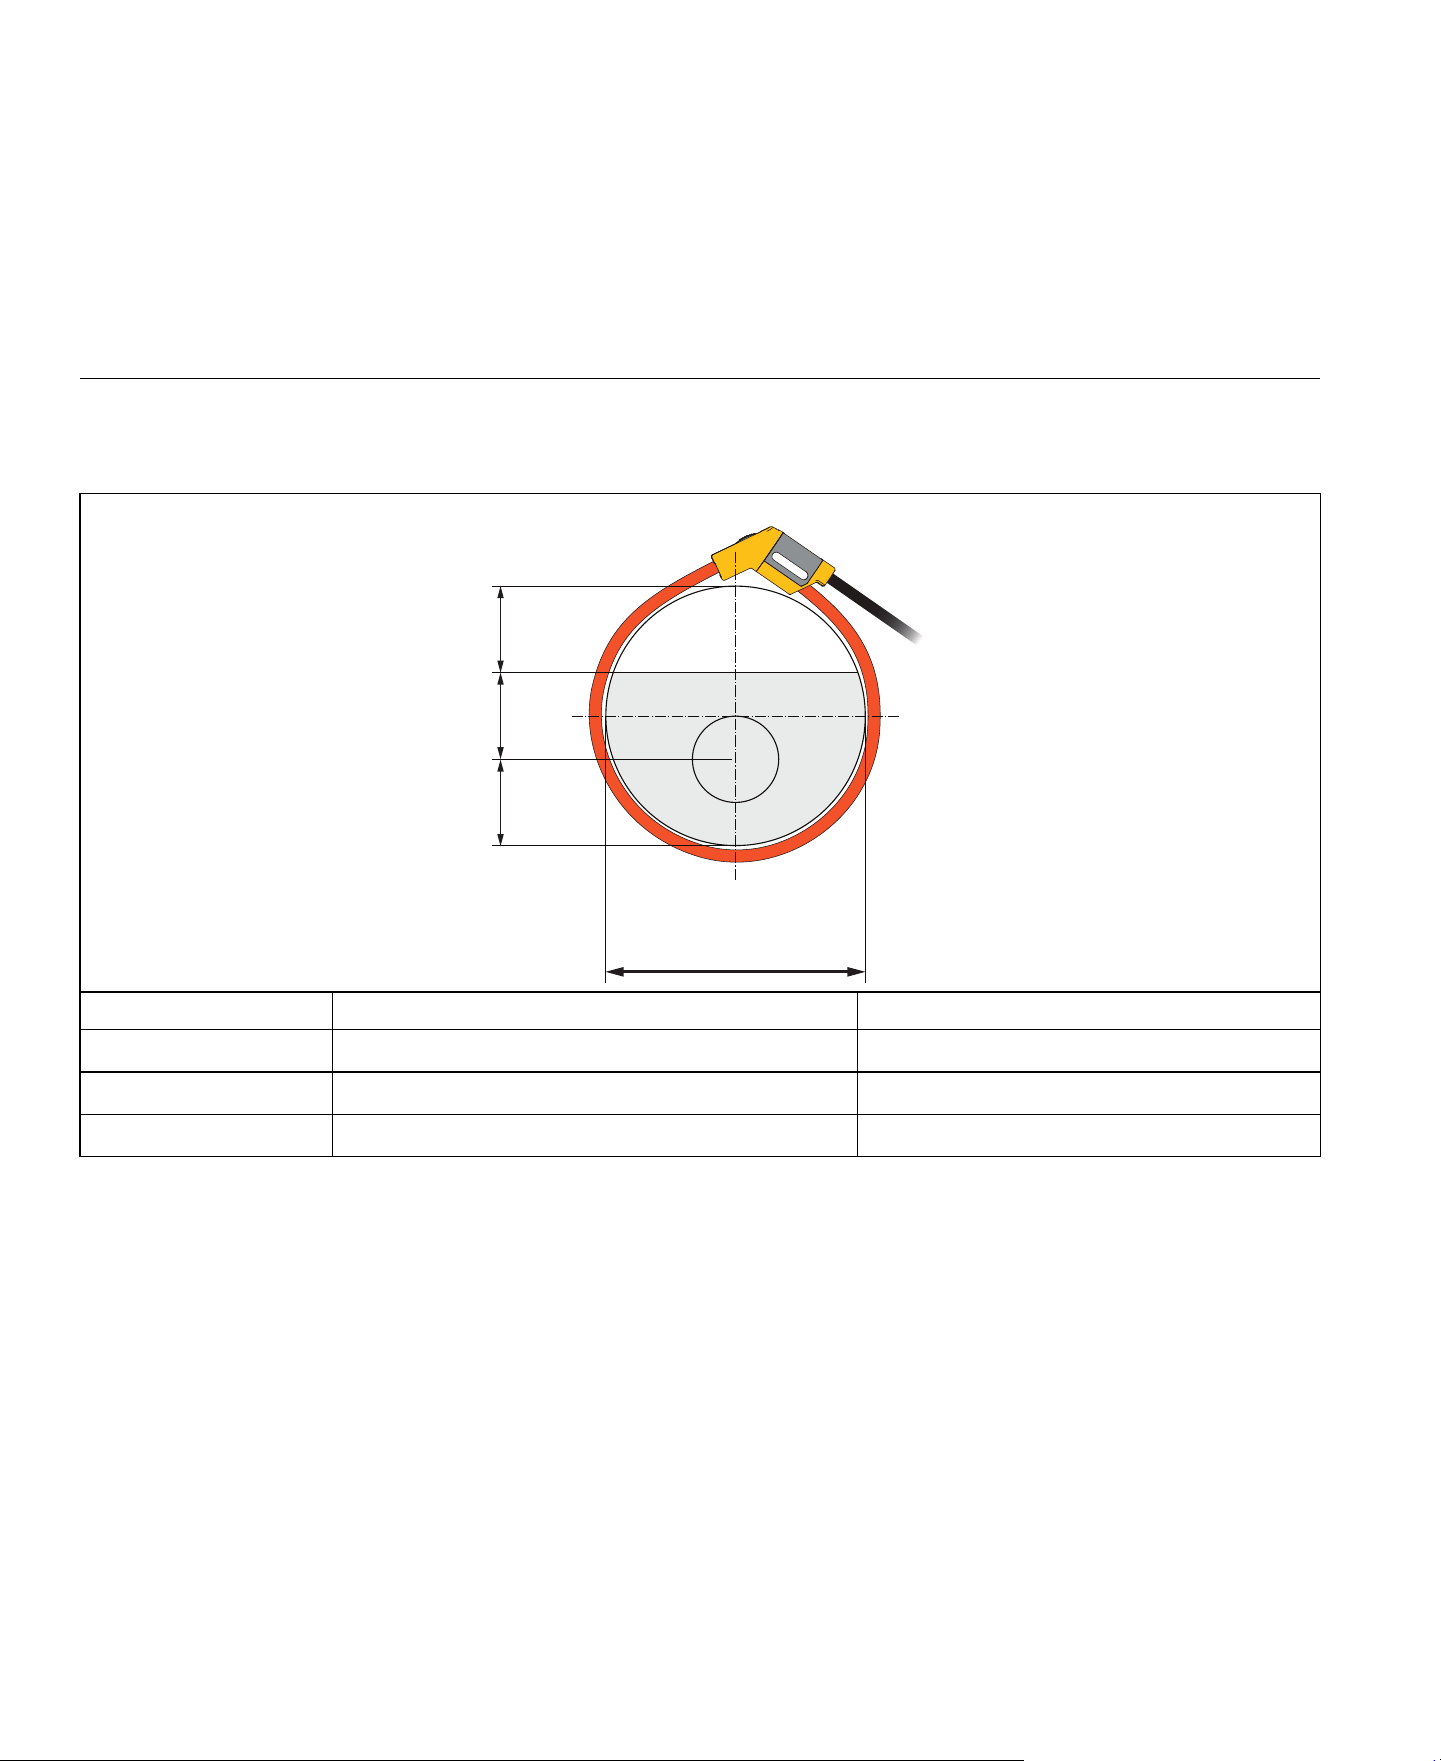
1736/1738
Users Manual
76
Positioning error with position of conductor in the probe window. (See Table 11.)
Table 11. Flex Probe Window
External magnetic field rejection in reference to external current (with cable >100 mm from the head-coupling
and r-coil) ................................................................40 dB
Phase shift...............................................................< ±0.5°
Bandwidth................................................................10 Hz to 23.5 kHz
Frequency derating .................................................I x f ≤385 kA Hz
Probe Window iFlex1500-12, iFlex3000-24 iFlex6000-36
A ±(1 % of reading + 0.02 % of range) ±(1.5 % of reading + 0.03 % of range)
B ±(1.5 % of reading + 0.02 % of range) ±(2.0 % of reading + 0.03 % of range)
C ±(2.5 % of reading + 0.02 % of range) ±(4 % of reading + 0.03 % of range)
iFlex1500-12: 88mm
iFlex3000-24: 185mm
iFlex6000-36: 282mm
C
B
A
1/31/31/3
1.888.610.7664 sales@GlobalTestSupply.com
Fluke-Direct
.com

Power Logger
Electrical Specifications
77
Working Voltage......................................................1000 V CAT III, 600 V CAT IV
[1] Reference Condition:
• Environmental: 23 °C ±5 °C, no external electrical/magnetic field, RH 65 %
• Primary conductor in center position
Transducer length
iFlex 1500-12 ......................................................305 mm (12 in)
iFlex 3000-24 ......................................................610 mm (24 in)
iFlex 6000-36 ......................................................915 mm (36 in)
Transducer cable diameter .....................................7.5 mm (0.3 in)
Minimum bending radius .........................................38 mm (1.5 in)
Output cable length
iFlex 1500-12 ......................................................2 m (6.6 ft)
iFlex 3000-24 & iFlex 6000-36 ............................3 m (9.8 ft)
Weight
iFlex 1500-12 ......................................................115 g
iFlex 3000-24 ......................................................170 g
iFlex 6000-36 ......................................................190 g
Material
Transducer cable ................................................TPR
Coupling ..............................................................POM + ABS/PC
Output cable........................................................TPR/PVC
Operating Temperature ..........................................-20 °C to +70 °C (-4 °F to 158°F) temperature of conductor under test shall not exceed 80°C (176°F)
Storage temperature ...............................................-40 °C to +80 °C (-40 °F to 176 °F)
Operating relative humidity .....................................15 % to 85 % noncondensing
IP Rating .................................................................IEC 60529:IP50
Operating Altitude ...................................................2000 m (6500 ft) up to 4000 m (13 000 ft) derate to 1000 V CAT II/600 V CAT III/300 V CAT IV
Storage Altitude.......................................................12 km (40 000 ft)
Warranty..................................................................1 year
1.888.610.7664 sales@GlobalTestSupply.com
Fluke-Direct
.com
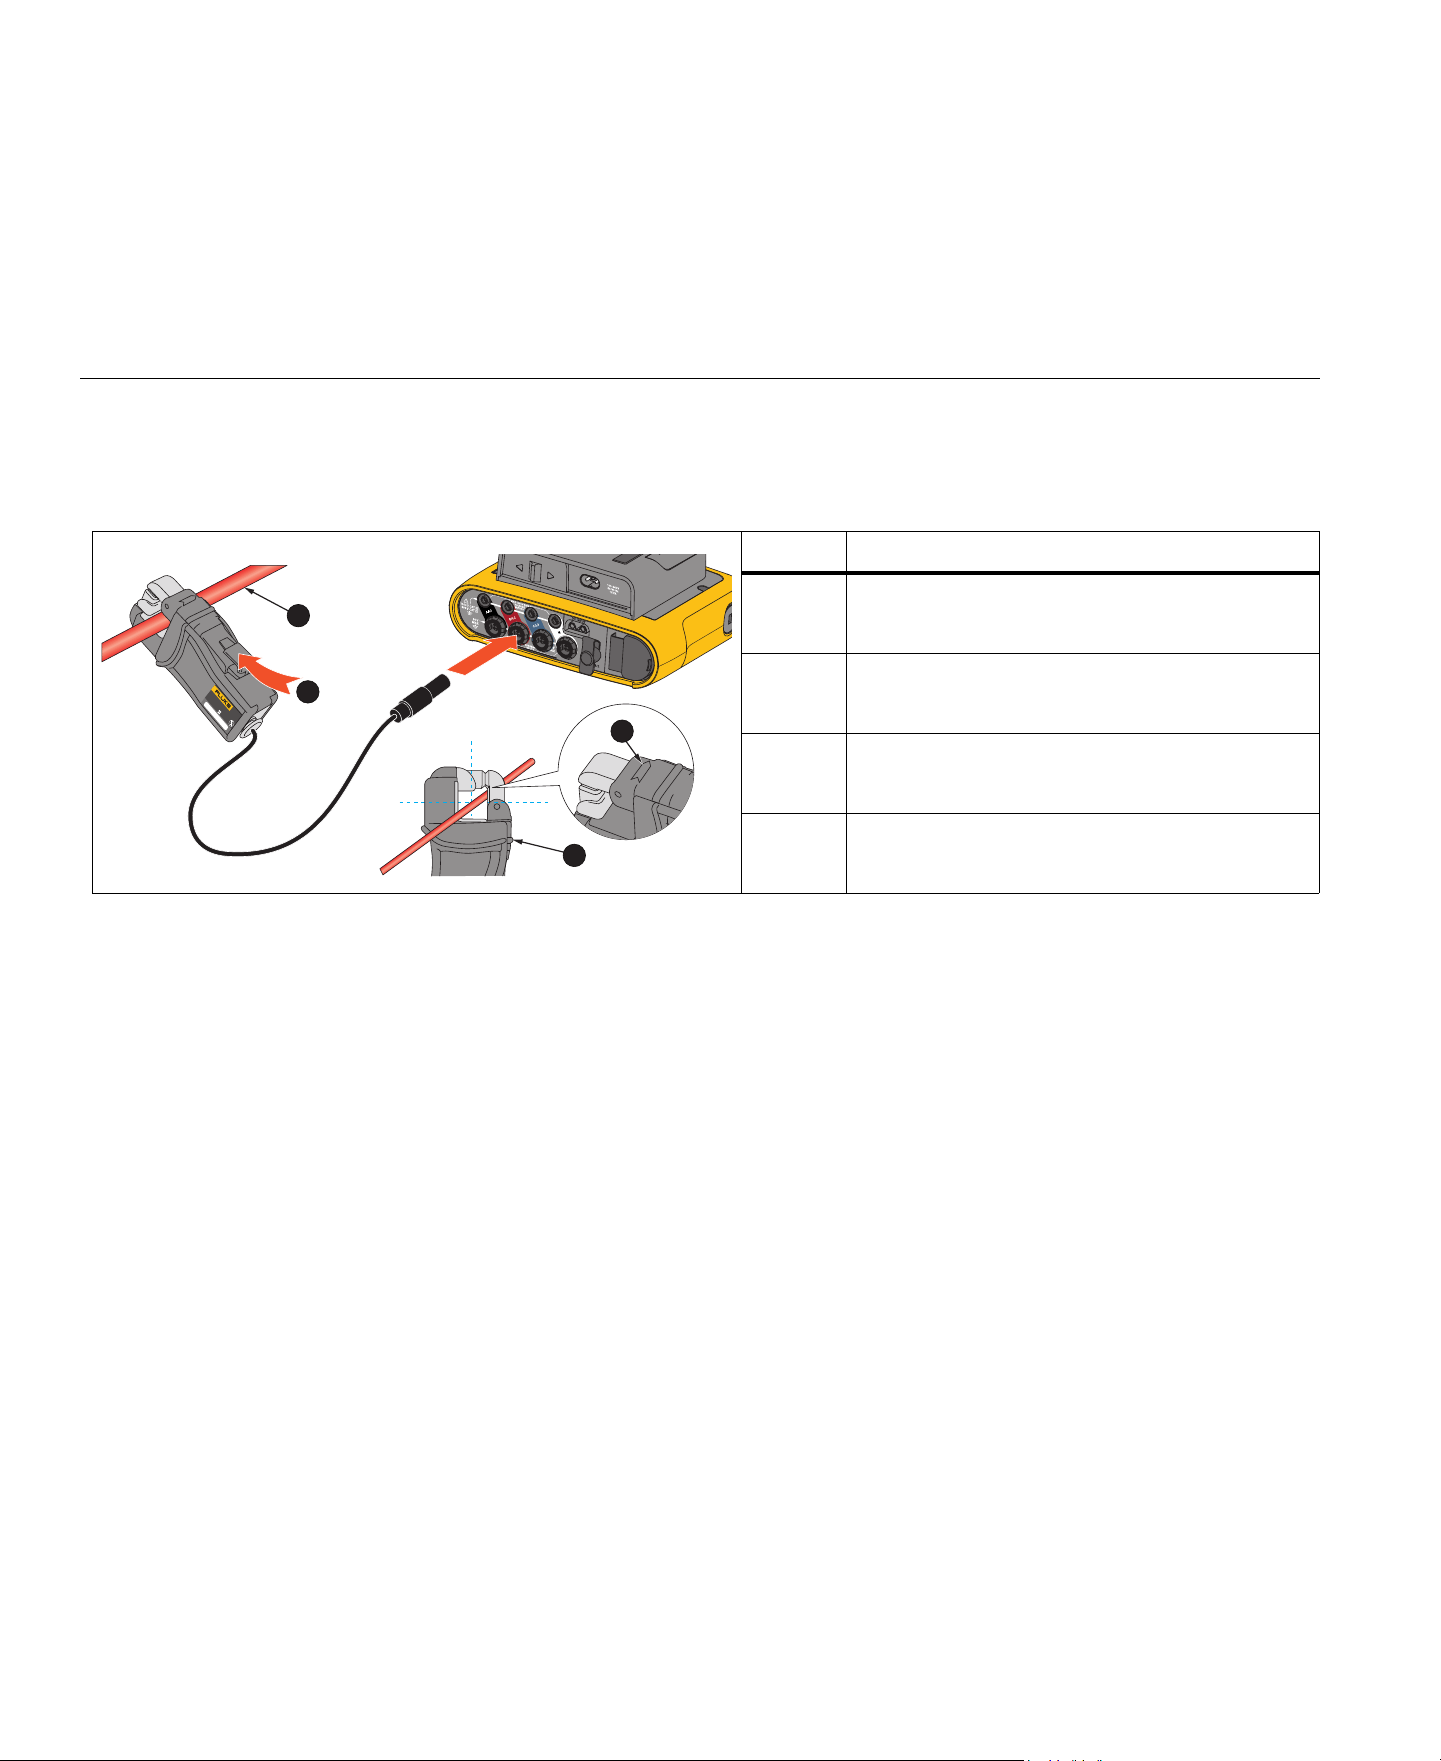
1736/1738
Users Manual
78
i40s-EL Current Clamp Specifications
See Table 12 for setup instructions.
Table 12. i40s-EL Setup
Measuring range .....................................................40 mA to 4 Aac / 0.4 Aac to 40 Aac
Crest factor..............................................................
≤3
Nondestructive current ............................................200 A (50/60Hz)
Intrinsic Error at reference condition .......................
±0.5 % of reading
Accuracy 173x + clamp ...........................................
±(0.7 % of reading + 0.02 % of range)
Phase shift
<40 mA................................................................unspecified
40 mA to 400 mA ................................................<
±1.5 °
400 mA to 40 A ...................................................< ±1 °
Temperature Coefficient over
operating temperature range...................................0.015 % of reading / °C
0.027 % of reading / °F
Influence of adjacent conductor ..................................
≤15 mA/A (@ 50/60 Hz)
Item Description
Single Insulated current carrying conductor
Release button
Load direction arrow
Tactile barrier
600V CAT III
AC CURRENT CLAMP
SERIAL NU
MBER
1
2
3
4
1.888.610.7664 sales@GlobalTestSupply.com
Fluke-Direct
.com

Power Logger
Electrical Specifications
79
Influence of conductor position
in jaw opening .........................................................
±0.5 % of reading (@ 50/60 Hz)
Bandwidth ...............................................................10 Hz to 2.5 kHz
Working Voltage......................................................600 V CAT III, 300 V CAT IV
[1] Reference Condition:
• Environmental: 23 °C ±5 °C, no external electrical/magnetic field, RH 65 %
• Primary conductor in center position
Size (H x W x L) ......................................................110 mm x 50 mm x 26 mm (4.33 in x 1.97 in x 1.02 in)
Maximum conductor size ........................................15 mm (0.59 in)
Output cable length .................................................2 m (6.6 ft)
Weight .....................................................................190 g (6.70 oz)
Material ...................................................................Case ABS and PC
Output cable: TPR/PVC
Temperature operating............................................-10 °C to +55 °C (-14 °F to 131 °F)
Temperature, non-operating ...................................-20 °C to +70 °C (-4 °F to 158 °F)
Relative Humidity, operating ...................................15 % to 85 % non-condensing
Max Operating Altitude ...........................................2000 m (6500 ft)
up to 4000 m (13 000 ft) derate to 600 V CAT II/300 V CAT IV
Max Storage Altitude ..............................................12 km (40 000 ft)
Warranty..................................................................1 year
1.888.610.7664 sales@GlobalTestSupply.com
Fluke-Direct
.com