
UPO1000CS
Series
Digital Phosphor Oscilloscope
User’s Manual
REV 1
2022.11.11

2 / 99
Forehead
Dear Users,
Hello! Thank you for choosing this brand new UNI-T instrument. In order to use this instrument safely and
correctly, please read this manual thoroughly, especially the Safety Requirements part.
After reading this manual, it is recommended to keep the manual at an easily accessible place, preferably
close to the device, for future reference.

3 / 99
Copyright Information
Uni-Trend Technology (China) Co., Ltd. All rights reserved.
Trademark Information
UNI-T is the registered trademark of Uni-Trend Technology (China) Co., Ltd.
Document Version
UPO1000CS-20211231-V1.00
Statement
UNI-T products are protected by patent rights in China and foreign countries, including issued and
pending patents.
UNI-T reserves the rights to any product specification and pricing changes.
UNI-T reserves all rights. Licensed software products are properties of Uni-Trend and its subsidiaries
or suppliers, which are protected by national copyright laws and international treaty provisions.
Information in this manual supersedes all previously published versions.

4 / 99
Warranty
UNI-T warrants that the product will be free from defects for a three-year period. If the product is re-sold,
the warranty period will be from the date of the original purchase from an authorized UNI-T distributor.
Probes, other accessories, and fuses are not included in this warranty.
If the product is proved to be defective within the warranty period, UNI-T reserves the rights to either
repair the defective product without charging of parts and labor, or exchange the defected product to a
working equivalent product. Replacement parts and products may be brand new, or perform at the same
specifications as brand new products. All replacement parts, modules, and products become the property
of UNI-T.
The “customer” refers to the individual or entity that is declared in the guarantee. In order to obtain the
warranty service, "customer" must inform the defects within the applicable warranty period to UNI-T, and
to perform appropriate arrangements for the warranty service. The customer shall be responsible for
packing and shipping the defective products to the designated maintenance center of UNI-T, pay the
shipping cost, and provide a copy of the purchase receipt of the original purchaser. If the product is
shipped domestically to the location of the UNI-T service center, UNI-T shall pay the return shipping fee.
If the product is sent to any other location, the customer shall be responsible for all shipping, duties, taxes,
and any other expenses.
This warranty shall not apply to any defects or damages caused by accidental, machine parts’ wear and
tear, improper use, and improper or lack of maintenance. UNI-T under the provisions of this warranty has
no obligation to provide the following services:
a) Any repair damage caused by the installation, repair, or maintenance of the product by non UNI-T
service representatives.
b) Any repair damage caused by improper use or connection to an incompatible device.
c) Any damage or malfunction caused by the use of a power source which does not conform to the
requirements of this manual.
d) Any maintenance on altered or integrated products (if such alteration or integration leads to an
increase in time or difficulty of product maintenance).
This warranty is written by UNI-T for this product, and it is used to substitute any other express or implied
warranties. UNI-T and its distributors do not offer any implied warranties for merchantability or applicability
purposes.
For violation of this guarantee, regardless of whether UNI-T and its distributors are informed that any
indirect, special, incidental, or consequential damage may occur, UNI-T and its distributors shall not be
responsible for any of the damages.

5 / 99
1. Introduction
This manual includes safety requirements, installment and the operation of UPO1000CS oscilloscope.
2. Safety Requirement
This section contains information and warnings that must be followed to keep the instrument operating
under safety conditions. In addition, user should also follow the common safety procedures.
Safety Precautions
Warning
Please follow the following guidelines to avoid possible electric shock and risk to
personal safety.
Users must follow the following conventional safety precautions in operation, service
and maintenance of this device. UNI-T will not be liable for any personal safety and
property loss caused by the user’s failure to follow the following safety precautions. This
device is designed for professional users and responsible organizations for
measurement purposes.
Do not use this device in any way not specified by the manufacturer. This device is only
for indoor use unless otherwise specified in the product manual.
Safety Statement
Warning
“Warning” indicates the presence of a hazard. It reminds users to pay attention to a
certain operation process, operation method or similar. Personal injury or death may
occur if the rules in the “Warning” statement are not properly executed or observed. Do
not proceed to the next step until you fully understand and meet the conditions stated in
the “Warning” statement.
Caution
“Caution” indicates the presence of a hazard. It reminds users to pay attention to a
certain operation process, operation method or similar. Product damage or loss of
important data may occur if the rules in the “Caution” statement are not properly
executed or observed. Do not proceed to the next step until you fully understand and
meet the conditions stated in the “Caution” statement.
Note
“Note” indicates important information. It reminds users to pay attention to procedures,
methods and conditions, etc. The contents of the “Note” should be highlighted if
necessary.
Safety Sign

6 / 99
Danger
It indicates possible danger of electric shock, which may cause personal
injury or death.
Warning
It indicates that you should be careful to avoid personal injury or product
damage.
Caution
It indicates possible danger, which may cause damage to this device or
other equipment if you fail to follow a certain procedure or condition. If the
“Caution” sign is present, all conditions must be met before you proceed
to operation.
Note
It indicates potential problems, which may cause failure of this device if
you fail to follow a certain procedure or condition. If the “Note” sign is
present, all conditions must be met before this device will function
properly.
AC
Alternating current of device. Please check the region’s voltage range.
DC
Direct current device. Please check the region’s voltage range.
Grounding
Frame and chassis grounding terminal.
Grounding
Protective grounding terminal.
Grounding
Measuring grounding terminal.
OFF
Main power off.
ON
Main power on.
Power
Supply
Standby power supply: when the power switch is turned off, this device is
not completely disconnected from the AC power supply.
CAT I
Secondary electrical circuit connected to wall sockets through
transformers or similar equipment, such as electronic instruments and
electronic equipment; electronic equipment with protective measures, and
any high-voltage and low-voltage circuits, such as the copier in the office.
CAT II
CATII: Primary electrical circuit of the electrical equipment connected to
the indoor socket via the power cord, such as mobile tools, home
appliances, etc. Household appliances, portable tools (e.g. electric drill),
household sockets, sockets more than 10 meters away from CAT III
circuit or sockets more than 20 meters away from CAT IV circuit

7 / 99
CAT III
Primary circuit of large equipment directly connected to the distribution
board and circuit between the distribution board and the socket (three-
phase distributor circuit includes a single commercial lighting circuit).
Fixed equipment, such as multi-phase motor and multi-phase fuse box;
lighting equipment and lines inside large buildings; machine tools and
power distribution boards at industrial sites (workshops).
CAT IV
Three-phase public power unit and outdoor power supply line equipment.
Equipment designed to “initial connection”, such as power distribution
system of power station, power instrument, front-end overload protection,
and any outdoor transmission line.
Certificatio
n
CE indicates a registered trademark of EU.
Certificatio
n
UKCA indicates a registered trademark of United Kingdom.
Certificatio
n
Conforms to UL STD 61010-1, 61010-2-030, Certified to CSA STD C22.2
No. 61010-1, 61010-2-030.
Waste
Do not place equipment and its accessories in the trash. Items must be
properly disposed of in accordance with local regulations.
EFUP
This environment-friendly use period (EFUP) mark indicates that
dangerous or toxic substances will not leak or cause damage within this
indicated time period. The environment-friendly use period of this product
is 40 years, during which it can be used safely. Upon expiration of this
period, it should enter the recycling system.
Safety Requirements
Warning
Preparation before use
Please connect this device to AC power supply with the power cable
provided;
The AC input voltage of the line reaches the rated value of this device.
See the product manual for specific rated value.
The line voltage switch of this device matches the line voltage;
The line voltage of the line fuse of this device is correct.
Do not used to measure MAINS CIRCUIT.
Check all terminal rated
values
Please check all rated values and marking instructions on the product to
avoid fire and impact of excessive current. Please consult the product
manual for detailed rated values before connection.

8 / 99
Use the power cord
properly
You can only use the special power cord for the instrument approved by
the local and state standards. Please check whether the insulation layer of
the cord is damaged or the cord is exposed, and test whether the cord is
conductive. If the cord is damaged, please replace it before using the
instrument.
Instrument Grounding
To avoid electric shock, the grounding conductor must be connected to
the ground. This product is grounded through the grounding conductor of
the power supply. Please be sure to ground this product before it is
powered on.
AC power supply
Please use the AC power supply specified for this device. Please use the
power cord approved by your country and confirm that the insulation layer
is not damaged.
Electrostatic prevention
This device may be damaged by static electricity, so it should be tested in
the anti-static area if possible. Before the power cable is connected to this
device, the internal and external conductors should be grounded briefly to
release static electricity. The protection grade of this device is 4KV for
contact discharge and 8KV for air discharge.
Measurement
accessories
Measurement accessories are of lower class, which are definitely not
applicable to main power supply measurement, CAT II, CAT III or CAT IV
circuit measurement.
Probe assemblies and accessories within the scope of IEC 61010-031,
and current sensors within the scope of IEC 61010-2-032 shall meet the
requirements thereof.
Use the input / output
port of this device
properly
Please use the input / output ports provided by this device in a properly
manner. Do not load any input signal at the output port of this device. Do
not load any signal that does not reach the rated value at the input port of
this device. The probe or other connection accessories should be
effectively grounded to avoid product damage or abnormal function.
Please refer to the product manual for the rated value of the input / output
port of this device.
Power fuse
Please use power fuse of specified specification. If the fuse needs to be
replaced, it must be replaced with another one that meets the specified
specifications (Class T, rated current 5A, rated voltage 250V) by the
maintenance personnel authorized by UNI-T.

9 / 99
Disassembly and
cleaning
There are no components available to operators inside. Do not remove
the protective cover.
Maintenance must be carried out by qualified personnel.
Service environment
This device should be used indoors in a clean and dry environment with
ambient temperature from 0 ℃ to 40 ℃.
Do not use this device in explosive, dusty or humid air.
Do not operate in humid
environment
Do not use this device in a humid environment to avoid the risk of internal
short circuit or electric shock.
Do not operate in
flammable and
explosive environment
Do not use this device in a flammable and explosive environment to avoid
product damage or personal injury.
Caution
Abnormity
If this device may be faulty, please contact the authorized maintenance
personnel of UNI-T for testing. Any maintenance, adjustment or parts
replacement must be done by the relevant personnel of UNI-T.
Cooling
Do not block the ventilation holes at the side and back of this device;
Do not allow any external objects to enter this device via ventilation holes;
Please ensure adequate ventilation, and leave a gap of at least 15 cm on
both sides, front and back of this device.
Safe transportation
Please transport this device safely to prevent it from sliding, which may
damage the buttons, knobs or interfaces on the instrument panel.
Proper ventilation
Poor ventilation will cause the device temperature to rise, thus causing
damage to this device. Please keep proper ventilation during use, and
regularly check the vents and fans.
Keep clean and dry
Please take actions to avoid dust or moisture in the air affecting the
performance of this device. Please keep the product surface clean and
dry.
Note
Calibration
The recommended calibration period is one year. Calibration should only
be carried out by qualified personnel.

10 / 99
Environmental Requirements
This instrument is suitable for the following environment:
Indoor use.
Pollution degree 2
In operating: altitude lower to 3000 meter;in non-operating: altitude lower to 15000 meter.
Operating temperature 0℃ to﹢40℃; Storage temperature -20℃ to +70℃(unless otherwise
specified).
In operating, humidity temperature below to +35℃, ≤90% relative humidity;
In non-operating, humidity temperature +35℃ to +40℃, ≤60% relative humidity.
There are ventilation opening on the rear panel and side panel of the instrument. So please keep the air
flowing through the vents of the instrument housing. To prevent excessive dust from blocking the vents,
please clean the instrument housing regularly. The housing is not waterproof, please disconnect the
power supply first and then wipe the housing with a dry cloth or a slightly moistened soft cloth.
Connecting Power Supply
The specification of AC power supply that can input
Voltage Range
Frequency
100-240VAC (Fluctuations±10%)
50/60Hz
Please use the attached power lead to connect to the power port.
Connecting to service cable
This instrument is a Class I safety product. The supplied power lead has good performance in terms of
case ground. This spectrum analyzer is equipped with a three-prong power cable that meets international
safety standards. It provides good case grounding performance for the specification of your country or
region.
Please install AC power cable as follows:
• ensure the power cable is in a good condition.
• leave enough space for connecting the power cord.
• Plug the attached three-prong power cable into a well-grounded power socket.
Electrostatic Protection
Electrostatic discharge may cause damage to component. Components can be damaged invisibly by
electrostatic discharge during transportation, storage and use.
The following measure can reduce the damage of electrostatic discharge,
• Testing in antistatic area as far as possible;
• Before connecting the power cable to the instrument, inner and outer conductors of the instrument
should be briefly grounded to discharge static electricity;
• Ensure all the instruments are properly grounded to prevent the accumulation of static.

11 / 99

12 / 99
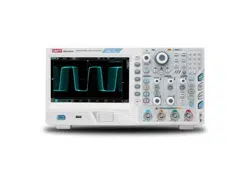
3. Introduction of UPO1000CS Series Digital Phosphor Oscilloscope
UPO1000CS Series contains the following 2 models
Model
Analog Channel
Bandwidth
UPO1202CS
2
200MHz
UPO1102CS
2
100MHz
UPO1000CS Series digital phosphor oscilloscope is based on unique Ultra Phosphor technology. A multi-
functional, high performance oscilloscope that is easy to use, with excellent technical specifications, a
perfect combination of many functionalities that can help users to quickly complete testing. UPO1000CS
series is aimed at satisfying the most extensive oscilloscope markets, including communications,
semiconductors, computers, meter and instruments, aerospace defense, instrumentation, industrial
electronics, consumer electronics, automotive electronics, field maintenance, R&D, education, etc.
Main Features:
● Analog channel bandwidth: 200MHz, 100MHz
● Analog channel: 2
● Sampling rate: 1 GS/s (not interleaving, each channel is independent sampling)
● Vertical scale: 1 mV/div-20 V/div
● Ground noise: <100 μVrms
● Storage depth: 56 Mpts (per channel)
● Waveform capture rate of up to 500,000 wfms/s
● Hardware real-time continuous recording up to 100,000 frames
● Automatic measurement of 35 waveform parameters
● Multi-Scopes supports two channels independent trigger fluorescent display
● Two channels with independent hardware 7 digits frequency meter
● DVM supports two channels independent AC/DC TRMS (true virtual value) measurement
● Waveform operation: FFT, add, subtract, multiply, divide, digital filter, logical operation and advanced
operation
● 1M points enhance FFT function, supporting frequency setting, waterfall curve, detection setting and
mark measurement

13 / 99
● Abundant trigger functions: edge, pulse width, video, slope, runt pulse, over-amplitude pulse, delay,
timeout, duration, setup hold, Nth edge and pattern trigger
● Supporting RS232, I
2
C, SPI, CAN and LIN trigger
● Creative hardware decoding function: RS232, I
2
C, SPI, CAN and LIN, hardware decoding and full
and deep storage decoding function
● Ultra Phosphor display, 256 level gray scale display
● 7 inch WVGA(800×480)TFT LCD
● Multiple interface: USB-Host, USB-Device, LAN, EXT Trig, AUX Out (Trig Out, Pass/Fail)
● Supporting SCPI programmable standard command
● Support WEB access and control

14 / 99
4. Getting Started Guide
4.1 General Inspection
4.2 Before Use
4.3 Front Panel
4.4 Rear Panel
4.5 Operation Panels
4.6 User Interface
4.7 Introduction of Special Symbol
This chapter introduces on using the oscilloscope for the first time, the front and rear panels, the user
interface, as well as the built-in help system.

15 / 99
4.1 General Inspection
It is recommended to inspect the instrument follow the steps below before using the UPO1000CS series
for the first time.
(1) Check for Damages caused by Transport
If the packaging carton or the foam plastic cushions are severely damaged, please contact the UNI-T
distributor of this product immediately.
(2) Check Attachment
Please check appendix for the list of accessories. If any of the accessories are missing or damaged,
please contact UNI-T or local distributors of this product.
(3) Machine Inspection
If the instrument appears to be damaged, not working properly, or has failed the functionality test,
please contact UNI-T or local distributors of this product.
If the equipment is damaged due to shipping, please keep the packaging and notify both the
transportation department and UNI-T distributors, UNI-T will arrange maintenance or replacement.
4.2 Before Use
To perform a quick verification of the instrument’s normal operations, please follow the steps below:
(1) Connect to the Power Supply
The power supply voltage range is from 100 VAC to 240 VAC, the frequency range is 50/60Hz.
Connect the oscilloscope to the power supply line that came with the oscilloscope or any power
supply line that meets the local country standards. Turn on the power button, which on the back of
the oscilloscope. The soft power button in the front of the oscilloscope should be on red. Press
this button to turn on the oscilloscope.
(2) Boot Check
Press the soft power button and the light should change to green. The oscilloscope will show
a boot animation, and then enter the normal interface.
(3) Connect Probe
Use probe in the attachment and connect it BNC port to the channel 1 BNC port of the oscilloscope.
Connect the probe’s main alligator clip to the “Compensating signal port” and the ground clip is
connected to the “Ground terminal” shown below. The output of the compensating signal should be
amplitude 3Vpp, default frequency is 1 kHz.

16 / 99
Figure 4-1 Compensating signal and Ground terminal
(4) Function Check
Press the AUTO key, a 3 Vpp 1 kHz square wave should appear. Repeat step 3 for all channels. If
the output is not a square wave with the above descriptions, please perform the probe
compensation step in the next section.
(5) Probe Compensation
When the probe is connected to any input channel for the first time, this step might be adjusted in
order to match the probe and the input channel. Probes that are not compensated may lead to
measurement errors or mistake. Please follow the following steps:
① Set the attenuation coefficient in the probe menu and the switch on the probe to 10x, and connect
the probe to CH1. Make sure the probe’s connector is properly connected with the oscilloscope.
Connect the probe’s main clip and ground clip to the oscilloscope’s compensating signal and
ground terminal respectively. Open CH1 and press the AUTO button.
② View displayed waveforms, as shown in Figure 4-2.
Excessive Compensation Correct Compensation Insufficient Compensation
Figure 4-2 Compensating Calibration of Probe
③ If the displayed waveform is look like the above “Insufficient Compensation” or “Excessive
Compensation”, use a non-metallic screwdriver to adjust the probe’s variable capacitance until the
display matches the "Correct compensation" waveform.
Warning: To avoid electric shock when using the probe to measure high voltage, please ensure
that the probe insulation is in good condition and avoid physical contact with any metallic part of
the probe.
Compensating signal terminal
Ground terminal

17 / 99
4.3 Front Panel
Figure 4-3 Front Panel
1. Screen display area
2. Multipurpose knob
3. Function menu
4. Run/Stop, Automatic setting key
5. TRIGGER control
6. Default, Help menu
7. Compensation signal and Ground terminal
8. EXT (External trigger input) port
9. Horizontal control area
10. Analog channel input port
11. Vertical control area
12. Control menu, copy key
13. USB HOST interface
14. Power on/off
1
2
3
4
10
8
9
11
7
14
5
6
12
13
18 / 99
4.4 Rear Panel
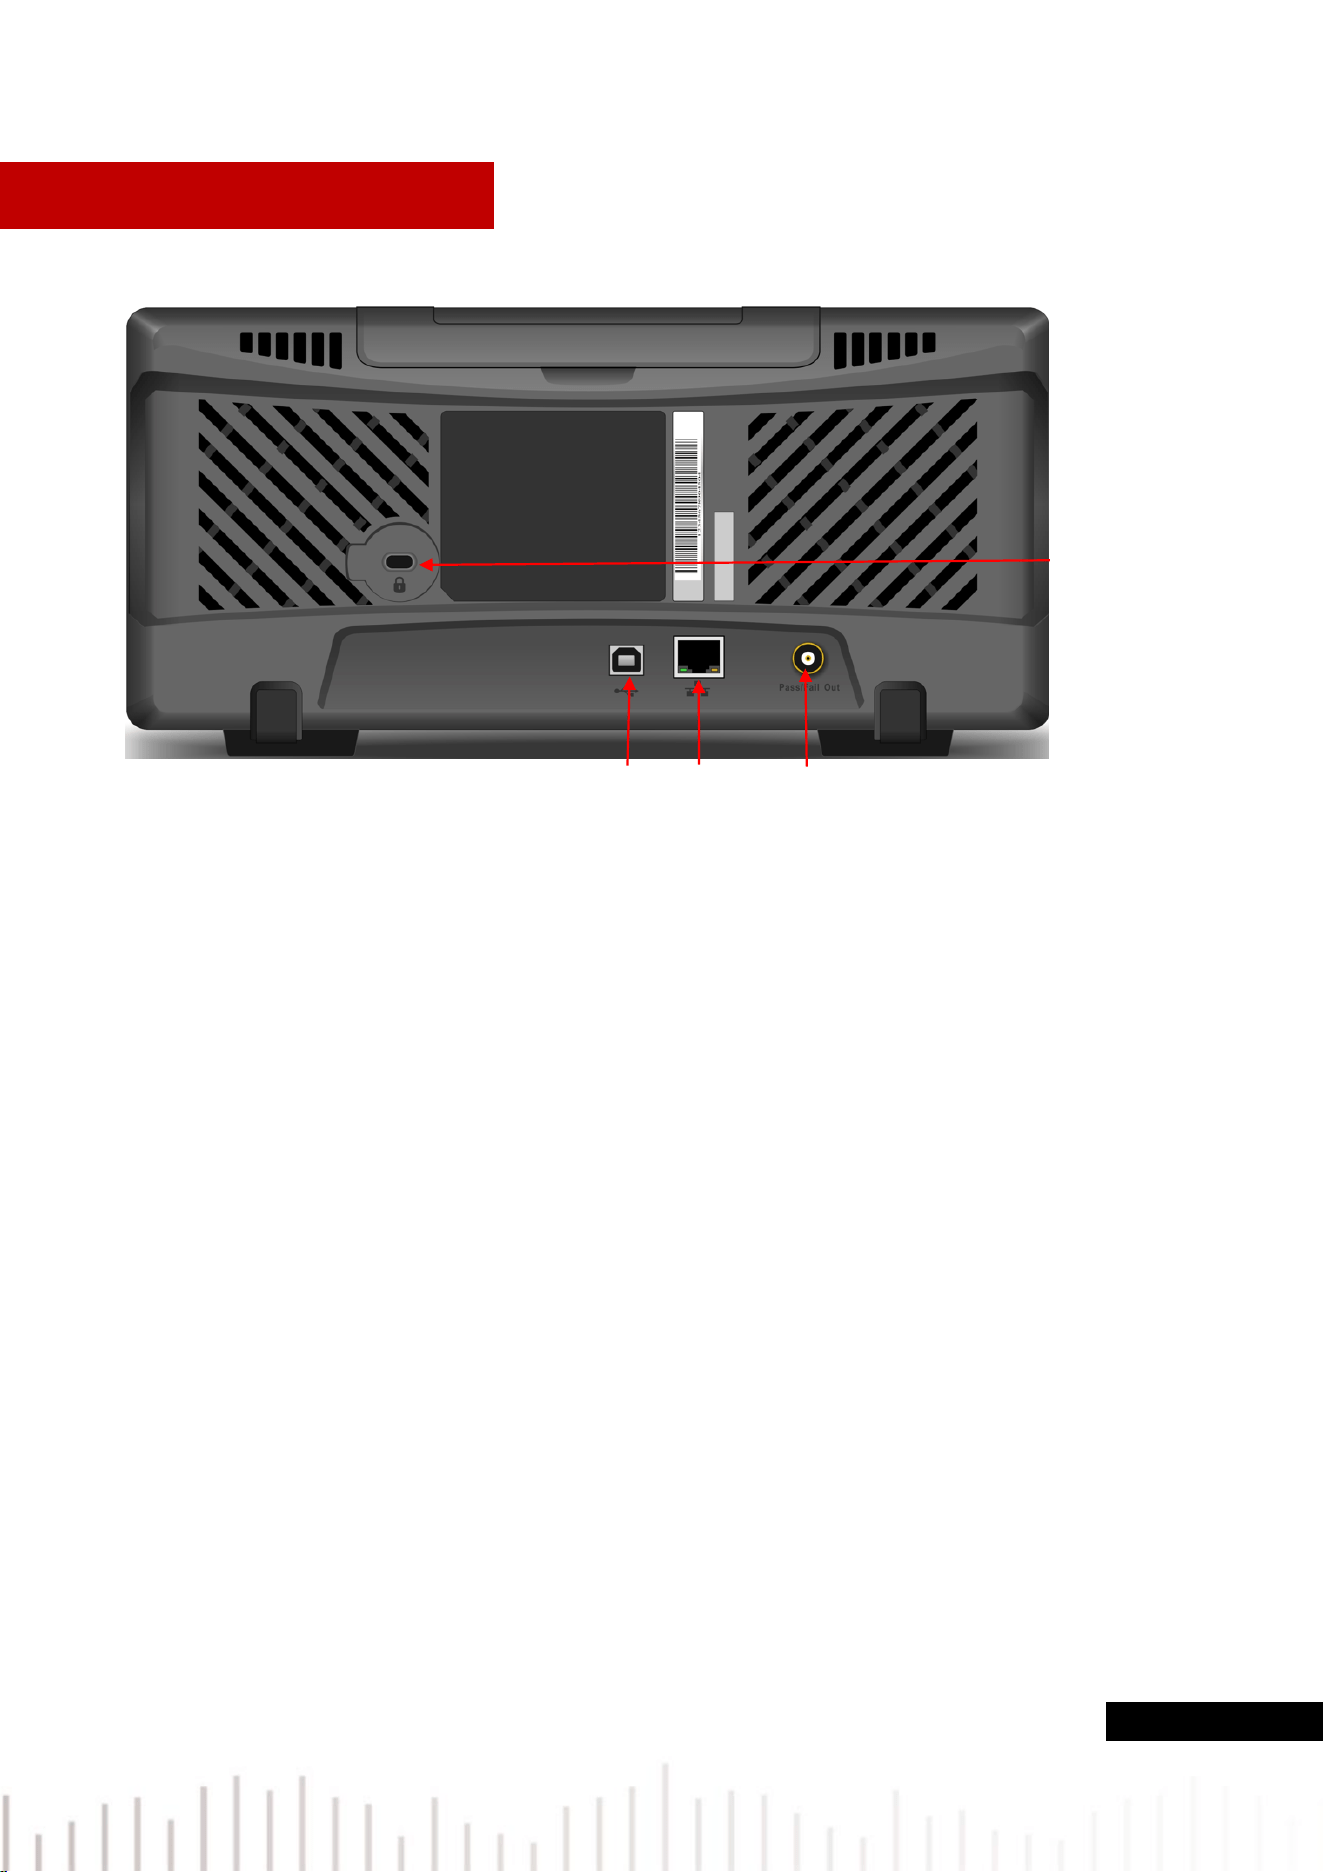
Figure 4-4 Rear Panel
①. USB Device:USB Device interface, it can be used to communicate with the PC
②. LAN :The oscilloscope can be connected to the LAN network for remote control
③. Pass/Fail output port: Pass/Fail test output, Trig_out signal
④. Safety Lock:Optional safety lock (sold separately) can be used for the oscilloscope stay at fixed
position
①
②
③
④

19 / 99
4.5 Operation Panel
(1) Vertical Control
① CH1 、 CH2 :Analog channel setting keys, CH1, CH2 identified by different
colors and it also corresponding to the colors of waveforms on the screen and
channel input connectors. Press any key to turn on the related channel menu
(activate or disable channel).
② MATH :Press this key to open the mathematical operation menu for add,
subtract, multiply, divide, FFT, logical operations, digital filtering and advanced
operations.
③ Vertical POSITION :Adjust the vertical position to move the current channel
waveform, the vertical offset value will display at the baseline cursor.
Press this knob to return the channel display back to the vertical midpoint.
④ Vertical SCALE :Vertical position knob is used for adjusting the vertical scale,
turn clockwise to decrease the scale, turn counterclockwise to increase the scale.
With this process, waveform will display increasing or decreasing and position
information will also be presented at the same time. The vertical
scale stepped as 1-2-5 order. Press the knob allows the vertical adjustment to
switch between coarse and fine adjustment mode.
(2) Horizontal Control
① HORI MENU :Horizontal menu is for display window extension, Multi-
Scopes, timebase (XY/YT) and trigger holdoff.
② Horizontal POSITION :Adjusting the horizontal position knob, the trigger
point moves around the left or right of the center of the screen, and the
waveform of all the channel moves to left or right. Horizontal position
parameter will display on the top of the screen in real- time. Press
this knob to return the channel display back to the midpoint position.
③ Horizontal SCALE :Used to adjust the time base of all the channel. Screen
will display the changes of the waveform, compressed or extension on
horizontal. Time base will display on the top of the screen in
real- time. The time base scale stepped as 1-2- 5 order. Press the knob
allows the horizontal adjustment to switch between window display and
extension window.

20 / 99
(3) Trigger Control
① LEVEL :Adjusting the trigger level. Turn clockwise to increase
the level and turn counterclockwise to decrease the level. During
the adjustment, the trigger level at the top right corner of the
screen will change accordingly. Press this
knob to quickly reset the trigger level back to 50% trigger signal
position.
② TRIG MENU :Press to display the trigger menu. For more
details, please refer to “Trigger Setting”.
③ DECODE:Set bus decoding, the specific refer to “DECODE”.
(4) Auto Setting
Press this key to enable the auto setting function. The oscilloscope will automatically adjust
the vertical scale, scan timebase and trigger mode according to the input signal to realize
optimum waveform display.
Note:Waveform auto setting function requires that the frequency of sine is no lower than 20 Hz; the
amplitude must be at least 20 mVpp~120 Vpp. Otherwise, the waveform auto setting function may
be invalid.
(5) Run/Stop
Press this key set the operating state to "RUN" or "STOP".
In the "RUN" state, the key is illuminated in green.
In the "STOP “state, the key is illuminated in red.
(6) PrintScreen
Press this knob to save waveform as bmp format image into USB device.
(7) Multipurpose Knob
Multipurpose:Turn the knob to select sub-menu, then press the knob to confirm the selection.

21 / 99
(8) Function Key
(9)
① MEASURE: Press this key to enable the measurement setting menu. It can set the measurement
source, parameter measurement, user-defined parameter, measurement statistic, measure indicator
and digital voltmeter. Turn on user-defined, it has 36 types of parameter measurement. Press
Multipurpose knob to quick select parameter to measuring and the result will show on the bottom of
the screen.
② ACQUIRE :Press this key to enter sampling setting menu, it can set sampling mode, deep storage
and quick sampling.
③ CURSOR :Press this key to enter cursor measurement menu, it can set type of cursor measurement,
information source and mode.
④ DISPLAY :Press this key to enter the display setting menu to set the display type, format, grid
brightness, waveform brightness, backlight brightness, persistence time, color temperature, anti-
color temperature, menu display and transparency.
⑤ STORAGE :Press this key to enter storage interface. Storage type includes setting, waveform,
reference waveform and picture. It can also call back waveform and setting from storage. It can save
in internal or external USB device.
⑥ UTILITY :Press this key to enter the auxiliary function setting menu. It can set auto-calibration,
system information, language setting, waveform recording, pass/fail test, square wave output,
frequency meter, output selection, time setting, IP setting, boot loading and delete data, etc.

22 / 99
4.6 User Interface
Figure 4-5 User Interface
User interface as shown in Figure 4-5 and the detailed description see the following.
① Trigger status identification: TRIGED (has been triggered), AUTO, READY, STOP, and ROLL.
② Timebase scale: Indicates the amount of time represented by one grid, which can be adjusted by the
horizontal scale knob.
③ Sampling rate/Storage depth: Indicates sampling rate and storage depth of the current scale.
④ Horizontal displacement: Display the horizontal displacement value of waveform, which can adjusted
by turning POSITION knob on the horizontal control. Press the knob returns the displacement back
to 0.
⑤ Trigger status: Displays trigger source, type, slope, coupling, mode, level, etc.
a. Trigger source: There are CH1~CH2, mains electricity and EXT states. CH1~CH2 will display
different trigger state colors based on channel colors. For example, presents trigger source
is CH1.
b. Trigger type: The types are edge, pulse width, video, slope, and advanced trigger. For example,
presents edge trigger.
c. Trigger slope: The types are rising, falling, and random. For example, presents rising edge
trigger.
d. Trigger coupling: The types are DC, AC, HF rejection, LF rejection and noise. For example,
indicates DC coupling.
7 8
6
5
4
2
3
10
9
11 ⑩
1
1

23 / 99
e. Trigger mode:Auto, normal and single.
f. Trigger level: Display the current trigger level, it corresponding to the right side of screen .
Adjusting trigger control LEVEL knob in front of panel to change the parameter.
⑥ CH1 vertical scale identification:Display CH1 activation state, channel coupling, bandwidth limit,
vertical scale and probe attenuation coefficient.
a. Channel activation state:
b. Bandwidth limitation: When the bandwidth limit function is turned on, an icon will appear in the
display
c. Vertical scale: Display the vertical scale of CH1. When CH1 is activated, the vertical scale can
be adjusted with the vertical scale knob in front of panel.
d. Probe attenuation coefficient: Display CH1 probe attenuation coefficient 0.001×,0.01×,0.1×,
1×,10×,100×,1000× and user-defined.
⑦ USB host identification:USB icon will be shown when USB device is connected.
⑧ LAN identification:LAN icon will be shown when network wire is connected.
⑨ The current date and time.
⑩ Soft key menu:Display the operation menu, press the corresponding knob to select menu. Press
F1 ~ F5 to change the sub-menu.
⑪ Analog channel identification and Waveform:Display channel identification and waveform of
CH1~CH2, the color of channel identification will be the same with waveform.
4.7 Introduction of Special Symbol
Take the left menu as example
This symbol presents there has the next menu
This symbol presents there has pull-down menu
This symbol presents there are two option
This symbol presents it can be adjusted by multipurpose knob
Circle number presents the page of menu, single page has no small circle, and
two or more pages will have small circle display. Press F5 to turn pages.

24 / 99
5. Vertical Channel Settings
5.1 Turn on/off/Activate/ Analog Channel
5.2 Channel Coupling
5.3 Bandwidth Limitation
5.4 Volts/div
5.5 Reverse Phase
5.6 Probe
5.7 Unit
UPO1000CS provides two analog inputs channel, that is CH1~CH2. In this chapter, take the channel 1
as example to introduce vertical channel settings.

25 / 99
5.1 Turn on/off/Activate/ Analog Channel
CH1~CH2 contains three states: turn on, shut down and activate
① Turn on:Press to turn off any of 1, 2 key can turn on the corresponding channel.
② Shut down:In this state, it will not show waveform. Press the corresponding channel key to turn off
which has been activated.
③ Activation:When multiple channel are enabled, only one channel can be activated (should be in
open state). In the active state,vertical scale, vertical displacement and channel setting can be
adjusted. Any of the channels that have been opened but not activated could be activated by the
corresponding channel keys.
Activation state Open but not activated Shut down
5.2 Channel Coupling
Channel coupling has three mode direct current, alternating current and ground coupling.
Direct Current AC Current Ground
5.3 Bandwidth Limitation
The bandwidth limit can set to 20 MHz and full bandwidth, soft key menu set to 20 MHz. The bandwidth
of the oscilloscope is limited to about 20 MHz and the high frequency signal above 20MHz in the
attenuation signal. It is often used to observe high frequency noise when low frequency signals is reducing.
When the bandwidth limit function is turned on, the B icon will appear in the vertical state, as shown in
Figure below.
B Icon
5.4 Volts/div
Press vertical scale knob can switch to volts/div quickly, it divided into coarse and fine adjustments. The
volts/div is from 1mV/div ~ 20V/div, with 1 -2- 5 order. In the coarse adjustment, it adjusts the vertical unit
by normal order; in fine adjustment, it adjusts the current vertical position by stepped 1%.

26 / 99
5.5 Reverse Phase
When reverse phase is turned on, the voltage value of waveform will be reversed and the reverse icon
will display on the screen, as shown in Figure 5-2.
Figure 5-1 Reverse Phase Closed Figure 5-2 Open Reverse Phase
5.6 Probe
In order to match up the attenuation coefficient setting of the probe, the coefficient needs to be set up in
the channel soft key menu. If the probe attenuation coefficient is 10:1, then the probe coefficient should
set to 10X to ensure the correct voltage reading.
The probe can be set to 0.001X,0.01X,0.1×,1×,10×,100×,1000× and user-defined.
5.7 Unit
Set the amplitude unit for the current channel. Unit setting should set in channel, it can set to “V”, “A”,
“W”, “U” and the default unit is V. After the setting, the unit in the channel status label and measurement
unit will be change accordingly.


28 / 99
6.1 Horizontal Scale
Horizontal scale which is horizontal time base, the time value represented by each scale in the horizontal
direction of the display screen, usually expressed as s/div. Rotate the SCALE knob in the HORIZONTAL
control area and set the horizontal scale according to 1-2-5 order, that is 1 ns/div, 2 ns/div, 5ns/div, 10
ns/div, 20 ns/div... 500 s/div, 1 ks/div. Turn clockwise to decrease the scale, turn counterclockwise to
increase the scale. When adjusting the horizontal time base, the scale information will appear in the upper
left corner of the screen (as shown in Figure 6-1), it changes in real time.
Figure 6-1
When the time base is changing, waveform will be change with trigger point to extension or compressed
accordingly.
6.2 ROLL Mode
When trigger mode is in auto state, rotate SCALE knob in the HORIZONTAL control area, the
oscilloscope will enter ROLL mode when horizontal scale slow to 20 ms/div.
The oscilloscope will continuously draw a voltage-time trend of the waveform on the screen. In this mode,
the waveform is scrolled from right to left to refresh the display, and the latest waveform is drawn at the
far right end of the screen. The diagram as shown in Figure 6-2.
Horizontal timebase
Trigger
point

29 / 99
Figure 6-2
Apply to slow sweep mode to observe low-frequency signal, it’s recommend that set the channel coupling
mode to direct current.
Note:In ROLL mode, horizontal displacement, window extension, pass/fail test, parameter measurement,
recording waveform and waveform brightness cannot be used.
6.3 Window Extension
Window extension is used for magnifying a waveform to view the image detail. In horizontal menu, it can
open window extension or open it by press SCALE knob in the HORIZONTAL control area.
In window extension mode, screen will be divided into two display area as shown in Figure 6-3.
Figure 6-3
Before enlarged waveform
After enlarged waveform
Main timebase
Extend timebase

30 / 99
The waveform before amplification is shown in the square brackets on the upper part of the screen. It can
move by horizontal position or adjusting time base to increasing or decreasing this area.
Enlarged Waveform
The enlarged waveform is displayed on the bottom part of the screen, window extension improves
resolution relative to the main time base.
Note: Window extension requires that time base position should at 20 ms/div~2 ns/div. Only in this range,
window extension can be functioned.
6.4 XY
The waveform displayed in XY mode is also called Lissajous curve.
In XY mode, input CH1 signal on the horizontal axis(X axis), input CH2 signal on the vertical axis (Y axis).
In XY mode, when CH1 is activated, use POSITION knob in the vertical control area to move XY figure
on the horizontal direction. When CH2 is activated, use POSITION knob in the vertical control area to
move XY figure on the vertical direction.
Rotate the SCALE knob in the vertical control area to adjust amplitude scale of each channel, rotate the
SCALE knob in the horizontal control area to adjust the time base, which can get a better display effect
of Lissajous curve. Waveform in XY mode as shown in Figure 6-4.
Figure 6-4
Application of XY Mode
Phase difference between in two signals with the same frequency can be easily observed through
Lissajous curve. The following figure explains the observation schematic of the phase difference.

31 / 99
Figure 6-5
Based on sinθ=A/B or C/D, θ is the phase angle between channels, the definition of A, B, C, D see Figure
6-5. So the phase angle isθ=±arcsin(A/B)or θ=±arcsin(C/D).
If the main spindle of elliptical within I, III quadrant, then the acquired phase angle should at I, IV quadrant,
that is within (0~π/2)or(3π/2~2π).
If the main spindle of elliptical within II, IV, then the acquired phase angle should within (π/2~π)or
(π~3π/2).
In addition, if the frequency or phase difference of the two signal to be measured are integer times,
calculating the frequency and phase relation of the two signals based on the Figure 6-6.
Figure 6-6
6.5 Multi-Scopes
In multi-scopes, CH1, CH2 can be set to different timebase scale, so that signals of different frequency in multiple
channels can be observed at the same time. Enter Multi-Scopes interface via horizontal menu.
Switch Multi-scopes to enter this mode, as shown in Figure 6-7. Each channel can be set to different frequency,
amplitude and waveform and all can be stable generated in multi-scopes.
In multi-scopes, it can turn on, off, activate channel. Timebase scale, volts/div, horizontal displacement, vertical
displacement, trigger setting of channel can be adjusted independently.
Multi-Scopes supports split screen (upper and down screen) for observing waveform, as shown in Figure 6-7.

32 / 99
Figure 6-7
6.6 Trigger Holdoff
Trigger holdoff is used for viewing complicated waveform (such as pulse string). Holdoff time refers to the
time that the oscilloscope waits to restart the trigger circuit. During hold off, the oscilloscope will not trigger
until the end of holdoff time. For example, a group of pulse string, it requires that trigger the first pulse
string and the hold off time can be set as width of pulse string, as shown in Figure 6-8.
In HORI MENU, use multipurpose knob and numeric keyboard to set hold off time. Time range: 100 ns
~10 s.
Figure 6-8

33 / 99
7. Trigger System
7.1 Noun Explanation of Trigger System
7.2 Edge Trigger
7.3 Pulse Width Trigger
7.4 Video Trigger
7.5 Slope Trigger
7.6 Runt Trigger
7.7 Over-Amplitude Pulse Trigger
7.8 Delay Trigger
7.9 Time-out Trigger
7.10 Duration Trigger
7.11 Setup/Hold Trigger
7.12 Nth Edge Trigger
7.13 Pattern Trigger
7.14 RS232 Trigger
7.15 I
2
C Trigger
7.16 SPI Trigger
7.17 CAN Trigger
7.18 LIN Trigger
7.19 DECODE
Trigger determines when the oscilloscope starts to collect data and display waveform. Once the trigger
is correctly setup, it can convert unstable signals into meaningful waveform. In the beginning of data
acquisition, it collects enough data to compose the waveform at the left of the trigger point, and continue
to collect the data until the trigger condition is met. When a trigger is detected, the oscilloscope
continuously collecting enough data to draw the waveform at the right of the trigger point.
In this chapter, take UPO1202CS as example to introduce trigger setting.

34 / 99
7.1 Noun Explanation of Trigger System
(1) Trigger Source
A signal for generating a trigger. Trigger can be obtained from a variety of information sources, such
as input channel (CH1, CH2), external trigger (EXT), mains electricity, etc.
a. Input channel: Select any one of the analog signal input port CH1~CH2 on the front panel of the
oscilloscope as a trigger signal. Trigger level range: ± 5 grids from screen center.
b. External trigger: Select the input signal EXT TRIG (EXT input port) on the front of the
oscilloscope as a trigger signal. For example, the external clock input to EXT Trig port to be a
trigger source. EXT signal trigger level within the range from–4 V~ +4 V can be set.
c. Mains electricity:Used to observe the related signal of mains electricity, such as the relation of
lighting equipment and power supply equipment, to obtain stable synchronization.
(2) Trigger Mode
Trigger mode determines the behavior of the wave during a trigger event. This oscilloscope provides
three kinds of trigger modes: auto, normal, and single.
a. Auto trigger:When there is no trigger signal, the system automatically collect and display data.
When the trigger signal is generated, it automatically switch to trigger scanning, so that the
signal will be synchronized.
Auto trigger mode is suitable for
Check DC signal or signal with unknown electrical feature
Note: This mode allows 50 ms/div or in slower timebase scale to set no trigger signal in ROLL mode.
b. Normal trigger: The oscilloscope can only collect data when the trigger condition is satisfied.
When there is no trigger signal, the oscilloscope will stop collect data. When the trigger condition
is satisfied, refresh the current waveform data display on the screen, otherwise, it remains the
last triggered waveform.
Normal trigger mode is suitable for
Only collect the specific event appointed by the trigger setting;
Rare trigger event, use normal mode can prevent the oscilloscope from automatic trigger, so that
the waveform can be stable display.
c. Single trigger: Delete the waveform display on the screen, the oscilloscope waits for the trigger.
When the instrument detects a single trigger, the waveform will be sampled and displayed, and
then the instrument enters the STOP state.
Single trigger mode is suitable for
Capture casual event or aperiodicity signal, such as up, down waveform;
Rare trigger event
(3) Trigger Coupling
Trigger coupling determines which part of the signal will be transmitted to the trigger circuit. The
coupling type includes DC, AC, low frequency/high frequency suppression and noise suppression.
a. DC:Let all the components of the signal pass through

35 / 99
b. AC:Block the DC component of the signal
c. High frequency suppression: Attenuates high frequency components over 40kHz.
d. Low frequency suppression: Attenuates low frequency components below 40kHz.
e. Noise suppression: Suppress high frequency noise in the signal to reduce probability of touch
error.
(4) Pre-trigger / Delayed Trigger
Before trigger event / after collect data.
Trigger position is usually set at the horizontal center of the screen, user can observe 7 grids of pre-
trigger and delay trigger information. Horizontal move the waveform to view more pre-trigger
information. By observing the pre-trigger data, the waveform before generated can be observed. For
example, capturing the glitch at the start of the circuit, observing and analyzing the pre-trigger data
to find out the cause of the glitch.
7.2 Edge Trigger
The edge can be triggered by looking for the specific edge (rising edge, falling edge and random edge)
and electrical level. Press edge trigger menu to set signal source, edge type, alternate trigger and
trigger mode, waveform can be stable generated when the condition is satisfied, as shown in Figure 7-
1.
Figure 7-1
(1) Edge type:
a. Rising edge: Set to trigger on the rising edge of the signal.
b. Falling edge: Set to trigger on the falling edge of the signal.
c. Random edge:Set to trigger on the rising edge and the falling edge of the signal.
Trigger point
Rising edge
Falling edge

36 / 99
7.3 Pulse Width Trigger
Pulse width trigger can set the oscilloscope at specific width and generated the positive pulse or
negative pulse when meet the trigger condition. Pulse width trigger menu can set information source,
polarity of pulse width (positive and negative), condition, the upper /lower limit of time, trigger coupling,
trigger mode, etc. As shown in Figure 7-2.
Figure 7-2
(1) Condition
Select trigger condition:“>”,“<”,“≤≥”.
a. >:It will be generated when the pulse width of the trigger signal is greater than the pulse width
setting, it can set the lower limit of pulse width.
b. <:It will be generated when the pulse width of the trigger signal is smaller than the pulse width
setting, it can set the upper limit of pulse width.
c. ≤≥:It will be generated when the pulse width of the trigger signal is in the setting scope, it can
set the lower limit of pulse width and the upper limit of pulse width.
(2) The upper /lower limit of time
Compare the setting pulse width value with the signal pulse width. The trigger will be generated when
the condition is met. The range can be set to 2 ns ~10 s.
Positive pulse width
Negative pulse width
Trigger level line

37 / 99
7.4 Video Trigger
The video signal includes the image and the time sequence information, it has multiple standards and
formats. UPO1000CS provides the basic measurement functions, which can be triggered in NTSC
(National Television Standards Committee), PAL (Phase Alternating Line) , SECAM (Sequential
Couleur A Memoire).
(1) Video Format
a. PAL: The frame frequency is 25 frames per second, the TV scan line is 625 lines, the odd field
is in the front and the even field is in the rear.
b. NTAC: The field frequency is 60 fields per second, and the frame frequency is 30 frames per
second. The TV scan line is 525 lines. The even field is in the front and the odd field is in the
rear.
c. SECAM:The frame frequency is 25 frames per second, the TV scan line is 625 lines,
interlaced scanning.
(2) Video Synchronization
a. Even field: Set to trigger and synchronize on the even field of the video signal.
b. Odd field: Set to trigger and synchronize on the odd field of the video signal.
c. All lines: Set to trigger and synchronize on the line signal of the video signal.
d. Specified lines: Set to trigger and synchronize on the specified video lines. User can use the
Multipurpose knob to specify the line number, and the setting range is from 1 to 625
(PAL/SECAM), or from 1 to 525 (NTSC).
Note: In order to observe the waveform details in the video signal, user can set the memory depth
a little bigger.
The UPO1000CS series utilize the UNI-T original digital 3D technology, it uses a multi-level
grayscale display function so that different brightness can reflect the frequency of different parts of
the signal. Experienced users can quickly judge the signal quality during the debugging process
and find the unusual conditions.
7.5 Slope Trigger
Slope trigger refers to triggering when the slope of signal rising or falling conforms to the set value. Slope
trigger menu can set the source, trigger coupling, trigger mode, slope (positive slope, negative slope),
condition, the lower limit/ upper limit of time, threshold, etc.
(1) Slope
a. Positive slope: Perform slope trigger by using the rising edge of the trigger signal.
b. Falling slope: Perform slope trigger by using the falling edge of the trigger signal.

38 / 99
(2) Condition
a. >:It will be generated when the slope time of the trigger signal is greater than the setting slope
time, it can set the lower limit of time.
b. <:It will be generated when the slope time of the trigger signal is less than the setting slope
time, it can set the upper limit of time.
c. ≤≥:It will be generated when the slope time of the trigger signal is within the scope of setting
slope time, it can set the lower/upper limit of time.
Note:Slope time of trigger signal refers to the figure shown “slope time of rising/ falling edge”.
(3) Threshold
Threshold has three mode: low level, high level and high-low level. Press LEVEL knob to quickly
select the mode.
a. Lower level:The slope of the low threshold level can be adjusted with the LEVEL knob.
b. High level:The slope of the high threshold level can be adjusted with the LEVEL knob
c. High-low level:The slope of the high-low threshold level can be adjusted with the LEVEL knob
(4) The lower/upper limit of time
Set the time of slope, range can be set to 8ns ~ 10s.
Note: The formula for calculating the slew rate is
(High level threshold - Low level threshold) ÷ Time
For the set slew rate, the time here is the time setting value. For the slew rate of the trigger signal, the
time here refers to the time value between two intersection points where the high level, low level
intersect with the trigger signal.
7.6 Runt Trigger
The runt trigger is used to trigger a pulse that has crossed one trigger level but not the other.
In this oscilloscope, the positive runt pulse is the pulse that crosses the lower limit of the trigger level but
does not cross the upper limit of the trigger level; the negative runt pulse is the pulse that crosses the
upper limit of the trigger level but does not cross the lower limit of the trigger level, as shown in Figure 7-
3..
The runt trigger menu can set source, trigger coupling, trigger mode, polarity (positive, negative pulse),
runt condition (irrelevance, <, >,≤≥), time setting (the lower/upper limit of time), trigger level, etc.

39 / 99
Figure 7-3
(1) Polarity
a. Positive pulse: Set to trigger on the positive runt pulse.
b. Negative pulse: Set to trigger on the negative runt pulse.
(2) Condition
Trigger condition:Irrelevance, >, <, ≤≥.
a. Irrelevance:Does not set the runt pulse trigger condition.
b. >:It will be generated when the runt pulse width is greater than the setting pulse width, it can
set the lower limit of time.
c. <:It will be generated when the runt pulse width is less than the setting pulse width, it can
set the upper limit of time.
(3) ≤≥:It will be generated when the runt pulse width is in the scope of the setting pulse width or
within a range, it can set the lower/upper limit of time
(4) The lower/upper limit of time
Compare the setting pulse width value with pulse width of channel. It will generated when trigger
condition is met, range can be set to 8ns ~ 10s.
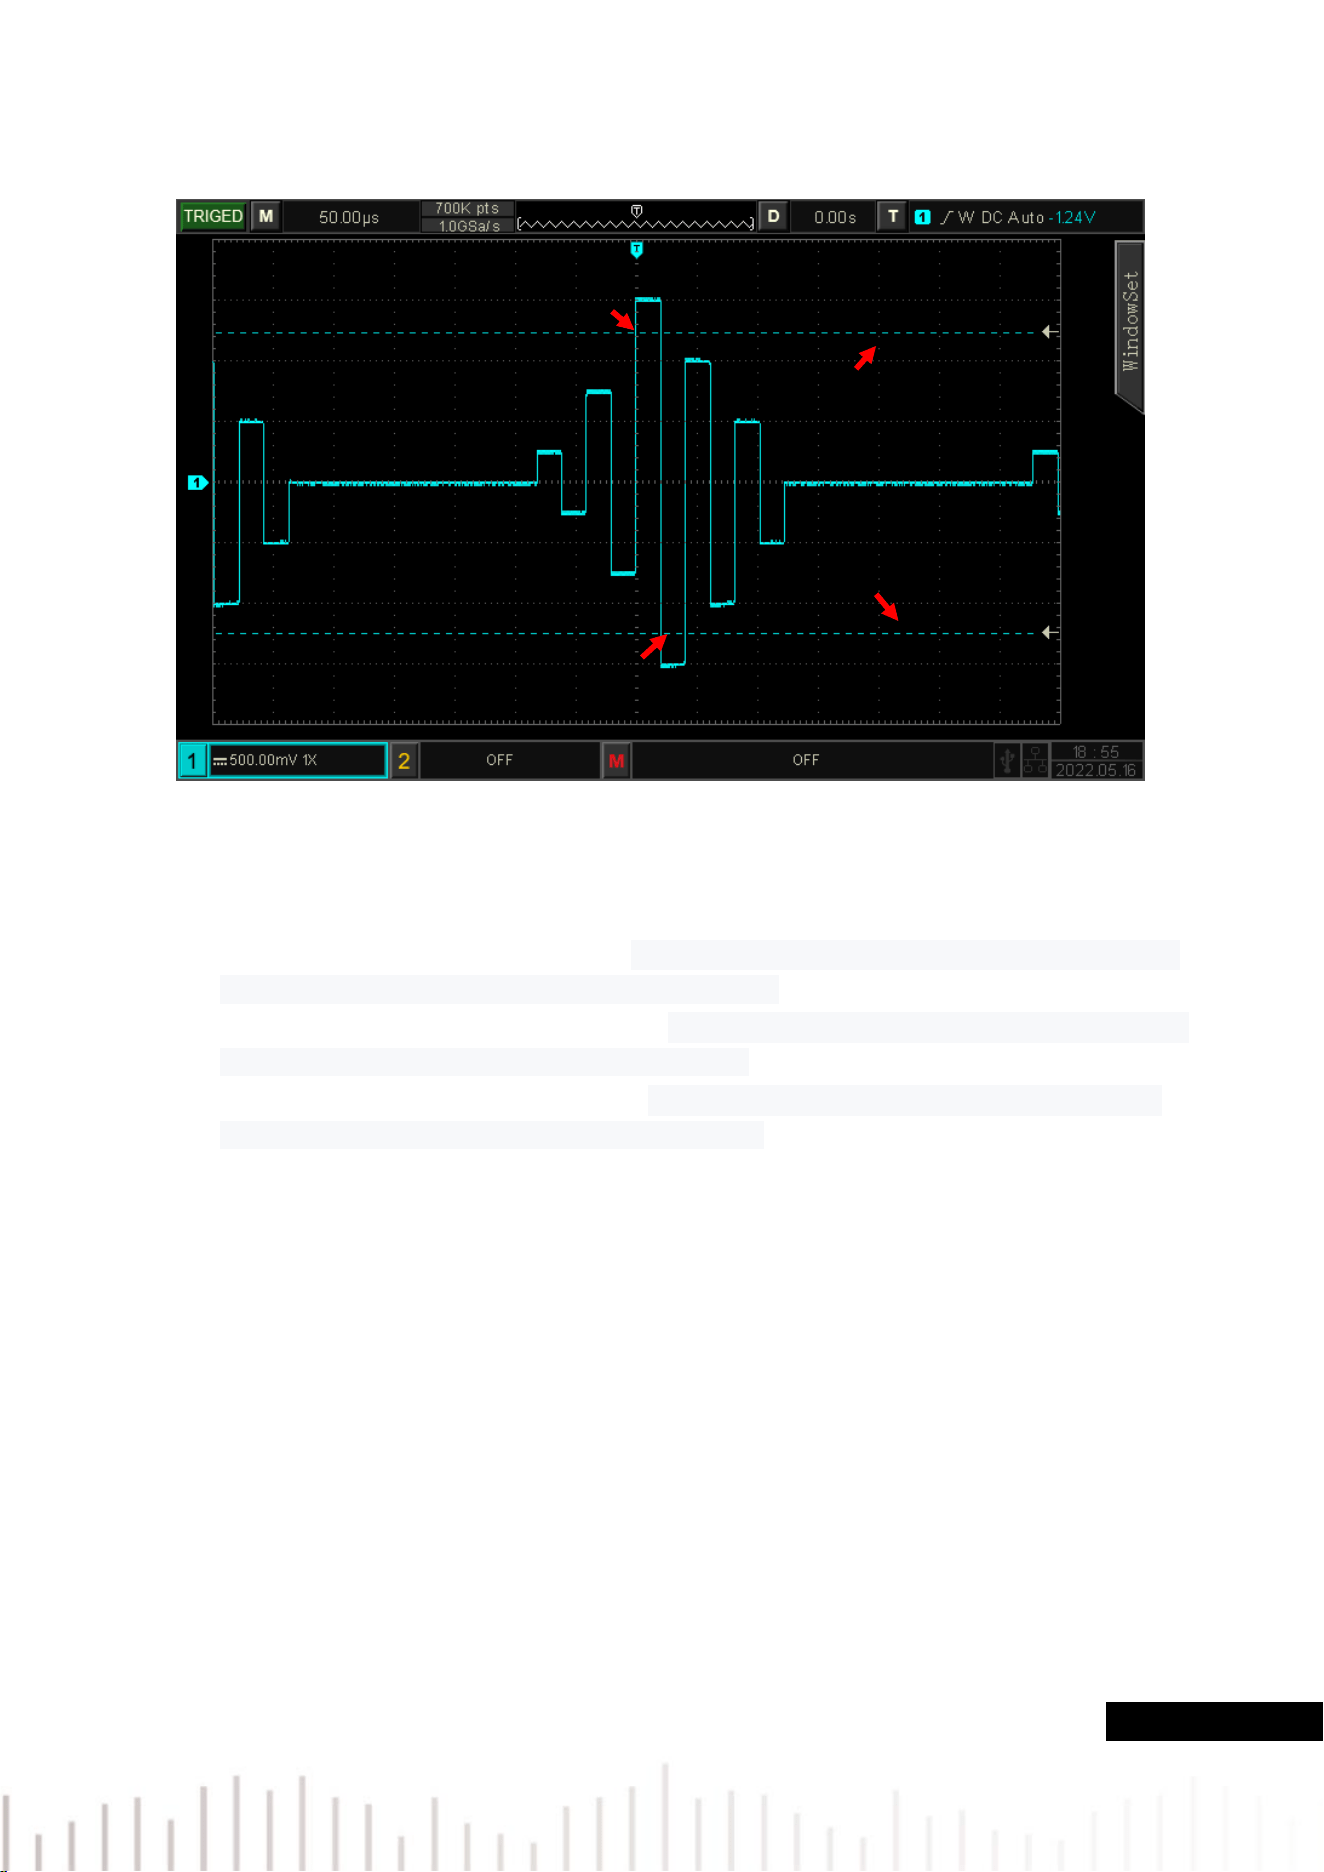
7.7 Over-Amplitude Pulse Trigger
Trigger level of over-amplitude has a high level and a low level, when the rising edge of the input signal
crosses the high level or the falling edge crosses the low level, the oscilloscope will be triggered, as
shown in Figure 7-4. Over-amplitude pulse trigger menu can set to source, coupling mode, trigger mode,
slope (rising edge, falling edge, random edge), position (enter, exit, time), setting, trigger level, etc.
Negative runt amplitude
Positive runt amplitude
Trigger level-high level
Trigger level-low level
40 / 99
Figure 7-4
(1) Slope
Select which edge that the input signal can be triggered. It can select rising edge, falling edge or
random edge. The current slope is displayed in the upper right corner of the screen.
a. Rising edge:It will be generated when the trigger on the rising edge of the input signal and
the voltage level is higher than the setting high level.
b. Falling edge:It will be generated when the trigger on the falling edge of the input signal and
the voltage level is lower than the setting low level.
c. Random edge:It will be generated when the trigger on the rising/falling edge of the input
signal and the voltage level is within the setting level.
(2) Trigger Position
Trigger position can set enter, exit and time. Select trigger position to confirm the timing of trigger.
a. Enter:It will be generated when the input signal enter the specified trigger level.
b. Exit:It will be generated when the input signal exit the specified trigger level.
c. Time:It will be generated when the over-amplitude entered, accumulated hold time is greater
than or equal to the preset over-amplitude time
(3) Setting
When trigger position is set to “Time”, the setting time takes effect and is triggered when condition
is met. The range can be set to8ns ~ 10s.
rising edge
falling edge
Trigger level-high level
Trigger level-low level
平

41 / 99
7.8 Delay Trigger
Delay trigger should set trigger source 1 and trigger source 2. When the time difference (△T) between
the edge set by source 1 (edge 1) and the edge set by source 2 (edge 2) meets the preset time limit, the
oscilloscope is triggered, as shown in Figure 7-5.
Figure 7-5
Edge 1 set as rising edge, edge 2 also set as rising edge. △T is the area marked by red color, as shown
in Figure 7-5.
Note:Edge 1 and edge 2 must be adjacent edges.
Note:Only the channel that has been connected to the signal, select it as the trigger source that can get
the stable trigger.
(1) Condition
Set delay condition to >, <, <>, ≤≥, >< .
a. >:It will be generated when the time difference (△T) between the edge of source 1 and the
edge of source 2 is greater than the setting lower limit of time, it can set the lower limit of time.
b. <:It will be generated when the time difference (△T) between the edge of source 1 and the
edge of source 2 is smaller than the setting upper limit of time, it can set the upper limit of
time.
c. ≤≥:It will be generated when the time difference (△T) between the edge of source 1 and
the edge of source 2 is greater than the setting lower limit of time and smaller than the setting
upper limit of time, it can set the upper limit and lower limit of time.
d. > <( irrelevance):It will be generated when the time difference (△T) between the edge of
source 1 and the edge of source 2 is smaller than the setting lower limit of time or greater than
the setting upper limit of time. It can set the upper limit and lower limit of time.
△T

42 / 99
(2) The upper/lower limit of time
Compare the setting time value with △T, it will be triggered when the condition is met. The range can
be set 8ns ~ 10s.
7.9 Time-out Trigger
Timeout trigger can generate the signal when the time interval (△T) from the rising edge (or falling edge)
of the input signal to adjacent falling edge (rising edge) across the trigger level is greater than the set
timeout time. As shown in Figure 7-6.
Figure 7-6
(1) Slope
Select which edge that the input signal can be triggered. It can select rising edge, falling edge,
random rising. The current slope is displayed in the upper right corner of the screen.
a. Rising edge:Set the timer to start when the rising edge of the input signal through the trigger
level.
b. Falling edge:Set the timer to start when the falling edge of the input signal through the
trigger level.
c. Random edge:Set the timer to start when the rising edge or the falling edge of the input
signal through the trigger level.
(2) Timeout
Compare timeout with △T, it will be triggered when the condition is met. The range can be set 8ns
~ 10s.

43 / 99
7.10 Duration Trigger
With duration trigger selected, the oscilloscope identifies the trigger condition by looking for the duration
of the specified codes. The codes are the combination of channel logic "AND", and the value of each
channel can be H (high), L (low), or X (ignored). When the duration (△T) of the code meets a preset time,
it will be generated, as shown in Figure 7-7.
Figure 7-7
(1) Code
It has three modes H, L and X. The code setting of each channel is displayed at the bottom of the
screen, as shown in Figure 7-7.
a. H:Set the code value of the selected channel to "High", that is, the voltage level is higher than
the trigger level of the channel.
b. L:Set the code value of the selected channel to "Low", that is, the voltage level is lower than
the trigger level of the channel.
c. X:Set the code value of the selected channel to "Ignored", that is, the channel is not part of the
codes. The oscilloscope will not trigger if all channels in the codes are set to "ignored".
(2) Condition
Press the condition key to select: >, <. ≤≥.
a. >:It will be generated when the code duration is greater than the setting time, it can set the
lower limit of time.
b. <:It will be generated when the code duration is small than the setting time, it can set the
upper limit of time.
△T

44 / 99
c. ≤≥:It will be generated when the code duration is small than the setting upper time limit and
greater than the setting lower time limit, it can set the upper limit and the lower limit of time.
(3) The upper/lower limit of time
Compare the duration time with the setting time of △T, it will be triggered when the condition is
met. The range can be set to 8ns ~ 10s.
7.11 Setup/Hold Trigger
In setup/hold trigger, the oscilloscope need to set up the data signal line and clock signal line. The setup
time begins when the data signal crosses the trigger level and ends when the specified clock edge arrives.
The hold time begins when the specified clock edge arrives and ends when the data signal crosses the
trigger level again (as shown in Figure 7-8). The oscilloscope will trigger when the setup time or the hold
time is less than the preset time. It is mainly used to locate and find error code, and quickly find the signal
that cannot meet setup hold time.
Figure 7-8
(1) Pattern
It has two modes H and L.
a. H:Set the valid code of the data signal to high level.
b. L:Set the valid code of the data signal to low level.
(2) Clock edge
Select the clock edge type: rising edge and falling edge.
a. Rising edge: Set the clock edge type to rising edge.
b. Falling edge: Set the clock edge type to falling edge.
data source
clock source
Data code type: H
Edge type: rising
edge
△1 is Setup time
△2 is Hold time
△1
△2

45 / 99
(3) Setup/Hold
It has three modes setup, hold, setup & hold.
a. Setup:It will be generated when the setup time is small than the setting value.
b. Hold:It will be generated when the setup time is small than the setting value.
c. Setup & hold:It will be generated when the setup time and the hold time are all small than the
set value.
(4) Time
Compare the setup, hold time of code with the setting time of △T, it will be triggered when the
condition is met. The range can be set 8ns ~ 10s.
7.12 Nth Edge Trigger
The Nth edge trigger is triggered on the Nth edge after the specified idle time. For example, as shown in
Figure 7-9, it is set to trigger on the 2nd rising edge after the specified idle time (the time between two
adjacent rising edge), then set the idle time as P< idle time <M, M is the time between the 1st rising
edge and the next rising edge, P is the maximum time between the counting rising edge.
Figure 7-9
(1) Slope
Select which edge that the input signal can be triggered. It can select rising edge, falling edge. The
current slope is displayed in the upper right corner of the screen.
a. Rising edge: Set to trigger on the rising edge of the signal.
b. Falling edge: Set to trigger on the falling edge of the signal.
M
P
P<idle time<M

46 / 99
(2) Idle Time
Compare the idle time with pulse time, it will be triggered when the condition is met. The range can
be set 8ns ~ 10s.
(3) Edge Value
The edge value is triggered at the edge of the pulse string. The edge value can be set by using
multipurpose knob, shuttle knob and numeric keypad. The edge value range can be set 1 to 65535.
7.13 Pattern Trigger
The pattern trigger identifies the trigger condition by looking for the specified patterns. The pattern trigger
type is the combination of the channel logic "AND", each channel can be set to H (high), L (low), X
(ignored). You can also specify a channel in the type as a rising edge or falling edge (only one edge can
be specified). When the edge is assigned, if the pattern of the other channels are judged "true" (i.e., the
actual code is consistent with the preset code type), the oscilloscope will trigger on the specified edge. If
the edge is not assigned, the oscilloscope will trigger at the last edge of the code type "true". If the pattern
of all channels are set to "ignore", the oscilloscope will not be triggered.
(1) Pattern
There are H, L, X, rising edge, or falling edge. The pattern setting of each channel is displayed at the
bottom of the screen.
a. H:Set the pattern value of the selected channel to “High”, that is, the voltage level is higher
than the trigger level of the channel.
b. L:Set the pattern value of the selected channel to “Low”, that is, the voltage level is lower than
the trigger level of the channel.
c. X:Set the pattern value of the selected channel to “Ignored”, that is, the channel is not part of
the pattern. The oscilloscope will not be triggered if all channels in the pattern are set to “ignored”.
d. Rising edge: Set the pattern to the rising edge of the selected channel.
e. Falling edge: Set the pattern to the falling edge of the selected channel.
7.14 RS232 Trigger
RS232 interface is an asynchronous transmission standard interface developed by the Electronics
Industry Association. It is usually available in DB-9 or DB-25 applications. It is suitable for communication
with data transmission rate in the range of 0~25000000b/s and is widely used in microcomputer
communication interface. The data to be sent is combined into a specific set of serial bits according to
the protocol rules and sent in an asynchronous serial.

47 / 99
The data sent each time is according to the following rules: send one start bit firstly, then 5 to 8 is data
bits, the next is optional parity bits, and the last is one or two stop bits. The number of data bits is agreed
upon by the two communicating parties and can be 5 to 8 bits, no parity bits, or select odd or even parity.
Stop bit can select one or two bits. In the following description, one data string transmission is referred to
as one frame, as shown in figure below,
(1) Information Source
The information source which is trigger source, CH1 and CH2 can be selected. The current selected
source will displayed in the upper right corner of the screen.
Note: Only the channel that has been connected to the signal, select it as the trigger source that can
get the stable trigger and correct decoding.
(2) Baud Rate
When RS232 is asynchronous transmission communication, there is no accompanying clock signal
during data transmission. In order to solve the determination of data bits, the protocol stipulates that
both parties of communication should agree on the bit rate. Usually, the bit rate is defined as the
number of bits that can be transmitted in 1s. For example, 9600 bps means 9600 bits can be
transmitted in 1s. Note that the start, data, parity and stop bits are all counted as bit, so the baud rate
does not directly equal the effective data rate. The oscilloscope will sample the bit values according
to the setting baud rate.
Baud rate can choose 2400 bps, 4800 bps, 9600 bps, 19200 bps, 38400 bps, 57600 bps, 115200
bps, 128000 bps, 230400 bps, 460800 bps, 921600 bps, 1382400 bps, 1843200 bps, 2764800 bps
and user-defined. The baud rate can be adjusted via the Multipurpose knob or jog dial when user-
defined is selected.
It is recommended to set the baud rate based on the hardware and software of RS232
communication protocol. Due to the basic model of this transmission protocol, RS232 protocol is
usually used for short distance (under 20m) and low speed (under 1 Mbps) transmission.
Communication beyond this range is susceptible interference and unreliable.

48 / 99
(3) Polarity
Press the Polarity key to select the trigger polarity: positive and negative polarity.
a. Negative polarity: opposite logic level polarity, i.e. high level is 0 and low level is 1.
b. Positive polarity: normal logic level polarity, i.e. high level is 1, low level is 0.
(4) Bit Width
Specify the data bit width of RS232 protocol signal to be decoded, 5 bits, 6 its, 7 bits, 8 bits can be
selected.
(5) Bit Order
Specify whether the data bits of the RS232 protocol signal to be decoded are high bit first (MSB) or
low bit first (LSB), and either MSB or LSB can be selected.
a. MSB: The high bit of data is transmitted first.
b. LSB: Data low bit is transmitted first.
(6) Stop Bit
The stop bit is the bit that sets the stop after each data frame. It can be set to 1 bit or 2 bits.
(7) Parity
Set the parity mode of data transmission. It can select no parity, even parity or odd parity.
(8) Trigger Condition
The trigger condition is to set the trigger condition, it can choose start frame, error frame, parity error
and data.
a. Start frame: Waveform triggering at the start bit of RS232 protocol. When send a single string or
send the same string several times, this trigger can be used to see a stable signal waveform, and
if the sent data changes, the corresponding waveform will also be change.
b. Error frame: When receiving 0 in the stop state or data error occurs in the middle of data bits.
c. Parity error: RS232 protocol sets the parity bit to 0 or 1 according to the parity rule when there is
a parity bit setting.
The parity rule is as follows.
Odd parity: If in data bits and parity bits, number of bit 1 is odd, then the transmission is correct.
Even Check: If in data bits and parity bits, number of bit 1 is even, then the transmission is correct.
Using this option, user can check the RS232 communication process and quickly find the
transmission process of parity error, so that you can easily locate the fault analysis.
d. Data: The trigger is generated when the data acquired by the oscilloscope is the same as the 2-
bit hexadecimal number set by the user. Using this option, user can quickly find the transmission
signal of the specific data you are interested in.
(9) Data
It will be valid when the trigger condition is "Data", settable range: 00 ~ FF (hexadecimal number).
49 / 99
7.15 I
2
C Trigger
I
2
C trigger usually used to connecting microcontroller and peripheral equipment, it’s widely applied in
micro-electronics area. This bus protocol has two lines to transmit, one line is serial data SDA, and
another line is serial clock SCL. Communicated by master-slave system which can both-way
communication between master and slave computer. The bus is a multiple master bus that prevents data
corruption through conflict detection and arbitration mechanisms. It is worth noting that the I
2
C bus has
two address bit widths, 7 bits and 10 bits, where 10 bits and 7 bits addresses are compatible that can be
used in combination. When the bus is idle, both lines are high level. When any device on the bus output
low level, it will make the bus signal goes low, i.e., the signals of multiple devices are " wired and" logic.
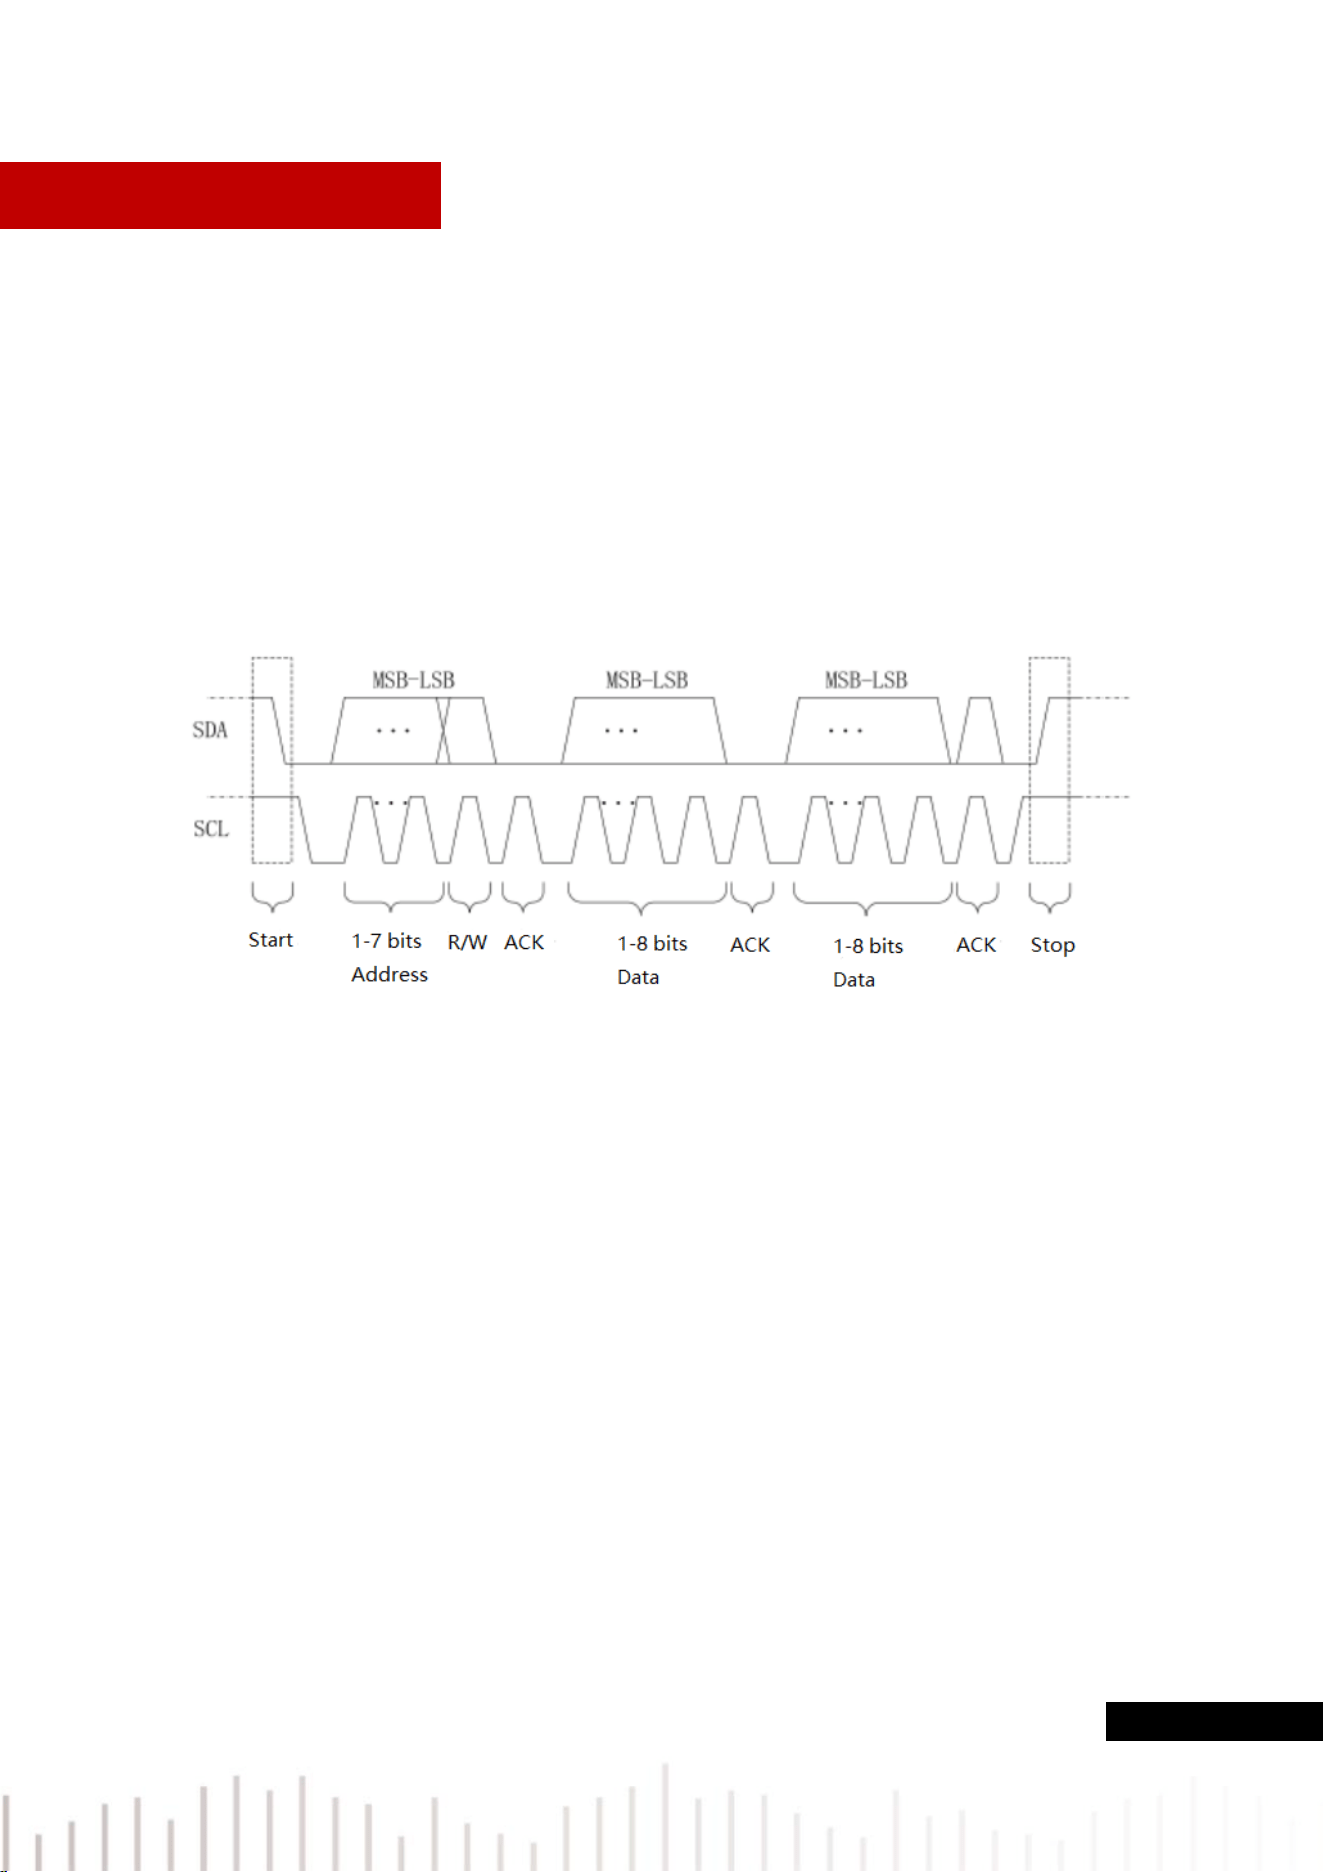
This special logic relation is the key to bus arbitration. The protocol requires that the data SDA must
remain stable while the clock line SCL is high, and the data is usually transmitted in MSB form. This is
shown in the following diagram.
I
2
C trigger can set SCL source, SDA source, operating direction, trigger condition, address setting and
data setting.
(1) SCL Source
When SCL source is selected, it can set either CH1 or CH2 as the clock input of I
2
C.
(2) SDA Source
When SCL source is selected, it can set either CH1 or CH2 as the data input of I
2
C.
(3) Operating Direction
It can set to “write, read or random”
a. Write: It will be generated when the “read/write” bit of the I
2
C protocol is “write”.
b. Read: It will be generated when the “read/write” bit of the I
2
C protocol is “read”.
c. Random: It will be generated the “read/write” bit of the I
2
C protocol is “read or write”.

50 / 99
(4) Trigger Condition
It can set the I
2
C trigger condition to start, restart, stop, loss confirmed, address, data and address
data.
a. Start: It will be generated at the start time, that is, when the SCL is in high level, the SDA signal
has a falling edge.
b. Restart: It will be generated at the restarting time, that is, after a start signal, and before it stops,
the start signal appears again.
c. Stop: It will be generated when the stop bit occurs, that is, when the SCL is in high level, the
SDA signal jumps from low to high.
d. Loss Confirmed: In I
2
C protocol, every time after 8 bits of information are transmitted, the data
receiver needs to send an acknowledgement signal, which is the ACK bit in the above figure
when the SCL is in high level, the SDA signal is low. The loss trigger will occur while the SCL
and SDA signal at the ACK bit are both high.
e. Address: It will be generated when the communication address is the same with the user setting
address. It can help to quickly locate the address transmission.
f. Data: It will be generated when the detected data is equal to/ greater than/ less than/ not equal
to the setting value. This feature is convenient for the data analysis and can capture the
abnormal data.
g. Address & Data: It will be generated when the addresses are the same and the data relationship
meets the setting conditions during the transmission process. This trigger condition makes it
easy to implement the I
2
C specified address and data trigger, and help to analyze the
transmission.
(5) Address Setting
a. Address Bit Wide
When the trigger condition is select “address” or “address data”, it should set the address bit wide
to 7bits or 10bits.
b. Address
It will be valid when the trigger condition is “address” or “address data”, the range can set to 00
~ 3FF (hexadecimal number).
(6) Data Setting
a. Length of Byte
It will be valid when the trigger condition is “address” or “address data”, it can set the specific length
of byte, the range can be 1~5.
b. Data
It will be valid when the trigger condition is “address” or “address data”, the range can set to
00~FFFFFFFFFF (hexadecimal number). Press multipurpose knob to set the data.
c. Data Mask
It can set the data mask value.

51 / 99
7.16 SPI Trigger
SPI (serial peripheral interface) can connect the host with peripheral equipment in serial way to
communication. It’s full duplex and synchronous communication bus. It’s usually use 4 signal connecting
line, MOSI: master data output, slave data input; MISO: master input, slave data output; SCLK: clock
signal generated by master; CS: chip select enable signal from slave.
SPI interface is mainly used for synchronous serial data transfer between the host and low-speed
peripheral equipment. Under the shift pulse of the host, the data is transferred bit by bit, the high bit in
front and behind is the low bit. SPI interface is widely used because it does not require slave address
addressing, which is full duplex communication and the protocol is simple. SPI protocol transfer is shown
in the following figure,
(1) SCL Source
When SCL source is selected, it can set either CH1 or CH2 as the clock input of SPI decoding signal.
(2) MOSI Source
When MOSI source is selected, it can set either CH1 or CH2 as MOSI input of SPI decoding signal.
(3) MISO Source
When MISO source selected, it can set either CH1 or CH2 as MISO input of SPI decoding signal.
(4) SCLK Polarity
SCLK edge, set the edge of clock signal: rising edge, falling edge.
a. Rising edge: triggered on the rising edge of the clock signal.
b. Falling edge: triggered on the falling edge of the clock signal.
(5) MOSI Polarity
It can set MOSI polarity of data signal: positive / negative polarity.
a. Positive: It is 1 when setting signal is greater than the threshold, otherwise it is 0.
b. Negative: It is 1 when setting signal is small than the threshold, otherwise it is 0.
(6) MISO Polarity
It can set MISO polarity of data signal: positive / negative polarity.

52 / 99
a. Positive: It is 1 when setting signal is greater than the threshold, otherwise it is 0.
b. Negative: It is 1 when setting signal is small than the threshold, otherwise it is 0.
(7) Bit Sequence
Bit sequence is to set whether the data bit of the SPI protocol signal is high order first (MSB) or low
order first (LSB).
a. MSB: high order data transmit first
B. LSB: low order data transmit first
(8) Bit Wide
Set bit wide of each frame of the SPI protocol signal, which can range from 4 to 32.
(9) Trigger Condition
Set SPI condition which has two types: “idle & data” and “idle”.
a. Idle & data:It will be generated at the edge where the level jumps from invalid to active.
b. Idle:Idle trigger is generated at the start of a new segment of data after a certain idle time
(10) Idle time
The idle time counter counts when the SCK is unchanged, and judges whether the count value
exceeds the preset value at the SCK valid edge, if it exceeds, it will be generated at the valid edge.
The counter will be cleared when each clock edge is valid. The range can set to 80ns ~ 1s.
(11) Frame Length
Set the length of data unit, the range can set from 1 to 32.
(12) MOSI Data
MOSI data setting is related to frame length, the range can set to 0 ~
FFFFFFFFFFFFFFFFFFFFFFFFFFFFFFFF.
7.17 CAN Trigger
(1) Information Source
The information source which is select CAN protocol trigger source, CH1 and CH2 can be selected.
The current selected source will displayed in the upper right corner of the screen.
(2) Signal Type
Set the input signal of the current source whether is high data line signal or low data line signal,
which can select CAN_H and CAN_L.
(3) Trigger Condition

53 / 99
It can set the CAN trigger condition to start frame, data frame, remote frame, error frame, overload
frame, identifier, data, ID and data, end of frame, loss confirmed and bit stuff error.
a. Start Frame: the oscilloscope will generate waveform trigger on start frame.
b. Data Frame:the oscilloscope will be generate on data frame match with CAN signal.
c. Remote Frame:it will be generated on remote frame.
d. Error Frame:the oscilloscope will be generated on error frame of CAN signal.
e. Overload Frame:the oscilloscope will be generated on overload frame of CAN signal.
f. Identifier:the oscilloscope will be generated on data frame that matches the specified ID.
g. Data:the oscilloscope will be generated on data frame that matches the specified ID. //(data frame
and remote frame have ID, data frame has data, remote frame has no data.)
h. ID and Data:the oscilloscope will be generated on data frame that matches the specified ID.
i. End of Frame:it will be generated on the end of frame of CAN signal.
j. Loss Confirmed:it will be generated on loss confirmed of CAN signal.
k. Bit stuff error:in the segment that requires bit filling, the waveform will be triggered when continuous
detect the error from the same level of 6 bits.
(4) ID Setting
It can be set when trigger condition is “Identifier” or “ID and data”, it can set frame format, ID and
direction.
a. Frame Format: it can set “standard format, extension format”, ID value range of different frame
format is different.
b. ID: set the ID value, which can set to 000~7FF, 00000000~1FFFFFFF.
c. Direction:
Write: It will be generated when the “read/write” bit of the CAN protocol is “write”.
Read: It will be generated when the “read/write” bit of the CAN protocol is “read”.
Write or Read: It will be generated the “read/write” bit of the CAN protocol is “write or read”.
(5) Data Setting
It can be set when trigger condition is “data” or “ID and data”, it can set length of byte and data.
a. Length of byte: set the byte number of data to be triggered, which can set to 1~8.
b. Data: set the data to be triggered, the settable data byte is related with byte value, which can set
to 00~FFFFFFFFFFFFFFFF.
(6) Bit Rate (bps)
Select the bit rate of CAN bus serial data, which can set to 10k, 20k, 25k, 31.25k, 3.3k, 37k, 50k,
62.5k, 68.266k, 83.3k, 92.238k, 100k, 125k, 153k, 250k, 400k, 500k, 800k, 1M and user-defined.
User-defined can input custom bit rate value.

54 / 99
7.18 LIN Trigger
(1) Information Source
The information source which is select CAN protocol trigger source, CH1 and CH2 can be selected.
The current selected source will displayed in the upper right corner of the screen.
(2) Polarity
Set the polarity if input signal, which can set to normal (high=1), reverse (high=0).
(3) Version
Version can set to v1.x, v2.x and random.
(4) Bit Rate
Set the bit rate of LIN protocol, which can set to 1.2k, 2.4k, 4.8k, 9.6k, 10.417k, 19.2k and user-
defined. User-defined can input custom bit rate value.
(5) ID include parity bit
It can set to yes or no. when “yes” is selected, the parity bit and ID is included; “no” is not include.
(6) Trigger Condition
It can set the LIN trigger condition to synchronization, identifier, data, ID and data, wake-up frame,
sleep frame and error.
a. Synchronization: the oscilloscope will be generated when detect the synchronizing signal.
b. Identifier:the oscilloscope will be generated when detect ID is equal to the setting frame.
c. Data: Waveform will be generated when the sampled data by LIN protocol is in accord with user
setting data. It can help to find the specific data of transmission signal quickly that interest to user.
d. ID and Data: the oscilloscope will be generated when detect ID is equal to the setting frame.
e. Wake-up Frame: the oscilloscope will be generated on wake-up frame of signal.
f. Sleep Frame: the oscilloscope will be generated on sleep frame of signal.
g. Error Frame: the oscilloscope will be generated on error frame of LIN signal, which includes
synchronizing error, ID parity error and checksum error.
(7) ID Setting
It can be set when trigger condition is “identifier” or “ID and data”, ID can be set.
a. ID: set the ID value
When ID include parity check is set to “yes”, ID range can set to 00~FF.
When ID include parity check is set to “no”, ID range can set to 00~3F.
(8) Data Setting
It can be set when trigger condition is “Data” or “ID and data”, it can set length of byte and data.
a. Length of byte: set the byte number of data to be triggered, which can set to 1~8.
b. Data: set the data to be triggered, which can set to 00~FFFFFFFFFFFFFFFF.

55 / 99
(9) Error Setting
It can be set when trigger condition is “error”, it can set synchronization, ID parity check and
checksum.
a. Synchronization: synchronizing error
b. ID parity check: ID parity check error
c. Checksum: data check and error
(10) Setup Data Length
Set whether display the setting menu of the data length, it can set yes or no. when “yes” is selected,
the data length menu will be displayed, select “no”, the data length menu will not display.
(11) Data Length
Set the data length of LIN, which can set to 1~8, it is valid only setup data length is “yes”.
7.19 DECODE
DECODE button can set protocol decoding bus, such as bus status, display format, event list and position.
a. Bus Status: set decoding bus to on or off
b. Display Format: set the display format of decoding format, which can set to hexadecimal, decimal,
binary and ASCII.
c. Event List: the decoded data on the data line, the corresponding line number, time, data and parity
data will display in the format of a table, it’s helpful to observe the longer decoded data.
d. Vertical Position: Change the display position of bus by adjusting Multipurpose knob, which can set to
-160 ~ 160.
e. Trigger Setting: it can jump to trigger menu
Note: For I
2
C trigger, if there are signs READ and WRITE in the bus decoded data, the abbreviated R
and W are used in the bus instead.

56 / 99
8. Automatic Measurement
8.1 Parameter Measurement
8.2 Automatic Measurement Menu
8.3 All Parameters Measurement
8.4 User Defined Parameters
Automatic measurement contains all parameter automatic measurement, user-defined parameter
measurement, user-defined parameter measurement statistic, digital voltage meter, indicator and
selection indicator.

57 / 99
8.1 Parameter Measurement
UPO1000CS series oscilloscope can automatically measure 36 kinds of parameters. It includes voltage,
time and other.
① Voltage
Max:The voltage from the highest point of the waveform to GND.
Min:The voltage from the lowest point of the waveform to GND.
High:The voltage value from the flat top to GND.
Low: The voltage value from the bottom to GND.
Middle: Half of the sum of the voltage values at the top and bottom of the waveform
Pk-Pk: Peak-to-peak value, the voltage value from the highest point to the lowest point of the waveform.
Amp:Voltage from top to bottom of the waveform.
Mean:The average amplitude of the waveform in the screen.
CycMean:Average amplitude of the waveform in one period.
RMS: The effective value. The energy generated by the conversion of AC signal, it corresponds to the
DC voltage that generates equivalent energy.
CycRMS: The energy produced by the conversion of AC signal in a period, it corresponds to a DC
voltage that generates equivalent energy.
AC RMS: The RMS value is the waveform which DC component has removed.
② Time
Period: Time between two consecutive, same-polarity edges of a repetitive waveform.
Frequency: The reciprocal of the period.
Rise time: Time needed for waveform amplitude rising from 10% to 90%.
Fall time: Time needed for waveform amplitude falling from 90% to 10%.

58 / 99
Rise delay: The delay time between the two rising edges of the primary and secondary signals.
Fall delay: The delay time between the two falling edges of the primary and secondary signals.
+Width: The width of a positive pulse at 50% amplitude.
-Width: The width of a negative pulse at 50% amplitude.
FRFR:Time from the first rising edge of source 1 to the first rising edge of source 2
FRFF:Time from the first rising edge of source 1 to the first falling edge of source 2
FFFR:Time from the first falling edge of source 1 to the first rising edge of source 2
FFFF:Time from the first falling edge of source 1 to the first falling edge of source 2
FRLF:Time from the first rising edge of source 1 to the last falling edge of source 2
FRLR:Time from the first rising edge of source 1 to the last rising edge of source 2
FFLR:Time from the last falling edge of source 1 to the last rising edge of source 2
FFLF:Time from the last falling edge of source 1 to the last falling edge of source 2
③ Others
+Duty: Ratio of positive pulse width to period.
-Duty: Ratio of negative pulse width to period.
OverSht:The ratio of the difference between the maximum value and the top value of a waveform to
its amplitude.
PreSht:The ratio of the difference between the minimum value and the bottom value of a waveform
to its amplitude.
Area:The algebraic sum of the time product of voltage at all points on the screen.
CycArea:The algebraic sum of the time product of voltage at all points in a cycle of waveform.
Phase: The phase difference between the master source and the slave source.
Pulse Count: Completed rising edge number on the screen.
8.2 Automatic Measurement Menu
Press MEASURE button on the front panel to enter the automatic measurement menu.
Automatic Measurement Menu
Functions
Options
Descriptions
Main Source
CH1,CH2,MATH
Select any of CH1, CH2, MATH for automatic
parameter measurement
Slave Source
CH1,CH2,MATH
Select the second source that requires two channels for
measurement

59 / 99
All Parameter
OFF
Turn off display frame of all parameter measurement
ON
Pops up a display frame of all parameters on the waveform
display area
User-defined
A user-defined parameter selection interface pops up on the
waveform display area, adjust the Multipurpose knob to select
and press the knob to confirm to show the parameter on the
screen.
Press the user defined key again to close the user-defined
parameter choice box.
Measurement
Statistical
Analysis
OFF
Turn off measurement statistical function
Extremum
Automatic calculates and displays the current user defined
parameters, the average, maximum, and minimum.
Only enabled when user defined parameters display on the
screen.
Difference
Automatic calculates and displays the current user defined
parameters, the average, standard deviation and measurement
times.
Only enabled when user defined parameters display on the
screen.
Digital
Voltage
Meter
Digital Voltage
Meter
Turn on/off the measurement of digital voltage meter, the current
measured value will display on the top of the screen.
Source
Measuring source can set to CH1,CH2.
Mode
It can set to DC, DC RMS and AC RMS
Selection
Indicator
Press Multipurpose knob to select the parameter of selection
indicator.
Indicator
Off
Turn off the indicator function
On
Indicate the physical significance of the indicator parameter
intuitively by line
Delete
Clear all the user-defined parameter

60 / 99
8.3 All Parameters Measurement
Press MEASURE to pop out all parameter to measuring all parameters, as shown in Figure 8-1.
Figure 8-1
All parameters are always marked the same color with the current measuring channel (the main source).
When "----" is shown, it indicates that the current source has no signal input, or the measurement result
is not valid range (too large or too small).
8.4 User Defined Parameters
Press MEASURE to pop out user defined, as shown in Figure 8-2.
Figure 8-2
Rotating the Multipurpose knob to select parameter and press the knob to confirm. For every selected
parameter, a * symbol will appear in front of the parameter. The user defined parameter will display on
the bottom of the screen, it can measuring 5 parameters at the same time.
User can select difference value, extremum to measuring statistic the user-defined parameters.


62 / 99
9.1 Time Measurement
Press the CURSOR button to enter the cursor measurement menu, select enable, type, source, mode,
transparence to measuring time, as shown in Figure 9-1.
Figure 9-1
The upper left corner of the display area shows the cursor measurement information:
“X” indicates the time measurement, and “Y” indicates the voltage measurement. Press
Multipurpose knob to adjusting the horizontal position of A, B to achieve time measurement.
9.2 Voltage Measurement
Voltage measurement is the same as time measurement, the difference is the vertical cursor of time
measurement change to horizontal cursor.
Press the CURSOR button to enter the cursor measurement menu, select voltage, source, mode,
transparence to measuring voltage, as shown in Figure 9-2
Figure 9-2
The upper left corner of the display area shows the cursor measurement information: Y presents the
result of voltage measurement, Press Multipurpose knob to adjusting the vertical position of A, B to
achieve the voltage measurement.


64 / 99
10.1 Sampling Rate
(1) Sampling and Sampling Rate
Sampling is the oscilloscope sample the input analog signal and then convert it to digital data.
Gathering the digital data to waveform record and stored in memory.
Analog Signal Sampling Points
Sampling rate refers to the time interval between two sampling points. The maximum sampling rate of
the UPO1000CS series is 1 GS/s.
The sampling rate will be affected by the timing scale and the change of storage depth. UPO1000CS
oscilloscopes sampling rate is displayed in real-time at the top of the screen in the status bar. The horizontal
SCALE knob can adjust the horizontal time base or modify the memory depth to change it.
(2) The influence of low sampling rate
① Waveform Distortion: Due to low sampling rate, the details of the waveform might be missing,
the sampling waveform might be different than the actual signal.
② Wave Mixing: When the sampling rate is 2 times lower than the actual signal frequency (Nyquist
frequency), the frequency of the reconstructed signal will be less than the actual signal frequency.
③ Waveform Leakage: Due to low sampling rate, the reconstructed waveform might not reflect the

65 / 99
actual signal.
10.2 Acquisition Mode
To obtain a waveform from sampling points, press the ACQUIREsampling mode to select acquisition
mode.
(1) Normal Sampling
The signal is sampled and reconstructed with equal time intervals. For most waveforms, this mode
can perform the best display.
(2) Peak Sampling
The maximum and minimum values of the input signal are found at each sampling interval, and the
waveform is displayed these values. The oscilloscope can acquire and display a narrow pulse,
otherwise the narrow pulse might be missed in the normal mode. Noise might be enlarged in this
mode.
(3) High Resolution
The oscilloscope will averages the adjacent points of the sampled waveform and reduce random
noise from the input signal and generate smoother waveforms.
(4) Average
The oscilloscope obtains several waveforms to take the average, and display the final waveform.
This method can reduce random noise.
By changing the acquisition mode setting to observe the waveform changes. If the signal contains
large noise, when the average mode is not adopted and when the 32 times average mode is adopted,
the sampled waveform is shown in the following figure.
Waveform when the average mode is not adopted waveform when the 32 times average mode
Note: Average and high resolution uses different average methods. The former is multiple sampling
average, the latter is single sampling.
Pulse disappear

66 / 99
10.3 Storage Depth
The storage depth is the number of waveforms that can be stored in the oscilloscope during a trigger
acquisition. It reflects the memory storage capacity of the acquisition.
The relation of storage depth, sampling rate and waveform length should meet the pattern:
storage depth = sampling rate×horizontal time base× the number of grid of horizontal direction
UPO1000CS the maximum storage depth 56 Mpts (per channel).
In ACQUIRE menu,user can freely to set the storage depth to auto, 7k, 70k, 700k, 7M, 35M,
56M.The default setting is auto.

67 / 99
11. Display System
11.1 Waveform Display Setting
DISPLAY can set the display type of waveform, XY, grid brightness, waveform brightness, duration
time, color temperature, anti-color temperature.
(1) Display Type
① Vector:This mode provides the most realistic waveform in most cases and makes it easy to
view the steep edges of the waveform (e.g. square wave).
② Point:Displays sampling points directly.
(2) Grid
Grid type can be set in the DISPLAY menu, which includes full display, grid, crosshair and frame.
(3) Grid Brightness
Rotating multipurpose knob to set the grid brightness, the default value is 40%.
(4) Waveform Brightness
Rotating multipurpose knob to set the waveform brightness, the default value is 50%.
(5) Backlight Brightness
It can set the screen backlight brightness, rotating multipurpose knob to set the brightness, the
default value is 50%.
(6) Duration Time
Duration time of waveform can be set to the minimum value, 50ms, 100ms, 200ms, 500ms, 1s, 5s,
10s, 20s, infinite afterglow, the default value is the minimum.
(7) Color Temperature
It can intuitively reflect the probability of the occurrence of waveform signals. The waveform with high
frequency is displayed in warm color, and the waveform with low frequency is displayed in cold color.
(8) Anti-color Temperature
Anti-color temperature is the opposite of color temperature function, it takes effects when the color
temperature function is enabled.
(9) Menu Display
Set the time of menu display, which can set to 5s, 10s, 20s and manual.
(10) Transparence
Turn on transparence in display menu, set the pop-up frame whether is transparence, it can set to on or off.

68 / 99
12. Storage and Callback
13. 12.1 Storage and Load Setting
14. 12.2 Waveform Storage and Load
15. 12.3 Picture Storage
16. 12.4 Print Screen
17. 12.5 Saved Path
18.
With the storage function, user can save the oscilloscope's settings, waveforms, and screen images to
the oscilloscope or external USB storage devices, and load the saved settings or waveforms anytime.
Press the STORAGE key to enter the storage function setting interface.
Note: For the external USB storage device, only supports FAT32 format, the NTFS format is not
compatible.

69 / 99
12.1 Storage and Load Setting
Table 12-1 Storage Menu Setting
Functions
Option
Descriptions
Type
Setting
Disk
Local
Press save, the setting will be saved in the oscilloscope
USB
Press save, the setting will be saved in external USB storage device
Filename
Press filename to pop out the virtual keyboard, adjusting Multipurpose knob to select
letter and numeric, the length limit is 12 characters.
Save
Performing the save setting, save the setting to the specified storage location.
Load
Loading the previously saved settings in the specified memory location, return the
oscilloscope to the previously saved setting state.
12.2 Waveform Storage and Load
Table 12-2 Waveform Storage Menu
Functions
Option
Descriptions
Type
Waveform
Source
CH1, CH2
Set which channel waveform to be saved.
Disk
Lock
Press save, the waveform will be saved in oscilloscope
USB
Press save, the waveform will be saved in external USB storage device
USB CSV
Press save, the waveform will be saved as .csv format in external USB
storage device, this format can use Excel software open on PC
Filename
Press filename to pop out the virtual keyboard, adjusting Multipurpose knob
to select letter and numeric, the length limit is 12 characters.
Save
Performing the save setting, save the setting to the specified storage
location.
After the waveform is saved, user can select the REF key to load waveform.

70 / 99
Table 12-3 REF Waveform Load Menu
Functions
Option
Descriptions
Reference
Ref-A、Ref-B
Select any of the two references to load waveforms
Disk
Local
Press REF, loading the waveform form internal of the oscilloscope
USB
Press REF, loading the waveform from external USB storage device
Load
Press REF to pop out the select file frame, adjusting Multipurpose to select file
Delete
Turn off the current REF waveform
The callback REF waveform is shown in Figure 12-1.
Figure 12-1
After the callback, the Ref waveform status will be displayed in the lower left corner, including time base
scale and amplitude scale. User can use the vertical and horizontal control knob to adjust the Ref
waveform position on the screen and the time base scale and the amplitude scale.
Remark
Only when the oscilloscope is connected to an external USB storage device, user can select
the disk as USB, and then save the settings to the USB storage device. When the USB
storage device is not connected, it will prompt “Detect USB device is failed.”

71 / 99
12.3 Picture Storage
Table 12-4 Picture storage
Function
Setting
Description
Type
Picture
Format
Original
picture
Oscilloscope screenshot is saved in the color displayed on the oscilloscope interface
Save ink
Oscilloscope screenshot will turn the dark background into light color for storage, the
purpose is saving ink to printing photos.
Grayscale
Oscilloscope screenshot will turn the color picture to grayscale picture for storage.
Save ink &
grayscale
Oscilloscope screenshot will turn the dark background into light color, color picture to
grayscale picture for storage.
Preview
Picture
On
Enter preview, turn on the saved picture in USB and display it on the screen.
Off
Exit preview
The last
Switch to the last picture in USB
The next
Switch to the next picture in USB
12.4 Print Screen
The PrtSc key can be used to store the current screen in BMP format to an external USB storage device.
The bitmap can be opened directly on the PC. This function can only be used when external USB storage
device is connected.
12.5 Saved Path
After a file or picture is saved on a USB storage device, a UNIT folder is automatically generated in the
root directory of the USB storage device. In this folder, lower-level folders are automatically generated
based on file types. The saved files are stored in these folders. The system automatically classifies files
based on their types and saves them to folders of their own types.


73 / 99
13.1 System Function Setting
(1) Automatic Calibration
Automatic calibration allows the oscilloscope to work optimally to obtain the most accurate
measurements. This function can perform at any time, especially when the ambient temperature
range reaches or exceeds 5℃. Before performing the automatic calibration operation, make sure
that the oscilloscope is operating for more than 20 minutes.
(2) System Information
System Information can view the system information of the oscilloscope, which includes
manufacturer, model number, SN code, software version number, logical version number, hardware
version number, website, website user name & password and date.
(3) Language
Language can set system language, English, simplified Chinese. By default, language display is the
current setting.
(4) Square Waveform Output
Square Output can set the output frequency of local square wave: 10Hz, 100Hz, 1kHz, 10kHz.1kHz
by default.
(5) Frequency Meter
Frequency Meter can set the state of frequency meter (on/off), when the frequency meter is enabled,
the frequency information will displayed on the top of screen. Frequency meter is the counter of
trigger event frequency in the trigger channel, display as hardware 7 digitals frequency meter.
(6) Output Selection
Output Selection can select output signal by AUX OUT port, it can select “trigger” or “pass/fail”.
Trigger: AUX OUT port outputs the trigger synchronization signal.
Pass/Fail: AUX OUT port outputs the pass/fail signal.
The default selection is “trigger”.
(7) Delete Data
Delete Data can clear the stored waveform setting file, and etc.
(8) Internet Setting
When the device is connected with available internet, IP setting can set the IP, subnet mask and
gateway of the oscilloscope.
a. Mode:manual or auto
Manual:it can set IP address and subnet maskby by manual
Auto:Only can view the IP address and submask

74 / 99
b. IP Address:IP address format is nnn.nnn.nnn.nnn,the first nnn range is from 1 to 233, the
second nnn range is from 0 to 255. It is recommended that user can consult network
administrator for an available subnet mask.
c. Submask Setting: the format is nnn.nnn.nnn.nnn, the nnn range is from 1 to 255. It is
recommended that user can consult network administrator for an available subnet mask.
(9) Time Setting
Time Setting can set the time, year, month, date, hour, minute independently by adjusting the knob
to switch the setting. After the setting, the oscilloscope will display the setting time.
(10) Boot Loading
Boot Loading can set whether to automatically set the settings before the shutdown when the
oscilloscope starts up. It can set the last setting or the default setting.
Last setting: Load all the settings before shutdown;
Default setting: restore the oscilloscope to the default factory setting after starting up.
13.2 Recording Waveform
Recording Waveform can set to record the waveform, this function includes recording setting, record,
stop and display.
(1) Recording Setting
Set the parameter of recording waveform, which includes recording interval, end of frame, playback
delay and the maximum frame
a. Recording Interval:Set the interval between each frame of the waveform recording.
b. End of Frame:The waveform recording will automatically stop recording when it reaches the
end frame.
c. Playback Delay:Set the interval time between each frame during the waveform playback.
d. Maximum Frame:Displays the maximum number of frames that can be recorded in the current
situation, it cannot be modified (The maximum number of frames will be changed by memory
depth).
(2) Record
Star to recording.
(3) Stop
Stop the recording.
(4) Playback
Playback the waveform, press the knob can stop playback. Adjusting the Multipurpose knob to skip
to the specified frame.

75 / 99
(5) Quick Recording
It can continuous to record for improving capture waveform rate; waveform will not display on the
screen when perform quick recording; it can be played only the record is finished. It can set to on or
off.
13.3 Pass/Fail Test
Pass/Fail can set the template and judgment condition to perform Pass/Fail test, which can set allow
to test, output, information source, operating, template and stop setting.
The Pass/Fail uses a template to detect whether the input signal within the range of the template
requirements. If the input signal exceeds the limited range of the template, it is judged as failed.
(1) Allow to test
Allow to test is to select whether perform test or not. On: turn on to set and perform the test; off: turn
off is not allow to perform the test.
Total Wfs presents the total frame number that has tested
Pass Wfs presents the frame number that has passed
Fail Wfs presents the frame number that has failed
(2) Output
Set which signal output by AUX port, which can set to pass or fail.
a. Fail:Set the AUX port on the back panel of the oscilloscope to output pulse when “fail” and
produce beeps.
b. Pass:Set the AUX port on the back panel of the oscilloscope to output pulses when “pass”
and produce beeps.
Note: AUX output selection needs to be switched to Pass test.
(3) Information Source
Information source is the source pass through the test, which can set to
CH1, CH2.
(4) Operating Test
After the testing template, stop setting, source setting are completed, then to set “operating”. On:
performing the pass test. Off: turn off the pass test.
(5) Stop Setting
Stop setting is to set the stop conditions for pass/fail test, and automatically stop the test when the
conditions are met.

76 / 99
Table 14-1 Condition Setting
Function
Option
Description
Stop Type
Pass Count
Set the Pass/Fail function to stop the test automatically after
it reaches the specified threshold count of pass
Fail Count
Set the Pass/Fail function to stop the test automatically after
it reaches the specified threshold count of failure
Condition
>=, <=
Set the stop condition
Threshold
Adjusting Multipurpose knob to set the threshold of stop condition
(6) Template Setting
Template setting is to set the template of pass/fail test. CH1 is used as the reference waveform to
create a template by default. If the waveform is within the template range, then the output is
successful. If the waveform exceeds the template range, then the output is failed.
Table 14-2 Template Setting
Function
Option
Description
Reference
Waveform
CH1, CH2
Specify a channel waveform in CH1~CH2 and plus the horizontal
and vertical tolerance as the conditions for creating a template
Horizontal
1~100
Adjusting Multipurpose knob to select the range of horizontal tolerance,
the default value is 5
Vertical
1~100
Adjusting Multipurpose knob to select the range of vertical tolerance,the
default value is 5
13.4 Web Access
(1) Access Local Area Network
The computer and the oscilloscope are under the same LAN. Check the IP address through the
UTILITY menu of the oscilloscope, and then the browser accesses the oscilloscope by IP: 9000 port.
Example:
Computer IP: 192.168.42.3
Oscilloscope IP: 192.168.42.12
PC browser using 192.168.42.12:9000 to access the oscilloscope
View the basic information, as shown in Figure 13-1.

77 / 99
Figure 13-1
Log in to check the instrument setting, internet setting and password setting. Web user name and
password see Utility/System Information. View waveform and control, as shown in Figure 13-2.
Figure 13-2
In Web page, click the corresponding key and knob to control the oscilloscope. In screen part of the
oscilloscope can be set multiple operating, such as
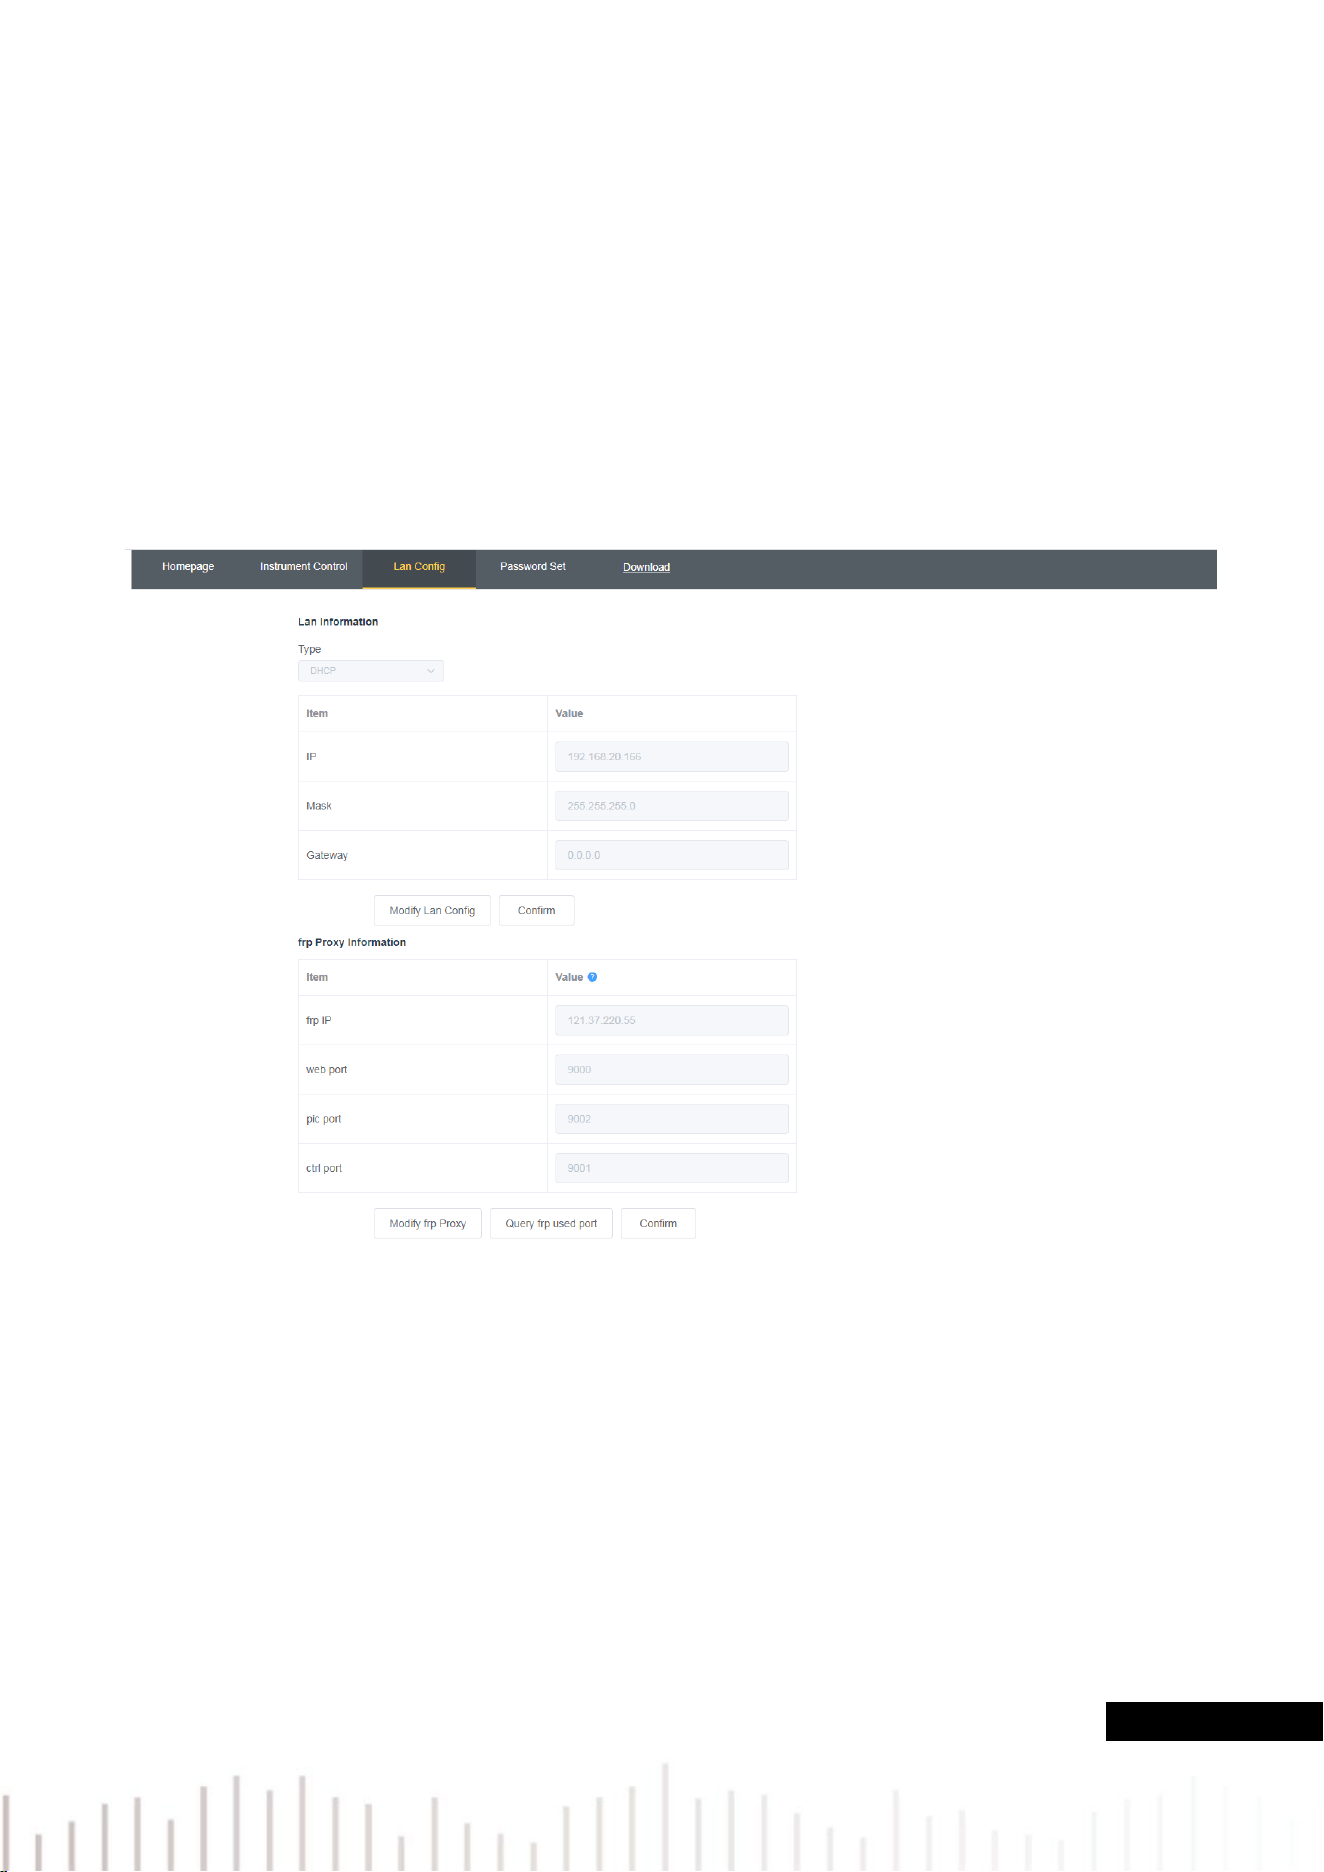
78 / 99
a. drag waveform cursor to adjust the vertical position of the waveform; drag the trigger position cursor
to adjust the trigger position.
b. click the channel to switch turn on/off the current channel
c. user mouse wheel to adjust the amplitude volts/div in the channel
d. user mouse wheel to adjust the timebase scale in timebase position (M)
e. click left/right slid in the blank to adjust the preset trigger position; click the trigger delay to move the
preset position to the center of the screen.
f. click menu to adjust the setting option directly
The internet setting information of the oscilloscope, as shown in Figure 13-3.
Figure 13-3
(2) Access Outer Network
a. Plug the network cable into the oscilloscope and the network can be access internet
b. Open frp proxy service on the server
c. Configure the oscilloscope frp proxy IP and port
d. The browser can access the proxy IP:9000 port, and the access interface LAN is consistent.
Note:
This oscilloscope uses frp intranet penetration way to achieve external network access. frp use version
is 0.34.0. This machine with frp-0.34.0 client, it need use with the server, the server needs to open frp
server, the client connects to the frp server port is 7000, so the server needs to configure bind_port =
7000

79 / 99
(3) Network Parameter Setting
a. Local area network setting
It should log in to access the internet setting of the oscilloscope, web user name and password
see see Utility/System Information. The setting interface as shown in Figure 13-4.
Figure 13-4
Internet information setting includes IP address acquisition method (dhcp/static), local IP address,
subnet mask and gateway. If IP setting is dhcp, it not need to fill in the configuration IP address, subnet
mask and gateway, click confirmation directly. If IP setting is STATIC, it should fill in the correct IP
address, subnet mask and gateway, and then click confirmation, as shown in Figure 13-5.
Figure 13-5
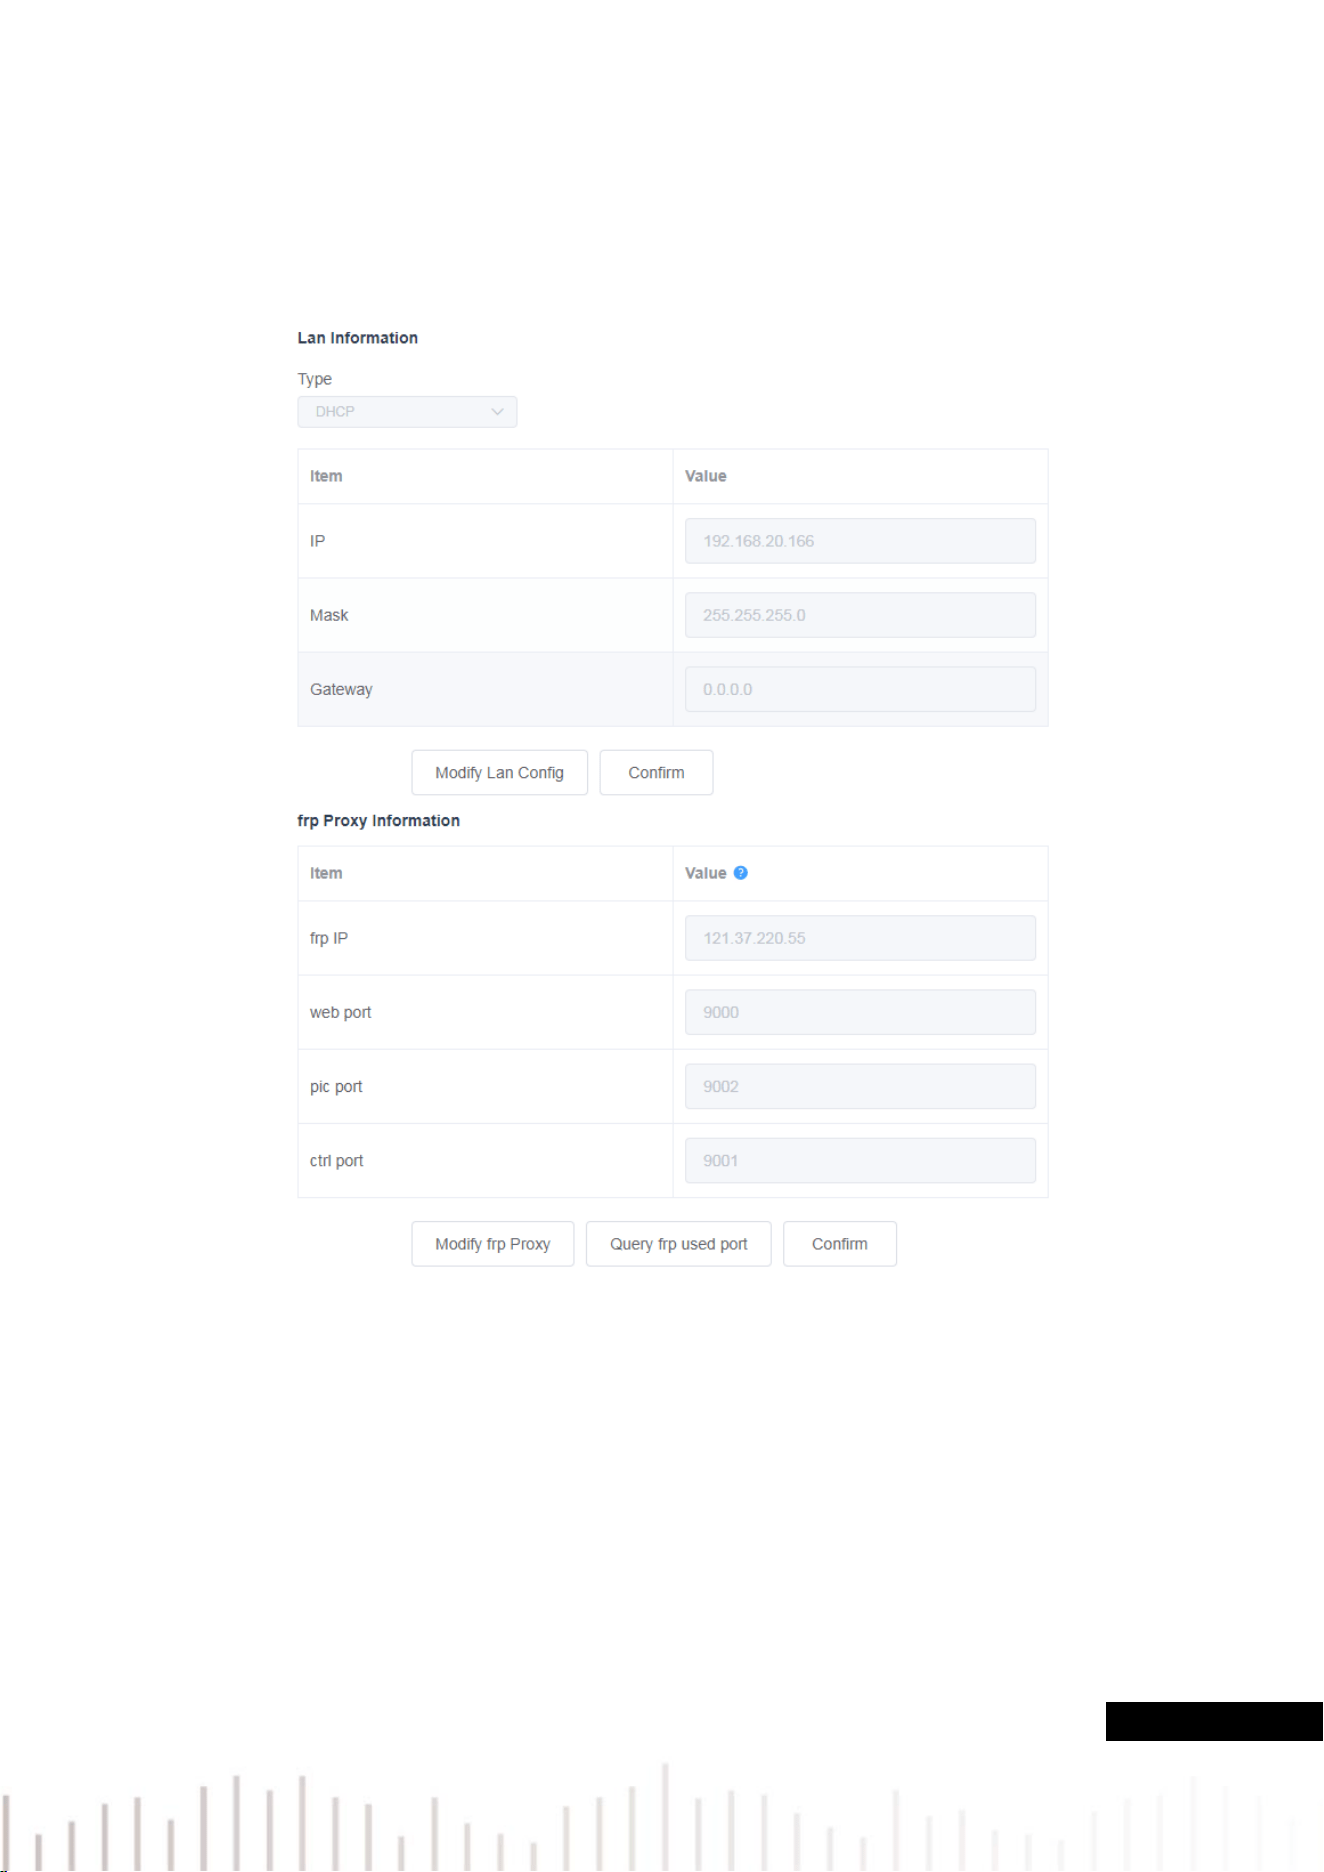
80 / 99
Click the confirmation after the input is completed, it can continuous to access according to the new
modified IP address information (in correct configuration)
b. frp proxy network information setting
The setting interface setting as shown in Figure 13-6.
Figure 13-6
frp proxy network information setting includes frp proxy network server IP address, web_port,pic_port
proxy port,ctrl_port proxy port.
Click to change frp setting,that is to edit proxy IP address, web_port,pic_port,ctrl_port,as shown
in Figure 13-7.

81 / 99
Figure 13-7
Click the confirmation after the input is completed, it can continuous to access according to the new
modified frp proxy IP address information (in correct configuration)
Note:
If each oscilloscope is connect with the same frp server, then web_port,pic_port,ctrl_port of each
oscilloscope should be consistent , otherwise frp proxy fails and cannot access.
If frp proxy is modified, it cannot access by local area network IP: 9000. If user need to recover the
normal access, press the DEFAULT button on the oscilloscope panel to reset the configuration and then
use IP: 9000 port to access.
(4) Password Setting
Password setting is for the user account to log in. After the user changes the login password, the
user needs to use the new password for the next login. If you forget the password, reset the
password by pressing the DEFAULT button on the oscilloscope panel.

82 / 99
14. Mathematical Operation
14.1 Mathematical Function
14.2 FFT
14.3 Logical Operation
14.4 Digital Filter
14.5 Advanced Operation
UPO1000CS series digital phosphor oscilloscope carries a variety of mathematical operations, it includes
math, FFT, logical operation, digital filter and advanced operation.
Enter mathematical operation menu, adjusting POSITION or SCALE knob on vertical control area to
change the vertical position and the vertical scales of the waveforms. The math operation waveforms
cannot be independent adjust the horizontal time base scale. it will change automatically according to the
horizontal time base scale of the analog input channel.
Math operation cursor marks the result of a mathematical operation.

83 / 99
14.1 Mathematical Function
Use operator“+” ,“-”,“x”,“÷” to operating the channel waveform to get the math waveform.
(1) Operator
Operator supports “+” ,“-”,“x”,“÷”.
a. +:The waveforms of source 1 and source 2 are added point by point.
b. -:The waveforms of source 1 and source 2 are subtracted point by point.
c. x:The waveforms of source 1 and source 2 are multiplied point by point.
d. ÷:The waveforms of source 1 and source 2 are divided point by point.
14.2 FFT
Using FFT (Fast Fourier Transform) mathematical operations, the time domain signal (YT) can be
converted into frequency domain signal. The following types of signals can be easily observed by using
FFT:
Harmonic content and distortion in measurement system;
Perform the noise feature in DC power supply;
Vibration Analysis;
(1) Vertical Unit
The unit of the FFT operation result can select Vrms and dBVrms. Vrms and dBVrms display the
vertical amplitude size in a linear way and decibel volts way. If the FFT spectrum need to display in
a large dynamic range, dBVrms is recommended.
(2) Frequency Range
a. Range
Start Frequency:Set the start sweep frequency of FTT.
End of Frequency:Set the end sweep frequency of FTT.
Follow:It can set ON or OFF. ON: start frequency and end of frequency will be linkage. OFF:
start frequency and end of frequency will not be linkage.
b. Bandwidth
Center Frequency:Set the center frequency of the FFT waveform and the FFT waveform will
be changed accordingly.
Frequency Bandwidth:Set the sweep frequency of bandwidth.
(3) FFT Count
Perform a data count of FFT operation, the count larger the resolution is higher, the corresponding
refresh speed will be slower. It can set to 8K, 16K, 32K, 128K, 256K, 512K and 1M.

84 / 99
(4) Window
Window function, it can select Hamming, Blackman, Rectangle and Hanning.
a. Rectangle:It has the best frequency resolution and the worst amplitude resolution, which is
similar to the one with no window. It is suitable for measuring the following waveforms:
Transient or short pulse, the signal level is almost equal to before and after.
Equal amplitude sine wave with very similar frequency.
Wide-band random noise in a slowly changing spectrum.
b. Hanning:Compared with the rectangle window, it has better frequency resolution, but poorer
amplitude resolution. It is suitable for measuring sine, periodic and narrow-band random noise
waveforms.
c. Hamming:The frequency resolution is slightly better than that of Hanning window, and it is
suitable for measuring transient or short pulse, and the waveform with great difference before
and after the signal level.
d. Blackman:It has the best amplitude resolution, and the worst frequency resolution. It is suitable
for measuring the single frequency signals or seeking higher harmonics.
(5) Display Mode
It can set to full screen, split screen and waterfall curve-1, waterfall curve-1.
a. Split screen:Display the source waveform and the waveform of FFT frequency spectrum
waveform in split screen, and extend display the spectrum.
b. Full screen:Superimposed display the source waveform and the FFT frequency spectrum
waveform in full screen. User can observe the spectrum more clearly and make more accurate
measurements.
c. Waterfall curve-1:Waveform, frequency spectrum and waterfall curve are separate display in
3 window. dB value changes with the time in frequency spectrum display on waterfall curve. It
has record function.
d. Waterfall curve-2: frequency spectrum and waterfall curve are separate display in 2 window. It
has record function, as shown in Figure 14-1.
Segment Selection: In STOP state, use Multipurpose knob to select segment and view the
frequency spectrum which corresponding to a point in time on the waterfall curve, it can record
up to 200 the frequency spectrum which correspond to waterfall curve.
Figure 14-1

85 / 99
(6) Detecting Mode
The detecting mode is to set the way to display the sampling points of the raw data after FFT
operation. The display mode can be set to normal, average, maximum hold and minimum hold.
The sampling point mode can be set to + peak, - peak, average and interval, as shown in Figure
14-2.
Figure 14-2
Display Mode
a. Normal: the spectrum waveform displays all sampled values, the corresponding spectrum
waveform is displayed in red color.
b. Average: the spectrum waveform displays the average value by sampling point in time interval,
the corresponding spectrum waveform is displayed in green color.
Average time: set the number of times of the average calculation, when the average spectrum is
enabled, the number of times can be set in the range of 2~512. The larger the number, the
smoother the average spectrum.
c. Maximum hold: the spectrum waveform displays the maximum value among the multiple
sampling data, and the corresponding spectrum waveform is displayed in blue.
d. Minimum hold: the spectrum waveform displays the minimum value among the multiple sampling
data, and the corresponding spectrum waveform is displayed in gray.
Sampling Point Mode
a. OFF: turn off the detection display
b. + Peak: take the maximum value within the range of each sampling point.
c. – Peak: take the minimum value within the range of each sampling point.
d. Average: take the average value within the range of each sampling point.
e. Interval: perform sampling in the same time interval.
Reset trace: fresh every spectrum data
Note: a detection trace must be displayed in detecting mode
(7) Spectrum Marker
To mark the point in spectrum and display frequency value and voltage value. Mark mode: off,
auto, threshold and manual. The default setting is off.

86 / 99
a. OFF: turn off the marker function
b. Auto
Marker source:Select spectrum wave as the marker source, which is the spectrum waveform
generated by different detection types under the detecting mode, it can set to real time,
average, maximum hold and minimum hold. Not open trace is gray by default.
Marker count: Set the counts to be marked, the range can set to 1~50.
Marker list:Display the information of current marker point, including point number, frequency
and voltage, which can be set to on or off, default state is off.
c. Threshold
Marker source:Select spectrum wave as the marker source, which is the spectrum waveform
generated by different detection types under the detecting mode, it can set to real time,
average, maximum hold and minimum hold. Not open trace is gray by default.
Threshold: Set the threshold value to be used as a comparison condition, and mark those
greater than the threshold value and less than the threshold value will not be marked.
Marker list:Display the information of current marker point, including point number, frequency
and voltage, which can be set to on or off, default state is off.
d. Manual: use Multipurpose knob to move marker to arbitrary point.
Marker source:Select spectrum wave as the marker source, which is the spectrum waveform
generated by different detection types under the detecting mode, it can set to real time,
average, maximum hold and minimum hold. Not open trace is gray by default.
Marker peak:Mark the peak value of the current directly.
(8) User’s Presetting
Chang the display mode to full screen by defalut. Other setting remains unchanged.
FFT Operation Tips
Signals with DC components or deviations can cause errors or deviations in the FFT waveform
components.
To reduce the DC component, the channel can be set to AC coupling.
To reduce the random noise and aliasing frequency components of the repetitive or single pulse,
user can set the oscilloscope acquisition mode to average acquisition.
14.3 Logical Operation
(1) Expression
a. AND:Performing “AND” logical operation for every point of source 1 and source 2.
b. OR:Performing “OR” logical operation for every point of source 1 and source 2.
c. NOT:Performing “NOT” logical operation for every point of source 1, source 2 will not be
displayed at this moment.
d. XOR:Performing “XOR” logical operation for every point of source 1 and source 2.
Perform logical operations for all points of the source waveform voltage and display the results.

87 / 99
During the operation, when the voltage value of source channel is greater than the threshold
value, it is determined as logic “1”, otherwise it is logic “0”. Turn waveform to the binary system
and then perform the logical operation. Four types logical operation as shown in Table 14-1.
Table 14-1
Source 1
Source 2
AND
OR
XOR
Source1
NOT
0
0
0
0
0
0
1
0
1
0
1
1
1
0
1
0
0
1
1
1
1
1
1
0
(2) Inverse
Inverse can select on or off. ON:Invert the waveform of the logical operation.
(3) Threshold 1
Adjusting the Multipurpose knob to change the value of Threshold 1. When the voltage value of the
source channel is greater than the value of Threshold 1, it is identified as logic “1”, otherwise it is
logic “0”.
(4) Threshold 2
Adjusting the Multipurpose knob to change the value of Threshold 2. When the voltage value of the
source channel is greater than the value of Threshold 2, it is identified as logic “1”, otherwise it is
logic “0”.
14.4 Digital Filter
(1) Digital Type
a. Low pass:Only signal with the source frequency lower than the current frequency upper limit
are allowed to pass.
b. High pass:Only signal with the frequency higher than the current frequency lower limit are
allowed to pass.
c. Band pass:Only signal with the frequency higher than the current frequency lower limit and
lower than the current frequency upper limit are allowed to pass.
d. Band elimination:Only signal with the frequency lower than the current frequency lower limit or
higher than the current frequency upper limit are allowed to pass.
(2) The lower limit of frequency
Adjusting the Multipurpose knob to change the value of the lower limit of frequency. When in low
pass, the lower limit of frequency is invalid and the menu is hidden.
(3) The upper limit of frequency
Adjusting the Multipurpose knob to change the value of the high limit of frequency. When in high
pass, the high limit of frequency is invalid and the menu is hidden.
Note:The setting range of the upper/lower limit of frequency is related with the current horizontal time
base.
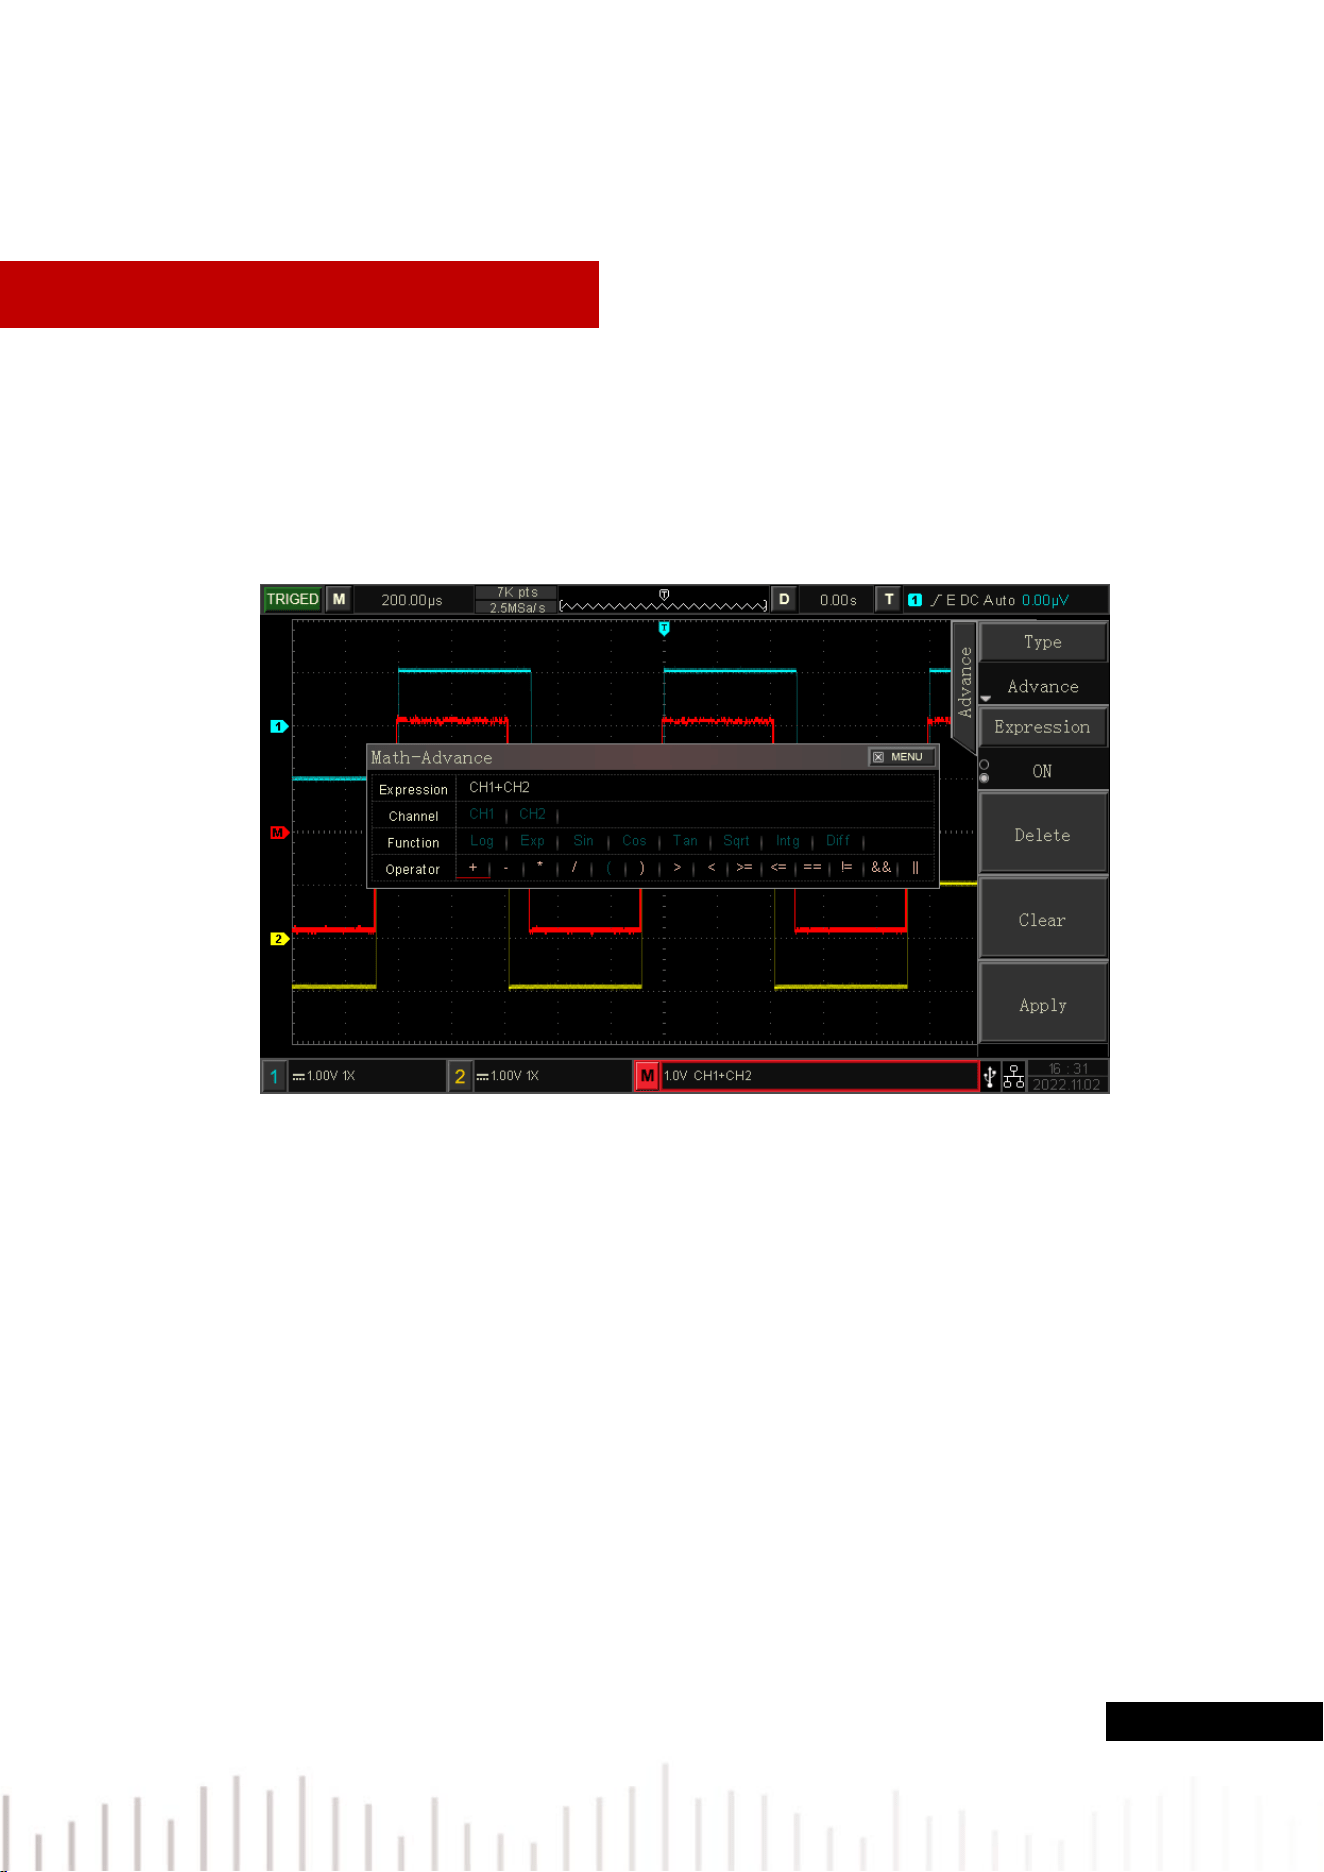
88 / 99
14.5 Advanced Operation
User can freely defined the operation of each signal of input channel to get different operation result of
MATH waveform.
(1) Expression
It can set on or off,turn on expression to pop out Math-Advance dialog box, as shown in Figure 14-
3.
Figure 14-3
Adjust the Multipurpose knob to select “Channel”, ”Function”, or ”Operator”, then press the knob to display
the options in the list after Expression.
When editing the expression, user can press the delete key to “delete", "clear" and "application" the
expression. After applying the expression, the oscilloscope performs operations according to the
expression and displays the result.
(2) Description of Math-Advance
a. Expression:Here refers to the formula consisting of channel, function, variable, and operator.
The length of the expression must not exceed 40 characters.
b. Channel:channel selection, it can select CH1,CH2.
c. Function:Function selection as shown in Table 14-2.

89 / 99
Table 14-2 Advanced Operation Function
Function Name
Description
Log
Calculates the logarithm of the selected logarithm.
Exp
Calculates the index of the selected source
Sin
Calculates the sine value of the selected source.
Cos
Calculates the cosine value of the selected source.
Tan
Calculates the tangent value of the selected source.
Sqrt
Calculates the square root of the selected source.
Intg
Calculates the integral of the selected source.
Diff
Calculates the discrete-time differential of the selected source.
d. Operator:The function of each operator as shown in Table 14-3.
Table 14-3
Function Name
Description
+、-、x、÷、^
Arithmetic operators: add, subtract, multiply, divide, index
( )
Parenthesis, it is used to increase the operation
priority within parenthesis
<、> 、>=、<=、==、 !=
Relational operators: less than, greater than, less than or equal to, greater than or
equal to, equal, not equal to.
|| 、&&
Logical operators: or, and


91 / 99
15.1 Auto Setting
Automatic settings will choose appropriate time base scale, amplitude scale and trigger parameter
according to the input signal so that the waveform will automatically display on the screen. Press the
AUTO key to enable automatic settings.
Automatic setting only applies to the following conditions:
a. Automatic setting is only suitable for simple single frequency signal. It is impossible to achieve
effective automatic setting for complex combination waves.
b. The measured signal frequency is not less than 20 Hz, and the amplitude is not less than 20 mVpp;
the duty cycle of square wave is greater than 5%.
15.2 Run/Stop
Use the RUN/STOP key on the front panel to set. When the key is pressed and the green light is on, it
indicates the RUN state, and if the red light is on after the key press, it is the STOP state.
In the running state, the oscilloscope is continuously acquiring waveform and the upper part of the screen
shows “AUTO”; in the stop state, the oscilloscope stops the acquisition and the upper part of the screen
shows “STOP”. Press the RUN/STOP key to switch the waveform sampling between the run and stop
states.
15.3 Factory Setting
Press the DEFAULT key on the front panel, the oscilloscope can quickly restore to factory setting.
UPO1000CS series digital phosphor oscilloscope factory settings are as shown in Figure 15-1.
Table 15-1
System
Function
Factory Setting
Vertical System
CH1
1V/DIV
Vertical displacement
0(vertical midpoint)
Coupling
DC
Bandwidth limitation
OFF
VOLTS/DIV
Coarse tuning
Probe
1×
Inverse
OFF
CH2
OFF
MATH, REF
OFF

92 / 99
Horizontal System
Extension window
OFF
Multi-Scopes
OFF
Horizontal time base
1μs/div
Horizontal displacement
0(horizontal midpoint)
Trigger System
Hold-off time
100.00ns
Trigger type
Edge
Source
CH1
Slope type
Rising
Coupling mode
DC
Trigger mode
Automatic
Display
Type
Vector
Format
YT
Duration time
The minimum
Grid brightness
40%
Waveform brightness
50%
Background brightness
50%
Transparence
ON
Other System
Storage type
Waveform
Frequency meter
ON
Measurement
OFF,clear all measurement
Cursor
OFF
Language
Keep the settings before shutdown
Menu display
Manual
Square wave output
1 kHz
Output selection
Trigger
Sampling mode
Normal
Storage depth
Auto


94 / 99
16.1 Description of System Prompt
This chapter is to describe the system prompt, the detailed explanation as shown in Figure 16-1.
Table 16-1
Adjusting is up to extremity!
It is prompt that the adjusting is up to extremity in the
current status. It cannot be adjust. It will be prompt when
timebase rotary knob, horizontal displacement, vertical
displacement, trigger level, trigger time is up to extremity.
Saving, please wait…
It will be prompt when save waveform and the setting file.
Loading, please wait…
It will be prompt when recall the setting file.
Storage is succeed.
It will be prompt when save waveform, the setting file,
decoding data is succeed.
Storage is failed.
It will be prompt when save waveform, the setting file,
decoding data is failed.
The setting is succeed.
It will be prompt when recall the reference waveform and
the setting file is set successfully.
The setting is failed.
It will be prompt when fail to set recall the reference
waveform and the setting file.
The factory setting is succeed.
It will be prompt when the Default function is enabled.
The signal is not detected.
It will be prompt when AUTO operating is performed but no
input signal.
In XY mode, this function is
forbidden.
It will be prompt when turn on extend window in XY mode.
In FFT mode, this function is
forbidden.
It will be prompt when opening FFT, entering waveform
recording, pass test and open the bus.
In waveform recording, this function
is forbidden.
It will be prompt when switch the storage depth in waveform
recording.
In recording, please exit the
record
!
It will be prompt when switch the extend window in
waveform recording.
Detect USB device is failed
!
It will be prompt when plug in USB, USB identify failed and
plug out when USB loading the setting file.
USB device is removed.
It will be prompt when USB is plug out.

95 / 99
In extend timebase, this function is
forbidden.
It will be prompt when turn on extend timebase and pass
test.
In Multi-Scopes, this function is
forbidden.
It will be prompt when using auto-calibration, extend
window, recording waveform, pass test, MATH, open XY
and DECODE function in Multi-Scopes.
PrintScreen is succeed.
It will be prompt when PrtSc is succeed.
PrintScreen is failed.
It will be prompt when PrtSc is failed.
Invalid expression
!
It will be prompt when expression is invalid in MATH
advanced operation.
IP address is configured succeed.
It will be prompt when IP address is configured succeed.
IP address is configured failed.
It will be prompt when IP address is configured failed.
Automatic configure IP address,
please wait…
It will be prompt when adjust IP type to DHCP.
Clearing the data, please wait…
It will be prompt when using the clear data function.
Data is successful deleted.
It will be prompt when clear data is completed.
User-defined is successful deleted.
It will be prompt when the user-defined parameter is
cleared.
The system is shutting down…
It will be prompt when the oscilloscope is shutting down.
This function is invalid when it in
STOP
!
It will be prompt when turn on/off Multi-Scopes, switch
storage depth and sampling mode, XY function in STOP
state.
Automatic setting is completed.
It will be prompt when automatic setting is completed.
Turn on reference channel
It will be prompt when select a not open channel during
creating template in Pass test mode.
Press RUN/STOP to stop the
operating.
It will be prompt when using Multiple function rotary knob to
adjust the value of chip selection in FFT-waterfall curve.
Input parameter is invalid
!
It will be prompt when input parameter via the soft keypad is
not within input range.
Channel is not open
!
It will be prompt when channel is not open, waveform
storage, vertical movement, horizontal movement, adjusting
timebase scale, adjusting volts/div scale and adjusting
trigger level.
Exceed the maximum limit
!
It will be prompt when the input character of File name
(
storage waveform, the setting file, decoding data
)
is
exceed 12.

96 / 99
No record waveform
!
It will be prompt when no recording data, play waveform,
stop the operating.
No user-defined parameter
!
It will be prompt when open measurement statistics but no
user-defined parameter.
In MultiScope, this function is
forbidden.
It will be prompt when using auto-calibration, recording
waveform and pass test in Multi-Scopes.
Keypad is locked.
It will be prompt when open the upper computer.
Keypad is unlocked.
It will be prompt when cut-off the upper computer.
Input the file name.
It will be prompt when confirm the input file name.
The file list is empty.
It will be prompt when recall the reference waveform and
the setting file, the recall list is empty.
In roll mode, this function is
forbidden.
It will be prompt when turn on extend timebase, XY,
waveform storage, recording waveform, Pass test and
MATH in ROLL mode.
In MultiScope, this function is
forbidden.
It will be prompt when using extend window, MATH, open
XY and DECODE function in Multi-Scopes.
In DHCP mode, key is not worked.
It will be prompt when confirm IP configuration in DHCP
mode.
Invalid subnet mask.
It will be prompt when the subnet mask value is out of
255.255.255.0.
Auto-calibration is failed.
It will be prompt when the auto-calibration is failed.
Auto-calibration is succeed.
It will be prompt when the auto-calibration is completed and
succeed.
Exit the recording.
It will be prompt when press RUN/STOP key during
recording waveform or the record is completed.
Recording is completed.
It will be prompt when press RUN/STOP key during
recording waveform or the record is completed.
In FFT mode, cursor is forbidden.
Please use FFT marker function.
In FFT, It will be prompt when using the CURSOR function.
In FFT split mode, this function is
forbidden.
In FFT split screen, it will be prompt when turn on XY.
Stop Pass/Fail function.
It will be prompt when the pass test is closed.
MultiScope is loading, please wait...
It will be prompt when turn on Multi-Scopes.
EXIT MultiScope, please wait…
It will be prompt when turn off Multi-Scopes.

97 / 99
18.2 Troubleshooting
(1) When press the button, the oscilloscope is blank screen.
a. Check whether the power is correctly connected, power supply is normal or not.
b. Check whether the power switch is really turned on. The soft power switch button should light in
green when the instrument is normal boot. And it should have relay sound.
c. If there is a relay sound, it indicates that the oscilloscope starts normally.
Try the following steps: press the DEFAULT key, then press F1, if device returns to normal, it
means backlight brightness is set too low.
d. After completing the above steps, restart the oscilloscope.
e. If the instrument still cannot work, please contact UNI-T.
(2) After signal acquisition, signal of waveform does not appear on the screen.
a. Check whether BNC port is connected properly.
b. Check whether the signal output channel has turned on.
c. Check whether the input signal channel has turned on.
d. Check whether has frequency displacement in signal of information source.
e. Plug out the input signal, check whether the baseline is in the screen range (if not, please
perform auto-calibration.)
f. If the instrument still cannot work, please contact UNI-T.
(3) The measured voltage amplitude value is 10 times larger or smaller than the actual value: Check the
channel probe attenuation coefficient setting is consistent with the used probe attenuation rate.
(4) There is a waveform display but not stable
a. Check the trigger source in the trigger menu and confirm that it matches the input channel of
the actual signal.
b. Check the trigger type: general signal should use “Edge” trigger. The waveform can display
stably only the proper trigger type is used.
c. Change the trigger coupling setting to high-frequency or low-frequency, in order to filter out the
high-frequency or low-frequency noise that interferes with the trigger.
(5) No display after pressing Run/Stop button
a. Check whether the mode at the trigger panel (TRIGGER) is on “Normal” or “Single” and whether
the trigger level exceeds the waveform range.
b. If it exceeds,set the trigger level to the middle or set the trigger mode to Auto.
c. Press AUTO button could automatically finish the above setting.
(6) Waveform refresh is very slow
a. Check whether the acquisition method is average and the average times are large.
b. Check whether the holdoff time is large.
c. Check whether is single trigger and the current setting is slow timebase scale.
d. The above will cause slow refreshing of the waveform. It is advised to restore the factory setting.
Waveform can be refresh normally.

98 / 99
17. Appendix
Appendix A Maintenance and Cleaning
(1) General Maintenance
Keep the instrument away from the direct sunlight.
Caution
Keep sprays, liquids and solvents away from the instrument or probe to avoid damaging the
instrument or probe.
(2) Cleaning
Check the instrument frequently according to the operating condition. Follow these steps to clean the
external surface of the instrument:
a. Please use a soft cloth to wipe the dust outside the instrument.
b. When cleaning the LCD screen, please pay attention and protect the transparent LCD screen.
c. When cleaning the dust screen, use a screwdriver to remove the screws of the dust cover and
then remove the dust screen. After cleaning, install the dust screen in sequence.
d. Please disconnect the power supply, then wipe the instrument with a damp but not dripping soft
cloth. Do not use any abrasive chemical cleaning agent on the instrument or probes.
Warning
Please confirm that the instrument is completely dry before use, to avoid electrical shorts or
even personal injury caused by moisture.
Appendix B Warranty Overview
UNI-T (UNI-TREND TECHNOLOGY (CHINA) CO., LTD.) ensures the production and sale of products,
from authorized dealer’s delivery date of three years, without any defects in materials and workmanship.
If the product is proven to be defective within this period, UNI-T will repair or replace the product in
accordance with the detailed provisions of the warranty.
To arrange for repair or acquire warranty form, please contact the nearest UNI-T sales and repair
department.
In addition to permit provided by this summary or other applicable insurance guarantee, UNI-T does not
provide any other explicit or implied guarantee, including but not limited to the product trading and special
purpose for any implied warranties.
In any case, UNI-T does not bear any responsibility for indirect, special, or consequential loss.

99 / 99
Appendix C Contact Us
If the use of this product has caused any inconvenience, if you in mainland China you can contact UNI-T
company directly.
Service support: 8am to 5.30pm (UTC+8), Monday to Friday or via email. Our email address is
infosh@uni-trend.com.cn
For product support outside mainland China, please contact your local UNI-T distributor or sales center.
Many UNI-T products have the option of extending the warranty and calibration period, please contact
your local UNI-T dealer or sales center.
To obtain the address list of our service centers, please visit our website at URL: http://www.uni-
trend.com