

Introductio
n
Dear users
:
Thank you for purchasing UNI-T product. To operate the instrument correctly, please
read this Operating Manual carefully and especially its “Safety Notice” before use
.
Afer reading it, you are suggested to keep the manual properly. Please keep it with the
instrument together or place it in an accessible location for future use
.

General Safety Overview
The instrument is designed and manufactured strictl
y
according to “Safety Requirements of Electronic
Measuri ng In strume nts” (GB47 93) and IEC61010-1
Safety Standard . It conforms to “Insulation Overvoltage
Standard” (CAT 600V) and Safety Standard wit
h
Pollution Level You are expected to know the followin
g
safety precaution measures to avoid personal injury or
product damage or any other product connected to it
.
Please use the product according to the regulations so
as to avoid the possible damage
.
Only personnel w ith professional training can execute
maintenance procedure to avoid fire or personal
injury. Appropriate power wires should be used and
special power wires must be approved by the state
.
Reliable grounding of products: The product is
grounded by ground conductor of power supply
.
Ground conductor must be connected to earth to
avoid electric shock. Please guarantee correct
grounding before connecting input/output terminal of
the product
.
Correct connection of oscillograph probe: Earth wire
of p robe is t he same to earth pot enti al . Pl eas e do not
conn ec t ear th w i re t o hi gh v olt age
.
Review of rated values of all terminals: Please refer to
all rated values and marks on the product surface to
avoid fire or excessive current shock. Please refer to
product manual before connecting products so as to
know deta il s of r at ed v alu es.D o n ot op en cov er p late
of m achi ne b ox: It is not allo wed to st art or o pera te the
product when opening external cover or panel
.
Ċ
Ċ
Correct plug-in/out: Please do not plug in/out whe
n
connecting probe or testing conduits to voltage
source
.
Operating Manual for UTD2000/3000

Operating Manual for UTD2000/3000
Usage of appropriate fuse: It is only allowed to use
fuse type and rated indicator designated by the
product
.
To avoid exposed circuits: It is not allowed to touc
h
exposed connector or element after power supply
.
Operation is not allowed if there is any doubt for
product trouble: Please consult qualified maintenance
personnel to inspect the product if there is any trouble
doubt
.
It has to maintain appropriate ventilation. It is not
allowed to operate in wet locations. It is not allowed
to operate in combustible and explosive
environment. It has to keep product surface clea
n
and dry
.
Terms in the manual: The following terms may be
seen in the manual
:
Terms for products: The following terms may be
Danger: It refers to direct injury near the mark
.
Warning: It refers to potential injury near the mark
.
Note: It refers to potential danger for the product
and other properties
.
Warning: Warning statement means the
conditions and behaviors that may endanger lives.
Note: Notice statement means the conditions
and behaviors that may cause other property
damage
Protective
ground terminal
Ground terminal
for chassis
Ground terminal
for tes tin
g
Caution
!
Refer to manual
High voltage
Safety Terms and Symbols
Product symbol: Following symbols may be show
n
on the product surface
.
Operating Manual for UTD2000/3000

Operating Manual for UTD2000/3000
The manual is about operation information of OPERATING MANUAL FOR UTD2000/3000 digital storage
oscillograph. The manual includes the following chapters
Chapter 1: User Guideline: It is to introduce functions of digital storage oscillograph easily and provide
installation guidelines
.
Chapter 2: Instrument Setup:Operation methods of OPERATING MANUAL FOR UTD2000/3000 digital
storage oscillograph
.
Chapter 3: Application example: Examples to solve various measurement problems
Chapter 4: System Prompt and Troubleshootin
g
Chapter 5: Appendix: Technical Indicators
A
ppendix B: Fittings of OPERATING MANUAL FOR UTD2000/3000 series digital storage oscillograph
A
ppendix C: Maintenance and Cleaning Maintenance
Preface

The manual includes 3 series of digital storage oscillograph as follows. Detailed models are shown in the
following form
:
Operating Manual for UTD2000/3000
UTD2 C/UTD3025
C
02
5
UTD2 C/UTD3042
C
04
2
UTD2 C/UTD3062
C
06
2
UTD2 C/UTD3082
C
08
2
UTD2 C/UTD3102
C
10
2
UTD2 C/UTD3152
C
15
2
UTD2 C/UTD3202
C
20
2
UTD2 CE/UTD3042CE04
2
UTD2 CE/UTD3062CE06
2
UTD2 CE/UTD3082CE08
2
UTD2 CE/UTD3102CE10
2
UTD2 CE/UTD3152CE15
2
UTD2202CE/UTD3202CE
UTD2025C
L
UTD2052C
L
UTD2052CE
X
UTD2102CE
X
25MH
z
40MH
z
60MH
z
80MH
z
100MH
z
150MH
z
200MH
z
40MH
z
60MH
z
80MH
z
100MH
z
150MH
z
200MH
z
25MH
z
50MH
z
50MH
z
100MH
z
250MS/s
500MS/s
500MS/s
500MS/s
500MS/s
500MS/s
500MS/s
1GS/s
1GS/s
1GS/s
1GS/s
1GS/s
1GS/s
1GS/s
1GS/s
250MS/s
500MS/s
UTD2000C/3000
C
UTD2000E/3000E
UTD2000
L
UTD2000E
X
UTD2000/300
0
Series Model
Band width
Real-time

Oper ating Man ual fo r UTD 2000/3000
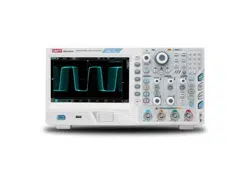
UTD2000/3000 series digital storage oscillograp
h
provides simple front panel with clear functions to
users for all basic operations. Scale and position of
various channels can provide intuitional operatio
n
to meet usage habits of traditional instruments
.
Users can use it skillfully without learning and
being familiar with operation for a long time. Users
can also press AUTO key directly to ac celerate
adjustment and facilitate measurement
.
A
ppropriate waveform and gear setup can be
shown on the instrument panel
.
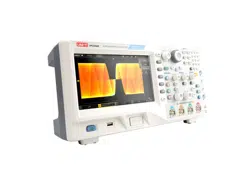
UTD2000/3000 series digital storage oscillograp
h
also has high-performance indicators and powerful
functions to fulfill measurement tasks quickl
y
besides easy usage. Quicker signals can be
observed by UTD2000/3000 series digital storage
oscillograph by real-time sampling of 500MS/s (or
1GS/s) and equivalent sampling of 25GS/s (or
50GS/s). It can capture and analyze waveform
easily by powerful trigger and analysis capacity
.
Users can also observe and analyze signal
problems quickly and clearly by clear LCD displa
y
and mathematical calculation function. We can see
that such series of digital storage oscillograph ca
n
meet your measurement requirements by following
performance characteristics
:
Double analog channels
High-resolution colorful LCD display system w it
h
resolution of 320 240 or 800 480
To support plug and play USB storage instrument
to communicate with computer
A
utomatic waveform and status setup
Waveform, setup, bitmap storage, waveform and
setup reoccurrence
Ɣ
Ɣ
Ɣ
Ɣ
Ɣ
h h

Ɣ
Ɣ
Ɣ
Ɣ
Ɣ
Ɣ
Ɣ
Ɣ
Ɣ
Ɣ
Ɣ
Ɣ
hr
Āā
Āā
Elaborate view window extension function for
delicate analysis of waveform details and profile
A
utomatic measurement of 28 kinds of
waveform parameters
A
utomatic cursor tracing and measurement
functio
n
Unique waveform recording and playback
functions
Embedded FFT
Multiple mathematical calculation functions
(including +, -, for waveform
Edge, video, pulse width and ALT TRIG
functions
Multi-language menu displa
y
Fittings of UTD2000/3000 series digital storage
oscillograp
h
2 probes of 1.2m 1:1/10:1 please refer to
manual of probe Fittings of probe details so as
to meet EN61010-031:2008 standar
d
1 power wire to meet national standards
1 Operating Manual
1 Product Warrant
y
USB connecting wire: UT-D06 or UT-D0
5
Communication control software for
UTD2000/3000 series oscillograp
h
㧦
Operating Manual for UTD2000/3000

Item
Elementary understanding of Tr igger S ystem..........................................
.
Page
..........................................................................................
.
.........................................................................................
.
......................................................................................
.
............................................................
.
Elementary understanding of Vertical System...............................................
.
Elementary understanding of Horizontal System..........................................
.
Gene ra l Sa fet y O vervi ew
Preface
Setup of Vertical S ystem........................................................................
.
Setup of Horizontal Sy stem.....................................................................
.
Setup of Trigger System..........................................................................
.
General Inspectio
n
Function Inspectio
n
Probe Compensatio
n
A
utomaticSetup of Waveform Displa
y
Chapter 1: User Guideline ..................................................................................
.
5
5
8
9
9
11
1
4
1
5
1
6
2
7
31
Oper ating Man ual fo r UTD 2000/3000
Content
s
Chapter 2: Instrument Setup.......................................................................
1

Page
...................................................................................
.
..........................................................................................
.
Setup of Auxiliary Functions .........................................................................
.
...
.
A
utomatic Measurement..............................................................................
.
....
.
Cursor Measurement .................................................................................
.
......
.
..................................................................................................
.
.
....................................................
.
.............
.
..................................................................
.
Setup of Display System
Storage and Callout
Operation Ke
y
Chapter 3: Application Examples
Example 1: Measurement of Simple Signals
Examp le 2: De lay Obs e rva ti on of Sin e Sig na l s by Circ uit.. ... .... ......... ... .... ....
.
Examp le 3: Ca pt ure of Si ng le Sig na l .... ... ... ... .... ... ... ... .... ... ... ... ... .... ... ... ... .... .
.
Exampl e 4: Redu c ti on of Ran do m Noi se for S igna ls. ... .... ... ... ... ... .... ... ..........
.
Exampl e 5: Ap plic ati on Cu r sor Me asu r em en t.. ... .... ... ... ... .... ... ... ... .... ... ... ... ...
.
Example 6: Application of X-Y Functio
n
Example 7: Trigger of Video Signals
........ ... ... ... ... .... ... ... ... .... ... ... ... .... ... ...
.
........ .... ... ... ... .... ... ... ... ... .... ... ...
.
4
8
5
0
5
5
6
0
6
8
7
0
7
2
7
2
7
3
7
5
7
6
7
8
7
9
81
4
4
Operating Manual for UTD2000/3000
Item
Setup of Sampling System................................................................
.

Item Page
.......................................................
.
............................................................................
.
....................
.
.....................................................
.
...............................................................................................
.
.........................................
Examp
Examp : Usage of Upgrading Procedure of U disk
System Prompt Informatio
n
Troubleshootin
g
A
ppendix A: Technical Indicators......................................................
.
A
ppendix B: Fittings of UTD2000/3000 Series Digital Storage Oscillograph..
.
A
ppen dix C: M ain tenan ce a nd Clea nin g Ma int enan ce. .... ..... .... .... ..... .... ....
.
Example 10: Usage of Storage Functio
n
Chapter 4: Syste m Prompt and Troubleshooting
Chapter 5: Technical Indicators............................................................
Example 8: Pass/Fail Detectio
n
Example
9
8
8
8
9
91
91
10
4
10
5
8
3
8
4
8
5
8
8
Operating Manual for UTD2000/3000

Operating Manual for UTD2000/3000
Chapter 1: User Guideline
Ƹ
Ƹ
Ƹ
Function inspectio
n
Elementary understanding of vertical system
Elementary understanding of horizontal system
UTD2000/3000 series digital storage oscillograph is
a small and handy desktop product. Basic test can be
done by providing convenient front panel to facilitate
operation f or users
.
UTD2000/3000 series are to provide simple front
panel with clear functions to users for basic
operation. Panel also includes knob and function key
.
Knob functions are similar to those of other digital
storage oscillograph
.
The chapter is to show execution of following steps
General inspectio
n
5 keys in a row in the right side of display panel are
menu operation keys. (They are defined as F1 to F
5
keys from top to bottom.) You can also set different
options for current menu by them. Other keys are
function keys. You can enter into different functio
n
menus or gain specific function application directly
by them
.
㧦
Elementary understanding of trigger system
Please know front operation panel firstly after
getting UTD2000/3000 series digital storage
oscillograph. The chapter is to introduce operation
and functions of front panel for
UTD2000/3000products so as to be familiar wit
h
usage within the shortest period
.
General inspectio
n
Ƹ
Ƹ
Ƹ
A
utomatic setup of w aveform displa
y
Probe compensatio
n
Ƹ
1
Operating Manual for UTD2000/3000
2
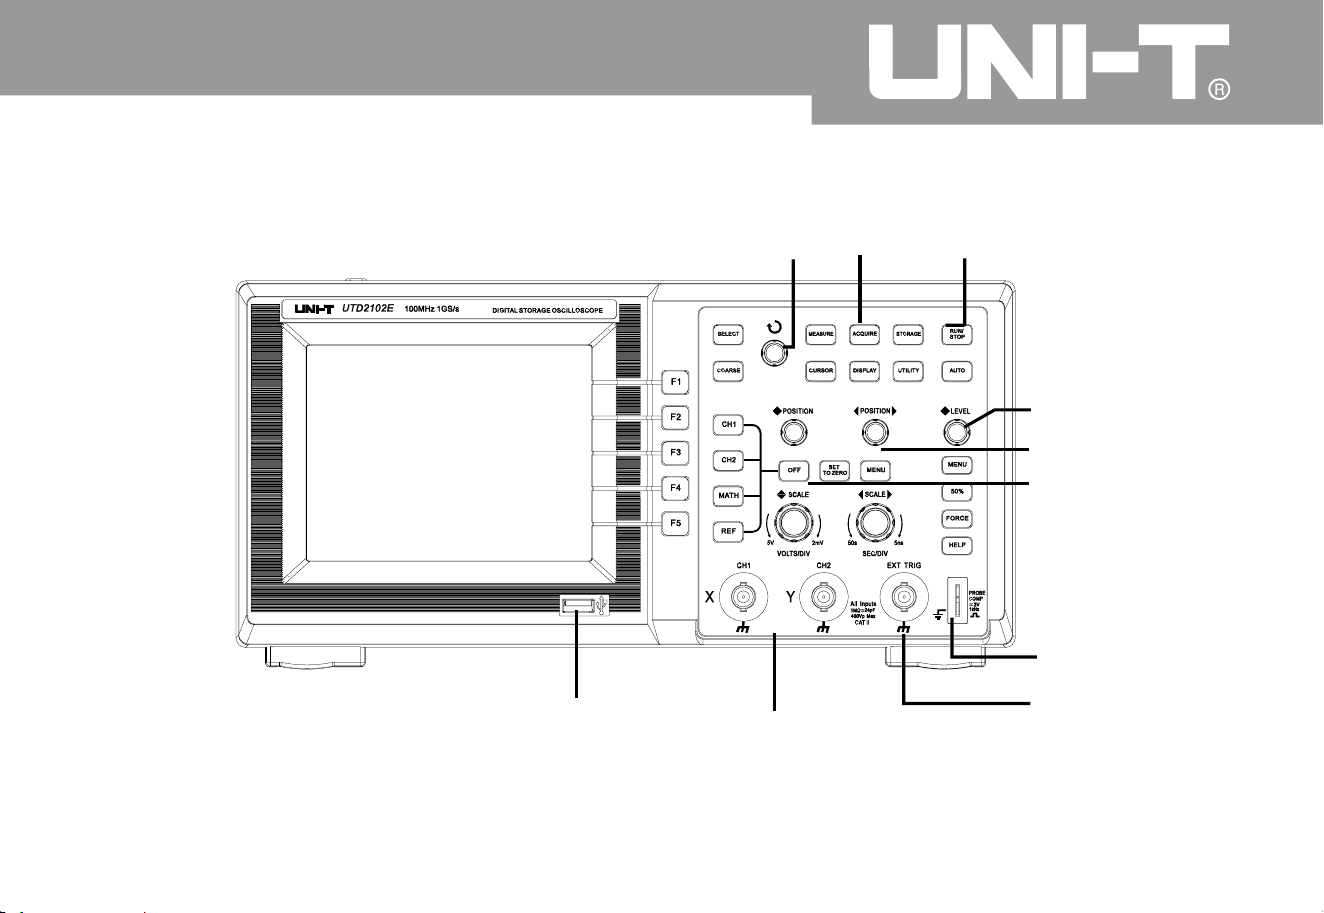
5.7 inch front panel of UNI-T
probe compensatio
n
signal output
vertical control
horizontal control
Operatio
n
con tro ls
multi-purpose
knob controller
commo
n
men
u
trigger control
EXT TRIG INPUT
analog signal input
interface
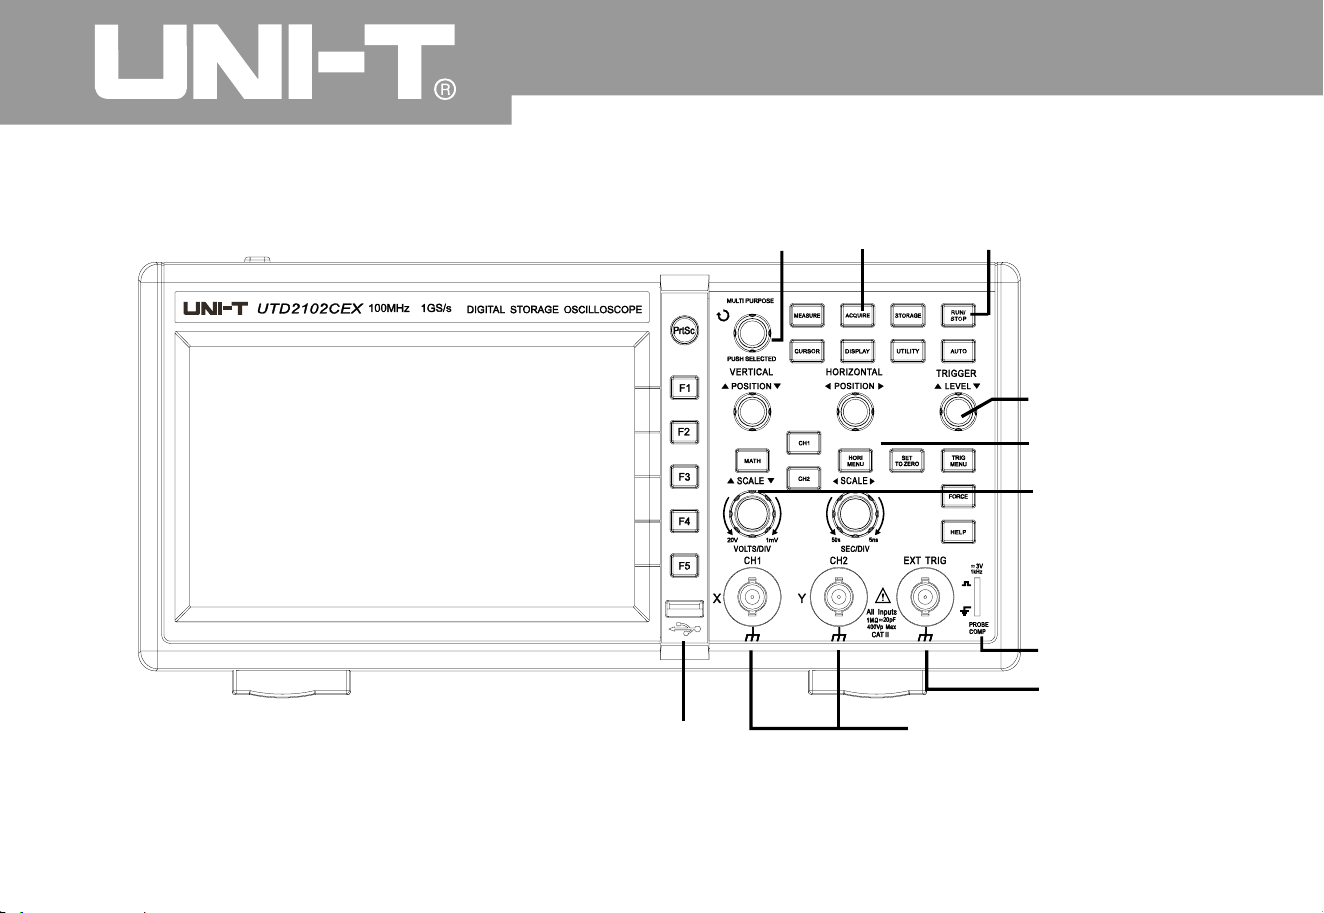
Oper ating Man ual for UTD2000/3000
3
probe compensatio
n
signal output
vertical control
horizontal control
Operati o
n
controls
multi-purpose
knob controller
commo
n
men
u
trigger control
EXT TRIG INPUT
analog signal input
interface
7inch front panel of UNI-T
Oper ating Man ual fo r UTD 2000/3000
4
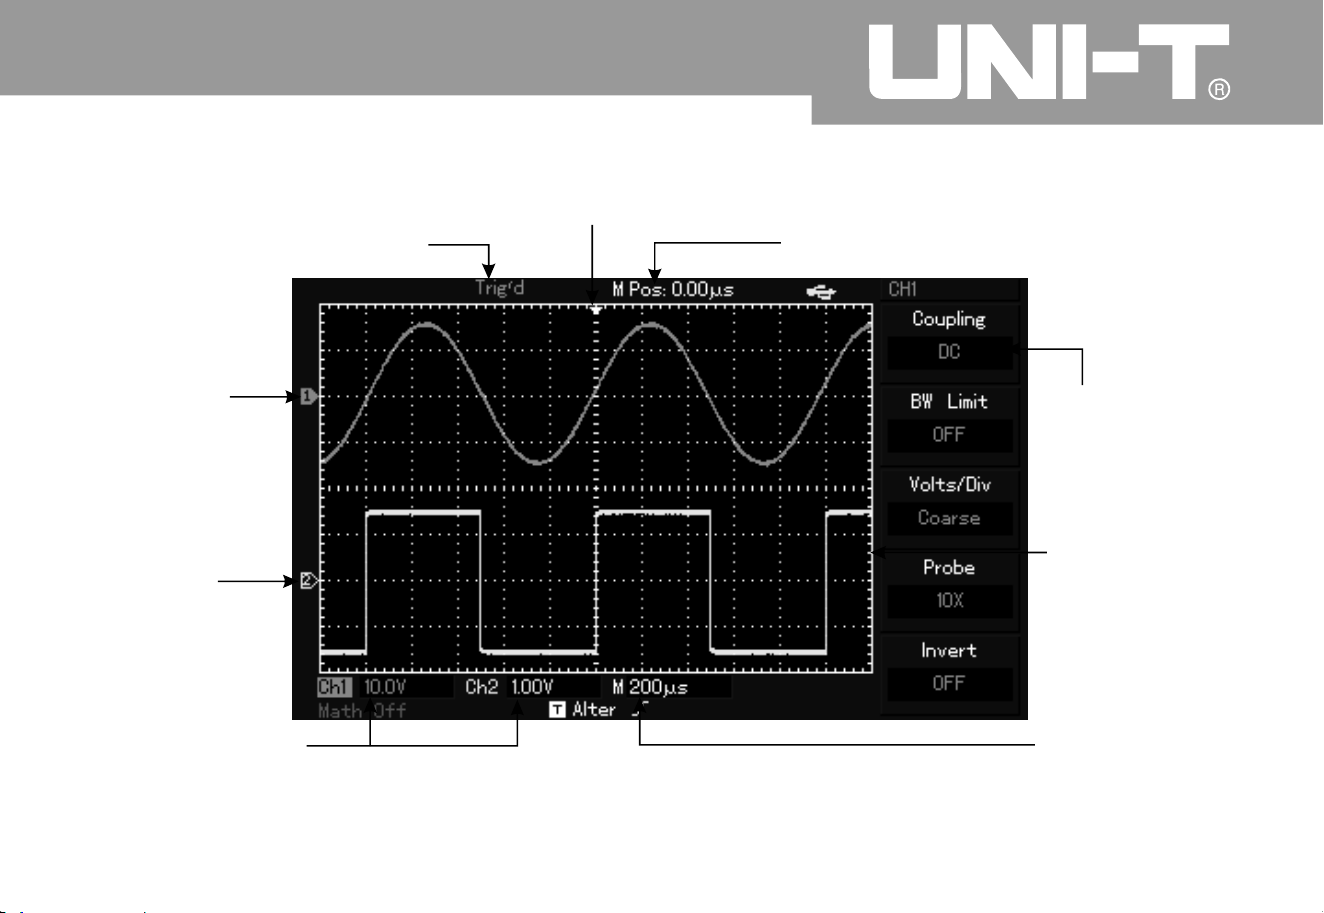
display of horizontal trigger positio
n
time display of central scale line
vertical scale
coefficient of
display channel
display setup of
main time base
waveform
display window
Menu varies wit
h
different functio
n
keys
.
mark of
channel
2
display of trigger status
mark of
channel 1
Interface display diagram of digital storage oscillograph (i.e. UTD2000L series
)

Operating Manual for UTD2000/3000
5
General inspectio
n
Function inspectio
n
It is suggested to inspect the instrument b
y
following steps when getting a new UTD2000/3000
series digital storage oscillograph
.
1. To check if there is damage due to transportatio
n
or not
.
Please replace carton or foaming plastic protectio
n
cushion with severe damage instantly
.
2. Please inspect fitting details and shown it i
n
“Fittings of UTD2000/3000 series digital Storage
Oscillograph” shown in the manual. You can check
if there are deficient fittings or not by referring to it
.
Please contact UNI-T distributor or local agent if
there are deficient or damaged fittings
.
3. Please inspect the entire machine and contact UNI-T
distributor or local agent for damaged appearance
,
abnormal operation or failing to pass performance test
.
Please pay attention to packages and report to
transportation department and UNI-T distributor if
machine damage is caused by transportation
.
1. Connect the power suppl
y
You can supply power to the machine and voltage is A
C
100V to AC 240V. Frequency is 45Hz to 440Hz. It has
to press [UTILITY] menu and [F1] for self-correctio
n
after power supply 30 minutes after operation of hot
machine so that digital storage oscillograph operates
under the
best status. As shown in Figure 1 4, please
enter into next page and press [F1] to call out ex-factor
y
setup
.
㧙
UNI-T will arrange maintenance or replacement
.
Please carry out once fast function inspection to
check if the machine operates normally or not
.
Please operate according to following steps
:
Warning: Please confirm safety grounding of digital
storage oscillograph to avoid dangers
.
2. Signal access of digital storage oscillograph is
double-channel input for UTD2000/3000 series
digital storage oscillograph. There is also 1 EXT
TRIG INPUT channel. Please connect signals
according to following steps
:
(As shown in Figure 1-5), connect probe of
digital storage oscillograph to CH1 input terminal
and set attenuation ratio switch on probe to 10×
Á
Figure 1 5 Setup of attenuation ratio switch o
n
probe
㧙
ķ
ˊ
Operating Manual for UTD2000/3000
6
Figure 1-
4
power switc
h
function butto
n
F
1
MEASURE
CURS O
R
DISPLAY
A
CQUIR E STORAGE
UTIL ITY
MULTIPURPOSE
SELECT
A
UT
O
CH
1
CH
2
F
2
F
3
F
4
F
5
POSITION
SCALE SCALE
VOLTS DI
V
VVm
POSITION
SEC DIV
SS
LEVEL
MATH
FORCE
HEL P
MENU
TRI
G
MENU
HORI
VERTICA
L
CH
1
TRIGGE
R
HORI ZONTA
L
CH2
SET
Oper ating Man ual for UTD2000/3000
Oper ating Man ual for UTD2000/3000
7
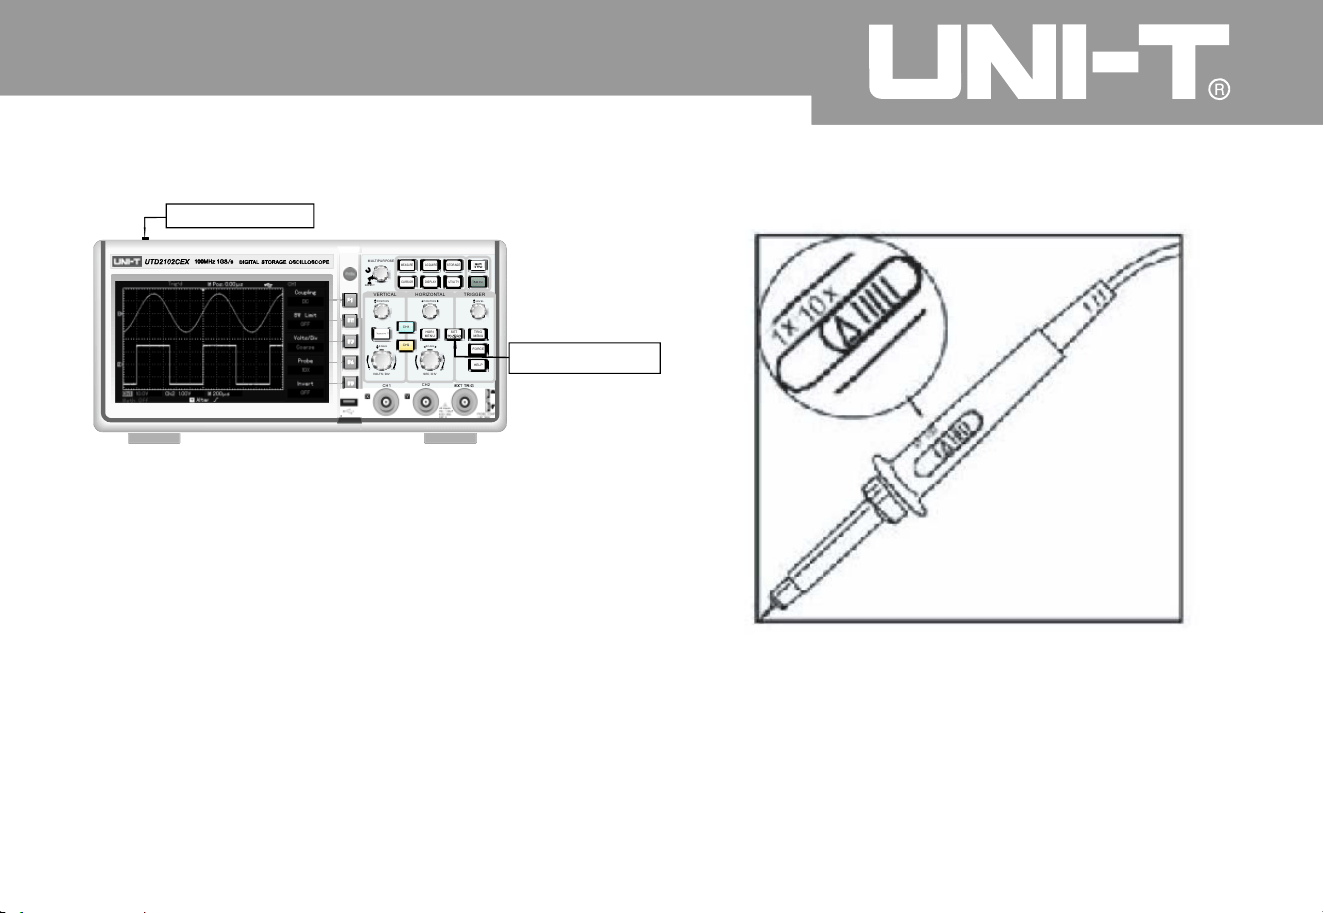
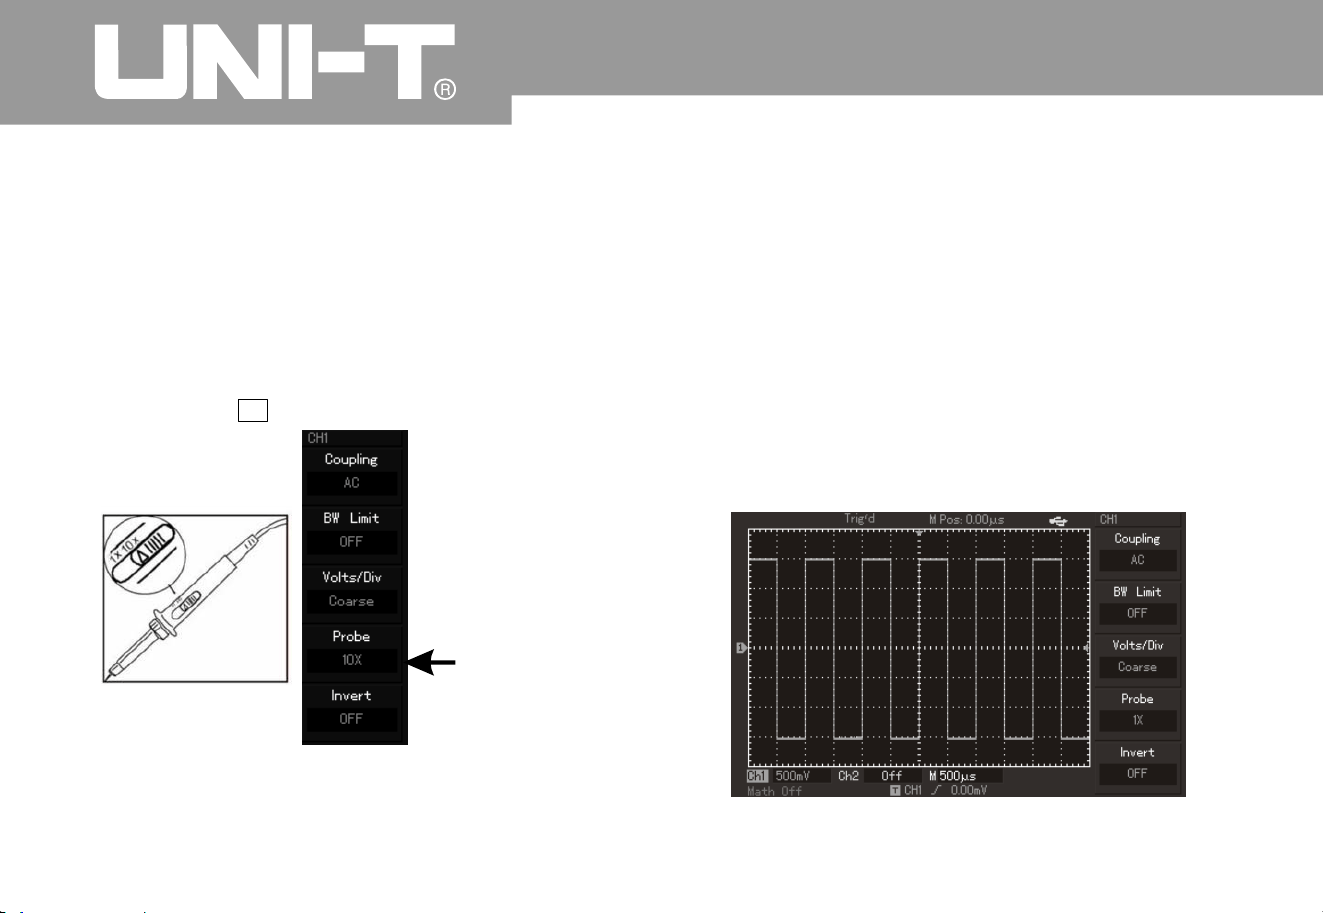
ĸIn digital storage oscilloscope to set the probe
attenuation factor. The attenuation coefficient of
vertical gear ratio change instruments, whic
h
makes measurement resultsSetup method of
attenuation coefficient of probe is as follows to
show amplitude of measured signals correctly
.
Please press
Figure 1-6 Setup of deflection coefficient of probe
on digital storage oscillograp
h
F4 key for menu display of 10
×
Connect probe and grounding clip to
corresponding connection ends then press [AUTO]
button. As shown in Figure 1-7, square wave (1kHz
,
about 3V and peak value) can be displayed withi
n
several seconds. It has to inspect CH2 by the same
method then press [OFF] function button so as to
power off CH1. It has to press [CH2] function butto
n
to power on CH2 and repeat the second and third
steps.
Ĺ
Probe ratio
n
Figure 1
7
㧙

Operating Manual for UTD2000/3000
Probe compensatio
n
It needs to adjust it when connecting probe to an
y
input channel for the first time so that probe can be
appropriate to input channel. Probe without
compensation correction can also bring i
n
measurement tolerance or error. Please operate
according to following steps for adjustment of
probe compensation
:
1. To set probe menu attenuation coefficient to
10× and place probe switch to 10× then connect
digital storage oscillograph probe to CH1. Please
guarantee reliable contact to probe. It has to
connect probe end to signal output connector
2
of
probe compensator then connect grounding clip to
earth wire connector of probe compensator. It also
has to power on CH1 and press [AUTO]
.
3. Adjust variable capacitance on the probe b
y
screwdriver of non-metallic handle for waveform
display of “insufficient compensation” or
“excessive compensation” shown in above figure
until “correct compensation” for waveform displa
y
on the screen as above
.
Warning: Please guarantee perfect insulatio
n
conduits of probe and do not contact metallic part
of probe when connecting to HV source to avoid
electric shock of probe during HV measurement
.
Observation of displayed waveform
8
Exceedin
g
compensatio
n
Correct
compensation
Insufficient
compensation Figure 1
8
㧙
Compensation correction of probe
Oper ating Man ual fo r UTD 2000/3000
9
Automatic setup of waveform displa
y
UTD2000/3000 series digital storage oscillograp
h
has automatic setup functions. It can adjust vertical
deflection coefficient, scanning time base and
trigger mode automatically according to i nput
signal for the most appropriate waveform display
.
Frequency of measured signals shall be more tha
n
or equal to 50Hz and duty cycle shall exceed 1%
according to automatic setup requirements
.
1. Connect measured signals to signal input
channel
.
2. Press [AUTO] button so that digital storage
oscillograph can set vertical deflection coefficient
,
scanning time base and trigger mode
automatically. They can be adjusted again after
careful observation and automatic setup so that
waveform display can realize the best effect
.
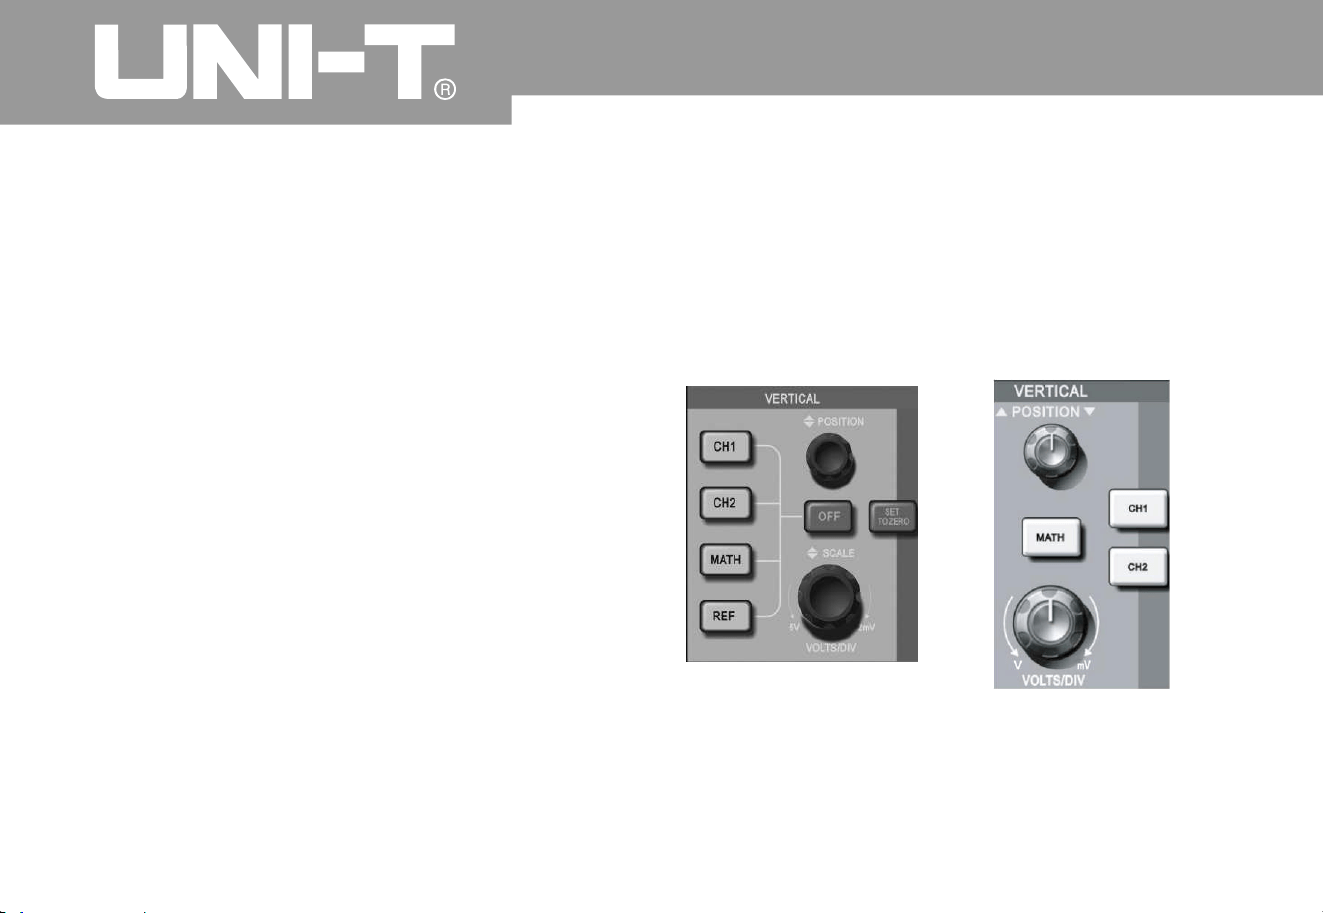
A
s shown in the following figure, there are a series
of keys and knobs in vertical control area. Please
introduce usage of vertical setup gradually as
foll ows
.
Automatic setup
Elementary understanding of vertical system
㧦
5.7-inch vertical
control panel of scree
n
7-inch vertical control
panel of scree
n
Figure 1 9 Vertical control area on the panel㧙

Operating Manual for UTD2000/3000
10
1. Use vertical position knob so that middle displa
y
of waveform signal in the window. Vertical displa
y
position of signal can be controlled by vertical
position knob
.
Ground mark moves vertically with waveform whe
n
rotating vertical position knob
.
Measurement knack
You can observe difference between waveform
and signal ground to measure DC component
of signal quickly if adopting DC channel
coupling mode. DC components in the signal
will be filtered if adopting AC coupling mode
. You can also display AC component of signal
by higher sensitivity conveniently
.
Vertical position of double analog channels shall be
restored to short-cut key of zero pointnamely
,
SET TO ZERO
.
The key is to return vertical displacement/horizontal
displacement/hold off position to zero point
(or middle point)
.
Of w hich: UT D2000L /2 000EX series will trig ger
elec tric lev el Ret urn to 50% of positi on
.
2 Alter vertical setup and observe alternation of
status information. You can determine variation of an
y
vertical gear by status bar below waveform window
.
Ver tical gear of “volt/grid” can be altered by rotatin
g
vertical scale knob to show corresponding variation for
channel gear display which corresponds to status bar
.
User can press [CH1], [CH2] , [MATH] and [REF] to
display operation menu, mark, and waveform and
gear status information of corresponding channels
.
Operating Manual for UTD2000/3000
1
1
Users can also press [OFF] key to close currentl
y
selected channels for UTD2000C/3000C and
UTD2000E/3000E oscillograph. They can also
click on CH1, CH2 and MATH keys twice to close
corresponding channels for UTD2000L/2000EX
oscillograph
.
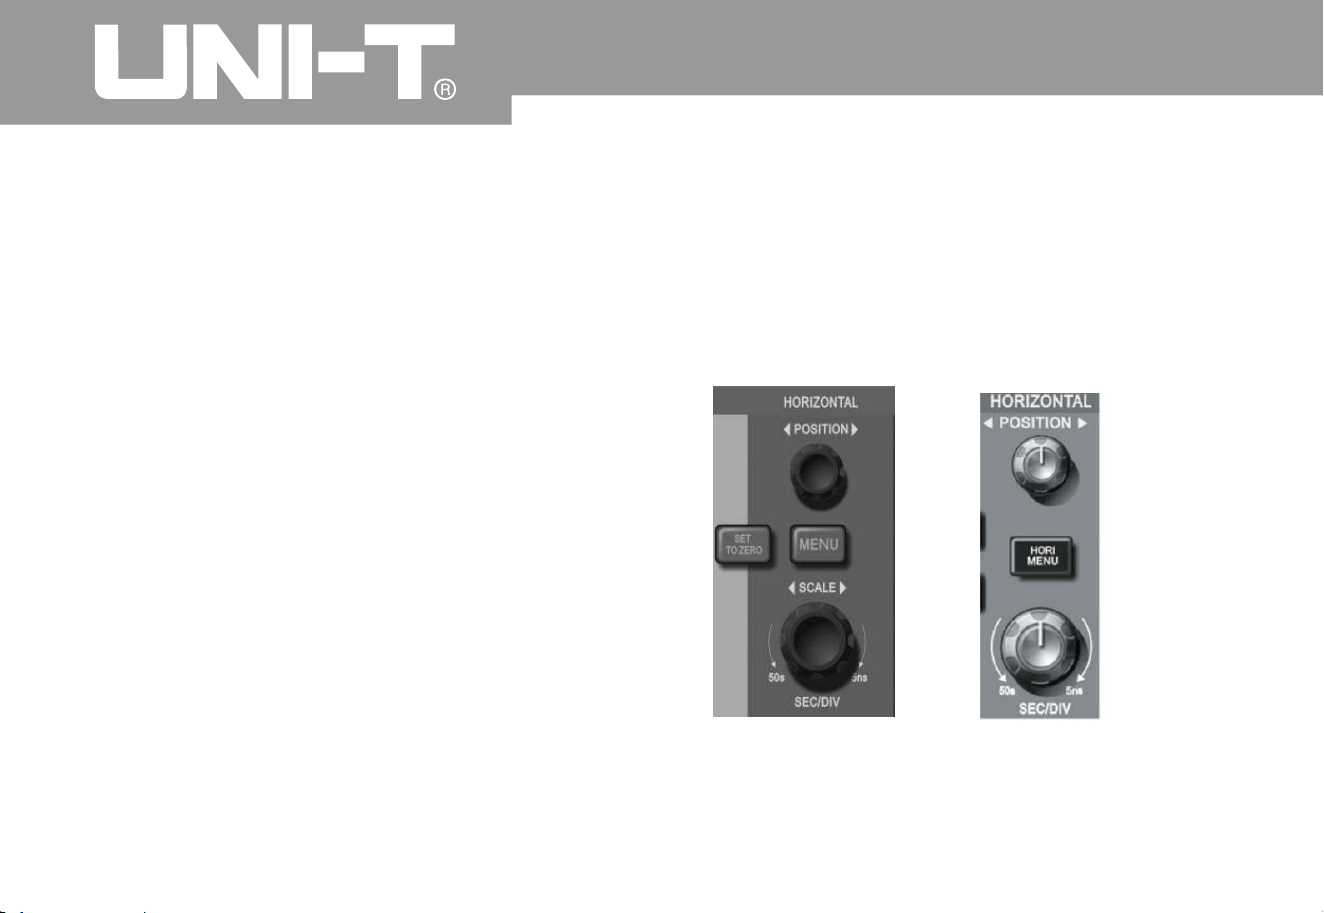
A
s shown in following figure, there is 1 key and
2
knobs in horizontal control area. Please be familiar
with setup of horizontal time base gradually as
foll ows
:
Elementary understanding of horizontal system
Horiz ont al c ont rol
panel of 5.7-inc
h
Horiz ont al c ont rol
panel of 7-inc
h
Figure 1 10 Horizontal control area on the panel㧙

Operating Manual for UTD2000/3000
1. Use horizontal SCALE knob to alter horizontal
time base gear then observe alternation of status
information. To rotate horizontal SCALE knob to
alter “s/div” time base gear so as to show
corresponding variation of time base gear displa
y
for corresponding channels of status bar
.
Horizontal scanning speed steps from 2ns/di
v
s/div by way of 1 mode
.
Note: Horizontal scanning time base gear varies
for UTD2000/3000 series digital storage
oscillograph due to different models
.
γ
㨪
㧙㧙50 2
5
2. Use horizontal POSITION knob to adjust
horizontal position of signals in waveform window
.
To use horizontal POSITION knob to control trigger
displacement of signals. Horizontal movement of
waveform with knob can be observed when rotatin
g
horizontal POSITION knob for application for
trigger displacement
.
3. Please press [MENU] button for 5.7-inc
h
oscillograph (and press [HORI MENU] button for 7-
inch oscillograph) to display Zoom menu. Please
press [F3] to open view window extension under
this menu then press [F1] to close view window
extension and return to main time base. Hold off
time can be set under this menu
.
1
2
Operating Manual for UTD2000/3000
1
3
Trigger point can be restored to vertical middle
point quickly by short-cut key of [SET TO ZERO] so
as to restoring displacement of trigger point to
horizontal zero point short-cut key. Users can also
adjust horizontal position of signal in waveform
window by rotating horizontal knob
.
Term explanatio
n
Trigger point: It refers to position of actual trigger
point by comparing with middle point of storage
instrument. Users can move trigger horizontally b
y
rotating horizontal POSITION knob
.
Hold off: It refers to interval to start up trigger
circuit again
.
Hold off time can be set by rotatin
g
multi-purpose
knob controller
.
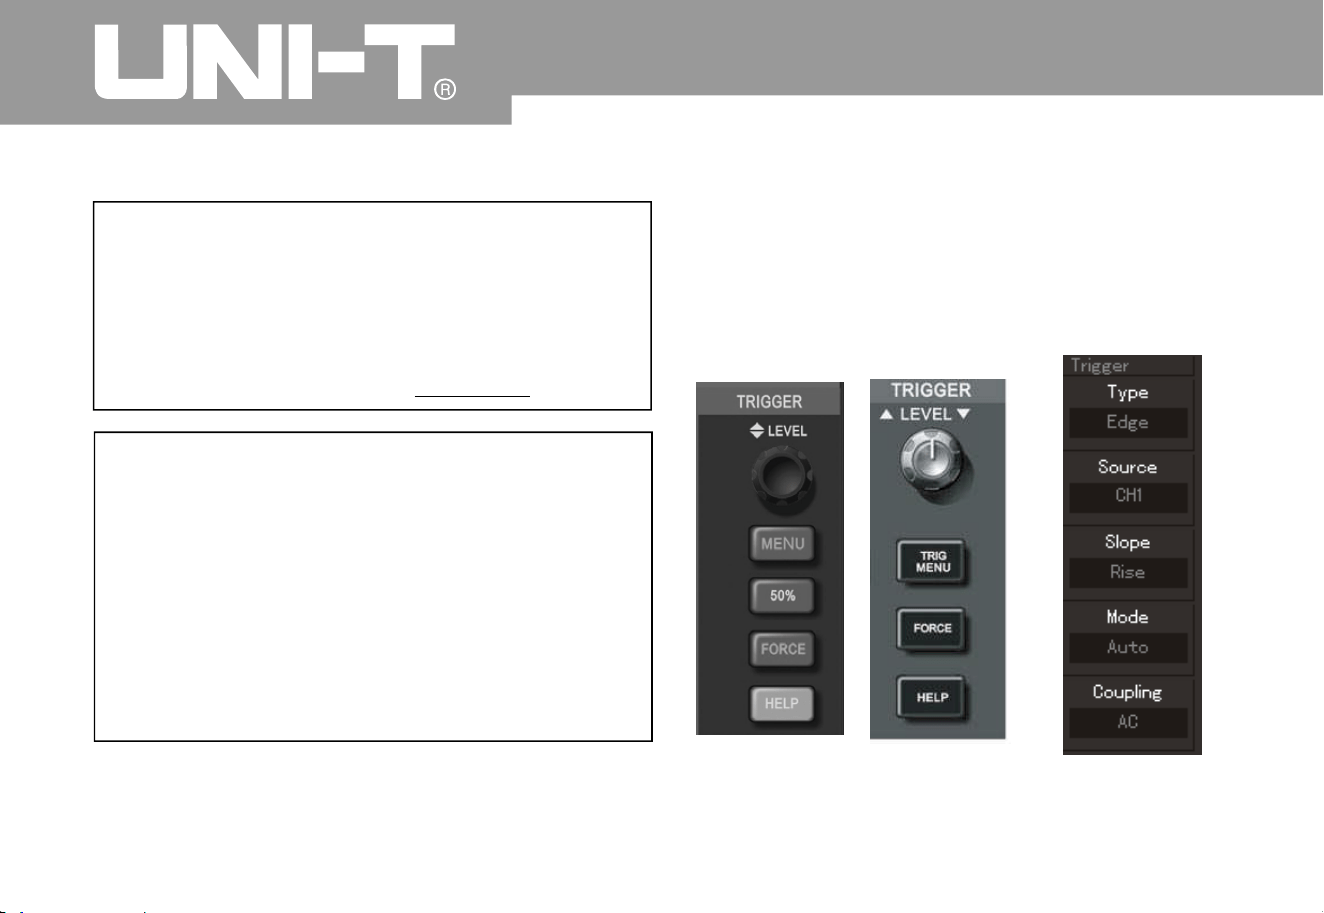
A
s shown in Figure 1 there is 1 knob and
3
(or 2) keys in control area of trigger menu. Please
be familiar with setup of trigger system gradually as
foll ows
:
POSITIO
N
Elementary understanding of trigger system
㧙11
5.7-inch screen 7-inch scree
n
Figure 1-1
2
Trigger men
u
Figure 1 Trigger menu on the panel㧙11

1. To user trigger level knob to alter trigger level
and instruct trigger level line by seeing trigger mark
on the screen so that it moves vertically with knob
rotation. Variation of trigger level in lower part of
screen can be observed when moving trigger level
at the same time
.
2. (As shown in Figure 1-12,) TRIGGER MENU ca
n
be used to alter trigger setup
.
User can press [F1] key to select “edge” trigger
.
n trigger signal amplitude
.
i
4
.
To press FORCE button: To produce 1 trigger
signal forcefully for mainly application for normal
and single trigger mode
.
Operating Manual for UTD2000/3000
14
They can press [F2]key to select “trigger source
”
to CH1
.
They can press [F3] key to set “gradient” of edge
type to ascending
.
They can press [F4 ]key to set “trigger mode” to
automatic. They can also press F5 key to set
“trigger coupling” to AC
.
They can press [50%] button for 5.7-inch oscillograp
h
and press [SET TO ZERO] key for 7-inch oscillograph
.
It also has to set vertical middle point of trigger level
2
.

Operating Manual for UTD2000/3000
1
5
Chapter 2: Instrument Setup
By now, you have been familiar with operation of
vertical control area, horizontal contro l a rea and
trigger system menu for UTD2000/3000 series digital
storage oscillograph preliminarily. You should be
familiar with setup of digital storage oscillograph b
y
menu operation by introduction shown in previous
chapter. It is suggested to read Chapter 1 if you have
not been familiar with above operation and methods
.
The chapter is mainly to introduce following themes
Set trigger systems of [TRIGGER LEVEL]
,
[MENU], ]50%] and] FORCE]
;
Set sampling mode of [ACQUIRE]
;
It is suggested to read the chapter carefully to know
many measurement functions for UTD2000/3000
and system operation method
.
㧦
Ƶ
Ƶ
Ƶ
Ƶ
Ƶ
Ƶ
Ƶ
Ƶ
Ƶ
Ƶ Set vertical systems of [CH1], ]CH2],] MATH]
,
]REF] , ]OFF] ]VERTICAL POSITION] and
]VERTICAL SCALE]
;
Set horizontal systems of ]MENU] or ]HO
R
MENU], ]HORIZONTAL POSITION] or
[HORIZONTAL SCALE]
;
Set display mode of [DISPLAY]
;
Store and call-out for [STORAGE]
;
Set auxiliary system of [UTILITY]
;
A
utomatic measurement of [MEASURE]
;
Cursor measurement of [CURSOR]
;
Use execution buttons of [AUTO] and
[RUN/STOP]
;

Operating Manual for UTD2000/3000
Setup of vertical system
CH1 and CH2 channels and setup
Every channel has its own vertical menu. Ever
y
item can be set individually according to different
channels. As shown in Form 2-1, the system ca
n
display operation menu of CH1 or CH2 channel b
y
pressing CH1 or CH2 function key
.
1
6
1
1
0
10
0
100
0
h
h
h
h
Setup
Descriptio
n
Function menu
Couplin
g
AC
D
C
To obstruct DC component
of input signal
.
To cut off input signals by A
C
and DC components of input
signals
.
Groundin
g
Bandwidt
h
limit
O
N
OFF
To limit band width to 20MH
z
so as to reduce display noise.
Full band widt
h
Volt/gri
d
Coarse
tunin
g
To set vertical deflectio
n
coefficient for coarse tunin
g
by 1-2-5 system. To refine
within setup scope of coarse
tuningforfinetuningsoasto
improve vertical resolution
.
Fine
tunin
g
Probe
To select one value according
to probe attenuatio
n
coefficient to keep correct
vertical deflection coefficient
.
There are total ly 4 kinds
,
namely,1 ,10 ,10
0
and 1000
.
hh h
h
Reverse phase
O
N
OFF
To realize reverse directio
n
function for waveform
;
To display waveform normally.
Form 2-1
1
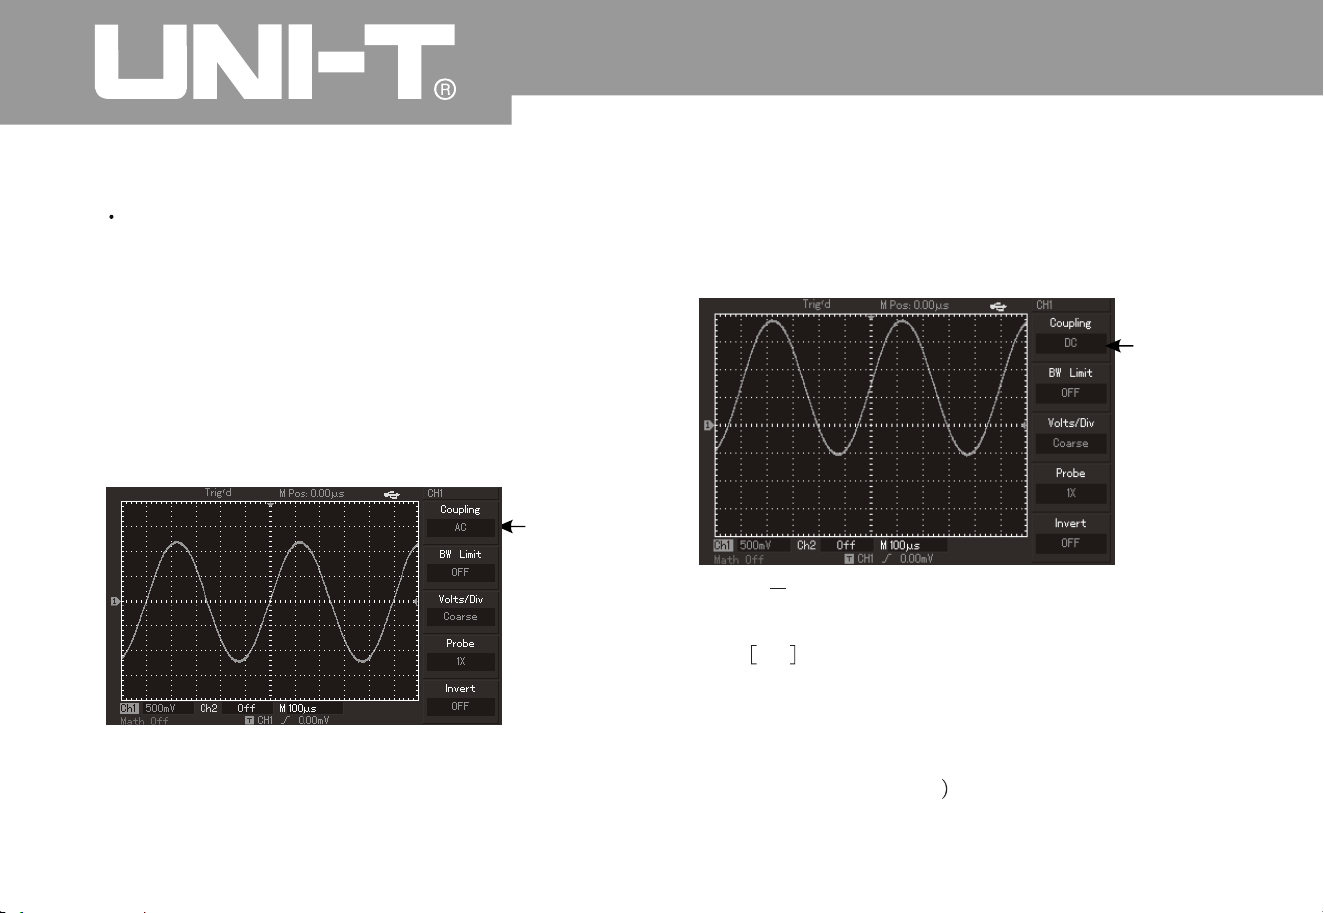
Measured signal is a sine signal with DC component
by taking exerting s ignal to CH1 channel as a
n
example
.
To press F 1 to select AC and AC c oupling mode. D
C
component contained by measured signal will be
obstructed. Waveform display is s hown in followin
g
figure
.
Press F1 to DC to pass through DC and A
C
components of measured signals of CH1 channel
.
Waveform display is also shown in following figure
:
Figure 2 2 Synchronous display of DC and A
C
components of signal
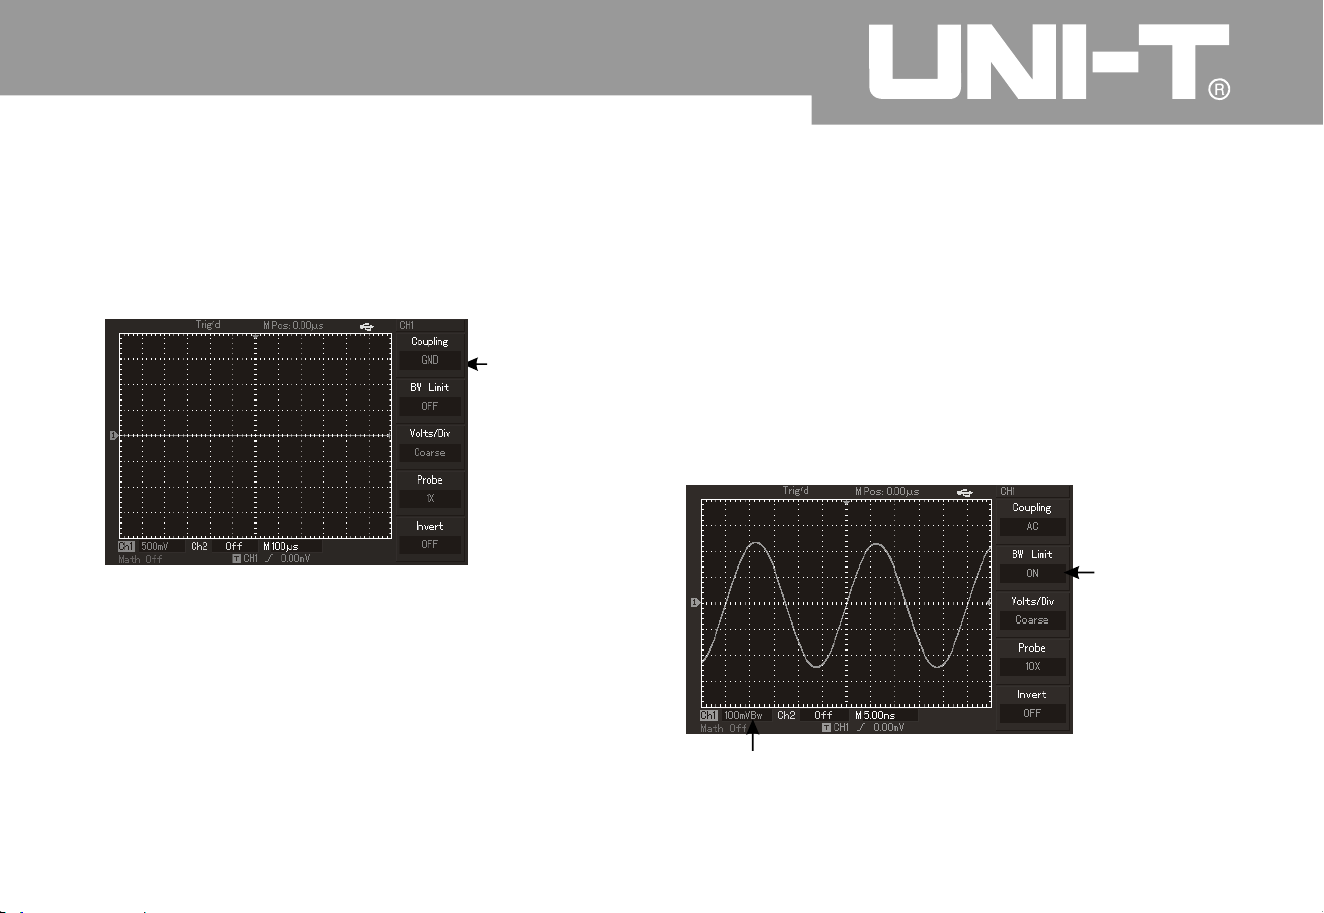
Press F1 to select grounding and set channels to
grounding m ode. DC and AC components
contained by measured signals will be obstructed.
Waveform display is shown in following figure
:
displayed on the screen
.
Setup of channel couplin
g
㧦
1
7
Oper ating Man ual fo r UTD 2000/3000
Figure 2 Jammed DC component of signal㧙1
Setup of
A
C couplin
g
DC couplin
g
setup
Operating Manual for UTD2000/3000
(Note: Input signal still shall be connected to
channel circuit under such mode althoug
h
waveform is not
Figure 2 3 Synchronous obstruction of DC and
A
C components of signal
㧙
18
Ground couplin
g
setup
2.
Setup of cha nnel bandwidth lim it㧦
Input one sine signal of about 40MHz for CH1 as an
example. It has to press [CH1] to open CH1 channel
then press [F2] to set bandwidth limit to OFF
.
Channel band width is full band width to pass
through high-frequency components contained by
measured signal. Waveform display is also shown
in following figure
.
Figure 2 Waveform display when closin
g
bandwidth limit
㧙4
Bandwidt
h
suppressio
n
20MH
z
Bandwidth suppression icon
Oper ating Man ual for UTD2000/3000
1
9
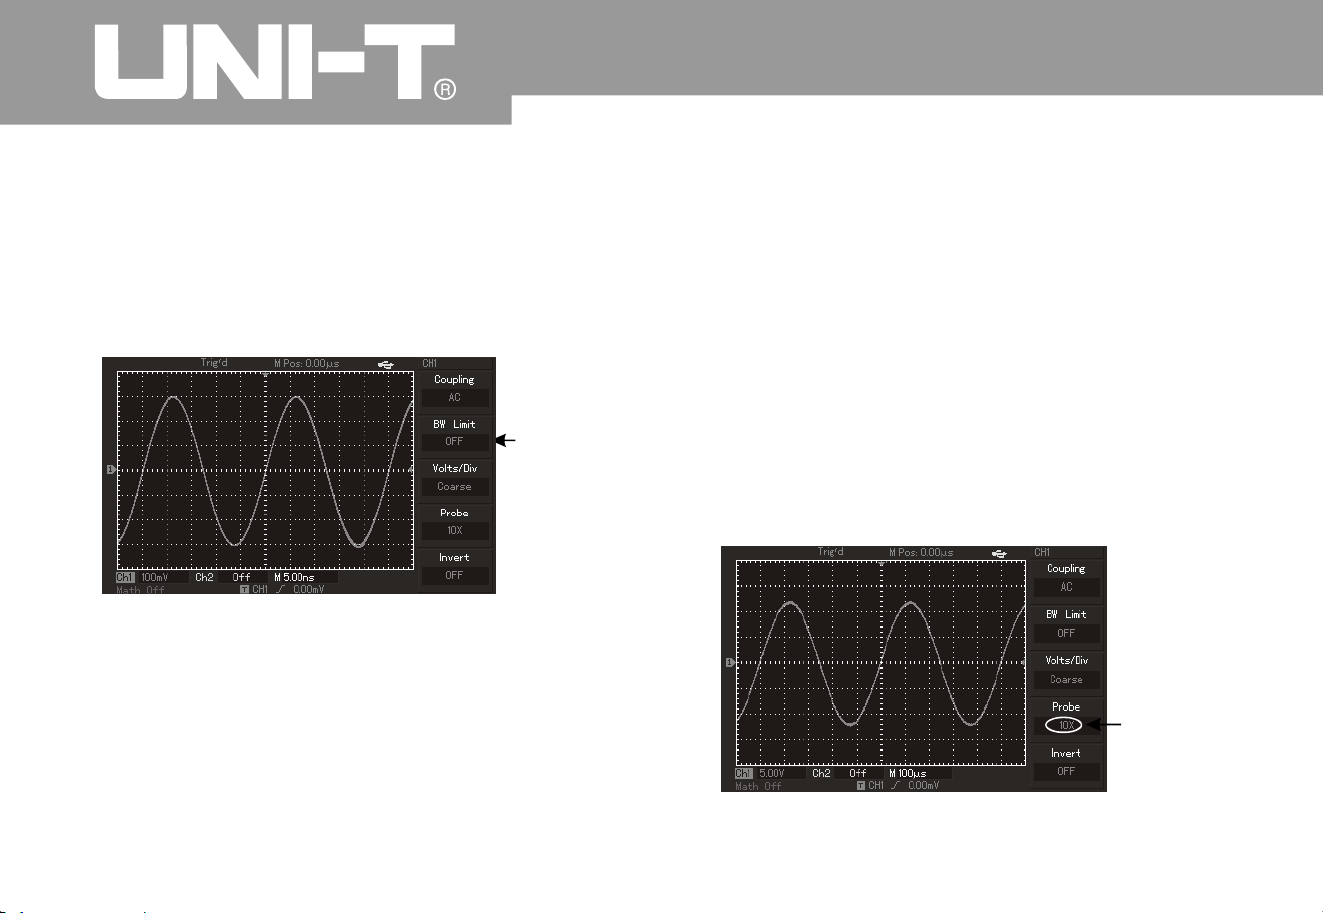
Please press [F2] to set band width limitation to ON
for great attenuation of high-frequency component
and noise of more than 20MHz contained b
y
measured signals. Waveform di splay is also show
n
in following figure
.
Figure 2 5Waveform display when openin
g
bandwidth limit
It has to set probe attenuation coefficient i
n
operation menu of channel to coordinate wit
h
attenuation coefficient setup of probe. Probe
coefficient in channel menu shall be set to 10× if
probe attenuation coefficient is 10:1. It has to
analogize to guarantee correct voltage
.
Volt/grid gears of vertical deflection coefficient can
be divided into coarse tuning and fine tuning
.
Please refer to following figure for setup and
vertical gear when using 10:1 probe
.
㧙
㧦3. Setup of multiplying factor for probe
Close
bandwidt
h
limit
Probe
attenuatio
n
coefficient
Figure 2 Probe attenuation coefficient shown
in channel men
u
㧙6
Operating Manual for UTD2000/3000
4.
2
0
2
5
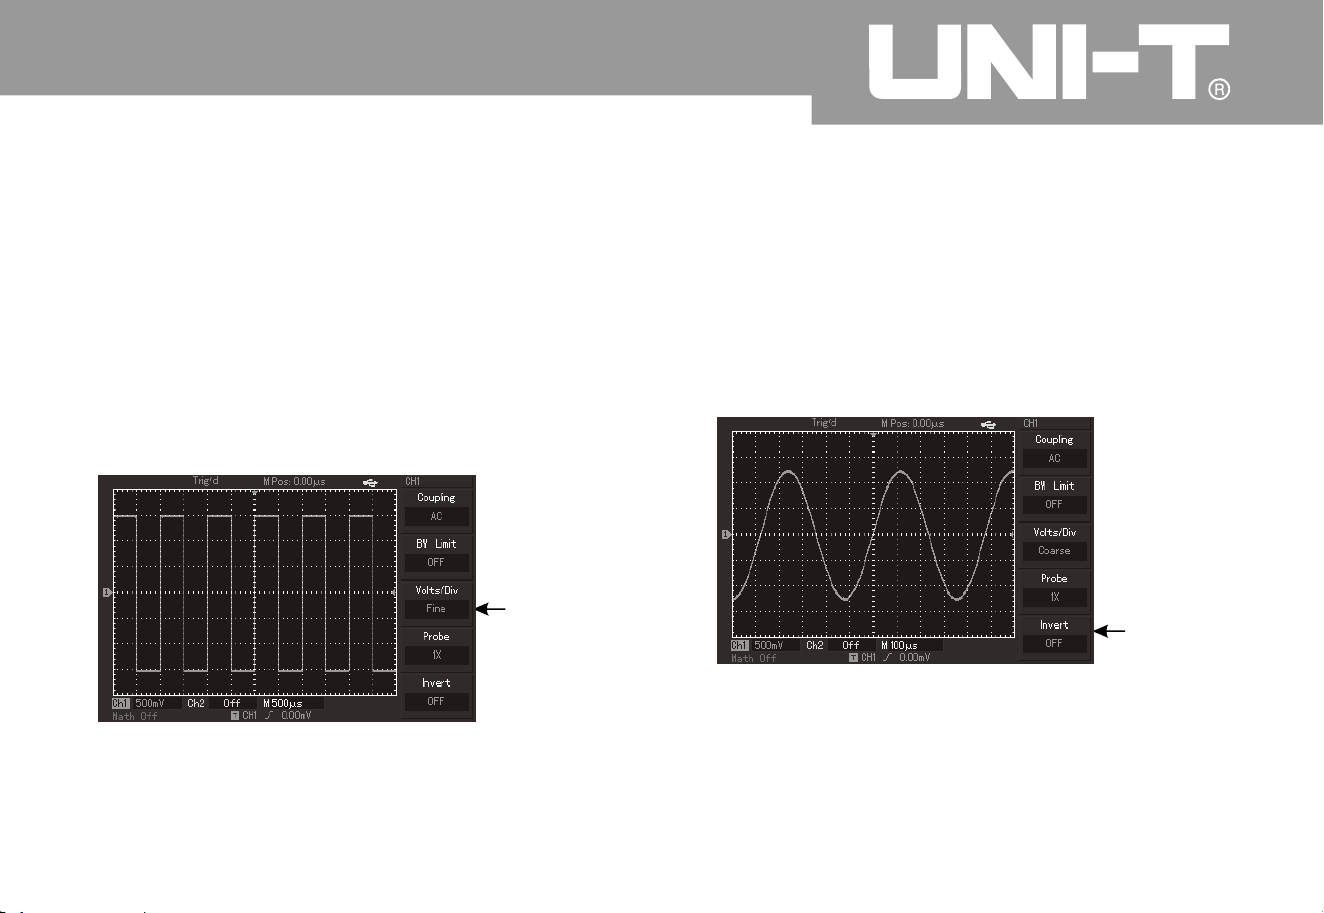
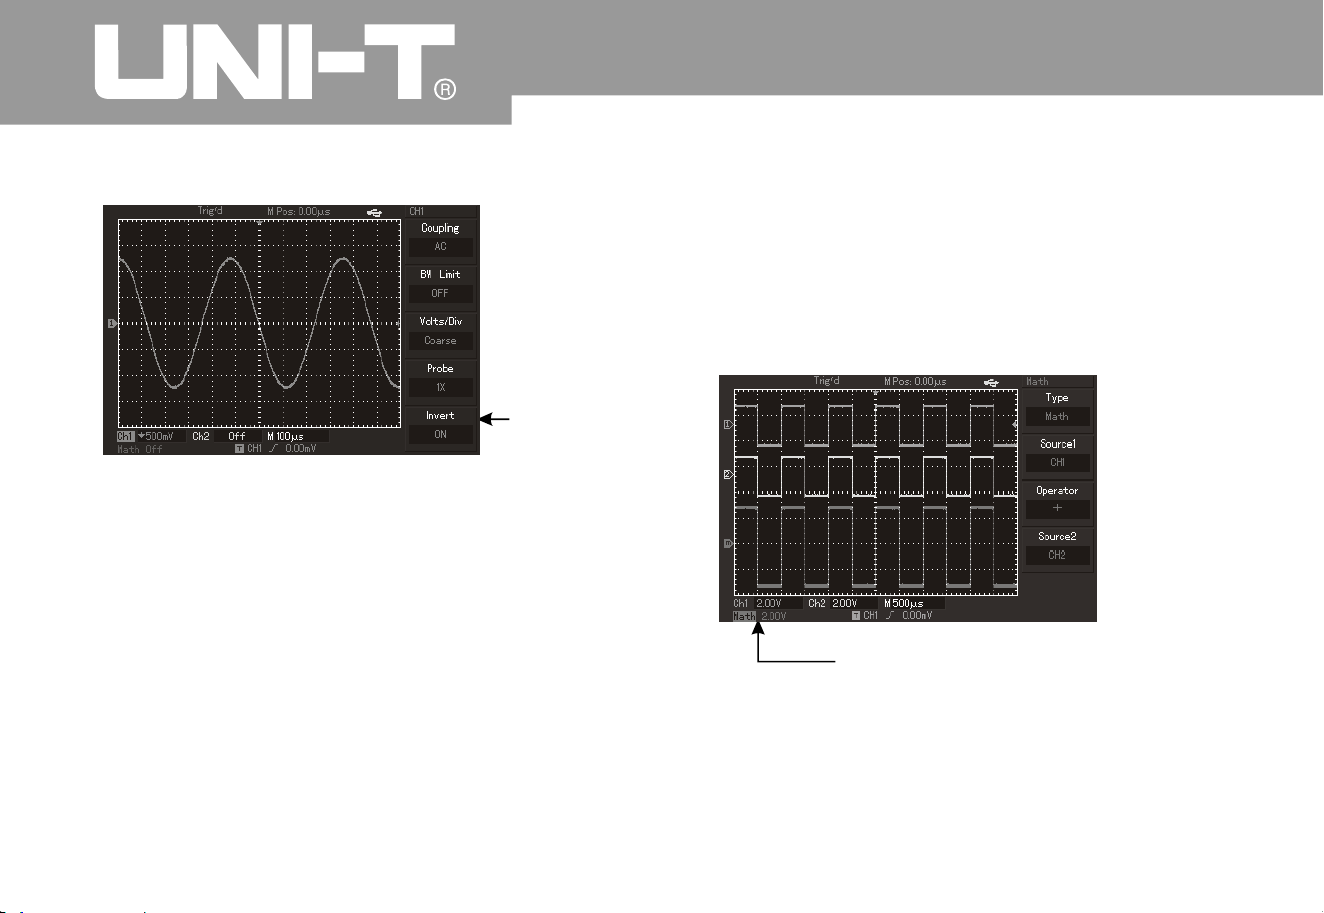
Regulation setup of vertical volt/grid Setup of reverse phase of waveform
Reverse phase of waveform:
㧦
㨪
㨪
㧙㧙
Volt/grid scope is 2mV/di
v
V/div (or 10V/div), or 1mV/div V/div with step
by way of 1 Deflection coefficient shall be
altered within current vertical gear scope by less
step during fine tuning so as to realize
uninterrupted and continuous adjustment of vertical
deflection coefficient within all vertical gears
.
5
20
Setup of
fine tunin
g
Figure 2 Coarse tuning and fine tuning of
vertical deflection coefficient
㧙7
It is to show overturning degree of phase location of
displayed signals. Please refer to Figure 2 for
waveform without reverse phase. Please refer to
Figure 2 for waveform with reverse phase
.
㧙
㧙
8
9
Without
reverse phase
Figure 2 Setup of reverse phase of vertical
channel (or without reverse phase
)
㧙8
Operating Manual for UTD2000/3000
2
1
Figure 2 9 Setup of reverse phase of vertical
channel
㧙
I. Realization of mathematical calculation
funct io
n
Mathematical calculation functions are to show +, -
,
, / as well as FFT calculation results for CH1 and
CH2 channel waveform. Menu is shown as follows:
h
Reverse phase
of waveform
Mathematical calculation
Figure 2 Mathematical calculatio
n
㧙1
0

Oper ating Man ual fo r UTD 2000/3000
Analysis of FFT frequency spectrum
Time domain signal can be converted to frequency
domain signal when using mathematical calculatio
n
of fast Fourier transtable (FFT). Following types of
signals can be observed conveniently by usin
g
FFT
Measure harmonic content and distortion withi
n
measurement system
;
㧦
Ɣ
Ɣ
Ɣ
Show noise characteristics in DC power
;
A
nalyze vibration
;
2
2
Function Menu
Setup Descriptio
n
Type
Mat
h
,
.
--
-
hr
Informatio
n
source
CH1
CH
2
To set information source 1
as Ch1 channel waveform
.
To set information source 1
as Ch2 channel waveform
.
,
.
Information source 1
Information source
2
Information source 1
Information source
2
Information source 1
Information source
2
Information source 1
Information source
2
,
.
Ø
r
Operator
Informatio
n
source
2
CH1
CH
2
To set information source
2
as CH1 channel waveform
.
To set information source
2
as CH2 channel waveform
.
Form 2-2: Introduction to mathematical calculatio
n
Ø
r

Form 2-3: FFT menu Descriptio
n
FFT operation knack:
Signals with DC component or deviation will brin
g
in error or deviation of FFT waveform component
.
A
C coupling mode can be selected to reduce D
C
component.
A
verage obtainment mode of digital storage
oscillograph can be set to reduce random noise
and aliasing frequency component of repeated or
single pulse event
.
Operating Manual for UTD2000/3000
2
3
Functio
n
Setup
Descriptio
n
Typ
e
FFT
FFT mathematical
calculation
Informatio
n
source
CH1
CH
2
To set CH1 and CH2 as
calculation waveform
.
Window
Hammin
g
Blackma
n
Rectangle
Set Hanning window
functio
n
Set Hamming window
functio
n
Set Blackman window
functio
n
Set Rectangle window
functio
n
Hannin
g
Vertical unit
Vr ms
dBVrm
To set vertical unit to
Vrms or dBVrms
.

Operating Manual for UTD2000/3000
Selection of FFT window
Mathematical storage oscillograph will carry out F FT conversion for time r ecord with limited length when
assuming continuous repetition of YT waveform. YT waveform will have the same amplitude in beginning
and ending locations for no interrupation. However, high-frequency transient interruption will be caused in
connector due to different waveform amplitudes for non-integral cycle of YT waveform. Such effect shall be
called as leakage in frequency domain. Therefore, value in forced beginning and ending locations is 0 b
y
multiplying original waveform by a window function to avoid leakage. Please refer to following form for
application of window function
.
Form 2-
4
24
FFT window
Characteristic
s
The most appropriate measurement content
Rectangle
The best frequency and the poorest
amplitude resolution to be basicall
y
similar to circumstances without window
;
Transient or short impulse with basically equivalent
signal level; Sine with equivalent amplitude wit
h
similar frequency; Wide band random noise of wave
spectrum with slow variation
;
Hannin
g
With excellent frequency resolution and
poor amplitude resolution by comparin
g
with rectangular window
;
Sine, cycle and narrow band random noise
Hammin
g
Frequency resolution of Hamming window
is better than that of Hanning window slightly
.
Transient or short impulse with large difference
for signal level
;
Blackma
n
The best amplitude resolution and the
poorest frequency resolutio
n
Mainly used for single-frequency signal to search
for higher order of harmonic wave
.

Operating Manual for UTD2000/3000
2
5
Te rm expl an ati on:
FFT resolution:
Nyquis t frequ ency:
Reference waveform
It is defined as factor of samplin
g
and calculation point. FFT resolution increases
when sampling rate decreases for fixed calculatio
n
point quantity
.
Original waveform can not be
reset until using sampling rate of at least 2f for
waveform with the maximum frequency of “f”. It is
also called as Nyquist guideline. “f” refers to Nyquist
frequency and “2f” refers to Nyquist sampling rate
.
Please refer to waveform stored in nonvolatile
memory (NVM) of digital storage oscillograph or
peripheral U disk with name of RefA and RefB as
follows. Please operate according to followin
g
steps to call out or close reference waveform
.
5. Please press REF menu key on the front panel
for 5.7-screen oscillograp
h
Please press [STORAGE]key and enter into the
second page to select call-out for 7-inc
h
oscillograph (namely, UTD2000L/2000EX series).
2. Please press [RefA] (RefA reference option) and
select information source then select its position b
y
rotating multi-purpose knob in upper part of front
panel. 1 10 (or 1 20) can be selected for the
position. Press “call-out” to call out waveform
which is stored inthe position originally after
selecting a certain position such as “1”. Please
plug in U disk if waveform is stored in the U disk
.
There are 2 options for magnetic disk as follows
:
DSO/USB; Please press [F2] key and select USB
.
(The menu can not be activated until plugging in U
disk.) Called out waveform is displayed on the
screen for waveform called out and stored from U
disk. Please press cancel key (F5) Return to
previous menu after waveform call-out
.
3. To press [RefB] (RefB reference option) and
select
㧧

information source 2 which participates i
n
calculation and method is the same to the
secondstep. Please measure and observe related
waveform by UTD2000/3000 series digital storage
oscillograph during actual application. Please
compare current waveform with reference
waveform for analysis. Please press REF key to
display reference waveform menu. Setup is also
shown in following form
.
Form 2-5 Selection of storage positio
n
It is allowed to select from 1 to 20 for internal
storage position. Please plug in U disk and press
F2 to select USB magnetic disk for external storage
instrument. Please refer to STORAGE menu for
waveform storage
.
Operating Manual for UTD2000/3000
2
6
Function menu
Setup
Descriptio
n
Storage positio
n
12
0
a
12
0
a refer to positions of
20 groups of waveform
respectively
;
There are 200 groups of
waveform positions for
storage to USB
;
(Storage position and quantity
vary withmachine model.
)
Magnetic disk
DSO
USB
To select internal storage position;
To select external storagepositio
n
(until plugging inU disk)
;
Close
To close called out waveform
;
Callout
To call out sel ected waveform;
Cancel
Return to previous menu;

Oper ating Man ual for UTD2000/3000
2
7
Setup of horizontal system
Horizontal control knob
Control knob on horizontal surface can be used to
alter horizontal scale (or time base) to trigger
horizontal position (or trigger position) shown i
n
RAM. Vertical middle point toward horizontal
direction on the screen is time reference point for
waveform. Horizontal scale can be altered for
waveform extension or shrinkage by comparin
g
with screen center. Horizontal position can also
alter by comparing with position of waveform
trigger point
.
Horizontal position: To adjust horizontal position of
channel waveform (including mathematical
calculation). Resolution of such control key varies
according to time base
.
Horizontal scale: To adjust main time base, namely
,
s/div. Window width can vary with delay scannin
g
time base by rotating horizontal scale knob whe
n
opening extension time base. Please refer to
introduction to extension time base for details. (As
shown in the following form), horizontal menu ca
n
be displayed for horizontal control key menu
.
Form 2 -
6
Function menu
Setup
Descriptio
n
Main time base
1
.
2
.
To open main time base
;
To close view window
extensionaccordingtomai
n
time base after opening
;
View window
extensio
n
To open extension time base
;
Hold off
To regulate inhibition period
;
üü
üü
üü
üü
üü

Mark Description:
Trigger horizontal distance of position b
y
comparing with middle point of view window
.
ķ
ˊ
ĸ
ˊ
Ĺ
ˊ
Ļ
ˊ
Mark represents position of current waveform
view window in RAM
Mark position of trigger point in RAM
.
Mark position of trigger point in current
waveform view window
.
Display horizontal time base (or main time
base), namely, s/div
.
ĺ
ˊ
Term explanation:
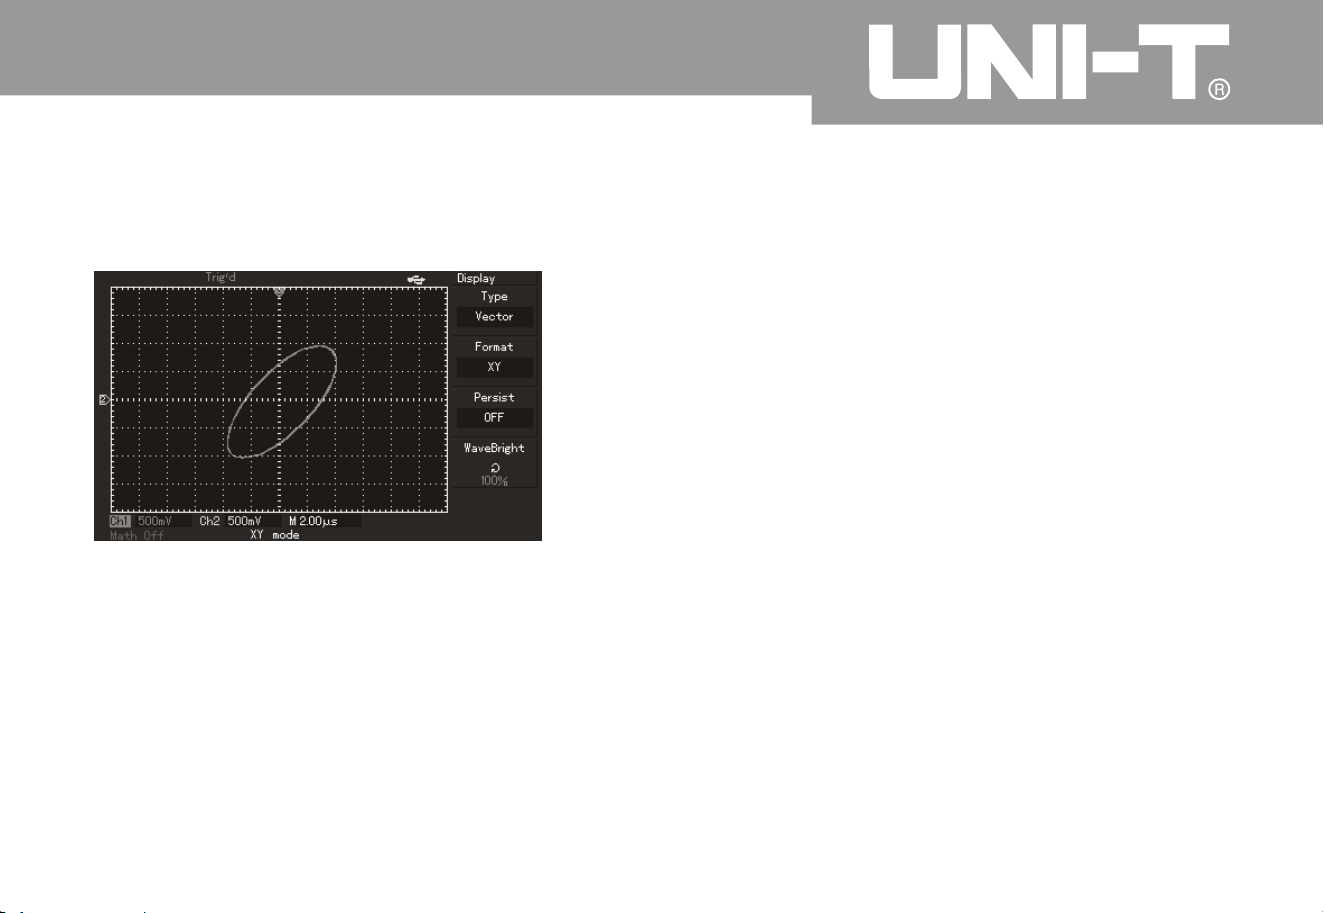
Y
-T mode:
X-Y mode:
Y axle refers to voltage and X axle
refers to time quantum under this mode
.
X axle refers to CH1 voltage and Y axle
refers to CH2 voltage under this mode
.
Slow scanning mode: Instrument will enter into
slow scanning sampling mode when settin
g
horizontal time base control to 100ms/div or less. It
is suggested to set channel coupling to DC whe
n
observing low-frequency signal by applying for
slow scanning mode
.
s-div: Time base control can expand or compress
waveform for horizontal scale (or time base) unit if
stopping waveform sampling (by using RUN/STOP
key).
Oper ating Man ual fo r UTD 2000/3000
2
8
Figure 2-11 Interface of horizontal system
Operating Manual for UTD2000/3000
2
9
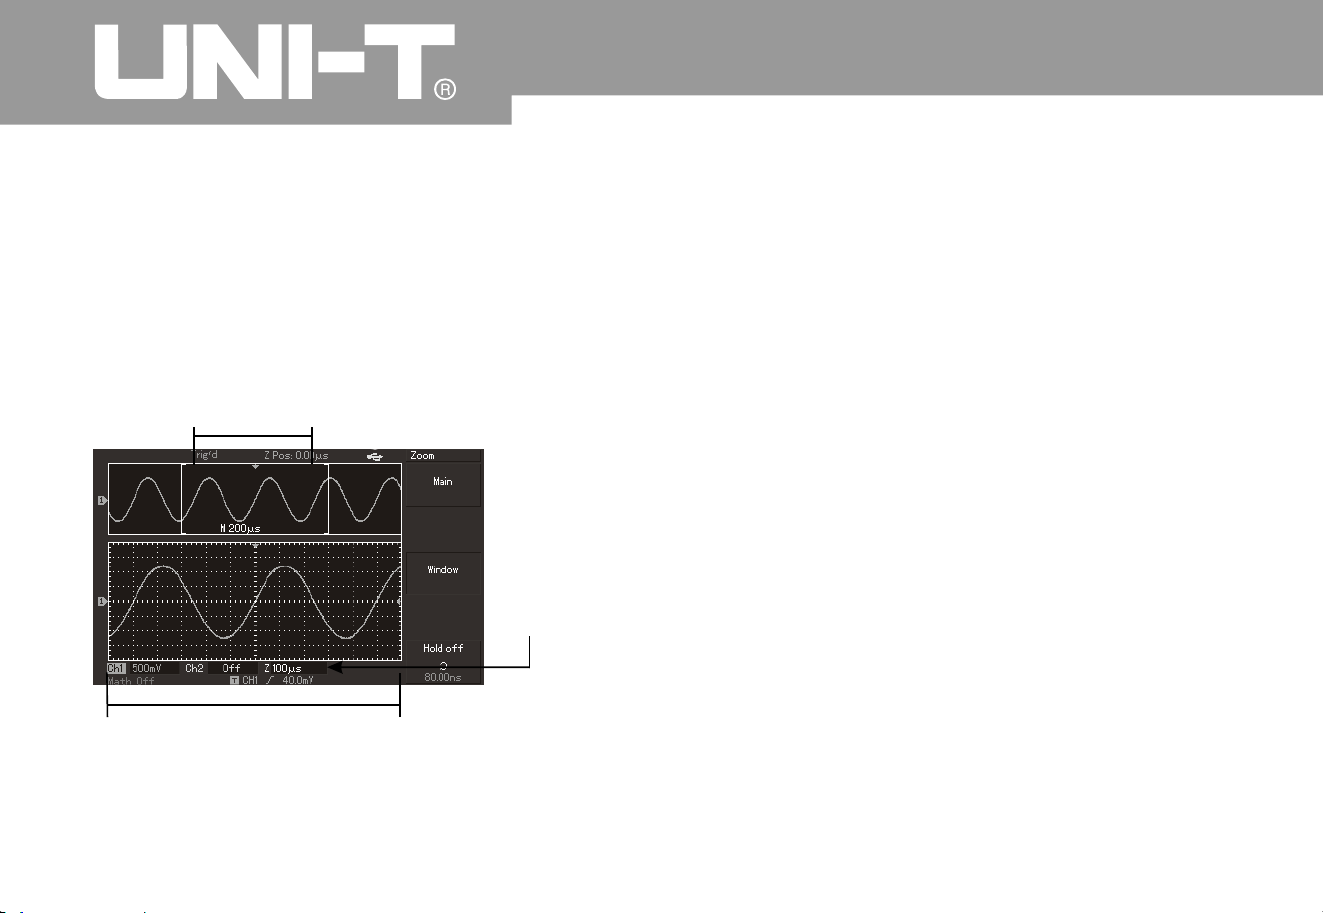
View window extension
View window extension is to argument a section of
waveform to review image details conveniently
.
Setup of view window extension can not be slower
than that of main time base
.
A
s shown in above figure), it can be divided into
2
display areas under extension time base. Original
wavef orm is di spl aye d fo r up per par t. Se lect ed area
can move horizontally by rotating horizontal
POSITION knob or increase or decrease by rotating
hori zont al SCAL E knob
.
(
Waveform with horizontal extension in originall
y
selected waveform area is shown in lower part. (As
shown in above figure,) please pay attention that
resolution increases for extension time base b
y
comparing with main time base. Waveform displayed
by the entire lower party corresponds to area
selected for upper part so users can rotate horizontal
SCALE knob to reduce selected area and increase
extension time base, namely, horizontal extensio
n
multiple of waveform
.
ThemodemustbeusedforCH1andCH2atthe
same time
.
CH1 voltage will be displayed on X axle and CH
2
voltage
Extensio
n
time base
Horizontal extensio
n
of the waveform
Horizontally extended part of the waveform
Figure 2 1 Screen display under view window
extensio
n
㧙 2
Oper ating Man ual fo r UTD 2000/3000
will be displayed on Y axle after selecting X-
Y
display mode
.
Note: Digital storage oscillograph can capture
waveform by any sampling speed under normal X-
Y
mode. Similarly, it is allowed to adjust samplin
g
rate, vertical gear of channels and time base gear
under X-Y mode. Default sampling rate is 100MS/s
under X-Y mode. In general, sampling rate ca
n
reduce to gain excellent Lissajou’s figure. Followin
g
functions do not effect during X-Y display
.
Automatic testing mode
Cursor measurement mode
Reference or mathematical calculation waveform
View window extension functio
n
Trigger cont
rol
Ƶ
Ƶ
Ƶ
Ƶ
Ƶ
30
Figure 2 Waveform display under X-Y mode㧙1
3

Oper ating Man ual fo r UTD 2000/3000
3
1
Setup of trigger system
Trigger can determine data acquisition time and
waveform display for digital storage oscillograph. It
can convert instable display to meaningful
waveform once correct setup. Digital storage
oscillograph will collect sufficient data to map
waveform in the left side of trigger point firstly. It
will acquire data continuously and synchronousl
y
when waiting for trigger conditions. It also will
acquire sufficient data continuously to map
waveform in the right side of trigger point. Trigger
control area of operation panel of digital storage
oscillograph includes trigger level adjustment knob
and trigger menu key of [TRIG MENU]
;
5.7-inch oscillograph will set 50% of trigger level i
n
vertical middle point of signal (and realize
UTD2000L /2000EX by press [SET TO ZERO] key)
.
It has to press forced trigger key of [FORCE]
.
Trigger level: Trigger level will set signal voltage
which corresponds to trigger point
.
50%: To set trigger level to vertical point of trigger
signal amplitude
.
FORCE: To produce 1 trigger signal forcefully for
mainly application for normal and single modes
shown in trigger modes
.
TRIG MENU: To trigger and set menu key
.

Operating Manual for UTD2000/3000
3
2
Trigger control
Trigger mode: Edge, pulse width, video and ALT TRIG
;
Edge trigger: Trigger when edge of trigger signal reaches a certain given level
.
Pulse width trigger: Trigger when pulse width of trigger signal reaches certain set trigger conditions
Video trigger: Carry out field or line trigger for standard video signals. (UTD2025CL/UTD2000EXseriesis
no such function.
)
A
LT TRIG: It is appropriate to trigger signal without frequency relevance. Various kinds of trigger menus
are also shown as follows
:
Edge trigger
:
Edge trigger mode is to trigger threshold value of input signal edge. That is, to trigger in ascending
/
descending edge of input signal when selecting “edge trigger”
.
Form 2-
7

Operating Manual for UTD2000/3000
3
3
Function menu
Setup
Descriptio
n
Type
Edge
Selection of
information source
CH1
CH
2
EXT
EXT/
5
Munic i pa l pow er
A
lteratio
n
Set CH1 as tri gg er si gn al o f info rma ti on s ou rce
.
et CH2 as trig ge r sig na l of inf or m atio n sou r ce
.
Set EXT TRI G INP UT chann el as trig ge r s ig na l of inf or m ati o n sou r ce
.
Divi de ou ter t rig ger sour ce by 5 to expand ou ter t rig ger lev el sco pe
.
Set muni c ip al po we r tri gg er
A
LT TRIG of CH1 an d CH2 sign al s;
.
Gradient
A
scen
d
Descen
d
A
scend/descend
Set a scending edge trigger for signal
;
Set d escending e dge trigger for signal
;
Set a scending/descending edge trigger of signal
;
Trigger mode
A
utomatic
Normal
Single
Set waveform acquisition without detecting trigger conditions
;
Set waveform acquisition after meeting trigger conditions
;
Set sampling of a waveform and shutdown after detecting once
trigger
;
Trigger couplin
g
AC
D
C
High-frequenc
y
inhibitio
n
Low-frequenc
y
inhibitio
n
Obstruct DC component of input signal
;
Pass through AC & DC components of input signal
;
Inhibit high-frequency components of more than 80kHz for signal
;
Inhibit low-frequency components of less than 80kHz for signal

Operating Manual for UTD2000/3000
Pulse width trigge
r
Trigger time shall be determined for pulse width trigger according to pulse width. You can capture
abnormal pulse by setting pulse width conditions
.
Form 2-8 (the first page
)
34
Fun ctio n m enu
Setup
Descriptio
n
Type
Pulse widt
h
Selection of
informatio
n
source
CH1
CH
2
EXT
EXT/
5
Municipal power
A
lteratio
n
To set CH1 as trigger signal of information source
.
To set CH2 as trigger signal of information source
.
To set EXT TRIG INPUT channel as trigger signal of information source.
To divide outer trigger source by 5 to expand outer trigger level scope.
To s et mun icipal pow er for trigg er
.
A
LT TR IG of CH1 and CH2 signals
Pulse widt
h
conditions
More tha
n
Less tha
n
Equal t
o
To trigger when pulse width exceeds set value
;
To trigger when pulse width is less than set value
;
To trigger when pulse width is equivale
Pulse widt
h
setup
To s et pul se width of 2 0ns to 10s the n r egulate by multi -purpose kno b i n
upper part of front panel
.
Next page
1/
2
Enter into next page
.

Operating Manual for UTD2000/3000
3
5
Form 2-9 (the second page
)
Function menu
Setup
Descriptio
n
Type
Pulse widt
h
Trigger polarit
y
Positive pulse widt
h
Negative pulse widt
h
Trigger mode
To set positive pulse width as trigger signal
;
To set negative pulse width as trigger signal
;
A
utomatic
Normal
Single
The system will acquire waveform data automaticall
y
and display scanning base line on the screen without
trigger signal input. It will convert to trigger scannin
g
automatically when producing trigger signal
.
To produce trigger scanning if any trigger signal is produced
.
To produce once trigger then stop during trigger signal input
.
Trigger couplin
g
D
C
AC
High-frequenc
y
inhibitio
n
High-frequency inhibitionTo pass through AC & D
C
components of trigger signal
.
To obstruct DC components of trigger signal
.
To obstruct pass through of high-frequency c omponents of
signal and only low-frequency c omponents can pass through
.
Previous page
2/
2
Return to previous page
.

Oper ating Man ual fo r UTD 2000/3000
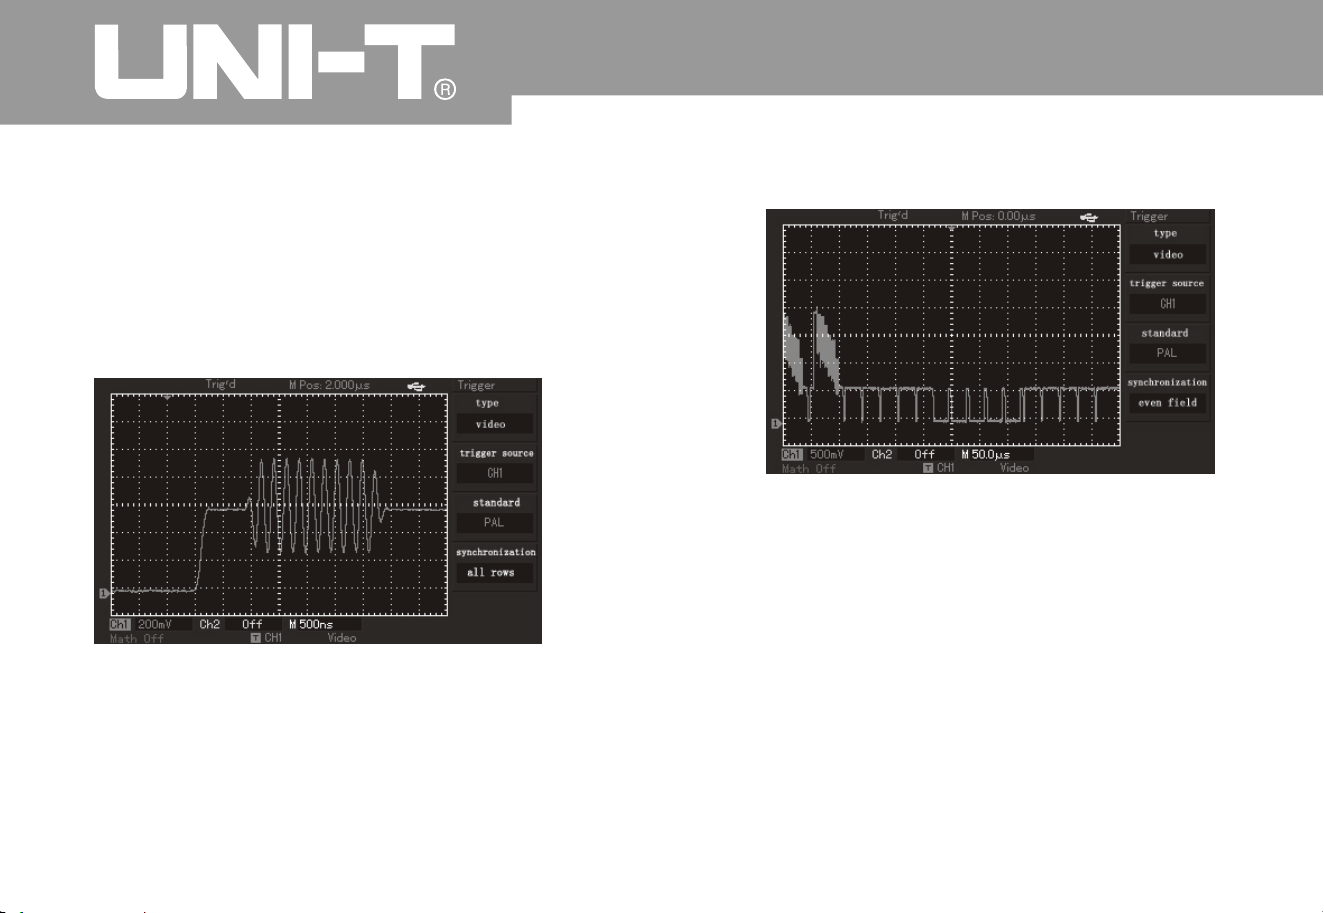
Video touc
h
To trigger in field or row with NTSC or PAL standard video signals after selecting video trigger for
UTD2025CL oscillograph shown in 5.7-inch or 7-inch screen. Trigger coupling is pre-set to DC. Please
refer to following form for trigger menu
.
Form 2-10 Setup of video trigger
3
6
Function menu
Setup
Descriptio
n
Type
Selection of
Pulse widt
h
information source
CH1
CH
2
EXT
To set CH1 as trigger signal of information source
.
To set CH2 as trigger signal of information source
.
To set EXT TRIG INPUT channel as trigger signal of
information source
.
To set 5 times of attenuation for outer trigger signal as trigger
signal
.
A
LT T RIG of CH 1 a nd CH 2 sig nal s
EXT/
5
A
lteratio
n
Standar
d
PA
L
NTS
C
Video signal to be appropriate to PAL system
;
Video signal to be appropriate to NTSC system
;
Synchronizatio
n
A
ll rows
Designated row
Odd fiel
d
Even fiel
d
To set synchronous trigger of video row
.
To set synchronous trigger of designated video row for
adjustment by multifunctional knob in upper part of front panel
.
To set synchronous trigger for video odd field
.
To set synchronous trigger for video even field
.
Oper ating Man ual for UTD2000/3000
3
7
Please refer to Figure 2-14 for screen display whe
n
selecting standard system of PAL and row
synchronization as synchronization mode. Please
refer to Figure 2-15 for field synchronization of
synchronization mode
.
Figure 2 14 Video trigger: Row synchronizatio
n
㧙
Figure 2 15 Video trigger: Field synchronizatio
n
㧙
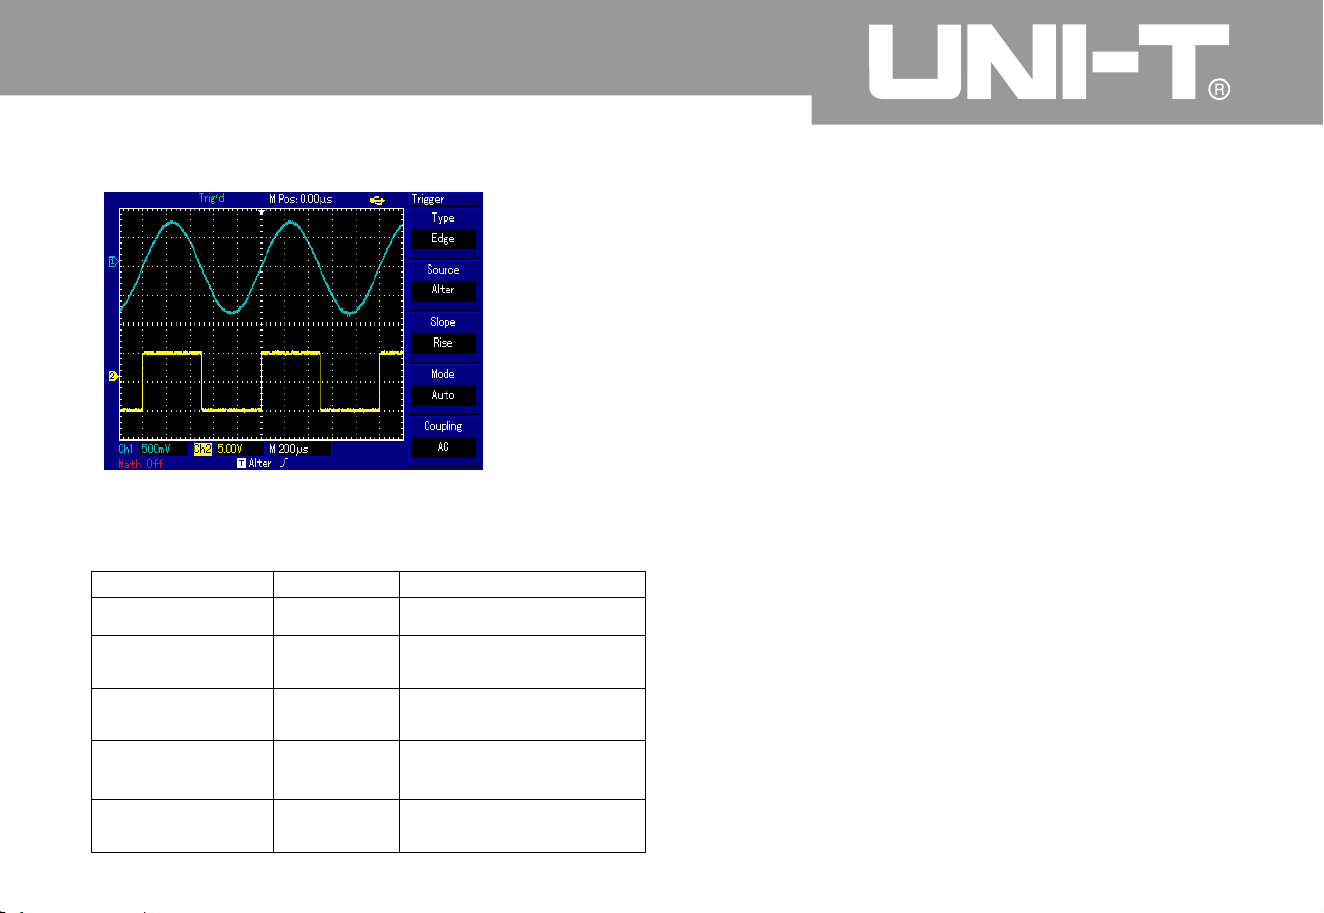
A
LT T RIG mode
A
LT TRIGTrigger signal comes from 2 vertical
chan nel s d urin g ALT T RIG. Suc h tr ig ger mode can be
adopted for synchronous observation of 2 signals
without regard to signal frequency. Please refer to
following figure for trigger alternation waveform
display
.
Setup of tri gger coupl ing m ode
Please enter into trigger setup menu for setup of
trigger coupling mode and gain the most sform
synchronization. Please refer to following form for
menu of trigger coupling mode
.
Operating Manual for UTD2000/3000
Form 2-11 Trigger alternation menu
Function menu
Setup Descriptio
n
Type
Edge
Set trigger mode to edge
Trigger source
A
lternatio
n
A
LT TRIG of CH1 and
CH
2
Gradient
A
scendin
g
Set trigger gradient to
ascending edge
.
Trigger mode
A
utomatic
Set trigger mode as
automatic one
Trigger couplin
g
AC
Set trigger couplin
g
modeto AC mode
Figure 2 Observation of 2 signals wit
h
different frequency by
.
㧙16
3
8

Form 2-1
2
Operating Manual for UTD2000/3000
3
9
Function menu
Setup
Descriptio
n
Type
Trigger source
Gradient
Trigger mode
Coupling
AC
D
C
High-frequency inhibitio
n
Low-frequencyinhibitio
n
Set pass -thro ugh o bstr ucti on of DC com pone nts
.
Set pass-through of all components
.
Obstruct pass-through of high-frequency part of signal. Only low-
frequency components can pass through
.
Obstruct pass-through of low-frequency part of signal. Only high-
frequency components can pass through
.
üü
üü
üü
üü

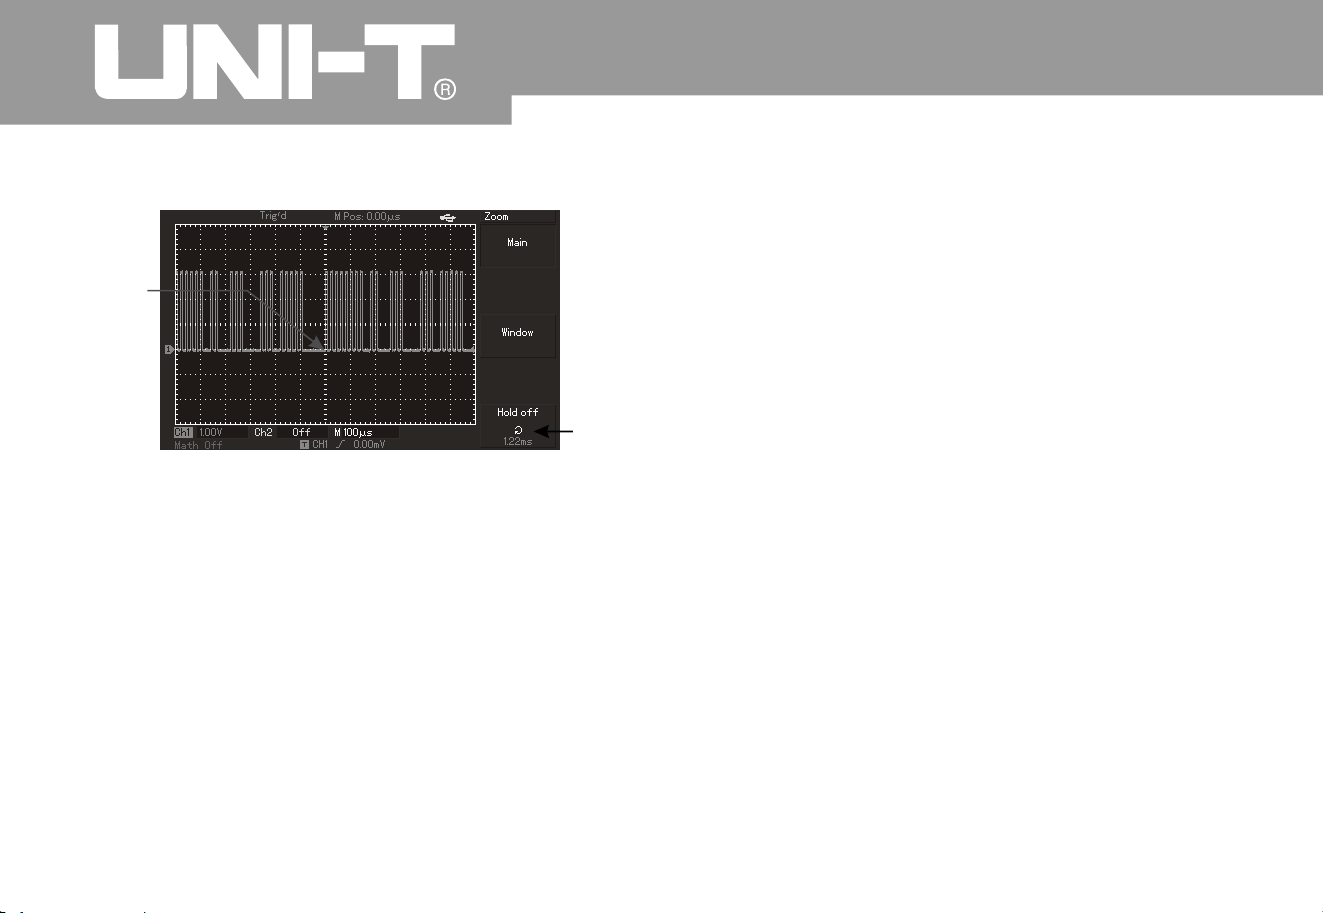
Adju stment of hold off tim e
A
djustment of hold off time can be used to observe complex waveform (such as pulse string series)
.
Inhibition time refers to waiting period of digital storage oscillograph to start up trigger circuit again
.
Digital storage oscillograph will not trigger until inhibition time ends during inhibition period. For instance
,
as shown in Figure 2-17, the first pulse among a group of pulse series shall be triggered to set inhibition
time to width of pulse string
.
Please refer to following form for hold off menu
.
Form 2-1
3
Operating Manual for UTD2000/3000
40
Function menu
Setup
Description
Main time base
1. To open main time base
;
2. To close view window extension according to main time base after openin
g
view window extension
.
View window extensio
n
To open extension time base
.
Hold off
To adjust inhibition time
.
üü
üü
üü
üü
Operating Manual for UTD2000/3000
4
1
Figure 2—17 Hold off used for synchronization
of complex waveform
Operation Description
1. To select edge, trigger source and gradient show
n
in TRIG MENU according to synchronization mode of
normal signal then adjust trigger level for stable
waveform display as practicable as possible
.
2. To press H ORI MENU key to display horizontal
menu
.
3. To adjust multi-purpose knob in upper part of
panel to alter inhibition time for stable waveform
display as practicable as possible
.
Term explanations
1. Trigger source: To gain trigger from many kinds of
information sources, namely, input channel (CH1
&
CH2), external trigger (EXT & EXT/5) and municipal
power
.
Input channel The most common trigger
information source is optional input channel
Selected one is used as channel of trigger
information source for normal operation regardless
of input displa
y
External trigger: Such trigger information source
can be used for trigger on the third informatio
n
channel during synchronous data acquisition o
n
channels For instance signals from external clock
or circuit t
o
meas
ure can be used as trigger information source
.
EXT and EXT/5 trigger sources shall use external
trigger signals
Ƶ
Ƶ
Trigger
Holdoff

connected to EXT TRIG interface. Signal can be
used for EXT and EXT can be used within signal
trigger level scope of -3V to +3V
.
A
utomatic trigger: The system will acquire
waveform data automatically so as to displa
y
scanning base line on the screen without trigger
signal input. It will convert to trigger scannin
g
automatically for signal synchronization whe
n
producing trigger signal
.
It is allowed to select EXT/5 for oscillograph of 5.7-
inch screen. Outer trigger shall be divided by 5 so
that trigger scope can expand to -15V to +15V for
trigger of digital storage oscillograph under large
signal
.
Municipal power: Such trigger mode can be used
to observe signal with regard to municipal power
.
For instance, it can provide relationship betwee
n
lighting equipment and power supply equipment so
as to gain stable synchronization
.
2 Trigger mode: It is to determine behavior mode
of digital storage oscillograph without trigger event
.
This digital storage oscillograph can also provide
3
triggers, namely, automatic, normal and single
trigger modes
.
Ƶ
Ƶ
Operating Manual for UTD2000/3000
4
2
Note: Without trigger signal is allowed under
“
automatic” m ode when setting scanning waveform to
5-ms/div or less time base
.
Normal trigger: Digital storage oscillograph ca
n
not acquire waveform until meeting trigger conditions
under ordinary trigger mode. Tr igger scanning can be
produced when producing trigger signal
.
Single trigger: User can press “operation” button
once under single trigger mode for entry and trigger
waiting for digital storage oscillograph. It will sample
and display all acquired waveform then stop after
digital storage oscillograph detects once trigger
.
Ƶ
Ƶ

Oper ating Man ual fo r UTD 2000/3000
4
3
3
.
4. Pre-trigger/delay trigger: To trigger data acquired
in ahead/after event. Trigger position is often set i
n
the horizontal center on the screen. You ca
n
observe pre-trigger and delay information of 5di
v
(or 6div). You can also rotate horizontal position to
regulate horizontal displacement of waveform and
review more pre-trigger details. You can observe
waveform in ahead of trigger by observing pre-
trigger data. For instance, burring reason can be
shown by observation and analysis on pre-trigger
data after capturing burring during circuit startup
.
Trigger coupling: Trigger coupling can determine
category of signal component conveyed to trigger
circuit. Coupling types include DC, AC, low-
frequency inhibition and high-frequency inhibition
.
Pass through all components of signals under
DC mode
.
Ƶ
Ƶ
Ƶ
Ƶ
Obstruct DC components with signal attenuatio
n
to be less than 400Hz under AC mode
.
Obstruct DC components with attenuation of
low-frequency component of less than 80kHz under
“low-frequency inhibition” mode
.
A
ttenuate high-frequency components of more
than 80kHz under “high-frequency inhibition” mode
.
Operating Manual for UTD2000/3000
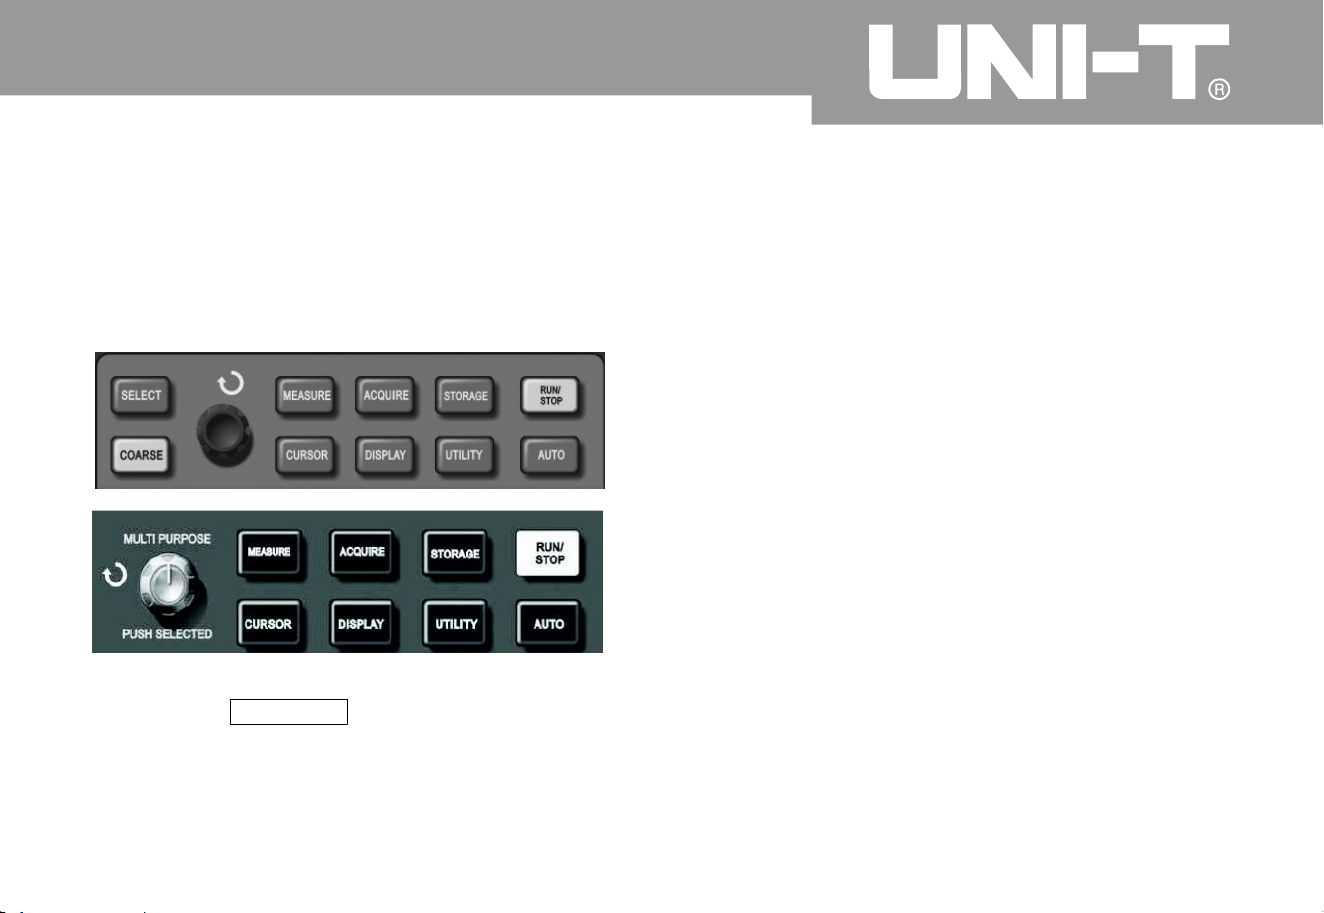
Setup of sampling system
As shown in following figure, ACQUIRE in
control area is function key of sampling
system
.
Figure 2 18 Function key of sampling system
User can use ACQUIRE key to pop out samplin
g
setup menu so as to adjust sampling mode b
y
control button shown in the menu
.
㧙
44

Operating Manual for UTD2000/3000
4
5
Form 2-14 Sampling men
u
Function menu
Setup
Descriptio
n
Obtainment mode
Samplin
g
Peak-value detectio
n
A
verage
A
ctivate ordinary sampling mode
.
A
ctivate peak-value detection mode
.
Set average sampling mode and display average times
.
A
verage times
2~25
6
Set average times for step by multiples of 2, namely, 2, 4, 8, 16
,
32, 64, 128 and 256. As shown in Figure 2-18, average times ca
n
alter by pressing left multi-purpose knob
.
Sampling mode
Real-time
Equivalent
Set sampling mode to real-time sampling mode
.
Set sampling mode to equivalent sampling m ode
.
Fast acquisitio
n
O
N
A
cquire by higher screen refreshing rate to reflect dynamic
effect of waveform excellently
.
Close fast acquisition
.
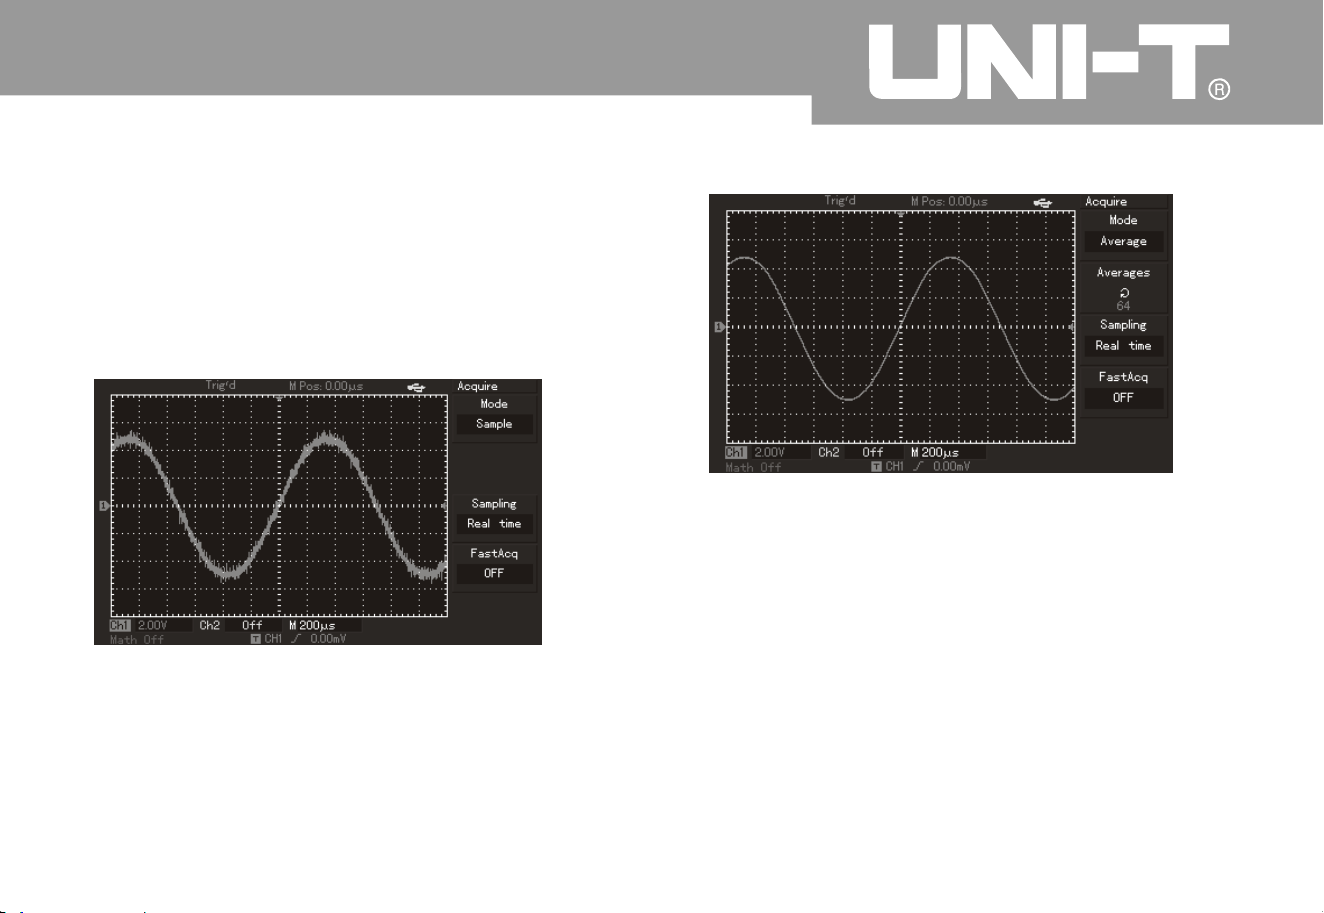
It has to observe waveform display variation b
y
altering obtainment mode. Please refer to Figure 2-
19 and 2-20 for sampled waveform display if signal
contains large noise when adopting 32 times of
average mode or without adopting average mode
.
Operating Manual for UTD2000/3000
4
6
Figure 2-20 Waveform by adopting 32 times of average mode
Figure 2 Waveform without adoptin
g
㧙1
9
Note
Please select real-time sampling mode for observation
of single signal
.
2. Please select equivalent sampling mode for observatio
n
of high-frequency periodic signal
.
3. Please select peak-value detection mode to avoid mixed
signal envelope. Please select average sampling mode wit
h
step of multiples of 2 for average value to reduce random
noise of displayed signal. Average times can be selected
form 2 to 256.
㧦
1

Term explanatio
n
Real-time sampling: It refers to data required for once acquisition
.
Equivalent sampling: It refers to repeated sampling mode. It can facilitate careful observation of repeated
periodic signals. It can be adopted to gain horizontal resolution which is higher than real-time sampling
resolution greatly
.
Sampling mode: It can be classified into equivalent and real-time modes
.
Peak-value detection mode
:
Digital storage oscillograph will find out the maximum and minimum input signals within every sampling
interval for waveform display by using such values under such obtainment mode. It can also obtain and
display narrow impulse or they may be omitted for larger noise under such mode. Average mode is as
follows: Digital storage oscillograph may obtain several waveform and calculate average value then
display final waveform under this obtainment mode. Such mode can be adopted to reduce random noise
.
Operating Manual for UTD2000/3000
4
7
Operating Manual for UTD2000/3000
Setup of display system
A
s shown in following figure, DISPLAY in control area is function key of display system
Figure 2 Function key of sampling system
Please press DISPLAY button to pop out setup menu shown in following figure. Display mode can be
adjusted by pressing menu control button
.
㧙
4
8

Oper ating Man ual fo r UTD 2000/3000
4
9
Key points
:
Display type: To fill in blank between adjacent sampling points during vector display. Only sampling points
will be displayed for point display
.
Function menu Setup
Description
s
Display type
Vector point
Only to display sampling points by wiring
.
Format
YT
X
Y
Operation mode of digital storage oscillograp
h
X-Y display mode; X input for CH1 and Y input for CH2
;
Continuous
Close
1s
2s
5s
Infinite
Real-time updating of screen waveform
;
To update after keeping waveform data shown in the screen for 1s
;
To update after keeping waveform data shown in the screen for 2s
;
To update after keeping waveform data shown in the screen for 5s
;
To always keep display of original waveform data shown in the screen
until this function is inactivated if new data is added into displa
y
continuously
;
W aveform brightness
1% - 100%
To set waveform brightness (without this function for
UTD2000C/3000C
)
Form 2-15 Display menu
Storage and callout
A
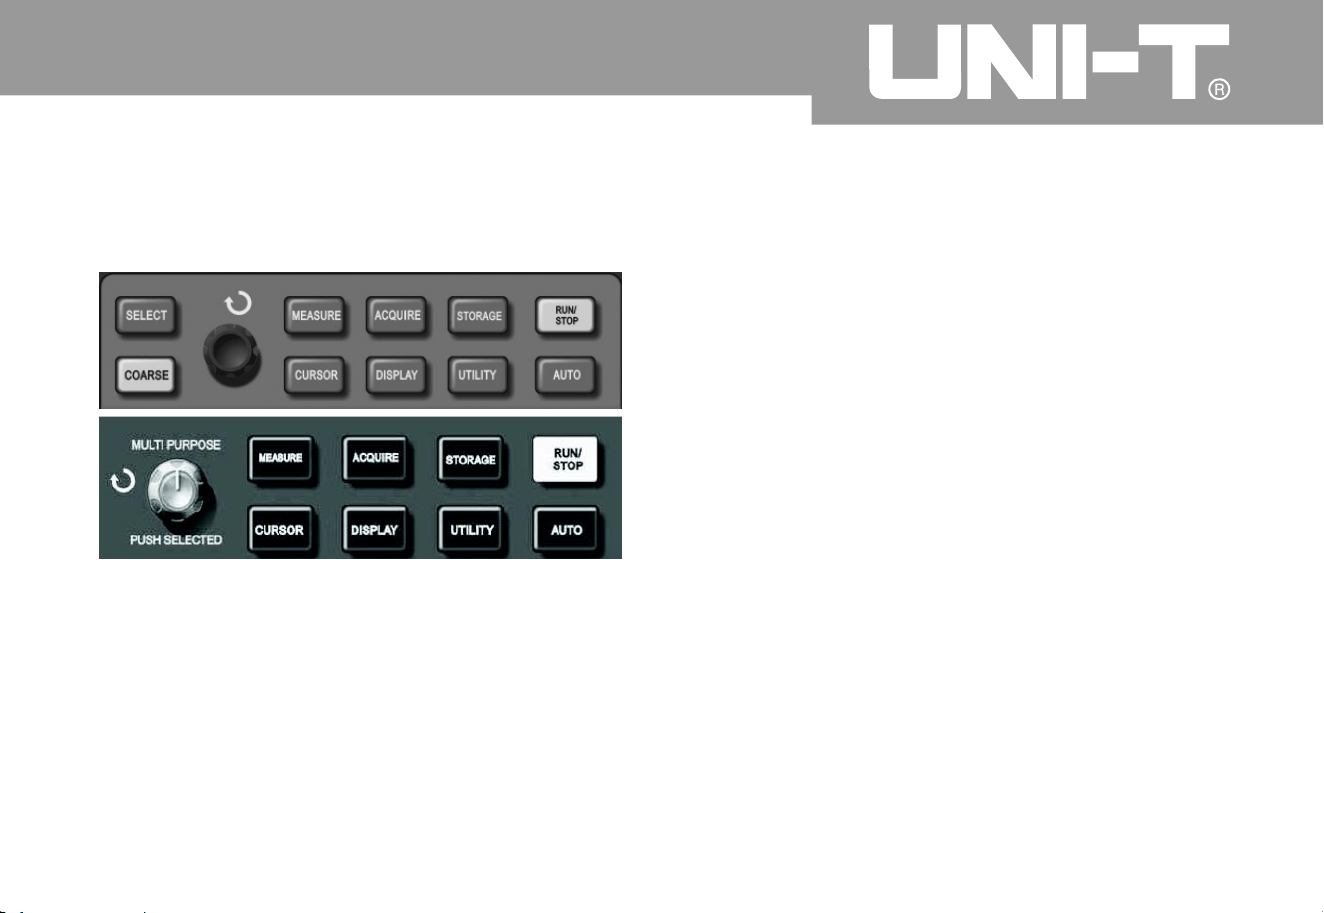
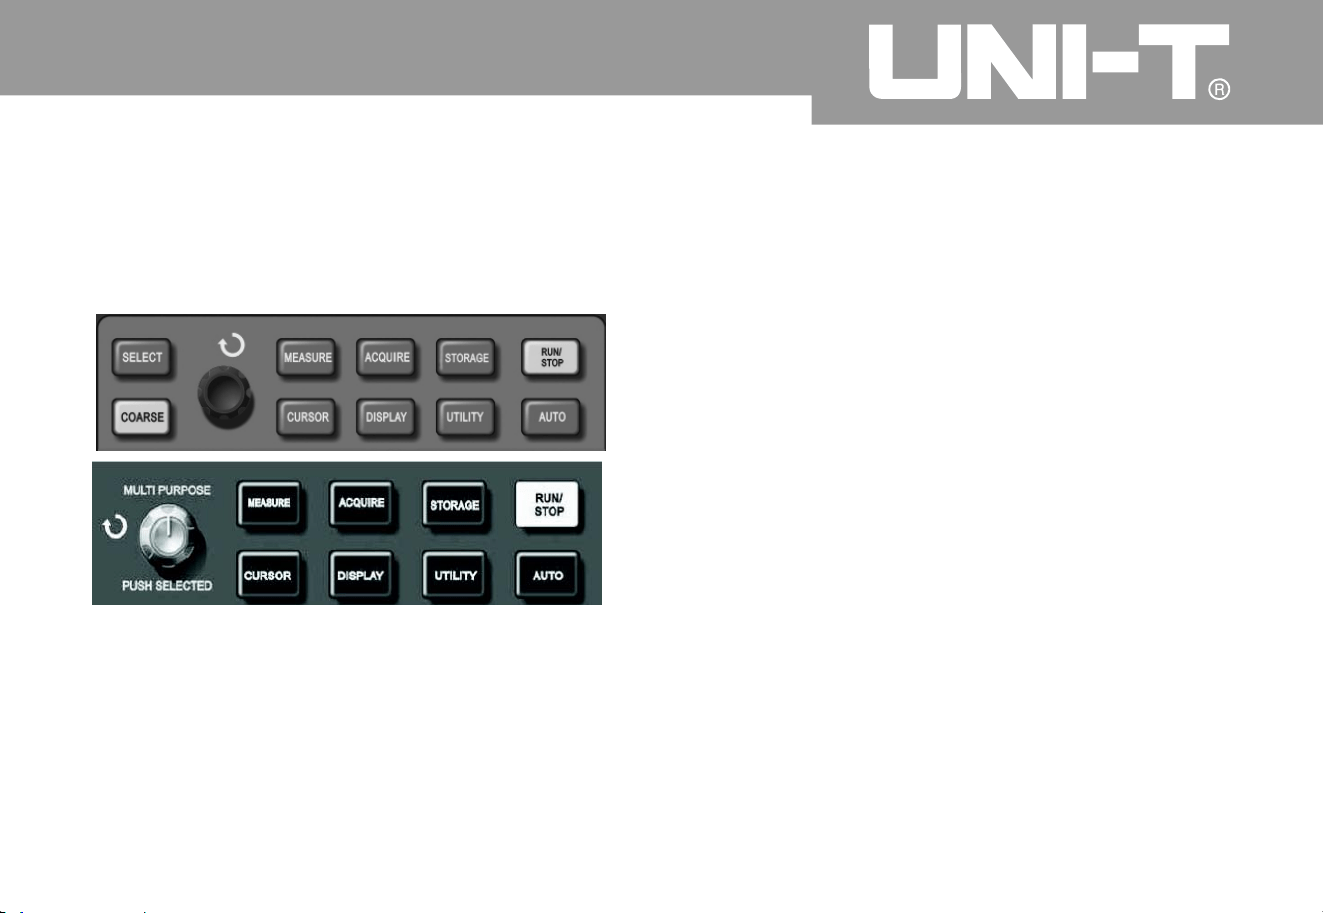
s shown in following figure, STORAGE in MENU
control area is function key of storage system
.
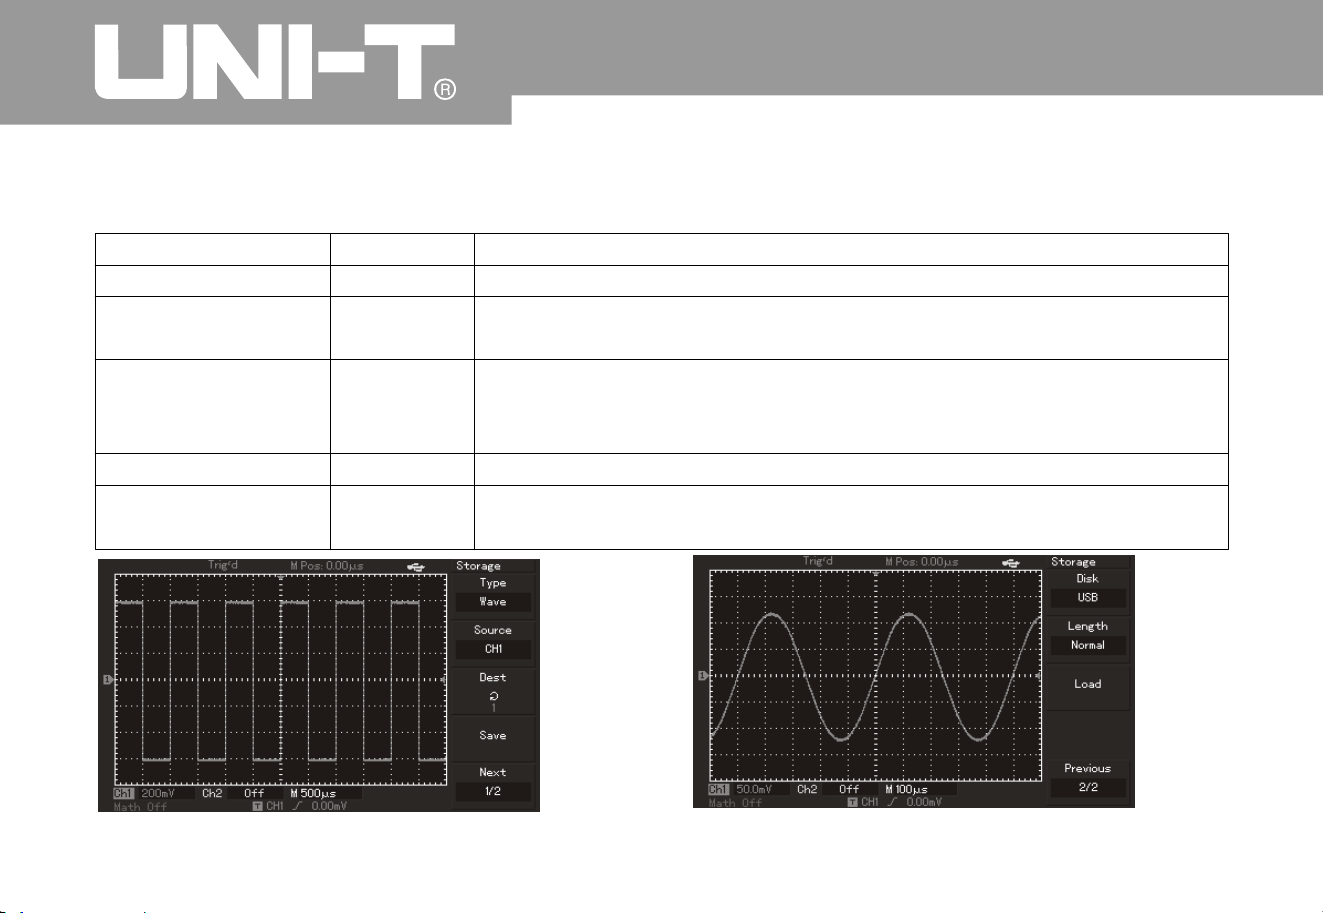
Operation steps
Please press STORAGE Enter into type menus
.
There are 3 types, namely, waveform, setup and
bitmap
.
Please refer to Figure 2-16 for selection of type
waveform and entry into following waveform
storage menu. Please call out REF (reference
waveform shown in the second page) from Section
2 of the chapter after saving waveform
.
Form 2-16 Waveform storage menu (the first page)
㧦
2.
Operating Manual for UTD2000/3000
50
Figure 2 22 Function key (storage) for sampling system
STORAGE key can b e used to display storage setup menu. You
can save oscillograph waveform or setup status to internal
storage area or U disk to call out saved waveform by Ref
A
(or RefB) or call out setup status by STORAGE key. Waveform
display area of oscillograph can be saved to DSO contents in U
disk in a form of bitmap. Saved bitmap can be read by PC computer
.
㧙
Oper ating Man ual fo r UTD 2000/3000
5
1
Form 2-16
Function menu
Setup
Descriptio
n
Type
Wa ve fo rm
Select waveform storage and callout menu
Information source
CH1
CH
2
Select waveform from CH1 channel
.
Select waveform from CH2 channel
.
Storage positio
n
12
0
a
12
0
a refer to positions to store 20 groups of waveform
.
There are 200 groups of waveform positions for storage to USB
.
(Storage position and quantity vary with machine m odel.
)
Save
Save waveform
Next page
1/
2
Enter into next page
.
Figure 2-23 Waveform storage
Figure 2-24 Waveform storage by U disk
üü
üü

Oper ating Man ual fo r UTD 2000/3000
Form 2-17 Storage menu (the second page
)
5
2
Function menu
Setup
Descriptio
n
Magnetic disk
DSO
USB
To select internal RAM of digital storage oscillograph the
n
select external U disk. (This function can not be used until
plugging in U disk.
)
Storage dept
h
Ordinar
y
Long storage
To set storage depth to ordinary; (Callout only can be done i
n
REF area when saving data to U disk.
)
To set storage depth to long storage. (Note: This function ca
n
not be activated until plugging in U disk. Callout can not be
done until using loading function of computer communicatio
n
software or waveform analysis load when saving data to U d isk.
)
Previous page
2/
2
Return to previous page
.
üü
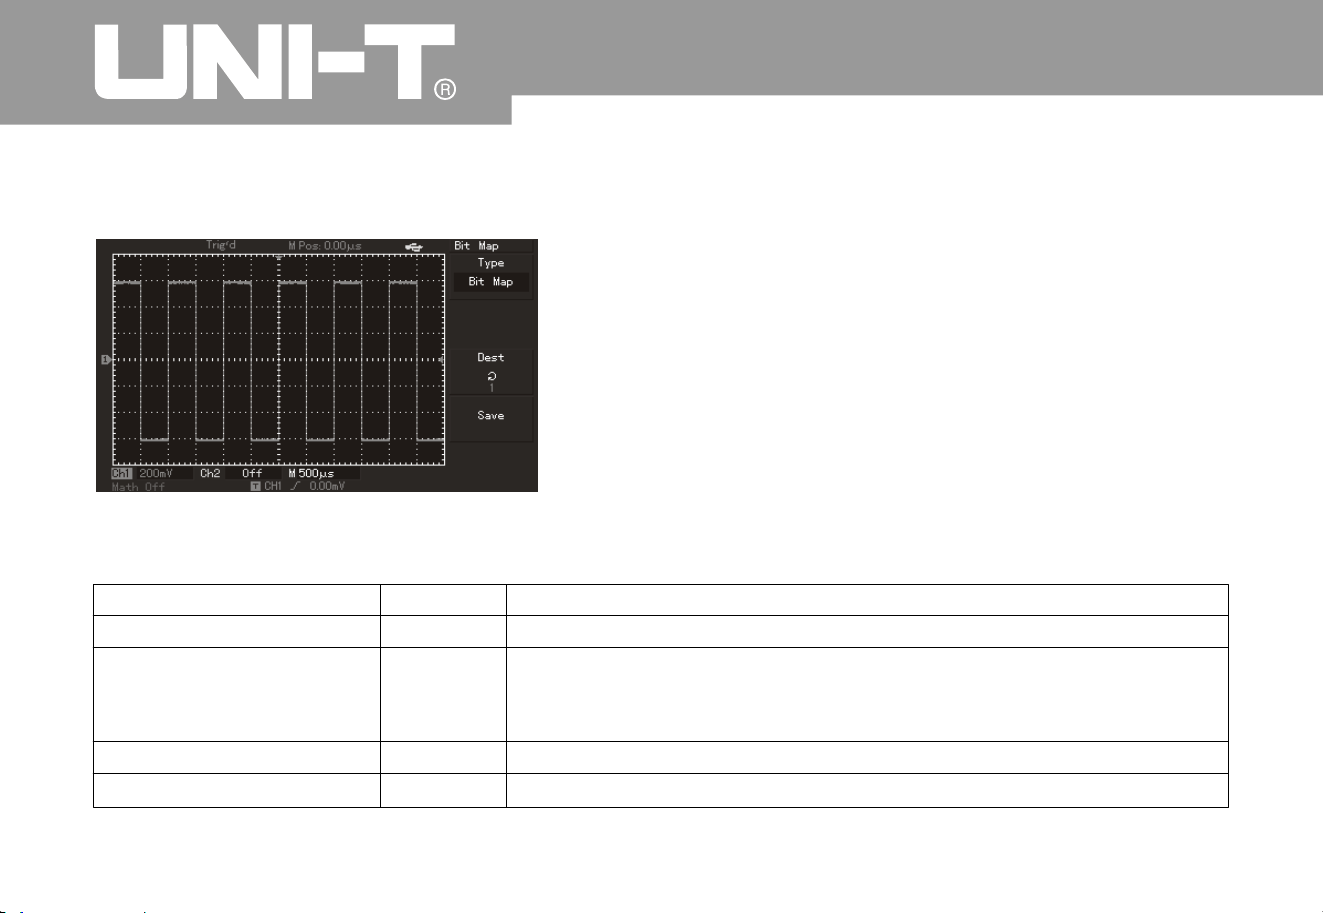
2
A
s shown in Form 2-18, please select setup and enter into setup storage menu
.
Figure 2-25 Storage setup
Form 2-18 Setup of storage menu
5
3
Operating Manual for UTD2000/3000
Function menu
Setu
p
Description
Setup
To select panel setup menu
.
Setup of (storage position
)
12
0
Operation setup to save 20 groups of panels: To select by multi
-
purpose knob in upper part of front panel. (Position and quantit
y
vary with machine model
Save
Storage setup
Recall
Callout setup
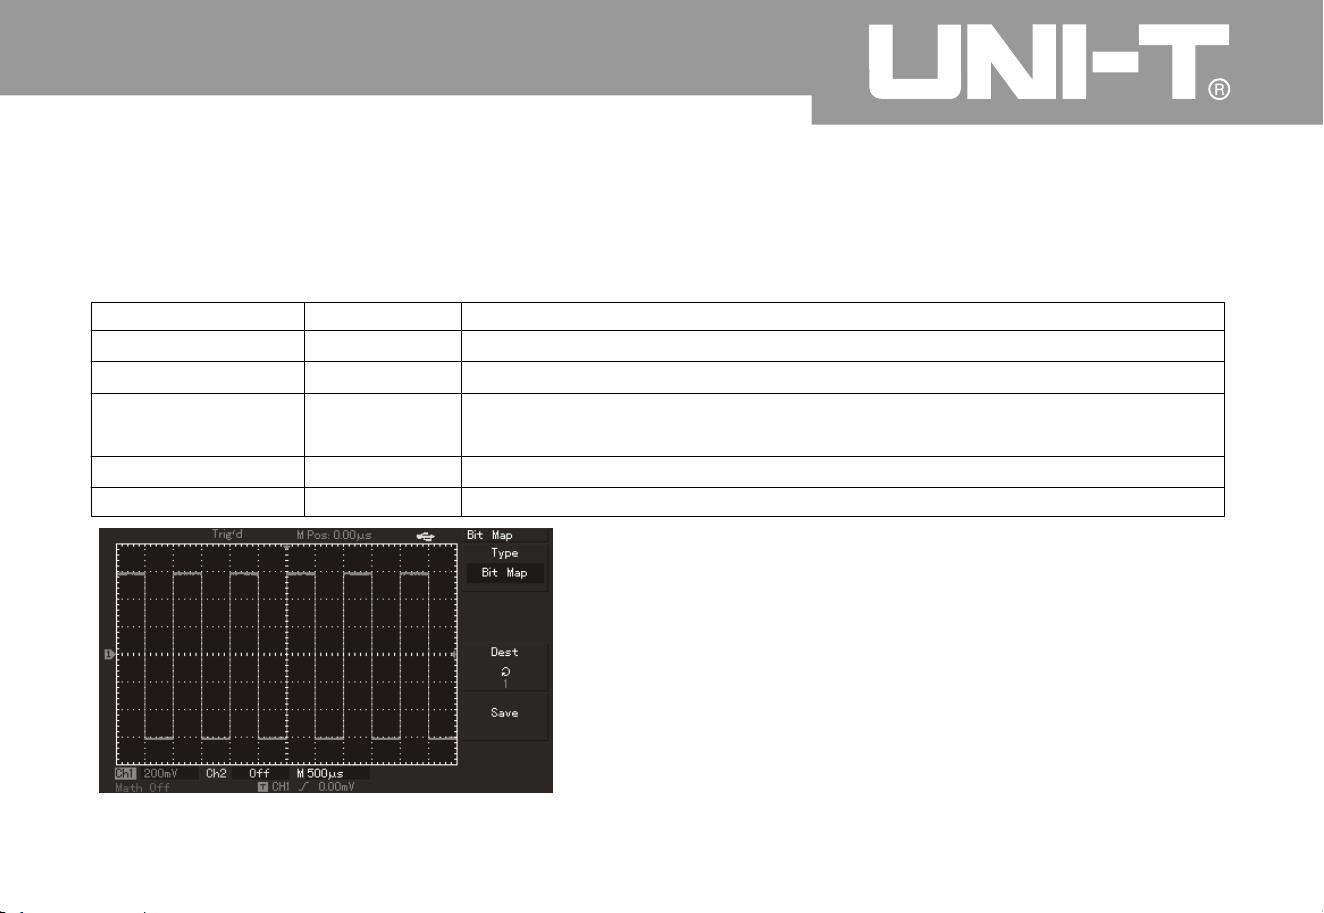
54
3
.
A
s shown in Form 2-19, please select bitmap for entry into bitmap storage menu
.
Remark: This function can not be called out until plugging in U disk
.
Form 2-19 Bitmap storage menu
Operating Manual for UTD2000/3000
Function menu
Setup
Descriptio
n
Bitmap
Select bitmap menu
Storage positio
n
12
0
200 bitmap data can be saved by selecting multi-purpose knob in
upper part of front panel. (It is 1 to 10 for UTD2000C series.
)
Save
Save bitmap data
üü
üü
Figure 2-26 Bitmap storage
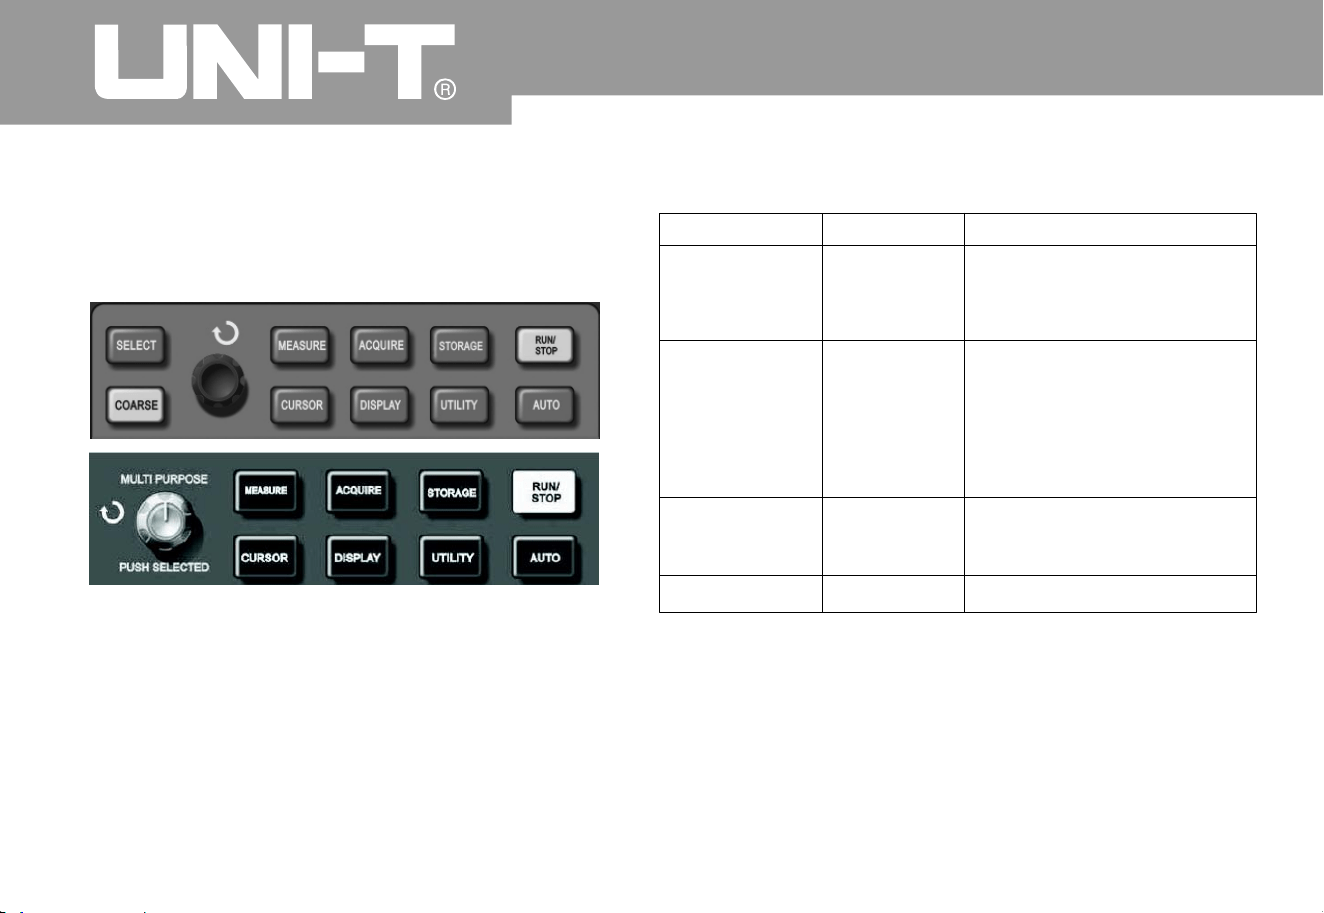
Setup of auxiliary functions
A
s shown in following figure, UTILITY in MENU
control area is function key
.
Figure 2 27 Function key (and function) of
samplin
g
User can press UTILITY key to pop out setup menu
of auxiliary system function
.
Form 2-20 (the first page
)
㧙
5
5
Oper ating Man ual for UTD2000/3000
Function menu
Setup
Descriptio
n
Self-correctio
n
Cancel
To carry out self-correction
.
To cancel self-correction and
return to previous page
.
Executio
n
By detectio
n
Please refer
to For m 2-2
3
To set w aveform Pass/Fail
.
(Only UTD2000E/3000E
,
UTD2025C/3025C and
UTD2025CL have this
function.
)
Waveform
recordin
g
Please refer
to Form 2-2
2
Set waveform recordin
g
operation
.
Language Multilanguage
Select interface language
.

5
6
Operating Manual for UTD2000/3000
Form 2-21-1 (the second page
)
Function menu
Function menu
Setup
Setup
Descriptio
n
Descriptio
n
Fast correctio
n
ON/OFF
A
ctivate/inactivate fast correction function of channels within scope
of 2mV/div to 10 mV/div. (Only UTD2025C/3025C has this function.
)
Interface style
The first style
The secondstyle
The third style
Thefourthstyle
Set 4 interface styles for digital storage oscillograph
.
Gridding brightness
1% - 100%
A
djust gridding brightness of the screen by multi-purpose knob
.
UTD2000C/3000C also has no this function
.
Next page
2/
3
Enter into next page
.
Form 2-21-2 (the third page
)
üü
System informatio
n
Display information of current oscillograph system
.
Frequency meter
A
ctivate/inactivate function of frequency meter
.
The first page
3/
3
Return to the first page
.
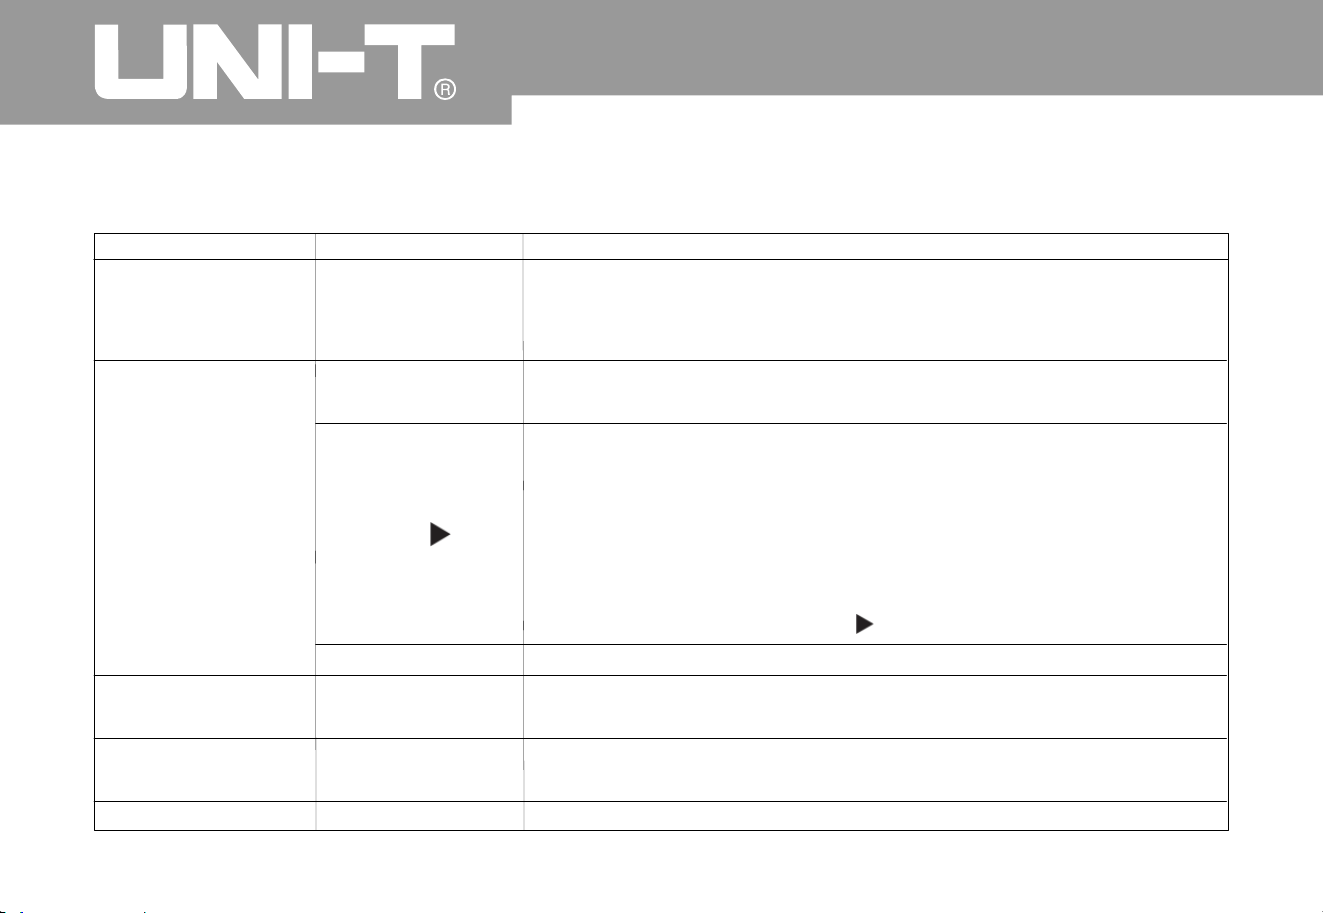
Form 2-22 Waveform r ecording menu
5
7
Oper ating Man ual fo r UTD 2000/3000
Function menu
Setup Descriptio
n
Information source
CH1
CH
2
CH1+ CH
2
Select CH1 as recording signal source
.
Select CH2 as recording signal source
.
Select ct CH1+CH2 as recording signal source
.
Operatio
n
Record by pressing recording key for synchronous display of
recorded quantity in lower part of the screen
.
1
.
Playback key
;
2. Press the key for playback and display of current playback
screen No. in lower right corner of screen. Playback can be
stopped by rotating multi-purpose knob controller in upper part
of panel. However, waveform of a certain screen can be selected
for repeated playback by continuing to rotate it
.
3Press to stop then press for playback of all items
.
ƽ
Ƶ
Ƶ
Stop recordin
g
Save
1~20
0
Save newly recorded waveform for U disk plug-in. Storage
position can be selected by multi-purpose knob
.
Recall
1~20
0
Call out r eco rde d wa vef or m fr om U dis k th en s elec t re cor din
g
posi tio n by mul ti -pur pose kno b
.
Retur
n
Return to previous level of menu
.
üü

5
8
Operating Manual for UTD2000/3000
Form 2-23 By detectio
n
Function menu
Setup
Descriptio
n
Detection status
Ope
n
Close
Open/close information of waveform pass/fail times
Information source
CH1
CH
2
MAT
H
Ref
A
RefB
Select CH1 as detected signal source
.
Select CH2 as detected signal source
.
Select MATH as detected signal source
.
Select RefA as detected signal source
.
Select RefB as detected signal source
.
Output conditions
Pass
Pass/Halt
Fail/Halt
Fail
Output concurrency prompt when detecting waveform pass
;
Output and pause when detecting waveform pass
;
Output and pause when detecting waveform fail
;
Output concurrency when detecting waveform fail
;
Template setup
Refer to Form
2-24 for details
Enter into template setup menu
.
Retur
n
Return to previous menu
.

5
9
Key note:Key note
:
Self-correction: Self-correction procedure is to
correct measurement error caused by digital
storage oscillograph due to ambient variation. You
can operate the procedure according to demand
.
Please open power of digital storage oscillograp
h
then wait for instrument pre-heating for 30 minutes
for more correct calibration. Please press UTILIT
Y
key (as an auxiliary function) for operatio
n
according to prompt shown in the screen
.
Language selection: There are many kinds of
languages for UTD2000/3000 series digital storage
oscillograph. Please press UTILITY me
n
u butto
n
and select appropriate language
.
Oper ating Man ual fo r UTD 2000/3000
Form 2-24 Template setup
Function menu
Setup
Descriptio
n
Template output
Set horizontal and vertical
Pass/Fail tolerance scope
accordingtoadjustment
Horizontal 1-200Pixel
Set horizontal tolerance
scope
Vertical
1-100Pixel
Setvertical tolerance scope
Retur
n
Return to Pass detectio
n
men
u
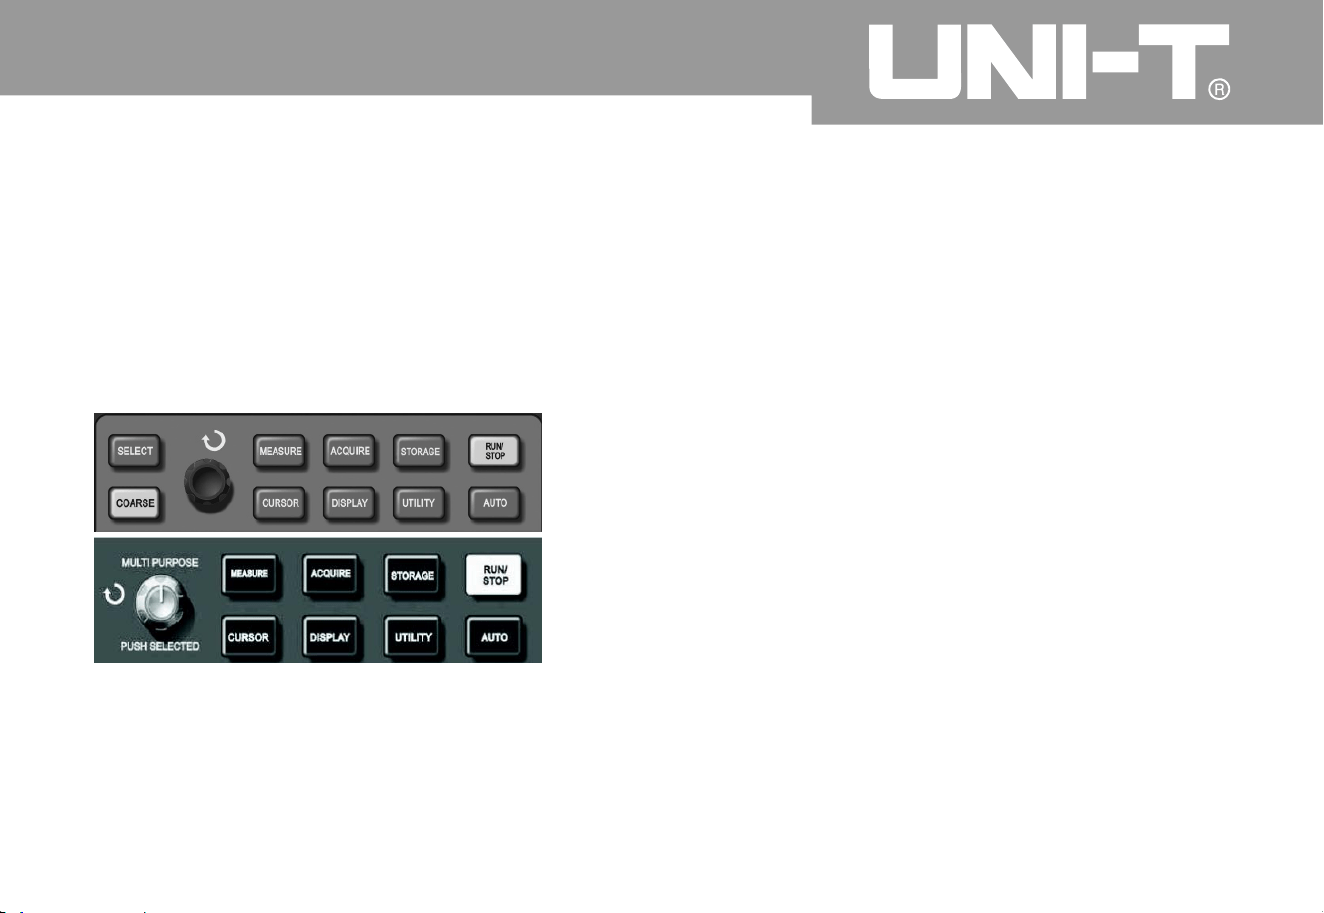
60
Automatic measurement
A
s shown in following figure, MEASURE is
automatic measurement function key. You can be
familiar with powerful automatic measurement
function of UTD2000/3000 series digital storage
oscillograph gradually by following introduction
.
Application example
Measurement menu of such series of oscillograp
h
can be used to measure 28 kinds of waveform
parameters. User can press MEASURE key Enter
into parameter measurement display menu firstly.
The menu includes 5 areas to display measurement
value at the same time. They correspond to functio
n
keys of F1 to F5 respectively. Please press
corresponding F keys Enter into measurement
category selection menu if measurement category
shall be selected for any area. M easurement
category selection menu can be classified into
voltage and time kinds Enter into voltage or time
measurement category respectively. Please press
F1 to F5 to select measurement category the
n
return to parameter
measurement display menu. In addition,user ca
n
Operating Manual for UTD2000/3000
Figure 2-28 Function key (automatic measurement
)
of sampling system

press F5 to select “All parameters” to display all
voltage/time measurement parameters. User ca
n
press F2 to select channel to measure. (Channel is
ineffective until opening.) User can press F1 Retur
n
to parameter measurement display menu if not
altering current measurement category. The first
example: Steps are as follows if displayin
g
measured peak value of CH2 channel in F1 area
.
1. To press F1 key Enter into measurement
category selection menu
;
2. To press F2 to select CH2
;
3. To press F3 to select voltage
;
4. To press F5 (shown in the second page, 2/4) to
see that F3 position is “peak value
”
5. To press F3 to select “peak value” and return to
parameter measurement display menu
automatically
;
Peak value is displayed in F1 area on the
homepage of measurement menu
.
The secondexample: Setup of delay measurement:
Delay measurement function is used for interval
between ascending edges of 2 information sources
,
namely, interval from ascending edge of the first
cycle of a certain information source to that of the
first cycle of additional information source
.
Measurement steps are as follows
:
1. To refer to above example and select area
displayed by delay measurement value after
entering into measurement menu (shown in 3/
3
page of time category)
;
2. To select reference information source of CH1
then select delay information source of CH2
;
3. To select reference information source of
then select delay information source of CH2
;
4. To press F5 to confirm that delay measurement is
displayed in selected area
.
CH
1
6
1
Oper ating Man ual fo r UTD 2000/3000

Automatic measurement of voltage parameters
Voltage parameters which can be measured b
y
UTD2000/3000 series oscillograph automaticall
y
are as follows
:
Peak value (Vpp): Voltage from the highest
waveform point to the lowest waveform point
;
The maximum value (Vmax): Voltage from the
highest waveform point to GND (ground)
;
The minimum value (Vmin): Voltage from the lowest
waveform point to GND (ground)
;
Middle value (Vmid): Half of sum of waveform top
and bottom voltage
;
A
mplitude (Vamp): Voltage from waveform top to
bottom
;
Middle value (Vmid): Half of sum of waveform top
and bottom voltage
;
Top value (Vtop): Voltage from flat wa
v
eform top t
o
GND (ground)
;
Bottom value (Vbase): Voltage from waveform
bottom to GND (ground);
Overshoot: Ratio of difference of the maximum
waveform value and top value and amplitude
;
Preshoot: Ratio of difference of the minimum
waveform value and bottom value and amplitude;
A
verage value: Average amplitude of signals withi
n
a cycle
;
Root-mean-square (Vrms): It is effective value
.
Root-mean-square refers to DC voltage of
converted energy within 1 cycle according to A
C
signal to correspond to equivalent energy
.
Operating Manual for UTD2000/3000
6
2

Automatic measurement of time parameters
UTD2000/3000 series oscillograph can measure
signal frequency, cycle, ascending time
,
descending time, positive pulse width, negative
pulse width, delay (of 9 combinations), positive dut
y
cycle, negative duty cycl e and 10 time parameters
automatically. Definitions of such time parameters
are as follows
:
RiseTime: It refers to period when waveform
amplitude increases from 10% to 90%
;
FallTime: It refers to period when waveform
amplitude decreases from 90% to 10%
;
Positive pulse width (+Width): It refers to pulse
width of positive pulse under 50% of amplitude
;
Negative pulse widt
h
(-Width): It refers to pulse
width of negative pulse under 50% of amplitude
;
Delay (ascending edge): It refers to delay from
ascending edge to ascending edge
;
Delay (descending edge): It refers to delay from
descending edge to descending edge
;
Positive duty cyc le (+Duty): It refers to r atio of
positive pulse width and cycle
;
Negative duty cycle (-Duty): It refers to ratio of
negative pulse width and cycle
;
Operation Description: Please press MEASURE
key so that the screen can display 5 measurement
values. As shown in Form 2-25, user can press any
key of F1 to F5 so that the screen enters into
me
asurement selection menu
.
Measurement menu
Oper ating Man ual fo r UTD 2000/3000
6
3

Operating Manual for UTD2000/3000
64
Form 2-2
5
Function menu
Setup
Descriptio
n
Retur
n
Return to parameter measurement display menu
.
Information source
CH1
Select channel of measurement parameters
.
CH
2
Select channel of measurement parameters
.
Voltage kin
d
Enter into voltage parameter menu
.
Tim e kin
d
Enter into time parameter menu
.
A
ll parameters
Display/close all measurement parameters
.
Form 2-2
6
Function/measurement item
Descriptio
n
Retur
n
Return to menu shown in Form 2-25
.
Preshoot
Return to parameter measurement display menu and
substitute original position parameter after selection
.
A
mplitude
he same as above
Overshoot
The same as above
Next page (1/4
)
Page turnin
g
Of which: Menu included by “voltage kind” is shown in Form 2-26 to 2-29
.

6
5
Form 2-27
Function/measurement item
Function/measurement item
Descriptio
n
Descriptio
n
Oper ating Man ual for UTD2000/3000
Previous page
Return to previous page
.
A
verage value
Return to parameter measurement display menu and substitute
original position parameter after selection
.
Peak value
he same as above
he same as above
Root-mean-square
Next page (2/4
)
Page turnin
g
Form 2-2
8
Previous page
Top value
Return to previous page
.
Return to parameter measurement display menu and substitute
original position parameter after selection
.
Bottom value
The same as above
The same as above
Middle value
Next page (3/4
)
Page turnin
g

6
6
Oper ating Man ual fo r UTD 2000/3000
Function/measurement item
Function/measurement item
Descriptio
n
Descriptio
n
Previous page
Retur
n
Return to previous page
.
Return to menu shown in Form 2-25
.
The maximum value
Frequenc
y
Return to parameter measurement display menu and substitute
original position parameter after selection
.
Return to parameter measurement display menu and substitute
original position parameter after selection
.
The minimum value
Cycle
The same as above
The same as above
Next page (4/4
)
Next page (1/3
)
Return to the first page (shown in Form 2-26
)
Page turnin
g
Form 2-2
9
Form 2-3
0
üü üü
Menu included by “time category” is shown in Form 2-30 to Form 2-32
.
The same as above
RiseTime

6
7
Oper ating Man ual fo r UTD 2000/3000
Function/measurement item
Function/measurement item
Descriptio
n
Descriptio
n
Previous page
Previous page
Return to previous page
.
Return to previous page
.
Frequenc
y
Dela
y
Return to parameter measurement display menu and substitute
original position parameter after selection
.
Enter into delay option menu (shown in Form 2-32a) after
selection
.
Cycle
Positive duty cycle
The same as above
Return to parameter measurement display menu and substitute
original position parameter after selection
.
Next page (2/3
)
The first page (3/3
)
Page turnin
g
Return to the first page (shown in Form 2-30)
.
Form 2-31
Form 2-3
2
The same as above
The same as above
RiseTime
Negative duty cycle
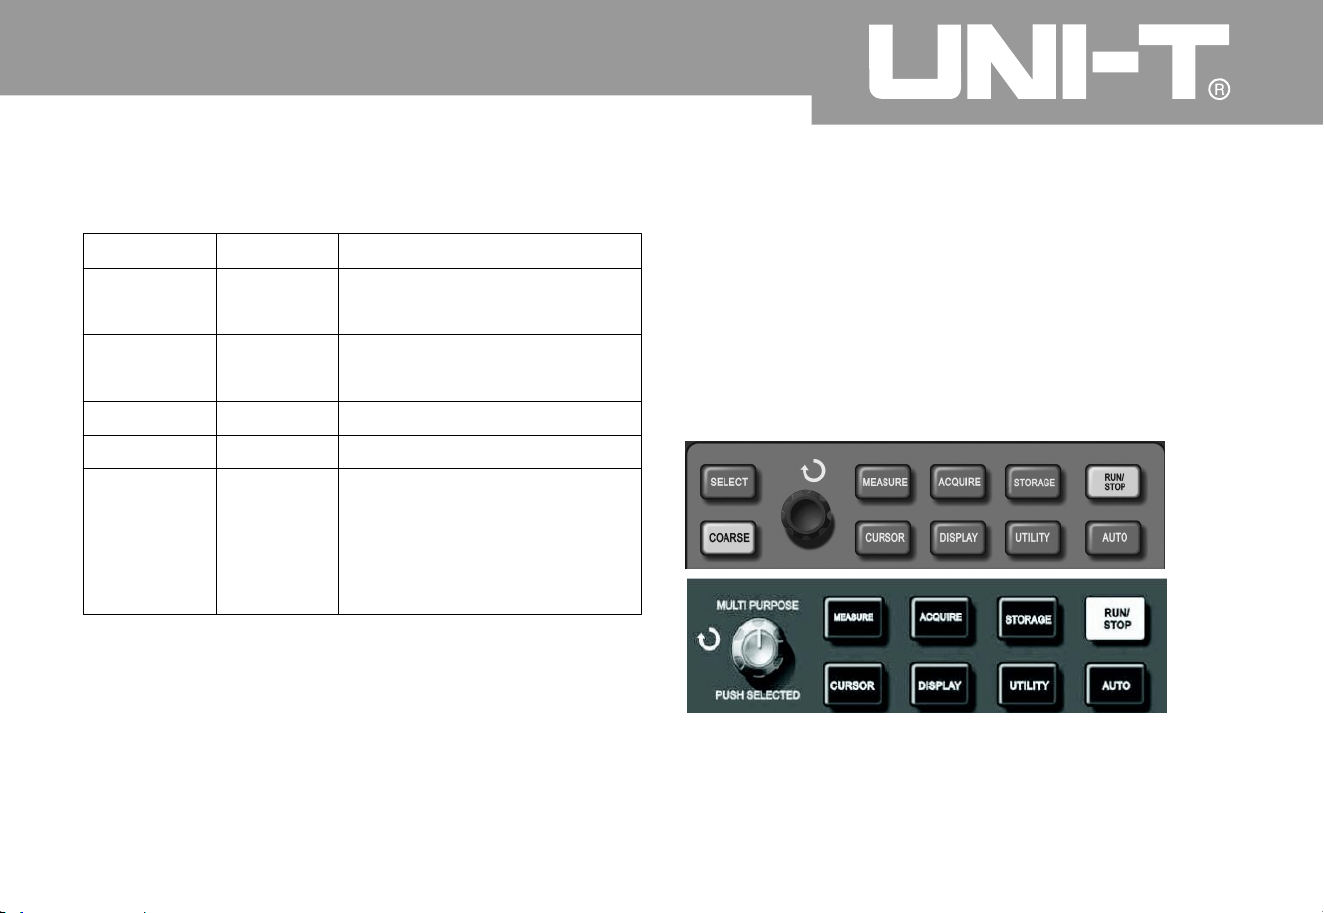
Cursor measurement
User can press CURSOR button to displa
y
measurement cursor and cursor menu then use
multi-purpose knob controller to alter cursor
position. As shown in following figure, CURSOR in
MENU control area is cursor measurement functio
n
key
.
Figure 2-29 Function key (or cursor) of samplin
g
system
6
8
Operating Manual for UTD2000/3000
Return to parameter
measurement display men
u
and substitute original
position parameter after
selection
.
Form 2-32a
Functio
n
Setup
Descriptio
n
Channel
Channel
CH1/C H
2
/MAT
H
CH1/C H
2
/MAT
H
Select measured channel
.
üü
üü
üü
üü
Enter

User can move cursor for measurement under
CURSOR mode. There are 3 modes, namely, voltage
,
time and tracing. V can be measured by pressin
g
SELECT and COARSE keys on the panel and multi-
purpose knob controller to adjust positions of
2
cursors respectively during voltage measurement
.
Similarly, it can be measured if selecting time. Cursor
of digital storage oscillograph can a lso trace signal
variation automatically under tracing mode wit
h
waveform display
.
Remark: For 5.7-inch oscillograp
h
1. Effe ct of SELECT key is to select the cursor
.
2. Effect of COARSE key is to adjust movement speed
of cursor
.
For 7-inch oscillograph
:
User can press multi-function knob key to select the
cursor. Movement speed of cursor can also alter
according to rotation speed
.
1. Voltage/time measurement mode: The first or
secondcursor will appear at the same time. Cursor
position on the screen can be adjusted by multi-
purpose knob controller. User can press SELECT ke
y
(or multi-function knob key) to select cursor to adjust
.
Displayed reading is also time or voltage between
2
cursors
.
2. Tracing mode:
H
orizontal and vertical cursors ca
n
intersect to become a crossing cursor. Cr ossin
g
cursor can position on the waveform automatically to
adjust horizontal position o f crossing cursor on the
waveform by rotating multi-purpose knob controller
.
Digital storage oscillograph can also displa
y
coordinate of cursor point at the same time
.
3. Measurement value will be displayed in upper
right corner of the screen automatically whe
n
opening cursor function
.
Operating Manual for UTD2000/3000
6
9
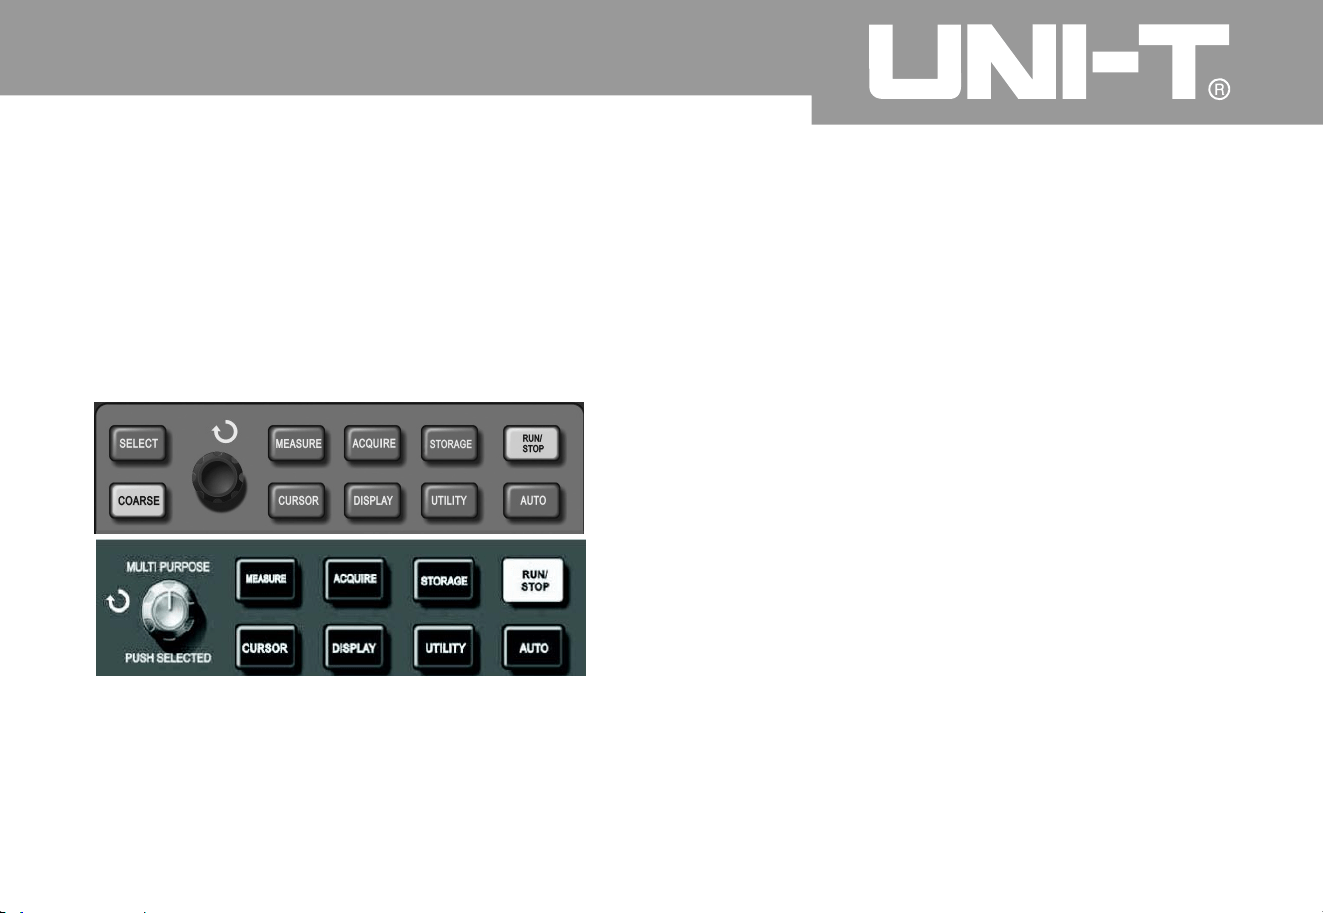
Usage of operation ke
y
RUN/STOP key is in upper right corner of front
panel of digital storage oscillograph. User ca
n
press the key so that green lamp is on to show
operation status. Red lamp can be on after pressin
g
the key to show stop status
.
Figure 2-30 Operation/stop ke
y
A
s shown in above figure, automatic setup is to
simplify operation. Digital storage oscillograph ca
n
adjust vertical deflection coefficient and horizontal
time base gear automatically for stable waveform
display on the screen according to waveform
amplitude and frequency when user presses AUTO
key. System setup is shown in following form durin
g
automatic setup
:
Automatic setup
Oper ating Man ual fo r UTD 2000/3000
70

RUN/STOP: To acquire waveform or stop
acquisition continuously;
The key can be pressed for switchover of waveform
sampling between operation and stop. User ca
n
press the key under operation status so that green
lamp is on. “Auto” can be displayed in upper part of
the screen. Old digital storage oscillograph ca
n
acquire waveform continuously while red lamp is o
n
by pressing the key under stop status. Digital
storage oscillograph can stop acquisition whe
n
displaying “Stop” in upper part of the screen
.
Oper ating Man ual fo r UTD 2000/3000
7
1
Functio
n
Setup
Obtainment mode Samplin
g
Display format
Set to YT
Horizonta l positio
n
A
utomatic adjustment
A
djustment according to signal
frequenc
y
Second/gri
d
Trigger couplin
g
AC
Hold off
The minimum value
Trigger level
Set to 50%
A
utomatic
Trigger mode
Trigger source
Set t o CH1 ; Set t o C H2 whe
n
exerting on signal for it if there
is no signal for CH1
;
Trigger gradient
A
scendin
g
Trigger type
Edge
A
llVertical band widt
h
Volt/gri
d
A
djustment according to signal
amplitude

Operating Manual for UTD2000/3000
7
2
Chapter 3: Applicatio n Example
The first example: Measurement of simple signal
It has to observe a unknown signal in the circuit for
quick display and measurement of signal frequenc
y
and peak value
.
2
1. Please operate according to following steps for
quick signal display
:
1. Please operate according to following steps for
quick signal display
:
To set probe menu attenuation coefficient to 10*
and set switch on the probe to 10*
.
To connect CH1 probe to measured point of
circuit
.
To press AUTO button
.
Digital storage oscillograph can set automaticall
y
for the best waveform display. You can also adjust
vertical or horizontal gear on above basis so that
waveform display can meet related requirements
.
A
utomatic measurement of signal voltage and
time parameters
Digital storage oscillogra
ph can measure most of
display signals automatically. Please operate
according to following steps for measurement of
signal frequency and peak value
.
To press MEASURE key to display automatic
measurement menu
;
To press F1 to enter into measurement menu
category for selectio
n
To press F3 to select voltage categor
y
To press F5 to turn to 2/4 page then press F3 to
select measurement type of peak value
To press F2 to enter into measurement menu
category for selection then press F to select
time categor
y
ķ
ķ
ĸ
Ĺ
ĺ
Ļ
ྚ
ྛ
ļ
To press F2 to select measurement type of
frequency.
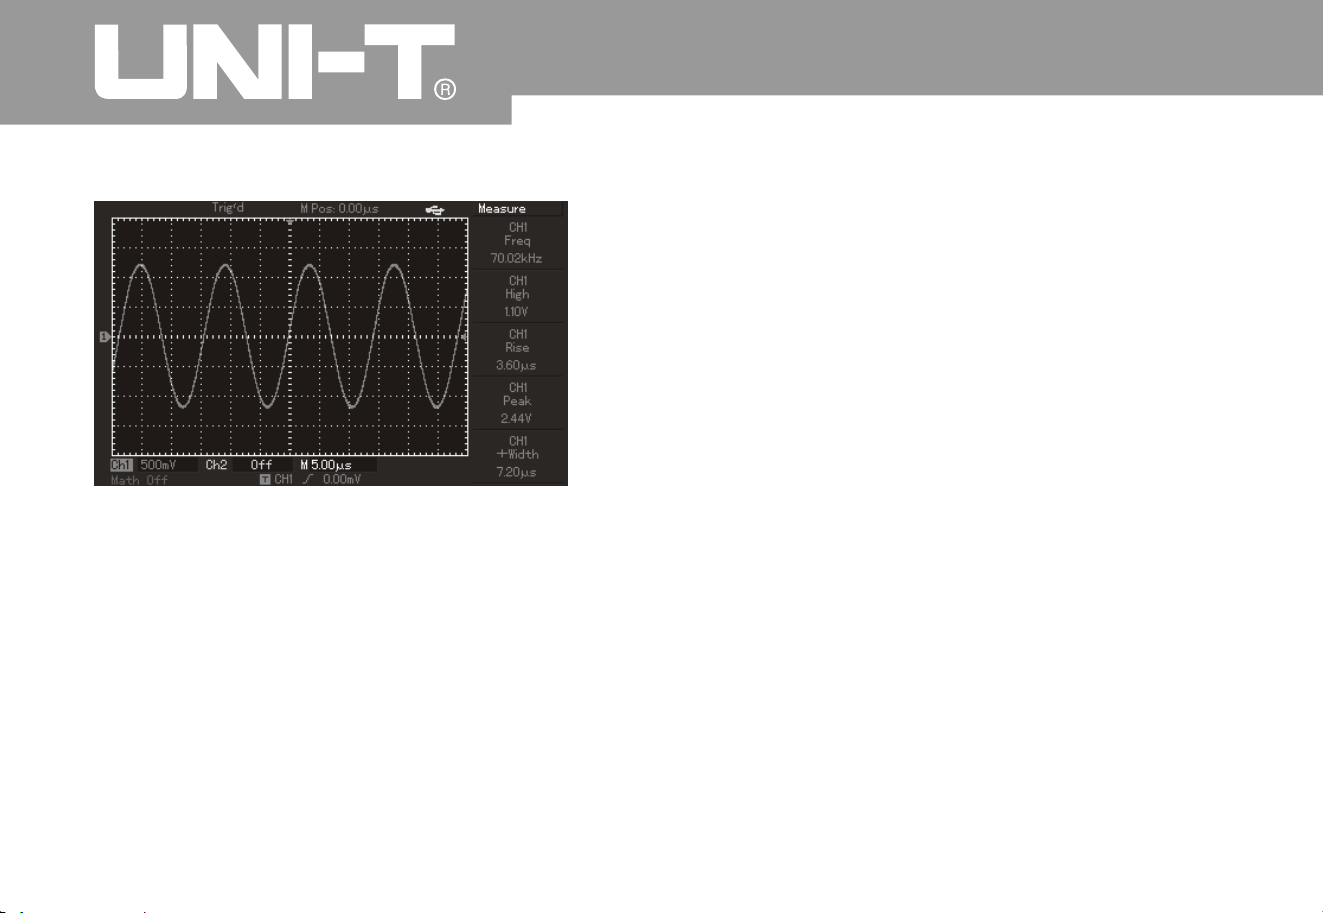
Operating Manual for UTD2000/3000
7
3
The secondexample: Delay observation of sine
wave signal by circuit
The same as above example, please set
attenuation coefficient of probe and digital storage
oscillograph to 10*. Please connect CH1 channel
of digital storage oscillograph to circuit signal input
terminal and connect CH2 channel to output
terminal
.
Operation steps
:
1. Signal display of CH1 and CH2 channels
:
To press AUTO button
To continue to adjust horizontal or vertical gear
so that waveform display can meet your test
requirements
.
To press CH1 key to select CH1 then rotate
vertical position knob to adjust vertical positio
n
of CH waveform
To press CH2 key to select CH2 then adjust
vertical position of CH2 waveform to facilitate
ķ
ĸ
Ĺ
ĺ
Figure 3-1 Automatic measurement
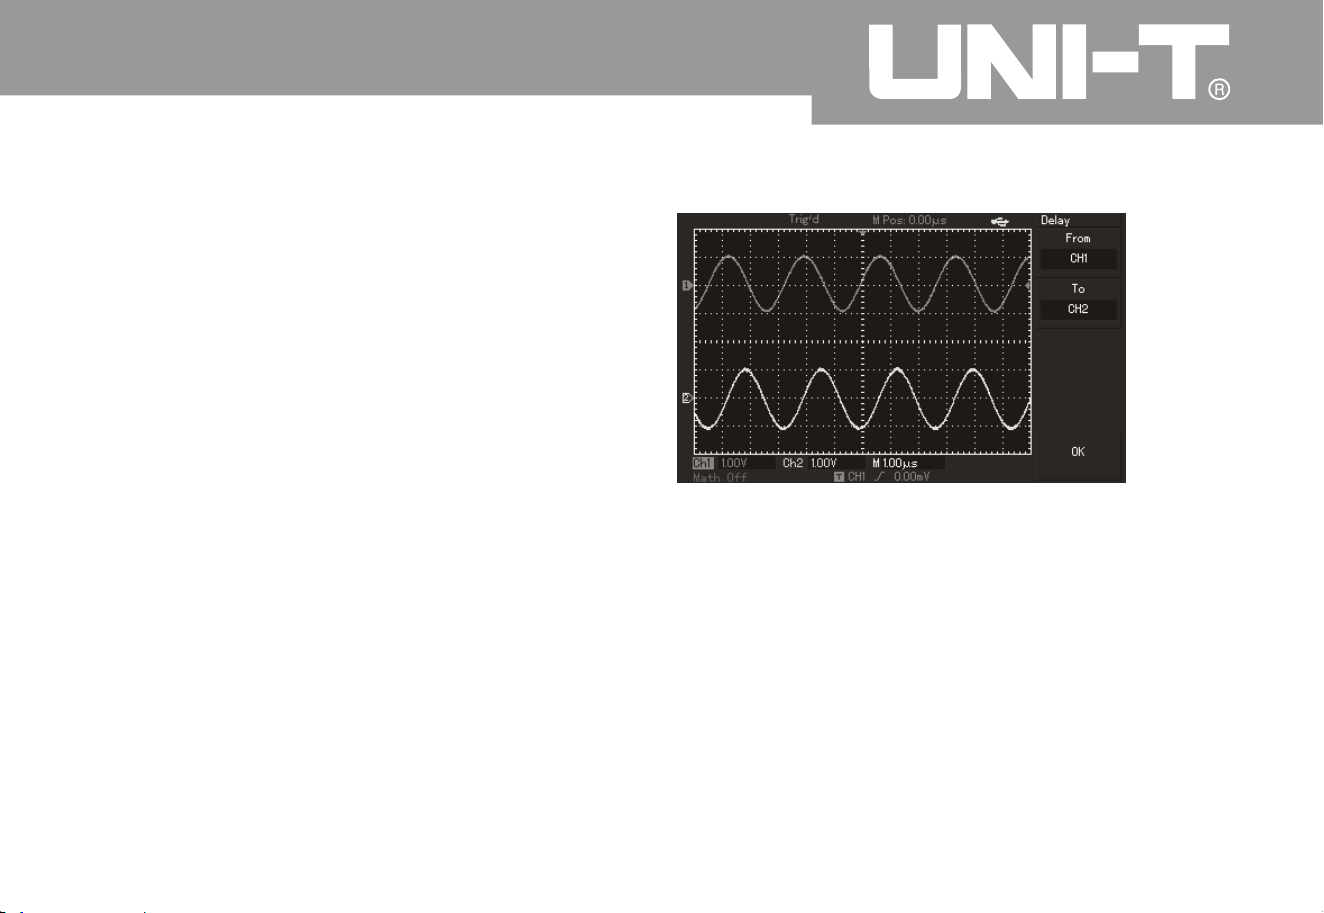
Operating Manual for UTD2000/3000
74
comparison without waveform overlapping for the
first and second channels
.
2. To measure delay of sine signal caused b
y
circuit then observe waveform variation.
ķ
ĸ
Delay of automatic measurement channel
To press MEASURE button to display automatic
measurement menu
;
To press F1 key to enter into measurement menu
category for selection
;
To press F4 key to enter into time measurement
parameter list
;
To press F5 key twice to enter into 3/3 page
;
To press F2 key to select delay measurement
;
To press F1 key to select CH1 then press F2 key to
select CH2 then press F5 as enter ke
y
You can see delay value from “CH1-CH2 delay” i
n
F1 area
.
Observation of waveform variation (shown i
n
following figure
)
Figure 3-2: Waveform dela
y

Operating Manual for UTD2000/3000
7
5
The third example: Capture of single signal
A
dvantages and characteristics of digital storage
oscillograph include convenient capture of
aperiodic signals such as pulse and burring, etc. It
has to know this signal to set trigger level and
trigger edge to capture a signal signal. For
instance: Trigger level shall be set to about 2V and
set trigger edge to ascending edge trigger if pulse is
a logic signal of TTL level. User can observe it b
y
automatic or ordinary trigger mode so as to
determine trigger level and trigger edge for
unknown signals
.
Operation steps are as follows
:
1. To set attenuation coefficient of probe and CH1
channel like the previous example
;
2. To set triggers
;
To press MENU button in trigger control area to
display trigger setup men
u
To set trigger type to edge, trigger source to CH1
,
gradient to ascend, trigger mode of single mode and
trigger coupling to AC by using menu operation keys
of F1 to F5 respectively under this menu
.
To adjust horizontal time base and vertical gear to
appropriate scope
To rotate TRIGGER LEVEL knob to adjust
appropriate trigger level
To press RUN/STOP execution button to wait for
signals which meet trigger conditions. Once
sampling can be done for display on the screen if a
certain si
gnal reaches set trigger level. Occidental
events can be captured easily by utilizing the
function. For instance: Sudden burring with large
amplitude Please set trigger level to be higher
than normal signal slightly then press
RUN STOP button for waiting The machine will
trigger automatically and record waveform before
and after trigger during burring. Horizontal
POSITION knob in horizontal
ķ
ĸ
Ĺ
ĺ
Ļ
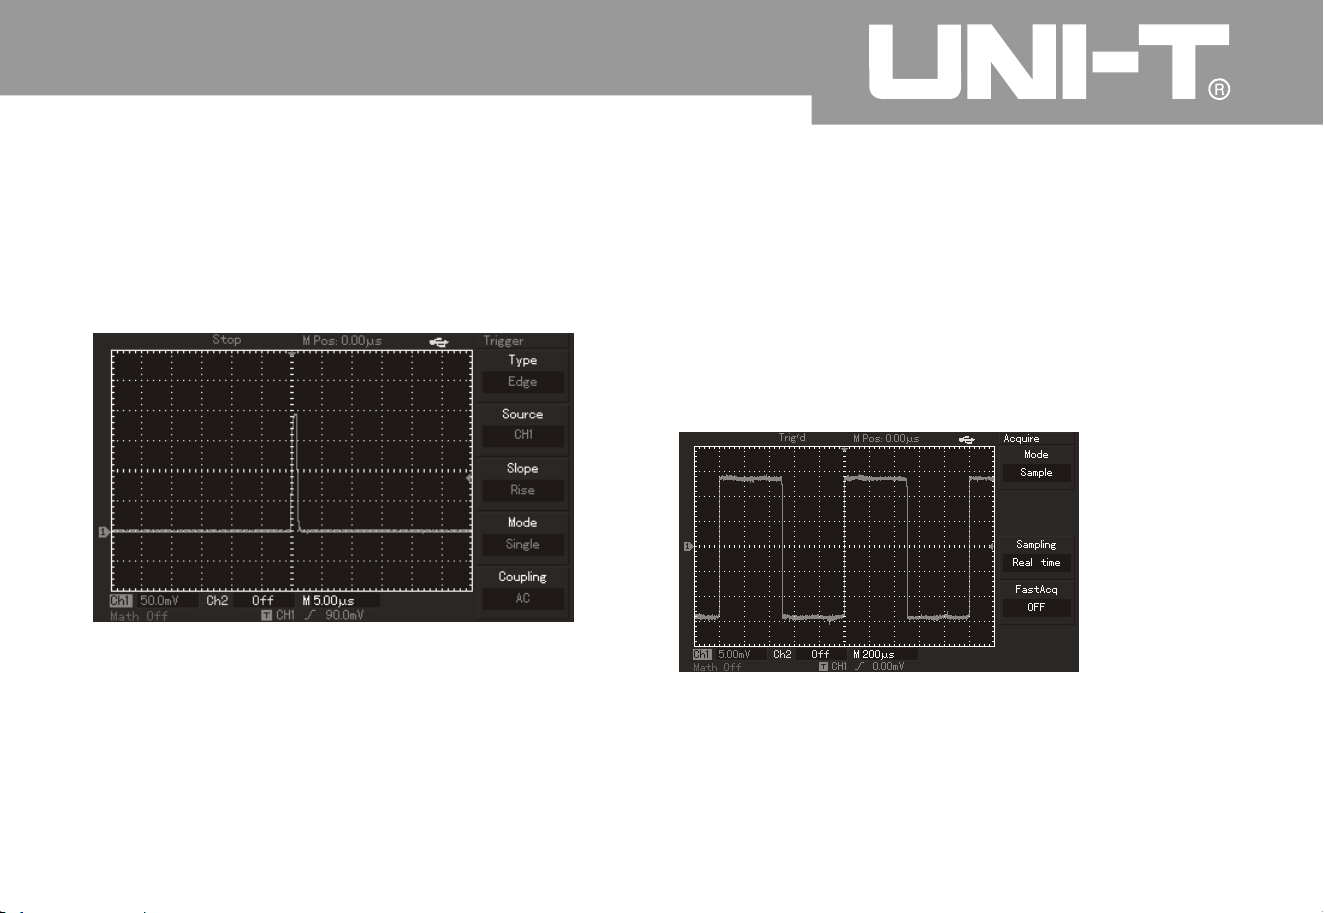
Operating Manual for UTD2000/3000
7
6
control area on the panel can be rotated to alter
horizontal trigger position so as to gain negative
delay trigger with different length to facilitate
observation of waveform before burring
.
Figure 3-3 Single signal
You can adjust setup of digital storage oscillograph
for overlapping of random noise to tested signal so
as to filter or reduce noise and avoid disturbance to
ontology signal during measurement. (Please refer
to following figure for waveform.
)
Figure 3-4 To reduce random noise of signals
Operation steps are as follows
:
1. As shown in previous example, please set
attenuation coefficient of probe and CH1 channel
.
The fourth example: To reduce random noise of
the si gnal

7
7
2. To connect signals for stable waveform display o
n
digital storage oscillograph
.
Please refer to previous example for operation
.
Please refer to previous chapter for adjustment of
horizontal time base and vertical gear
.
3. To improve trigger by setting trigger coupling
.
(1) To press MENU button in trigger area to displa
y
trigger setup menu
.
(2) To set trigger coupling to low-frequenc
y
inhibition or high-frequency inhibition. Low-
frequency inhibition is to set a high-pass filter to
filter low-frequency signal component of less tha
n
80kHz and allow pass through of high-frequenc
y
signal component. High- frequency inhibition is to
set a low-pass filter to filter high-frequency signal
component of more than 80kHz and allow pass
through of low-frequency signal component. It ca
n
be set to inhibit low-frequency or high-frequenc
y
noise respectively to gain stable trigger
4. To reduce display noise by setting samplin
g
modes
.
To adopt average sampling mode to eliminate
display of random noise to thinner waveform and
facilitate observation & measurement if waveform is
thickened by overlapping random noise to
measured signal. Signal details can be observed
convenientl
y by reduced random noise after gainin
g
average value. Detailed operation is as follows
To press ACQUIRE button in panel menu area to
display sampling setup menu To press F1 key as
menu operation key to set obtainment mode to
average status. (As shown in following figure,
)
please adjust average times by pressing F2 key as
menu operation key with step from 2 to 256 b
y
multiples of 2 so that waveform display can meet
observation & test equirements
.
ķ
Operating Manual for UTD2000/3000
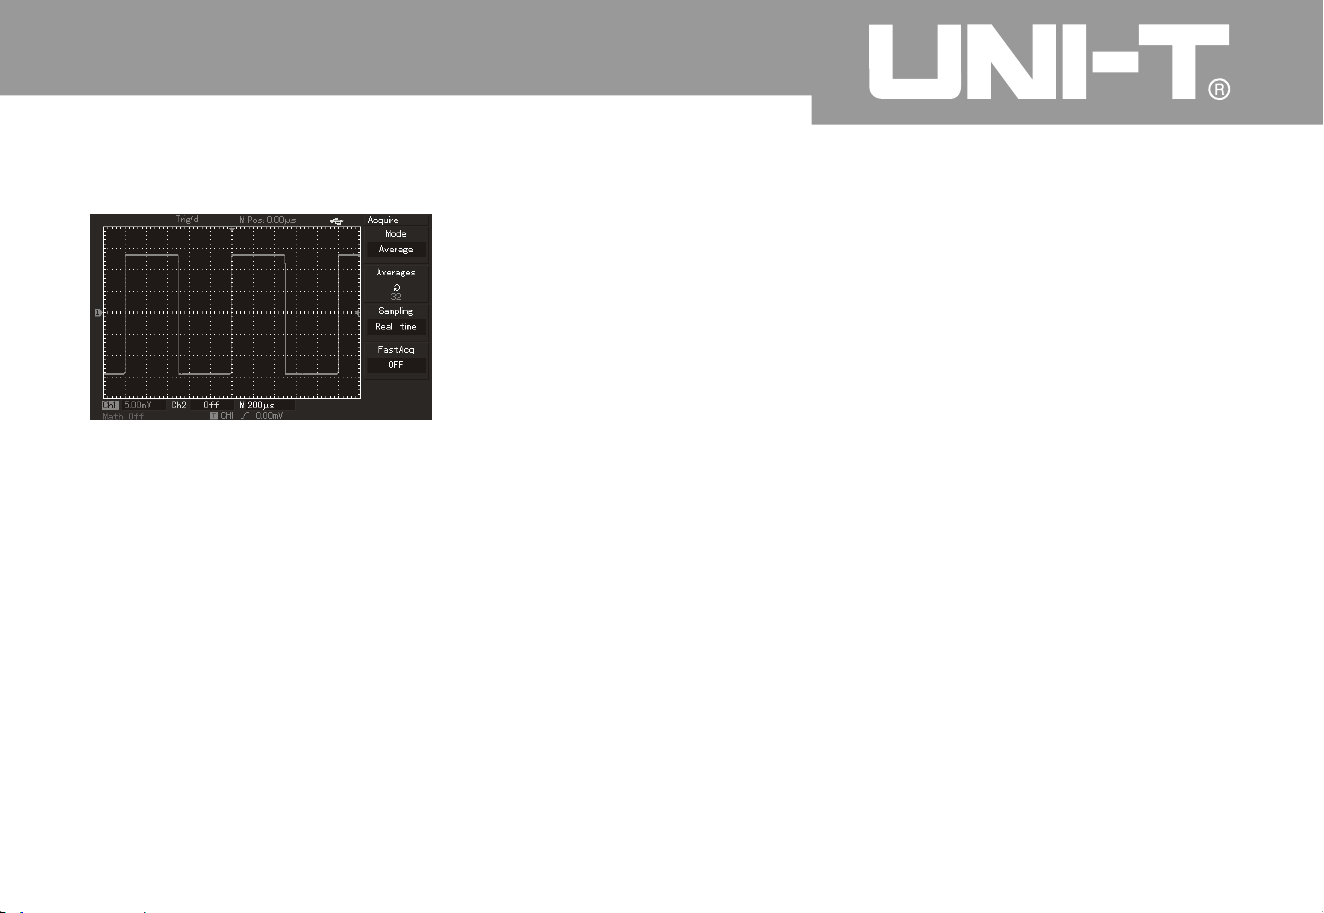
7
8
Figure 3-5 Inhibited signal noise
To reduce display noise by reducing waveform
brightness
.
Note: Average sampl ing mode can be used to slow
down updating speed for waveform display as
normal phenomenon
.
This digital storage oscillograp h can measure 2
8
kinds of waveform parameters automatically. All
automatic measurement parameters can be measured
by cursor. Waveform time and voltage can be
measured quickly by using cursor
.
Please operate according to following steps to
measure 1 staircase voltage of staircase signal
:
1. To press CURSOR key to display cursor
measurement menu
.
2. To press F1 key as menu operation key to set
cur sor t ype to v olt age
.
3. To rotate multi-purpose knob controller to place the
first cursor to 1 staircase of staircase signal
.
4. To press SELECT or PUSHSELECT t o select the
cursor then r otate multi-purpose knob controller to
place the secondcursor to another staircase of
staircase signal
.
ĸ
The fift h example: A pplication curso
r
measurement
To measure 1 staircase voltage of staircase signal
Operating Manual for UTD2000/3000
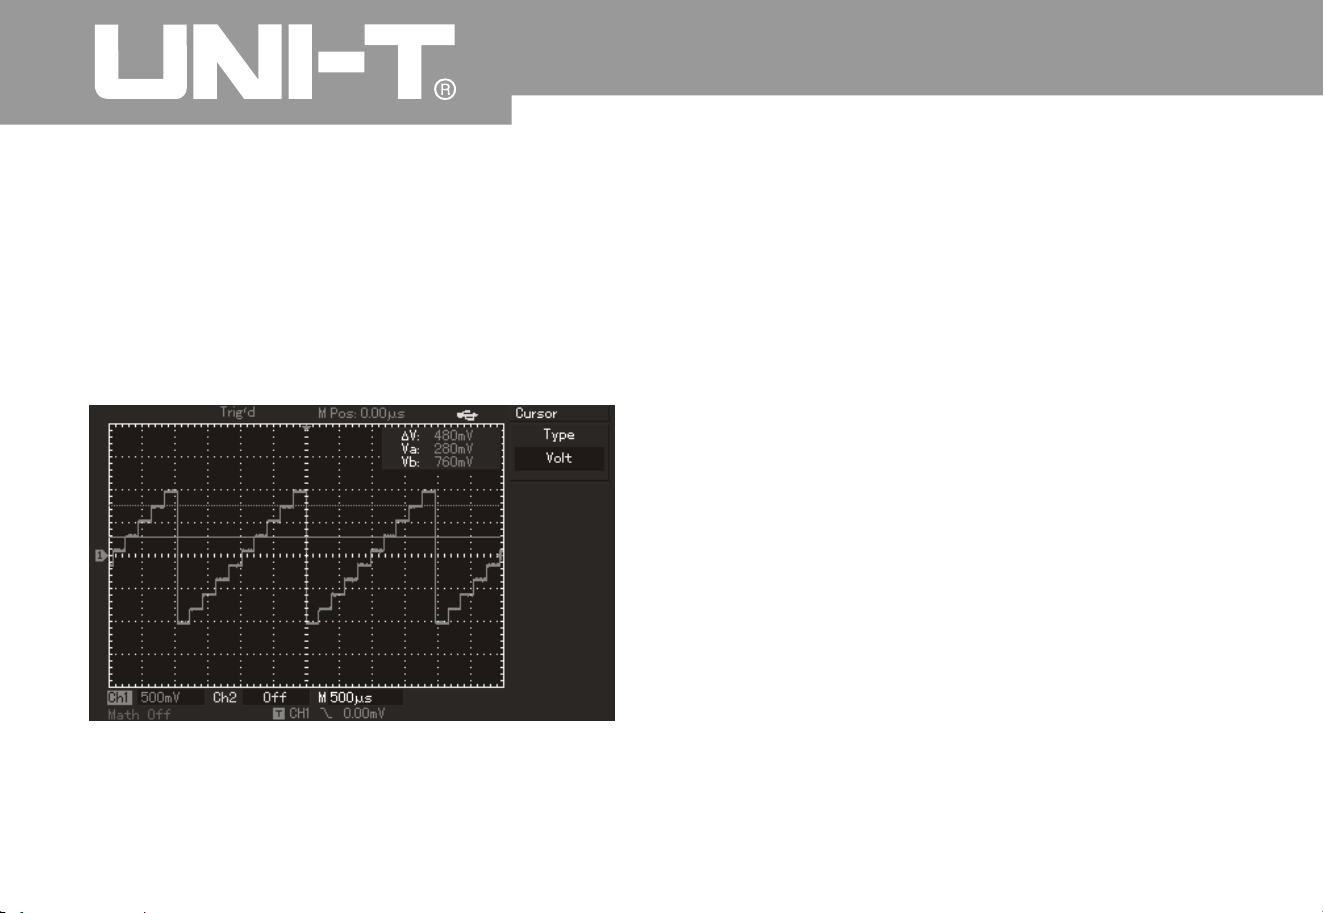
7
9
Ƹ
V namely pressure difference can be show
n
in cursor menu automaticall
y
Please refer to following figure for details
.
Note: Please set cursor type to time if onlyin
g
adopting the secondstep as above for time
measurement by cursor
.
Figure 3-6 Voltage difference of signal by cursor
measurement
To review phase location difference of signals of
2
channels
.
Example: Phase location variation caused by 1
circuit for tested signals. Please connect digital
storage oscillograph to circuit to monitor
input/output signal of circuits. Please operate
according to following steps to review input/output
terminal of circuits by way of X-Y coordinate
diagram
.
1. To set probe menu attenuation coefficient to 10*
and set switch on the probe to 10*
.
2. To connect CH1 probe to network input the
n
connect Ch2 probe to network output
.
3. To press CH1 and CH2 menu keys and open
2
channels if they have not been displayed
.
4. To press AUTO button
.
5. To adjust vertical scale knob for a pproximate
equivalent display amplitude of 2 loops of signals
.
The sixth example: Application o f X-Y function
Oper ating Man ual for UTD2000/3000

80
6. To press DISPLAY menu key to call out displa
y
control menu
.
7. To press F2 to select X-Y. Digital storage
oscillograph will display input/output characteristics of
circuit under Lissa Jous's figure mode
.
8. To adjust vertical scale and vertical position knob to
reach the best effect for waveform
.
9. (As shown in following figure), please observe and
calculate phase location difference by elliptic
oscillograph figure method
.
VLQș $% RU &' 2I ZKLFK ³ș ´ UHIHUV WR SKDVH
location difference angle between channels. Please
refer to above figure for definition of A, B, C and D.
Therefore
,
phase location difference angle is
calculated as follows =±arcsin A B or
±arcsin C D Calculated phase locatio
n
difference angle shall be within Quadrant I or IV
(namely, (0~ ) or ( ~ ) if main axle of ellipse
is within Quadrant I or III. Calculated value is within
( ~ ) or ( ~ ) if main axle of ellipse is withi
n
Quadrant II or IV. Additionally, frequency and phase
location relationship between 2 signals can be
calculated according to figure if frequency or phase
location difference of 2 measured signals is integral
multiple
.
Operating Manual for UTD2000/3000
Signal must be in the
horizontal center
Figure 3-
7
3
2
2
2
2
3
2

8
1
10.Form of X Y phase location difference The seventh example: Trigger of video signal
Trigger of video fiel
d
Video trigger function can be used for all modes
except UTD2000L/2000EX series. (Of which
:
UTD2025CL has video trigger function.
)
It has to adopt video trigger to gain stable video
output signal display for observation of a certai
n
video circuit.
Please operate according to following steps for
trigger in video field
.
1. To press[ MENU ]button in trigger control area to
display trigger menu
.
2. To press[ F1] key as menu operation key to select
video type
.
3. To press[ F2] key as menu operation key to set
trigger source to CH1
.
4. To press[ F3] key as menu operation key to select
video standard of P
A
L
.
Operating Manual for UTD2000/3000
Frequenc
y
ratio of
signal
1:1
Phase location difference
0°
4
5
°
9
0
°
18
0
°
27
0
°
36
0
°
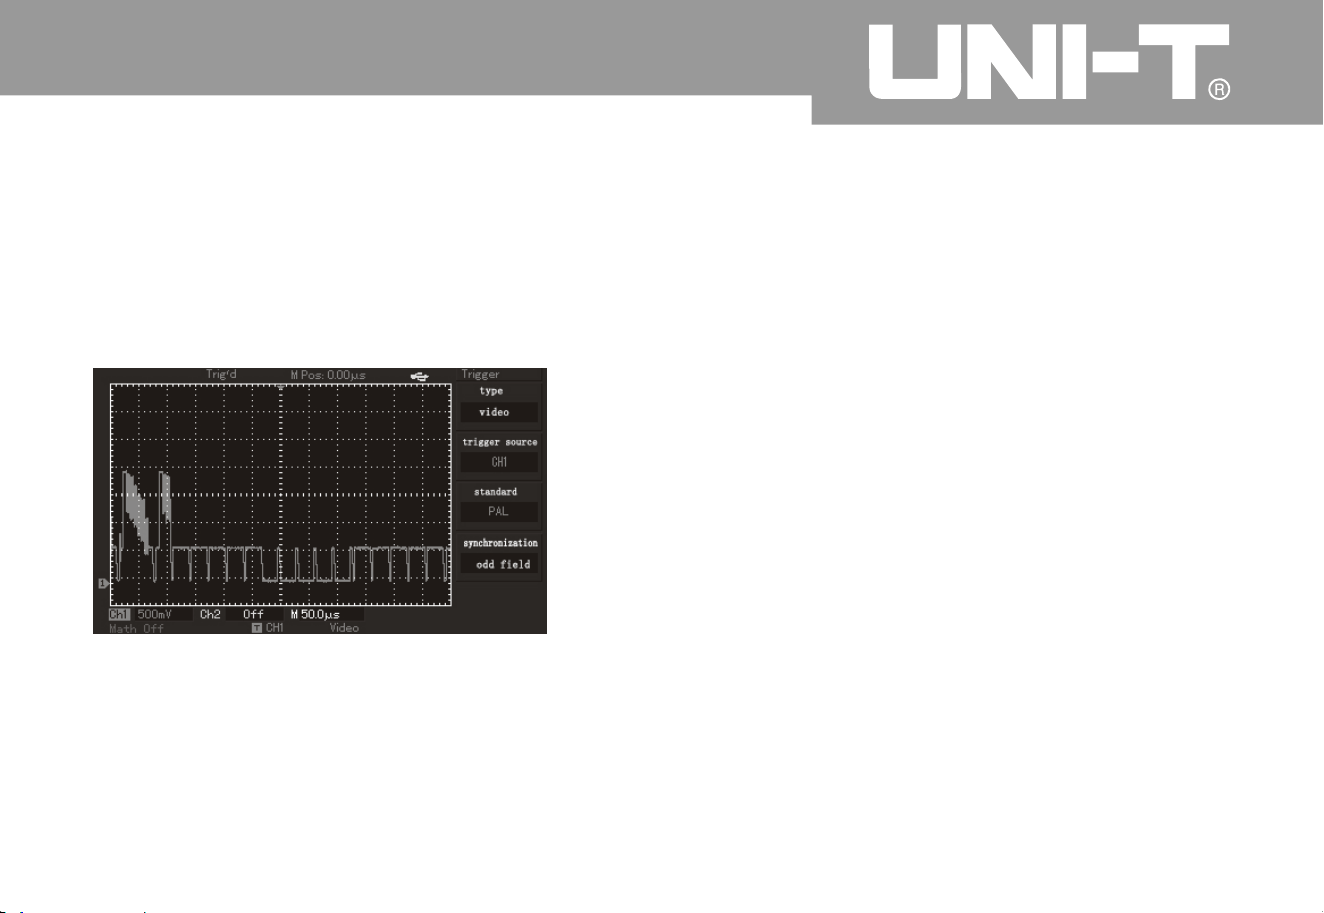
Operating Manual for UTD2000/3000
8
2
5. To press [F4] key as menu operation key to select
synchronization of odd field or even field
.
6. To adjust horizontal time base by rotatin
g
horizontal SCALE knob in horizontal control area so
as to gain clear waveform display
.
Figure 3-8 Trigger of video field
Please operate according to following steps for
trigger in video row
:
1. To press [MENU] button in trigger control area to
display trigger area
.
2. To press[ F1] key as menu operation key to select
video.
3. To press [F2] key as menu operation key to set
trigger source to Ch1
.
4. To press[F3] key as menu operation key to select
video standar
d
of PAL
.
5. To press[ F4] key as menu operation key to select
synchronization to designated row
.
6. To rotate multi-purpose knob controller for trigger
in any row
.
7. To adjust horizontal time base by rotatin
g
horizontal SCALE knob in horizontal control area so
as to gain clear waveform display
.
Trigger of video row
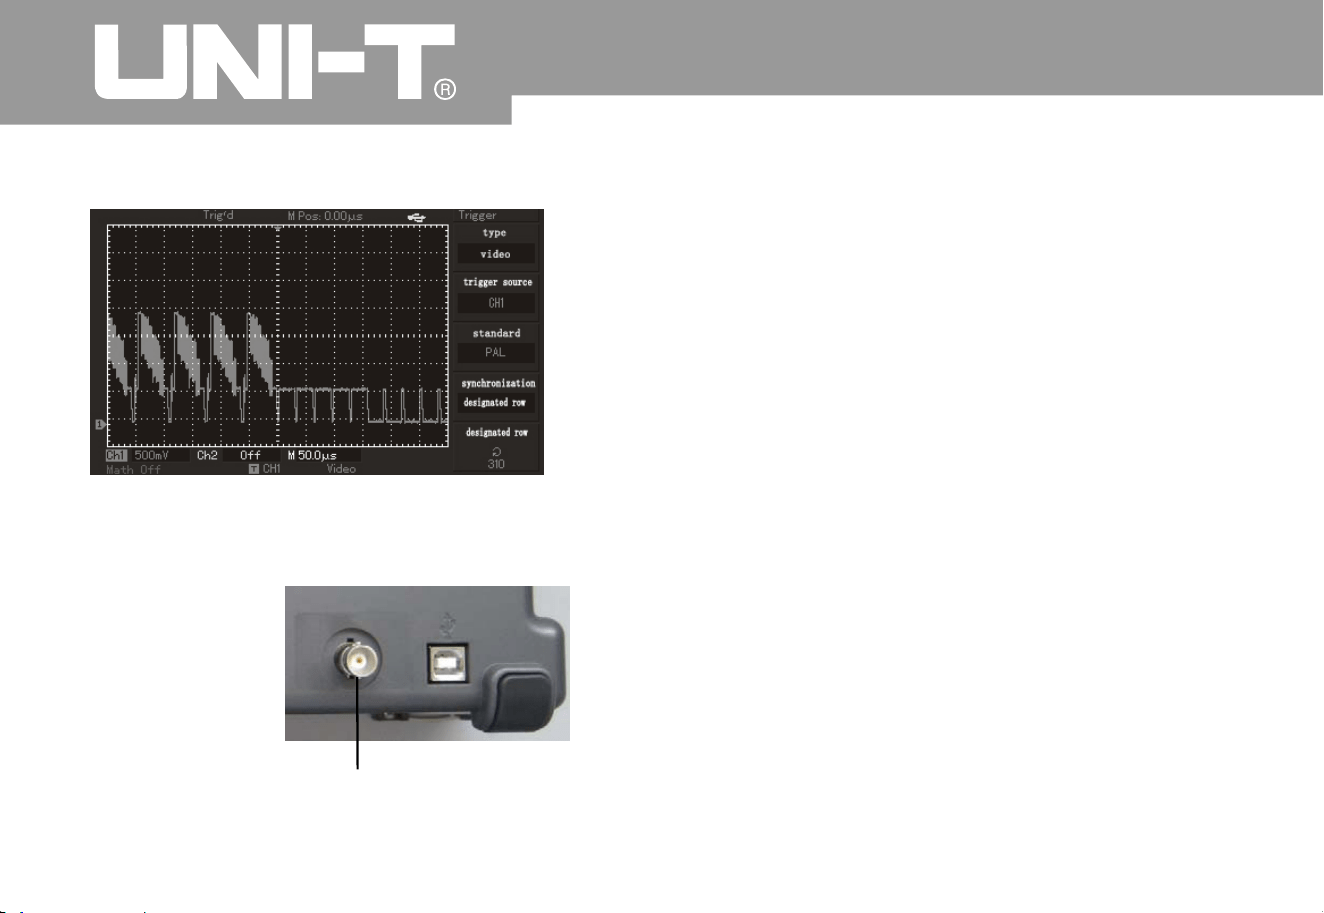
Operating Manual for UTD2000/3000
8
3
Figure 3-9 Trigger of video row
It ha s to che ck if in put sig nal is w ith in ru le s co pe o r
not. Fail refers to out of scope and Pass refers to
within the scope. Pass/Fail signal can be shown b
y
output port
.
1. To press[UTILITY] button then press[F2]Enter into
Pass/Fail menu
.
2. Setup of information source: Enter into Pass/Fail
menu then press[F2] to select information source
.
3. Template setup: To press[F4] Enter into template
setup menu (Template). To press[F2] and[F3] show
n
in Temp lat e m enu to s et hori zont al and ver tica l
tolerance scope by multi-function knob, (namely, 1-
200Pixel toward ho
rizontal direction and 1-100Pixel
toward vertical direction.) Please press F4 finall
y
Return to Pass/Fail menu.
4. Setup of output conditions: To press[F3] to set
output conditions shown in Pass/Fail menu
.
5. To begin detection: To press[F1] to ope
n
detection status shown in Pass/Fail menu
.
The eighth example: Pass/Fail detection
of the rear panel
Rear panel of Pass / Fail output
Pass FailInterface Schematic

Oper ating Man ual for UTD2000/3000
84
The ninth example: Usage of updatin
g
procedure of U-disk
Updating procedure of U-disk can be used more
conveniently and flexibly. Please operate according to
foll owi ng step s if usi ng this fun cti on
:
1. To download procedure documents to update from
Internet then save them in U-disk. (It is suggested to
use U -disk suggested by us.
)
2. To close oscillograph and insert U-disk then ope
n
osc illo gr aph
.
3. To turn to confirmation interface of whether to
update it or not if there is only 1 procedure document
in U-disk. Please press[F5] for exit or press F1 to exit
procedure updating. Document selection interace will
appear if there are at least 2 procedure documents i
n
U-disk. Please press[F5] key for confirmation (or
press[F1] to e xit procedure updating). Please turn to
confirmation interface of whether to update it or not
then press[F5] for updating)
.
4. To wait for updating for prompt of successful
updating. Please power off oscillograph then open it to
fulfi ll updat ing pr oce dure
.
Note:
1. Please wait for updating for several minutes
.
2. It is not allowed to power off oscillograph or plug
out U-disk during updating to avoid updating failure
or unforeseenable error
.
3. Please power off oscillograph then open it for re-
updating after updating failure
.
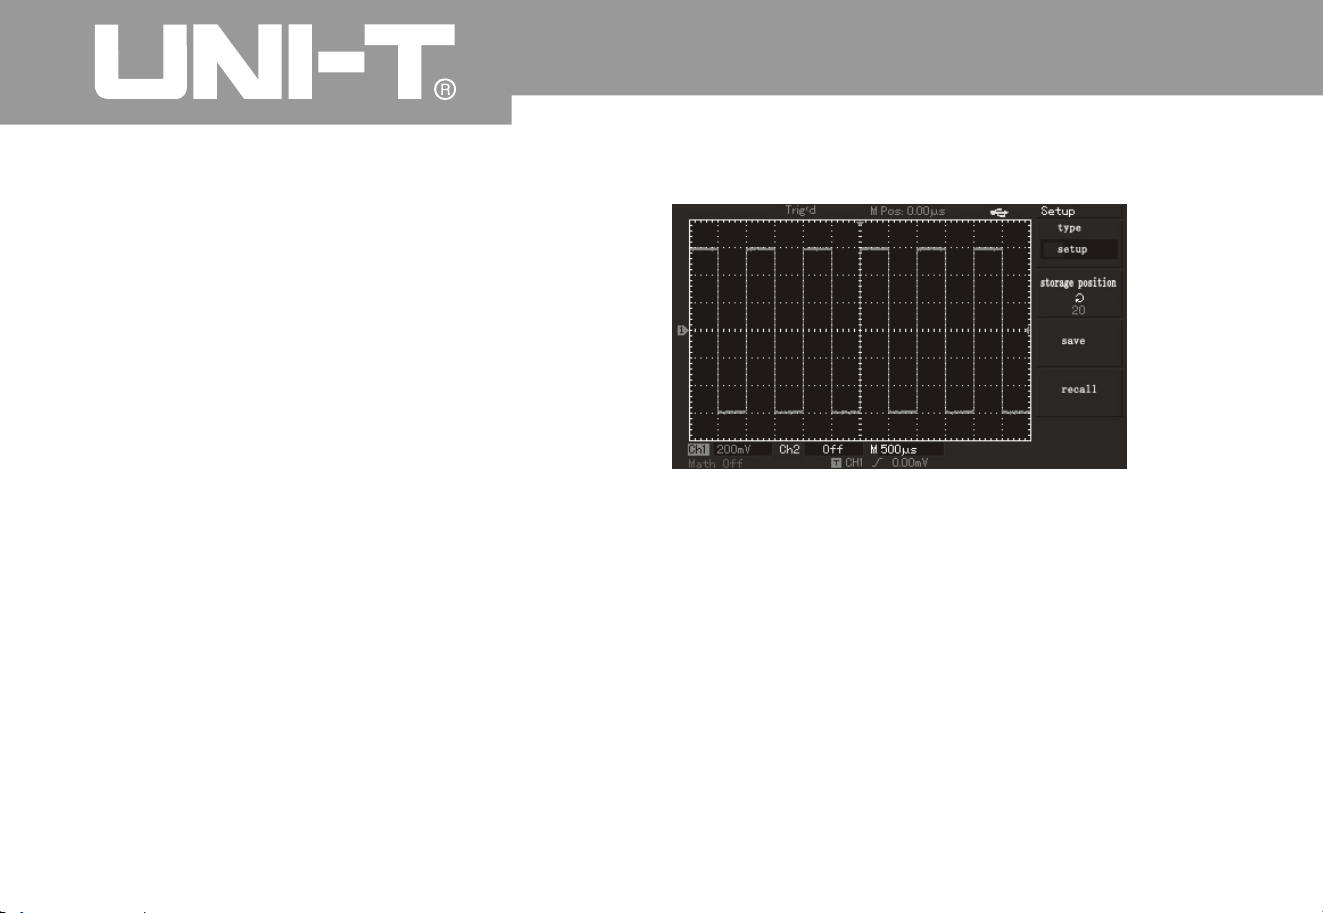
Operating Manual for UTD2000/3000
8
5
The tenth example: Usage of storage function
1. Setup of storag e fun ction:
Storage functions of oscillograph include setup
storage, waveform storage, bitmap storage and
specific screen copy function of UTD2000L/2000EX
series of oscillograph
.
It has to select display channel, trigger channel
,
vertical and horizontal gears of oscillograph for
setup. Please press[STORAGE] key to select
torage type of “setup” by pressing[F1 ]key. As
shown in following figure, it has to select position to
save by multi-function button then press F3 for
saving
.
It can b e tested directly during next test after saving
setup to reduce re-setup process. UTD2000C series
of oscillo
g
raph can save 10 kinds of setup while
UTD2000E and UTD2000L/2000EX series of
oscillograph can save 20 kinds of setup
.
Figure 3-10 Saving setup interface
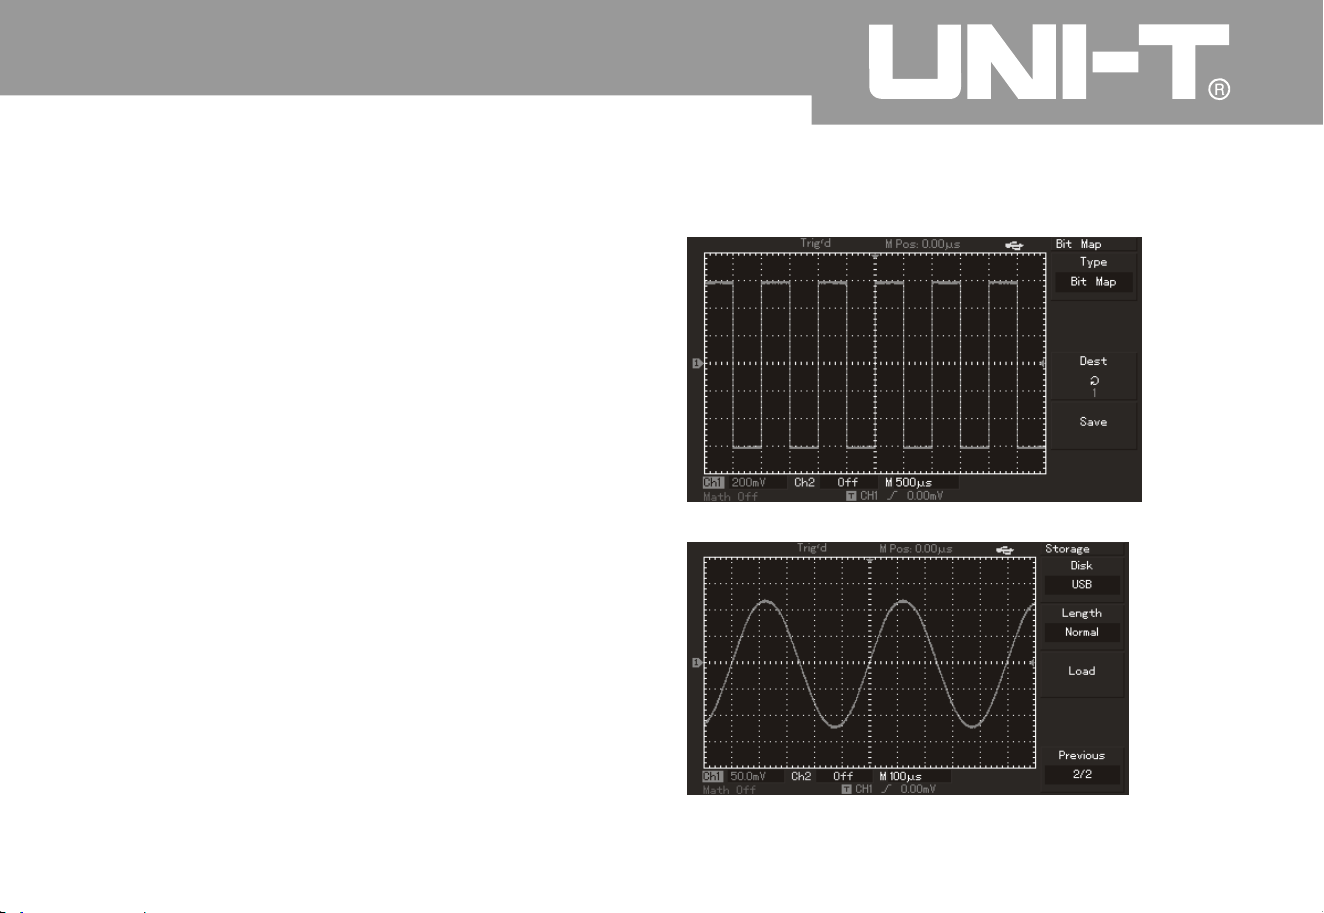
Operating Manual for UTD2000/3000
8
6
2. Waveform storage function:
UTD2000 series of oscillograph can provide waveform
storage function. User can press[STORAGE]key and
[F1] key to select storage type of “waveform”. User ca
n
press [F2]key to select channel to save waveform the
n
pres s[F 5] En te r in to ne x t page. Mag ne ti c dis k in F1
menu position can designate storage position and
default storage position is digital storage oscillograp
h
(DSO) without plugging in U-disk. Stored magnetic disk
position can be [DSO] or [USB] after plugging in U-disk
.
Default storage depth shown by F2 is ordinary and
save d wa v ef or m on ly c an be displayed by osc i ll og r ap h
.
Storage depth can be selected to long storage to save
“.dat a” fo r expo r ta ti on by wa v ef orm analysi s s oft wa r e
when plugging in U-disk and selecting magnetic disk
position to [USB]. It is allowed to analyze content data
of every point of saved waveform. User can also press
F5 Retur n to pr evi ou s me nu th en select stor ag e
posi tio n by mul ti -fun c ti on bu tto n the n pres s [F3] fo r
saving
.
Figure 3-12 Waveform storage by U-disk
Figure 3-11 Waveform storage
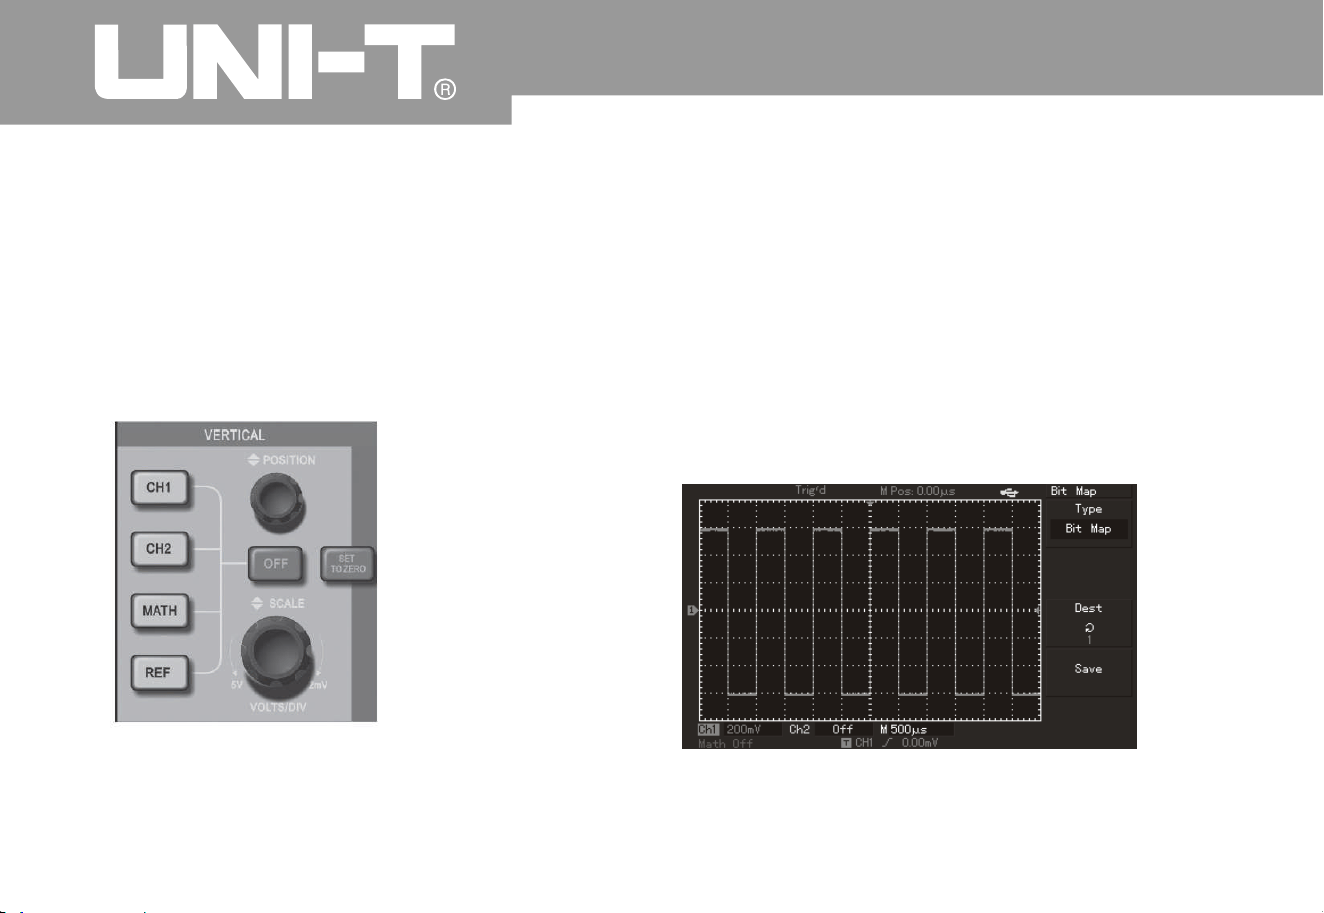
Operating Manual for UTD2000/3000
8
7
A
s shown in following figure, saved waveform ca
n
be recalled by short-cut key of [REF] on the panel
for UTD2000C and UTD2000E series of
oscillograph. User can press [F3] shown in the
second page of STORAGE main menu for recall for
UTD2000L/2000EX series of oscillograph
.
Figure 3-13 Vertical control panel of 5.7-inch scree
n
A
s shown in following figure, user can press[ F1]
menu key of STORAGE main menu to select storage
type of “bitmap” after plugging in U-disk and
successful connection of oscillograph. User ca
n
rotate multi-function knob to select saved bitmap
No. Saved bitmap in U-disk with “.BMP” format ca
n
be read out by computer directly
.
Figure 3-14 Bitmap storage
3. Bitmap storage function:
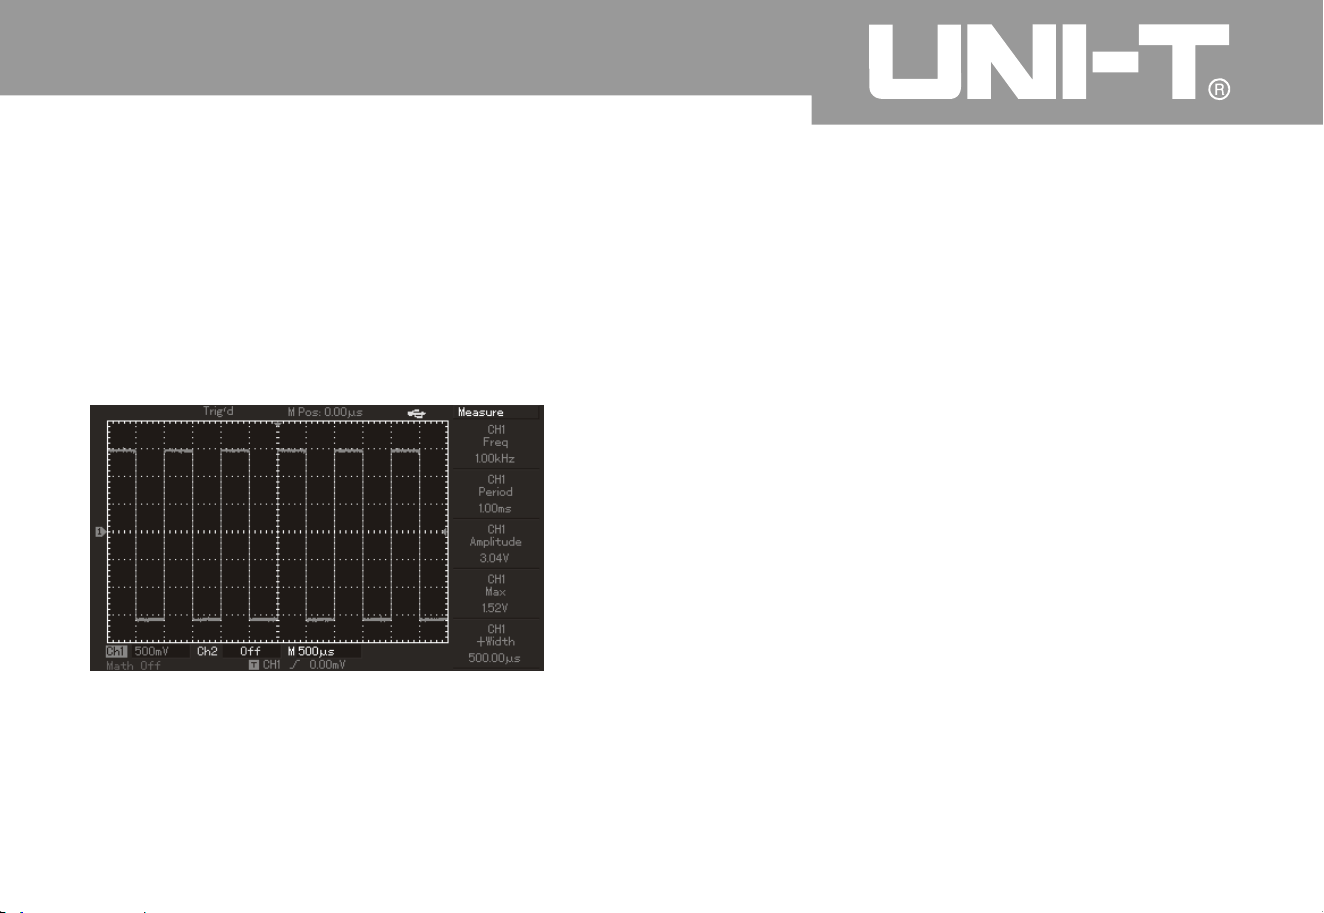
Oper ating Man ual for UTD2000/3000
8
8
4. PrtSc cop y & storag e fun ction
Introd uction to S ystem Prom pt
There is 1 PrtSc key in upper left corner of the scree
n
for UTD2000L/2000EX series of oscillograph. User
can press the key for screen copy after plugging in U-
disk. Displayed image can be saved in U-disk by wa
y
of “.BMP” format
.
Figure 3-15 Screen cop
y
Regulation to the extreme: It prompts that multi-
purpose knob has been regulated to the greatest
extent under current status and continued adjustment
is not allowed. The prompt will display whe
n
regulating vertical deflection coefficient switch, time
base switch, X displacement, vertical displacement
and trigger level to the terminal
.
Successful connection of U-disk: The prompt will
display on the screen after connecting U-disk to
digital storage oscillograph and correct connection
.
Plug-out of U-disk: The prompt will display on the
screen when plugging out U-disk from digital
storage oscillograph.Saving: The prompt will
display on the screen with schedule bar below it
when saving waveform
Chapter 4: System Prompt and
Troubleshootin
g

Operating Manual for UTD2000/3000
8
9
Loading: The prompt will display on the screen wit
h
schedule bar below it when calling out waveform
.
1. Please operate according to following steps for
black panel without display for digital storage
oscillograph after pressing power switch
.
To check if power plugs are connected wit
h
normal power supply or not
.
To check if power switch is connected or not
.
To start up the instrument again after above
inspection
.
Please contact UNI-T for service if the product
still can not be used normall
y
2. Please operate according to following steps if
there is no signal waveform in the image after signal
acquisition
.
To check if probe i s connected to signal
connection wire or not normally
.
To check if signal connection wire is connected
to BNC (namely, channel connector) or not
.
To check if probe is connected to articles to
measure or not normally.
To check if signals are produced or not for
articles to measure. (Channels with signal and
those with any problem can be connected to find
out reasons
To acquire signals onc e again
.
3. Measured voltage amplitude is 10 times larger or
smaller than actual value. It has to check if channel
attenuation coefficient is consistent wit
h
attenuation multiple
of used probe or not.
4. With instable waveform display
:
To inspect setup of trigger source shown i
n
trigger menu to check if it is consistent with input
channel of actual signal or not
.
Inspection of trigger type: General signals shall
be inspected by edge trigger mode while video
trigger
Troubleshootin
g
ķ
ĸ
Ĺ
ĺ
ķ
ĸ
Ĺ
ĺ
Ļ
ķ
ĸ

90
mode shall be used for video signals. Waveform ca
n
not be displayed stably until setting correct trigger
mode
.
Please strive to set coupling to high-frequenc
y
inhibition and low-frequency inhibition display to
filter high low frequency noise triggered b
y
interference
5. To press RUN/STOP key without any display
:
To check if trigger mode of trigger menu is i
n
normal or single gear or not. It has to check if trigger
level is out of waveform scope or not
.
Trigger level shall be in the middle or trigger mode
shall be set to AUTO gear if yes
.
To press AUTO key for automatic setup as
above
.
6. Display speed will reduce after opening average
time sampling mode
.
In general speed will reduce normally if
average times exceed
To reduce average times.
7. Staircase waveform displa
y
A
s normal phenomenon, horizontal time base
can increase under super-low horizontal time base
gear so as to increase horizontal resolution and
improve display
.
Possible display type is vector and samplin
g
points can be connected for staircase waveform
display. Display type can be set to point displa
y
Ĺ
ķ
ĸ
ķ
ĸ
ķ
ĸ
3
2
Oper ating Man ual for UTD2000/3000

9
1
Chapter 5: Appendix
Appendix A: Technical Indicators
Unless otherwise specified, all technical dimensions are appropriate to probes by setting attenuation
switch to 10* and UTD2000/3000 series digital storage oscillograph. Digital storage oscillograph must
meet 2 conditions as follows to meet such dimension standards
:
Instrument must operate under regulated operation temperature for more than minutes
continuousl
y
Be sure to open system function menu and execute self-correction procedure if variation scope of
operating temperature reaches or exceeds . All dimensions shall be guaranteed except dimension
with “typical” patter
n
.
Ƶ
ƵĀā
ć
Operating Manual for UTD2000/3000

9
2
Technical Indicator
s
Samplin
g
Sampling mode
Real-time
Equivalent
Samplin
g
rate
UTD2000C/3000
C
UTD2000E/3000E
UTD2052C
L
UTD2052CEX/UTD2102CEX
500M
S
/s
500M
S
/s
1GS/s
1GS/s
25GS/s
25GS/s
50GS/s
50GS/s
A
verage
value
N can be selected from 2, 4, 8, 16, 32, 64, 128 and 256 after sampling all channels for
N times at the same time
.
Note: Real-time sampling rate is 250MS/s without equivalent sampling for UTD2025C, UTD3025C and
UTD2025CL
.
Oper ating Man ual for UTD2000/3000

9
3
Input
Input couplin
g
DC, AC, GND
Input impedance
UTD2000C/3000C: 1±2% for parallel connection to 24±3pF
;
UTD2000E/3000E: 1±2% for parallel connection to 24±3pF
(for machine model of at most 100MHz);1±2% for parallel connection
to21± 3pF (fo r m achine mode l o f 150MH z to 2 00MHz)
;
UTD2000L/2000EX: 1±2% for parallel connection to 24±3pF
;
M
M
M
M
¡
¡
¡
¡
Probe attenuation coefficient
1×, 10×, 100×and 1000
×
The maximum input voltage 400V (DC + AC peak value and input impedance of 1M
)
¡
(Typical) delay between channels
150ps
Operating Manual for UTD2000/3000

94
Horizontal
Waveform interpolatio
n
Horizontal res olutio
n
Record lengt
h
Storage dept
h
Scanning scope
Sin(x)/x
Sampling point of 2×512k
25k(UTD2000C/3000C:2.5k for UTD2025C/3025C:4k
)
UTD2000C/3000C 2ns/div-50s/div (200MHz, 150MHz
)
UTD2000E/3000E 5ns/div-50s/div (100MHz, 80MHz, 60MHz and 40MHz);
20ns/div-50/div (25MHz
)
Precision of sampling rate
and delay time
±50ppm (for any interval of at least 1ms
)
interval ppm reading ns×
+50 +0.4
2ns/div-50s/div (UTD2052CEX, UTD2102CEX
)
5ns/div-50s/div (UTD2052CL
)
10ns/div-50s/div (UTD2025CL
)
Single mode: ±(1 sampling interval+50ppm×reading+0.6ns
)
16 average values: samplin
g
˚
±
Measurement precisio
n
(full band width) for
interval ( T
)
Ƹ
UTD2000
L
UTD2000EX
Oper ating Man ual for UTD2000/3000
UTD2000C/3000C /UTD2000E/3000E /UTD2000L:25points/di
v
UTD2000EX 50points/di
v

9
5
Vertical
A
nalog digital converter (A/D
)
Scope of deflection coefficient
(V/div
)
Displacement scope
(Typical) optional band width limitatio
n
Low-frequency response
(AC coupling, -3dB
)
DC gain precision (by adopting samplin
g
or sampling mode of average value
)
DC measurement precision (by adoptin
g
average sampling mode
)
8-bit resolution with synchronous sampling for 2 channels
UTD20 00 C/3 00 0C /UTD2000 E /30 00 E : 2mV /div ~5V /d i v (in inpu t BNC)
;
UTD2000L/2000EX: 1 mV/div~20V/div (in input BNC
)
İ10Hz (in BNC
)
div (Of which: ±5div for UTD2202E/3202E
)
±1
0
20MH
z
UTD2000C/UTD3000C, UTD2000E/UTD3000E:
UTD L/2000EX:
± if vertical sensitivity is mV div or mV div
;
± if vertical sensitivity is mV div to V div
;
±5 if vertical sensitivity is mV div or mV div
;
± if vertical sensitivity is mV div
;
± if vertical sensitivity is mV div to V div
;
200
0
4% 2
5
3% 10
5
%1
2
4%
5
3% 10 20
UTD2000C/UTD3000C, UTD2000E/UTD2000E:
If vertical displacement is 0 and N
±(4% reading+0.1 grid+1mV) by selecting 2mV/div or 5mV/div
;
±(3% reading+0.1 grid+1mV) by selecting 10mV/div to 5V/div
;
If vertical displacement is not 0 and N
ı
ı
×
×
1
6
1
6
Operating Manual for UTD2000/3000

9
6
DC measurement precision (by adoptin
g
average sampling mode
)
Measurement precision of voltage
difference ( V) (by adopting samplin
g
mode of average value
)
Ƹ
±3% 1%
1
6
±5%
1
6
0.
2
Ǐ
ǐ
ı
ı
fǏ
ǐ
reading+vertical displacement reading)+( vertical
displacement reading
)
To add 2mV when setting from 2mV/div to 200mV/div: To add set
value by 50mV when setting from 200mV/div to 5V/div
;
If vertical displacement is 0 and N
reading+0.1 grid+1mV) by selecting 1mV/div or 2mV/div
;
±(4% reading+0.1 grid+1mV) by selecting 5mV/div
;
±(3% reading+0.1 grid+1mV) by selecting 10mV/div to 20V/div
;
If vertical displacement is not 0 and N
reading+vertical displacement reading)+(1% vertical
displacement reading) div
;
To add 2mV when setting from 5mV/div to 200mV/div: To add set
value by 50mV w
h
en setting from 200mV/div to 20V/div
;
×
×
×
×
×
×
×
UTD2000L/2000EX:
Voltage difference between any 2 points on the waveform after
calculating average value for at least 16 captured waveform under the
same setup and environment conditions: ±(3% reading+0.05div
)
×
Note: Deflection coefficient scope of UTD2025C/3025C is 2mV/div ~ 10V/div (in input BNC)
.
Oper ating Man ual for UTD2000/3000

9
7
band widt
h
model
analogbandwidt
h
single band widt
h
RiseTime
UTD2000
C
3000
C
UTD2025C UTD3025
C
ǃ
series
25MH
z
25MH
z
14ns
UTD2042C UTD3042
C
ǃ
40MH
z
40MH
z
8.7ns
UTD2062C UTD3062
C
ǃ
60MH
z
60MH
z
5.8ns
UTD2082C UTD3082
C
ǃ
80MH
z
80MH
z
4.3ns
UTD2102C UTD3102
C
ǃ
100MHz
100MH
z
3.5ns
UTD2152C UTD3152
C
ǃ
150MHz
100MH
z
100MH
z
2.3ns
1.8ns
200MHz
UTD2202C UTD3202
C
ǃ
UTD2042CE UTD3042CEǃ
40MH
z
40MH
z
8.7ns
5.8ns
60MH
z
60MH
z
UTD2062CE UTD3062CEǃ
UTD2082CE UTD3082CEǃ
80MH
z
80MH
z
4.3ns
3.5ns
100MH
z
100MHz
UTD2102CE UTD3102CEǃ
UTD2152CE UTD3152CEǃ
150MHz
100MH
z
100MH
z
2.3ns
1.8ns
200MHz
UTD2202CE UTD3202CEǃ
UTD2025C
L
25MH
z
25MH
z
14ns
7ns
50MH
z
50MH
z
UTD2052C
L
UTD2052CEX 50MH
z
50MH
z
7ns
3.5ns
100MH
z
100MHz
UTD2102CEX
UTD2000
L
UTD2000EX
UTD2000E E300
0
Operating Manual for UTD2000/3000

9
8
Trigge
r
Trigger sensitivit
y
Trigger level scope
(Typical) precsion of trigger
level for signal of whic
h
RiseTime or DescendTime is
not less than 20ns
Pre-trigger ab ilit
y
Inhibition scope
(Typical) level set to 50%
Edge trigger
Pulse width trigger
Trigger mode
Pulse width scope
Edge type
İ1di
v
Internal
EXT
EXT
Internal
EXT/
5
EXT/
5
Operation if frequency of input signal is not less than 50H
z
Ascend, descend, ascend & descend (while UTD2000C has no “ascend & descen”
function)
;
To be more than, less than or equivalent to positive/negative pulse width
;
20ns-10s (UTD2025/3025
:
40ns-25s
)
UTD2000C/3000C/UTD2000E/3000E: 100ns-1.5s
UTD2000L/2000EX: 80ns-1.5s
Normal mode/scanning mode, pre-trigger/delay trigger with adjustable
pre-trigger depth
±5div away from screen center
±3V
±15V
±(0.3div V/div) (within scope of ±4div from screen center)h
±(6% of set value+40mV
)
±(6% of set value+200mV)
*
*
Oper ating Man ual for UTD2000/3000

9
9
Video trigger
*
Trigger sensitivit
y
(typical video trigger
)
Signal system and row/
field frequency (video
trigger type
)
A
LT TRIG
CH1 trigger
CH2 trigger
Note UTD CL and UTD C EX CEX has no EXT function and video trigger function 2052 2052 2102 5
Internal Peak value of 2di
v
400mV
2V
EXT
EXT/5*
Edge, pulse width and video
Edge, pulse width and video
To support standard NTSC and PAL; Scope of row quantity is 1-525 (NTSC
)
and 1-625 (PAL
)
Operating Manual for UTD2000/3000

100
Measurement
Cursor
Manual mode
Tracing mode
+, -,×, ÷
Peak value, amplitude, the maximum value, the minimum value, top value, bottom value
,
middle value, average value, root-mean-square, overshoot, preshoot, frequency, cycle
,
RiseTime, DescendTime, positive pulse width, negative pulse width, positive duty cycle
,
negative duty cycle and dela
y
UTD2000C/3000C: 10 groups of waveform and 10 kinds of setup
UTD2000E/3000E/UTD2000L/2000EX: 20 groups of waveform and 20 kinds of setup
Window
Sampling point
Phase locatio
n
difference
A
utomatic
measurement
Mathematical
operatio
n
Stored waveform
FFT
Lissajous's figure
Voltage difference ( V) between cursors
;
Time difference ( T between cursors
;
Reciprocal of T T
Ƹ
Ƹ
Ƹ Ƹ
Voltage and time of waveform point
Hanning, Hamming, Blackman, Rectangle
1024 points
±3 degrees
It is allowed to display cursor during automatic measurement
.
Oper ating Man ual for UTD2000/3000

10
1
Trigger frequency meter
*
Reading resolutio
n
Trigger sensitivit
y
(Typical) prec istio
n
General technical dimensio
n
6-bit
İ30Vrms
±51ppm (+1 word
)
UTD2000C/3000C/UTD2000E/3000E
Diagonal with diagonal of 145mm
(5.7 inches
)
320 (horizontal) RGB×24
0
(vertical pixels
)
h
Colorful
A
djustable (color
)
300nit
Multilingual selectio
n
UTD2000L/2000EX
Diagonal with diagonal of 178mm (7 inches
)
UTD2000EX 800(horizontal)×RGB×480(vertical pixels
)
UTD2000
L
400(horizontal)×RGB×240(vertical pixels
)
Displa
y
Display type
Display resolutio
n
Display color
W aveform brightness*
(Typical) backlight
strengt
h
Category of displa
y
language
Note*: UTD2000C/3000C series have no function of trigger frequency meter (except UTD2025C/3025C)
.
Waveform brightness can not be adjusted
.
Operating Manual for UTD2000/3000

10
2
Probe compensator output
(Typical) output voltage
(Typical) frequenc
y
A
bout 3V if peak value is not less than 1M¡
UTD2000C/3000C/UTD2000E/3000E: 1 USB (D); 1 USB (H)
;
UTD2000L/2000EX: 1 USB OTG
UTD2000C series, UT D2000E/3000E series: LAN
;
UTD3000C series: GPIB and LAN (Only LAN can be selecte dfor UTD3025C
)
1kH
z
Interface function
Standard configuration
Optional fittings
Powe
r
Power voltage
Fuse
100-240VACRMS, 45-440Hz, CAT I
I
To be less than 30V
A
F1.6AL 250V
;
Fuses of UTD2000/UTD2000E series are
on power board in the machine
;
Fuses of UTD3000/UTD3000E series are
in power socket
;
Fuses of UTD2000L/2000EX series are o
n
power board in the machine
.
Power
consumptio
n
Environment
Cooling metho
d
Humidity scope
A
ltitude
Temperature
scope
Operation: ~
+
ćć04
0
Non-operation: -20 ~
+
ćć6
0
Forced cooling by fan
˘ćİ
ˇćˇćİ
R
H
R
H
35 9
0
35 40 6
0
Operation elevation of less tha
n
3,000m
Non-operation elevation of less
than 15,000m
Oper ating Man ual for UTD2000/3000

10
3
Machine dimensio
n
Dimensio
n
Weight
Widt
h
Height
Dept
h
Not containing package
Containing package
320mm
150mm
130mm
2.5k
g
4.0k
g
320mm
150mm
292mm
4.9k
g
6.8k
g
306mm
147mm
122mm
2.2k
g
3.3k
g
UTD
C
2000
UTD E
2000
UTD
C
300
0
UTD
L
200
0
UTD E300
0
UTD X200
0
IP protectio
n
Adjustment interval
Suggested calibration period is 1 year
.
IP2 X
Operating Manual for UTD2000/3000

Appendix B: Fitti ngs of UTD 2000 /3000 ser ies
digital stor age oscillo graph Stand ard fitting s:
2 inactive probes of 1.2m and 1:1 (10:1); Please
refer to manual of probe fittings of details to meet
EN61010-031: standard
.
150V CAT II grade if switch is in 1* position
;
300V CAT II grade if switch is in 10* position
;
1 power wire to meet national standards
;
1 “Operation Manual”
;
1 “Warranty Certificate”
;
Communication control software of
UTD2000/3000 oscillograph
;
USB connecting wires
:
UTD2000C/3000C/2000E/3000E: UT-D0
6
UTD2000L/2000EX: UT-D0
5
Optional fittings
:
UTD2000C/2000E series: LAN module: UT-M01
series: LAN module: UT-M0
5
UTD3000C series: GPIB module: UT-M0
2
Please
o
rder all fittings (standard pieces and
optional fittings) from local UNI-T dealer
.
Ɣ
Ɣ
Ɣ
Ɣ
Ɣ
Ɣ
Ɣ
Ɣ
Ɣ
Ɣ
Ɣ
200
8
UTD3000C/3000E
104
Oper ating Man ual for UTD2000/3000

Appendix C: Maintenance and cleanin
g
General maintenance
Cleaning:
It is not allowed to store or place instruments i
n
locations with direct sunshine for LCD for a lon
g
time. Note: It is not allowed to touch instrument or
probe by pressurized spray, liquid or solvent to
avoid damage
.
Instrument and probe can be inspected constantl
y
according to operation
.
Please clean outer surface of instruments
according to following steps
:
1. Please remove floating dust out of instrument
and probe by soft cloth. Please do not scratc
h
transparent LCD protection screen during cleaning
.
2. Please power off when cleaning the instrument
by wet soft cloth without dripping. It can be cleane
d
by soft detergent or clean water. It is not allowed to
use any corrosive chemical detergent to avoid
damage to instrument or probe
.
Warning: Please confirm that instrument has been
dried thoroughly before power re-supply to avoid
electric short-circuit even personal injury due to
moisture
.
10
5
Operating Manual for UTD2000/3000

10
6
The information is subject to changes without prior notice if manual content varies
.
Oper ating Man ual for UTD2000/3000

10
7