Loading ...
Loading ...
Loading ...
LAUNCH
42
Notes:
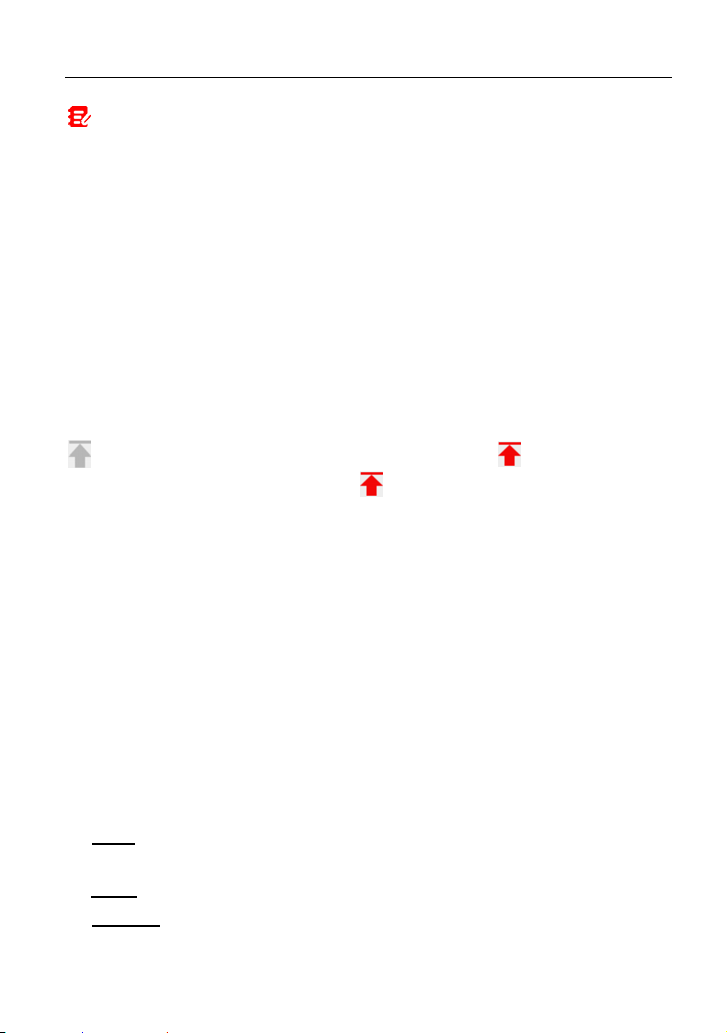
1. Tap , the following popup will appear.
Here the user can set different display style for each selected item.
indicates sticky top. If it is tapped, it will change into . On the data stream
display screen, the data stream item with will be shown on the top of the selected
data stream list. To remove it from the top of the list, just tap it again.
B indicates this item will be displayed in Bold.
A indicates this item will be displayed in Red.
2. Tap English or Metric to switch the measurement unit.
3. If the value of the data stream item is out of the range of the standard (reference)
value, the whole line will display in red. If it complies with the reference value, it
displays in blue (normal mode).
4. The indicator 1/X shown on the bottom of the screen stands for the current
page/total page number. Swipe the screen from the right/left to advance/return to the
next/previous page.
There are 3 types of display modes available for data viewing, allowing you to
view various types of parameters in the most suitable way.
Value – This is the default mode which displays the parameters in texts and
shows in list format.
Graph – Displays the parameters in waveform graphs.
Combine – This option is mostly used in graph merge status for data
comparison. In this case, different items are marked in different colors.
Loading ...
Loading ...
Loading ...