Loading ...
Loading ...
Loading ...
My Vessel Layer Settings
From a chart, select > Layers > My Vessel.
Heading Line: Shows and adjusts the heading line, which is a line drawn on the map from the bow of the boat in
the direction of travel (Setting the Heading Line and Angle Markers, page55).
Active Tracks: Shows the active track on the chart and opens the Active Track Options menu.
Wind Rose: Shows a visual representation of the wind angle or direction provided by the connected wind sensor
and sets the wind source.
Compass Rose: Shows a compass rose around your boat, indicating compass direction oriented to the heading
of the boat. Enabling this option disables the Wind Rose option.
Vessel Icon: Sets the icon that represents your present location on the chart.
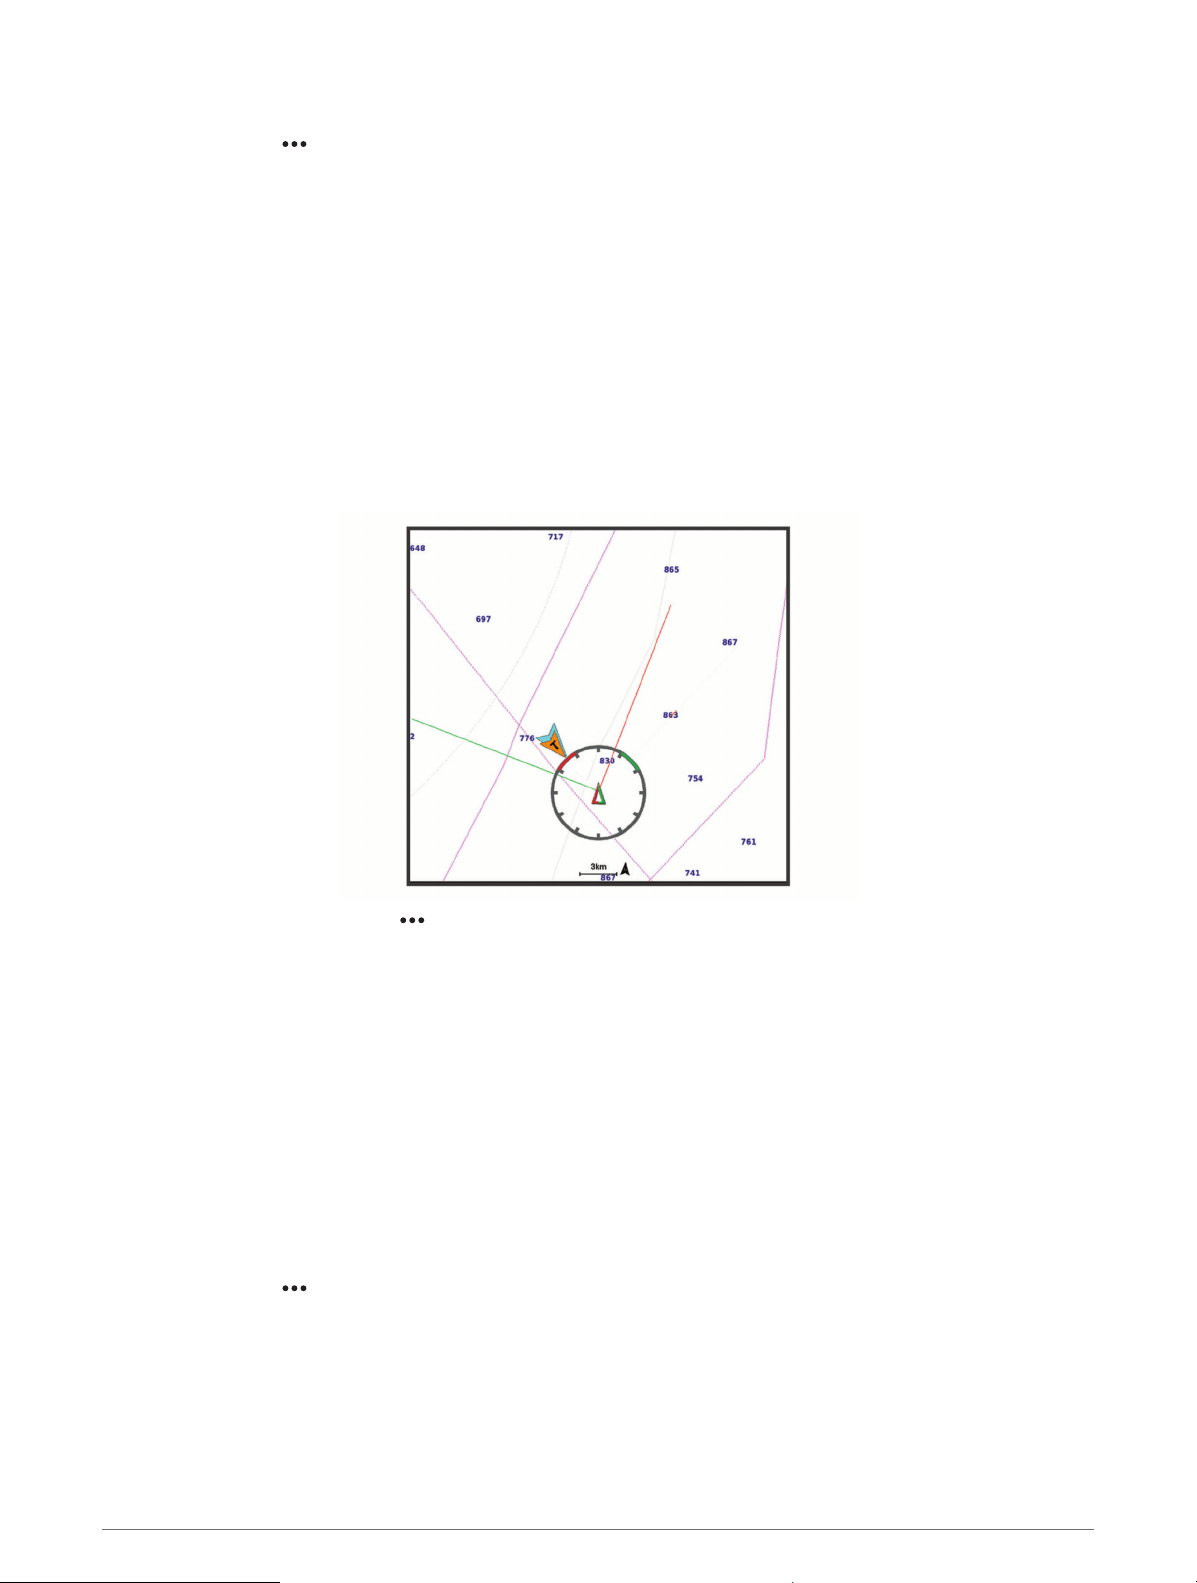
Laylines Settings
To use the laylines features, you must connect a wind sensor to the chartplotter.
When in sailing mode (Setting the Vessel Type for Sailing Features, page50), you can display laylines on the
navigation chart. Laylines can be very helpful when racing.
From the Navigation chart, select > Layers > My Vessel > Laylines > Setup.
Sailing Ang.: Allows you to select how the device calculates laylines. The Actual option calculates the laylines
using the measured wind angle from the wind sensor. The Manual option calculates the laylines using
manually entered windward and leeward angles. The Polar Table option calculates the laylines based on the
imported polar table data (Importing a Polar Table Manually, page52).
Windward Ang.: Allows you to set a layline based on the windward sailing angle.
Leeward Ang.: Allows you to set a layline based on the leeward sailing angle.
Tide Correction: Corrects the laylines based on the tide.
Layline Filter: Filters the layline data based on the time interval entered. For a smoother layline that filters out
some of the changes in the boat's heading or true wind angle, enter a higher number. For laylines that display
a higher sensitivity to changes in the boat's heading or true wind angle, enter a lower number.
User Data Layer Settings
You can show user data, such as waypoints, boundaries, and tracks, on the charts.
From a chart, select > Layers > Manage User Data.
Waypoints: Shows waypoints on the chart and opens the list of waypoints.
Boundaries: Shows boundaries on the chart and opens the list of boundaries.
Tracks: Shows tracks on the chart.
28 Charts and 3D Chart Views
Loading ...
Loading ...
Loading ...