Loading ...
Loading ...
Loading ...
Heart Rate Zone Calculations
Zone % of
Maximum
Heart Rate
Perceived Exertion Benefits
1 50–60% Relaxed, easy pace,
rhythmic breathing
Beginning-level
aerobic training,
reduces stress
2 60–70% Comfortable pace,
slightly deeper
breathing, conversation
possible
Basic cardiovascular
training, good
recovery pace
3 70–80% Moderate pace, more
difficult to hold
conversation
Improved aerobic
capacity, optimal
cardiovascular training
4 80–90% Fast pace and a bit
uncomfortable, breathing
forceful
Improved anaerobic
capacity and
threshold, improved
speed
5 90–100% Sprinting pace,
unsustainable for long
period of time, labored
breathing
Anaerobic and
muscular endurance,
increased power
Training Effect
Training Effect measures the impact of an activity on your
aerobic and anaerobic fitness. Training Effect accumulates
during the activity. As the activity progresses, the Training Effect
value increases. Training Effect is determined by your user
profile information and training history, and heart rate, duration,
and intensity of your activity.
Aerobic Training Effect uses your heart rate to measure how the
accumulated intensity of an exercise affects your aerobic fitness
and indicates if the workout had a maintaining or improving
effect on your fitness level. Your excess post-exercise oxygen
consumption (EPOC) accumulated during exercise is mapped to
a range of values that account for your fitness level and training
habits. Steady workouts at moderate effort or workouts involving
longer intervals (>180 sec) have a positive impact on your
aerobic metabolism and result in an improved aerobic Training
Effect.
Anaerobic Training Effect uses heart rate and speed (or power)
to determine how a workout affects your ability to perform at
very high intensity. You receive a value based on the anaerobic
contribution to EPOC and the type of activity. Repeated high-
intensity intervals of 10 to 120 seconds have a highly beneficial
impact on your anaerobic capability and result in an improved
anaerobic Training Effect.
You can add Aerobic Training Effect and Anaerobic Training
Effect as data fields to one of your training screens to monitor
your numbers throughout the activity.
Training Effect Aerobic Benefit Anaerobic Benefit
From 0.0 to 0.9 No benefit. No benefit.
From 1.0 to 1.9 Minor benefit. Minor benefit.
From 2.0 to 2.9 Maintains your aerobic
fitness.
Maintains your anaerobic
fitness.
From 3.0 to 3.9 Impacts your aerobic
fitness.
Impacts your anaerobic
fitness.
From 4.0 to 4.9 Highly impacts your
aerobic fitness.
Highly impacts your
anaerobic fitness.
5.0 Overreaching and
potentially harmful without
enough recovery time.
Overreaching and
potentially harmful without
enough recovery time.
Training Effect technology is provided and supported by
Firstbeat Technologies Ltd. For more information, go to
www.firstbeat.com.
Heart Rate Variability and Stress Level
Your device analyzes your heart rate variability while you are
inactive to determine your overall stress. Training, physical
activity, sleep, nutrition, and general life stress all impact your
stress level. The stress level range is from 0 to 100, where 0 to
25 is a resting state, 26 to 50 is low stress, 51 to 75 is medium
stress, and 76 to 100 is a high stress state. Knowing your stress
level can help you identify stressful moments throughout your
day. For best results, you should wear the device while sleeping.
You can sync your device with your Garmin Connect account to
view your all-day stress level, long-term trends, and additional
details.
Using the Stress Level Widget
The stress level widget displays your current stress level and a
graph of your stress level for the last several hours. It can also
guide you through a breathing activity to help you relax.
1
While you are sitting or inactive, select UP or DOWN to view
the stress level widget.
2
Select START.
• If your stress level is in the low or medium range, a graph
appears showing your stress level for the last four hours.
TIP: To start a relaxation activity from the graph, select
DOWN > START, and enter a duration in minutes.
• If your stress level is in the high range, a message
appears asking you to begin a relaxation activity.
3
Select an option:
• View your stress level graph.
NOTE: Blue bars indicate periods of rest. Yellow bars
indicate periods of stress. Gray bars indicate times when
you were too active to determine your stress level.
• Select Yes to start the relaxation activity, and enter a
duration in minutes.
• Select No to bypass the relaxation activity and view the
stress level graph.
Body Battery
Your device analyzes your heart rate variability, stress level,
sleep quality, and activity data to determine your overall Body
Battery level. Like a gas gauge on a car, it indicates your
amount of available reserve energy. The Body Battery level
range is from 0 to 100, where 0 to 25 is low reserve energy, 26
to 50 is medium reserve energy, 51 to 75 is high reserve energy,
and 76 to 100 is very high reserve energy.
You can sync your device with your Garmin Connect account to
view your most up-to-date Body Battery level, long-term trends,
and additional details (Tips for Improved Body Battery Data,
page 9).
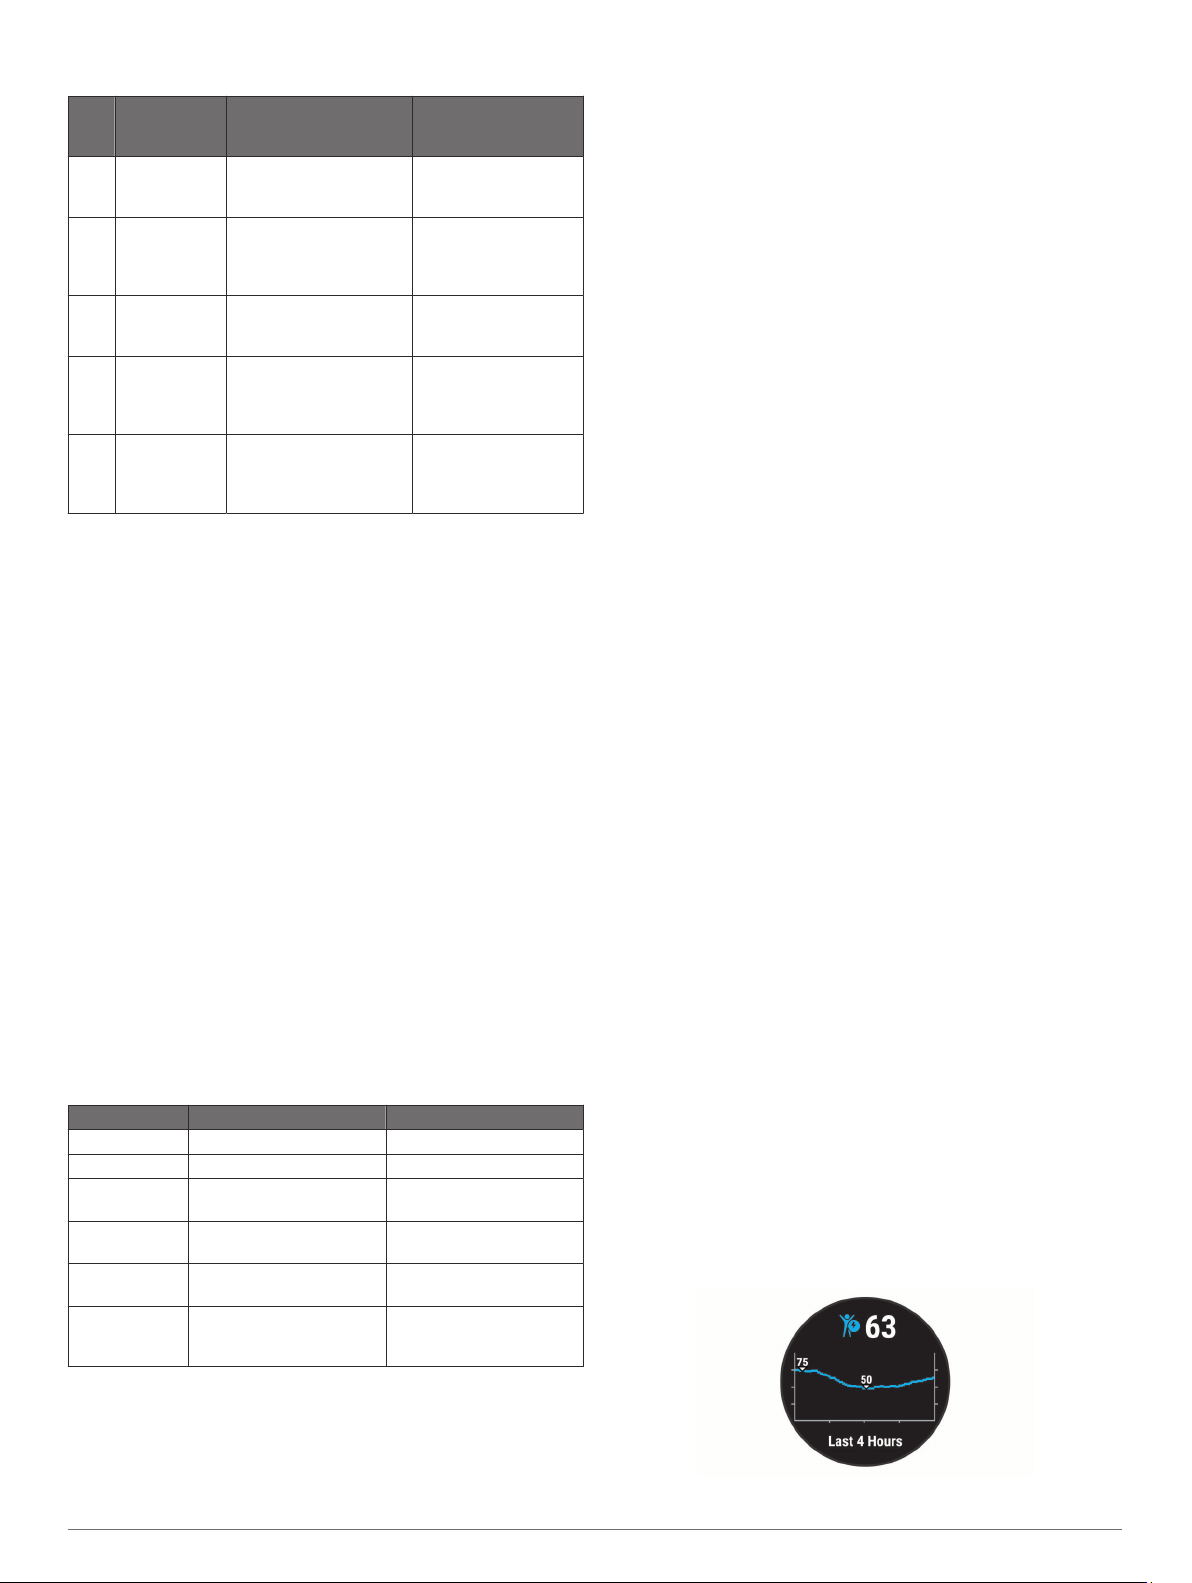
Viewing the Body Battery Widget
The Body Battery widget displays your current Body Battery
level and a graph of your Body Battery level for the last several
hours.
1
Select UP or DOWN to view the Body Battery widget.
NOTE: You may need to add the widget to your widget loop
(Customizing the Widget Loop, page 11).
8 Heart Rate Features
Loading ...
Loading ...
Loading ...