Loading ...
Loading ...
Loading ...
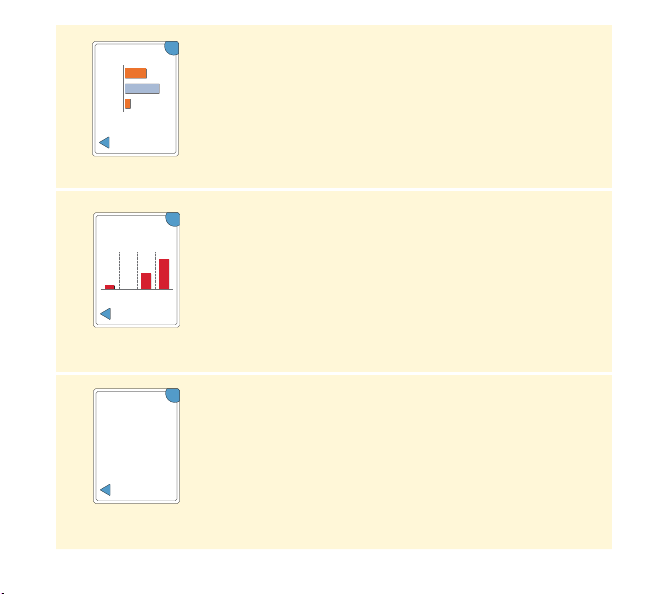
Time In Target
A graph showing the percentage of time your
Sensor glucose readings were above, below or
within your Target Glucose Range.
Low Glucose Events
Information about the number of low glucose
events measured by your Sensor. A low glucose
event is recorded when your Sensor glucose
reading is lower than 3.9 mmol/L for longer
than 15 minutes. The total number of events
is displayed above the graph. The bar graph
displays the low glucose events in four dierent
6-hour periods of the day.
Sensor Usage
Information about how often you scan your Sensor.
The Reader reports an average of how many
times you scanned your Sensor each day, and the
percentage of possible Sensor data the Reader
recorded from your scans.
OK
34%
54%
12%
Time In Target
Above
In Target
Below
Target Range
4.4-10.0 mmol/L
Last 7 Days
OK
Last 7 Days
1
0
Total Events:
10
3
6
Low Glucose
Events
24:0012:0000:00
OK
100%
5
Scans Per
Day
Sensor data
captured
Sensor Usage
Last 7 Days
36
Loading ...
Loading ...
Loading ...