Loading ...
Loading ...
Loading ...
Last Lap Speed: The average speed for the last completed lap.
Last Lap Time: The stopwatch time for the last completed lap.
Last Length Pace: The average pace for your last completed
pool length.
Last Length Stroke Rate: The average number of strokes per
minute (spm) during the last completed pool length.
Last Length Strokes: The total number of strokes for the last
completed pool length.
Last Length SWOLF: The swolf score for the last completed
pool length.
Lengths: The number of pool lengths completed during the
current activity.
Maximum Speed: The top speed for the current activity.
Pace: The current pace.
Speed: The current rate of travel.
Steps: The number of steps during the current activity.
Stroke Rate: The number of strokes per minute (spm).
Strokes: The total number of strokes for the current activity.
Sunrise: The time of sunrise based on your GPS position.
Sunset: The time of sunset based on your GPS position.
Temperature: The temperature of the air. Your body
temperature affects the temperature sensor.
Time in Zone: The time elapsed in each heart rate or power
zone.
Time of Day: The time of day based on your current location
and time settings (format, time zone, daylight saving time).
Timer: The stopwatch time for the current activity.
Total Ascent: The total elevation distance ascended during the
activity or since the last reset.
Total Descent: The total elevation distance descended during
the activity or since the last reset.
Vertical Speed: The rate of ascent or descent over time.
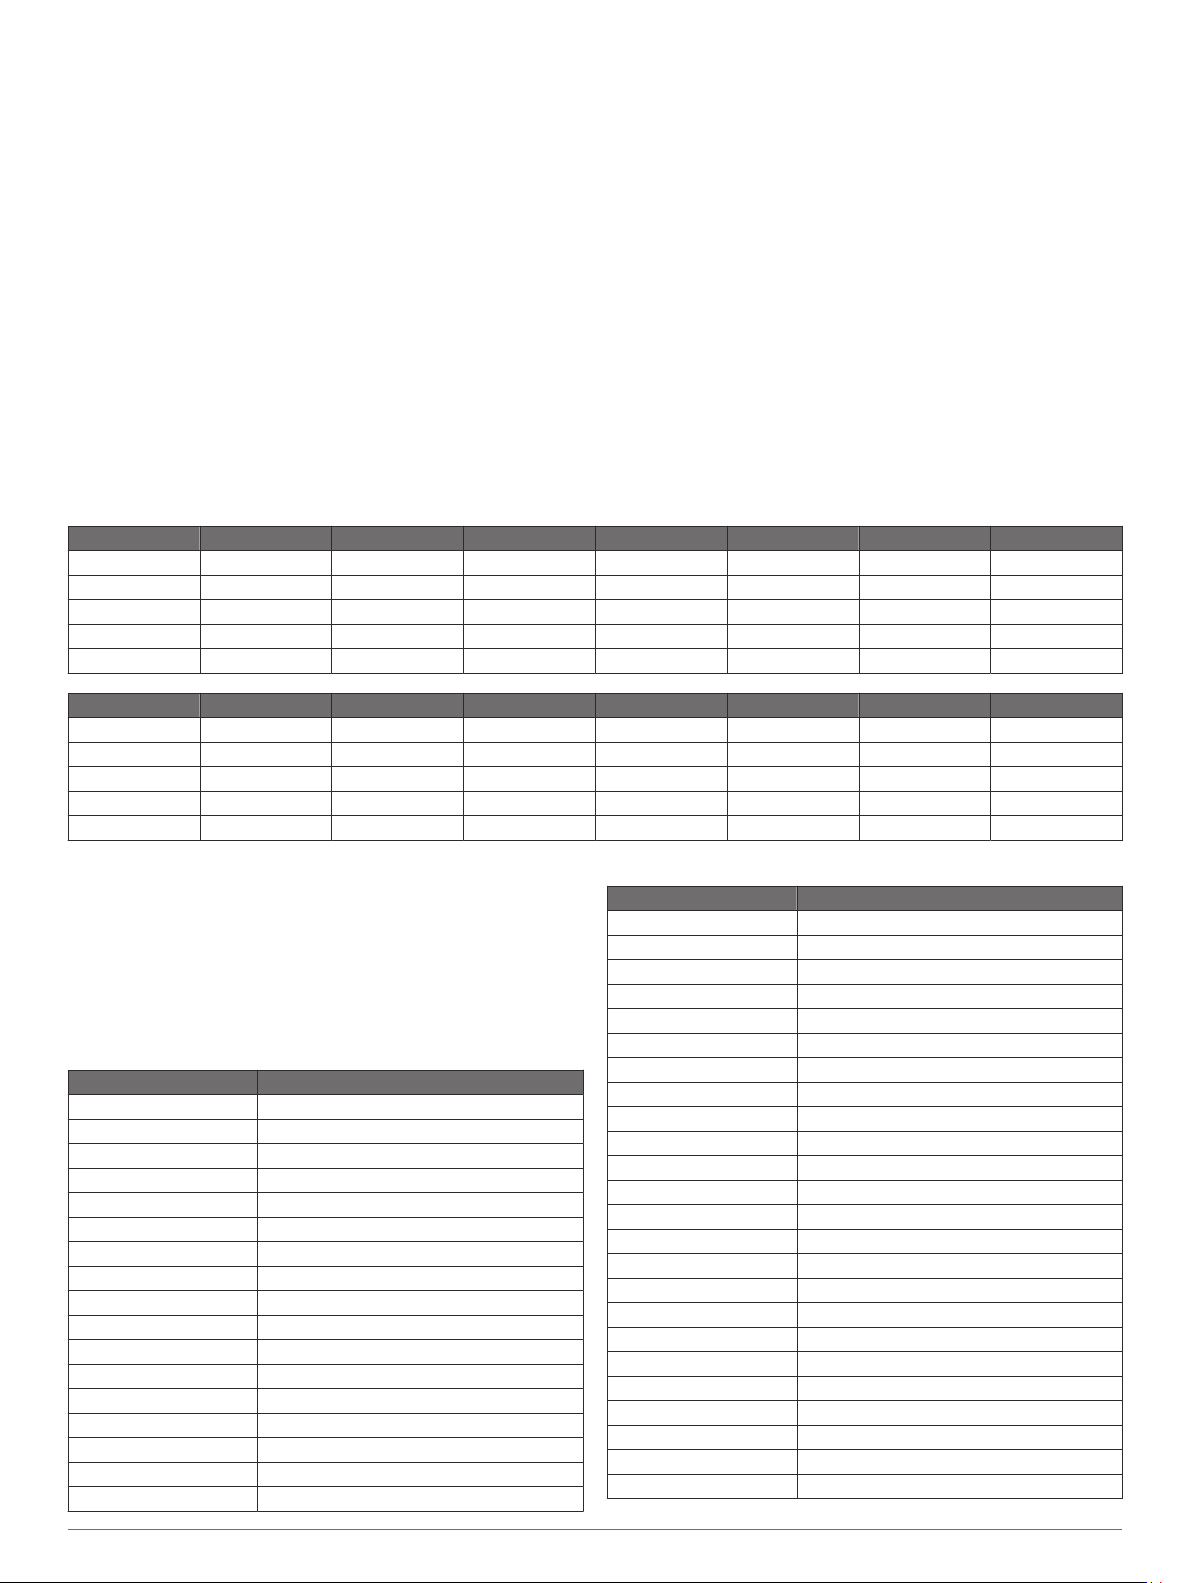
VO2 Max. Standard Ratings
These tables include standardized classifications for VO2 max. estimates by age and gender.
Males Percentile 20–29 30–39 40–49 50–59 60–69 70–79
Superior 95 55.4 54 52.5 48.9 45.7 42.1
Excellent 80 51.1 48.3 46.4 43.4 39.5 36.7
Good 60 45.4 44 42.4 39.2 35.5 32.3
Fair 40 41.7 40.5 38.5 35.6 32.3 29.4
Poor 0–40 <41.7 <40.5 <38.5 <35.6 <32.3 <29.4
Females Percentile 20–29 30–39 40–49 50–59 60–69 70–79
Superior 95 49.6 47.4 45.3 41.1 37.8 36.7
Excellent 80 43.9 42.4 39.7 36.7 33 30.9
Good 60 39.5 37.8 36.3 33 30 28.1
Fair 40 36.1 34.4 33 30.1 27.5 25.9
Poor 0–40 <36.1 <34.4 <33 <30.1 <27.5 <25.9
Data reprinted with permission from The Cooper Institute. For more information, go to www.CooperInstitute.org.
Wheel Size and Circumference
Your speed sensor automatically detects your wheel size. If
necessary, you can manually enter your wheel circumference in
the speed sensor settings.
The tire size is marked on both sides of the tire. This is not a
comprehensive list. You can also measure the circumference of
your wheel or use one of the calculators available on the
internet.
Tire Size Wheel Circumference (mm)
20 × 1.75 1515
20 × 1-3/8 1615
22 × 1-3/8 1770
22 × 1-1/2 1785
24 × 1 1753
24 × 3/4 Tubular 1785
24 × 1-1/8 1795
24 × 1.75 1890
24 × 1-1/4 1905
24 × 2.00 1925
24 × 2.125 1965
26 × 7/8 1920
26 × 1-1.0 1913
26 × 1 1952
26 × 1.25 1953
26 × 1-1/8 1970
26 × 1.40 2005
Tire Size Wheel Circumference (mm)
26 × 1.50 2010
26 × 1.75 2023
26 × 1.95 2050
26 × 2.00 2055
26 × 1-3/8 2068
26 × 2.10 2068
26 × 2.125 2070
26 × 2.35 2083
26 × 1-1/2 2100
26 × 3.00 2170
27 × 1 2145
27 × 1-1/8 2155
27 × 1-1/4 2161
27 × 1-3/8 2169
29 x 2.1 2288
29 x 2.2 2298
29 x 2.3 2326
650 x 20C 1938
650 x 23C 1944
650 × 35A 2090
650 × 38B 2105
650 × 38A 2125
700 × 18C 2070
700 × 19C 2080
24 Appendix
Loading ...
Loading ...
Loading ...