

ii
Important Information
Except as otherwise expressly stated in the License that accompanies a program, Texas
Instruments makes no warranty, either express or implied, including but not limited to
any implied warranties of merchantability and fitness for a particular purpose,
regarding any programs or book materials and makes such materials available solely
on an "as-is" basis. In no event shall Texas Instruments be liable to anyone for special,
collateral, incidental, or consequential damages in connection with or arising out of the
purchase or use of these materials, and the sole and exclusive liability of Texas
Instruments, regardless of the form of action, shall not exceed the amount set forth in
the license for the program. Moreover, Texas Instruments shall not be liable for any
claim of any kind whatsoever against the use of these materials by any other party.
EasyData is a trademark of Vernier Software and Technology.
© 2016 Texas Instruments Incorporated

Contents
Important Information
ii
What's New 1
What's New in TI-84 Plus CE Version 5.2
1
Sequence Graphing
1
Distributions
1
TI-Basic Program Editor Update
1
Assessment Updates
2
CE Apps Version 5.2
2
Using Your TI-84 Plus CE Graphing Calculator 3
Key Features
3
Using the Keyboard 4
Turning the TI-84 Plus CE On and Off
4
Using the TI-84Plus CE Keyboard
5
Setting the Display Brightness
8
Using the Home Screen
9
Working with Menus
15
Setting Up the Calculator Modes 19
Setting Modes
19
MATHPRINT™ CLASSIC
21
NORMAL SCI ENG
21
FLOAT 0 1 2 3 4 5 6 7 8 9
22
RADIAN DEGREE
22
FUNCTION PARAMETRIC POLAR SEQ
23
THICK DOT-THICK THIN DOT-THIN
23
SEQUENTIAL SIMUL
24
REAL a+bi re^(qi)
24
FULL HORIZONTAL GRAPH-TABLE
24
FRACTION TYPE: n/d Un/d
25
ANSWERS: AUTO DEC
25
STAT DIAGNOSTICS: OFF ON
25
STAT WIZARDS: ON OFF
26
SET CLOCK
26
LANGUAGE
27
Evaluating Expressions 29
Order of Operations
29
Entering Expressions and Instructions
31
iii

iv
Working with Graphs 35
Using Color on the TI-84 Plus CE
35
Using QuickPlot and Fit Equation
37
Working With Images
37
Working with Matrices 38
Using the Matrix Editor
38
Performing a Calculation with a Matrix
38
Working with Probability and Statistics 40
Working with Probability
40
Working with Statistics
41
Working with Variables 45
Storing Variable Values
47
Recalling Variable Values
48
Managing Calculator Files 49
Transferring the OS from calculator to calculator
49
Compatibility with Graphing Calculators
49
Using Applications (Apps) 51
Cabri™ Jr. App
51
CellSheet™ App
51
Conic Graphing App
51
Inequality Graphing App
52
Periodic Table App
52
Polynomial Root Finder and Simultaneous Equation Editor App
52
Probability Simulation App
52
Science Tools App
53
SmartPad™ CE App
53
TI-Innovator™ Hub App
54
Transformation Graphing App
54
Vernier EasyData™ App
54
Using Accessories 55
Using TI Desktop Software
55
Using the TI Charging Station CE
55
Using, Replacing, and Charging Batteries
59
Using Press-to-Test 62
Setting Up Test Mode
62

Bringing a Calculator Out of Test Mode
64
Diagnosing and Correcting Error Conditions 65
Diagnosing an Error
65
Correcting an Error
65
General Information 66
Texas Instruments Support and Service
66
Service and Warranty Information
66
Precautions for Rechargeable Batteries
66
Korean Class A warning statement
67
Index 68
v

vi
What's New
What's New in TI-84 Plus CE Version 5.2
To report issues and help us improve our applications, please email us at ti-
cares@ti.com.
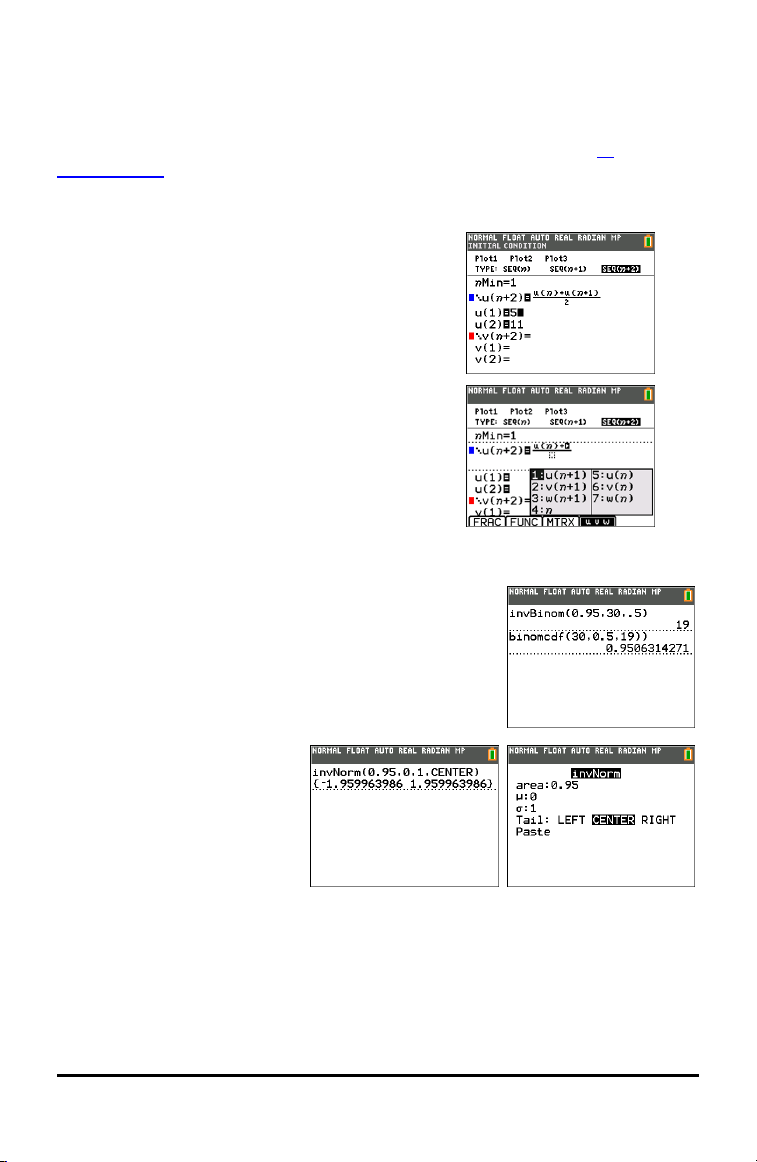
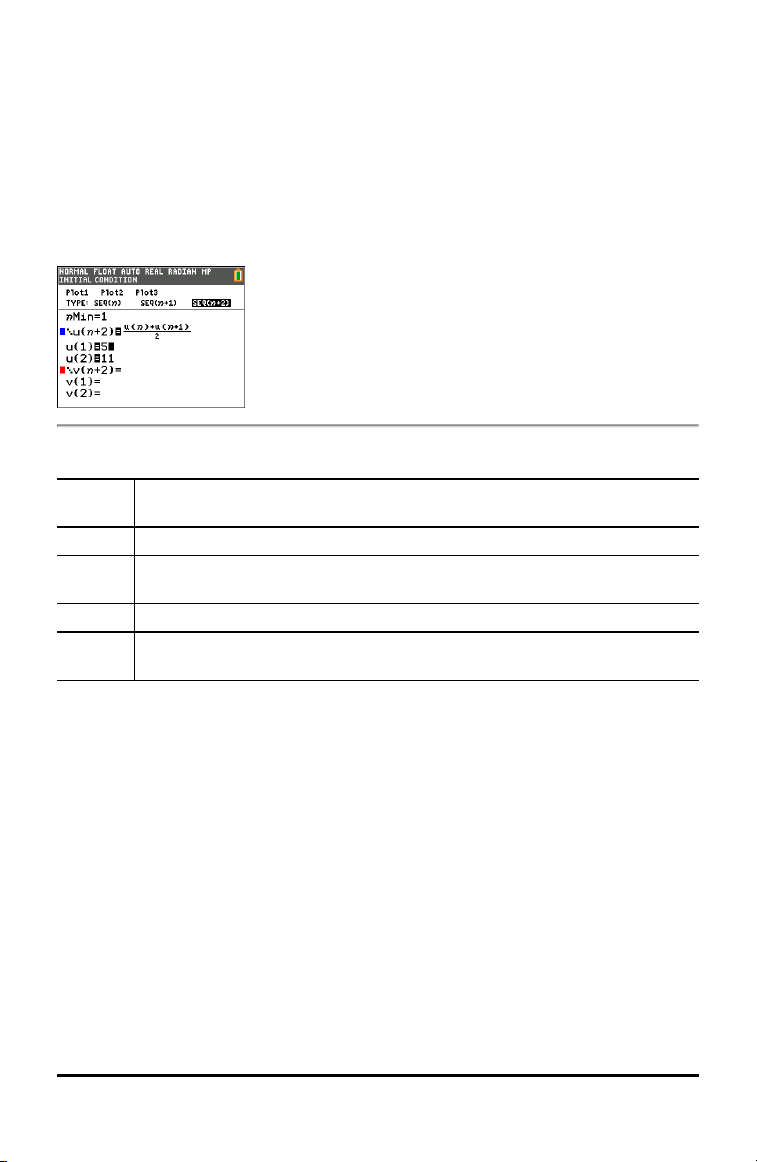
Sequence Graphing
Additional Seq graphing mode
Adds additional sequence types:
seq(n+1)
seq(n+2)
Adds easy sequence function entry from shortcut menu.
Distributions
Inverse Binomial Cumulative Distribution
Calculate the inverse binomial cumulative distribution. If
needed, also calculate the binomial CDF for the resulting
values for a full analysis.
Inverse Normal Distribution
Update
Updated to include an optional
argument "tail" to calculate LEFT,
(-∞,-a), CENTER [-a,a] or RIGHT
(a,∞) for Real a. LEFT is default.
TI-Basic Program Editor Update
• Additional or Enhanced TI-Basic Commands
- Wait
- eval(
- Send(Supports TI-Innovator™ commands
What's New 1
2 What's New
- Get(Enhanced with timeout argument
- DelVar
- to String(
TI-Basic Program Editor Line Number
If an error occurs when running a program, select Goto. The
cursor is now near the error, and the command line number
displays in the status bar.
MathPrint Icons on Shortcut
menus
Shortcut menus enhanced with
MathPrint template icons.
Assessment Updates
Always use the latest TestGuard™ CE App version with the latest CE OSfor exam
setups.
CE Apps Version 5.2
Language Localization Apps
• Up to date with the latest localizations.
SmartPad CE App
• Remote keypad support updated for TI-SmartView™ CE v 5.2.
TestGuard™ CE App
• Always use the latest version of app and OS for exam setups.
TI-Innovator™ Hub App
For CE version 5.2 only, a HUB submenu is added to the TI-Basic program editor with
command support for TI-Innovator™ Hub. This app title will not display in the Œ
menu and runs automatically when loaded on the CE OS version 5.2.
Vernier EasyData™ App version 5.2
• Enhanced for TI-SmartView™ CE.
• Pre-loaded on the CE emulator in TI-SmartView™ CE version 5.2. Single sensor data
collection is now available using the CE emulator only running Vernier EasyData™
App version 5.2.

Using Your TI-84 Plus CE Graphing Calculator
The TI-84 Plus CE graphing calculator comes with a USB cable, plenty of storage and
operating memory. It also comes pre-loaded with software applications (Apps) to help
you perform pre-algebra, calculus, biology, chemistry, and physics calculations.
Key Features
• High resolution, full-color backlit display
- Distinguish between multiple graphs and plots with color-coded equations,
plots, and objects
- Make graphs easier to read by adding grid lines
• TI Rechargeable Battery
- Recharges using a USB cable, wall charger, or TI Charging Station CE
• Familiar TI-84 Plus functionality
- Similar menu structure and navigation as the TI-84 Plus family with enhanced
features
- Built-in MathPrint™ functionality to input and view math symbols, formulas
and stacked fractions
• Import and use images
- Use TI Connect™ CE Software to send images (.gif, .jpg, .png, .tif, .bmp) from a
computer to a calculator
- Graph on top of images to connect concepts to the real world
The built-in applications extend the functionality of your calculator, allowing you to
perform specific math and science functions and to deepen your understanding of
concepts. Some pre-loaded applications include:
• Cabri™ Jr. Geometry
App
• Inequality
Graphing
• CellSheet App • Periodic Table
• Conic Graphing
Use this guide to learn more about these features and other essential tools of your TI-
84 Plus CE graphing calculator.
Using Your TI-84 Plus CE Graphing Calculator 3
4 Using the Keyboard
Using the Keyboard
This section covers basic graphing calculator settings and explains how to navigate the
home screen and menus.
Turning the TI-84 Plus CE On and Off
This section covers basic on and off features for your graphing calculator.
Turning the Graphing Calculator On
Press É.
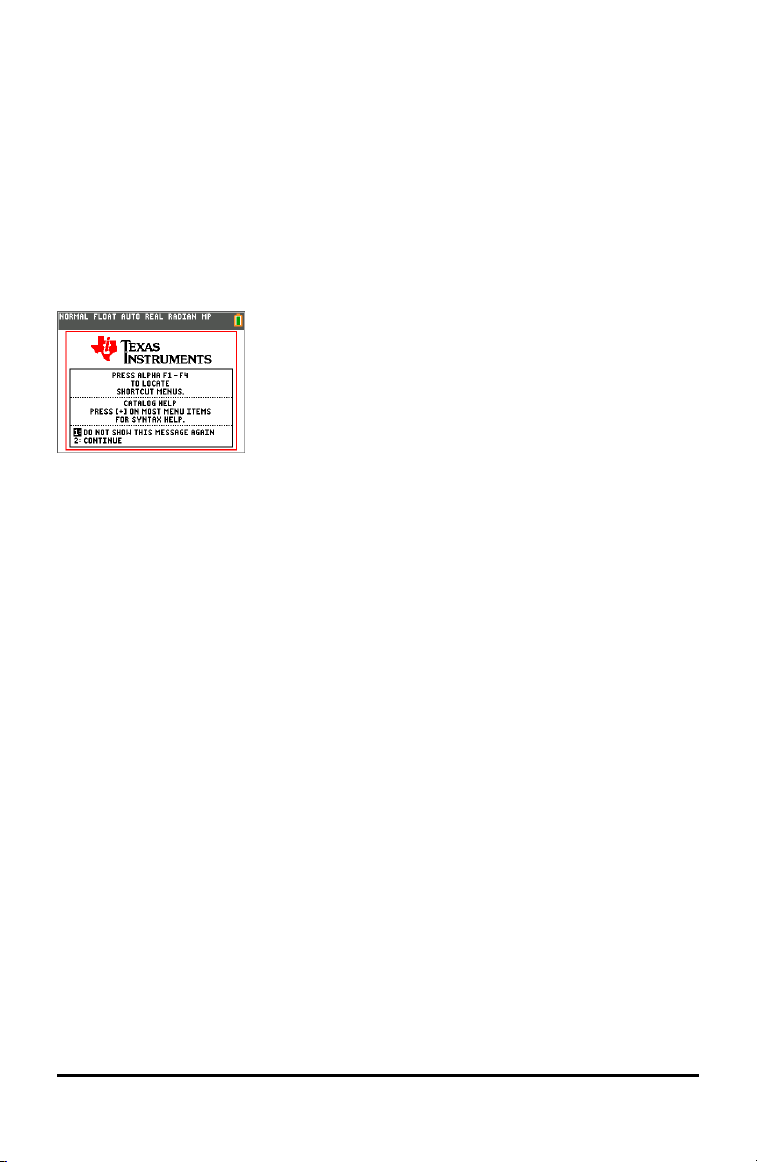
An information screen displays:
• Press À to continue to the home screen but not see this information screen the
next time you press É.
-or-
• Press Á to continue to the home screen.
Note: Any entry from this information screen will take you to the home screen (a
blank screen).
The information screen shows the following for information purposes only. You must
go to the home screen before you can complete the following.
• Press ƒ ^ - a to locate shortcut menus.
• Press à on most menu items for Catalog Help.
Note: This message also displays when you reset RAM.
You may see a shortcut menu located at [alpha][F5] for interactive features used
in the graph area.
Turning the Graphing Calculator Off
Press y M.
• The Constant Memory™ function retains settings and memory, and clears any error
condition.
• If you turn off the TI-84PlusCE and connect it to another graphing calculator or
personal computer, any communication will “wake" it up.
Automatic Power Down™ (APD™)
• To prolong battery-life, APD™ automatically turns the TI-84PlusCE off after about
three to four minutes of inactivity.
• If APD™ turns the graphing calculator off, it will return as you left it, including the
display, cursor, and any error.
Using the TI-84Plus CE Keyboard
This section describes the functions of specific keys on the graphing calculator
keyboard.
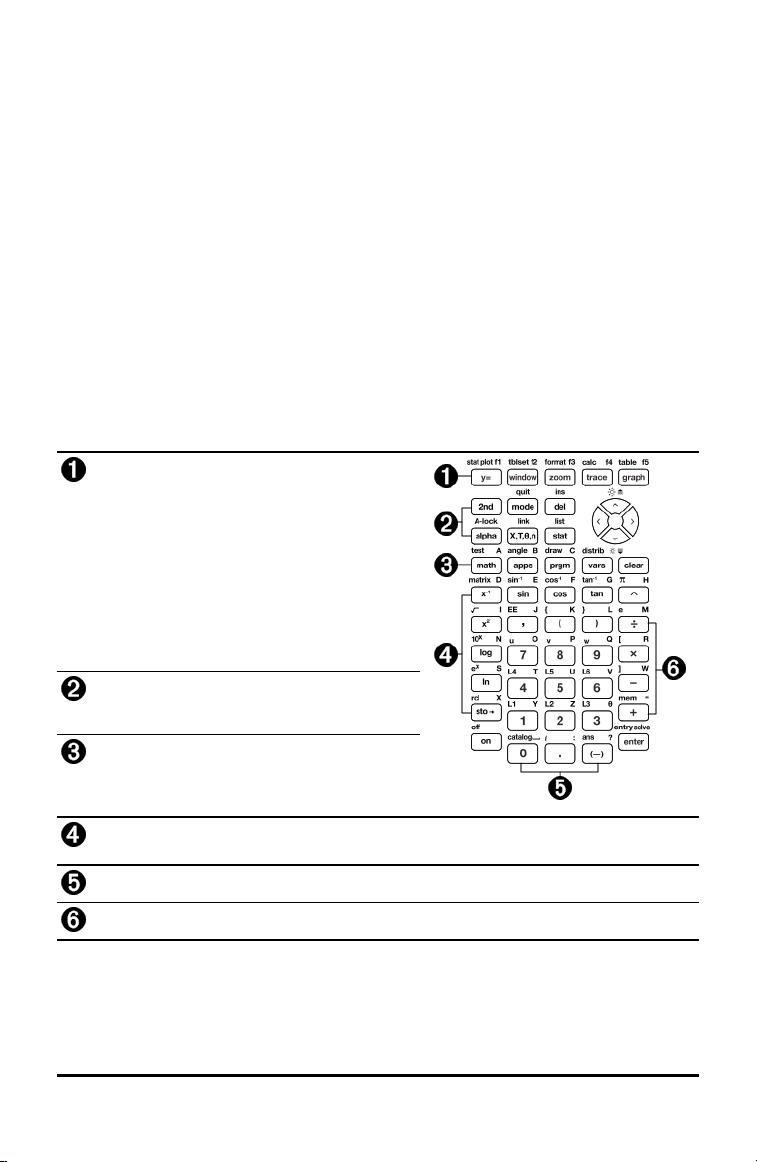
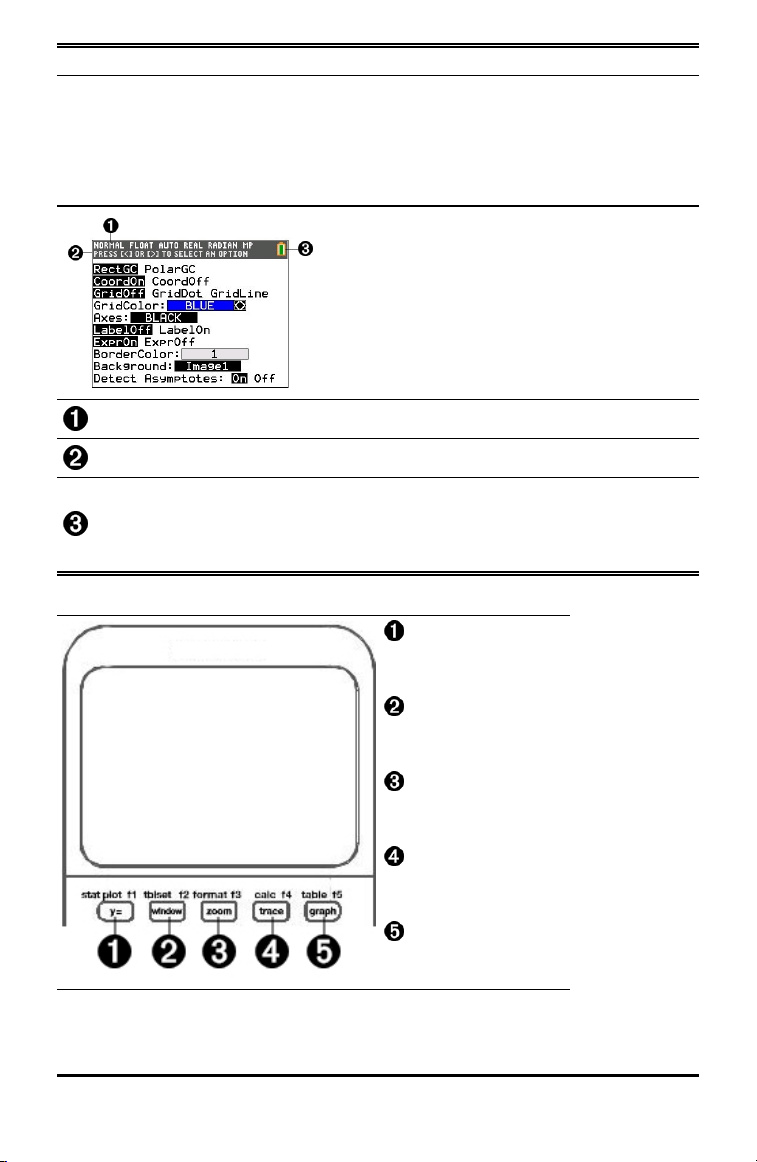
TI-84 Plus CE Keyboard
Graph/Plot Setup Keys allow access to
interactive graphing features. When some
graph screen features are active, you may see
a shortcut menu in the ƒ b location for
feature options.
Editing Keys allow you to edit expressions
and values.
Math and Statistics Keys display menus that
access math, statistics, and other basic
functions.
Scientific Keys allow access to the capabilities of a standard scientific calculator—
including trigonometric functions.
Number Keys allow you to enter numbers.
Common Math Functions allow you to divide, multiply, subtract, and add.
Using the Keyboard 5
6 Using the Keyboard
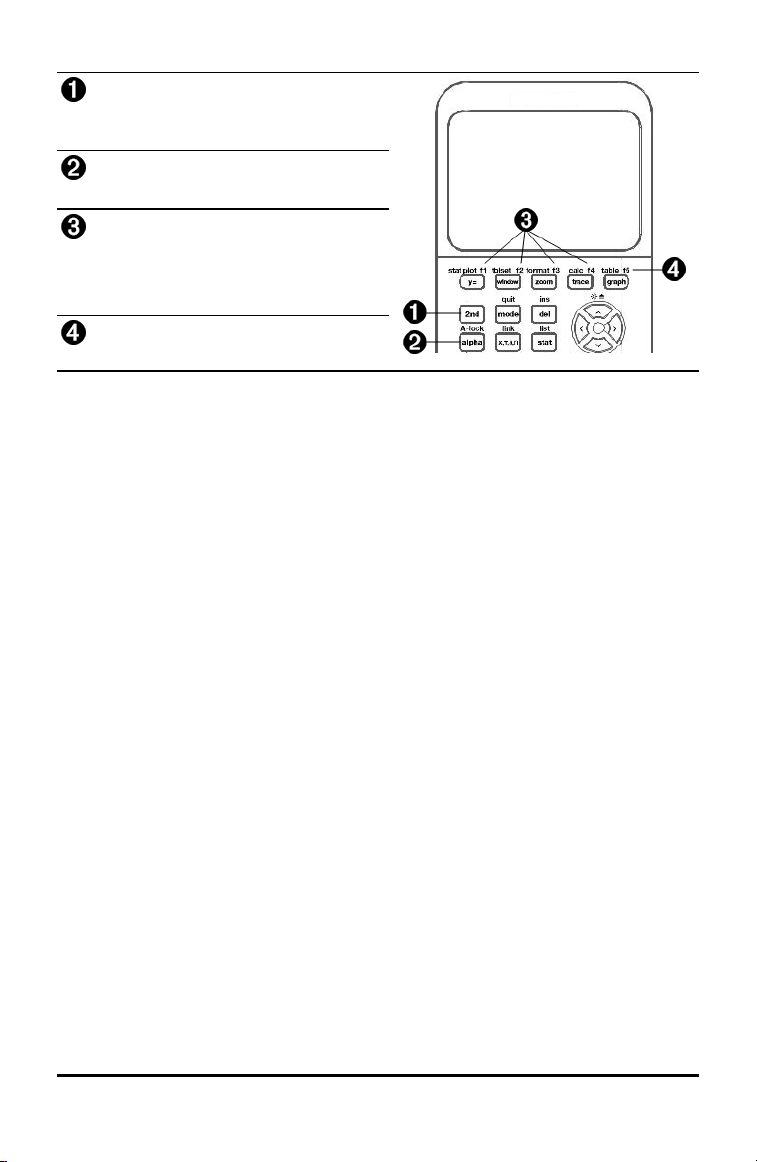
Function Keys
y
Access the second function
printed to the left above each
key.
ƒ
Access the third function printed
to the right above each key.
ƒ
^ -
a
Access shortcut menus for
fraction templates, n/d, quick
matrix entry, select MATH
menus, and VARS menu
functions.
ƒ
b
Access options for the DRAW
command when used in GRAPH.
Using the Function Keys
Primary
Function
• The function appears on the key.
Ex: to display the MATH menu, press ».
Secondary
Function
• The function appears above the key in the same color as the y key.
• When you press the y key, the key name printed above the other key
becomes active for the next keystroke.
Ex: to display the TEST menu, press y and then ».
• The flashing cursor becomes Þ when you press y. Þ may also appear
in the status bar.
Tertiary
(Alpha
Key)
Function
• The function appears above the key in the same color as the ƒ key.
• The third function allows you to enter alphabetic characters and special
symbols, and to access SOLVE and shortcut menus.
Ex: to display the letter A, press ƒ and then ».
• To enter several alphabetic characters in a row, press y 7. This
locks the alpha key in the ON position so that you avoid having to
repeatedly press ƒ. Press ƒ again to unlock it.
• The flashing cursor becomes Ø when you press ƒ. Ø may also appear
in the status bar.
Using the Keyboard 7

8 Using the Keyboard
Setting the Display Brightness
This section covers how to set the display brightness and explains automatic dimming.
Adjusting the Display Brightness
You can adjust the display brightness to suit your viewing angle and lighting conditions.
To adjust the brightness, follow these steps.
▶ Press y † to darken the screen one level at a time.
▶ Press y } to lighten the screen one level at a time.
The TI-84PlusCE retains the brightness setting in memory when it is turned off.
Automatic Dimming
The TI-84PlusCE automatically dims the screen brightness after 90 seconds of
inactivity.
▶ Press É to return the screen to the preset brightness.
▶ Pressing É to adjust the brightness will not affect any of the current state of your
calculator work.
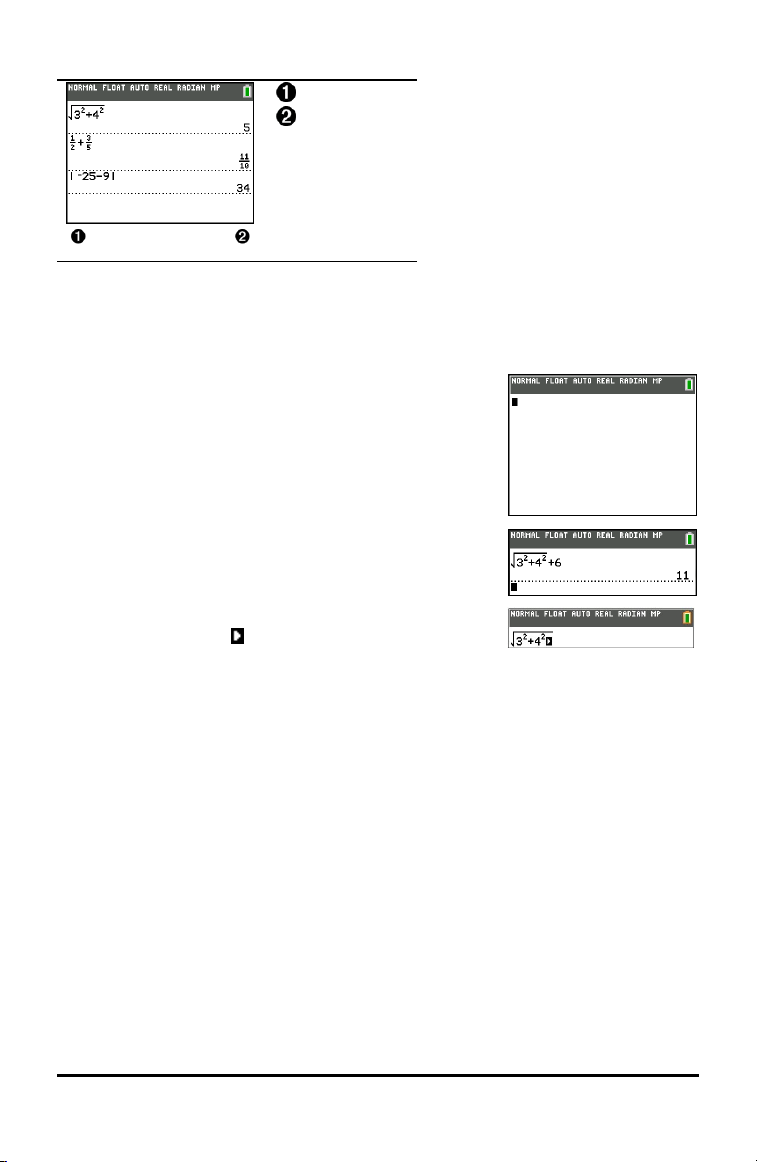
Using the Home Screen
Expressions
Answers
Use the home screen to enter instructions and evaluate expressions. Answers appear
on the same screen. Most calculations are stored in home screen history. Press } and
† to scroll through the entry history and paste the entries or answers to the current
entry line.
1. Enter a calculation.
2. Press y 5 from any screen until you get back to the
home screen.
3. Press y C 3 ¡ Ã 4 ¡ ~ Ã 6 Í.
Note: When you are in a MathPrint™ template, the cursor
turns into a right arrow to indicate that you must press ~
to get out of the template before you continue entering the
calculation.
Displaying Entries and Answers
Mode settings control how the TI-84PlusCE interprets expressions and displays
answers. Press z to switch between classic entries and MathPrint™ mode. This
guide focuses on MathPrint™ Mode, but may reference some classic entries.
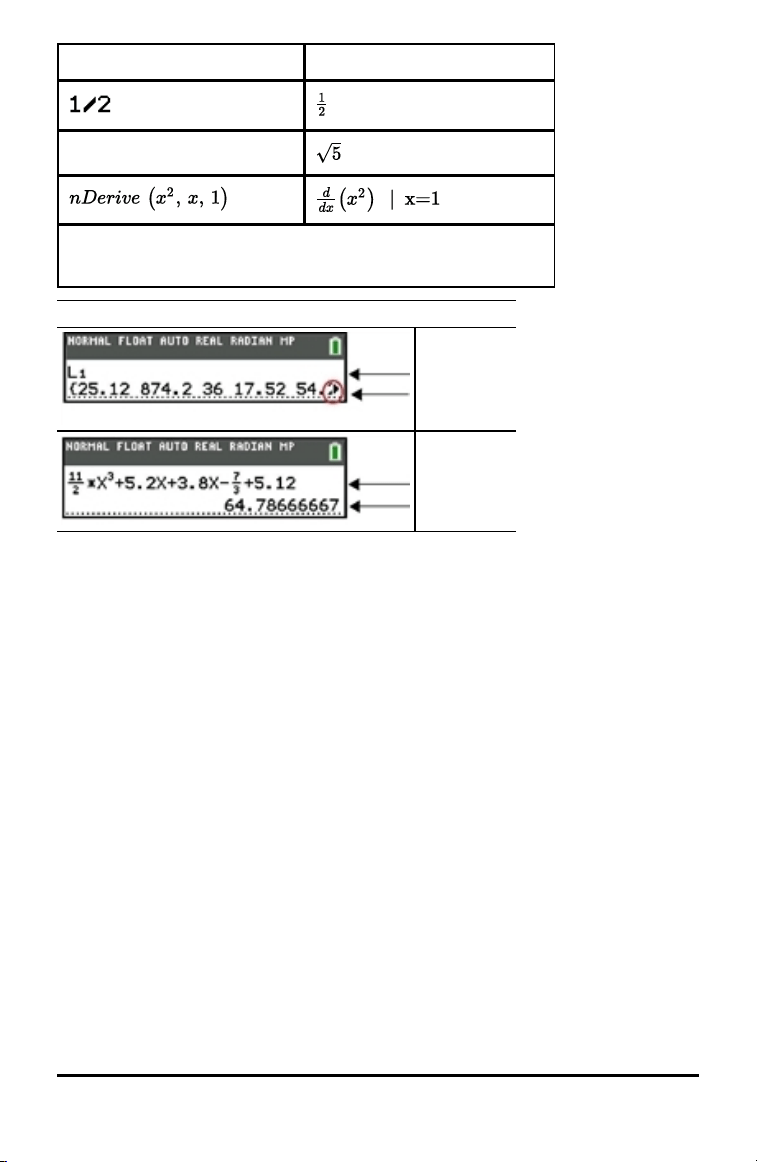
MathPrint™ Mode
• If an expression exceeds one line, it may scroll off the screen (on the home screen
or the Y=screen). Press ~ to see the entire expression.
Tip: Press the cursor without pressing y to move the cursor along the line.
• An arrow appears to the left of an answer if it scrolls off the screen. Press ~ and
| before you enter another expression to display the entire answer.
Using the Keyboard 9
10 Using the Keyboard
Classic Entries MathPrint™
√(5)
Some input areas in MathPrint™ mode only support classic entries.
Ex: y -
MathPrint™ (default)
Entry
Answer (Scrolls)
Entry
Answer
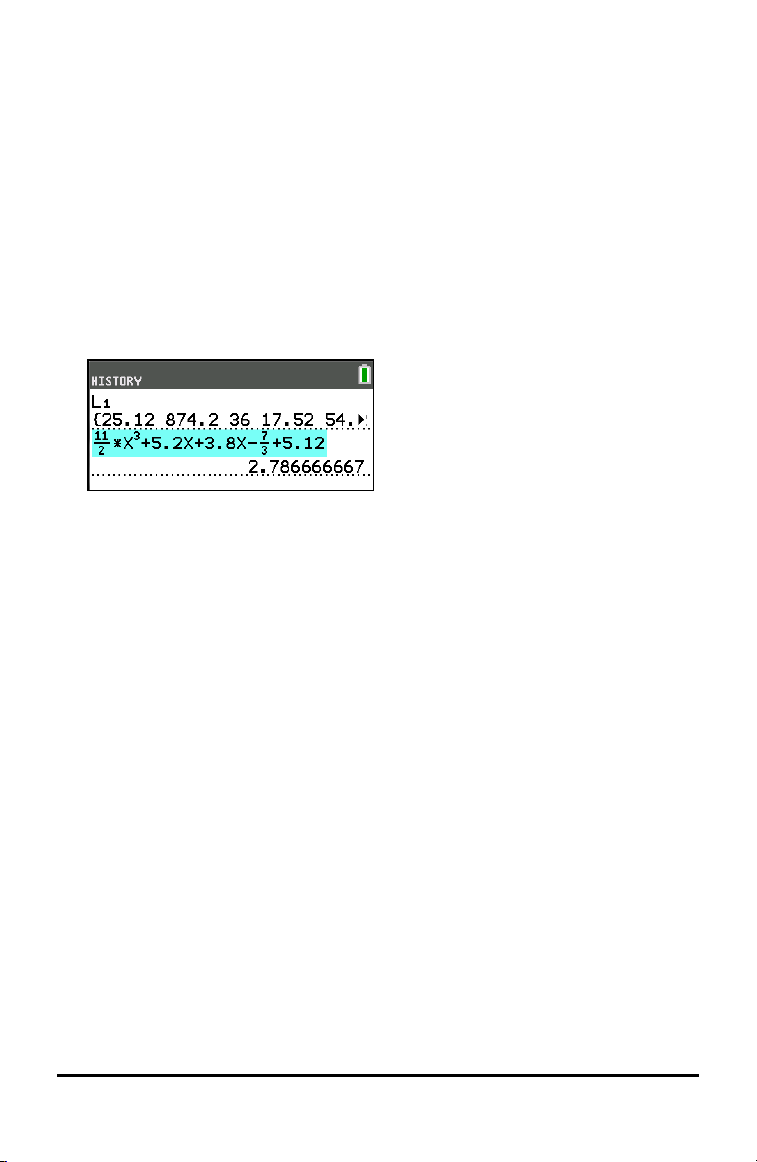
Scrolling Through the Home Screen History
If all lines of the display are full, text scrolls off the top of the display.
You can scroll up through previous entries and answers on the home screen, even if you
have cleared the screen. When you find an entry or answer that you want to use, you
can select it and paste it (press Í) on the current entry line.
Note: List and matrix answers cannot be copied and pasted to the new entry line.
However, you can copy the list or matrix command to the new entry line and execute
the command again to display the answer.
▶ Press } or † to move the cursor to the entry or answer you want to copy and then
press Í.
The TI-84PlusCE highlights the entry the cursor is on to help you select your
desired choice.
The entry or answer that you copied is automatically pasted on the current input
line at the cursor location.
Note: If the cursor is in a MathPrint™ expression, such as the denominator of a
fraction, press ƒ } to move the cursor out of the expression and then move
the cursor to the entry or answer you want to copy to that location in the
MathPrint™ template.
▶ Press ‘ or { to delete an entry/answer pair. After an entry/answer pair has
been deleted, it cannot be displayed or recalled again.
Returning to the Home Screen
To return to the home screen from any other screen, press y 5 until you get back
to home screen.
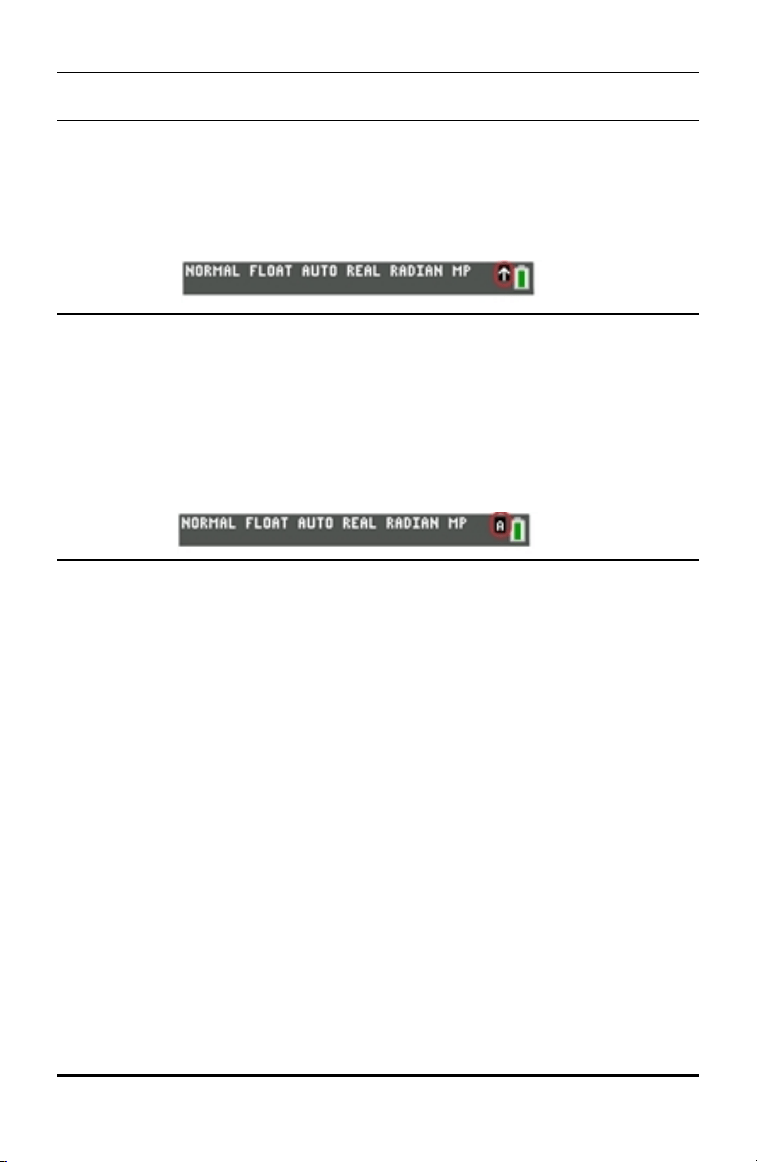
Status Bar
The status bar displays on all screens and gives information about the selected
calculator mode settings, any context help available for the item you currently have
selected, and battery status.
The status bar may also show a busy indicator if the calculator is performing an
operation, Ø to indicate the calculator is in alpha status, and Þ to indicate the
secondary function is active.
Selected mode settings are displayed on the top line of the status bar when the cursor
is in the active entry area. Mode settings do not display when the cursor is in the home
screen history, since the mode may have been different for previous calculations.
Using the Keyboard 11
12 Using the Keyboard
Tip:
Context help, if available, is displayed on the second line. The battery status icon, busy
indicator, alpha indicator, and second key indicator are on the right. When you scroll into
the home screen history, the context help on the status bar displays HISTORY.
In the example below, the cursor is on the GridColor option. The context help for how to
change the GridColor using the spinner menu is displayed on the second line of the
status bar.
Selected MODE settings.
Context help for current cursor position.
Battery icon.
This area of the status bar also displays the busy indicator,
alpha indicator, and second key indicator, depending on the state of the graphing
calculator.
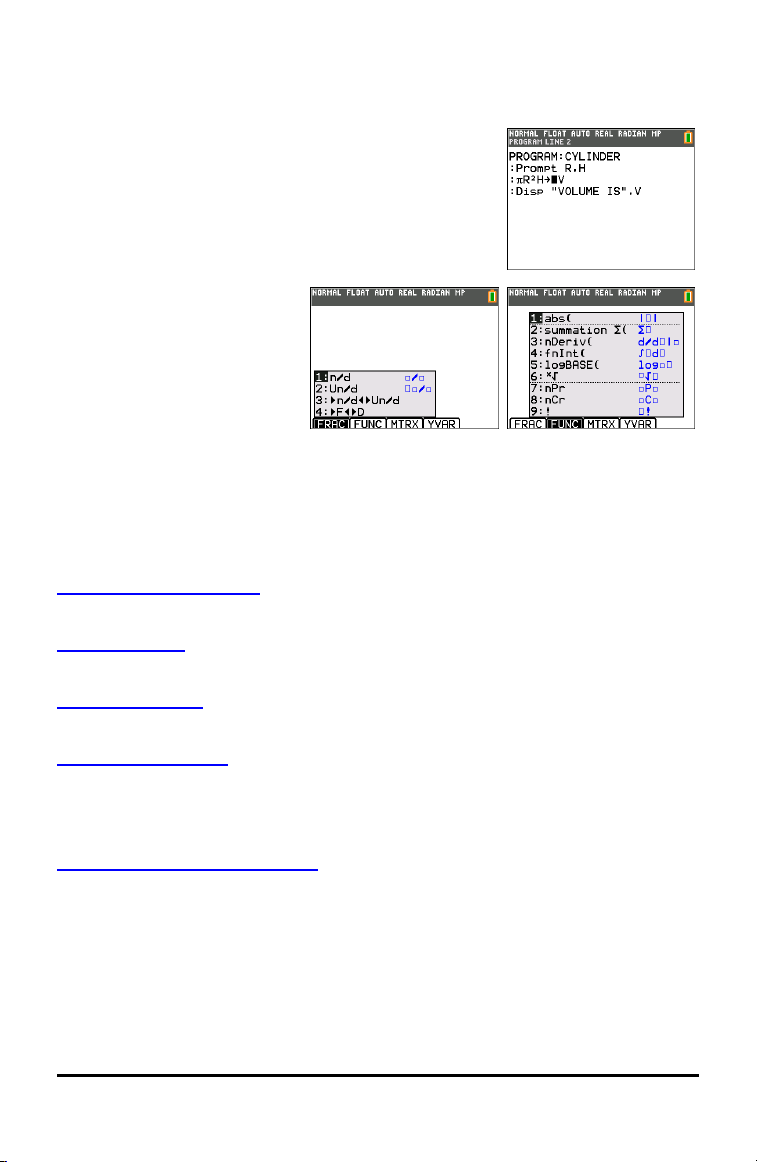
Using Shortcut Menus
ƒ ^
Opens FRAC menu.
ƒ _
Opens FUNC menu.
ƒ `
Opens MTRX menu.
ƒ a
Opens YVAR menu.
ƒ b
Opens special menus.
Shortcut menus allow quick access to the following:
^
Templates to enter fractions, and to toggle between whole and mixed fractions,
and fractions and decimals.
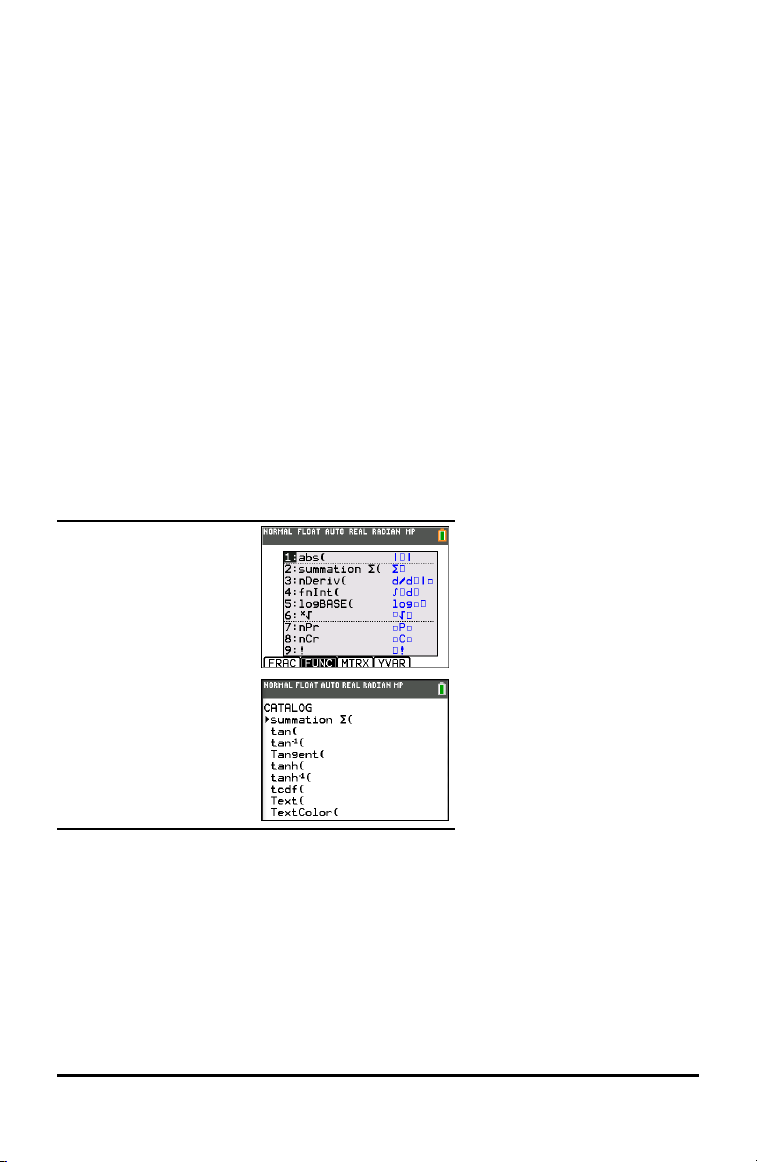
_
Selected functions from the MATH MATH and MATH NUM menus as you would
see them in a textbook, when in MathPrint™ mode. Functions include absolute
value, numeric differentiation, numeric integration, summation, log base n,
square root, permutations, combinations, and factorials.
`
Quick MathPrint™ matrix entry, when available.
a
Names of function variables from the VARS Y-VARS menu.
To open a shortcut menu, press ƒ plus the corresponding F-key: ^ for FRAC, _
for FUNC, ` for MTRX, a for YVAR, or b for special menus within interactive graph
activities such as DRAW or QuickPlot and Fit Equation.
To select a menu item:
-either-
▶ Press the number corresponding to the item.
-or-
▶ Use the arrow keys to move the cursor to the appropriate line and then press Í.
You can select all shortcut menu items except matrix templates using standard menus.
For example, you can choose the summation template from several places:
FUNC shortcut menu
ƒ _
y catalog
The shortcut menus are available to use where input is allowed. If the calculator is in
Classic mode, or if a screen is displayed that does not support MathPrint™ display,
entries will be displayed in Classic mode. The MTRX menu is only available in
MathPrint™ mode on the home screen and in the Y=editor.
Note: Shortcut menus may not be available if ƒ plus F-key combinations are used
while an application is running.
Using the Keyboard 13
14 Using the Keyboard
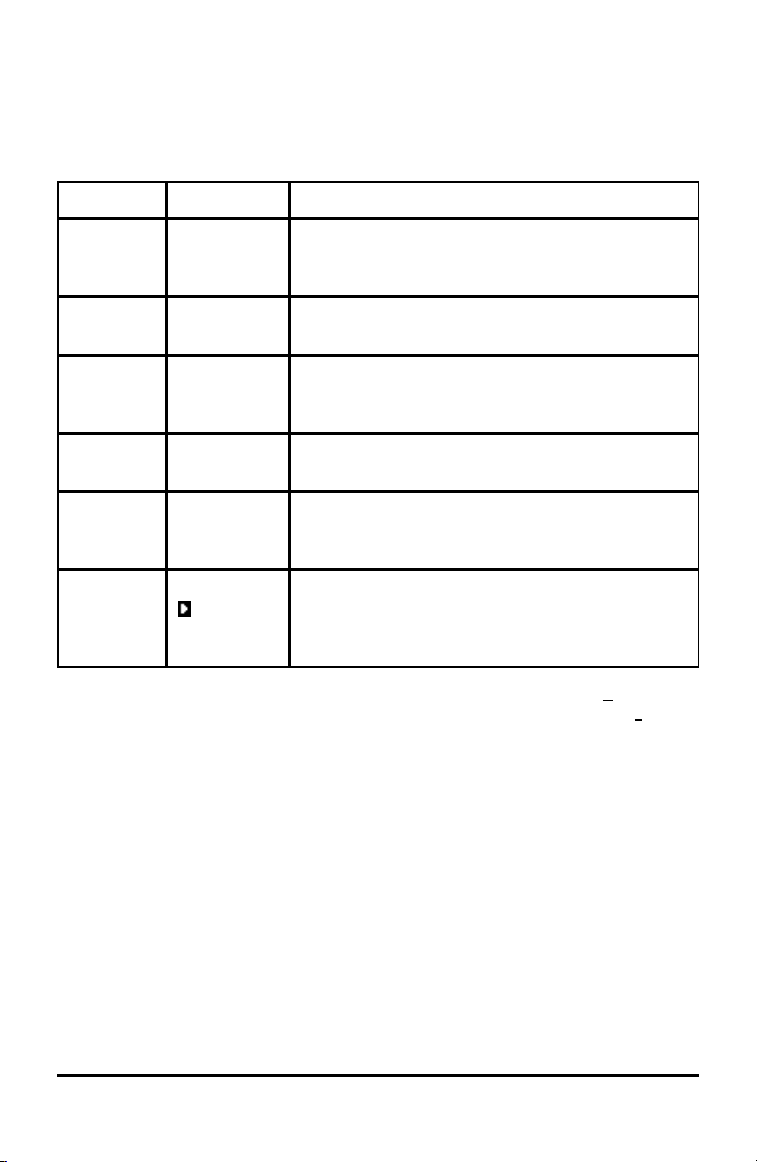
Display Cursors
The cursor may change to indicate what will happen when you press the next key or
when you select the next menu item to be pasted as a character.
Note: The second cursor Þ and alpha cursor Ø may appear on the status bar, depending
on the context.
Cursor Appearance Effect of Next Keystroke
Entry Solid
rectangle
$
This is the default cursor. Enter characters at this
cursor; this overrides any existing character.
Insert Underline
__
Press y6 for this cursor. Enter characters in front
of the cursor location.
Second Reverse
arrow
Þ
This allows you to enter a 2nd character or complete
a 2nd operation.
Alpha Reverse A
Ø
An alpha character is entered, SOLVE is executed, or
shortcut menus are displayed.
Full Checkerboard
rectangle
#
No entry; the maximum characters are entered at a
prompt or memory is full. Also indicates the limit of
the allowed MathPrint™ mode levels.
MathPrint™ Right arrow The cursor moves to either the next part of the
template or out of the template. Press the right arrow
to move out of all MathPrint™ templates before
entering the remaining terms in an expression.
If you press ƒ during an insertion, the cursor becomes an underlined A (A). If you
press y during an insertion, the underlined cursors becomes an underlined # (#).
Note: If you highlight a small character such as a colon or a comma and then press
ƒ or y, the cursor does not change because the cursor width is too narrow.
Working with Menus
You can access TI-84PlusCE commands using menus.
Displaying a Menu
• When you press a key to display a menu, that menu temporarily replaces the
screen where you are working.
• Ex: press » to display the MATH menu.
• After you select an item from a menu, the screen where you are working usually
displays again.
Note: If a context help message is in the status bar when you press a menu that
temporarily replaces the screen, that context help will remain in the status bar as a
reminder that you are working within a context.
Moving from One Menu to Another
Some keys access more than one menu. When you press such
a key, the names of all accessible menus are displayed on the
top line. When you highlight a menu name, the items in that
menu are displayed. Press ~ and | to highlight each menu
name.
Note: FRAC shortcut menu items are found in the FRAC
menu, and are also found on the MATH NUM menu. FUNC
shortcut menu items are also found on the MATH MATH
menu.
Scrolling a Menu
To scroll down the menu items, press †. To scroll up the menu items, press }.
To page down 9 menu items at a time, press ƒ †. To page up 9 menu items at a
time, press ƒ }.
To go to the last menu item directly from the first menu item, press }. To go to the
first menu item directly from the last menu item, press †.
Using the Keyboard 15
16 Using the Keyboard
Selecting an Item from a Menu
You can select an item from a menu in three ways.
▶ Press the number or letter of the item you want to
select. The cursor can be anywhere on the menu, and
the item you select does not need to be displayed on
the screen.
-or-
▶ Press † or } to move the cursor to the item you want, and then press Í.
-or-
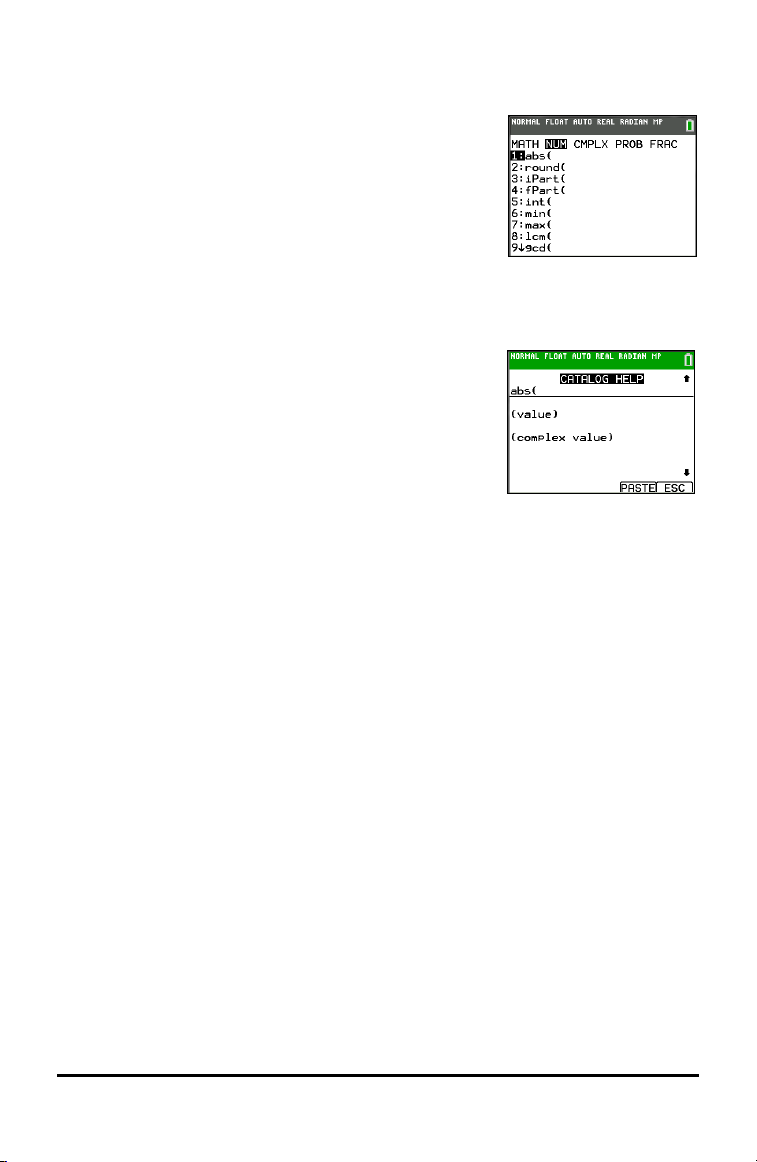
▶ Within the Catalog listing of functionality, move the
cursor to the item you want, and then press Ã. For
most commands, the Catalog Help syntax editor
displays the correct syntax. Enter the syntax using the
displayed help, and then press ƒ a to paste. The
Catalog Help pastes the complete command.
▶ Press ƒ b to escape without pasting the
command.

Notes:
• After you select an item from a menu, the TI-84PlusCE typically displays the
previous screen.
• If you do not see PASTE on the Catalog Help screen, press y5 until you return
to the home screen, then repeat your actions. If this happens, it may mean the
screens were layered and the previous screen did not have an active cursor on an
input line to accept the pasting of the function or command.
Leaving a Menu without Making a Selection
You can leave a menu without making a selection in these two ways.
• Press y 5 to return to the home screen.
-or-
• Press ‘ to return to the previous screen.
Using Menus
When you press a key or key combination to display a menu, one or more menu names
appear on the top line of the screen.
• The menu name on the left side of the top line is highlighted. Up to nine items in
that menu are displayed, beginning with item 1.
• A number or letter identifies each item’s place in the menu. The order is 1 through
9, then 0, then A, B, C. Once number and letter options are exhausted, the item
number or letter area will be blank. Select these items using the arrow keys.
• When the menu continues beyond the displayed items, a down arrow ($) replaces
the colon next to the last displayed item.
• When a menu item ends in an ellipsis (...), the item displays a secondary menu,
editor, or wizard when you select it.
• When an asterisk (*) appears to the left of a menu item, that item is stored in user
data archive. Pic and Image Vars are always stored in archive memory. You must
move other files (displayed with an asterisk) from archive to RAM in the MEM
menu.
Using the Keyboard 17
18 Using the Keyboard
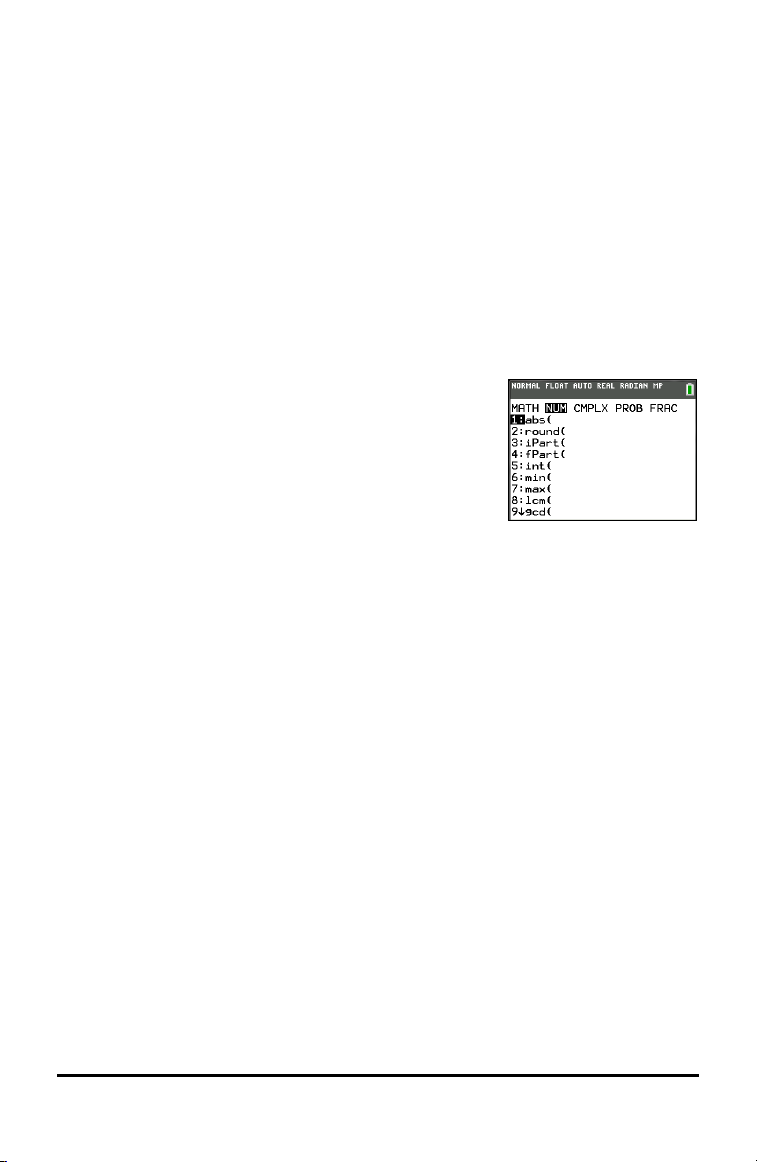
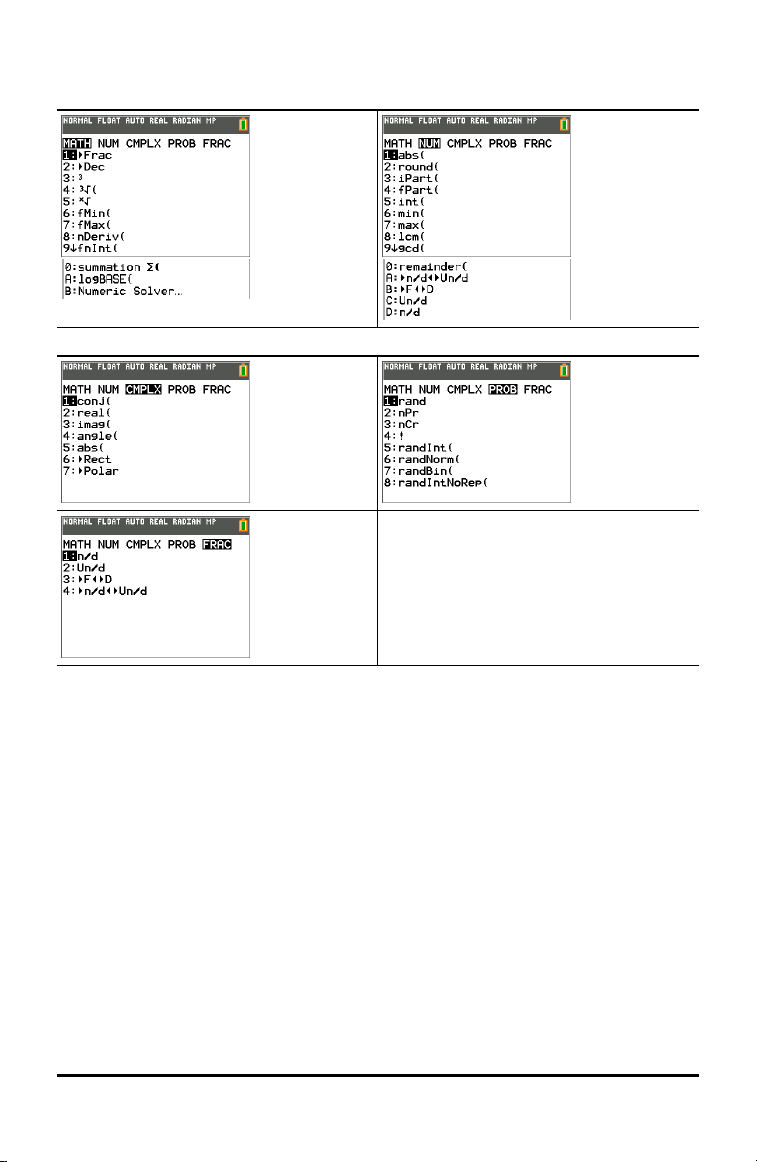
Working with MATH Menus
The following are the MATH shortcut menus.
Scroll down when you see the ($) to see the whole menu.
Setting Up the Calculator Modes
Mode settings control how the calculator displays and interprets:
• Answers
• Elements of lists and matrices
• Graphs
• Language settings
• Numbers
Setting Modes
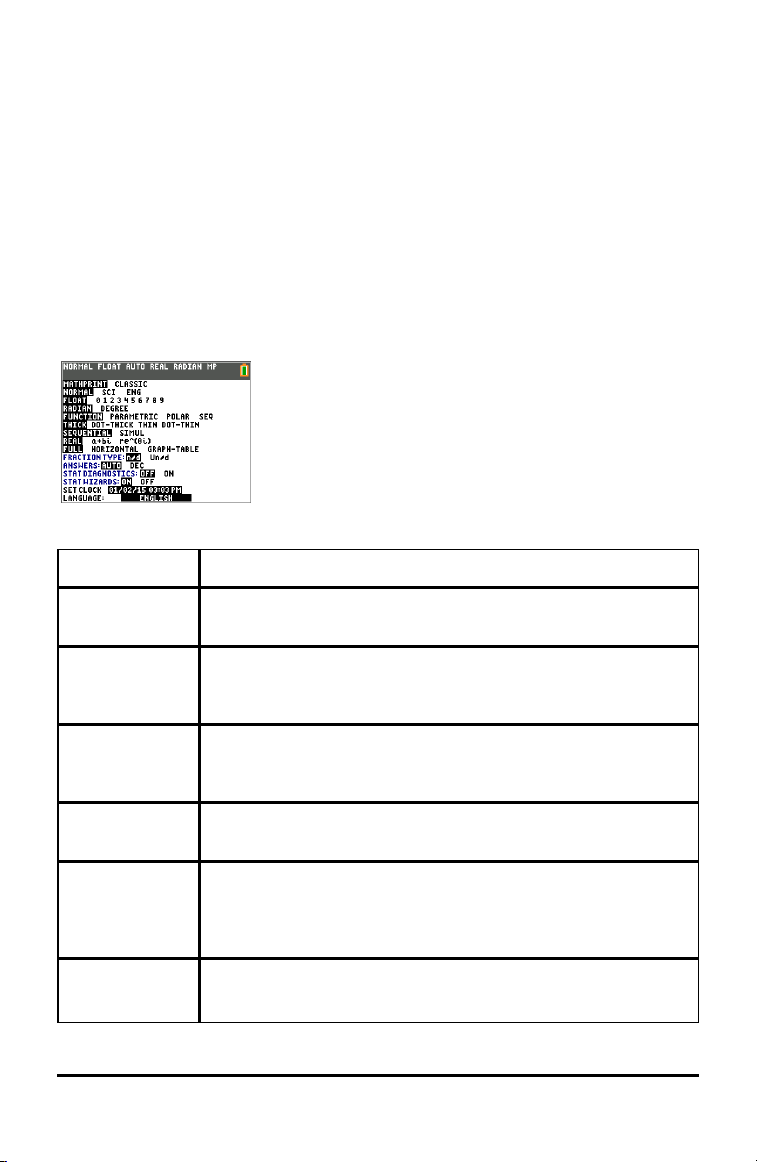
To set calculator modes, press z.
The following menu appears on your screen:
Note: When you press z, the cursor is on NORMAL by
default. Press } to switch between MathPrint™ and Classic
modes.
Note: The Constant Memory™ feature retains mode settings when the unit is turned off.
Mode Description
MATHPRINT
CLASSIC
Change how inputs and outputs are displayed.
NORMAL
SCI
ENG
Change how decimals are displayed.
FLOAT
0 1 2 3 4 5 6 7 8
9
Set the number of digits displayed.
RADIAN
DEGREE
Set how the calculator interprets angle values.
FUNCTION
PARAMETRIC
POLAR
SEQ
Set how functions, relations, and sequences are displayed.
THICK
DOT-THICK
Change the graph line style.
Setting Up the Calculator Modes 19

20 Setting Up the Calculator Modes
Mode Description
THIN
DOT-THIN
SEQUENTIAL
SIMUL
Change the order in which functions are plotted.
REAL
a+bi
re^(0i)
Change the way complex numbers are displayed.
FULL
HORIZONTAL
GRAPH-TABLE
Change the way a graph is displayed.
FRACTION
TYPE: N/D
Change the way a fraction is displayed.
ANSWERS:
AUTO DEC
Change the format in which you see your results.
STAT
DIAGNOSTICS:
OFF
ON
Controls whether a statistical regression displays with or without
the correlation coefficient.
STAT WIZARDS:
ON OFF
Turn the stat wizard on or off.
SET
CLOCK
00/00/00
00:00 PM
Set the clock.
LANGUAGE:
ENGLISH
Change the graphing calculator's display language.
Changing Mode Settings
To change mode settings, follow these steps:
1. Press † or } to move the cursor to the line of the setting that you want to
change.
2. Press ~ or | to move the cursor across the line to the desired setting.
3. Press Í to select a setting.
Exception: LANGUAGE Press ~ or | to select a loaded language. Press † or } to
set the selected language.
Note: The second line of the status bar displays context help with a description of line
modes.
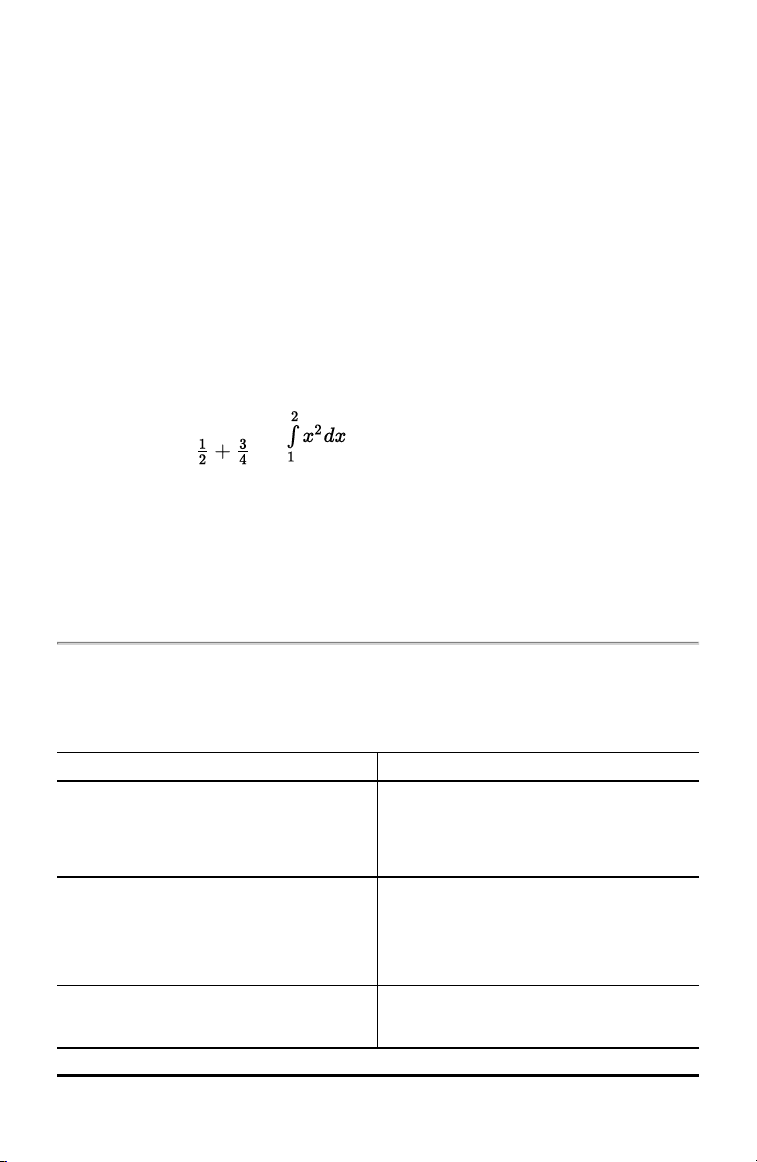
MATHPRINT™ CLASSIC
MATHPRINT™mode displays most inputs and outputs the way they are shown in
textbooks, such as and .
CLASSIC mode displays expressions and answers as if written on one line, such as 1/2 +
3/4. (Fraction bars appear as thick lines. A division operation will appear as a thin slash
mark.)
Note:
• Some areas in MATHPRINT™ mode display in classic (one line) formats.
• If you switch between these modes, most entries (except matrix calculations) will
be preserved.
NORMAL SCI ENG
Answers are displayed in standard formats when the calculation or setting forces a
decimal result on the calculator.
Notation for 12345.67 Decimal answer displays as:
NORMAL
12345.67
Retains the decimal notation up to limits of
the calculator display and memory.
12345.67
SCI (Scientific1.234567 x 10
4
)
One digit to the left of the decimal with
the appropriate power of 10 to the right
of *â.
1.234567â4
ENG (Engineering)
12.34567 x 10
3
12.34567â3
Setting Up the Calculator Modes 21

22 Setting Up the Calculator Modes
Up to three digits before the decimal and
the power of 10 (to the right of â) is a
multiple of three.
Note:
The keypad contains y D, which displays as â on the calculator. *This â in the display
stands for "x10" and the number entered after â becomes the power of 10. The
calculator notation, â, designates the "x10" part of the number without using extra
parentheses. The calculator then follows the order of operations as expected when using
SCI or ENG notation. This notation, â, is not typically accepted on homework and exams,
and written results should use the standard notation, for example, the 1.234567 x 10
4
.
If you select NORMAL notation, but the answer cannot display in 10 digits (or the
absolute value is less than .001), the TI-84PlusCE expresses the answer in scientific
notation.
FLOAT 0 1 2 3 4 5 6 7 8 9
FLOAT (floating) decimal mode displays up to 10 digits, plus the sign and decimal.
FLOAT will display in the status bar.
Selecting 0123456789 specifies the number of digits (0 through 9) to display to the
right of the decimal for decimal answers. FIX# will display in the status bar.
The decimal setting applies to NORMAL, SCI, and ENG notation modes.
The decimal setting applies to these numbers, with respect to the ANSWER mode
setting:
• An answer displayed on the home screen
• Coordinates on a graph
• The Tangent( DRAW instruction equation of the line, x, and dy/dx values
• Results of calculated operations
• The regression equation stored after the execution of a regression model
RADIAN DEGREE
Angle modes control how the calculator interprets angle values in trigonometric
functions and polar/rectangular conversions. The RADIAN or DEGREE setting will
display in the status bar.
RADIAN mode interprets angle values as radians. Answers display in radians.
DEGREE mode interprets angle values as degrees. Answers display in degrees. Polar
complex number arguments are always interpreted in radians.
FUNCTION PARAMETRIC POLAR SEQ
Graphing modes define the graphing parameters.
FUNCTION graphing mode plots functions, where Y is a function of X.
PARAMETRIC graphing mode plots relations, where X and Y are functions of T.
POLAR graphing mode plots functions, where r is a function of q.
SEQUENCE graphing mode plots sequences. Three sequences are available: u, v, and w,
with an option of the independent variables of n, n+1, and n+2.
THICK DOT-THICK THIN DOT-THIN
Line
Style:
Graphs as:
THICK Thick line style (default). More pixels displayed around a plotted point (pixel).
DOT-
THICK
Large dot plotting. (3x3 pixels) Equivalent to DOT on earlier TI-84 Plus family
calculators.
THIN Thin line style (graphing per pixel).
DOT-
THIN
DOT display is 1 pixel per dot graphed.
Note: You can change individual line styles in the Y=editor.
THICK plotting mode resets all Y= line styles to a thick line connecting each point
calculated for the selected functions.
Note: The THICK plotting mode on the TI-84 Plus CE is equivalent to the CONNECTED
plotting mode on the TI-84 Plus family of graphing calculators.
DOT-THICK plotting mode resets all Y= line styles to a large dot and plots only the
calculated points of the selected functions.
Note: The DOT-THICK plotting mode on the TI-84 Plus CE is equivalent to the DOT
plotting mode on the TI-84 Plus family of graphing calculators.
THIN plotting mode resets all Y= line styles to a thin line connecting each point
calculated for the selected functions.
Setting Up the Calculator Modes 23
24 Setting Up the Calculator Modes
Note: Use THIN plotting mode for function graphing when looking at any functions
which asymptote to an axis.
DOT-THIN plotting mode resets all Y= line styles to a small dot and plots only the
calculated points of the selected functions.
SEQUENTIAL SIMUL
SEQUENTIAL graphing-order mode evaluates and plots one function completely before
the next function is evaluated and plotted.
SIMUL (simultaneous) graphing-order mode evaluates and plots all selected functions
for a single value of X and then evaluates and plots them for the next value of X.
Note: Regardless of which graphing mode is selected, the calculator will sequentially
graph all stat plots before it graphs any functions.
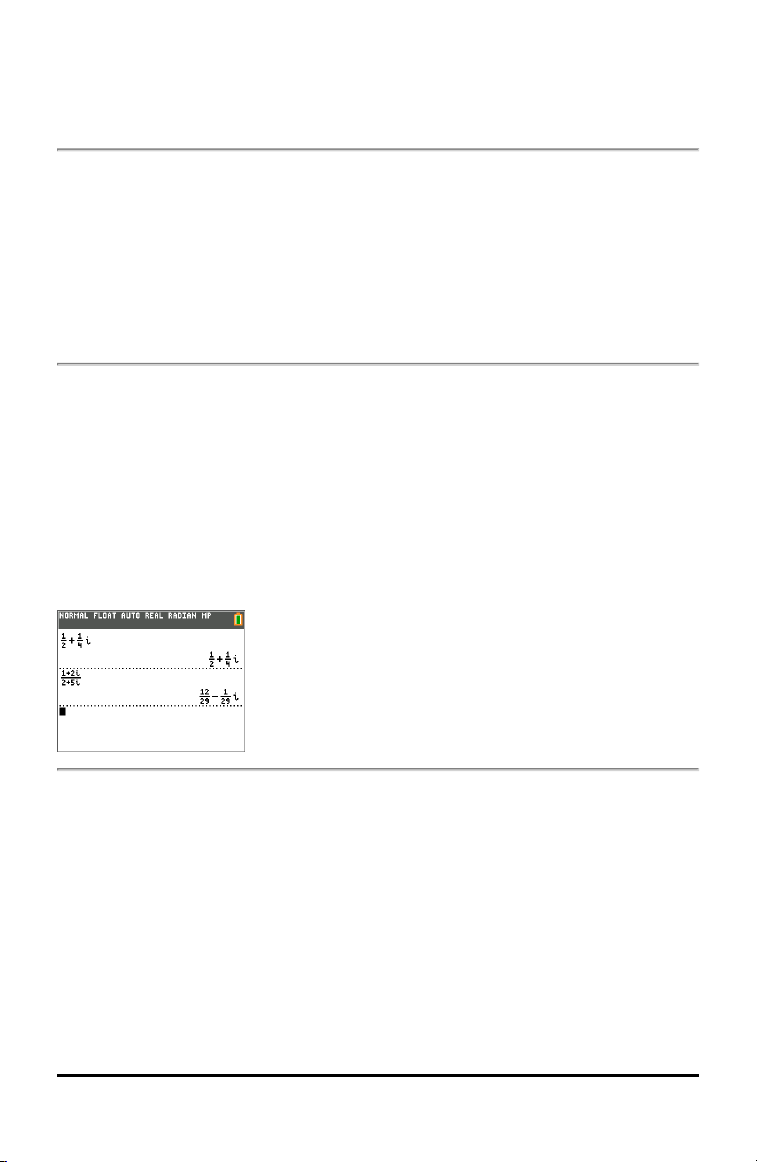
REAL a+bi re^(qi)
REAL mode does not display complex results unless complex numbers are entered as
input.
Two complex modes display complex results.
• a+bi (rectangular complex mode) displays complex numbers in the form a+bi. The
TI-84 Plus CE supports the n/d fraction template.
• re^(qi) (polar complex mode) displays complex numbers in the form
re^(qi).
FULL HORIZONTAL GRAPH-TABLE
FULL screen mode uses the entire screen to display a graph or edit screen.
Each split-screen mode displays two screens simultaneously.
• HORIZONTAL mode displays the current graph on the top half of the screen; it
displays the home screen or an editor on the bottom half.
• GRAPH-TABLE mode displays the current graph on the left half of the screen; it
displays the table screen on the right half.
Horizontal Graph-Table
FRACTION TYPE: n/d Un/d
n/d displays results as a simple fraction. Fractions may contain a maximum of six
digits in the numerator; the value of the denominator may not exceed 9999.
Un/d displays results as a mixed number, if applicable. U, n, and d must be all be
integers. If U is a non-integer, the result may be converted U n/d. If n or d is a non-
integer, a syntax error is displayed. The whole number, numerator, and denominator
may each contain a maximum of three digits.
ANSWERS: AUTO DEC
AUTO displays answers in a similar format as the input. For example, if a fraction is
entered in an expression, the answer will be in fraction form, if possible. If a decimal
appears in the expression, the output will be a decimal number.
DEC displays answers as integers or decimal numbers.
Note: The ANSWERS mode setting also affects how values in sequences, lists, and
tables are displayed. You can also convert values from decimal to fraction or fraction to
decimal using }FRAC, }DEC, and }F| }D located in the FRAC shortcut menu or the MATH
submenu.
OFF: The function or command will paste to the cursor location with no syntax help
(wizard).
STAT DIAGNOSTICS: OFF ON
OFF displays a statistical regression calculation without the correlation coefficient (r)
or the coefficient of determination (r
2
).
ON displays a statistical regression calculation with the correlation coefficient (r), and
the coefficient of determination (r
2
), as appropriate.
Setting Up the Calculator Modes 25
26 Setting Up the Calculator Modes
STAT WIZARDS: ON OFF
ON: Selection of menu items in MATH PROB, STAT, CALC, DISTR DISTR, DISTR DRAW and
seq( in LIST OPS displays a screen which provides syntax help (wizard) for the entry of
required and optional arguments into the command or function. The function or
command will paste the entered arguments to the Home Screen history or to most
other locations where the cursor is available for input. Some calculations will compute
directly from the wizard. If a command or function is accessed from N the
command or function will paste without wizard support.
If no wizard is available, use Catalog Help for more syntax help when needed. To use
Catalog Help, select a menu item and then press Ã.
OFF: The function or command will paste to the cursor location with no syntax help
(wizard).
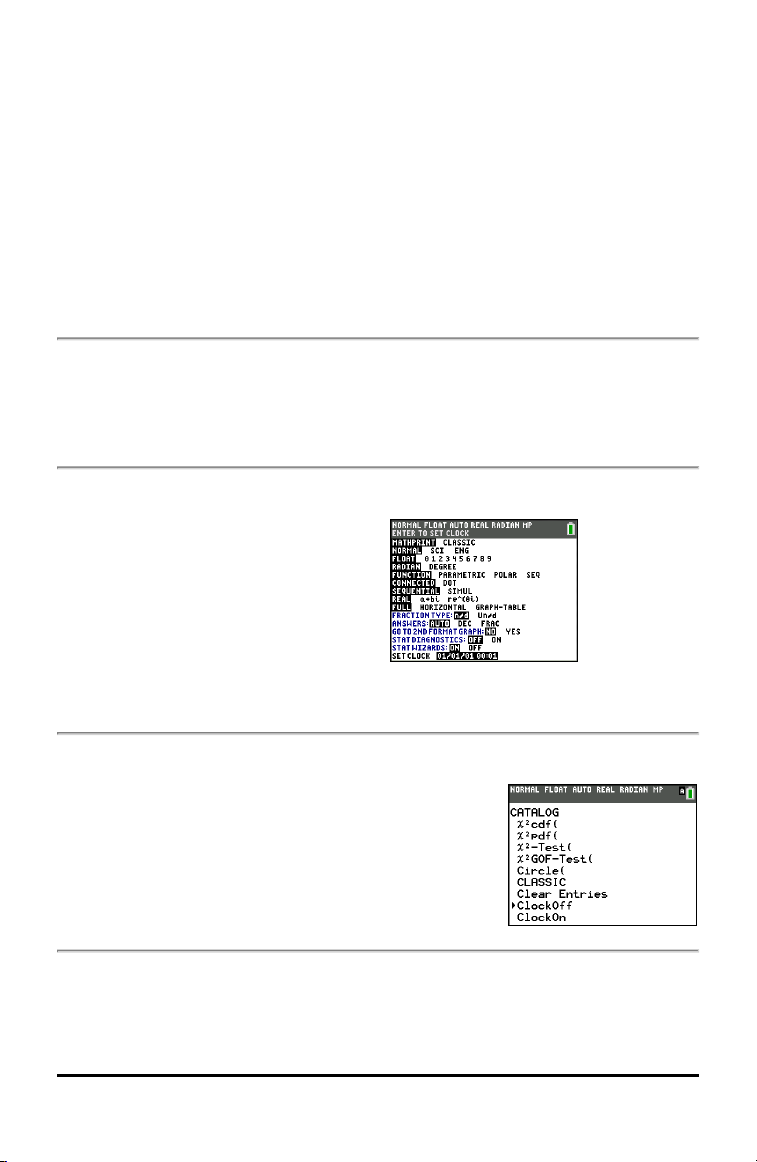
SET CLOCK
Use the clock to set the time and date, select the clock display format, and turn the
clock on and off. The clock is turned on by default and is accessed from the mode
screen.
Displaying the Clock Settings
1. Press z.
2. Press } } to move the cursor to SET
CLOCK.
3. Press Í to change clock settings.
Note: You may have to reset the clock if your battery power runs out.
See education.ti.com for future updates on the battery and battery preservation features.
Turning the Clock On and Off
1. Press y N.
2. Press † or } to scroll the CATALOG until the selection
cursor points to ClockOff or ClockOn.
3. Press Í Í.
LANGUAGE
Press ~ or | on the LANGUAGE spinner menu to select a loaded language. Press †
or } to set the selected language.
Note:
• The calculator will retain your language setting for most resets of the calculator.
• The LANGUAGE spinner menu will only display Language Apps loaded on the
calculator. Check education.ti.com for all available languages. Use
TI Connect™ CE to load files to your calculator.
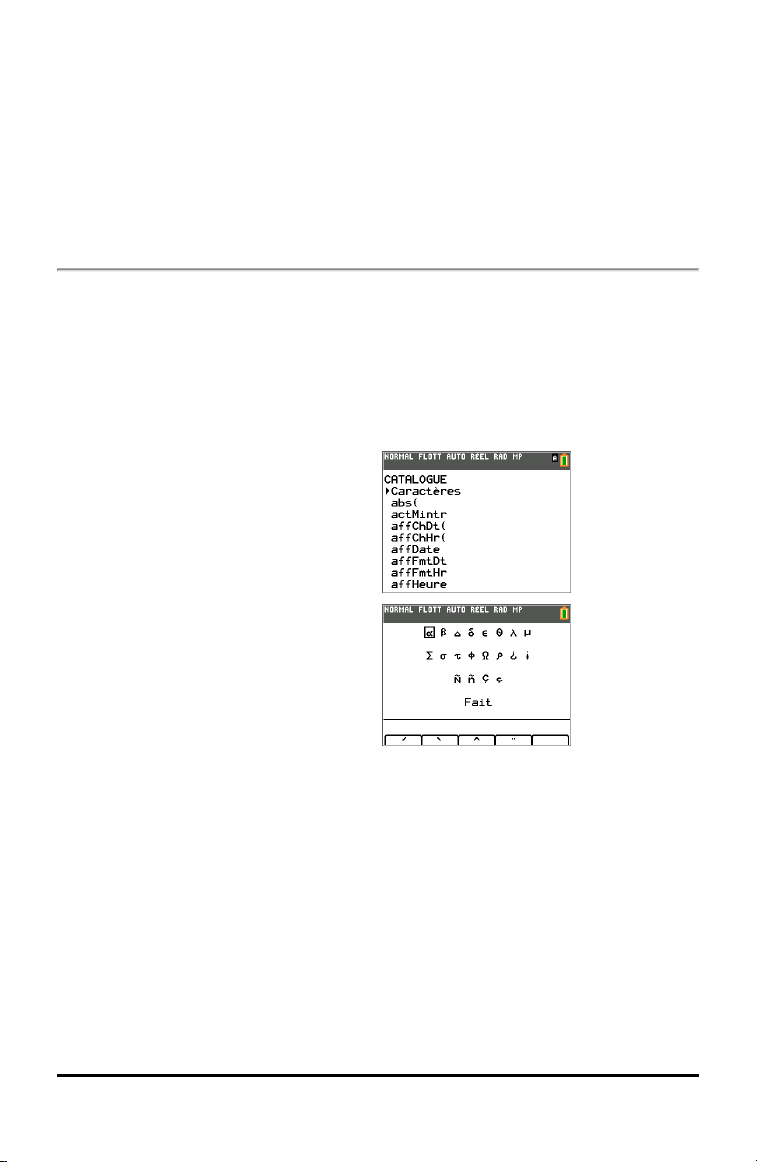
Using the Special Character Set
After you select your desired language, a new item (CHARACTER) is added to the TI-84
Plus CE CATALOG. This item accesses special characters and accent marks used in the
language that you chose for localization. You can use these special characters and
accent marks for display messages and text strings that you want to store to a
variable. You cannot, however, use them in variable names.
1. Press y N to display the
CATALOG.
Note: CHARACTER is always the first
item in the CATALOG.
2. Press Í to display the CHARACTER
screen.
Accent marks appear in the menus at
the bottom of the screen.
3. You can:
• Select a special character:
a) Press |, ~, †, or } to move the box to the special character that you want
to use in a message or text string.
b) Press Í to place the character on the edit line.
c) Press |, ~, †, or } to move the box to Done.
d) Press Í to paste the contents of the edit line to the previous screen.
-or-
• Add an accent mark to a character:
e) Press the function key (^, _, `, a, or b) immediately above the accent
Setting Up the Calculator Modes 27

28 Setting Up the Calculator Modes
mark to select it. The ALPHA uppercase mode is automatically turned on. To
change to lowercase, press ƒ.
f) Press the key associated with the alpha character that you want to accent, for
example, [A] (above »). The accented character is displayed in the edit
line.
g) Press |, ~, †, or } to move the box to Done.
h) Press Í to paste the contents of the edit line to the previous screen.
Evaluating Expressions
An expression is a group of
• numbers,
• variables,
• functions and their arguments,
-or-
• a combination of these elements.
An expression evaluates to a single answer.
On the TI-84PlusCE, you enter an expression in the same order as you would write it
on paper. For example: pR
2
is an expression.
Order of Operations
The TI-84 Plus CE uses an order of operations system called Equation Operating System
(EOS™), which
• defines the order in which functions in expressions are entered and evaluated
-and-
• allows you to enter numbers and functions in a simple, straightforward sequence.
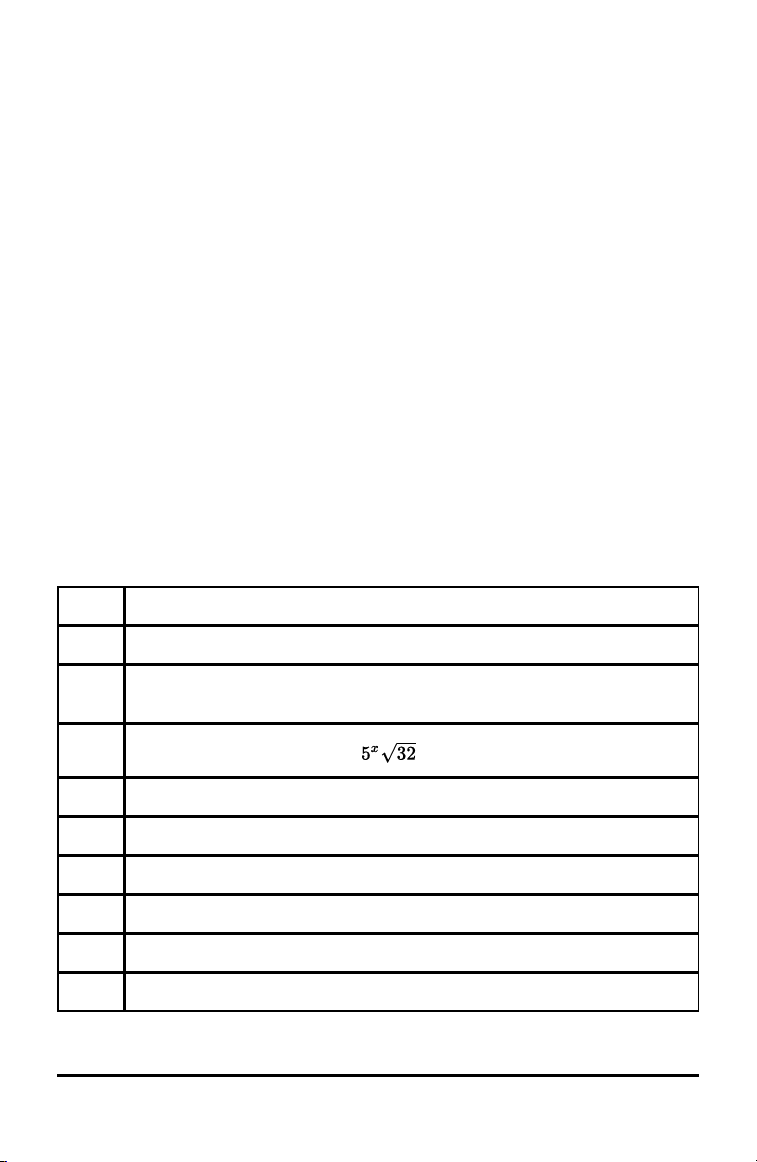
EOS™ evaluates the functions in an expression in this order:
Order Function
1 Functions that precede the argument, such as sin( or log(
2 Functions that are entered after the argument, such as 2, -1, !, ¡, r, and
conversions
3
Powers and roots, such as 2
5
or
4 Permutations (nPr) and combinations (nCr)
5 Multiplication, implied multiplication, and division
6 Addition and subtraction
7 Relational functions, such as > or
8 Logic operator and
9 Logic operators or and xor
Evaluating Expressions 29
30 Evaluating Expressions
Note: Within a priority level, EOS™ evaluates functions from left to right. Calculations
within parentheses are evaluated first. A number in scientific or engineering notation,
2.34â6, is interpreted as (2.3x10
6
) with parentheses so the number remains the correct
value during the EOS™ calculation.
Implied Multiplication
The TI-84PlusCE recognizes implied multiplication, so you do not need to press ¯ to
express multiplication in all cases. For example, the TI-84PlusCE interprets 2p, 4sin
(46), 5(1+2), and (2 ä 5)7 as implied multiplication.
Note: TI-84PlusCE implied multiplication rules differ from those of some other
graphing calculators. For example, the TI-84PlusCE evaluates 1à2X as (1à2) X, while
some graphing calculators may evaluate 1à2X as 1à(2 X).
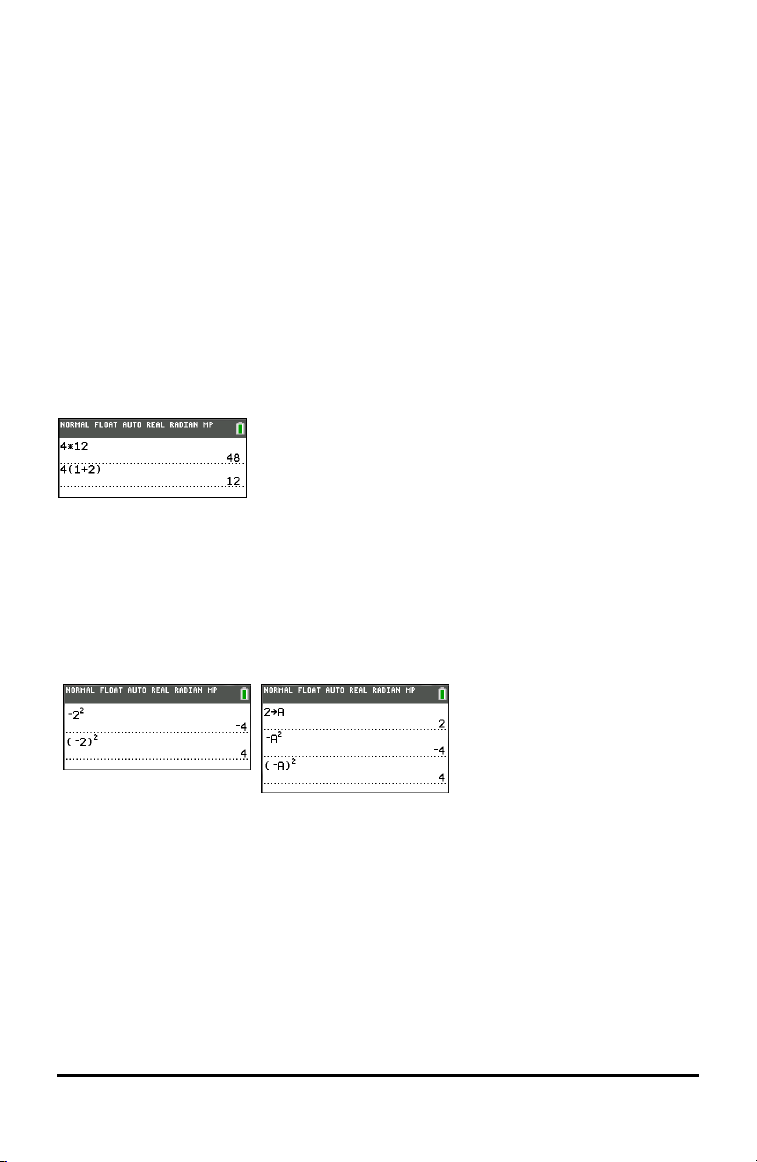
Parentheses
The TI-84 Plus CE completes all calculations inside a pair of parentheses first. For
example, in the expression 4(1+2), EOS™ first evaluates the portion inside the
parentheses, 1+2, and then multiplies the answer, 3, by 4.
Negation
To enter a negative number, use the negation key. Press k and then enter the
number. On the TI-84PlusCE, negation is in the third level in the EOS™ hierarchy.
Functions in the first level, such as squaring, are evaluated before negation.
Example: MX
2
, evaluates to a negative number (or 0). Use parentheses to square a
negative number.
Note: Use the j key for subtraction and the k key for negation. If you press j to
enter a negative number, as in 9 ¯ ¹ 7, or if you press k to indicate subtraction, as
in 9 k 7, an error occurs. If you press ƒ A k ƒ B, it is interpreted as implied
multiplication (A)(MB).
Entering Expressions and Instructions
You can use an expression on the home screen to calculate an answer. In most places
where a value is required, you can use an expression to enter a value.
Entering an Expression
To create an expression, you enter numbers, variables, and functions using the
keyboard and menus. An expression is evaluated when you press Í, regardless of
the cursor location. The entire expression is evaluated according to EOS™ rules, and the
answer is displayed according to the mode setting for Answer.
Note: Most TI-84PlusCE functions and operations are symbols comprising several
characters. You must enter the symbol from the keyboard or a menu; do not spell it
out. For example, to calculate the log of 45, you must press « 45. Do not enter the
letters L, O, and G. If you enter LOG, the TI-84PlusCE interprets the entry as implied
multiplication of the variables L, O, and G.
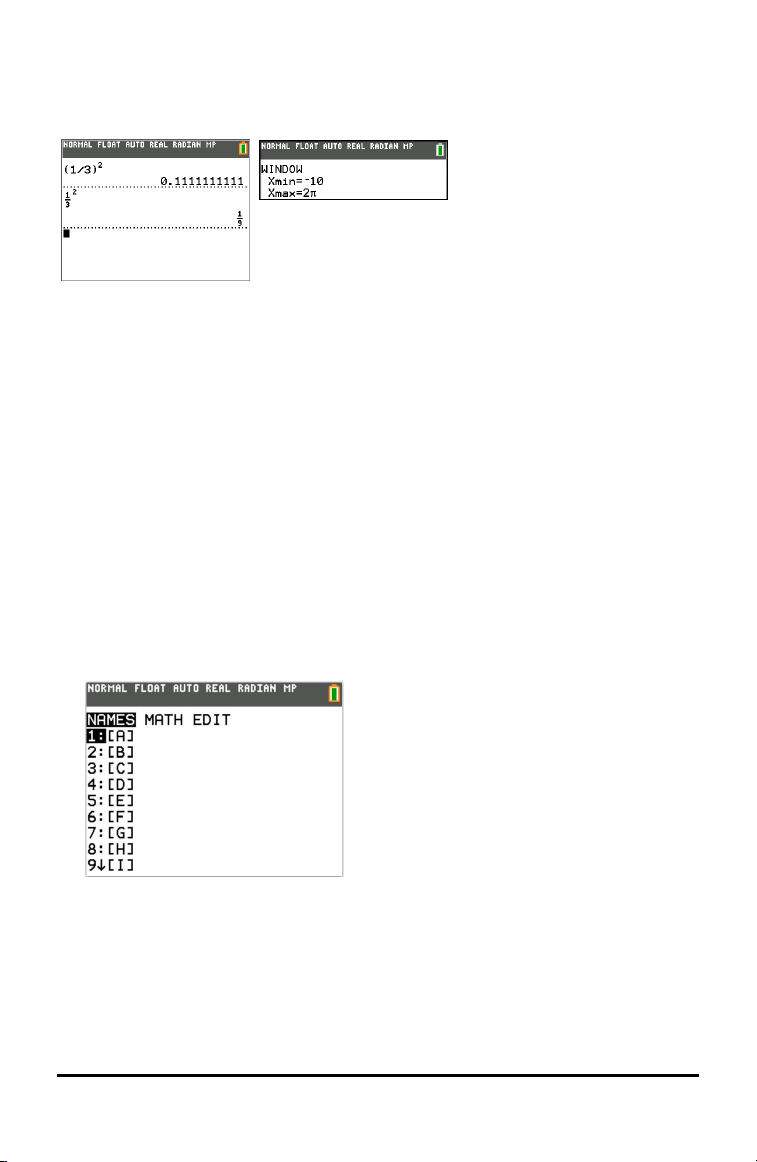
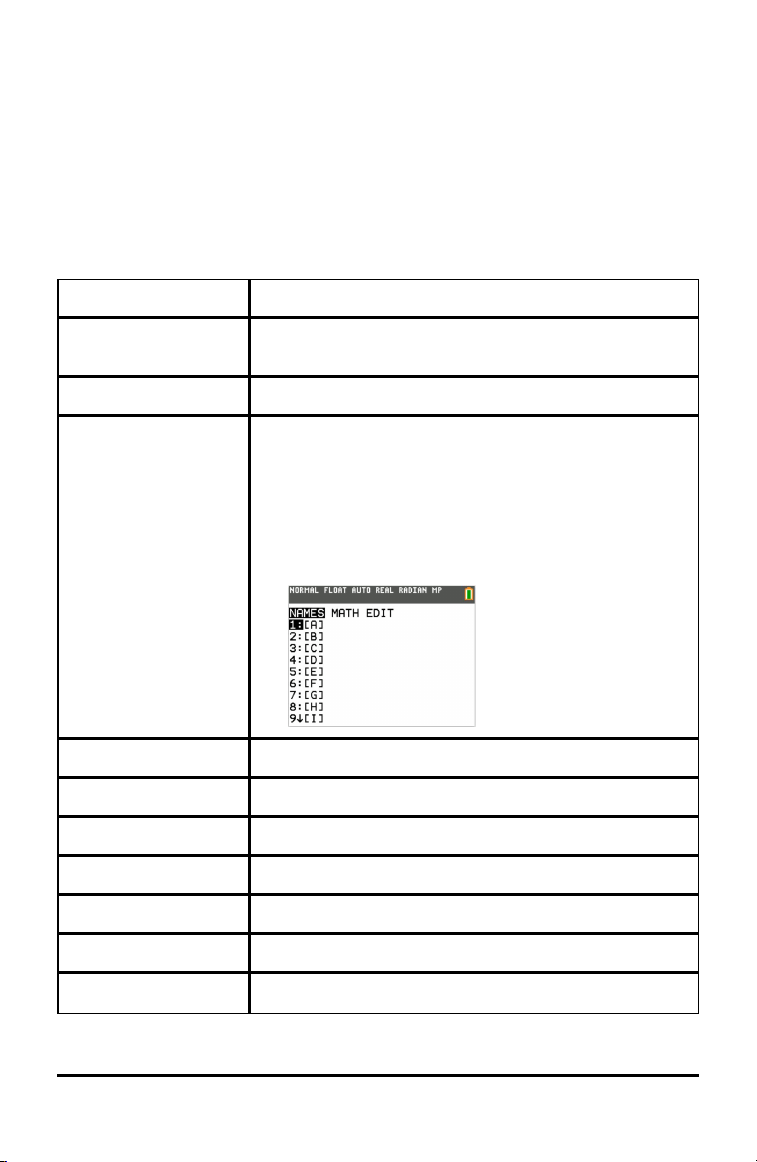
To enter a matrix name:
1. Press y ¾.
The Matrix Names menu appears.
2. Press the number on the keypad that corresponds with the desired Matrix Name.
Ex: Press 1 for [A] as shown.
Note: In MathPrint™ mode, press ~ to get out of the MathPrint™ template and
continue entering the expression.
Evaluating Expressions 31
32 Evaluating Expressions
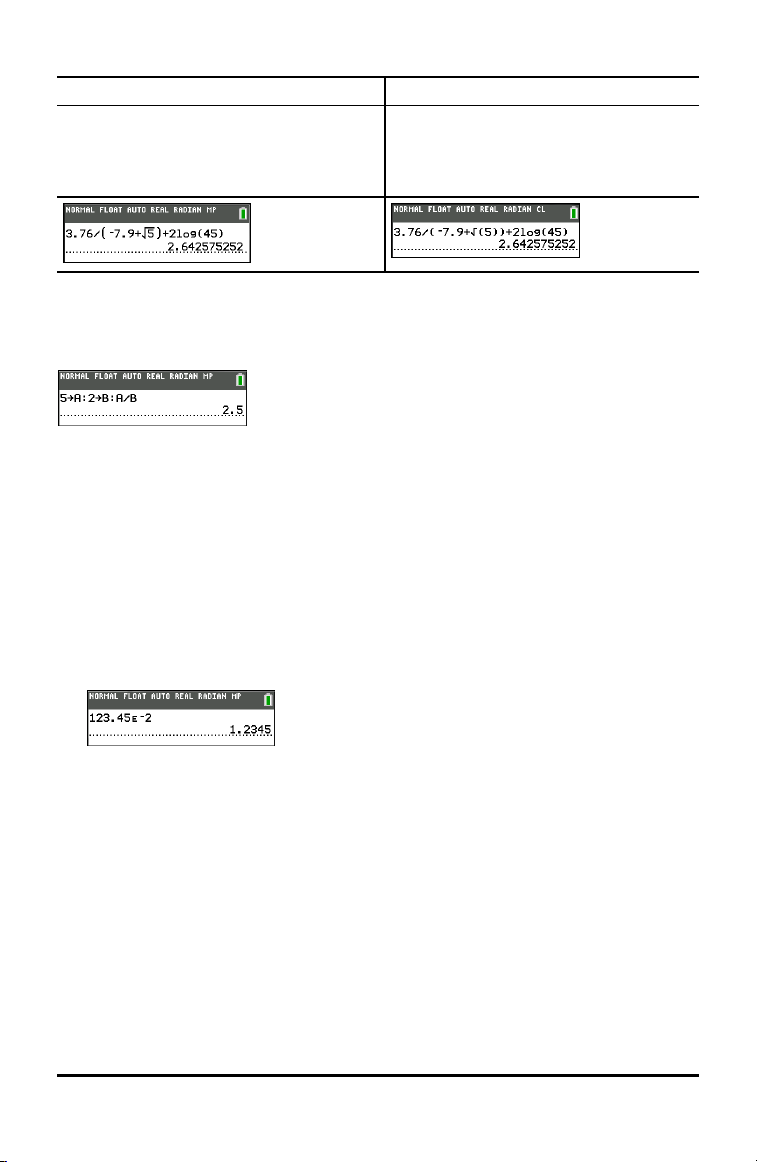
Calculate 3.76 P (L7.9 +$ 5) + 2 log 45.
MathPrint™ Classic
3 Ë 76 ¥ £ k 7 Ë 9 Ã y C 5 ~ ¤
à 2 « 45 ¤ Í
Note: The ~ is a notable keystroke
difference as compared to Classic.
3 Ë 76 ¥ £ k 7 Ë 9 Ã y C 5 ¤
¤ Ã 2 « 45 ¤ Í
Multiple Entries on a Line
To enter two or more expressions or instructions on a line, separate them with colons
(ƒ m). All instructions are stored together in last entry (ENTRY).
Entering a Number in Scientific Notation
1. Enter the part of the number that precedes the exponent. This value can be an
expression.
2. Press y D. â is pasted to the cursor location.
3. Enter the exponent, which can be one or two digits.
Notes:
• If the exponent is negative, press k, and then enter the exponent.
• â stands for "x10" and the calculator interprets the entire number as (1.23.45 x 10
-
2
) as if it was entered with parentheses.
When you enter a number in scientific notation, the TI-84PlusCE does not
automatically display answers in scientific or engineering notation. The mode settings
and the size of the number determine the display format.
Functions
A function returns a value. For example, log( and sin( are functions. In general, the first
letter of each function is lowercase. Most functions take at least one argument, as
indicated by an open parenthesis following the name. For example, sin( requires one
argument, sin (value).
Note: To see the arguments of a function or command in the calculator, find the item
in a menu or y N and press +. For most menu items, a Catalog Help screen will
display and the syntax of the arguments will be displayed.

Instructions
An instruction (command) initiates an action on the calculator. For example, ClrDraw is
an instruction to the calculator to clear drawn elements from a graph. Instructions
cannot be used in expressions. In general, the first letter of each instruction name is
uppercase. Some instructions take more than one argument, as indicated by an open
parenthesis at the end of the name. For example, on the TI-84PlusCE, Circle( requires
three arguments, and has two optional arguments: Circle(X,Y,radius[,color,
linestyle]).
Interrupting a Calculation
To interrupt a calculation or graph in progress, which is indicated by the busy indicator
in the status bar, press É.
When you interrupt a calculation, a menu is displayed.
• To return to the home screen, select 1:Quit.
• To go to the location of the interruption, select 2:Goto.
When you interrupt a graph, a partial graph is displayed.
• To return to the home screen, press ‘ or any non-graphing key.
• To restart graphing, press a graphing key or select a graphing instruction.
TI-84 Plus CE Edit Keys
Keystrokes Result
~ or | • Moves the cursor within an expression; these keys repeat if held down
on the keypad.
} or † • Moves the cursor from line to line within an expression that occupies
more than one line; these keys repeat if held down on the keypad.
• Moves the cursor from term to term within an expression in MathPrint™
mode; these keys repeat if held down on the keypad.
• On the home screen, scrolls through the history of entries and answers.
y | • Moves the cursor to the beginning of an expression.
y ~ • Moves the cursor to the end of an expression.
ƒ } • Moves the cursor out of a MathPrint™ expression and up into history on
the home screen.
• Moves the cursor from a MathPrint™ expression to the previous Y-var in
the Y=editor.
ƒ † • Moves the cursor from a MathPrint™ expression to the next Y-var in the
Y=editor.
Í
• Evaluates an expression or executes an instruction.
Evaluating Expressions 33

34 Evaluating Expressions
Keystrokes Result
‘
• Clears the current line on a line with text on the home screen.
• Clears everything on the home screen on a blank line on the home
screen. This does not clear the history of your entries and answers.
• Press } to see the history.
• Use Clear Entries* followed by ‘ if you wish to delete all home
screen entries.
*Clear Entries is found in N.
• Clears the expression or value where the cursor is located in an editor; it
does not store a zero.
{
• Deletes a character at the cursor; this key repeats if held down on the
keypad.
y {
• Changes the cursor to an underline (__); inserts characters in front of the
underline cursor; to end insertion, press y 6 or press |, }, ~, or
†.
y
• Changes the cursor or status bar indicator to Þ; the next keystroke
performs a 2nd function (displayed above a key and to the left); to cancel
2nd, press y again.
ƒ
• Changes the cursor or status bar indicator to Ø; the next keystroke
performs a third function of that key (displayed above a key and to the
right) or accesses a shortcut menu. To cancel ƒ, press ƒ or press
|, }, ~, or †.
y
7
• Changes the cursor to Ø; sets alpha-lock; subsequent keystrokes access
the third functions of the keys pressed; to cancel alpha-lock, press ƒ.
If you are prompted to enter a name such as for a group or a program,
alpha-lock is set automatically.
• Note: The TI-84 Plus CE does not automatically set alpha-lock for entries
that require list names.
„
• Pastes an X in Function mode, a T in Parametric mode, a q in Polar
mode, or an n in Seq mode with one keystroke.
Working with Graphs
This section covers how to change color options on a graph, how to draw points on a
graph, and how to insert an image as a background on a graph.
Using Color on the TI-84 Plus CE
The TI-84PlusCE graphing calculator has many color options and a high resolution
display that allows more information to be shown on the screen. The TI-84PlusCE
uses color in the following ways:
• Y= editor for line color.
• DRAW commands for line color, such as vertical lines, circles, and text on the graph
screen.
• The graph format screen for grid, axes, or border color, and applying a background
image or color.
• Statistical Plots.
The color options are selected using a spinner, which can contain various options
depending on the feature. Press | and ~ to scroll through the color options to set a
color.
Note: Take care to choose appropriate color combinations for the graph areas so that
all features are visible.
▶ You can reset the calculator to its default settings, including color settings, by
pressing y L 7 2 2.
Using Color on the Graph Screen
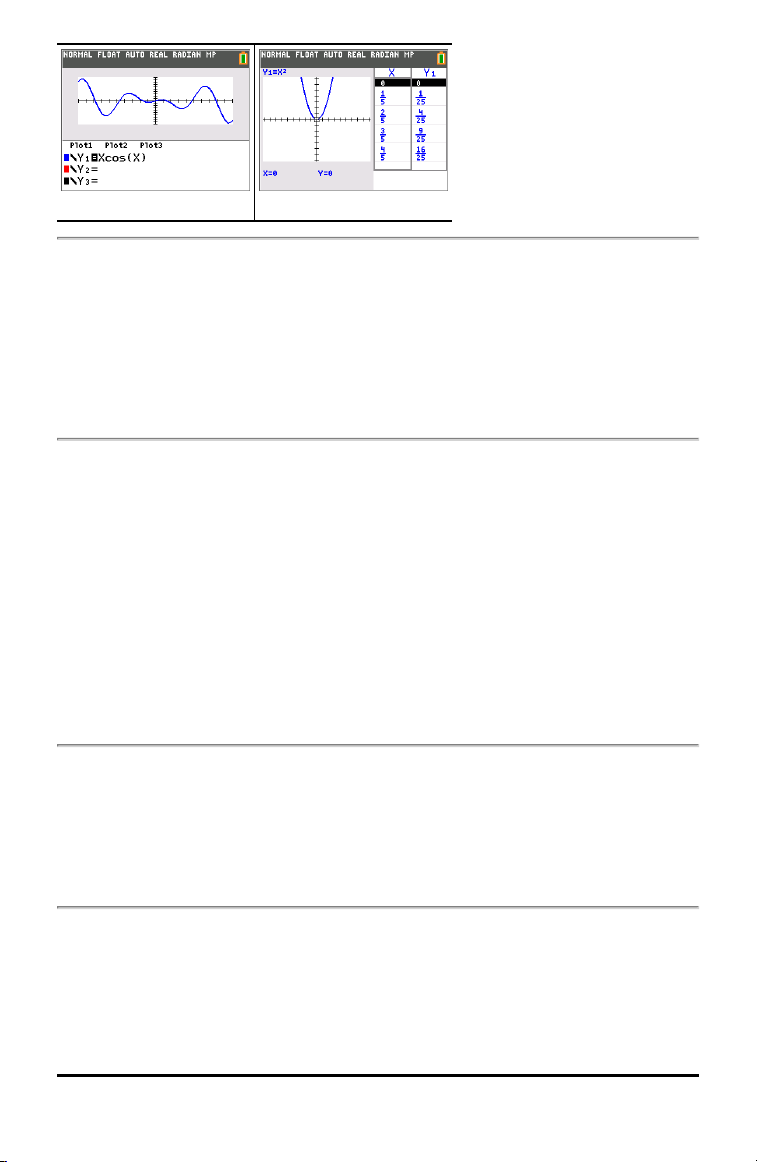
The examples below show how to set up the graph of a function. Here, the mode is set
to FUNCTION and the default settings are assumed.
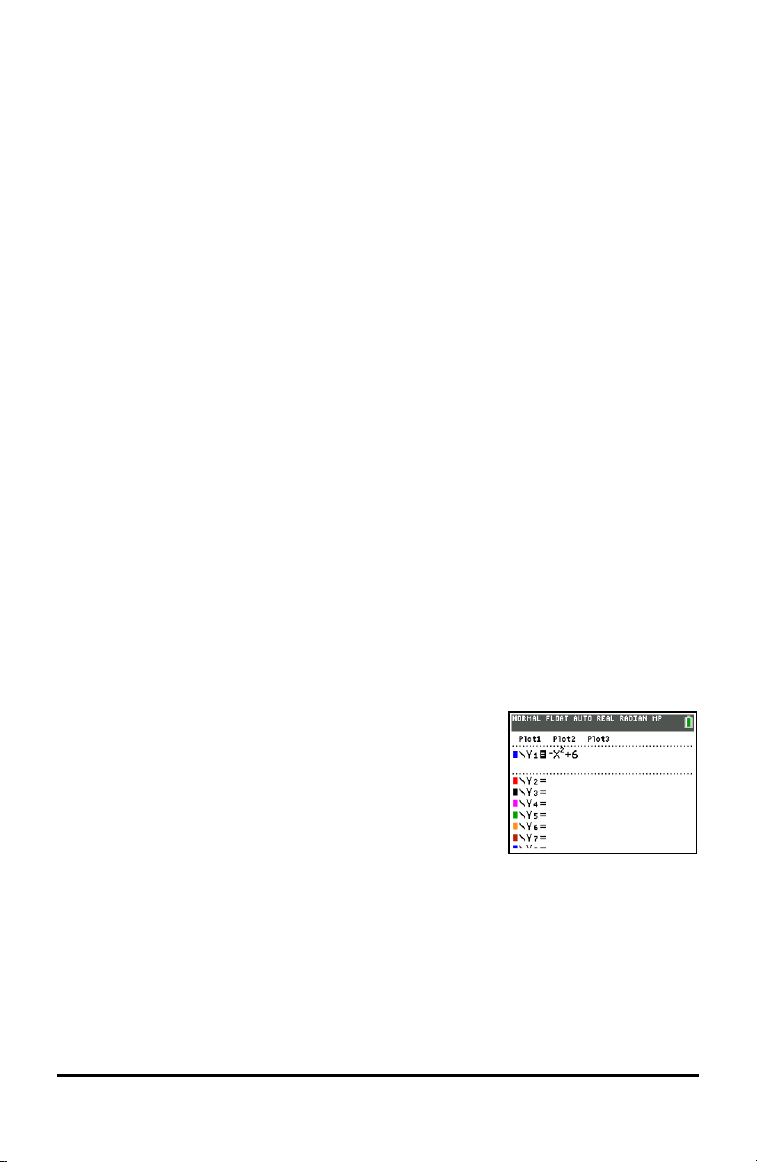
Enter an equation in the Y= editor.
1. Press o.
2. Press k „ ¡ Ã 6.
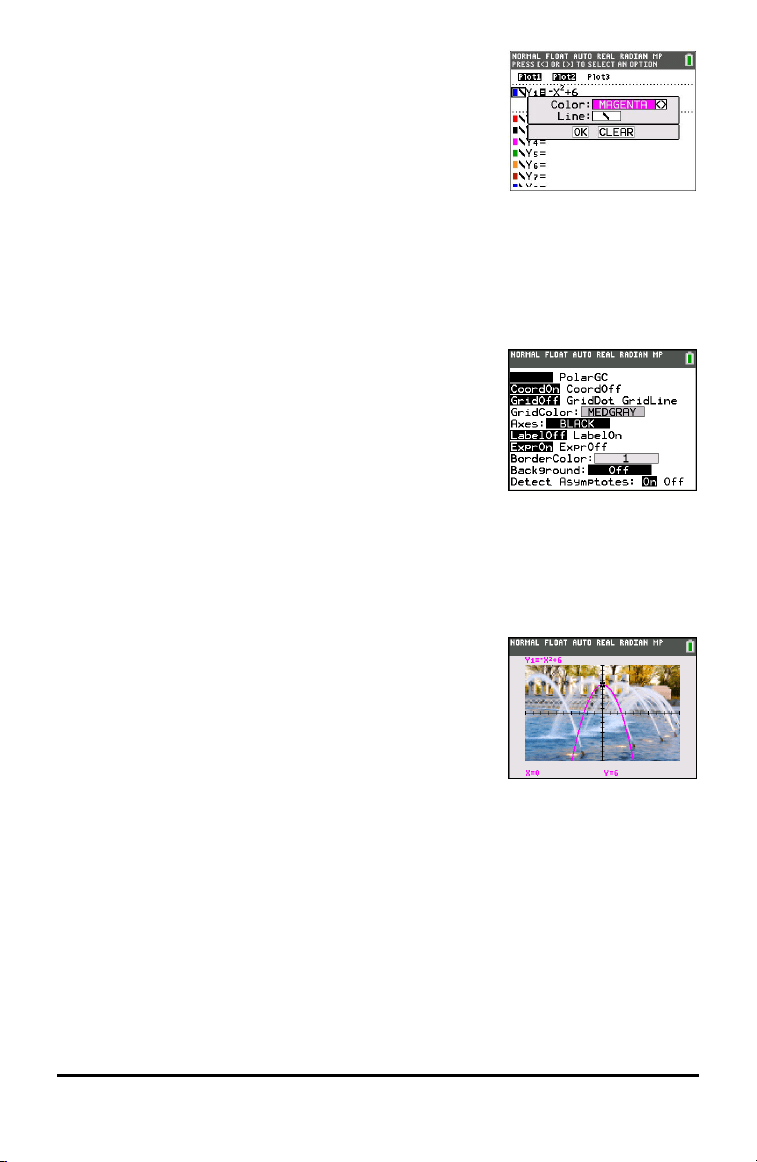
To set the line color in the Y= editor:
Working with Graphs 35
36 Working with Graphs
1. Press | to highlight the colored box.
2. Press Í.
3. Press y ~ ~ ~ to place the cursor box on the color
and line style at the left of the screen and press Í.
The spinner box displays. Notice the second line in the
status bar, which displays hints.
4. Press ~ ~ ~ to select magenta.
5. Press †.
Note: The thick line style is the default. It can be changed by pressing | or ~.
6. Press ~ to highlight OK and then press Í.
To set a Background Image:
1. Press y ..
Set grid color, axes, and border color as desired.
2. Press } or † as necessary to highlight Background.
The spinner dialog box becomes active.
3. Press ~ as necessary to select the desired Background Image or color.
Note: Your pre-loaded Image Var may be different than the one displayed.
Note: To create Background Image Vars, use the free TIConnect™ CE software to
convert and send images to your TI-84 Plus CE graphing calculator.
4. Press r to see the graph and trace points.
Note: You can manipulate the graph to “fit” an object in
the Background Image Var. You can also use QuickPlot and
Fit Equation to fit an equation to a shape. (See QuickPlot .)

Using QuickPlot and Fit Equation
QuickPlot and Fit Equation allows you to drop points on a graph screen and model a
curve to those points using regression functions. You can select color and line style,
draw points on a graph, and choose an equation to fit the drawn points. You can then
store the results of the plot and equation.
QuickPlot and Fit Equation is an option in the … / menu.
Prior to starting the QuickPlot and Fit Equation interactive feature on the graph area,
be sure to set your Background Image Var and other graph settings from the FORMAT
screen. Also set your WINDOW or ZOOM settings.
Drop points on the
screen. Points can be
saved to lists.
Calculate the regression equation,
draw the curve, and store the
function.
Working With Images
The TI-84PlusCE uses both pictures and background images. They are both stored in
Flash archive, but they are used in different ways.
Using Pictures and Backgrounds
• Image Vars (Image1 - Image9, and Image0) are variables stored in archive
memory. An Image Var is used as a Background Image in the graph area. Several
images are pre-loaded on the TI-84PlusCE. You can also convert images to TI-84
Plus CE Image Vars in the TIConnect™ CE software and load them to the calculator.
You cannot create images on the calculator.
Note: TIConnect™ CE software is available as a free download from
education.ti.com/go/download.
• Pic Vars (Pic1 - Pic 9, and Pic0) are also variables stored in archive memory. Pic
Vars can be created by drawing in the graphing area, and the changes saved and
recalled to the graphing area. Saving a Pic Var will not include the Background
Image behind your graphing area.
• Both Image Vars and Pic Vars are stored and run in Flash archive, not in RAM. They
are both accessible in the VARS menu.
• Image Vars and Pic Vars can only be shared with another TI-84PlusCE or TI-84 C
graphing calculator.
• TI-84 Plus Pic Vars cannot be shared between the TI-84 Plus and the TI-84 PlusCE
graphing calculators.
• If you perform a RAM reset on the TI-84 PlusCE, the Image Vars and Pic Vars
remain in Archive memory for use.
Working with Graphs 37
38 Working with Matrices
Working with Matrices
You can enter matrices using the matrix editor on your graphing calculator. For
example, you can perform the following operations on matrices:
• Addition • Inverses
• Division • Multiplication
• Elementary Row
Operations
• Subtraction
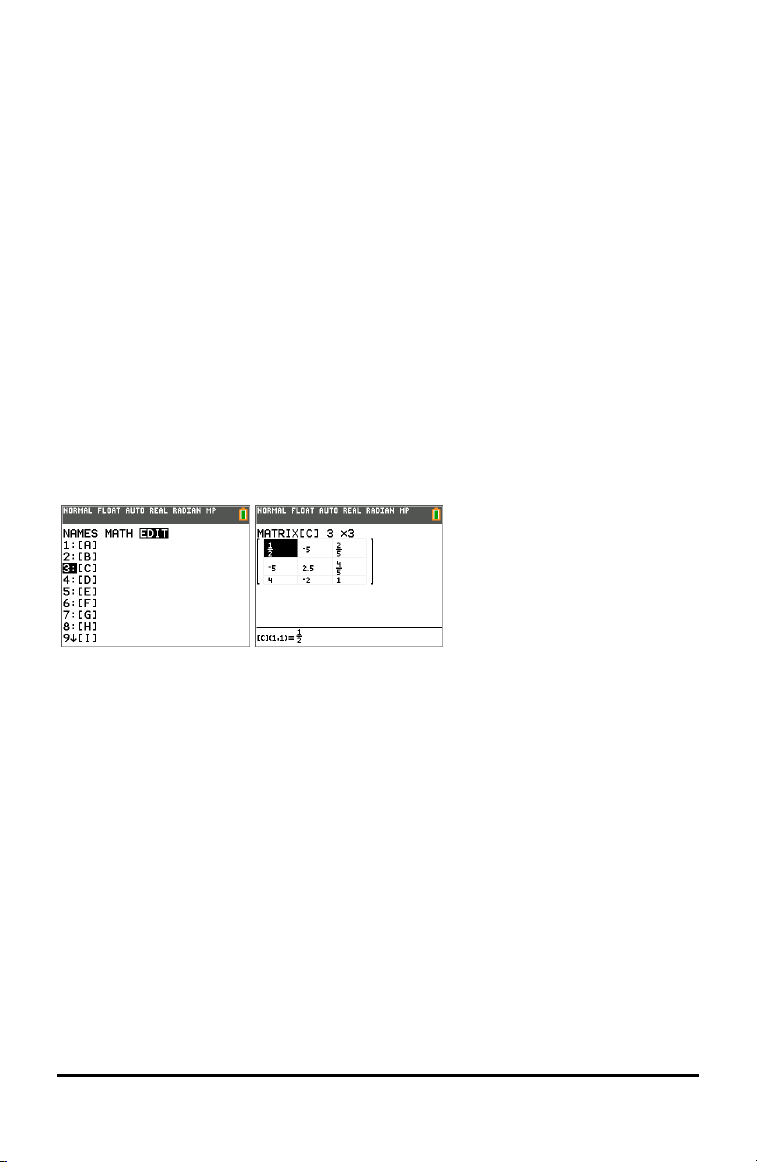
Using the Matrix Editor
1. Press y ¾.
2. Press ~ to navigate to the EDIT submenu.
3. Select from one of 10 allowed matrix variable names [A] – [J].
4. Enter the dimension of the matrix, then enter values in each matrix cell.
Note: Once in the editor, use the arrow keys to navigate between cells.
Example:
Matrix [C] as a 3x3 matrix is now in memory.
Performing a Calculation with a Matrix
1. Press y 5 to go to the Home Screen.
2. Press y ¾ use the MATH submenu to select a matrix command.
3. Use the NAMES submenu to paste the matrix name.
Note: A matrix name, such as [C], is a special character and can ONLY be pasted
for a calculation from the ¾ NAMES menu and not typed from the calculator
keypad.
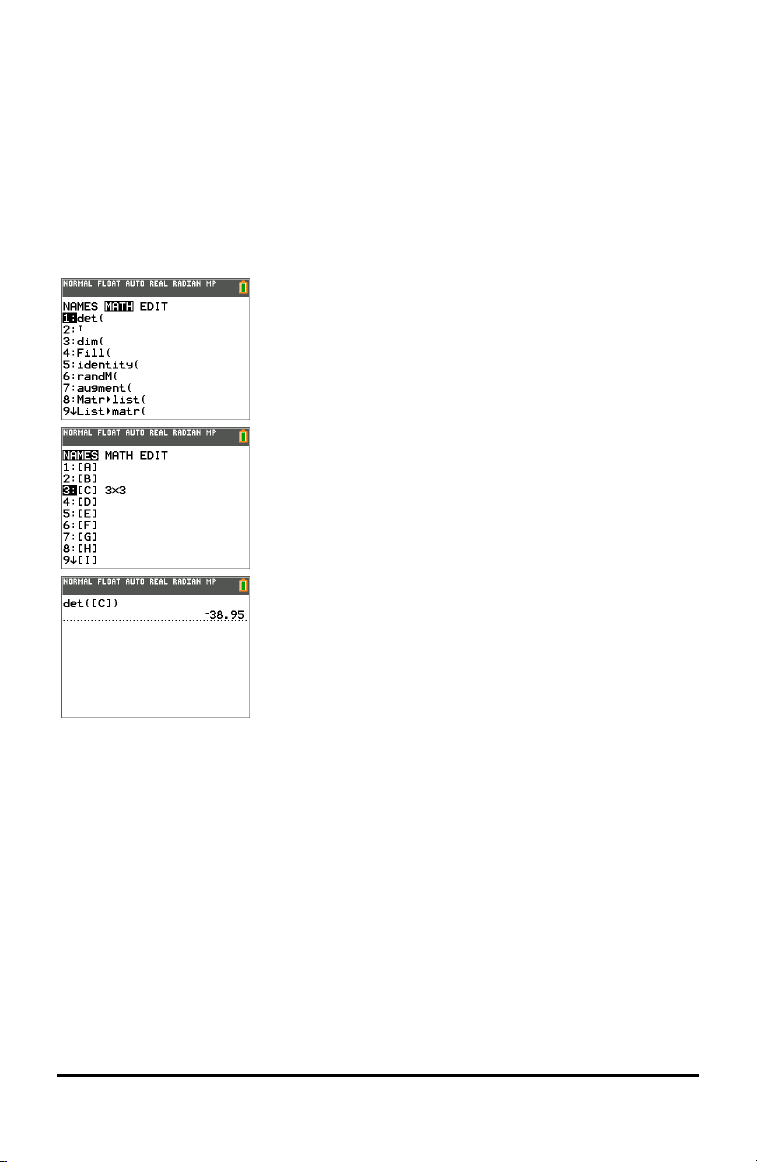
Example:
To find the determinant of [C] as entered above:
▶ Use the ¾ MATH menu to paste the
- 1: det(command
-and-
- ¾ NAMES 3: [C]
as matrix variables to the Home Screen.
Note: Remember that you cannot type in a matrix name from the calculator keypad.
Use the ¾ NAMES menu to paste a matrix name.
Working with Matrices 39
40 Working with Probability and Statistics
Working with Probability and Statistics
This section covers probability and statistics commands.
• Probability commands deal with random numbers, which are generated by
algorithms on the calculator.
• Statistics commands allow you to create lists of data, then plot or analyze that
data.
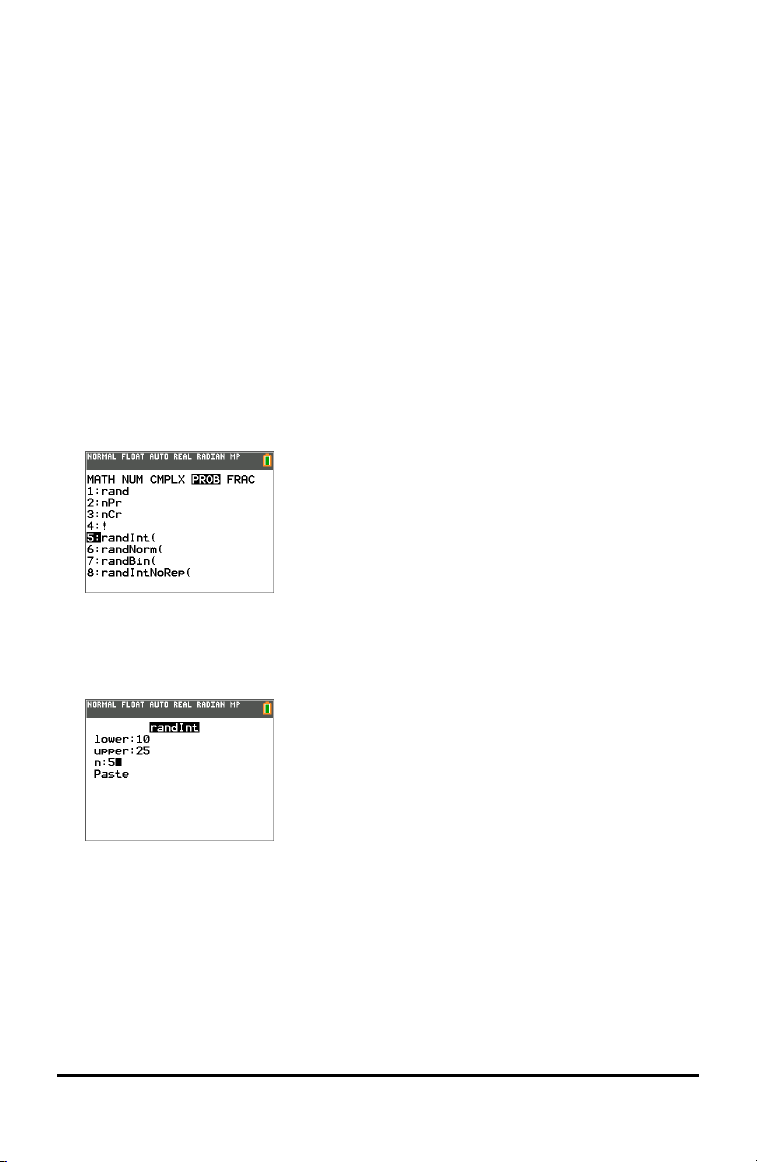
Working with Probability
You can find probability commands in the » PROB submenu.
Many probability commands have Stat Wizards to help you enter the syntax.
Example:
To generate a set of five random integers between 10 and 25 (inclusive):
1. Press », then press ~ until you highlight PROB.
2. Press † until you highlight 5: randInt(, then Í.
3. Enter the lower integer, then Í.
4. Enter the upper integer, then Í.
5. Enter the number of integers (n), then Í.
6. Press Í to Paste.
7. Press Í again to see the random set of integers.
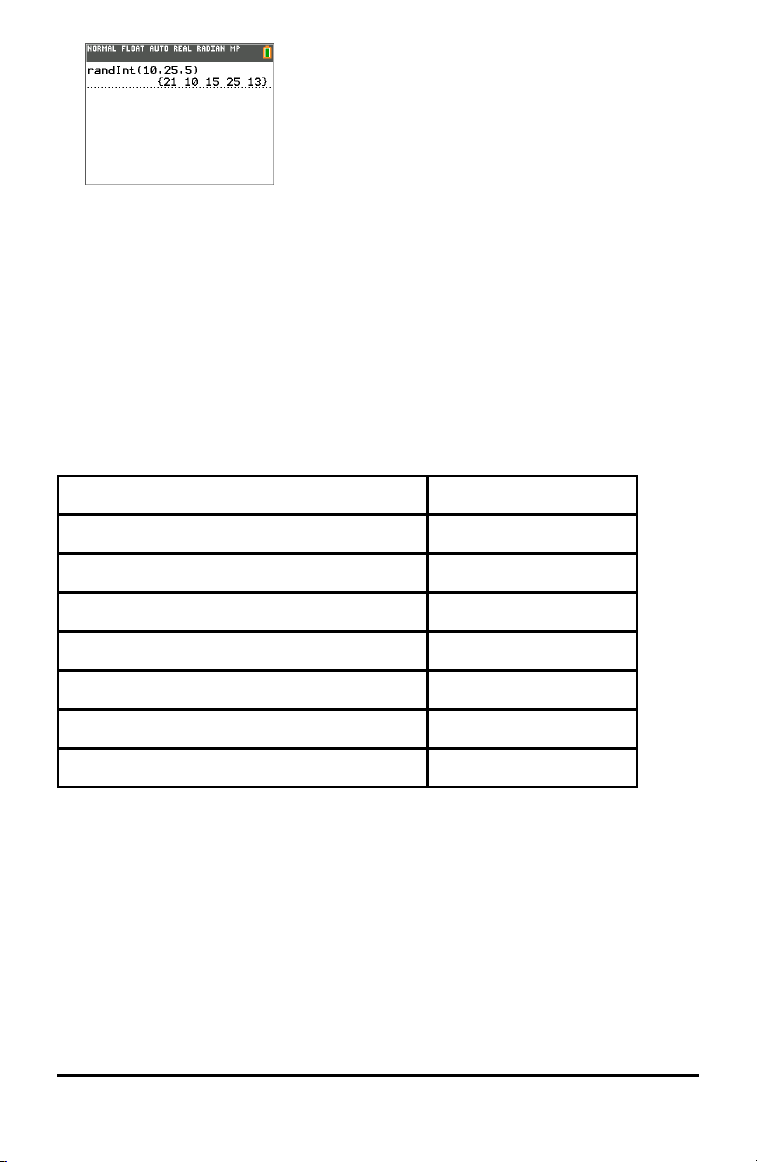
Notes:
• With each rand execution, the TI-84 Plus CE generates the same random-number
sequence for a given seed value. The TI-84 Plus CE factory-set seed value for rand
is 0. To generate a different random-number sequence, store any nonzero seed
value to rand. To restore the factory-set seed value, store 0 to rand, or reset the
defaults by going to y L 7:Reset....
• The seed value also affects randInt(, randNorm(, and randBin( instructions.
Working with Statistics
You can find statistics commands in the …menu.
You can use the following statistics functions:
Description Keys
Best fit equations (regressions) … ~ } †
Define and store up to three stat plot definitions y ,
Distributions y =
List-based statistical analysis y 9 ~ ~
Logistic and sine regression analysis … ~ } †
One- and two-variable analysis … ~ À and … ~ Á
Statistical tests … ~ ~
Inferential Statistics
You can perform 16 hypothesis tests and confidence intervals and 15 distribution
functions. You can display hypothesis test results graphically or numerically.
To enter lists of data:
1. Press ….
2. Select 1: Edit in the EDIT submenu, then Í.
Working with Probability and Statistics 41
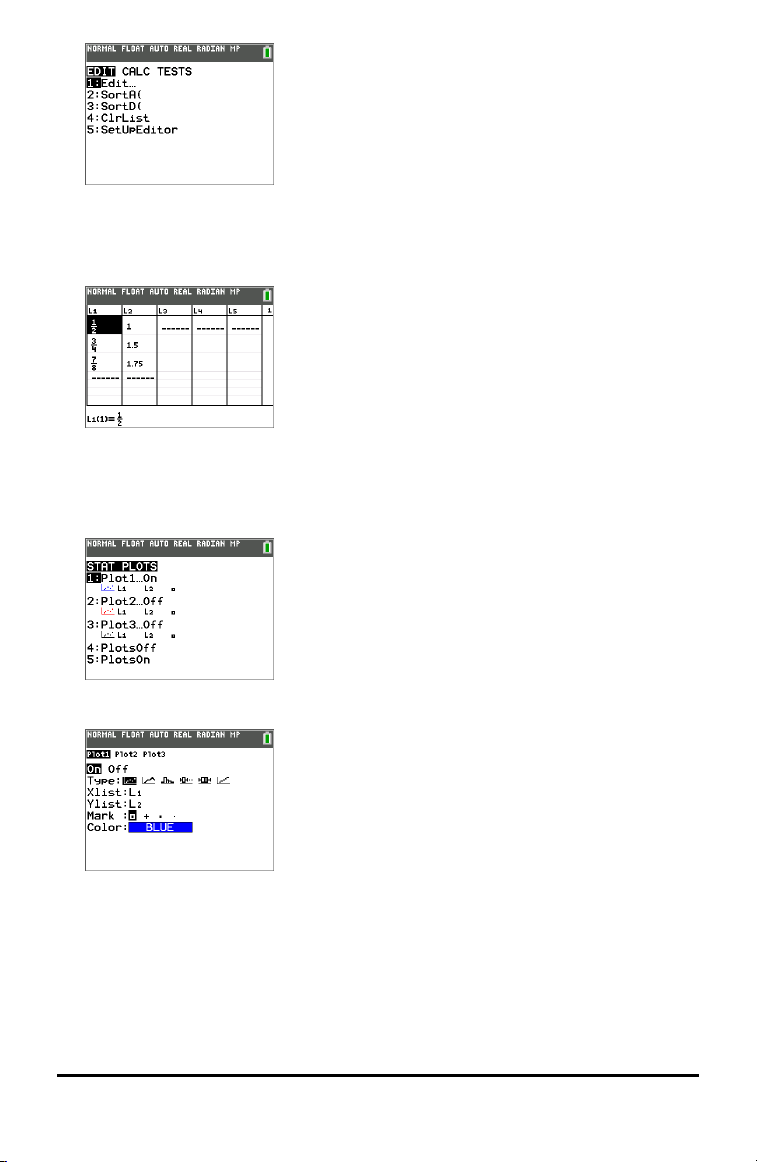
42 Working with Probability and Statistics
3. Enter your data into list columns.
Note: Once in the list editor, use the arrow keys to enter the data in the lists. L1 – L6
are built-in list names.
To plot this data:
4. Press y ,.
5. Press 1: Plot1 (to set up a scatter plot for L1 and L2), then Í.
6. Press | to highlight On.
7. Press q to automatically set up a graphing window for your data.
8. Press 9: ZoomStat to see the graph.
9. Press r and arrow keys to trace on the plot.

Note: You can plot your statistics data in these ways:
• Scatter plot
• xyLine
• Histogram
• Regular or Modified box-and-whisker plot
• Normal probability plot
Working with Probability and Statistics 43
44 Working with Probability and Statistics
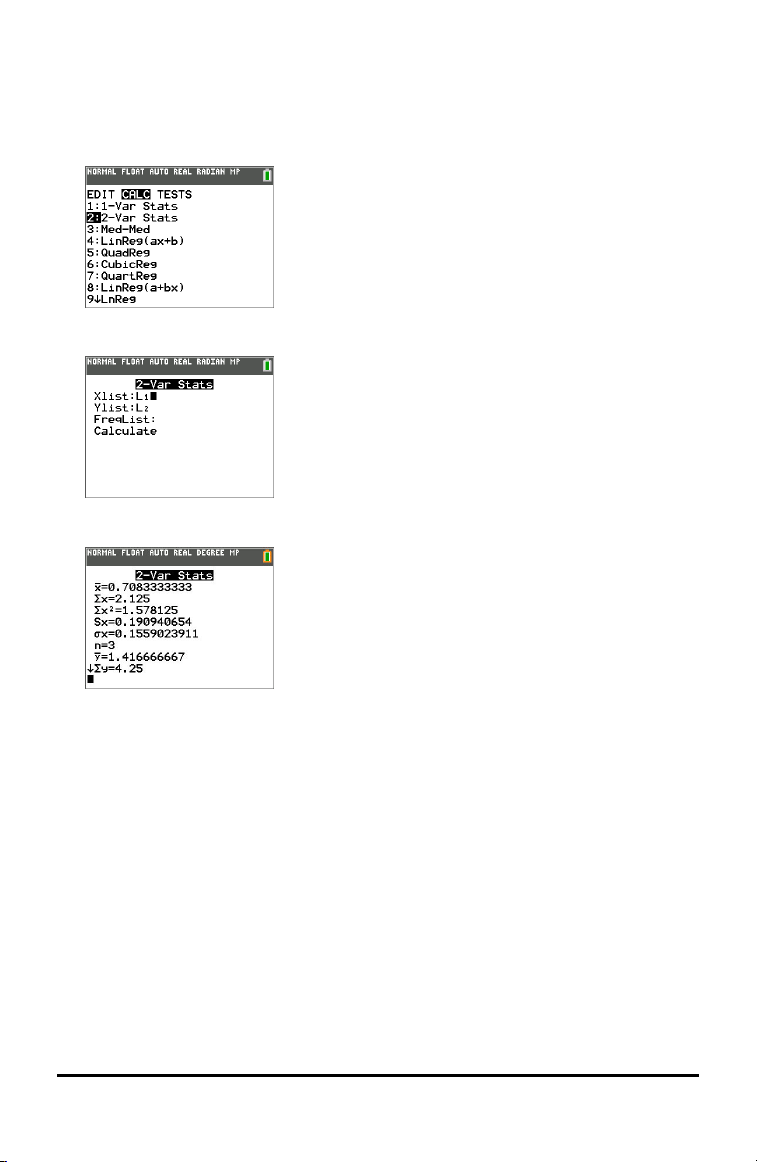
To find the two variable statistics for L1 and L2:
1. Press ….
2. Press ~ to highlight CALC.
3. Press † until you highlight 2:2-Var Stats, then Í.
4. Press † until you highlight Calculate, then Í.
▶ The screen will display the variable statistics.
Note: Most common probability and statistics commands will have a wizard to
prompt for syntax (values). The built-in Catalog Help is also available by pressing
the à key on most menu items. This opens an editor to help you fill in the syntax
(values) needed in a calculation.
Working with Variables
You can enter and use several types of data, including real and complex numbers,
matrices, lists, functions, stat plots, graph databases, graph pictures, and strings.
Variables and Defined Items
You can enter and use several types of data, including real and complex numbers,
matrices, lists, functions, stat plots, graph databases, graph pictures, and strings.
The TI-84PlusCE uses assigned names for variables and other items saved in memory.
For lists, you also can create your own five-character names.
Variable Type Names
Real numbers
(including fractions)
A, B, ... , Z, q
Complex numbers A, B, ... , Z, q
Matrices ãAä, ãBä, ãCä, ... , ãJä
To enter a matrix name:
Press y ¾.
The Matrix Names menu appears.
Press the number on the keypad that corresponds with the
desired Matrix Name.
Ex: Press 1 for [A] as shown below.
Lists* L1, L2, L3, L4, L5, L6, and user-defined names
Functions Y1, Y2, ... , Y9, Y0
Parametric equations X1T and Y1T, ... , X6T and Y6T
Polar functions r1, r2, r3, r4, r5, r6
Sequence functions u, v, w
Stat plots
Plot1, Plot2, Plot3
Graphical databases GDB1, GDB2, ... , GDB9, GDB0
Working with Variables 45
46 Working with Variables
Variable Type Names
Save current equations from Y= and Window settings to re-
use.
Background images Image1, Image2, ... , Image9, Image0
Pictures Pic1, Pic2, ... , Pic9, Pic0
Strings Str1, Str2, ... , Str9, Str0
Apps Applications
AppVars Application variables
Groups Grouped variables
Save a group of calculator files for sharing or to re-use when
setting up a classroom.
System variables Xmin, Xmax, and others
* Once a list contains a complex number, it is designated as a complex list. To change
a list to Real numbers, delete the list and enter the Real values.
Notes about Variables
• You can create as many list names as memory will allow.
• From the home screen or from a program, you can store to matrices, lists, strings,
and system variables such as Xmax, TblStart, and all Y= functions.
• From an editor, you can store to matrices, lists, and Y=functions.
• From the home screen, a program, or an editor, you can store a value to a matrix
element or a list element.
• You can use DRAW STO menu items to store and recall Pic Vars.
• Although most variables can be archived, system variables including r, T, X, Y, and q
cannot be archived.
• Apps are independent applications, which are stored in Flash archive. AppVars is a
variable holder used to store variables created by independent applications. You
cannot edit or change variables in AppVars unless you do so through the application
that created them.
Storing Variable Values
Values are stored to and recalled from memory using variable names. When you
evaluate an expression that contains a variable name, the graphing calculator
substitutes the value currently stored in that variable.
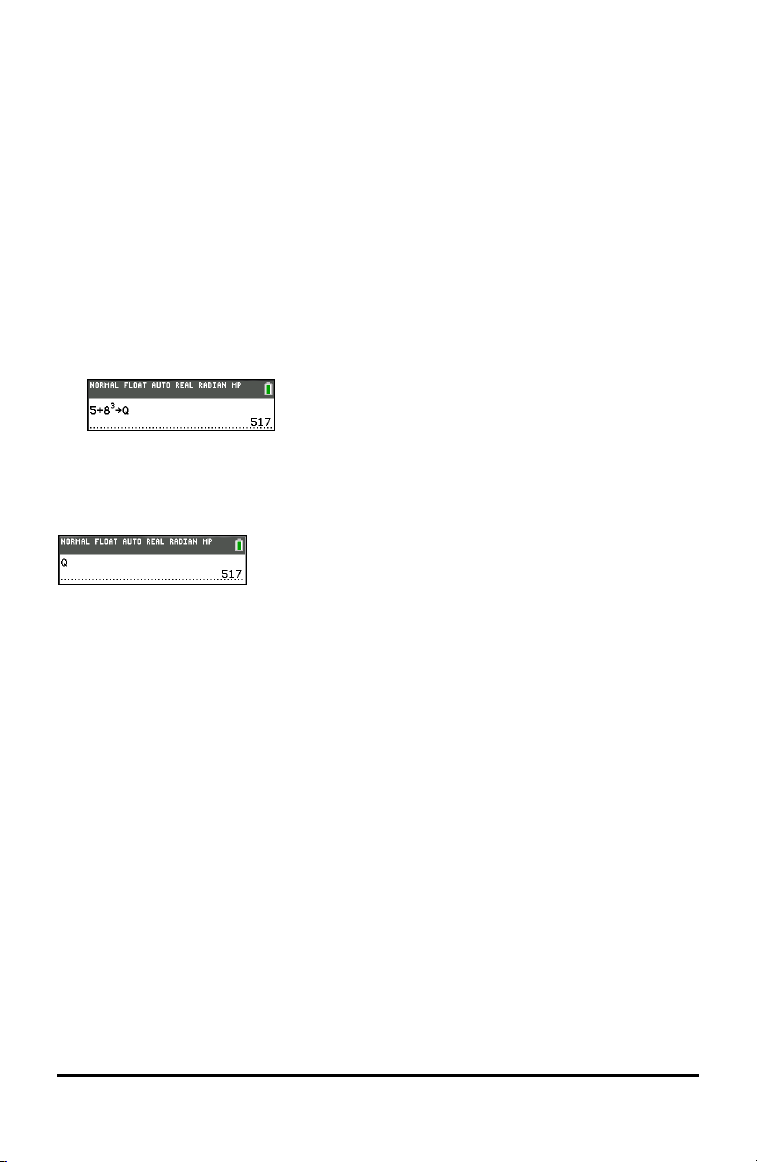
To store a value to a variable from the home screen or a program using the ¿ key,
begin on a blank line and follow these steps.
1. Enter the value you want to store. The value can be an expression.
2. Press ¿.
! is copied to the cursor location.
3. Press ƒ and then the letter of the variable to which you want to store the value.
4. Press Í. The graphing calculator evaluates the expression and stores the value
to the variable.
Displaying a Variable Value
To display the value of a variable, enter the variable name on a blank line on the home
screen, and then press Í.
Archiving Variables (Archive, Unarchive)
You can store variables in the TI-84PlusCE user data archive, a protected area of
memory separate from RAM. The user data archive lets you:
• Store data, programs, applications or any other variables to a safe location where
they cannot be edited or deleted inadvertently.
• Create additional free RAM by archiving variables.
By archiving variables that you do not need to edit frequently, you can free up RAM for
applications that may require additional memory.
The graphing calculator places an asterisk (ä)to the left of archived variables. You
cannot edit or execute archived variables. You can only see and unarchive them.
Example:
If you archive a list named L1, you will see that it exists in memory. However, if you
select and paste the name L1 to the home screen, it will not appear on the home
screen. You must unarchive it in order to see its contents and edit it.
Note: Image Vars are run and stored in archive, but when an Image Vars displays in
VARS 4:Picture & Background, the BACKGROUND menu does not display the asterisk *.
Working with Variables 47
48 Working with Variables
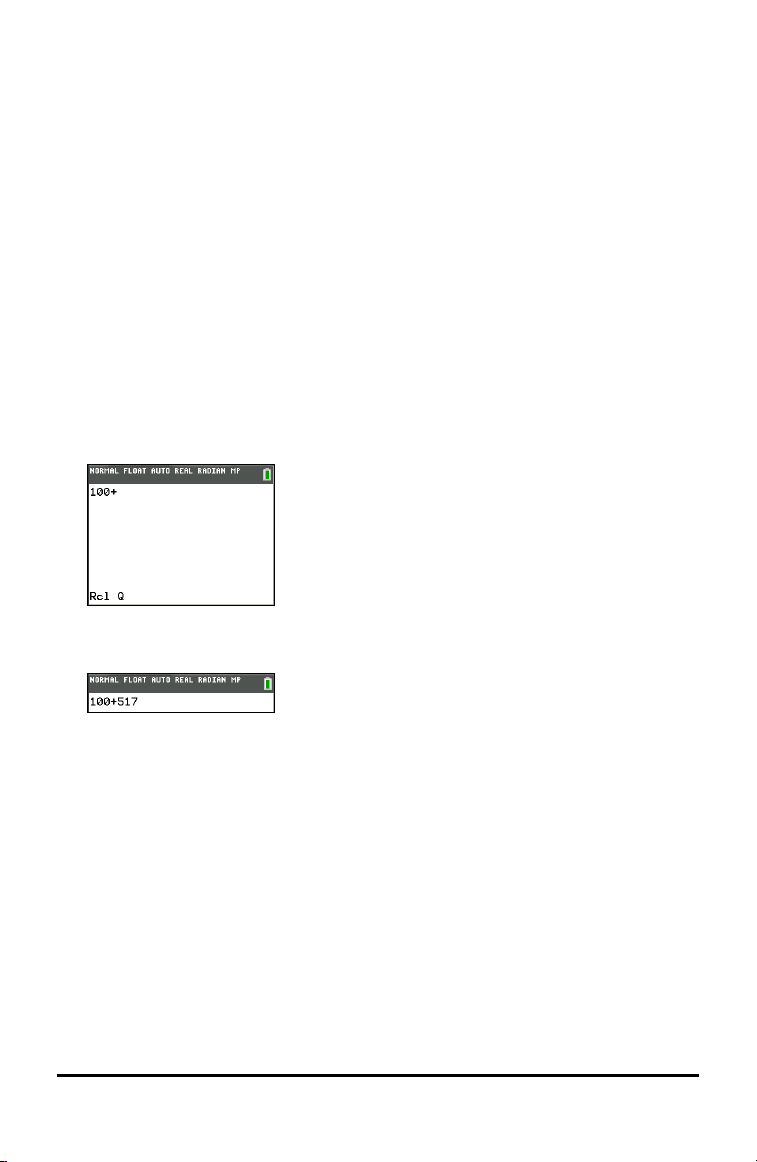
Recalling Variable Values
To recall and copy variable contents to the current cursor location, follow these steps.
To leave Rcl, press ‘.
1. Press y K. Rcl and the edit cursor are displayed on the bottom line of the
screen.
2. Enter the name of the variable in one of the following ways:
• Press ƒ and then the letter of the variable.
• Press y 9, and then select the name of the list, or press y d or e,
and so forth.
• Press y ¾, and then select the name of the matrix.
• Press ½ to display the VARS menu or ½ ~ to display the VARS Y-VARS
menu; then select the type and then the name of the variable or function.
• Press ƒ a to display the YVAR shortcut menu, then select the name of the
function.
The variable name you selected is displayed on the bottom line and the cursor
disappears.
3. Press Í. The variable contents are inserted where the cursor was located
before you began these steps.
Notes:
• You can edit the characters pasted to the expression without affecting the
value in memory.
• You can use Rcl in the Y= editor to paste a current function to a new YVar to
avoid retyping long expressions.
Managing Calculator Files
This section explains how to transfer the OS from calculator to calculator and describes
compatibility between graphing calculators.
Transferring the OS from calculator to calculator
You can transfer the operating system from one calculator to another using a USB unit-
to-unit cable.
Connect the two calculators by firmly inserting the USB cable ends into the calculators.
The USB port is located on the front-right side of the calculator.
Note: You cannot transfer the OS or files using the TI Charging Station CE (see the
accessories section). The TI Charging Station CE only charges the TI-84PlusCE graphing
calculators.
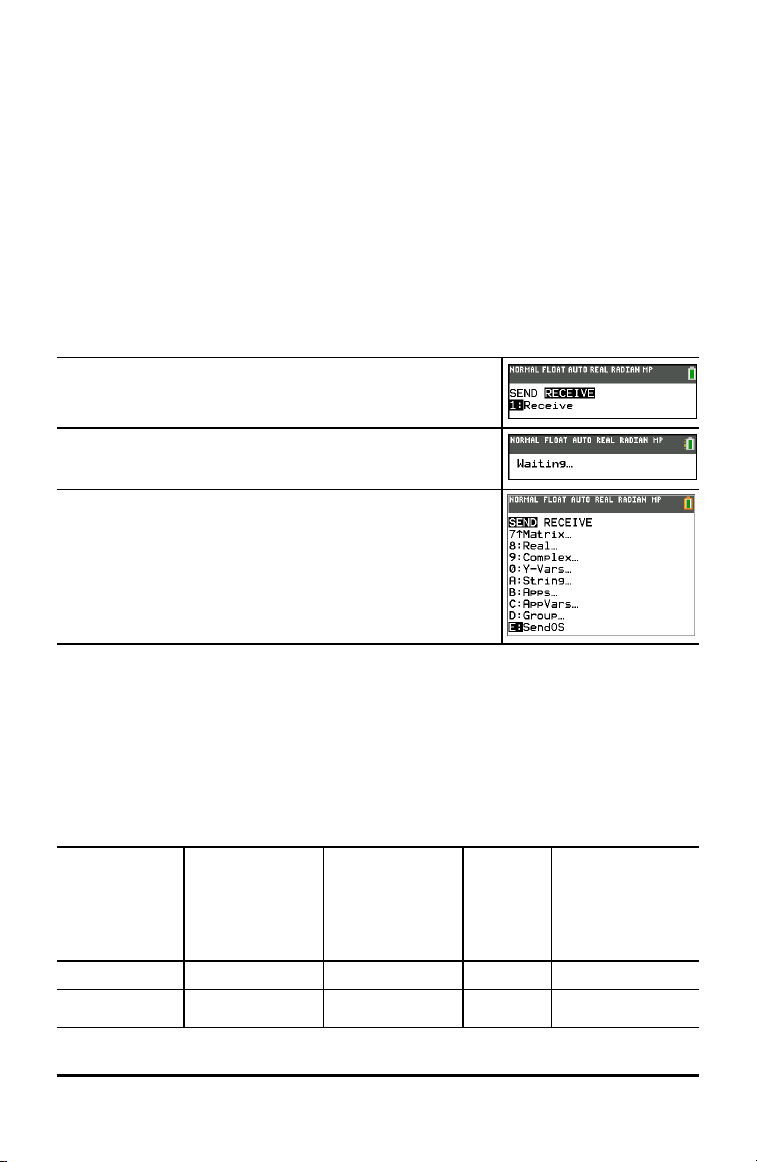
Receiving calculator:
y 8 ~ Í
When you press Í, the graphing calculator displays the
message Waiting...
Sending calculator:
y 8 } } Í
Compatibility with Graphing Calculators
Note: Not all TI-84 Plus CE graphing calculator files are compatible with other TI-84
Plus Family graphing calculator files because of the high resolution of the color screen.
In general, numeric files (not limited to lists, variables, matrices, and functions) are
shared between these graphing calculators but Apps are not shared between these
graphing calculators even if they have the same title. When not compatible, the
computer file extensions for the TI-84 Plus CE are different from a similar variable
from the TI-84 Plus/TI-84 Plus Silver Edition graphing calculators.
File Type
Link from
TI-84 to TI-84
Plus CE
Link from
TI-84 Plus CE to
TI-84
84P
computer
file type
TI-84 Plus CE
computer
file type
Operating
System
No No 8xu 8eu
Apps No No 8xk 8ek
AppVar
1
Yes Yes 8xv 8xv
Managing Calculator Files 49

50 Managing Calculator Files
File Type
Link from
TI-84 to TI-84
Plus CE
Link from
TI-84 Plus CE to
TI-84
84P
computer
file type
TI-84 Plus CE
computer
file type
Programs - TI
Basic
1, 2
Yes Yes 8xp 8xp
Assembly
Programs
1
Yes No 8xp 8xp
Pictures No No 8xi 8ci
Background
Images
N/A No N/A 8ca
Group Files Yes Yes 8xg 8xg
User Zoom Yes Yes 8xz 8xz
String Yes Yes 8xs 8xs
Table Yes Yes 8xt 8xt
Function file Yes Yes 8xy 8xy
GDB
3
Yes Yes 8xd 8xd
List Yes Yes 8xl 8xl
Matrix Yes Yes 8xm 8xm
Number Yes Yes 8xn 8xn
Complex Yes Yes 8xc 8xc
Window Setup Yes Yes 8xw 8xw
Backup No No 8xb —
1
App Vars and Programs should be reviewed for use after the transfer between the TI-
84 Plus family graphing calculators. Some App Vars may not setup an App as expected.
Some Programs will need to be modified due to the difference in screen resolution and
new commands.
2
Programs created using commands available only in the latest OS version will not
transfer to graphing calculators with an earlier OS version.
3
You may receive a version error if you used DOT-THIN line style. Change the line style
to avoid the error.

Using Applications (Apps)
These applications are preloaded on your TI-84 Plus CE, and you can install Apps. You
can view the Applications Guidebook, install applications, and install the TIConnect™
CE software at education.ti.com/go/download.
Press Πto see the complete list of applications.
Cabri™ Jr. App
Construct, analyze, and transform mathematical models and geometric diagrams on
your TI graphing calculator. You can:
• Perform analytic, transformational, and Euclidean geometric functions
• Build geometric constructions interactively with points, a set of points for locus,
lines, polygons, circles, and other basic geometric objects
• Alter geometric objects on the fly to see patterns, make conjectures, and draw
conclusions
CellSheet™ App
Combines spreadsheet functionality with the power of a graphing calculator.
Create cell formulas and use built-in functions.
Cells can contain:
• Integers
• Real numbers
• Formulas
• Variables
• Text and numeric strings
• Functions
Each spreadsheet contains 999 rows and 26 columns. The amount of data you can enter is
limited only by the available RAM.
• Store (x,y) coordinate pairs to lists for viewing and optimizing functions for linear
programming.
Conic Graphing App
Presents equations in function, parametric, or polar form and provides a simple way to
graph the four conic shapes:
• Ellipse
• Circle
• Parabola
• Hyperbola
Enter the required parameters to graph, trace, or solve for the conic's characteristic.
Using Applications (Apps) 51

52 Using Applications (Apps)
Inequality Graphing App
Gives you new features for graphing equations and inequalities and evaluating the
relationship between them. You can:
• Enter inequalities using relation symbols
• Graph inequalities and shade the union and intersection regions
• Enter inequalities (vertical lines only) in an X=editor
• Trace points of interest (such as intersections) between relations
• Store (x,y) coordinate pairs to lists for viewing and optimizing functions for linear
programming.
Periodic Table App
Provides a graphical representation of the elements of the Periodic Table. This application
allows you to:
• Observe and explore the Periodic Table of the Elements
• Find property data and useful information about the known elements
• Sort the elements by atomic number, alphabetically by name, or alphabetically by
symbol
• Identify groups of elements by region (noble gasses, halogens, etc.) and block (p-, d-, s-
and f-)
• Export property data to lists for further analysis
• Graph the major properties (atomic radii, electronegativities, etc.) against atomic
number to illustrate the periodic nature of the elements
Polynomial Root Finder and Simultaneous Equation Editor App
This application:
• Calculates the roots (zeros) of polynomials of degree 1 through 10 with a convenient,
easy-to-use interface.
• Allows you to store solutions into lists, load a list into the application for polynomial
coefficients, and store the polynomial to a Y-Var to graph after quitting the App.
• Finds solutions to systems of linear equations.
• Allows you to load matrices containing the coefficients of linear systems, and identify
whether a given system has a unique solution, an infinite number of solutions, or no
solution.
Probability Simulation App
Explore probability theory with interactive animation that simulates the rolling of dice and
tossing of coins, and generates random numbers on your calculator. Options include:
• Bar Graph
• Table of trials data
• Settings for specifying numbers of trials
• Ways to collect data
• Weighting
In addition, students can export data for further exploration.
Science Tools App
Science Tools allows you to perform unit conversions on your calculator. App elements
include:
• Significant Figures Calculator
• Constants and Conversions
• Data and Graph Wizard
• Vector Calculator
SmartPad™ CE App
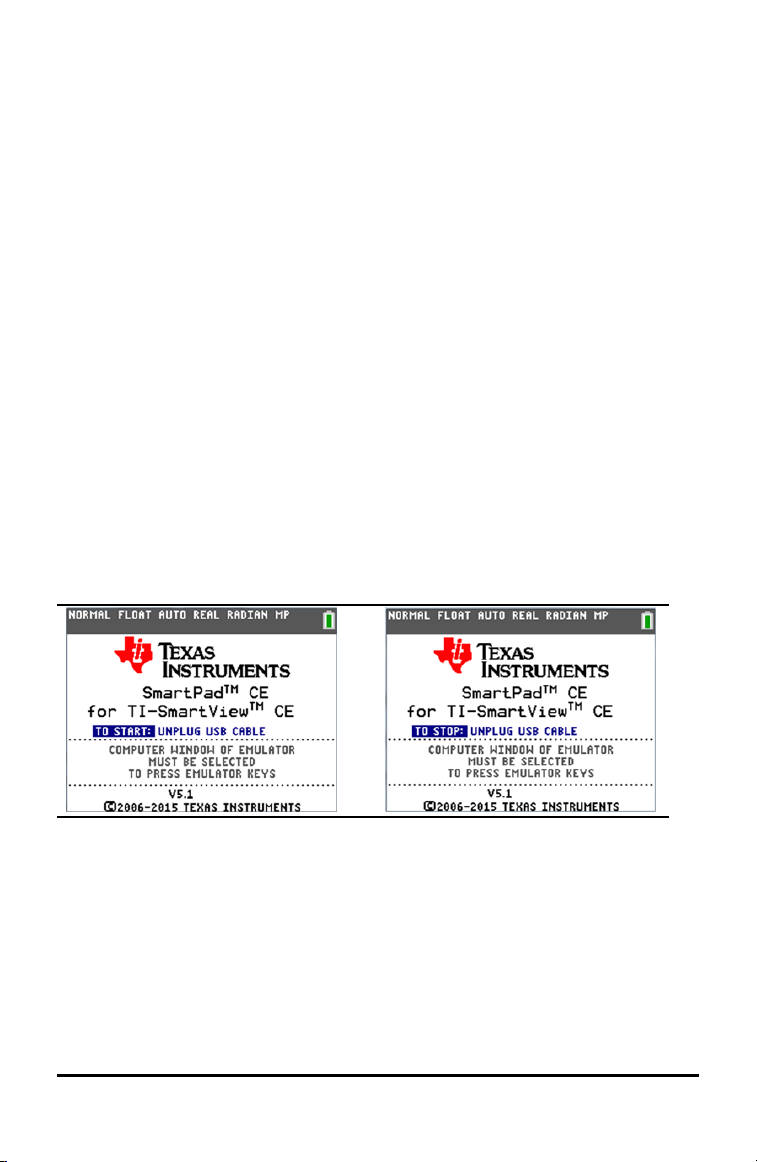
Connecting a Calculator as a Remote Key Pad
The SmartPad™ CE App allows you to connect a calculator as a remote key pad.
To use the TI-84 Plus CE as a remote keypad for TI-SmartView™ CE:
1. Load the SmartPad™ CE App on your TI-84 Plus CE.
2. Connect your TI-84 Plus CE to your computer using the USB Computer cable which
came with your calculator.
3. Launch TI-SmartView™ CE.
Note: Make sure the TI-SmartView™ CE window is in focus by clicking on the TI-
SmartView™ CE window.
4. Run SmartPad™ CE App on your TI-84 Plus CE.
5. Press Œand select SmartPad™ CE from the Apps menu.
6. Read the information on the splash screen.
7. Press keys on the calculator key pad which remotely press the emulator key pad.
To stop the App:
• Disconnect the USB cable from the calculator to stop the App and remote key pad
feature.
Tip: Reconnect the USB cable and run the App again if the remote key pad
connectivity is no longer responding.
Notes:
Using Applications (Apps) 53

54 Using Applications (Apps)
• The TI-84 Plus CE running the SmartPad™ CE App will not display calculations or
graphs. The calculator becomes a remote USB key pad for the emulator only.
• The TI-84 Plus CE will remain a remote key pad when the TI-SmartView™ CE
window is in focus. Click on the TI-SmartView window prior to pressing keys on the
calculator.
• The TI SilverLink cable is not supported in TI-SmartView™ CE.
TI-Innovator™ Hub App
The TI-Innovator™ Hub App runs automatically in CE OS 5.2 and higher when the App is
loaded on the calculator. The TI-Basic program editor is enhanced with a HUB
submenu to help you with spelling and syntax of commands for TI-Innovator™ Hub
programming. Save time by using the submenu to paste full TI-Innovator™ commands
rather than typing alpha characters from the keypad as you write your programs.
Note: This Hub App is listed only in [mem]. You can get CE OS 5.2 or higher and the TI-
Innovator™ Hub App at education.ti.com/go/download.
Transformation Graphing App
Transformation Graphing lets you observe the effects of changing coefficient values
without leaving the graph screen. Transformation Graphing affects only function
graphing mode. X is the independent variable and Y is the dependent variable. It is not
available in parametric, polar, or sequence graphing modes.
Transformation Graphing allows you to manipulate up to four coefficients on the
graph: A, B, C, and D. All other coefficients act like constants using the value in
memory. You can step through the transformation of a function or animate the
transformation using play styles, play/pause, play, and fast play.
Vernier EasyData™ App
Use EasyData™ App from Vernier Software & Technology to explore your world. The
EasyData™ App auto-launches data collection when used with Vernier EasyTemp™ sensor,
and loads built-in experiments for every supported Vernier sensor.

Using Accessories
This section covers how to use:
• TI computer software
• TI Charging Station CE
• TI rechargeable batteries
Using TI Desktop Software
Use TI desktop software to exchange information between your graphing calculator
and your computer, or to display a TI graphing calculator for your entire classroom.
Using TI-SmartView™ CE
The TI-SmartView™ CE software allows you to display a TI graphing calculator for your
entire classroom. With TI-SmartView™ CE software, you can:
• View the history of your key press entries.
• Capture and save screen shots to use in other documents as you investigate a math
or science concept.
• Use the View
3
™ pane to show three additional screens simultaneously.
The TI-SmartView™ CE software includes two workspaces:
Calculator Emulator: allows you to perform calculations and view answers as you
would on a physical calculator
Emulator Explorer: allows you to manage emulator content
Using TI Connect™ CE
The TI Connect™ CE software makes exchanging information between your graphing
calculator and your computer quick and easy.
The TI Connect™ CE software includes three workspaces:
Calculator Explorer: allows you to manage emulator content
Screen Capture: allows you to manage screen captures
Program Editor: allows you to work with TI-Basic programs
Using the TI Charging Station CE
The TI Charging Station CE has 10 slots, and each slot can accommodate a
TI-84PlusCE graphing calculator. Place a TI-84 Plus CE graphing calculator in one of
these slots to charge the TI Rechargeable Battery.
Note: It is not necessary to fill all the slots in the charging station to charge batteries.
Using Accessories 55

56 Using Accessories
Preparing Charging Stations for Use
The TI Charging Station CE is shipped with the following components in each package:
• A TI Charging Station CE
• An AC adapter
• A regional power cord adapter
1. Insert the small end of the power adapter cord into the charging station’s power
jack.
2. Plug the other end of the adapter into a power outlet.
• An indentation on each side of the TI Charging Station CE enables you to lift it.
Always use two hands to lift and move the charging station.
• When the charging station is empty, turn it over and you will notice and indention
on the bottom. Thread the cable through this indention to ensure the charging
station sits flat on a surface.
• Place the charging station on a flat, stable surface. You can also use a wheeled cart
if you need to move the charging station between classrooms. When deciding on a
location, consider its proximity to a power source such as a power strip or wall
outlet.
Inserting Graphing Calculators into the TI Charging Station CE
The slots in the TI Charging Station CE are designed to accommodate a graphing
calculator without a slide case attached. The calculator will not fit in the slots with the
slide case attached.
The front of the calculator must face the front of the charging station. You may
damage the TI-84PlusCE graphing calculator if you try to force it into the charging
station facing the wrong direction. When looking at the TI logo on the charging station,
insert calculators into the slot with the keypad facing left.

1. Remove the slide case from the graphing calculator.
2. Align the grooves on the sides of the graphing calculator with the guides in the
charging station slots. Ensure the calculator is facing the proper direction.
3. Gently push the graphing calculator into the slot. You will feel a slight resistance;
continue pushing down until the graphing calculator is seated.
When the TI-84PlusCE graphing calculator is properly seated in a slot, the LED light on
the side of the calculator turns amber to indicate it is charging.
Charging Batteries
The TI-84PlusCE graphing calculator uses a Li-Ion TIRechargeable Battery.
The charging process starts automatically when a graphing calculator is placed in a slot
on a powered charging station. You can charge a classroom set of graphing calculators
overnight.
Determining Battery Status
The LED light on each connected graphing calculator in the charging station provides
basic information about the status of the rechargeable battery.
• When the light is amber, the battery is charging.
• When the light is green, the battery is fully charged.
Troubleshooting
If the recharge fails:
• Make sure the graphing calculator is seated properly in the slot. Batteries are not
charged if the connector on the graphing calculator and the connector in the slot
are not aligned.
Using Accessories 57

58 Using Accessories
• Check the connector on the graphing calculator to ensure that it is clean. If there is
build-up on the graphing calculator’s connector, you can remove it with a clean, dry
cloth or a pencil eraser. Never use wet cloths or solutions of any kind.
Storing Charging Stations
Store the TI Charging Station CE on a flat surface such as a table or a wheeled cart. You
cannot damage the charging station by leaving it plugged in for extended periods of
time. Also, you cannot damage the batteries by leaving them in the charging station
beyond the time needed to fully charge them.
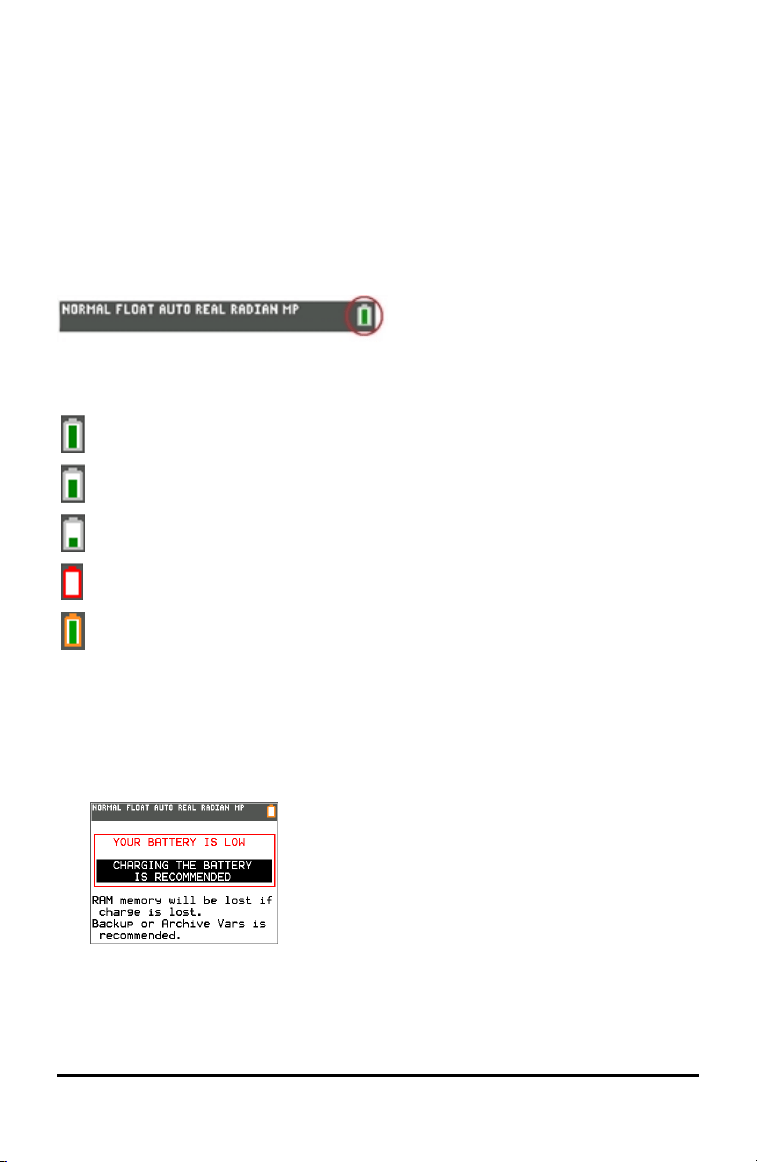
Using, Replacing, and Charging Batteries
The TI-84PlusCE graphing calculator comes with a:
• TI rechargeable battery
• USB computer cable for transferring files and charging the battery
Note: Charge the battery for at least four hours to ensure optimum performance.
Battery Status
The battery status icon on the upper right of the screen gives information on battery
life.
The battery icons indicate the level of battery power remaining, and indicate if the
battery is charging.
Battery is 75% to 100% charged.
Battery is 50% to 75% charged.
Battery is 25% to 50% charged.
Battery is 5% to 25% charged.
Battery is charging.
Warning:
• RAM memory will be lost if the battery charge is lost. You should back up or
archive your variables if your battery power gets low.
• Displays this message when you turn on the
unit.
Using Accessories 59

60 Using Accessories
Deep Sleep Mode
To maximize battery life, this graphing calculator is shipped in Deep Sleep mode. To
wake the handheld from this mode, press É for at least 4 seconds or apply USB
(computer or wall adapter) or TI Charging Station CE power. After waking the
handheld, you can turn it on anytime by pressing É. To maximize battery life during
extended storage periods, the Deep Sleep mode is enabled automatically after a
period of being in the off state.
Recharging the TI Rechargeable Battery
You should make sure the TI-84 PlusCE battery is charged for classroom use and
before exams.
Use one of the following options to charge the battery in the TI-84PlusCE graphing
calculator:
• Connect the graphing calculator to a computer using a USB computer cable.
-or-
• Connect to a wall outlet using a TI wall adapter (may be sold separately).
-or-
• Place the graphing calculator in a TI Charging Station CE.
The amount of time required to fully charge the battery may vary, but charging takes
approximately four hours. It is not necessary to remove the TI Rechargeable Battery
from the graphing calculator to recharge it. The graphing calculator operates normally
while it is attached to a charging source.
To recharge a graphing calculator from a computer, a TI USB driver must be installed.
To download TIConnect™ CE or TI-SmartView™ CE software that includes a driver, go
to: education.ti.com/go/download.
Replacing TI Rechargeable Batteries
Take these precautions when replacing rechargeable batteries:
• Use only the charger recommended for the battery, or the one that was provided
with the original equipment.
• Remove the graphing calculator from the charger or alternating current adapter
when not in use or being charged.
• Do not use the battery in other devices because:
- This may result in personal injury or damage to equipment or property.
- There is a risk of explosion if a battery is replaced by the wrong type.

Replacing the Battery
Use only the TI Rechargeable Battery to replace the TI-84PlusCE battery.
To replace the battery, follow these steps.
1. Use a small screwdriver to release the panel from the
back of the handheld.
2. Remove the panel.
3. Remove the old battery.
4. Drop in a new battery.
5. Replace the back panel and fasten the screws with a
screwdriver.
Disposing of Used Batteries Safely and Properly
Do not mutilate, puncture, or dispose of batteries in fire. The batteries can burst or
explode, releasing hazardous chemicals. Discard used batteries according to local
regulations.
When the TI Rechargeable Battery is fully charged, the graphing calculator draws
power in the following order:
1. From a connected external power source, such as:
• A computer connected through a USB computer cable
-or-
• A TI wall adapter (may be sold separately)
2. From the TI Rechargeable Battery
Using Accessories 61
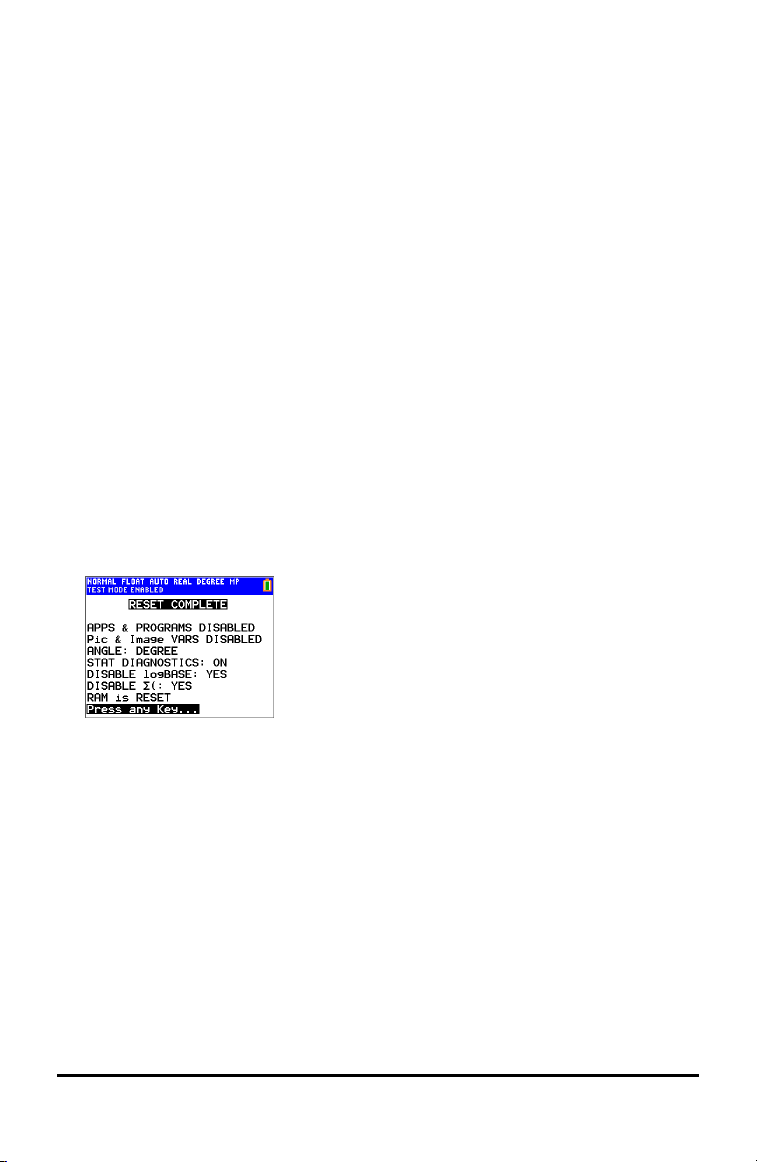
62 Using Press-to-Test
Using Press-to-Test
Use Press-to-Test to manage exams using TI graphing calculators in your classroom.
Setting Up Test Mode
1. Turn the calculator OFF.
2. Press and hold down the ~, |, and É keys, and then release.
3. Press OK on each screen to place calculator in exam mode.
4. Exam LED will blink green.
5. The RESET OPTIONS screen displays.
Notes:
• The status bar is blue when in TEST MODE and TEST MODE ENABLED.
• Pic & Image Vars are disabled.
• Calculator data (Vars) are deleted from RAM and Arc.
• By default:
- ANGLE is set to DEGREE
- STAT DIAGNOSTICS is set to ON
- DISABLE logBASE and DISABLE Σ(are set to YES.
6. To change the default settings, move the cursor over the desired setting and press
Í.
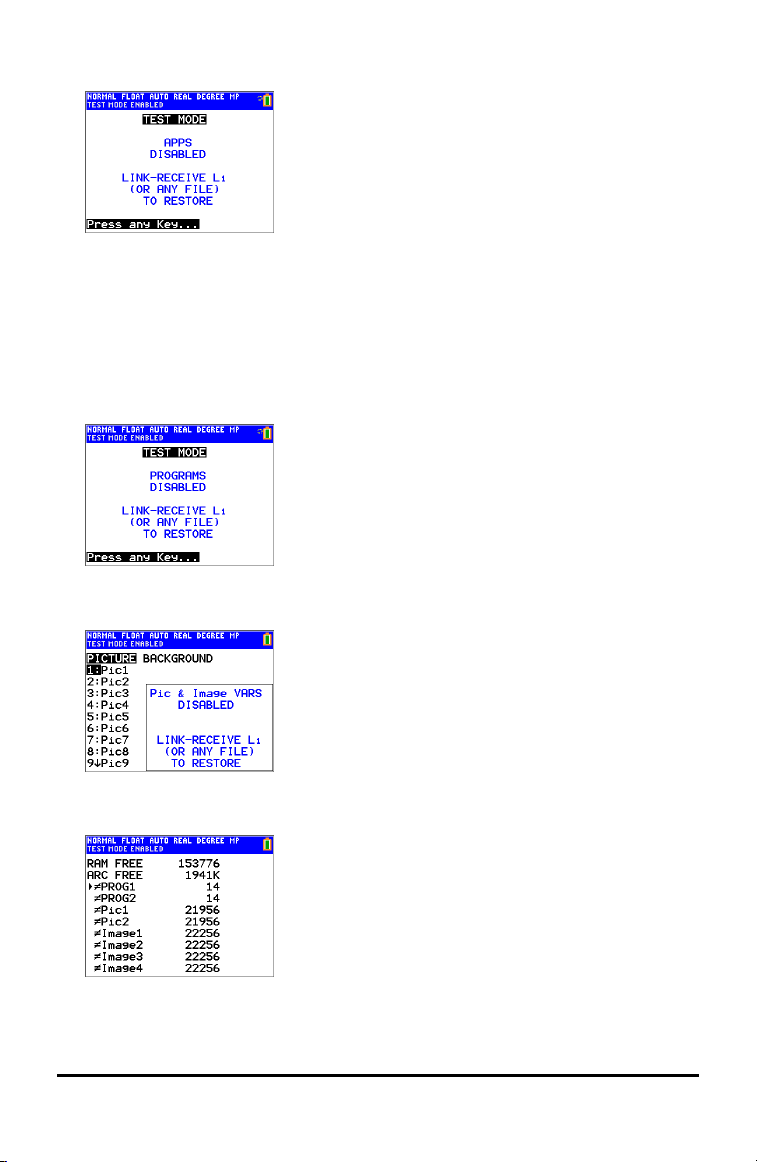
7. On the exam calculator, press Πto verify that applications are disabled. The
following screen displays:
Note:
• All variables, excluding AppVars, stored in RAM and in archived memory are
deleted.
• Several Apps remain on the calculator for the exam. Press any key to see the
Apps menu.
8. On the exam calculator, press ¼ to verify that programs have been disabled.
The following screen displays:
9. On the exam calculator, Pic and Image Vars are shown as disabled. The following
screen displays:
10. In memory management (y L, 2:Mem Management/Delete...), disabled files
will display with the not equal sign.
Using Press-to-Test 63

64 Using Press-to-Test
Bringing a Calculator Out of Test Mode
You can re-enable all disabled calculator files by using one of the following methods:
• Link two TI-84 Plus CE graphing calculators using a unit-to-unit USB cable and then
transfer a file by using y 8, SEND RECEIVE
-or-
• Use the TI TestGuard™ App re-enable feature.
Notes:
To clear a calculator of files created during an exam, use the following two-step
process:
If you do not need to clear files, use step 2 below:
1. Reset calculator files.
a) Turn off the calculator while in test mode.
b) "Re-Press-to-Test" - press and hold down the ~, |, and É keys, and then
release.
c) Select OK when you see the Reset Verification Screen. The calculator is now
"clean."
2. Re-enable files to turn off test mode.
a) Link two TI-84 Plus CE graphing calculators using a unit-to-unit USB cable.
b) Send a file to bring the calculator(s) out of test mode.
Tip: To preserve battery life, take your calculator out of Press-to-Test mode after the
exam.
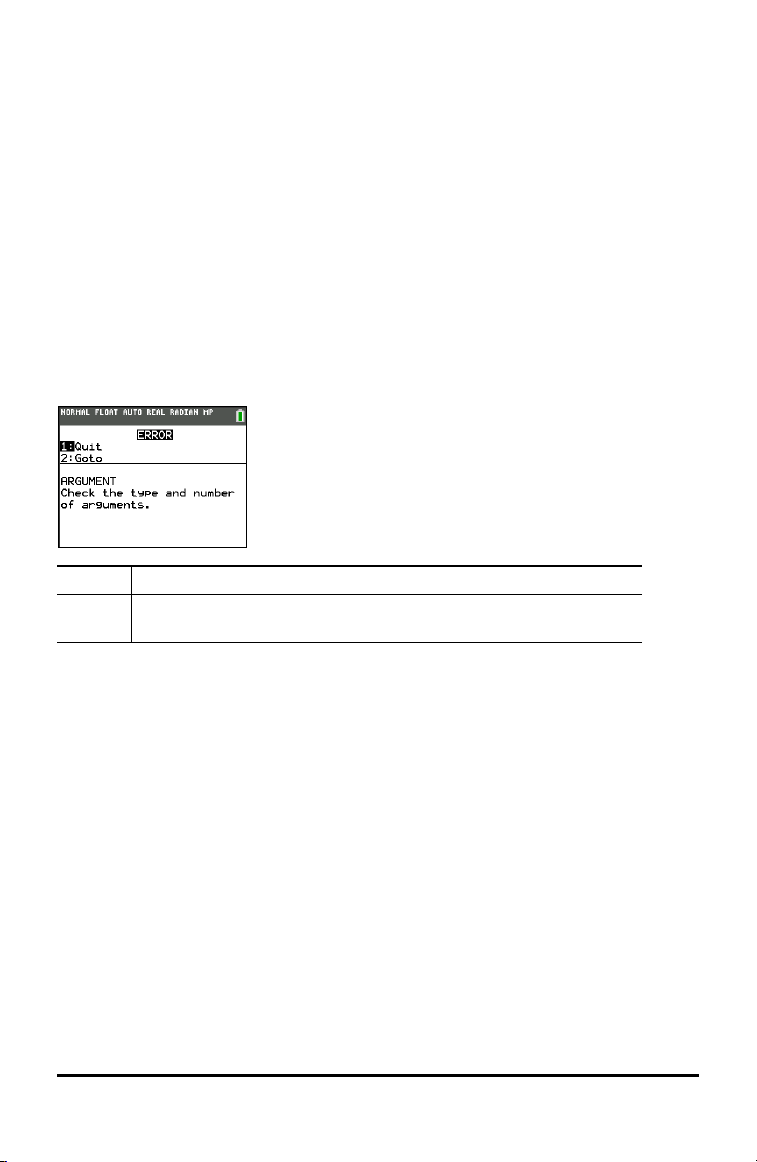
Diagnosing and Correcting Error Conditions
The TI-84PlusCE detects errors while performing these tasks:
• Evaluating an expression
• Executing an instruction
• Plotting a graph
• Storing a value
1. Determine the error. The error screens give helpful hints about what may have
happened, but the errors are not always fully explained.
2. Correct the expression.
Diagnosing an Error
When the TI-84PlusCE detects an error, it returns an error message with a short
description.
1:Quit Displays the home screen
2:Goto Displays the previous screen with the cursor at or near the error
location
Note: If a syntax error occurs in the contents of a Y= function during program
execution, then the 2:Goto option returns to the Y=editor, not to the program.
Correcting an Error
To correct an error, follow these steps.
1. Note the error type (ERROR:error type).
2. Select 2:Goto (if it is available).The previous screen is displayed with the cursor at
or near the error location.
3. Determine the error. The error screens give helpful hints about what may have
happened, but the errors are not always fully explained.
4. Correct the expression.
Diagnosing and Correcting Error Conditions 65

66 General Information
General Information
Texas Instruments Support and Service
General Information: North and South America
Home Page:
education.ti.com
KnowledgeBase and e-mail inquiries:
education.ti.com/support
Phone: (800) TI-CARES / (800) 842-2737
For North and South America and U.S. Territories
International contact information:
education.ti.com/support/worldwide
For Technical Support
Knowledge Base and support by e-mail:
education.ti.com/support or ti-cares@ti.com
Phone (not toll-free): (972) 917-8324
For Product (Hardware) Service
Customers in the U.S., Canada, Mexico, and U.S. territories: Always contact Texas
Instruments Customer Support before returning a product for service.
For All Other Countries:
For general information
For more information about TI products and services, contact TI by e-mail or visit the
TIInternet address.
E-mail inquiries:
ti-cares@ti.com
Home Page:
education.ti.com
Service and Warranty Information
For information about the length and terms of the warranty or about product service,
refer to the warranty statement enclosed with this product or contact your local Texas
Instruments retailer/distributor.
Precautions for Rechargeable Batteries
Take these precautions when replacing rechargeable batteries:
• Use only the charger recommended for the cell or battery, or the one that was
provided with the original equipment.
• Remove the cell or battery from the charger or alternating current adapter when
not in use or being charged.
• Use of the battery in other devices may result in personal injury or damage to
equipment or property.

• Do not mix brands (or types within brands) of batteries. There is a risk of explosion
if a battery is replaced by the wrong type.
Disposing of Batteries
Do not mutilate, puncture, or dispose of batteries in fire. The batteries can burst or
explode, releasing hazardous chemicals. Discard used batteries according to local
regulations.
Korean Class A warning statement
Class A
급기 기(업무용방 송통신 기자재 )
Notification
이 기 기는 업무용 (A급) 전 자파적 합기기로서 판
매자 또는 사용자는 이 점을 주 의하시기 바라
며, 가정외의 지역에서 사용하는 것을 목적으로 합니다.
General Information 67

Index
A
a+bi (rectangular complex mode)
24
AC adapters
56
alpha cursor
14
angle modes
22
APD™ (Automatic Power Down™)
4-5
Apps
46
AppVars
46
Archive
47
Automatic Power Down™ (APD™)
4-5
B
batteries
charging
57
status
57
troubleshooting
57
C
Cabri™ Jr.
51
Catalog Help
32
CellSheet™
51
charge status
LED indicator
57
charging batteries
57
troubleshooting
57
charging station
55
color
DRAW commands
35
graph format screen
35
spinner
35
stat plots
35
Y= editor
35
color on the TI-84 Plus CE
35, 51
complex
modes (a+bi, re^qi)
24
numbers
24
Conic Graphing
51
contrast (display)
8
cursors
14
D
decimal mode (float or fixed)
22
Degree angle mode
22
Desktop Software
55
display brightness
8
display cursors
14
Displaying the Clock Settings
26
E
E (exponent)
21, 32
edit keys table
33
Eng (engineering notation mode)
21
entry cursor
14
EOS™ (Equation Operating System™)
29
Equation Operating System™ (EOS™)
29
Error Conditions
65
errors
correcting
65
diagnosing
65
F
Fix (fixed-decimal mode)
22
fixed-decimal mode (Fix)
22
Float (floating-decimal mode)
22
floating-decimal mode (Float)
22
fractions
n/d
25
Un/d
25
full-screen mode (Full)
24
Full (full-screen mode)
24
Func (function graphing mode)
23
function graphing
modes
23
function, definition of
32
G
graph-table split-screen mode (G-T)
24
graphing-order modes
24
graphing modes
23
GT (graph-table split-screen mode)
24
68 Index

H
home screen
9
scrolling
9, 11
Horiz (horizontal split-screen mode)
24
I
implied multiplication
30
Inequality Graphing
52
insert cursor
14
inserting
calculators in charging station
56
instruction, definition of
33
L
LED lights
57
M
menus
15
scrolling
15
shortcut
12
mode
Answers
25
Classic
21
MathPrint™
21
mode settings
a+bi (complex rectangular)
24
Degree (angle)
22
Eng (notation)
21
Fix (decimal)
22
Float (decimal)
22
Full (screen)
24
Func (graphing)
23
GT (screen)
24
Horiz (screen)
24
Normal (notation)
21
Par/Param (graphing)
23
Pol/Polar (graphing)
23
Radian (angle)
22
re^qi (complex polar)
24
Real
24
Sci (notation)
21
Seq (graphing)
23
Simul (graphing order)
24
N
n/d
25
negation (-)
30
Normal notation mode
21
O
order of evaluating equations
29
P
Par/Param (parametric graphing
mode)
23
parentheses
30
Periodic Table
52
Pol/Polar (polar graphing mode)
23
polar graphing
mode (Pol/Polar)
23
Polynomial Root Finder and
Simultaneous Equation
Editor
52
Probability Simulation
52
R
Radian angle mode
22
re^(qi) (polar complex mode)
24
Real mode
24
rechargeable batteries
status
57
troubleshooting
57
S
Sci (scientific notation mode)
21
Science Tools
53
scientific notation
32
screen modes
24
second cursor (2nd)
14
Seq (sequence graphing mode)
23
Index 69

setting
display contrast
8
modes
19
Simul (simultaneous graphing order
mode)
24
SmartPad™ CE App
53
spinner
35
status
LED indicator
57
rechargeable batteries
57
status bar
11
storing
TI-84 Plus CE Charging Stations
58
T
TI-84 Plus CE Charging Stations
55
storing
58
TI-Innovator™ Hub
54
TI-SmartView™ CE
55
TI Connect™ CE
55
TI Rechargeable Batteries
charging
57
Transformation Graphing
54
troubleshooting
57
U
Un/d
25
UnArchive
47
V
variables
complex
45
displaying and storing values
47
graph databases
45
graph pictures
45
list
45
matrix
45
real
45
types
45
user and system
46
Vernier EasyData™
54
70 Index