Loading ...
Loading ...
Loading ...
Benchmarking SSD read and write
performance is straightforward,
reected on manufacturer data
sheets. Usually, evaluation with
mixed-load scenarios is left to
independent testing, with some
results available in third-party
reviews. Which metrics best gauge
data center SSD performance?
Cost per gigabyte was the
traditional measure of an HDD. For
client SSDs, cost per gigabyte is
somewhat applicable when directly
replacing an HDD, but omits IOPS
and other advantages. Cost per
gigabyte gures skew in favor of
large HDD capacities, an artifact
from an era of relatively expensive
ash. SSDs have made huge
strides with reduced ash cost and
increased capacity, a trend that will
continue with V-NAND.
IOPS per dollar and IOPS per watt
are popular metrics for SSDs.
They capture the advantage SSDs
provide in transactional speed and
power consumption compared to
HDDs. However, neither accounts
for important dierences between
client and data center SSDs.
In high-value data use, the deciding
metric for data center SSDs is
quality of service (QoS). With high
IOPS ratings a given with state-
of-the-art data center SSDs, QoS
accounts for latency, consistency,
and queue depth. Even short
periods of non-responsiveness are
generally unacceptable in high-
value data environments. Testing
for mixed-load QoS can quickly
discriminate a client SSD from a
data center SSD.
QoS implies a baseline where
essentially all pending requests,
often stated in four- or ve-nines
(99.99%, or 99.999%), nish within
a maximum allotted response
time. Peak performance becomes
a bonus, if favorable conditions
exist for a short period. Rather
than portray a high level of IOPS
only achievable under near-
perfect conditions, QoS reects
a consistent, reliable level of
performance.
Other considerations also highlight
the dierence between data
center SSDs and client SSDs:
TBW per dollar is an emerging
metric for data center SSDs. It
reects the value of longevity in
write-intensive and high-value data
scenarios, especially for V-NAND-
based data center SSDs with their
greatly increased write endurance.
Client SSDs generally sit idle,
and rarely incorporate power
fail protection for cost reasons.
Data center SSDs are likely under
signicant load for a much higher
percentage of time;
idle power becomes a
valley minimum against
a baseline of average
power consumption.
Write amplication – a
complex phenomenon
where logical blocks
may be written multiple
times to physical blocks
to satisfy requirements
such as wear leveling
and garbage collection
– can mean while the
host thinks a transfer is
complete, the SSD is still
dealing with writes. Data
center SSDs with advanced ash
controllers are designed to reduce
write amplication to near 1, as
part of maintaining QoS.
The number of available SATA
3 host ports is massive. V-NAND-
based SATA 3 SSDs can saturate
the interface with sustained
transfers, especially for large block
sizes. This does not automatically
imply SATA 3 is a bottleneck; data
center SSD upgrades often target
a slower, tapped-out SATA HDD
or inconsistent client SSDs. The
ultimate solution may be SATA
Express with its co-mingling of
SATA devices and NVMe devices,
which are just beginning to appear.
Data center SSDs are designed
to provide the best combination
of value, performance, and
consistency while mitigating
risk factors common in IT
environments. When high-value
data must be counted on, day in
and day out, data center SSDs with
better QoS gures are the best
choice.
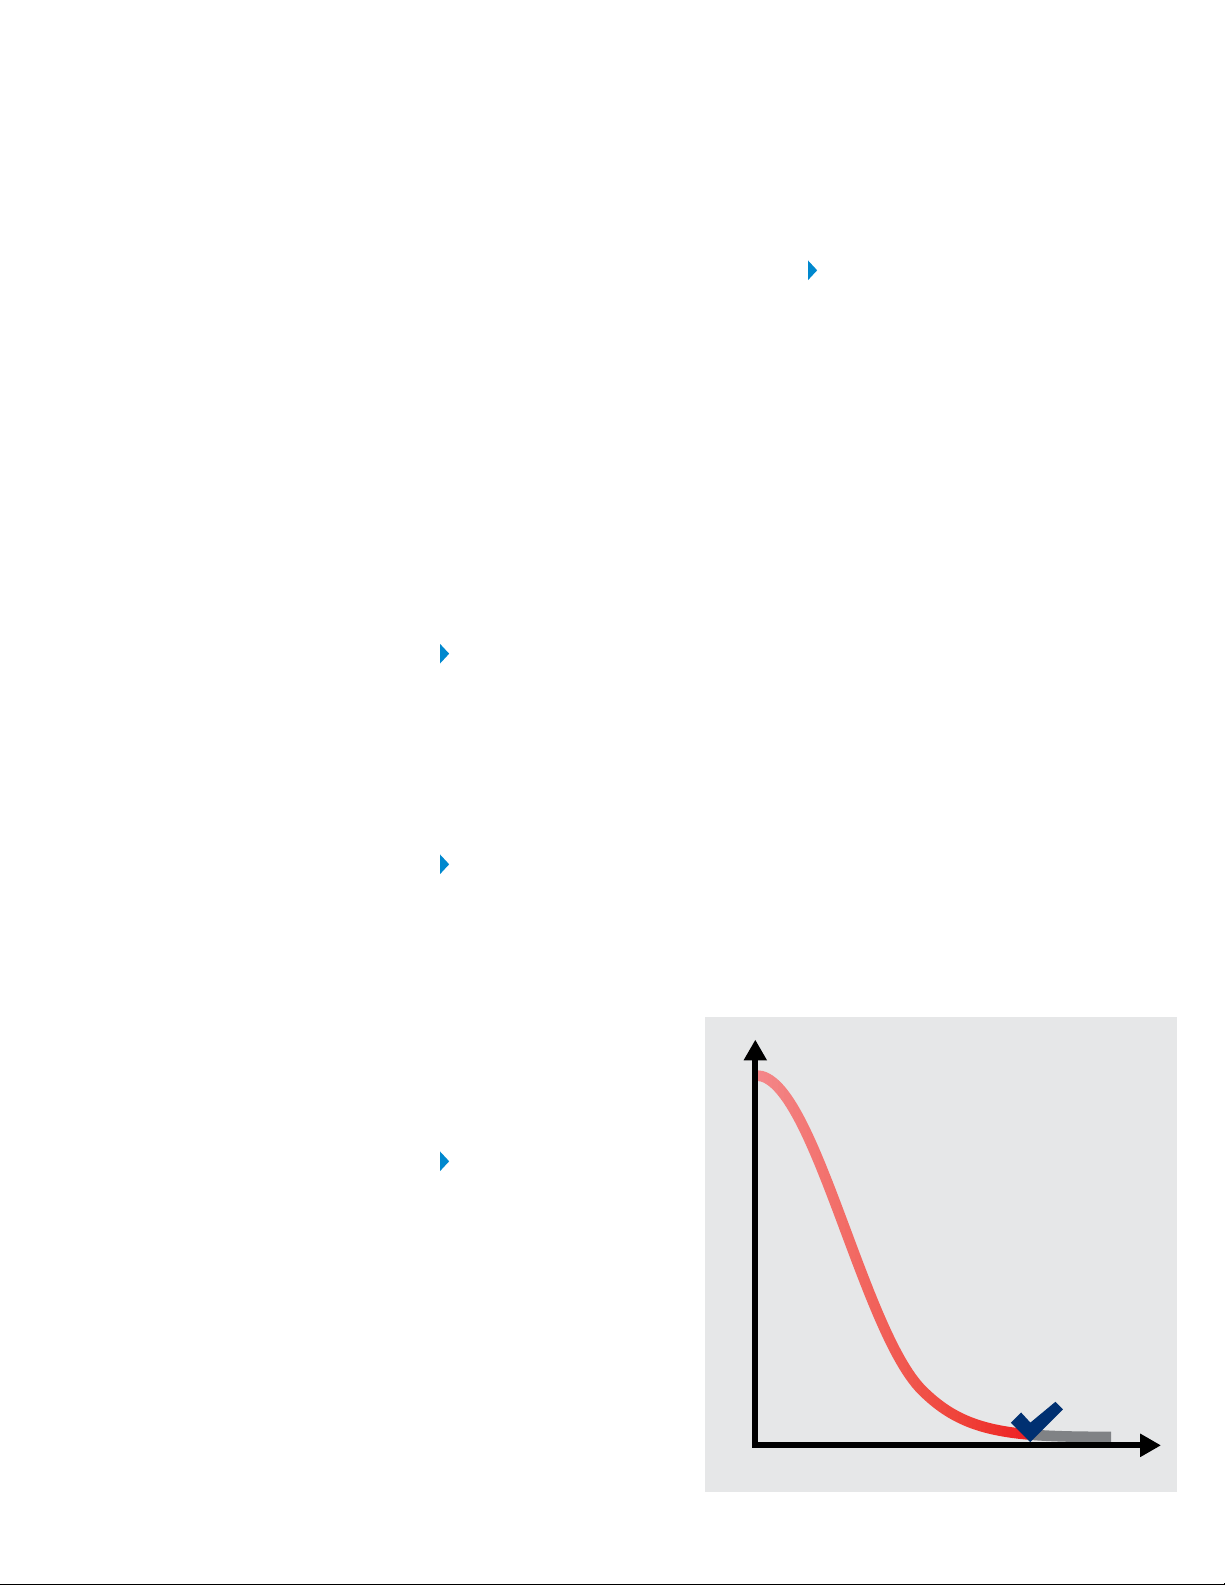
WHY QOS MATTERS MOST IN HIGH
-
VALUE DATA
Response Time
Transaction Requests
QoS
Quality of Service
Loading ...