
Loading ...
Loading ...
Loading ...
Viewing Your Predicted Race Times
For the most accurate estimate, complete the user profile setup
(Setting Up Your User Profile, page 20), and set your
maximum heart rate (Setting Your Heart Rate Zones, page 20).
Your device uses the VO2 max. estimate (About VO2 Max.
Estimates, page 17) and published data sources to provide a
target race time based on your current state of fitness. This
projection also presumes you have completed the proper
training for the race.
NOTE: The projections may seem inaccurate at first. The device
requires a few runs to learn about your running performance.
1
Select UP or DOWN to view the performance widget.
2
Select to scroll through the performance measurements.
Your projected race times appear for 5K, 10K, half marathon,
and marathon distances.
About Training Effect
Training Effect measures the impact of an activity on your
aerobic and anaerobic fitness. Training Effect accumulates
during the activity. As the activity progresses, the Training Effect
value increases, telling you how the activity has improved your
fitness. Training Effect is determined by your user profile
information, heart rate, duration, and intensity of your activity.
Aerobic Training Effect uses your heart rate to measure how the
accumulated intensity of an exercise affects your aerobic fitness
and indicates if the workout had a maintaining or improving
effect on your fitness level. Your EPOC accumulated during
exercise is mapped to a range of values that account for your
fitness level and training habits. Steady workouts at moderate
effort or workouts involving longer intervals (>180 sec) have a
positive impact on your aerobic metabolism and result in an
improved aerobic Training Effect.
Anaerobic Training Effect uses heart rate and speed (or power)
to determine how a workout affects your ability to perform at
very high intensity. You receive a value based on the anaerobic
contribution to EPOC and the type of activity. Repeated high-
intensity intervals of 10 to 120 seconds have a highly beneficial
impact on your anaerobic capability and result in an improved
anaerobic Training Effect.
It is important to know that your Training Effect numbers (from
0.0 to 5.0) may seem abnormally high during your first few
activities. It takes several activities for the device to learn your
aerobic and anaerobic fitness.
You can add Training Effect as a data field to one of your
training screens to monitor your numbers throughout the activity.
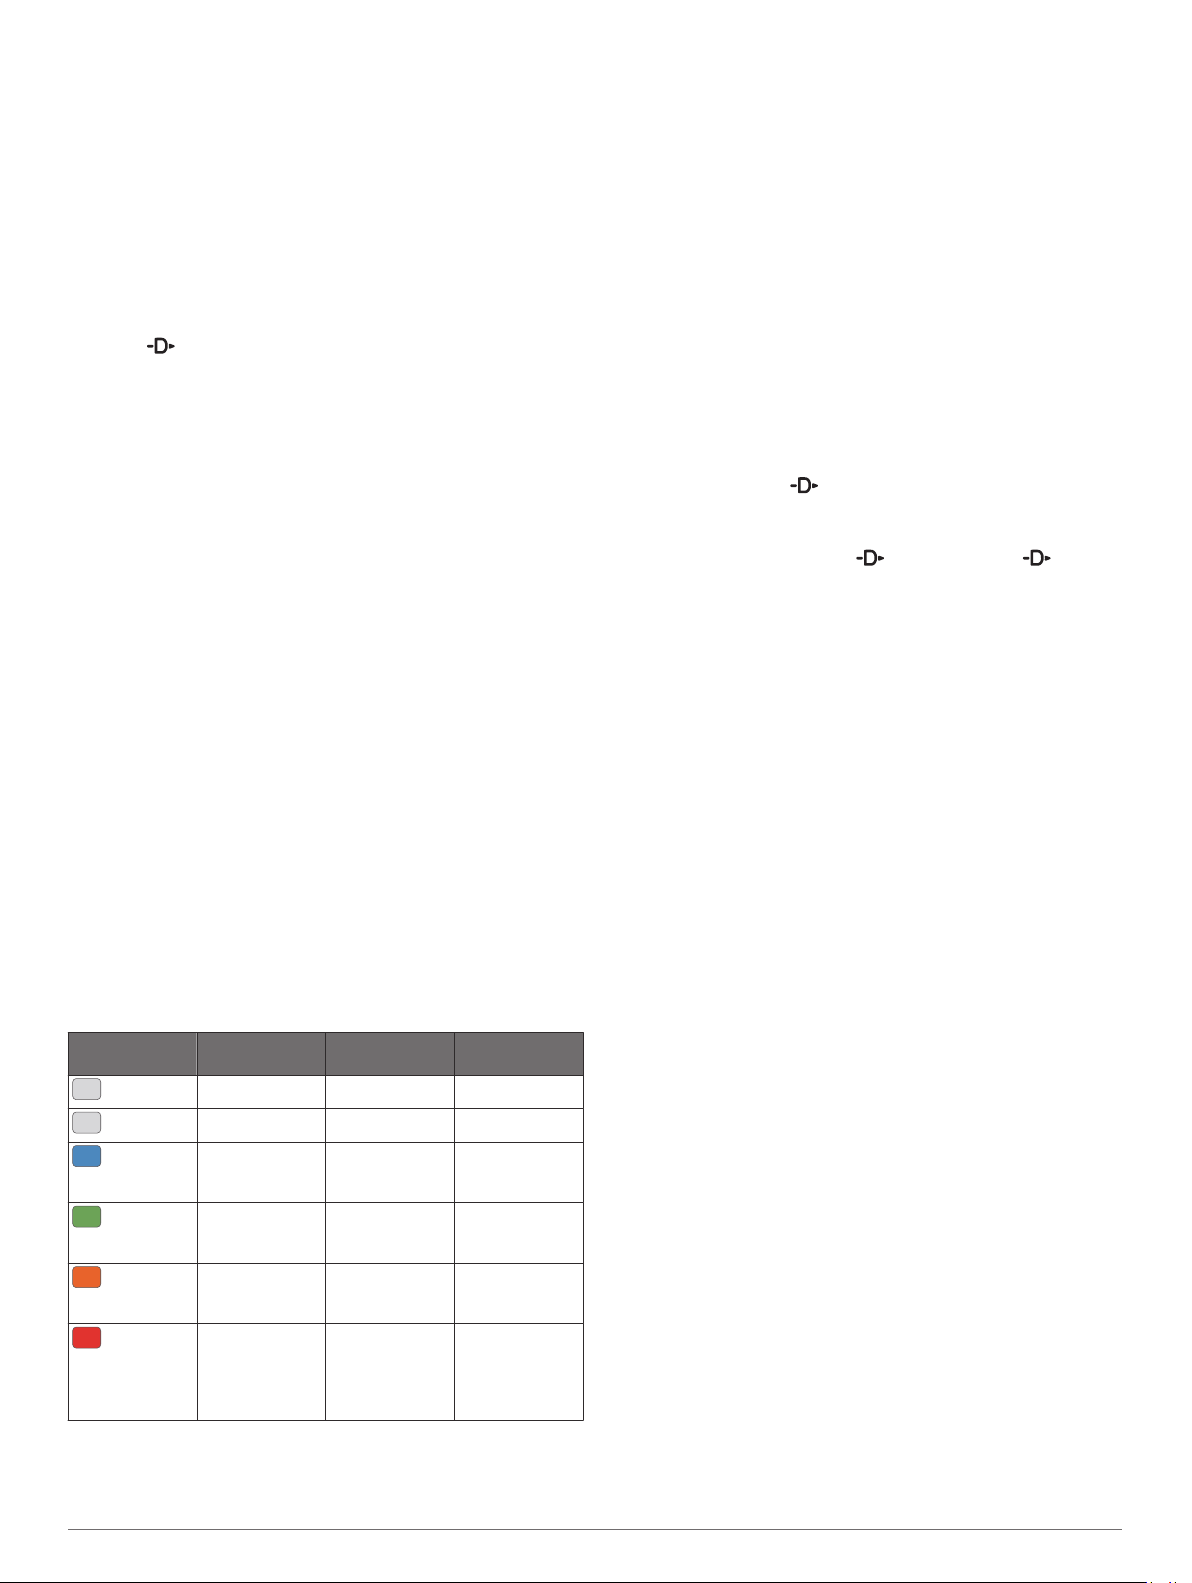
Color Zone Training Effect Aerobic Benefit Anaerobic
Benefit
From 0.0 to 0.9 No benefit. No benefit.
From 1.0 to 1.9 Minor benefit. Minor benefit.
From 2.0 to 2.9 Maintains your
aerobic fitness.
Maintains your
anaerobic
fitness.
From 3.0 to 3.9 Improves your
aerobic fitness.
Improves your
anaerobic
fitness.
From 4.0 to 4.9 Highly improves
your aerobic
fitness.
Highly improves
your anaerobic
fitness.
5.0 Overreaching
and potentially
harmful without
enough recovery
time.
Overreaching
and potentially
harmful without
enough recovery
time.
Training Effect technology is provided and supported by
Firstbeat Technologies Ltd. For more information, go to
www.firstbeat.com.
Heart Rate Variability and Stress Level
Stress level is the result of a three-minute test performed while
standing still, where the D2 device analyzes heart rate variability
to determine your overall stress. Training, sleep, nutrition, and
general life stress all impact how a runner performs. The stress
level range is from 1 to 100, where 1 is a very low stress state
and 100 is a very high stress state. Knowing your stress level
can help you decide if your body is ready for a tough training run
or yoga.
Viewing Your Heart Rate Variability and Stress Level
This feature requires a Garmin chest heart rate monitor. Before
you can view your heart rate variability (HRV) stress level, you
must put on a heart rate monitor and pair it with your device
(Pairing Your Wireless Sensors, page 35). If your D2 Delta/
Delta S/Delta PX device was packaged with a heart rate
monitor, the devices are already paired.
TIP: Garmin recommends that you measure your stress level at
approximately the same time and under the same conditions
every day.
1
If necessary, select > Add > HRV Stress to add the
stress app to the apps list.
2
Select Yes to add the app to your list of favorites.
3
From the watch face, select > HRV Stress > .
4
Stand still, and rest for 3 minutes.
Performance Condition
As you complete your activity, such as running or cycling, the
performance condition feature analyzes your pace, heart rate,
and heart rate variability to make a real-time assessment of your
ability to perform compared to your average fitness level. It is
approximately your real-time percentage deviation from your
baseline VO2 max. estimate.
Performance condition values range from -20 to +20. After the
first 6 to 20 minutes of your activity, the device displays your
performance condition score. For example, a score of +5 means
that you are rested, fresh, and capable of a good run or ride.
You can add performance condition as a data field to one of
your training screens to monitor your ability throughout the
activity. Performance condition can also be an indicator of
fatigue level, especially at the end of a long training run or ride.
NOTE: The device requires a few runs or rides with a heart rate
monitor to get an accurate VO2 max. estimate and learn about
your running or riding ability (About VO2 Max. Estimates,
page 17).
Viewing Your Performance Condition
This feature requires wrist-based heart rate or a compatible
chest heart rate monitor.
1
Add Perform. Cond. to a data screen (Customizing the Data
Screens, page 28).
2
Go for a run or ride.
After 6 to 20 minutes, your performance condition appears.
3
Scroll to the data screen to view your performance condition
throughout the run or ride.
Lactate Threshold
Lactate threshold is the exercise intensity at which lactate (lactic
acid) starts to accumulate in the bloodstream. In running, it is
the estimated level of effort or pace. When a runner exceeds the
threshold, fatigue starts to increase at an accelerating rate. For
experienced runners, the threshold occurs at approximately 90%
of their maximum heart rate and between 10k and half-marathon
race pace. For average runners, the lactate threshold often
occurs well below 90% of maximum heart rate. Knowing your
lactate threshold can help you determine how hard to train or
when to push yourself during a race.
18 Heart Rate Features
Loading ...
Loading ...
Loading ...