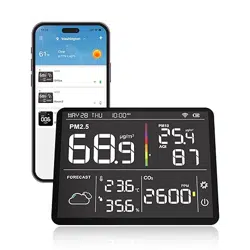

LKC-1000 Series
Air Quality Monitor
User Manual

PM2.5 (Particulate Matter 2.5) refers to fine
particles with diameter of 2.5 micrometers
or less. Due to its tiny size, PM2.5 can be
absorbed into bloodstream and the lungs, so
that long-term exposure to high concentration
of PM2.5 environment may cause eye and
nose irritation, cough, asthma, emphysema,
lung disease, heart attacks, cancer and etc.
PM10
(Particulate Matter 10) refers to particulates
with a diameter of 10 micrometers or less. Due
to the larger size, it's inhalable but penetrates
no further than bronchi as larger particles can
be filtered out by cilia and mucus of nose and
throat. It usually considered as less harmful
to health than PM2.5.
TVOC
(Total Volatile Organic Compounds) refers
to various common VOCs including benzene,
toluene, styrene, formaldehyde and etc. Due
to their volatility as well as toxicity, irritability
and carcinogenicity, long-term exposure to
TVOCs can cause damage to the skin, liver,
kidneys,central nervous system and etc.
Temperature & Humidity may often be
ignored however they do have a significant
impact on individual's well-being, comfort,
health and safety as well as your property.
High humidity may lead to an increase in
HCHO
(Formaldehyde) is a colorless and strong-
smelling chemical with formula CH2O or H-CHO,
which has been classified by IARC as Group
1 carcinogen due to its significant dangers to
human health. Long-term exposure to just low
doses could cause chronic respiratory diseases,
nasopharyngeal cancer, colon cancer,brain
tumors,nuclear gene mutations and etc.
Factory Aecting Air Quality
1

household air pollutants especially the
biological contaminants such as molds, bacteria,
viruses and dust mites; cold, low humidity
may cause nosebleeds, skin and respiratory
irritations, dyspnea, static electricity and etc.
AQI
(Air Quality Index) is a quick guide on air
quality levels.It aims to indicates how clean
or polluted the air is in a way that's easy to
understand.It ranges from 0 to 500 that higher
values indicate higher air pollution levels and
more adverse for health.AQI assessment can
indicated for PM
2.5, PM10, O3, SO2, NO2, CO etc.
Temtop follows EPA Standards to calculate and
focus only for AQI of PM2.5&10.
★
It is usual for the detector to show higher values when
first switched on or not used for an extended period.
Please place it in a ventilated area and turn it on for
around 30 minutes before testing.
★ Do not put the detector in an environment with
formaldehyde (HCHO) concentration above 1.0mg/m
3
or PM concentration above 500ug/m
3
for a long time.
Otherwise, the sensor may be damaged and cannot
run normally.
★ Do not come into contact with organic solvents, which
include silica gel and other adhesives, paintings, drugs,
oil and high-concentration gases.
★ Do not use the detector in a humid environment to
maintain detection accuracy.
★ Do not cover the air inlet / outlet when using the
detector.
★ Be cautious of cross interference by ethanol, benzene,
ammonia, etc.
Important!
2
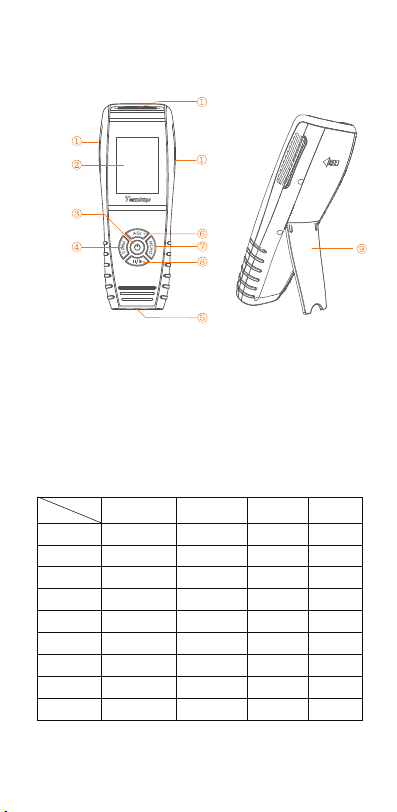
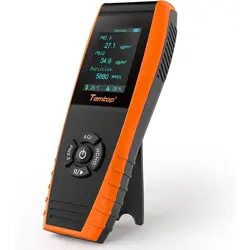
Overview
Function
① Air Inlet/Outlet ② LCD Screen ③ Power Button
④ PM2.5/PM10/Particles Button ⑤ USB Port
⑥ AQI/TEMP/HUM/Up Button ⑦ HCHO/TVOC Button
⑧ Running/Hold/Setting/Down Button ⑨ Bracket
Function
PM2.5
PM10
HCHO
Particle Count
AQI
Data Export
√
√
√
√
√
√
√
√
√
√
√
√
√
√
√
√
√
√
√
√
√
√
√
LKC-1000S
LKC-1000S+
LKC-1000S+
2nd
Model
3
LKC-1000S 2nd
√
√
√
√
√
√
√
TVOC
TEMP&HUM
Histogram

Specifications
Operation
Warning!
★ Indoor use: Keep the room/area airtight for 10
minutes to obtain more accurate results.
★ If battery level shows , please charge the detector
promptly to avoid eects during use (also chargeable
when turned o).
*For LKC-1000S+ /LKC-1000S+2nd Only
Note: The above data are from Temtop Laboratory.
Model
Dimensions
Battery Capacity
Battery Life
Charging Output
Display
Weight
Operating
Environment
PM2.5
PM10
HCHO
TVOC*
LKC-1000 Series
177*65.5*32mm (6.9*2.6*1.2 in)
3000mAh
15-18h @ Backlight Level 2
DC5V, 1A
TFT color LCD screen
About 219g (0.48lb)
Temperature: 0~50°C
(32~122°F)
Humidity: 0~90%RH
Measuring range: 0-999ug/m
3
Resolution: 0.1ug/m
3
Accuracy: ±10µg/m
3
(0-100µg/m
3
)
±10%(100-500µg/m
3
)
Measuring range: 0-999ug/m
3
Resolution: 0.1ug/m
3
Accuracy: ±15µg/m
3
(0-100µg/m
3
)
±15%(100-500µg/m
3
)
Measuring range: 0-2mg/m
3
Resolution: 0.01mg/m
3
Measuring range: 0-5mg/m
3
Resolution: 0.01mg/m
3
4
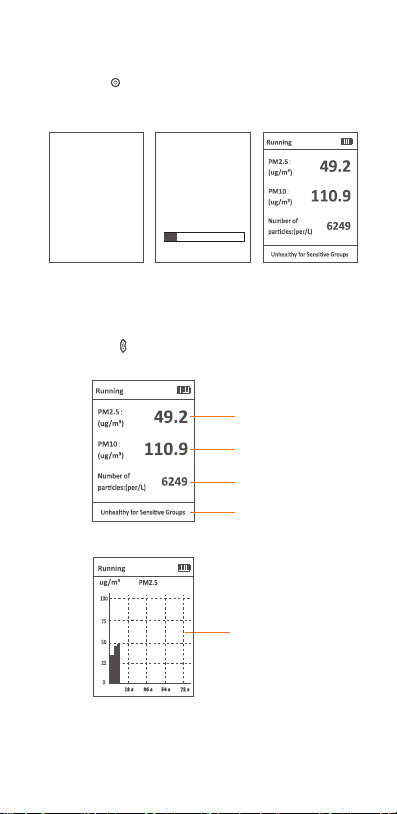
1.Switch On/O
PM2.5 Concentration
PM10 Concentration
Particle Count (For Ref)*
Air Quality Indicator
Press and hold button for 2 seconds to turn on/o the detector.
After initialization, the instrument enters the default interface.
2.Detection
2.1 PM2.5 Button
Please click the button to view the following four interfaces.
PM2.5 Graph View
�� s �� s �� s �� s
5
Temtop
Air quality detector
Notice
Do not place detector in
heavily polluted
environments for a long time,
or it may cause damages to
the sensor.
15%
* The particle counts are for reference only. For accurate particle counts
please choose a professional particle counter from Temtop.
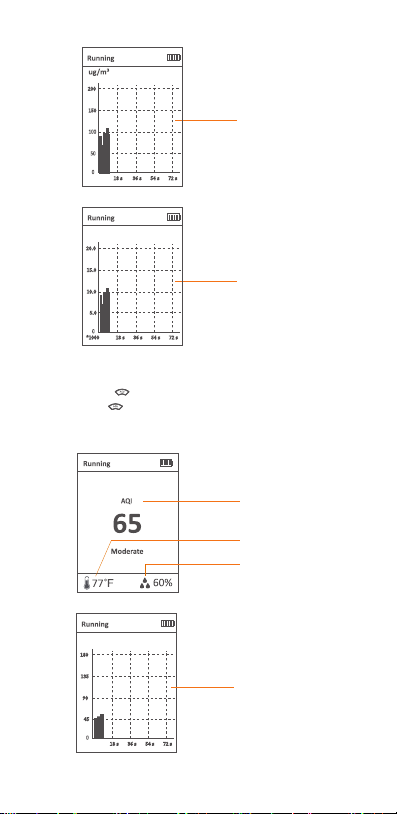
2.2 AQI Button
Please click the button to view the following four interfaces.
Press and hold button for 2 seconds to switch between °C
or °F.
PM10 Graph View
Particle Graph View
PM10
���
���
�� s �� s �� s �� s
Particles
��.�
��.�
*���� �� s �� s �� s �� s
�.�
��.�
Per/L
6
AQI
Humidity
Temperature
AQI
���
���
�� s �� s �� s �� s
��
��
AQI Graph View
7
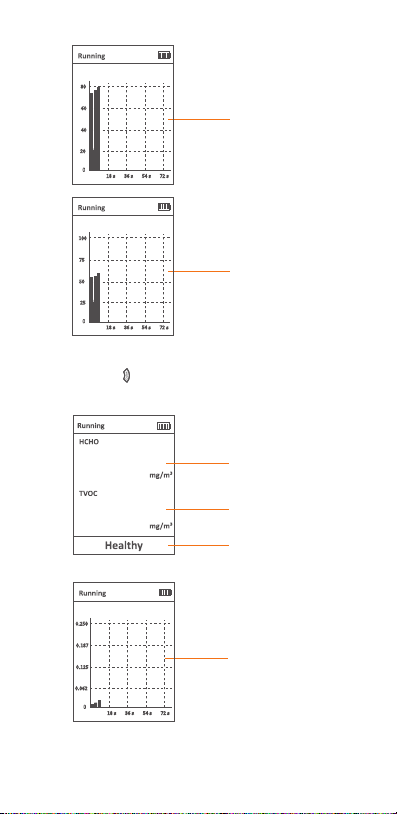
2.3 HCHO Button
Please click the button to view the following three interfaces.
TEMP Graph View
HUM Graph View
TEMP
��
��
�� s �� s �� s �� s
��
��
℉
HUM
��
���
�� s �� s �� s �� s
��
��
%
0.02
0.05
HCHO Concentration
HCHO Graph View
Humidity
TVOC Concentration
(LKC-1000S+/1000S+ 2nd)
HCHO
�.���
�.���
�� s �� s �� s �� s
�.���
�.���
mg/m
3
8
Note:
1) Please click "II/ " button to switch between running mode and
holding mode.
In running mode, the detector always displays currently detected data.
In holding mode, the detector paused the detection function and will stop
updating data on the screen.
2) Data updates every 3 seconds when x axis value is within 72 seconds.
Data updates every 1 minute when x axis value is within 24 minutes.
Data updates every 5 minutes when x axis value is within 120 minutes.
Data updates every 30 minutes when x axis value is within 12 hours.
TVOC Graph View
(LKC-1000S+/1000S+ 2nd)
TVOC
�.���
�.���
�� s �� s �� s �� s
�.���
�.���
mg/m
3
▲
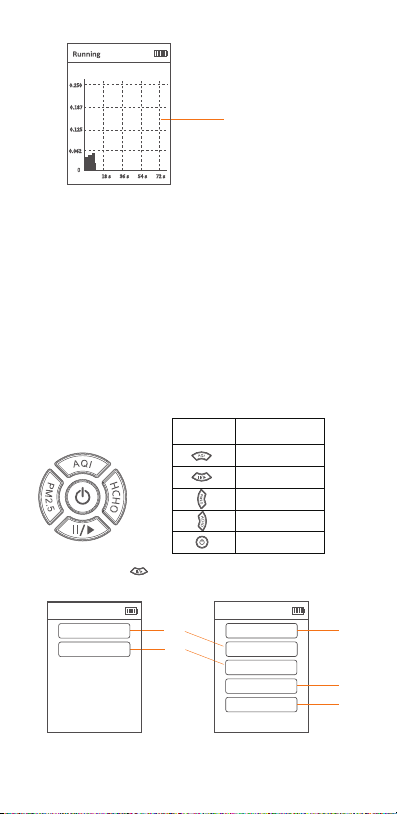
3.Settings Menu
Buttons
Date and Time
Power Saving
Data Export
Storage Interval
Calibration
Exit
Settings
Press and hold the button for 2 seconds in the main display of
"PM2.5, AQI, HCHO" to enter the system settings.
Button Setting Function
Up/Increase
Down/decrease
Left
Right
Confirm
3.1
3.2
Power Saving
Calibration
Exit
Settings
For LKC-1000S / LKC-1000S+ Only
3.3
3.4
3.5
For LKC-1000S 2nd/LKC-1000S+2nd Only
9
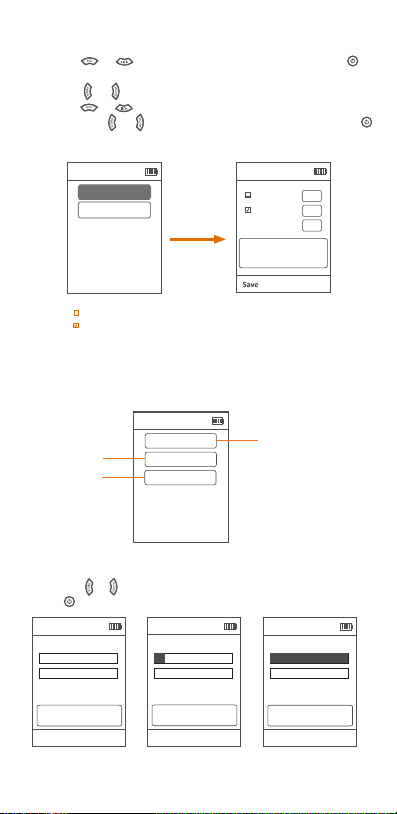
3.2 Calibration
In this interface, you will you can see figure below.
Power Saving
Auto Off(min)
001
Exit
Screen Off(min)
030
Backlight Level
5
HCHO
TEMP&HUM
Exit
Calibration
Note:
1. " Auto O(min) " : Auto power o function is not switched on.
2.
" Screen O(min) " : The screen will automatically switch o after 30 minutes.
3. The "Backlight Level" are divided into 0, 1, 2, 3, 4 and 5.
Press the AQI or ||/> button to set
the current value, press the PM2.5
or HCHO button to switch to the
next item.
3.1 Power Saving (Example Of Button Operation):
Press the or button to scroll up or down and press the
button to confirm.
Press the or button to switch to the item you want to set.
Press the or button to increase or decrease the current value.
Then press the or button to switch to save or exit, and press
button to save the setting or exit the interface.
PM2.5
Calibration
Exit
Settings
3.2.1
3.2.2
3.2.3
Power Saving
Calibration
Press the PM2.5 or HCHO button to
switch to the next item.
Exit
HCHO
Please ensure that you can calibrate
under fresh air outdoors.
Calibration zero
0%
Calibration
Exit
HCHO
Calibration in progress, please wait.
Calibrating
10%
Calibration
Exit
HCHO
Calibration Successful!
Successed
100%
Press the PM2.5 or HCHO button to
switch to the next item.
Press the PM2.5 or HCHO button to
switch to the next item.
3.2.1 HCHO Calibration
Press the or button to switch to the "Calibration zero" and
press button to calibrate.
10
3.2.2 TEMP & HUM Calibration
You can calibrate the temperature and humidity by modifying the
"OFF" value.
Formula :
OFF(TEMP target value) = TEMP(target value) - TEMP(current value) + OFF(TEMP current value).
OFF(HUM target value) = HUM(target value) - HUM(current value) + OFF(HUM current value).
Example:
If TEMP target value is 25.0, current value is 23.0, current value of OFF(TEMP) is -0.2.
Then "OFF(TEMP target value)=25.0-23.0+(-0.2)=+1.8".
If HUM target value is 36.0, current value is 33.0, current value of OFF(HUM) is +1.5.
Then "OFF(HUM target value)=36.0-33.0+(+1.5)=+4.5".
Note:
1. Please ensure that you can calibrate under fresh air outdoors.
2. During the calibration process, please do not perform other operations until the
calibration is successful and you return to the previous level screen.
Calibration
Exit
Save
Pleass ensure that the reading is
stable before calibration.
TEMP: 23.0 °C
OFF: -0.2 °C
HUM: 33.0 %rh
OFF: +1.5 %rh
Calibration
Exit
Save
Pleass ensure that the reading is
stable before calibration.
TEMP: 25.0 °C
OFF: +1.8 °C
HUM: 36.0 %rh
OFF: +4.5 %rh
Increase "OFF(TEMP)" to +1.8°C
Increase "OFF(HUM)" to +4.5%rh
Press the AQI or ||/> button to set
the current value, press the PM2.5
or HCHO button to switch to the
next item.
Press the AQI or ||/> button to set
the current value, press the PM2.5
or HCHO button to switch to the
next item.
Formula :
K(target value) = PM2.5(target value) / PM2.5(current value) * K(current value).
Example:
If PM2.5 target value is 30.0µg/m
3
, current value is 49.2µg/m
3
, current value of
K is 1.00. Then "K(target value) = 30.0/49.2 * 1.00 = 0.61".
3.2.3 PM2.5 Calibration
You can calibrate the PM2.5 value by adjusting the "K" factor.
Calibration
Exit
Save
PM2.5:
PM2.5: 49.2 ug/m
3
K: 1.00
The larger the K value, the greater
the display value.
Calibration
Exit
Save
PM2.5:
PM2.5: 30.0 ug/m
3
K: 0.61
The larger the K value, the greater
the display value.
Decrease "K" to 0.61
Press the AQI or ||/> button to set
the current value, press the PM2.5
or HCHO button to switch to the
next item.
Press the AQI or ||/> button to set
the current value, press the PM2.5
or HCHO button to switch to the
next item.
Note: For products calibrated according to ISO standard, K coecient is 1 by
default. It is only recommended that professional engineers perform this
adjustment under standard conditions with standard laboratory, or test bin
facilities. At the same time, the calibration environment required for P2.5 is
relatively high, and the calibration results will be aected by factors such as
dust/particle size and dierent configurations of standard warehouse
facilities, etc, so it is strongly recommended that you use this function only
under essential conditions or contact us to better support your special needs.
11
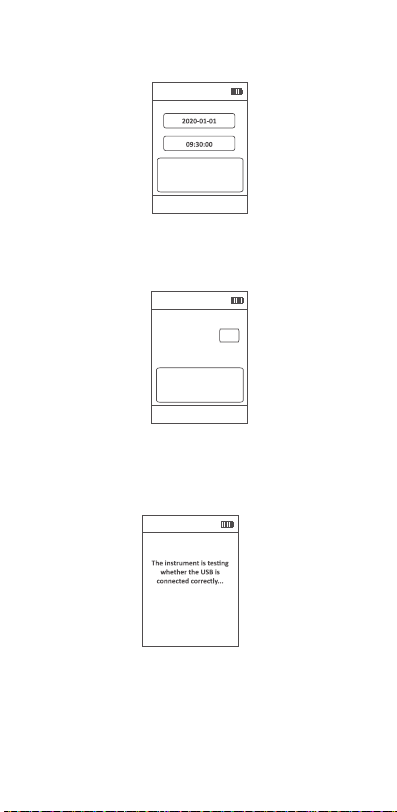
3.3 Date and Time
In this interface, you will see the figure below.
3.4 Storage Interval
In this interface, you will see the figure below.
Storage Interval
Exit
Save
Interval(Min) 60
Note: The recording intervals are divided into 01, 05, 10, 30, and 60 min.
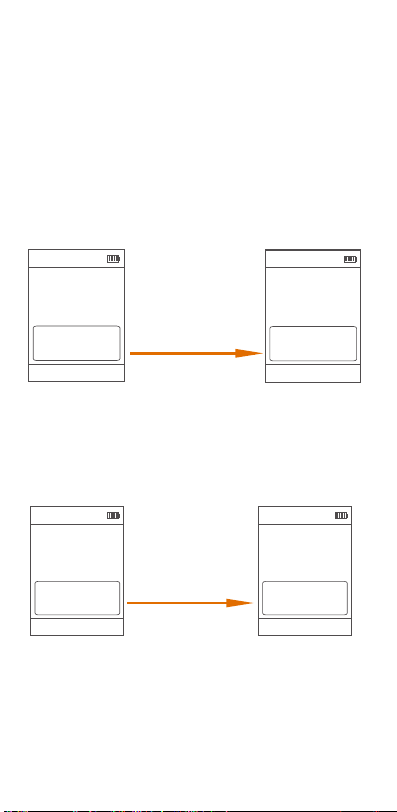
3.5 Data Export *
In this interface, you will see the following tips.
Export
Press the AQI or ||/> button to set
the current value, press the PM2.5
or HCHO button to switch to the
next item.
* For LKC-1000S 2nd /LKC-1000S+ 2nd Only.
Date and Time
Exit
Save
Press the AQI or ||/> button to set
the current value, press the PM2.5
or HCHO button to switch to the
next item.
12
Note: USB connected successfully. During the data export process,
please do not unplug the USB. If you want to exit the USB connection
mode, press the button!
After copying and viewing historical data, please press to exit
(see figure below).
Export
Successfully exit the USB
connection, return to the
menu, please wait!
Export
USB connected
successfully. During the
data export process, please
do not unplug the USB. If
you want to exit the USB
connection mode, press the
'HCHO' button!
Export
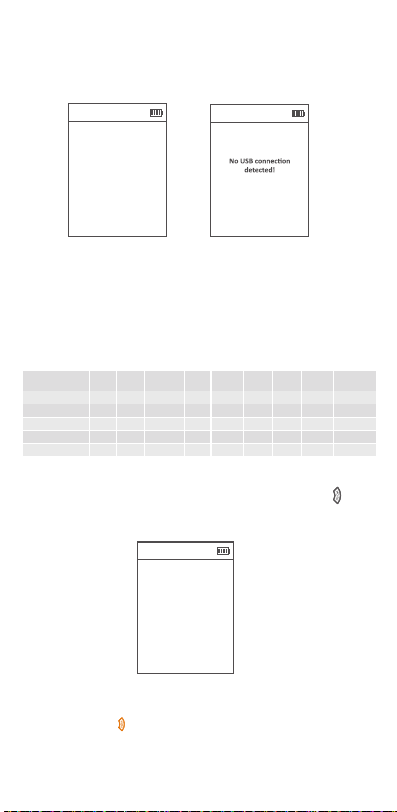
If connected to the computer successfully by the USB cable,
the detector will pop up a tip USB connection successful; If
not, it will remind you of the failure (See the figures below).
After successful connection, the detector creates a removable
storage device "TEMTOP" on the computer, which contains a
folder named "HISTORY". This history folder contains a history
file named after the time, e.g. "20230601". The history file is in
CSV format and lists information such as date, PM2.5, PM10,
PARTICLES, AQI, HCHO, TVOC, Temperature, Humidity, etc.
(
see figure below). Please save it to your computer for viewing.
DATE
2023/6/1 9:01:40
2023/6/1 9:02:40
2023/6/1 9:03:40
2023/6/1 9:04:40
2023/6/1 9:05:40
34.6
36.6
34.1
35
35.3
56.3
61.6
56.6
56.8
57.7
5277
5228
5218
5288
5341
98
103
97
99
93
0.04
0.03
0.04
0.04
0.04
0.17
0.14
0.16
0.16
0.17
26
26
26
26
26
61.4
61.4
61.4
61.4
61.4
C
C
C
C
C
PM2.5 PM10 HCHO TVOC* HUMI
AQI
TEMPUNIT
TEMP
(µg/m
3
) (µg/m
3
) (mg/m
3
) (mg/m
3
) (%)
PARTICLES
* For LKC-1000S 2nd /LKC-1000S+ 2nd Only.

*Refers to EPA standards,with PM2.5 as the main responsible pollutant.
13
Q: Why data reading is unstable?
A:If the airflow in the current sampling space is in an unstable
state, such as strong wind, the concentration of particulate matter
in the air will be unevenly distributed, and will vary greatly with the
surrounding airflow, resulting in large dierences in measured values.
Q: Why humidifiers can cause rising particulate matter readings?
A: Our sensors use the principle of light scattering. When using a
humidifier, the humidifier will spray many small droplets of water.
Excessive humidity and moisture in the air will cause dust particles
to absorb water and swell, which will aect the scattering of light
and cause deviations in sensor readings.
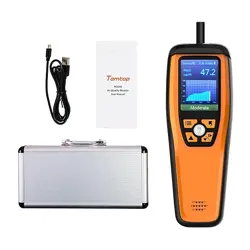
LKC-1000 Series Detector x 1
USB Cable x 1
User Manual x 1
Air Quality Parameter for Reference
What's Included
(µg/m
3
)
≤12
≤54
≤50
12.1~35.4
55~154
51~100
35.5~55.4
155~254
101~150
55.5~150.4
255~354
151~200
150.5~250.4
355~424
201~300
≥250.5
≥425
≥301
Status
Good Moderate
Unhealthy Hazardous
Very
Unhealthy
Unhealthy
for Sensitive
Groups
Pollutant
PM2.5
(µg/m
3
)
PM10
AQI*
FAQ
≤0.1
≤0.5
>0.1
>0.5
Status
Pollutant
HCHO
Healthy Unhealthy
(mg/m
3
)
TVOC (mg/m
3
)
Q: Why is the data high after booting?
A: The reason why the data is high when you first turn on the
sensor is that when the sensor starts to work, the fan will run
at full speed, and it will take a while (about 1-2 minutes) for
the fan to run stably. At this time, the airflow in the air duct
will be stable, and the data will gradually become stable.
Q: AQI/ PM2.5 and other values, why the measured value is
inconsistent with the ocial announcement?
A: The AQI/PM2.5 shown on the display is a measurement

14
Q: Which the HCHO reading inaccurate or overestimated at
some points?
A: As Temtop uses a high-precision electrochemical HCHO
sensor, its electrochemical reaction characteristics could also
respond to other gases besides formaldehyde.This table lists
the most common gases that interfere with relative sensitivities
of HCHO sensor.
Temtop warrants the included detector for 1 year from the date
of original purchase. The item can be exchanged or returned
within 30 days if the defect is not caused by artificial damage.
Temtop warranty does NOT include:
•Malfunction or damages caused by artificial damage or
modification.
•Other deliberate damages.
•Damage caused by natural events.
Before return or delivery for repair, please check if the following
items are ready:
Warranty
Detector
Accessories
Item
1 year included
N/A
Warranty Period
Return
Exchange
Repair
Detector &
Accessories
√
√
√
Complete
Package
√
√
Proof of
Purchase*
√
√
√
Gift (if any)
√
* Including invoice, order number and etc.
Carbon monoxide(CO)
Hydrogen (H
2)
Ethyl alcohol
Phenols
Sulphur dioxide( SO
2)
Ammoniak (NH
3)
Interference Gas
1
0.1
50
7
12
0
Relative Sensitivity (%)
of the space where the device is located. The measured value
published on the Internet or ocial websites is the average
value of several monitoring points, and each measurement
point will be dierent. At the same time, according to the
regulations of EPA and WHO, the AQI value is calculated
based on the highest value among the five pollutants in the
atmosphere on that day. In the past ten years, the local AQI
in the United States has basically been calculated with the
value of PM2.5/10, and sometimes with the value of O
3.

Elitech Technology, Inc.
2528 Qume Dr, Ste 2
San Jose, CA 95131 USA
Tel: (+1) 408-898-2866
Sales: [email protected]
Website: www.temtopus.com
Elitech (UK) Limited
Unit 13 Greenwich Business Park,
53 Norman Road,London, SE10 9QF
Tel: (+44)208-858-1888
Support: [email protected]
Website: www.temtop.co.uk
Elitech Brazil Ltda
R.Dona Rosalina,90-Lgara, Canoas-RS
92410-695,Brazil
Tel: (+55)51-3939-8634
Sales: [email protected]
Website: www.elitechbrasil.com.br
V1.4