Loading ...
Loading ...
Loading ...
33
LAUNCH
TOUCH PRO ELITE User Manual
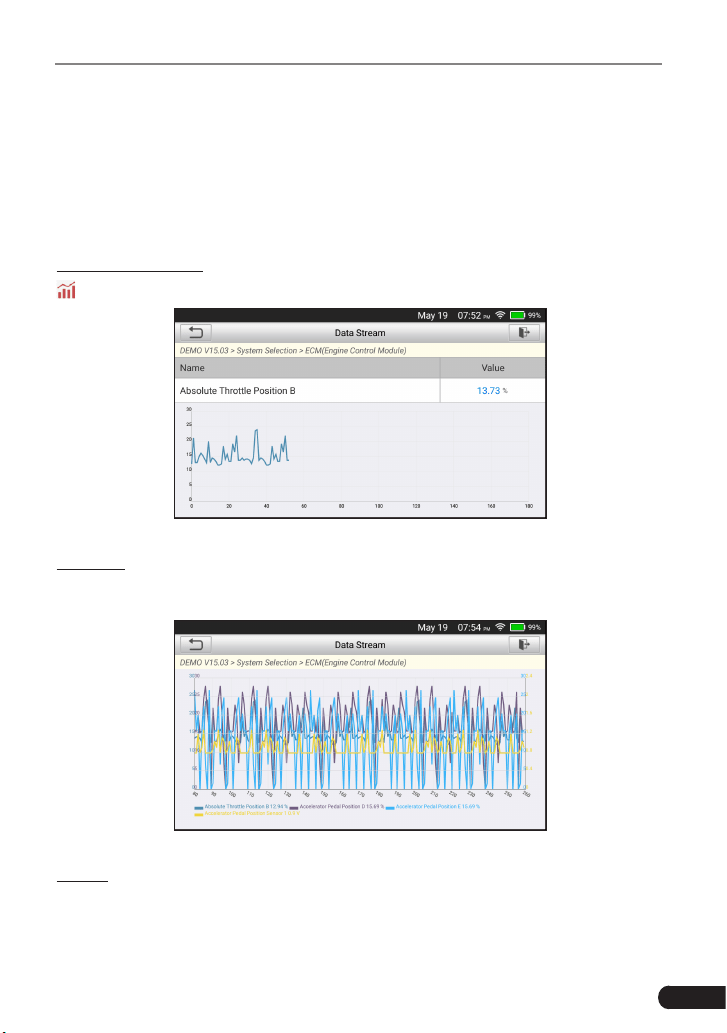
There are 3 types of display modes available for data viewing, allowing you to
view various types of parameters in the most suitable way.
• Value – this is the default mode which displays the parameters in texts and
shows in list format.
• Graph – displays the parameters in waveform graphs.
• Combine – this option is mostly used in graph merge status for data
comparison. In this case, dierent items are marked in dierent colors.
On-screen Buttons:
: Tap it to view the waveform graph of the current data stream item.
Fig. 5-10
Combine: Tap it, a list of the data stream items will appear on the screen. Select
the necessary items (Max. 4 items can be selected at the same time) and the
screen will display the waveforms corresponding to these items immediately.
Fig. 5-11
Report: Tap to save the current data as a diagnostic report. All diagnostic reports
can be accessed from
Data
->
Diagnostic Report
. The tool logs the Date of
Report (the date and time at which the report was created) and assigns a unique
Report #.
Loading ...
Loading ...
Loading ...