Loading ...
Loading ...
Loading ...
44
Automotive Diagnostic & TPMS Scanner NT819TS User's Manual V1.0
3. Swipe the screen up and down to view additional information when
necessary.
4. To move a data line to the top of Data List screen, just tap the line to select
and then press the button To Top. To view data records or test reports,
and press the button History. To make records of live data, just tab the
button Record, and press Pause to stop recording at any time. To save
the data, tap the Save icon.
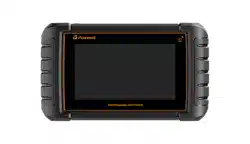
5. To view live PID in graph format, press the tab Graph, and the plot
displays. To view another PID plot, tab the name of a plot and a list of
available PIDs display. Select one from the dropdown box and the plot
changes to the newly selected PID.
Figure 9-20 Sample PID Graph Screen
●
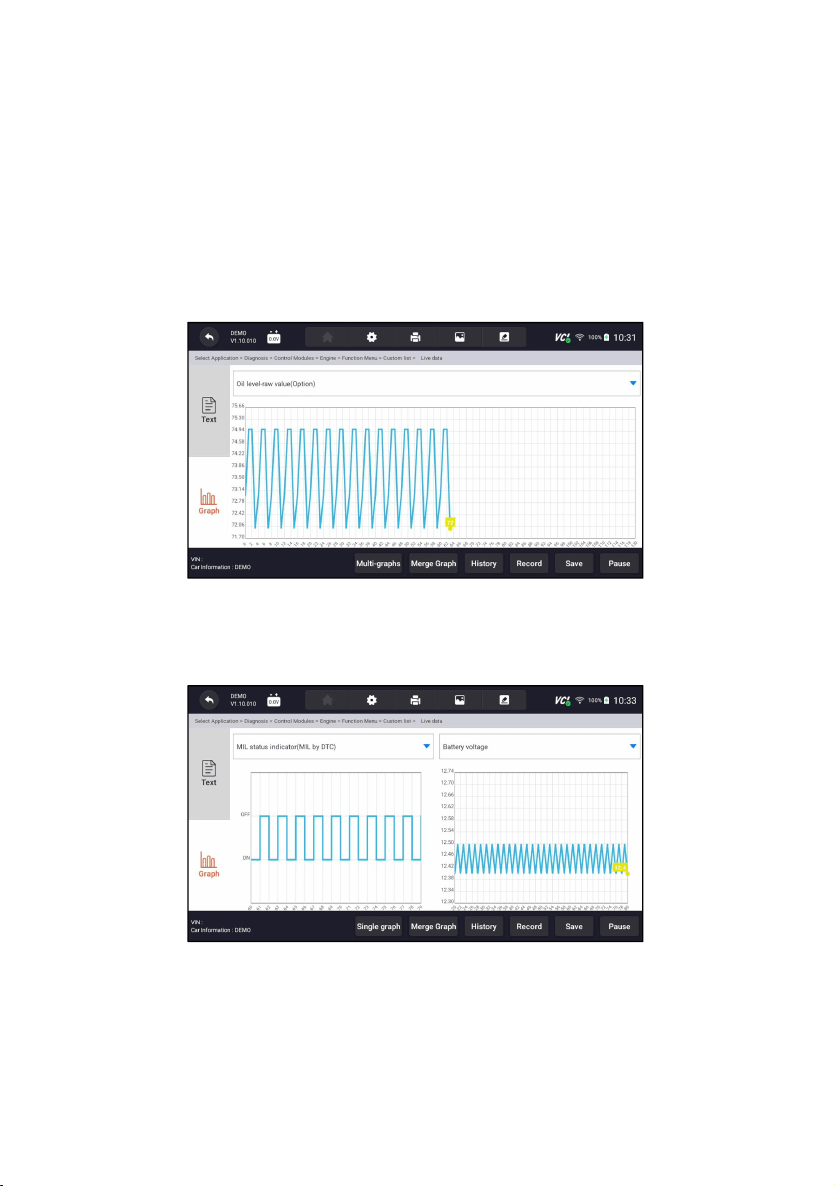
Multi-graphs: displays the parameters in waveform graphs, giving you
the ‘real picture’ of what’s going on in the vehicle. You can view up to 4
parameter graphs simultaneously.
Figure 9-21 Sample Multi-graphs Screen
●
Merge Graph: merges multiple PID plots into one coordinate, so you can
easily see how they affect each other, providing you with the most
comprehensive and functional look at live data possible.
Loading ...
Loading ...
Loading ...