
USER’S MANUAL
IDSO1070 Series
2CH WLAN Digital Storage Oscilloscope
V1.0.2
www.hantek.com

Content
General Safety Summary .............................................................................................................. I
Brief Introduction to IDSO .......................................................................................................... III
Chapter 1 Quick Start ................................................................................................................... 1
1.1 Connections and Indications ................................................................................................. 2
1.2 Set Connection Mode............................................................................................................ 3
1.3 Charging the battery.............................................................................................................. 4
1.4 General Check ...................................................................................................................... 4
1.5 Probe Compensation ............................................................................................................ 4
1.6 Function Check ..................................................................................................................... 6
1.7 Self Calibration ...................................................................................................................... 7
Chapter 2 PC Application ............................................................................................................ 8
2.1 Install Software ..................................................................................................................... 9
2.2 Install Driver ........................................................................................................................ 12
2.3 Set Connection Mode with PC ............................................................................................ 18
2.4 The User’s Interface ............................................................................................................ 20
2.5 The Menu System ............................................................................................................... 22
2.6 Setup the Oscilloscope ....................................................................................................... 22
2.7 Set Horizontal System......................................................................................................... 23
2.7.1 Horizontal Setting ......................................................................................................... 23
2.7.2 The Application of the X-Y Operation ........................................................................... 24
2.8 Set Vertical System ............................................................................................................. 26
2.9 Set Trigger System ............................................................................................................. 28
2.9.1 Trigger Setting .............................................................................................................. 28
2.9.2 Capturing a Single-Shot Signal .................................................................................... 29
2.10 Math and FFT ................................................................................................................... 30
2.10.1 MATH ......................................................................................................................... 30
2.10.2 Fast Fourier Transform Function ................................................................................ 31
2.11 Save and Load .................................................................................................................. 32
2.11.1 Save and load file ....................................................................................................... 32
2.11.2 Set Reference ............................................................................................................. 33
2.11.3 Save/Load Setup ........................................................................................................ 34
2.12 Display System ................................................................................................................. 34
2.13 Measure System ............................................................................................................... 36
2.13.1 Scale measurement .................................................................................................... 36
2.13.2 Cursor Measure .......................................................................................................... 37

2.13.3 Automatic Measurement ............................................................................................. 40
2.14 Acquisition Modes ............................................................................................................. 42
2.15 Interpolation ...................................................................................................................... 42
2.16 Utility Function .................................................................................................................. 44
2.16.1 Record ........................................................................................................................ 45
2.16.2 Pass/Fail ..................................................................................................................... 45
2.16.3 Self Calibration ........................................................................................................... 47
2.16.4 Factory Setup ............................................................................................................. 47
2.16.5 Language ................................................................................................................... 47
2.17 Print And Print Preview ..................................................................................................... 48
Chapter 3 IOS Application ......................................................................................................... 49
3.1 User Interface ..................................................................................................................... 50
3.2 Menu System ...................................................................................................................... 52
3.3 Connect IDSO With Apple/Android ..................................................................................... 52
3.4 Set Horizontal System......................................................................................................... 53
3.4.1 Horizontal Setting ......................................................................................................... 53
3.4.2 The Application of the X-Y Operation ........................................................................... 54
3.5 Set Vertical System ............................................................................................................. 54
3.6 Set Trigger System ............................................................................................................. 56
3.7 Save and Load .................................................................................................................... 57
3.7.1 Save/Load File ............................................................................................................. 57
3.7.2 Save/Load Reference ................................................................................................... 57
3.7.3 Save/Load Setup .......................................................................................................... 59
3.8 Display System ................................................................................................................... 59
3.9 Measure Signal ................................................................................................................... 59
3.9.1 Cursor ........................................................................................................................... 59
3.9.2 Measure ....................................................................................................................... 60
3.10 Acquire .............................................................................................................................. 61
3.10.1 Capture Mode ............................................................................................................. 61
3.10.2 Interpolation ................................................................................................................ 61
Chapter 4 Android Application .................................................................................................. 62
4.1 User Interface ..................................................................................................................... 62
4.2 Menu System ...................................................................................................................... 64
4.3 Connect IDSO with Android in direct mode ......................................................................... 64
4.4 Set Vertical System ............................................................................................................. 65
4.5 Set Trigger System ............................................................................................................. 66
4.6 Measure Signal ................................................................................................................... 66

Chapter 5 Appendix .................................................................................................................... 67
Appendix A: Specifications ........................................................................................................ 68
Appendix B: General Maintenance ........................................................................................... 70
Appendix C: Accessories .......................................................................................................... 70

General Safety Summary
User’s Manual I
General Safety Summary
Review the following safety precautions carefully before operate the device to avoid any
personal injuries or damages to the device and any products connected to it. To avoid potential
hazards use the device as specified by this user’s guide only.
To Avoid Fire or Personal Injury.
Connect and Disconnect Properly. Do not connect or disconnect probes or test leads while
they are connected to a voltage source.
Connect and Disconnect Properly. Connect the probe output to the measurement device
before connecting the probe to the circuit under test. Disconnect the probe input and the
probe reference lead from the circuit under test before disconnecting the probe from the
measurement device.
Observe All Terminal Ratings. To avoid fire or shock hazard, observe all ratings and
markings on the product. Consult the product manual for further ratings information before
making connections to the product.
Use Proper Probe. To avoid shock hazard, use a properly rated probe for your
measurement.
Avoid Circuit or Wire Exposure. Do not touch exposed connections and components when
power is on.
Do Not Operate with Suspected Failures. If suspected damage occurs with the device,
have it inspected by qualified service personnel before further operations.
Provide Proper Ventilation. Refer to the installation instructions for proper ventilation of the
device.
Do not operate in Wet/Damp Conditions.
Do not operate in an Explosive Atmosphere.
Keep Product Surfaces Clean and Dry.
General Safety Summary
User’s Manual II
Safety Information
In order to ensure the correct using and the best efficient service, please carefully read the user’s
manual.
System Symbols
These symbols may appear in this manual or on the instrument.
Warning: “Waring” identifies conditions and actions that pose hazards to the users.
Caution: “Caution” identifies conditions and actions that may damage the product or other
properties.
System Terms
The following terms may appear on the instrument:
Danger: The term “Danger” is used in the manual to indicate that when you read this mark,
personal injury may be caused to immediately.
Waning: The term “Danger” is used in the manual to indicate that when you read this mark,
personal injury may not be caused to you immediately, but you need to be cautionary.
Notice: The term “Noise” is used in this manual to indicate that damages may be caused on
this product or other properties.
DANGER:
High Voltage
Refer to
the manual
Protective Condutor
Terminal
Chassis grand
Earth(grand) Terminal

General Safety Summary
User’s Manual III
Brief Introduction
The IDSO is WLAN dual-channel digital storage oscilloscope geared towards tablet computers, it's
a small, lightweight, portable, battery powered, fully featured two channel oscilloscope. The
oscilloscopes is ideal for production test, research and design and all of the applications involving
analog circuits test and troubleshooting, as well as education and training.
Instead of a built-in screen it uses your tablet iOS, Android or PC (Windows) to display the
measurements. Data exchange between the tablet and the oscilloscope is via WLAN, there are no
cables. Also, as there is no physical connection between the oscilloscope and the tablet, it is a
very safe instrument to use. Due to the wireless principle, the oscilloscope and the ‘screen’ do not
need to be at the same location.
The communication protocol between the oscilloscope and the tablet is freely available, so it is
easy for third-party developers to develop applications for other purposes. Finally, it is equipped
with a USB port for charging of the internal battery. If desired, it can also connect to a PC via the
USB port, instead of wireless.
Model
Channels
Bandwidth
Sample Rate
IDSO1070A
2
70MHz
250Msa/s
Features
Excellent industrial design-the same anodized aluminium casing as iPad, which is not only
beautiful and tasteful but also greatly enhanced the hardness of aluminum alloy surface, and
has good heat resistance and strong wearability.
USB2.0 interface, USB power source required, easy to use.
Li-ion rechargeable battery include
DVM readouts
20 measurement functions, PASS/FAIL Check, be suitable for technical application.
Waveform average, persistence, intensity, invert, addition, subtraction, multiplication, division,
X-Y plot.
Save waveform in the following: text file, jpg/bmp graphic file, MS excel/word file.
FFT
Minimum system requirements
iOS (*)
Android™ 4.0 (*)
Windows XP or higher (*)
Tablet or PC
Download the IDSO APP
IOS: Search for IDSO from App Store
Windows: 1. CD Disc
2. Download from Our Website
Android: 1. CD Disc
2. Download from Our Website
3. Search for IDSO1070 from Google Play

Quick Start
User’s Manual 2
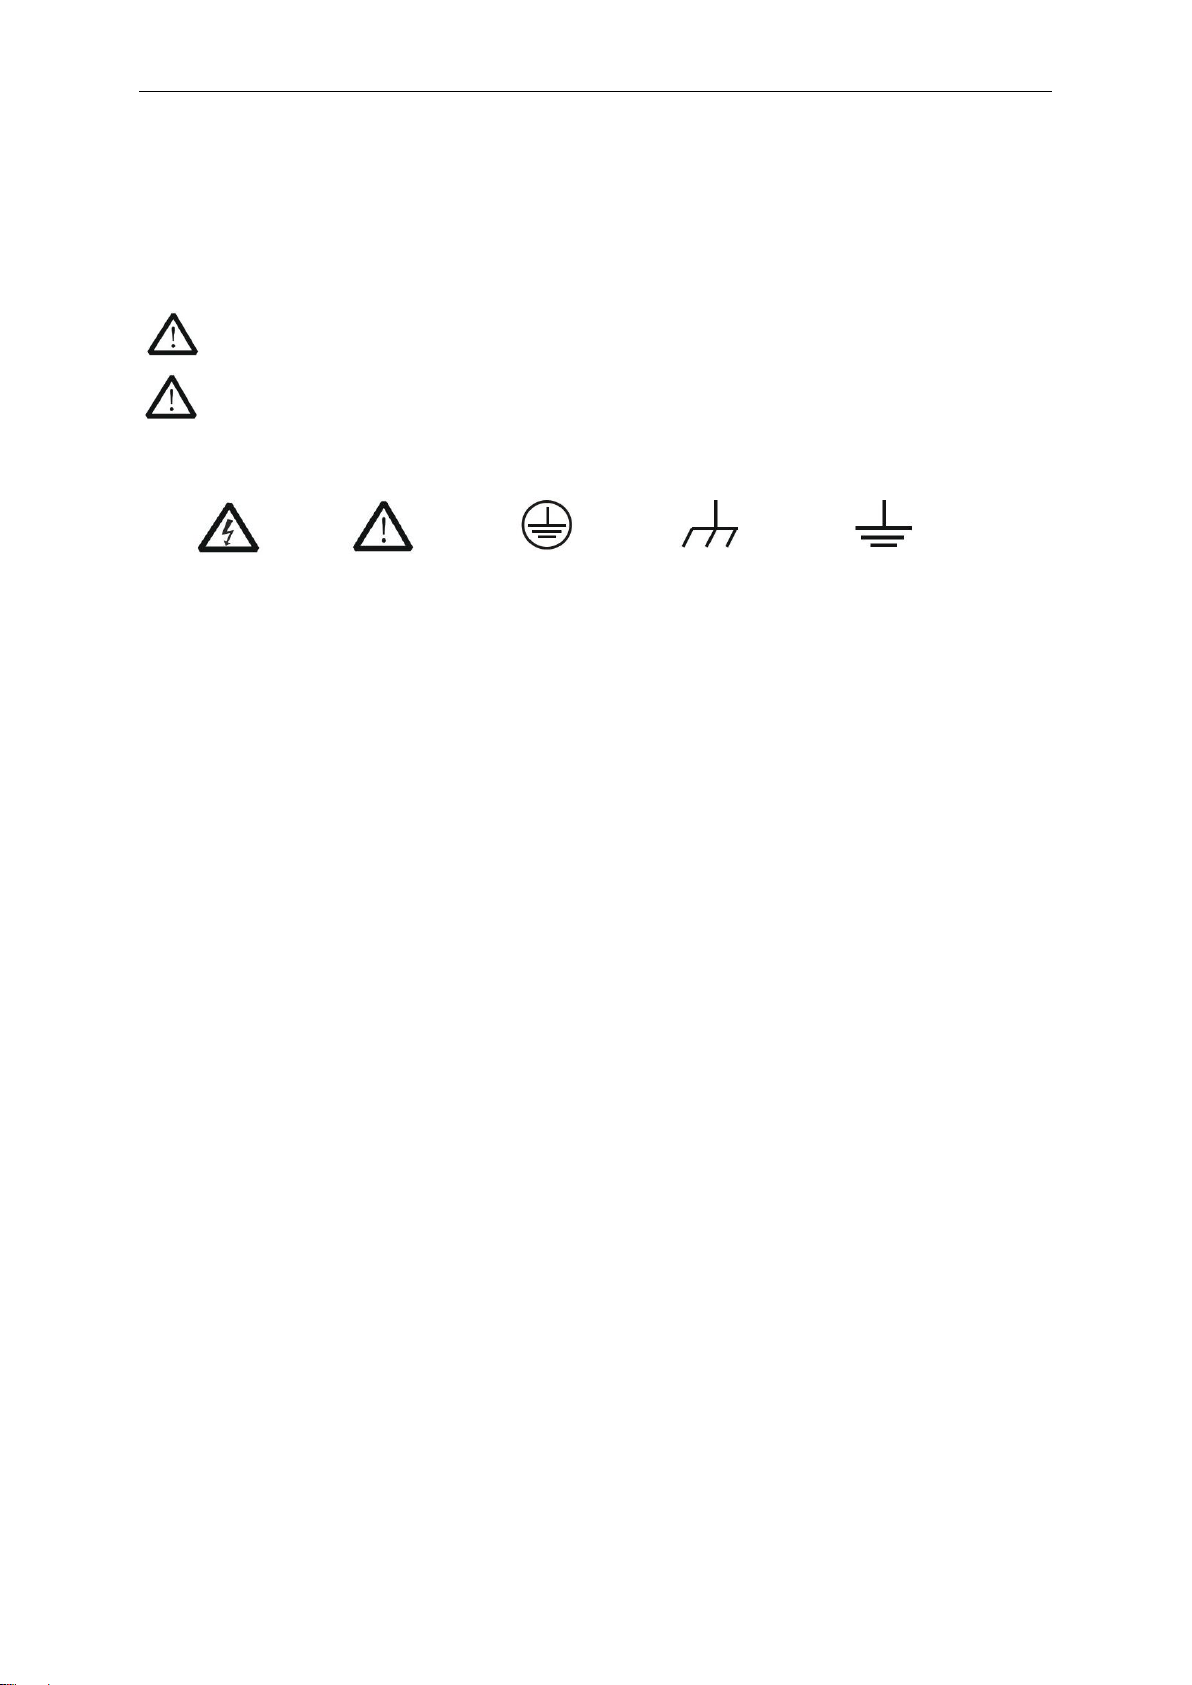
1.1 Connections and Indications
1. CH 1: Input connectors for waveform display.
2. CH 2: Input connectors for waveform display.
3. EXT.: Input connector for an external trigger source. Use the Trigger menu to select the Ext.
source.
4. CAL.: Probe compensation output.
5. GND.: Ground terminal.
6. Power Button: Power on/off button.
7. USB PORT: Connect the B-Type Plug of USB cable to this port.
8. ANT: Antenna
9. Indications
:
:
:
:
1
2
3
4
5
6
7
8
9
10
Power on/off ①.
Battery charging
Battery full
USB/WI-FI indication
②

Quick Start
User’s Manual 3
:
:
:
:
10. Easylink: Press this button to restart the IDSO and set Wi-Fi connection mode.
① Power on for IDSO. Keep pressing power button until power indicator lights up. The
indicator is blinking when it get battery level. When the battery is lower than 10%, the
indicator is quick blinking. When the battery is not less than 10%, the indicator is slow
blinking.
② The indicator keeps lighting in USB mode and slow blinking in Wi-Fi mode.
③ If there is data transfer between IDSO device and IDSO APP, this indicator is quick
blinking. Otherwise, the indicator is off.
④ In Wi-Fi mode, if there is communication link between IDSO device and IDSO APP, the
indicator keeps lighting normally.
1.2 Set Connection Mode
There are two connection modes of the IDSO Wi-Fi mode and USB mode.
Wi-Fi mode: Keep pressing power button until power indicator lights up. Then the communication
indicator USB/Wi-Fi lights up and slow blinking. You can connect the IDSO with tablet/PC via
Wi-Fi.
USB mode: Keep pressing power button until power indicator lights up. And press Easy-Link
button immediately, then the USB/Wi-Fi communication indicator lights up and keeping light. You
can connect the IDSO with PC via USB cable.
Note:
1. In Wi-Fi mode: The IDSO device will power off when the time of no communication between
IDSO device and IDSO application more than ten minutes. There are three situations about no
communication:
1) When the software of Windows is close.
2) When iOS APP quits or works on background.
3) When Android APP quits or the screen is lock.
Hotspot, creates it's own wireless local area network (WLAN). Yellow light is
always flashing.
When the device is connected with PC and communicates with PC successfully
via USB cable, the light blinks in green for long.
Send signals when the connection is successful with the tablet/PC. ③
App connection indicates when there is connection over the WLAN network with the
tablet application. ④

Quick Start
User’s Manual 4
2. In USB mode, if the driver is installed successfully on a PC, the software can communicate
with IDSO automatically, so the IDSO won’t power off when connect it with the PC. If the driver
isn’t installed successfully on a PC, there is no communication, so the IDSO will power off
more than ten minutes.
1.3 Charging the battery
There are two ways to charge the battery:
1. Connect B-Type Plug of USB cable to IDSO’s USB port. Connect the A-type Plug of USB cable
to power adapter (5V, 1A).
2. Connect B-Type Plug of USB cable to IDSO’s USB port. Connect the A-type Plug of USB cable
to PC’s USB port.
Note:
It is recommended to charge the rechargeable battery completely before using the
oscilloscope for the first time.
When the battery is out of power, please use power adapter to charge it for a period of time
before using.
1.4 General Check
Please check the instrument as following steps after receiving an oscilloscope:
Check the shipping container for damage:
Keep the damaged shipping container or cushioning material until the contents of the shipment
have been checked for completeness and the instrument has been checked mechanically and
electrically.
Check the accessories:
Accessories supplied with the instrument are listed in "Accessories" in this guide. If the contents
are incomplete or damaged, please notify the franchiser.
Check the instrument:
In case there is any mechanical damage or defect, or the instrument does not operate properly
or fails performance tests, please notify the franchiser.
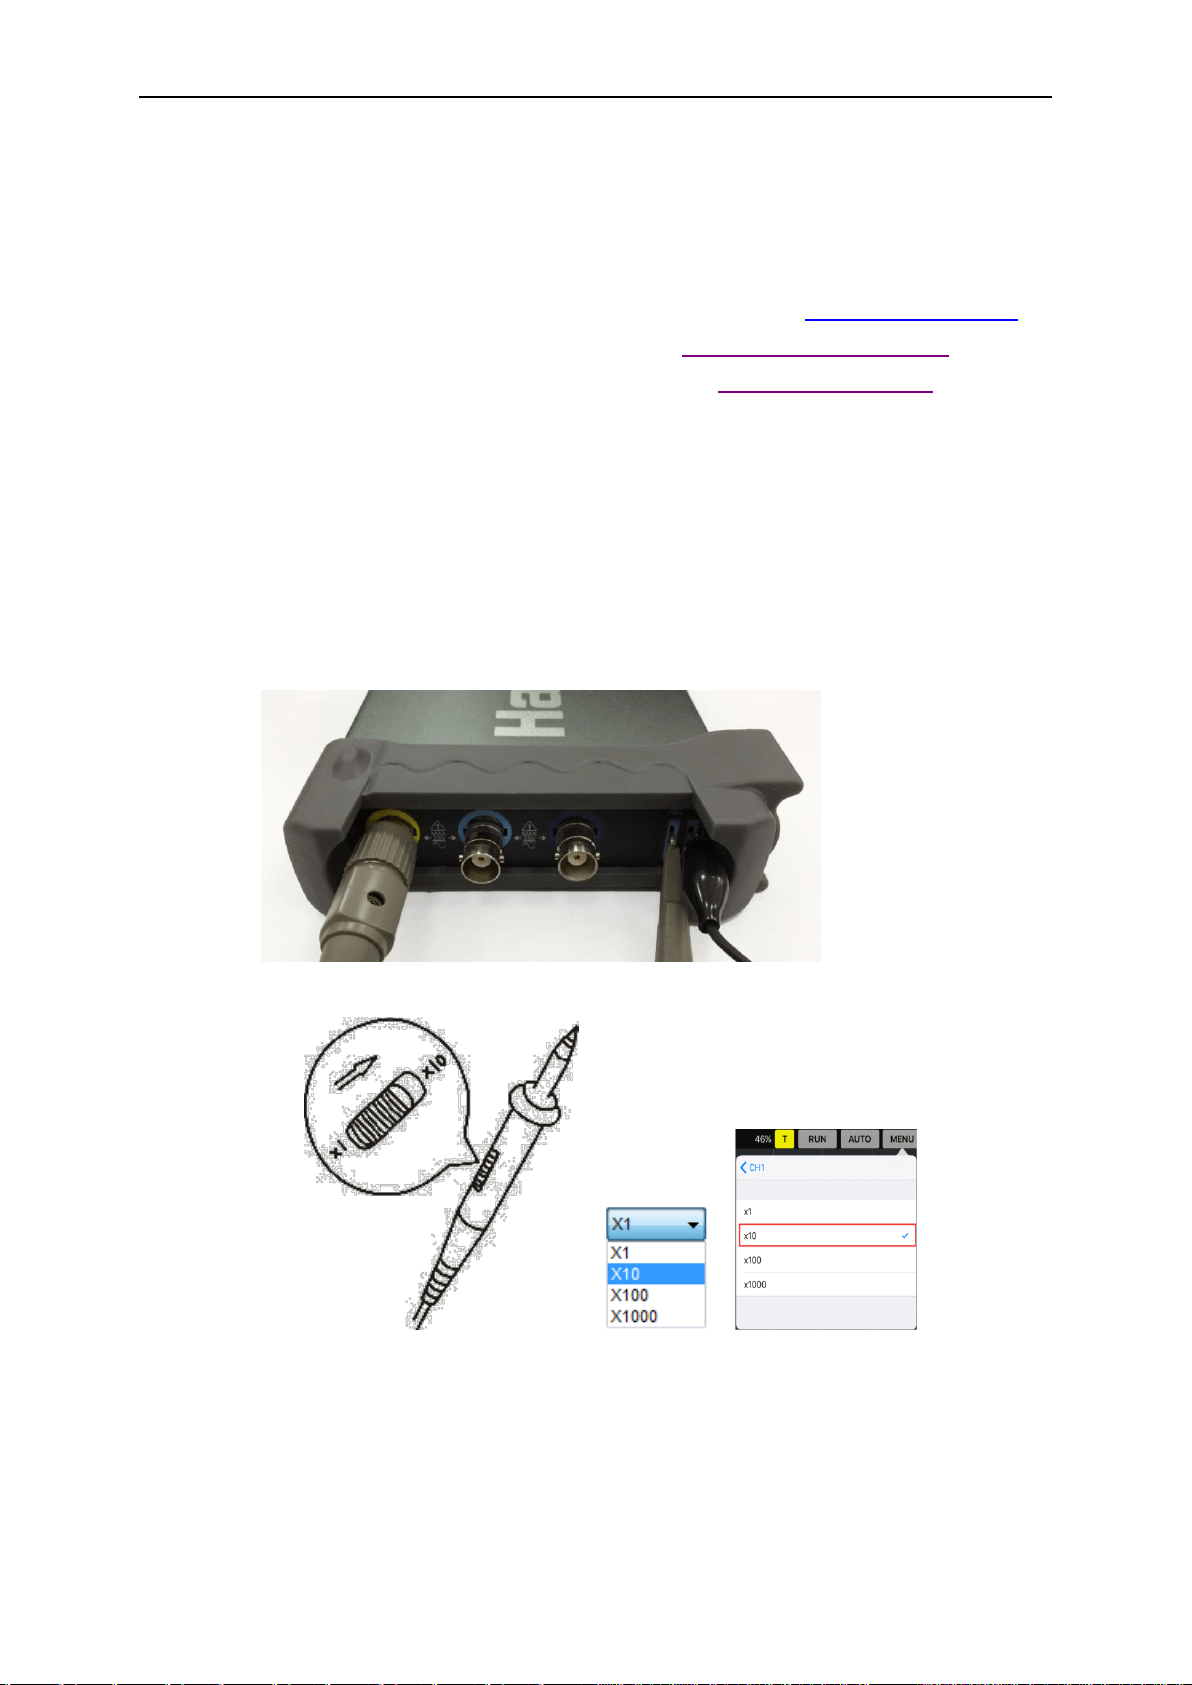
1.5 Probe Compensation
Perform this function to match the characteristics of the probe and the channel input. This
should be performed whenever attaching a probe to any input channel at the first time.
1. From the “Probe” menu, select attenuation to 1:10. Set the switch to “X10” on the probe and
connect it to CH1 of the oscilloscope. When using the probe hook-tip, insert the tip onto the
probe firmly to ensure a proper connection.
2. Connect the probe tip with a 1 KHz, 2 Vp-p square, select CH1, and then press the
Quick Start
User’s Manual 5
“AUTOSET” button into the menu or the toolbar.
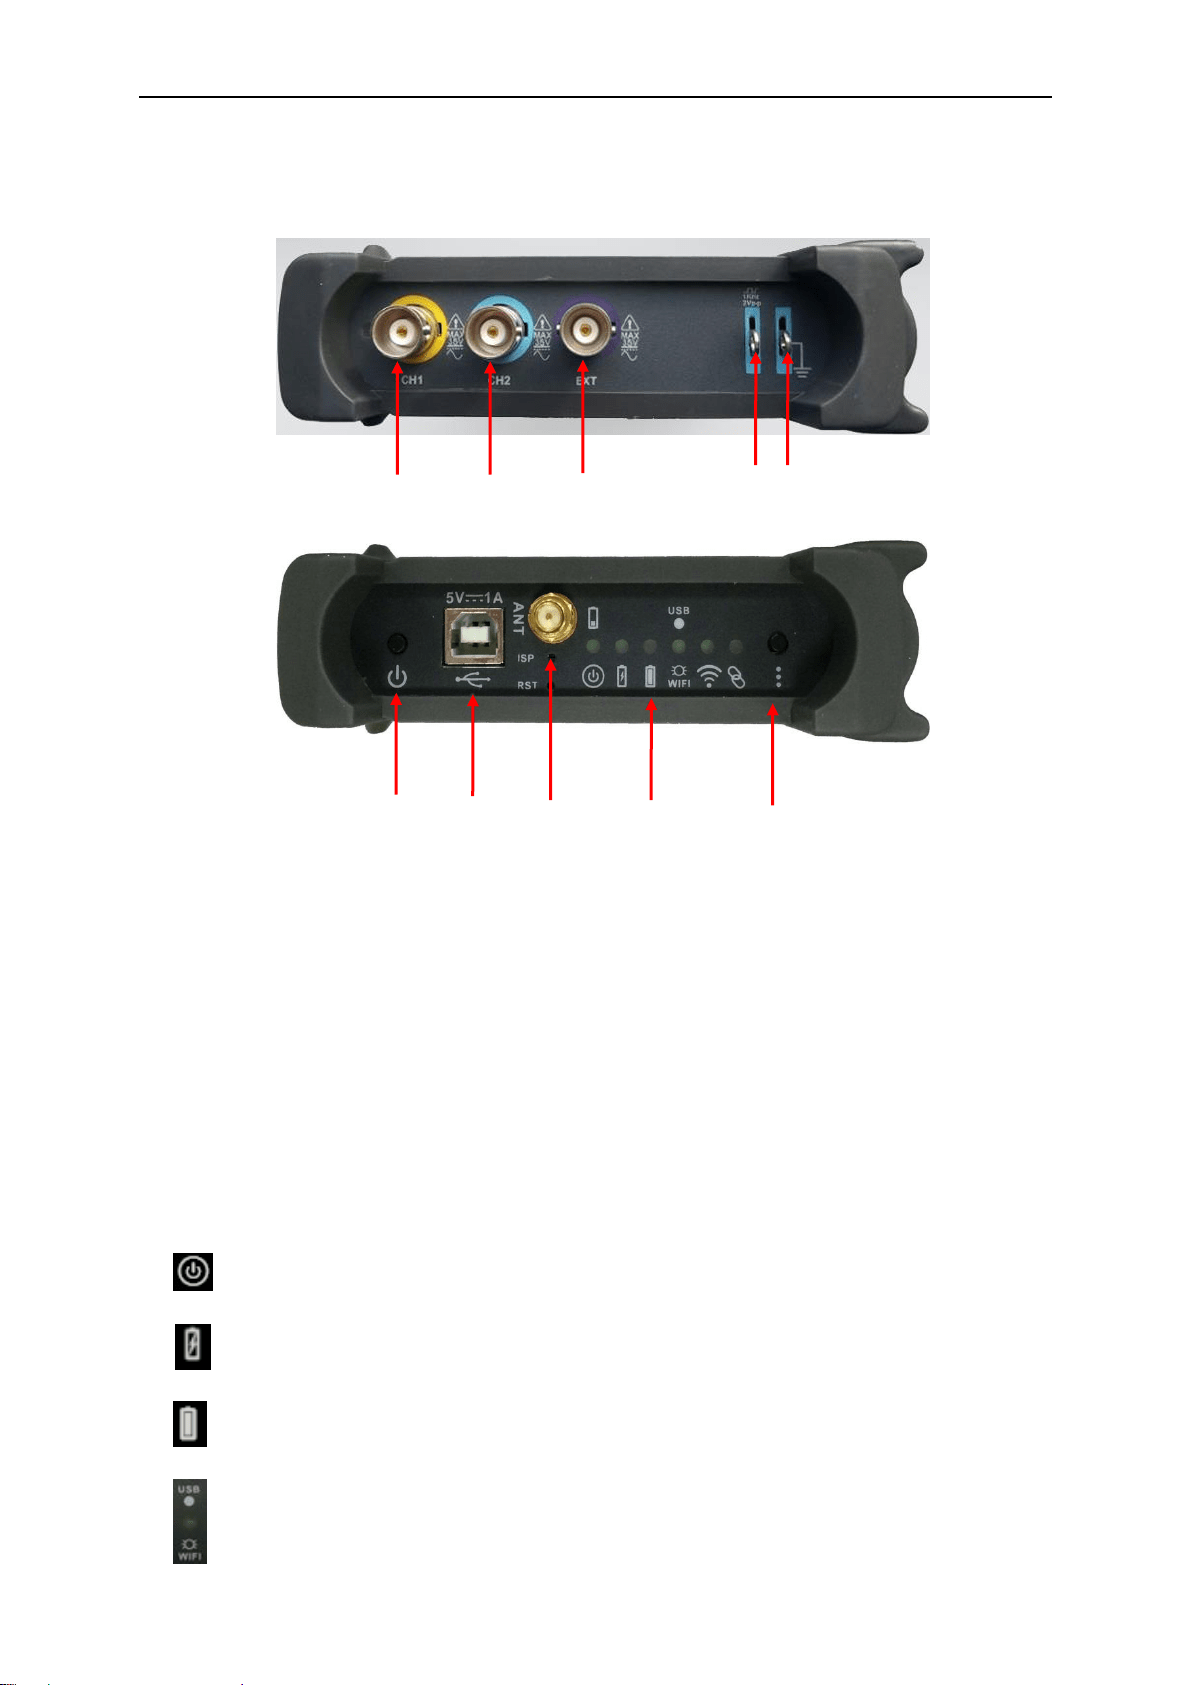
3. Check the shape of the displayed waveform.
Correctly Compensated
Over compensated
Under Compensated
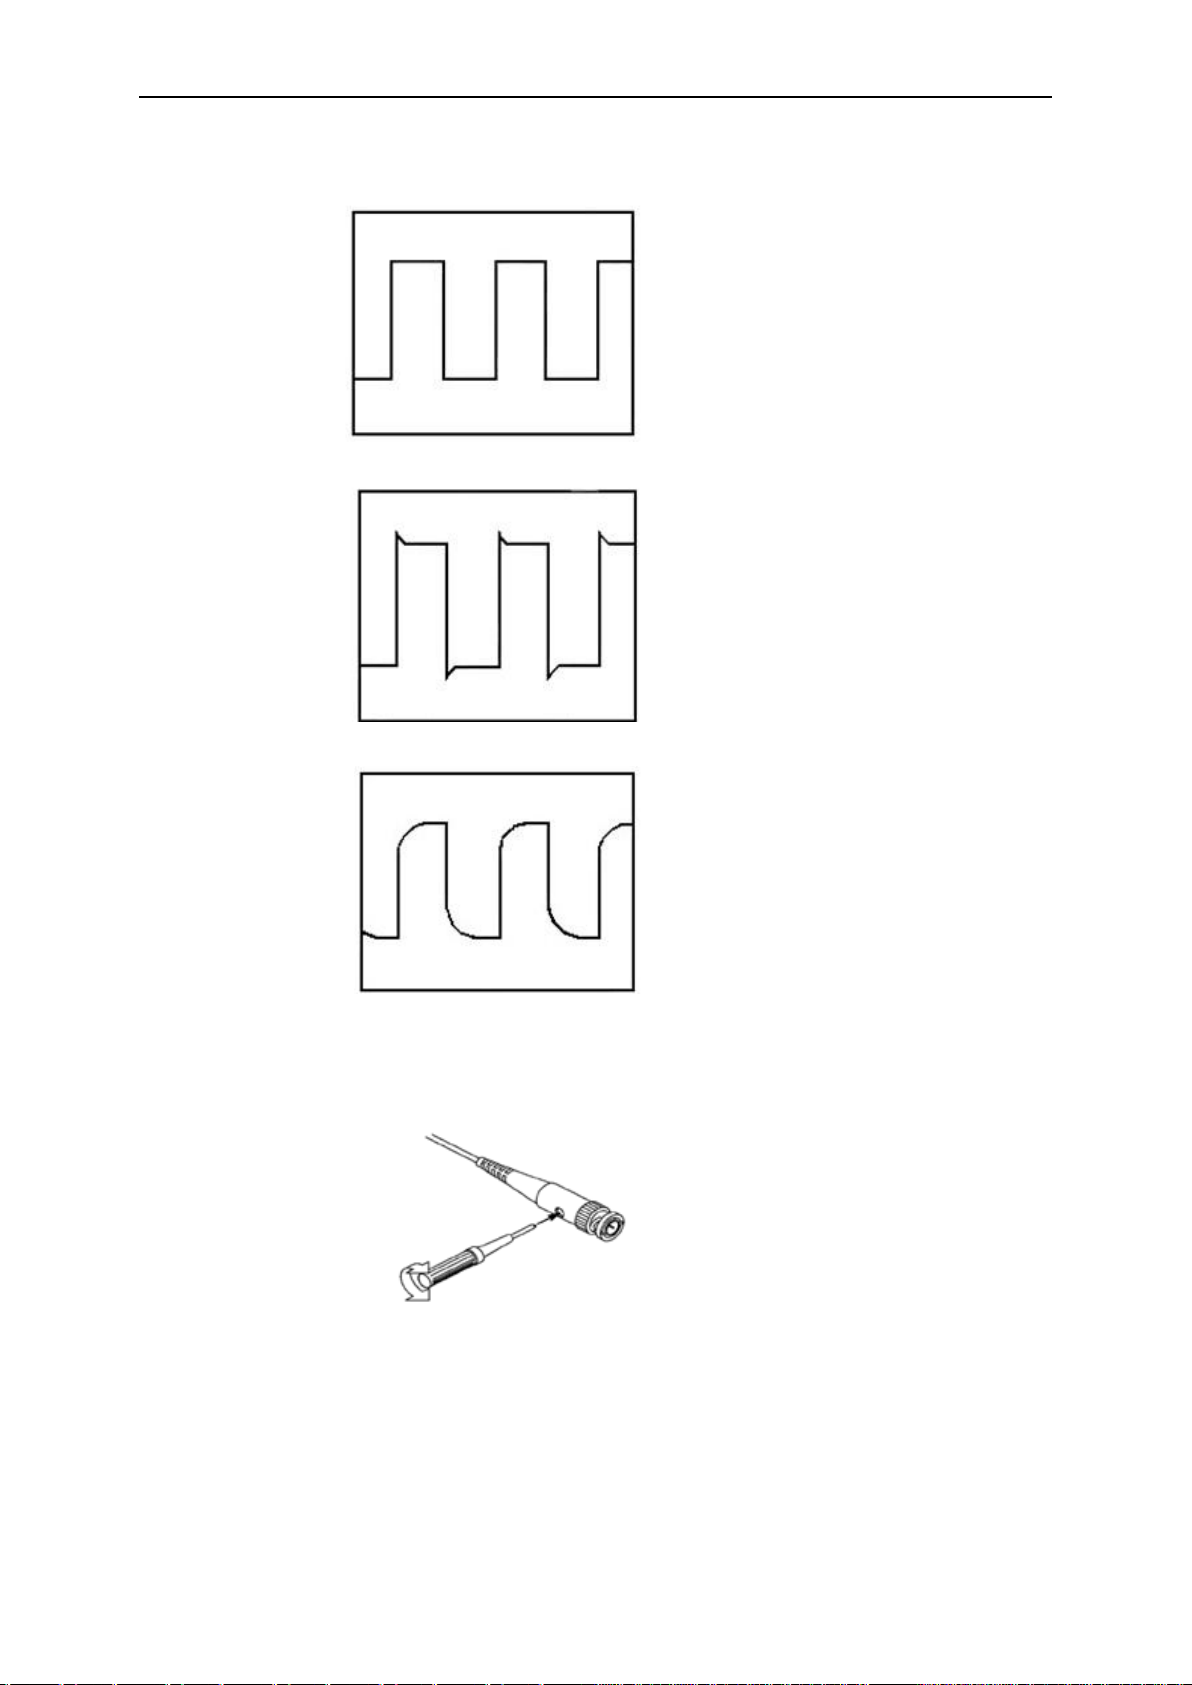
4. If necessary, use a non-metallic tool to adjust the trimmer capacitor of the probe for the
fattest square wave being displayed on the oscilloscope.
5. Repeat if necessary.
WARNNING: To avoid electric shock while using the probe, be sure the perfection of the insulated
cable, and do not touch the metallic portions of the probe head while it is connected with a voltage
source.
Quick Start
User’s Manual 6
1.6 Function Check
Perform this functional check to verify that your oscilloscope is operating correctly.
Connect the oscilloscope with PC, iOS or Android
1. Connect IDSO with PC via USB cable or Wi-Fi. Please refer to Connect IDSO with PC.
2. Connect IDSO with IOS via Wi-Fi. Please refer to Connect IDSO WITH APPLE.
3. Connect IDSO with Android via Wi-Fi. Please refer to Connect WITH Android.
Input a signal to a channel of the oscilloscope
The oscilloscope is equipped with two channels plus external trigger.
Please input signal in the following steps:
1. Set the attenuation switch on the probe as 10X and connect the probe on the oscilloscope with
CH1. Aim the slot in the probe connector at the faucet on BNC of CH1 and insert, then, turn right to
lock the probe. Finally, attach the tip of probe and ground nip to the Connector of Probe
compensator.
2. Set the CH1 probe attenuation of the oscilloscope to X10. (The default is X1).
3. Attach the tip of probe and ground nip to the Connector of Probe compensator. Click the
AUTO button. A square wave will be displayed within a several seconds. (Approximately 1 KHz,
2V, peak- to- peak).
4. Inspect CH2 with the same method. Repeat steps 2 and 3.

Quick Start
User’s Manual 7
1.7 Self Calibration
The self calibration routine lets you optimize the oscilloscope signal path for maximum
measurement accuracy. You can run the routine at any time but you should always run the
routine if the ambient temperature changes by 5℃ or more. For accurate calibration, power on
the oscilloscope and wait twenty minutes to ensure it is warmed up. To compensate the signal
path, disconnect any probes or cables from the input connectors. Then, access the “Utility ->
Calibrate/Self Calibration” option and follow the directions on the screen. The self calibration
routine takes about several minutes.

PC Application
User’s Manual 8
Chapter 2 PC Application
Install Software
Install Driver
Set Connection Mode with PC
The User’s Interface
The Menu System
Set Oscilloscope
Set Horizontal System
Set Vertical System
Set Trigger System
MATH an FFT
Save and Load
Display System
Measure System
Acquisition Modes
Interpolation
Utility Function
Print
PC Application
User’s Manual 9
2.1 Install Software
Caution: You must install the software before using the oscilloscope on Windows PC.
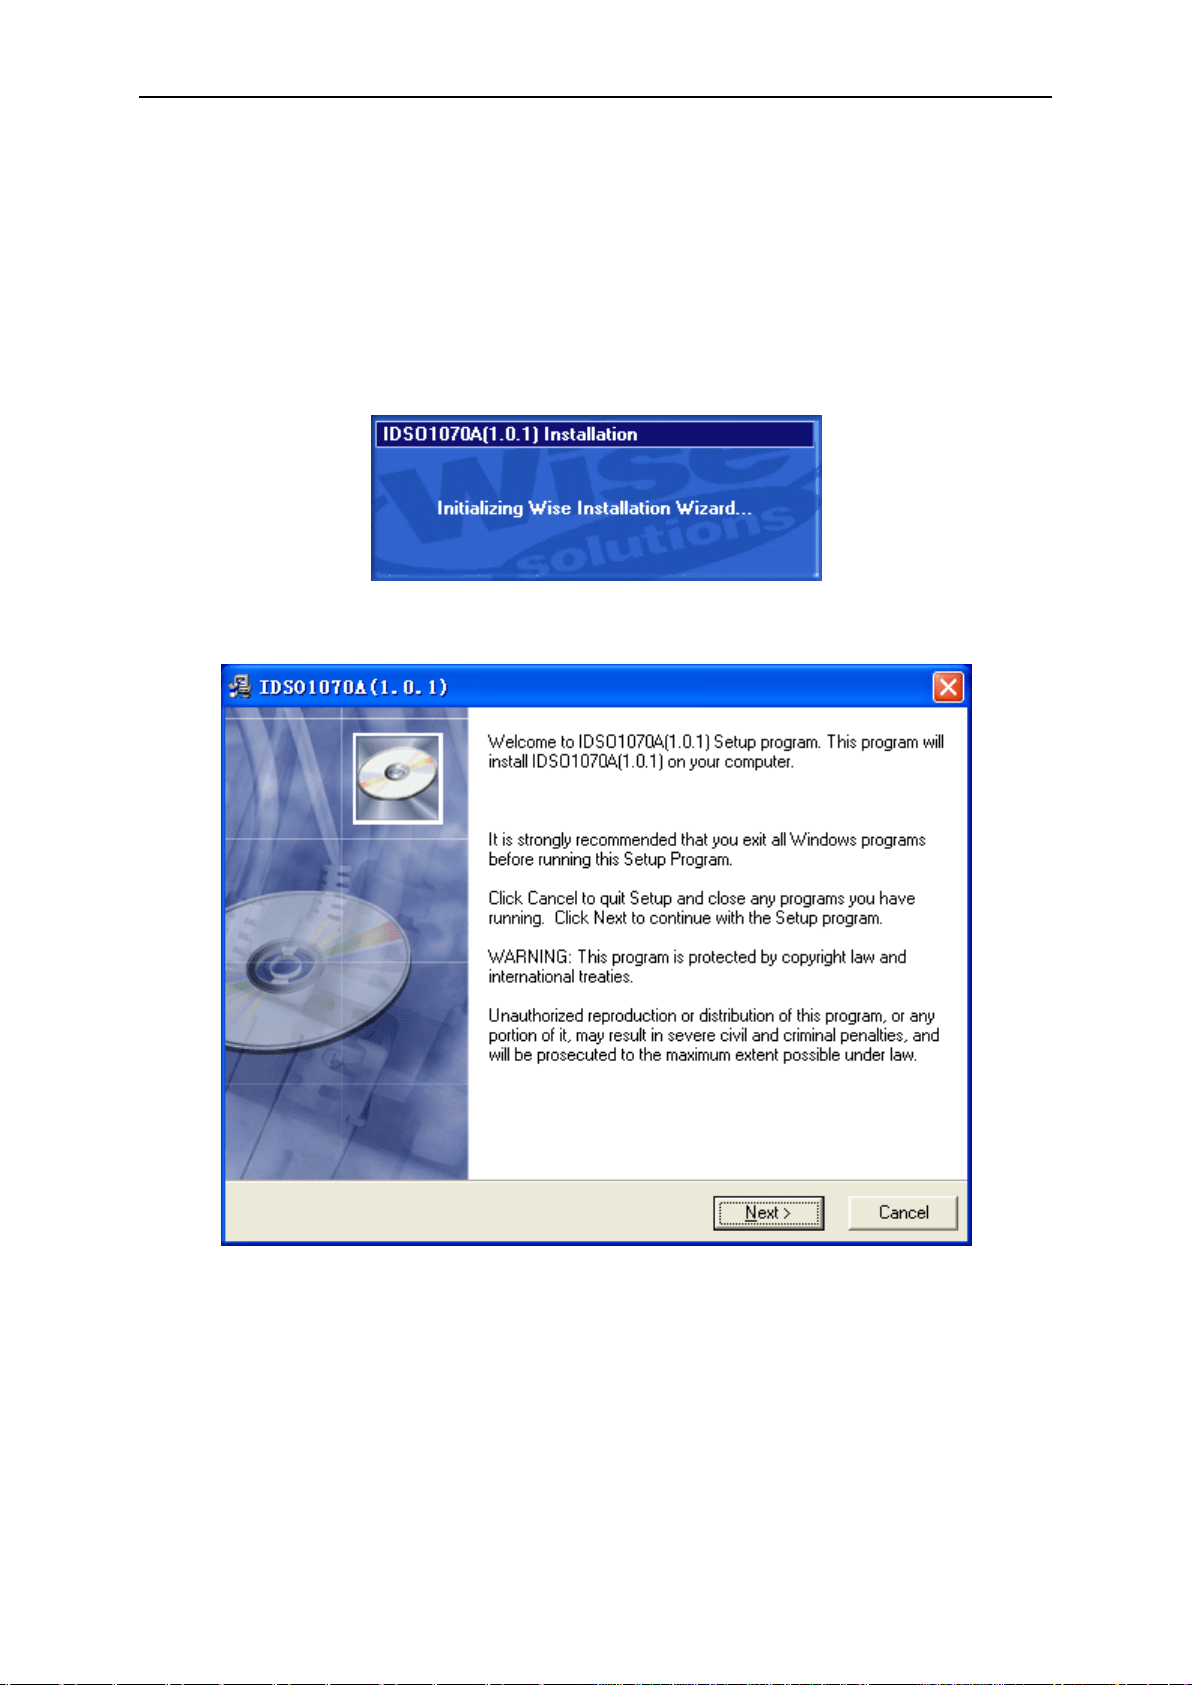
1. While in Windows, insert the installation CD into the CD-ROM drive.
2. The installation should start up automatically. Otherwise open Windows Explorer, and switch to
the CD-ROM driver and run Setup.exe.
3. The software Installation is started. Click 'Next' to continue.
PC Application
User’s Manual 10
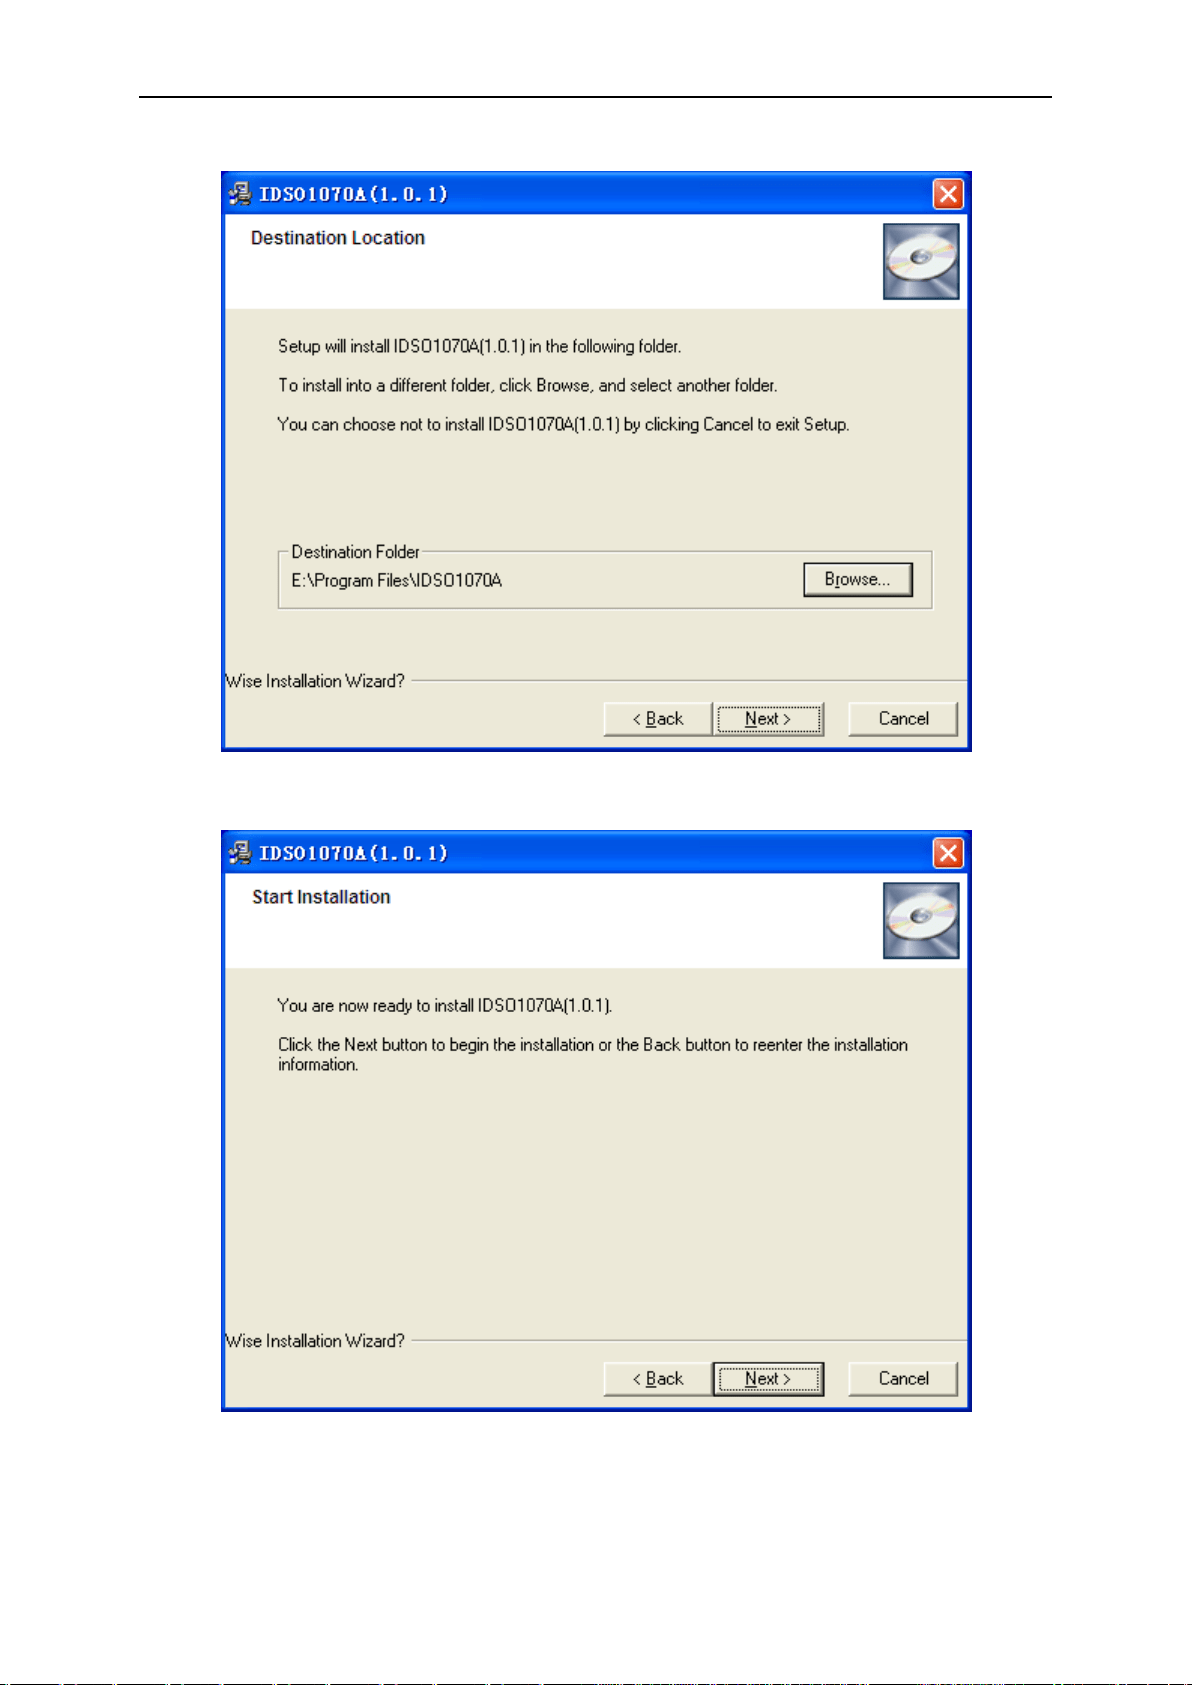
4. Choose a destination directory. Click ‘Next’ to continue.
5. Check the setup information. Click Next to start copying of files.
PC Application
User’s Manual 11
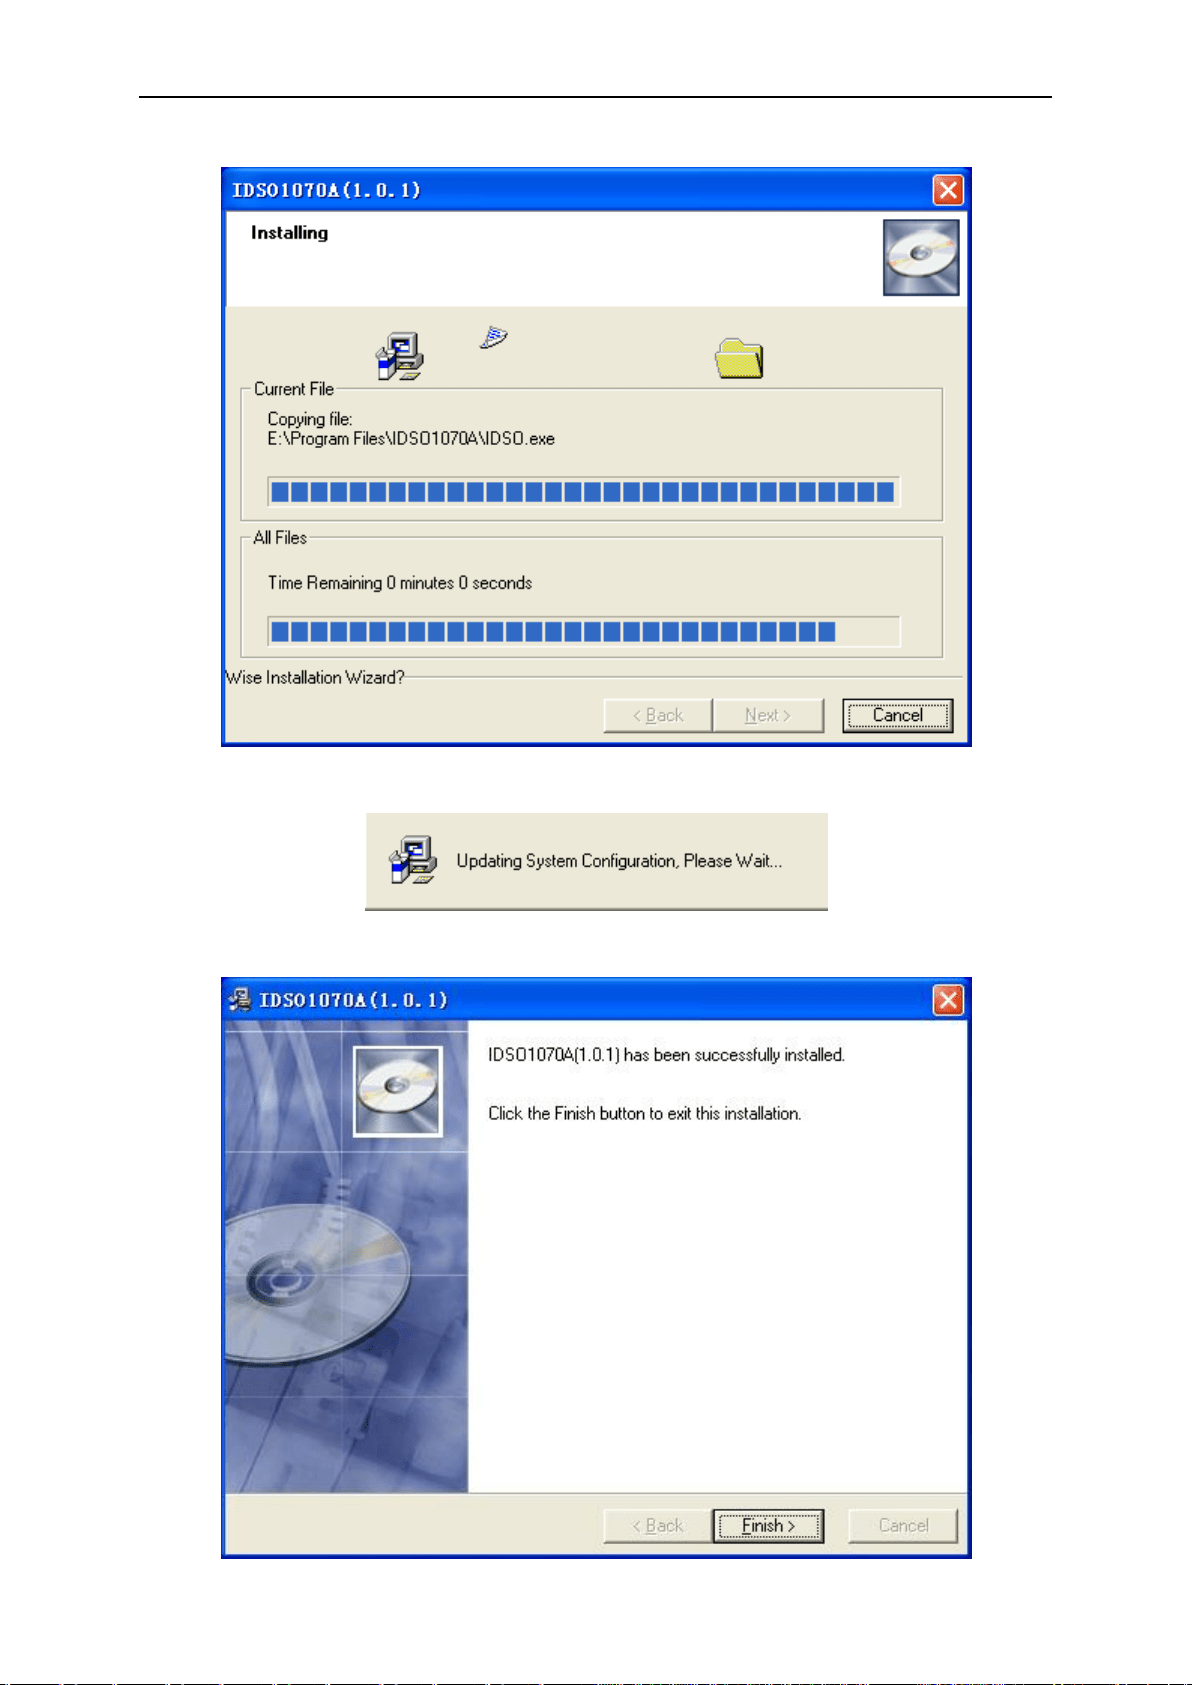
6. This Status dialog is displayed during copying of files.
7. Updating your system configuration.
8. The installation is complete.
PC Application
User’s Manual 12
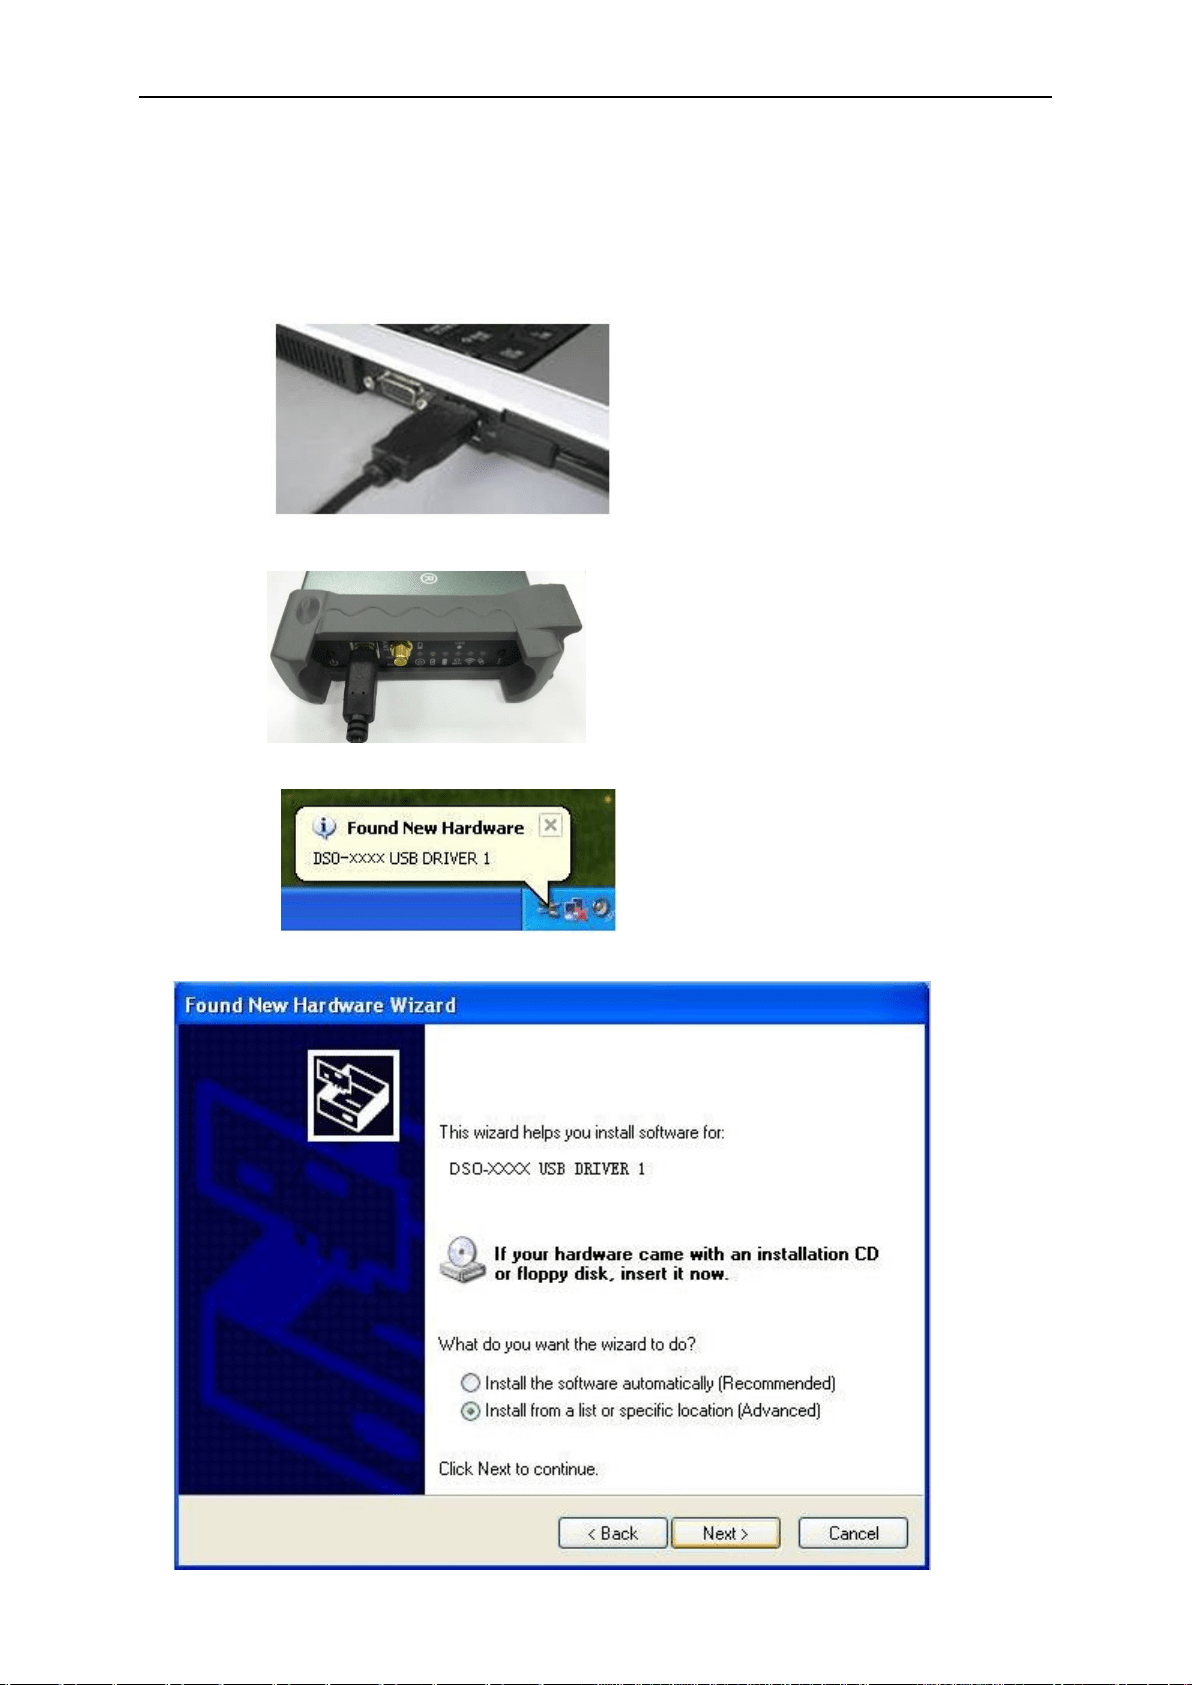
2.2 Install Driver
Caution: You must install the driver before connect the device with Windows PC via USB cable.
Not need to install driver if you connect IDSO with PC via Wi-Fi.
1. Connect the A-Type Plug of USB cable to your PC’s USB port.
2. Connect the B-Type Plug of USB cable to IDSO’s USB port.
3. New hardware is found.
4. New hardware search wizard starts.
PC Application
User’s Manual 13
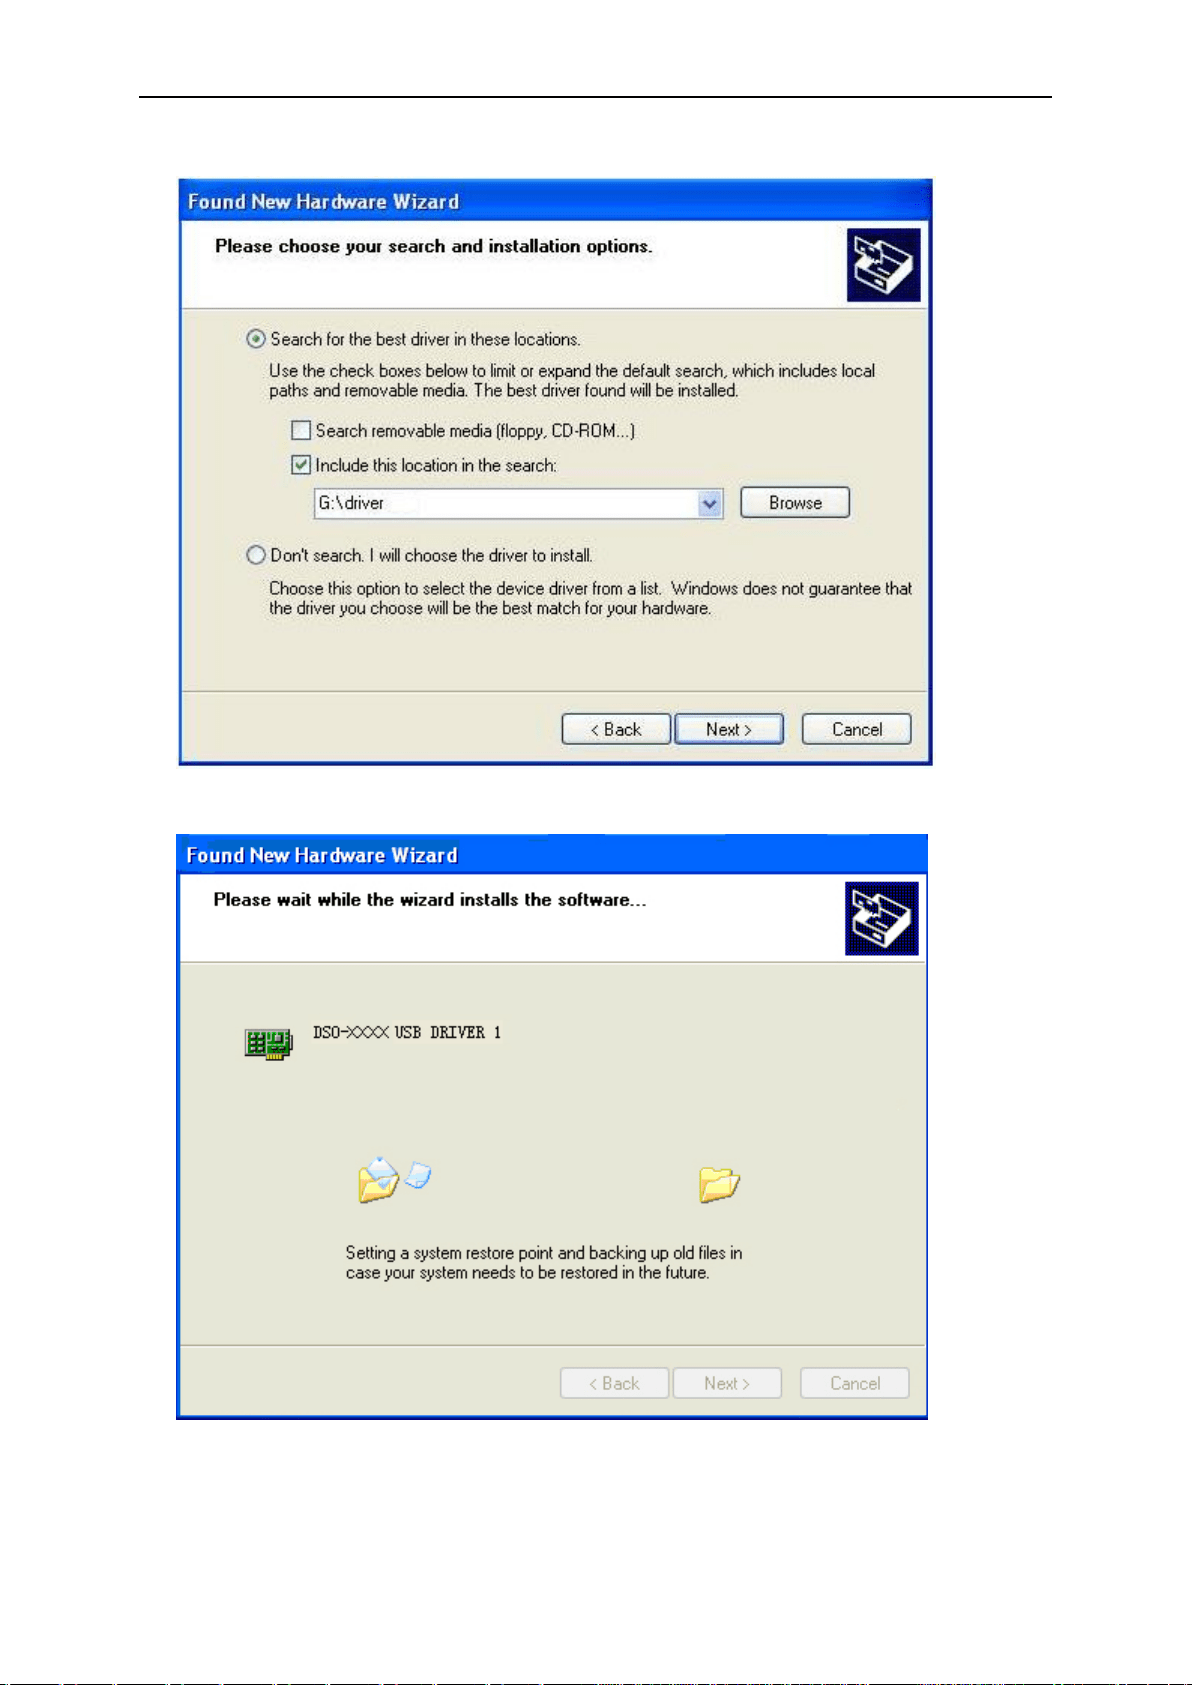
5. New hardware search wizard starts to search the drive.
6. New hardware wizard installs software
PC Application
User’s Manual 14
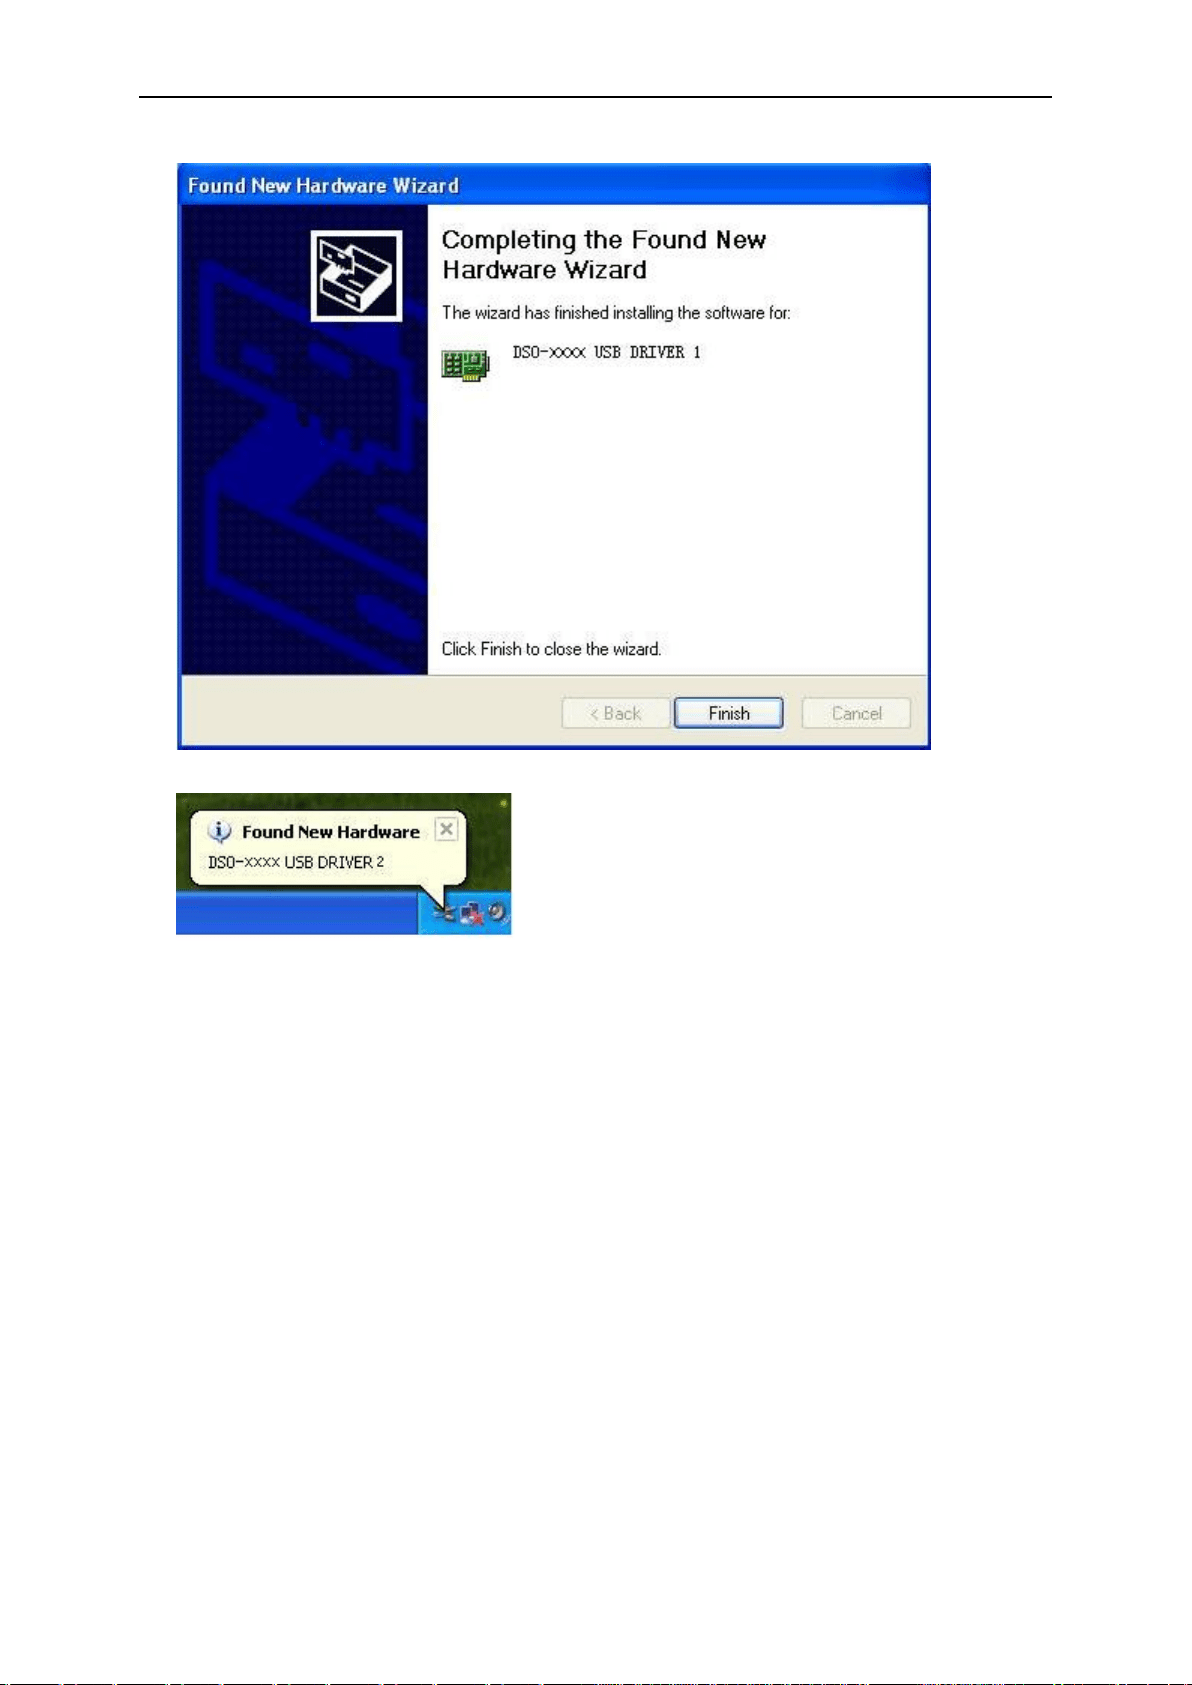
7. Finish new hardware search wizard.
8. New hardware is found.
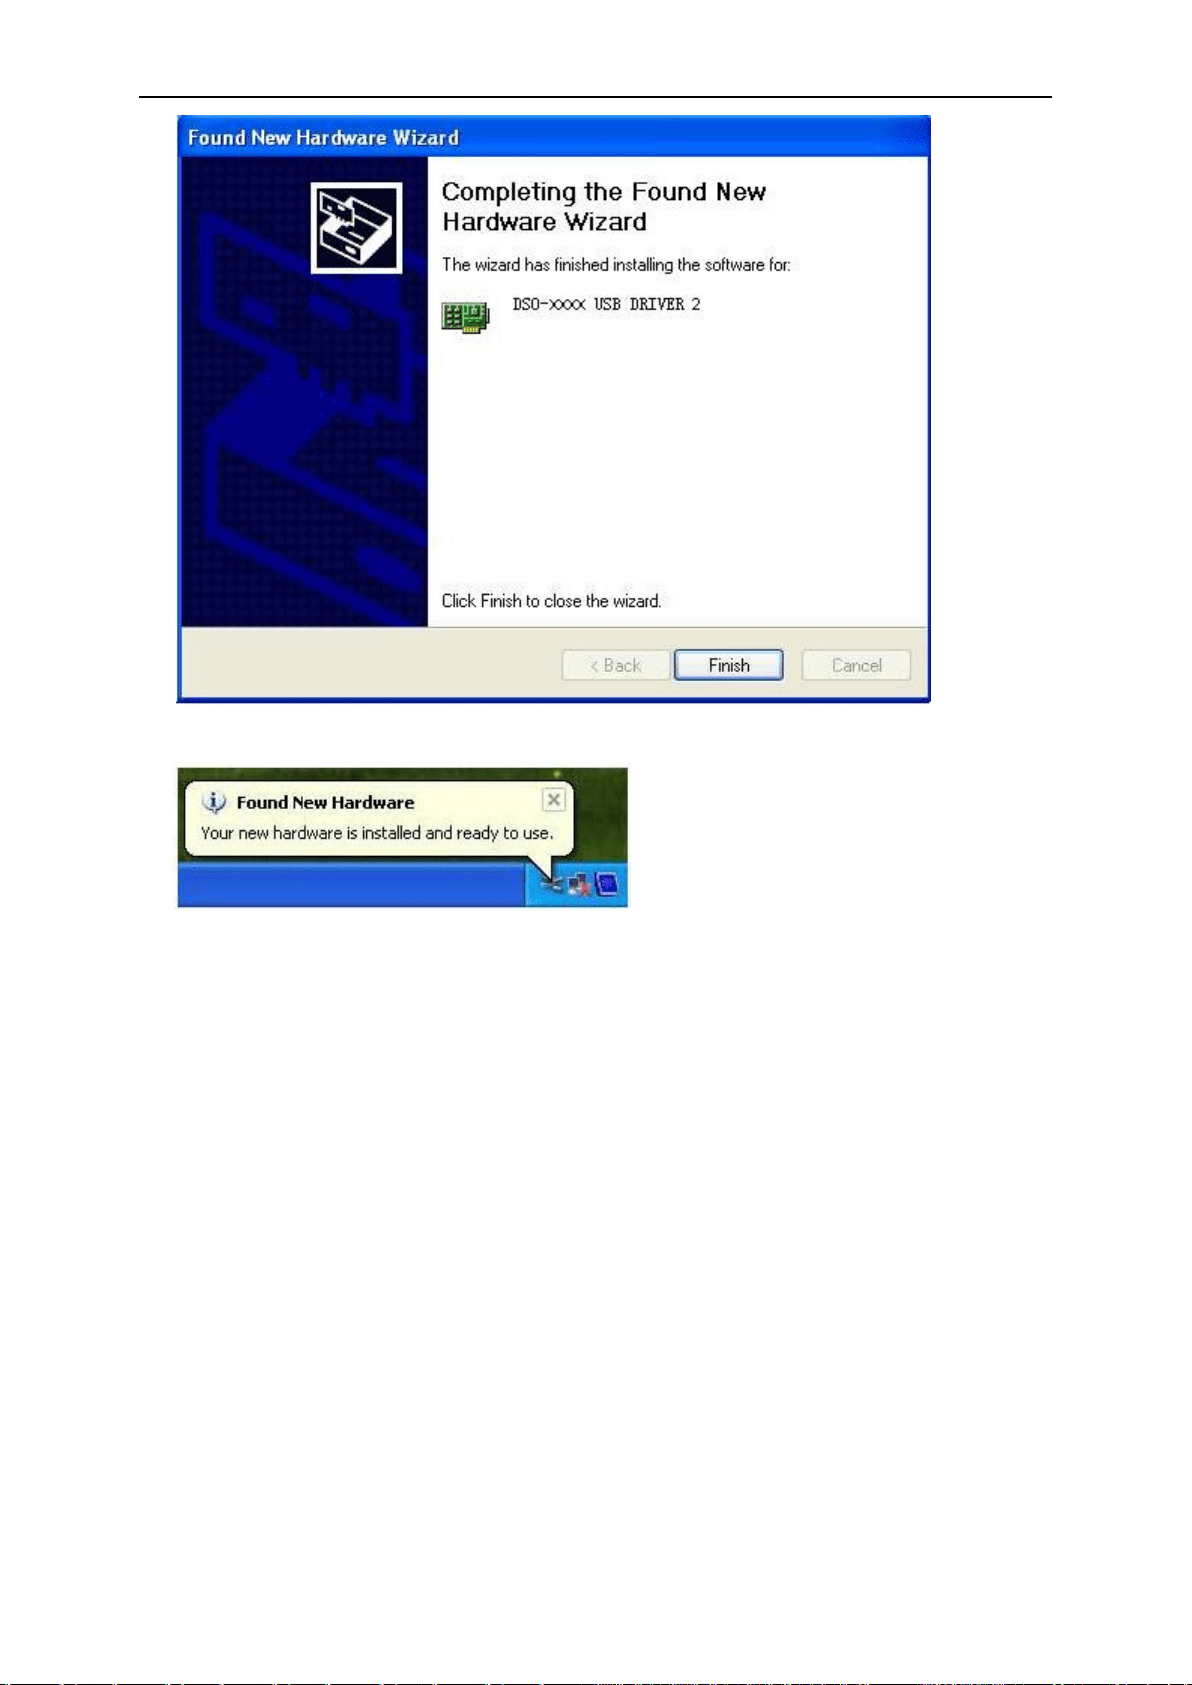
9. New hardware wizard installs software and finish new hardware search wizard.
PC Application
User’s Manual 15
10. Your new hardware is installed and ready to use.
Note: Simply plug this cable’s USB-B end into the device, and plug the two USB-A ends into open
ports on one PC. This cable then pulls power from both USB port, and thus increases the output to
the external driver. The red molded hood on the auxiliary USB-A connector enables the user to
quickly distinguish between main and auxiliary power.
If the DSO instrument does not work, the possible causes are:
1. The instrument is not connected to PC.
2. The driver is not found.
3. The driver is wrong.
Method: Update Driver
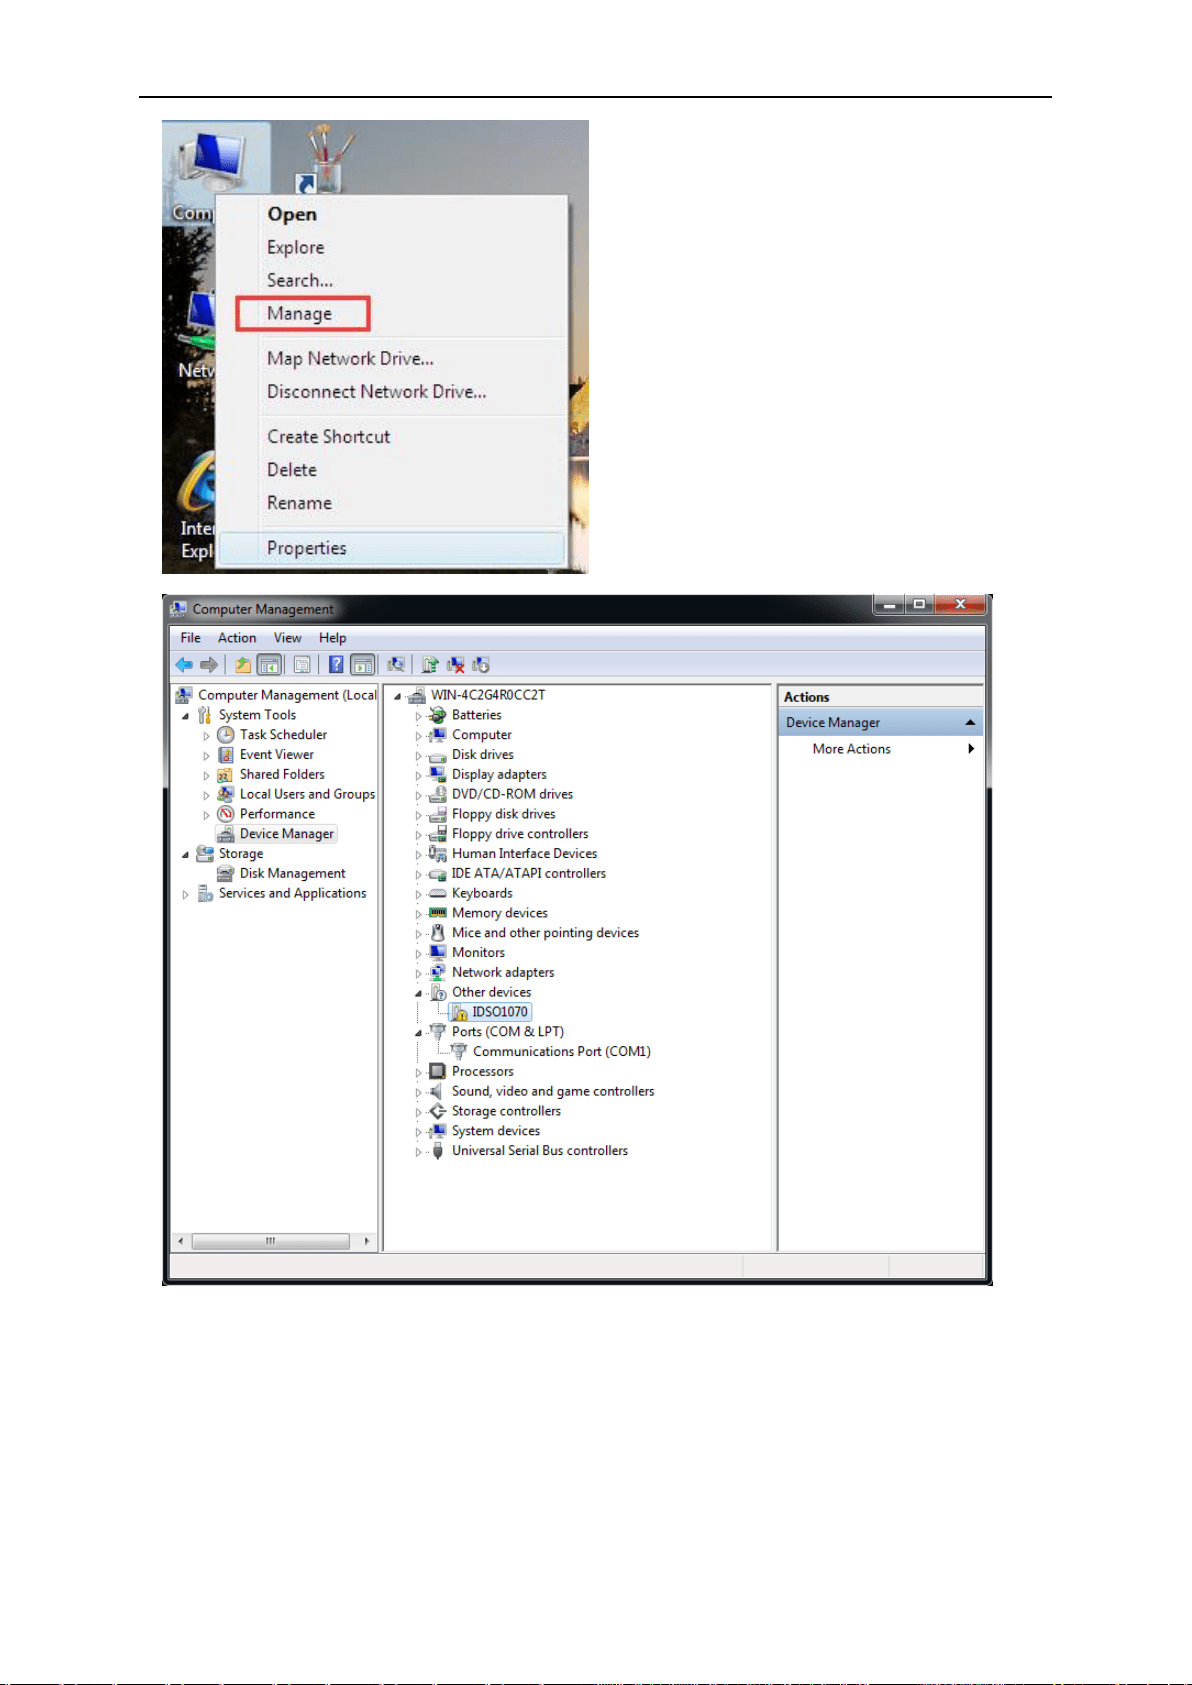
Open “Device Manager” and see the driver is right or not.
If the driver is wrong, please update the driver!
1. Right click “Computer->Manager” to open the device manager.
PC Application
User’s Manual 16
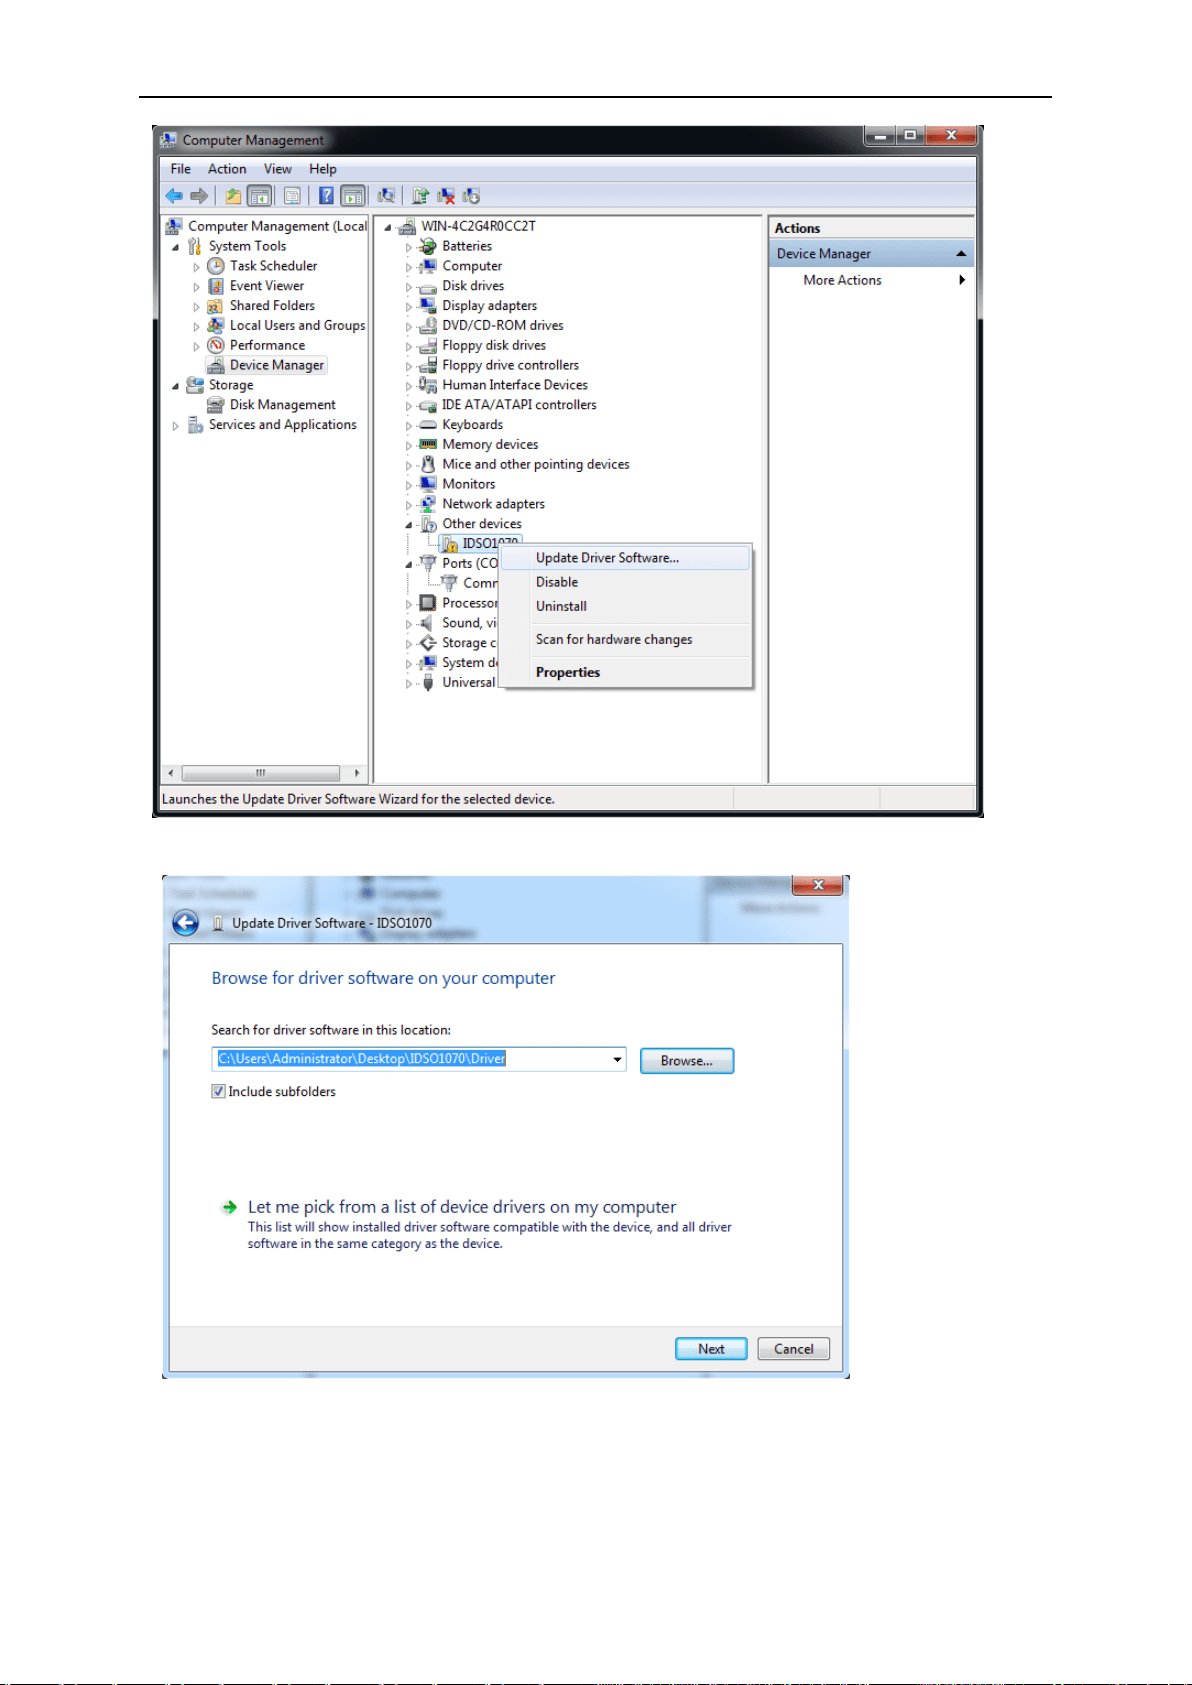
2. Right click “IDSO1070”, select “Update driver software”. According to the installation wizard to
install.
PC Application
User’s Manual 17
3. Select the driver path, click “Next”.
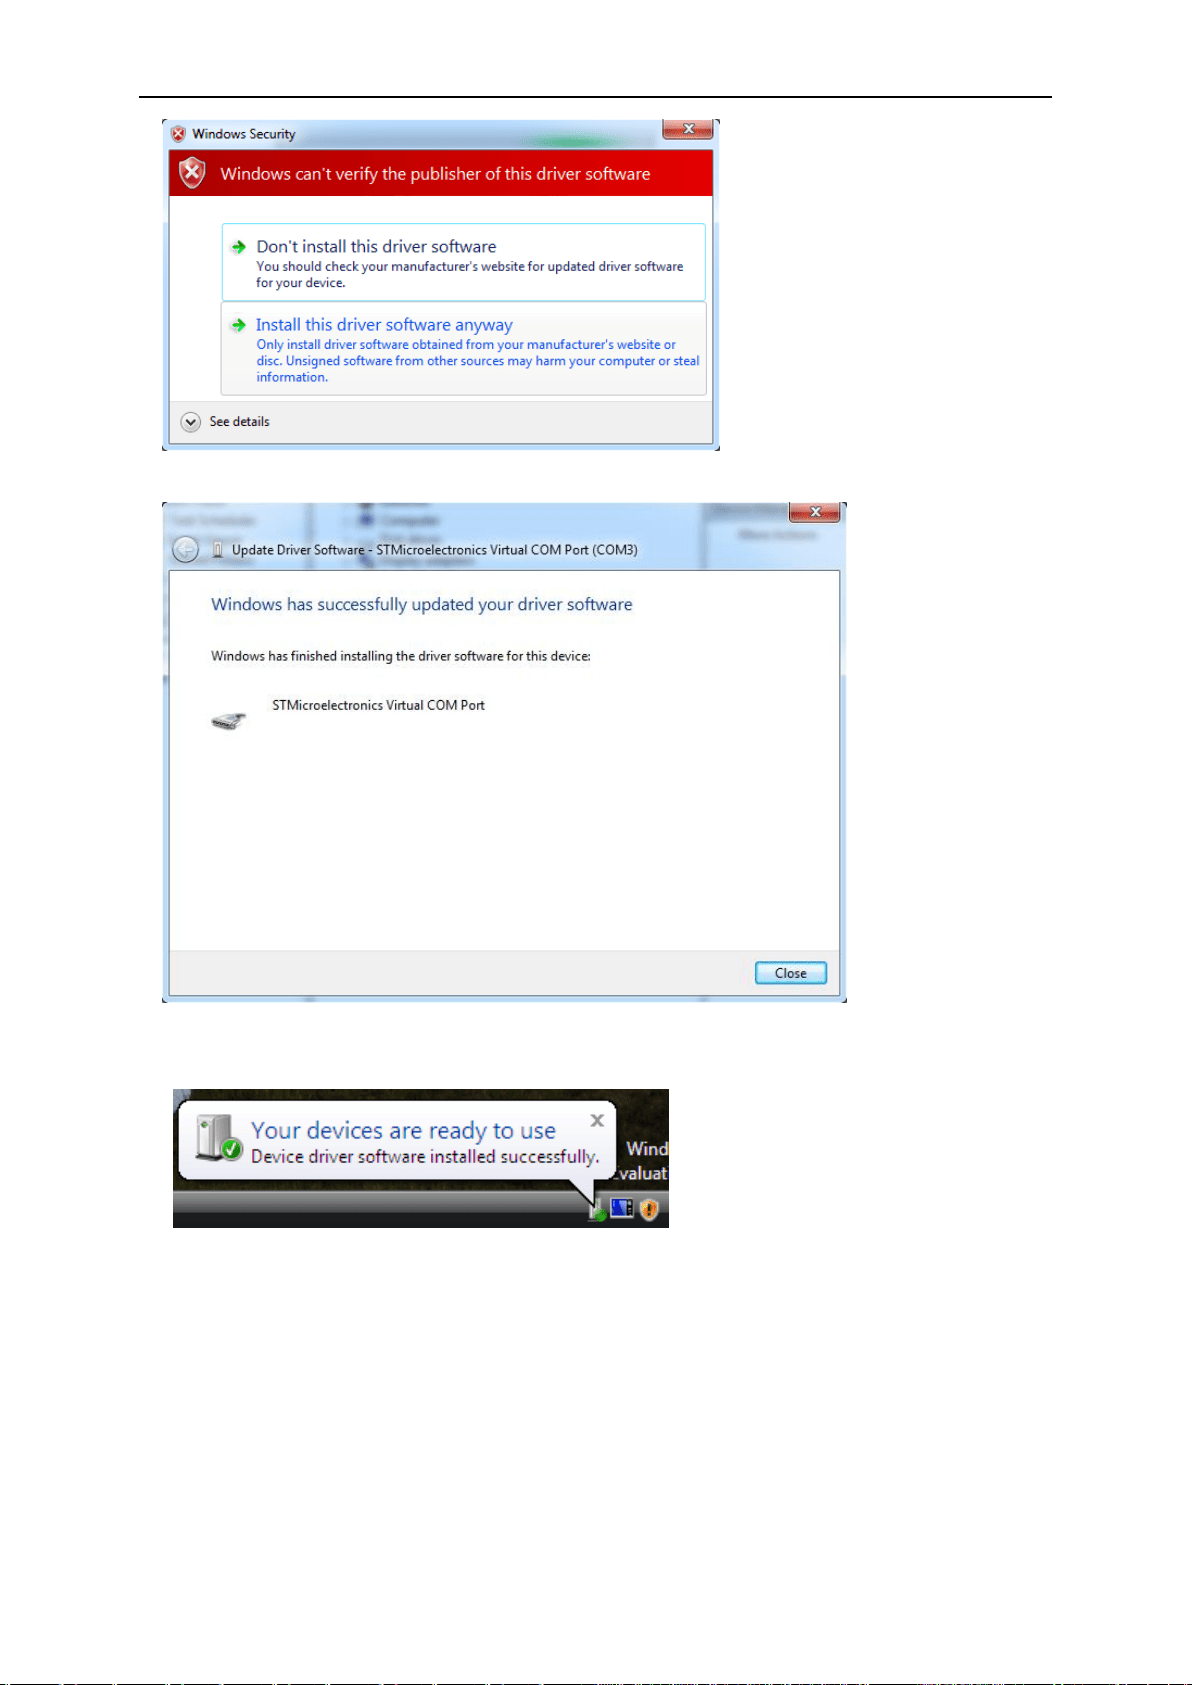
4. Click “Install this driver software anyway”.
PC Application
User’s Manual 18
5. The driver has been successfully installed.
Now your device is ready to use.
2.3 Set Connection Mode with PC
Communicate with PC via USB cable
1. Connect the A-Type Plug of USB cable to your PC’s USB port. Connect the B-Type Plug of
USB cable to IDSO’s USB port.
PC Application
User’s Manual 19
2. Power on the IDSO.
3. Set connect mode to USB mode. Please refer to Set Connection Mode.
4. Double click shortcut icon on desktop to open IDSO software. It will communicate with IDSO
device automatically.
5. If the device is connected with PC successfully, the status information will display “Connected”
on bottom left status bar.
Note: Only IDSO windows software can support USB mode.
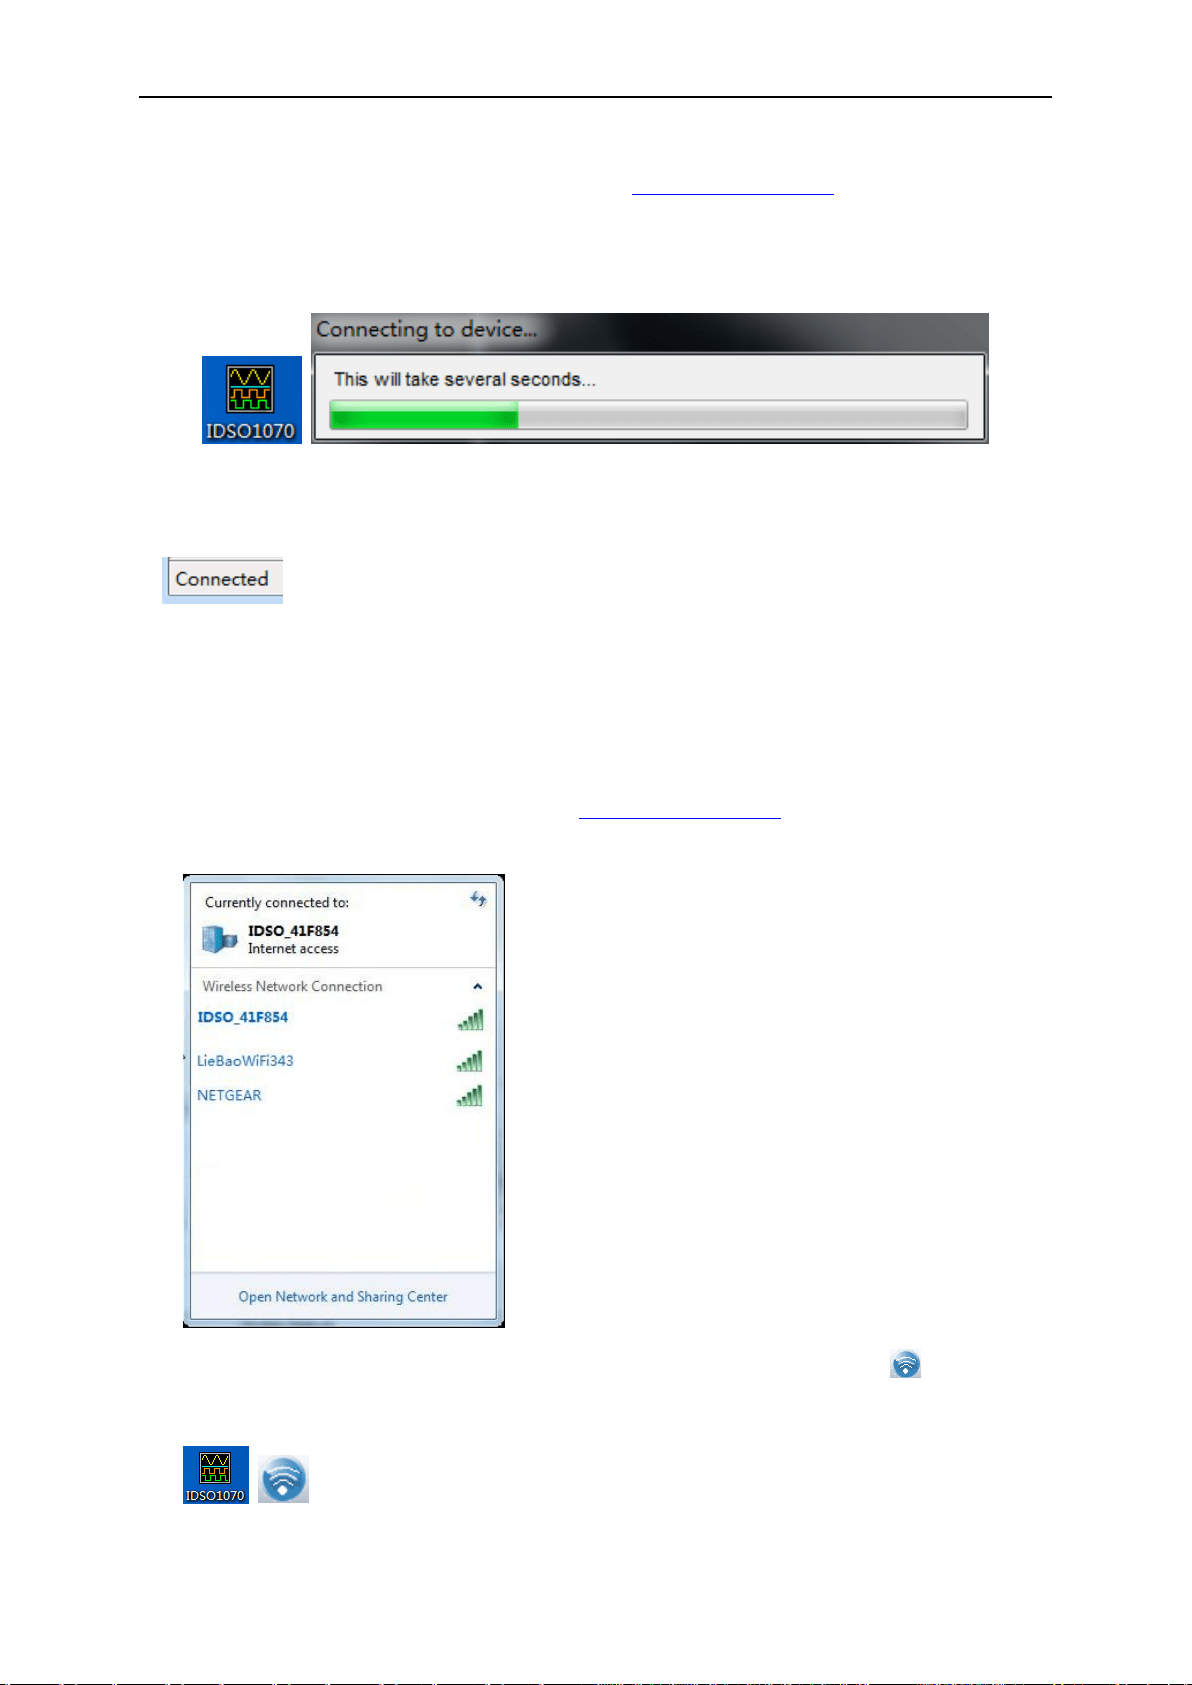
Communicate with PC via Wi-Fi
1. Power on the IDSO.
2. Set connect mode to Wi-Fi. Please refer to Set Connection Mode.
3. Connect your PC with the Wi-Fi access point.
4. Double click shortcut icon on desktop to open IDSO software. And click in toolbar to
connect via Wi-Fi.
5. If the device is connected with PC successfully, the status information will display “Connected”
PC Application
User’s Manual 20
on bottom status bar.
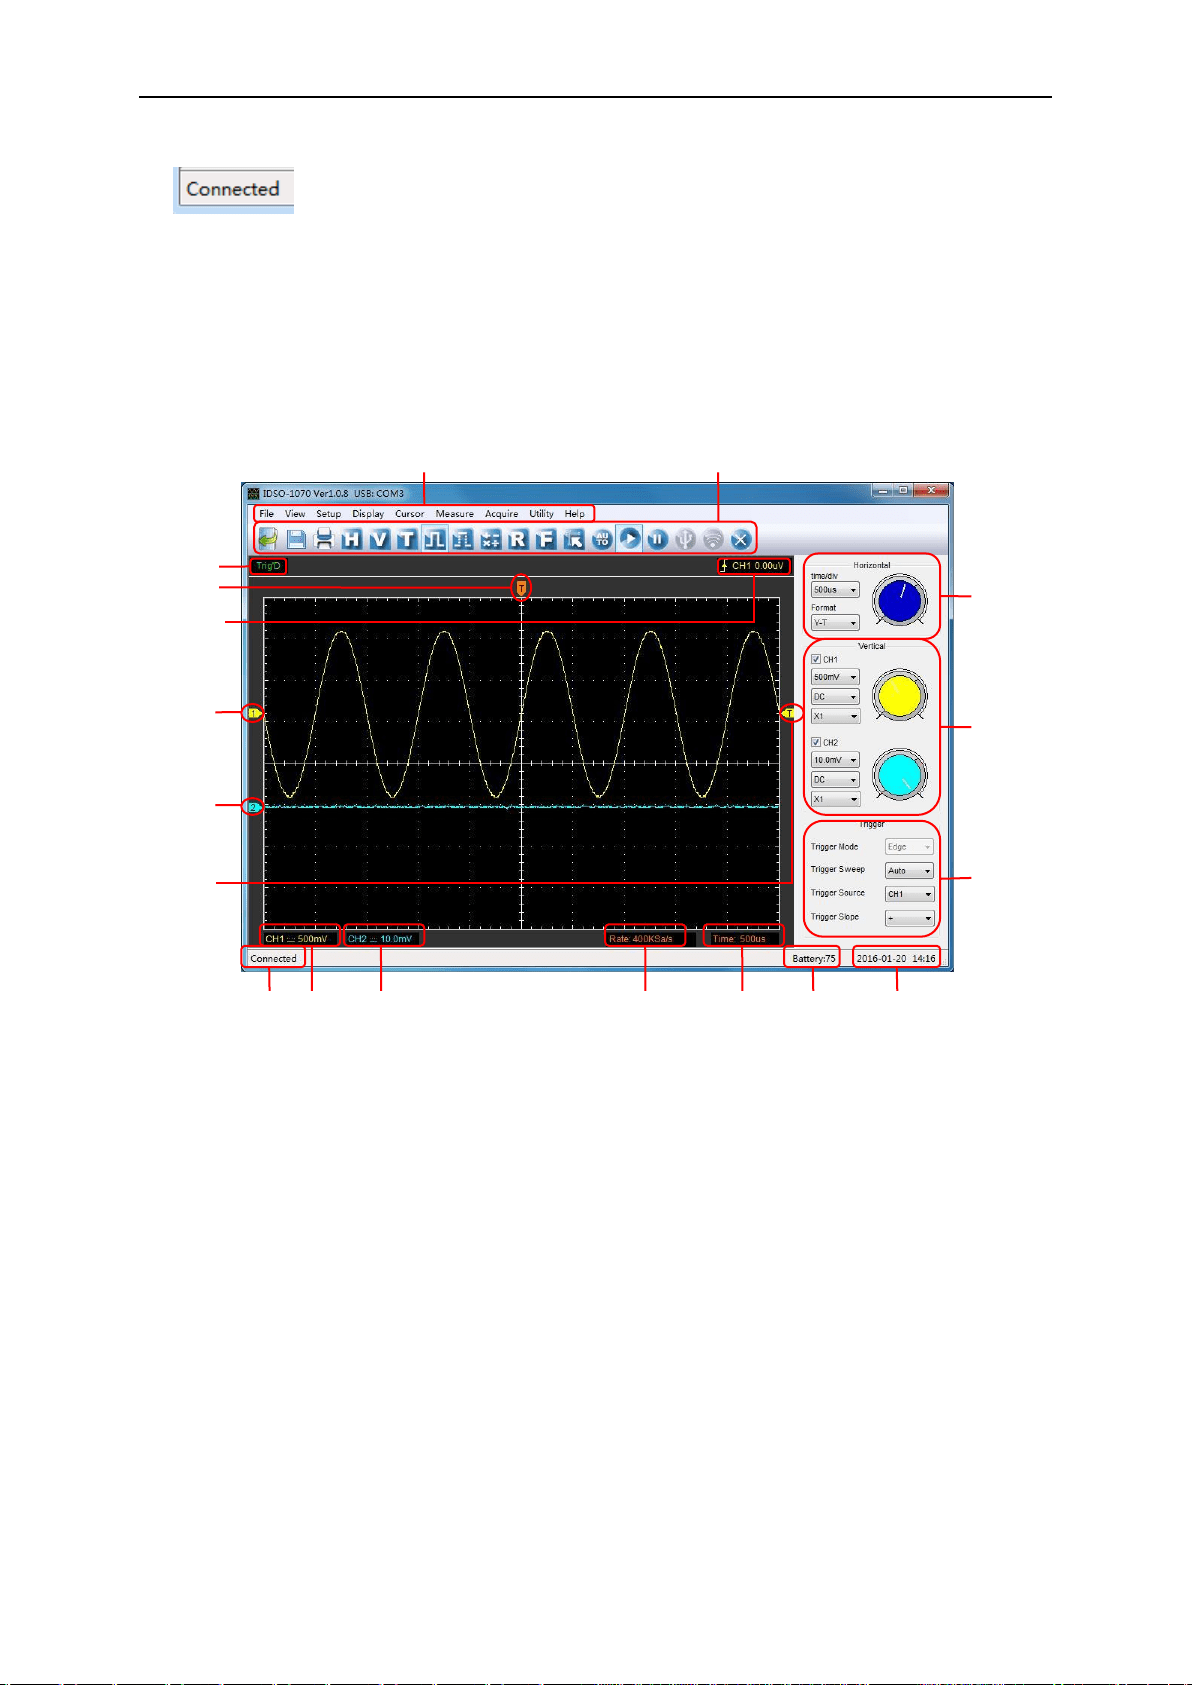
2.4 The User’s Interface
Click the software icon on the desk after you finished the software setting and equipment
connecting. Then a user interface will be showed as follows:
1. The Main Menu
All setting can be found in the main menu.
2. The Toolbar
3. The Horizontal Panel
The user can change Time/Div, format in the panel.
4. The vertical Panel
The user can turn on/off the CH1/CH2.Also the user can change the CH1/CH2 volt/div, coupling
and probe attenuation.
5. The Trigger Panel
In this panel, the user can change the trigger mode, sweep, source and slope.
6. Displays the system time.
1
3
4
2
5
6
7
8
9
10
11
12
13
14
15
18
17
16

PC Application
User’s Manual 21
7. Battery Level.
8. Time/Div.
9. Sample Rate.
10. Displays the CH2 information
Readout shows the coupling of the channels.
Readout shows the vertical scale factors of the channels.
A “B” icon indicates that the channel is bandwidth.
11. Displays the CH1 information
Readout shows the coupling of the channels.
Readout shows the vertical scale factors of the channels.
A “B” icon indicates that the channel is bandwidth.
12. Status Information.
Demo: Don’t communicate with PC.
Disconnected: The device is not connected with PC successfully.
Connected: The device is connected with PC successfully.
13. Trigger Level.
14. The marker shows the reference points of the displayed waveforms.
If there is no marker, the channel is not displayed.
15. The same as 14.
16. Displays the trigger information
Display the edge trigger slope, source and level.
17. Marker shows horizontal trigger position.
18. Trigger status indicates the following.
Auto: The oscilloscope is in auto mode and is acquiring waveform in the absence of triggers.
Trig’D: The oscilloscope has seen a trigger and is acquiring the post trigger data.
WAIT: All pretrigger data has been acquired and the oscilloscope is ready to accept a trigger.
Stop: The oscilloscope has stopped acquiring waveform data.
Run: The oscilloscope is running.
Play: The oscilloscope is displaying the record waveform.

PC Application
User’s Manual 22
2.5 The Menu System
The Main Menu:
1. File: Load or save CSV, waveform and setup
2. View: Change the user interface
3. Setup: Set Horizontal, vertical, trigger system.
4. Display: Change wave display type, intensity and color.
5. Cursor: Set cursor measure source and measure type
6. Measure: Set measurement source and measure parameters.
7. Acquire: Start, Stop, Autoset and other operation setting
8. Utility: Utility setting, record waveform, pass/fail test, self calibration, factory setup and
language setting.
9. Help: Turn on help file.
2.6 Setup the Oscilloscope
Use “AUTOSET” to display a signal automatically.
Auto setup functions one time each time you click the “AUTO” button. The function obtains a
stable waveform display for you. It automatically adjusts the vertical scale, horizontal scale and
trigger settings. Auto setup also displays several automatic measurements in the graticule area,
depending on the signal type.
Connect a signal to the CH1 input:
1. Connect a signal to the oscilloscope as described above.
2. Click the “Acquire ->Autoset” button.
The oscilloscope will change the current settings to display this signal.
Save Setup
The oscilloscope software saves the current setup before you close the oscilloscope software.
The oscilloscope recalls this setup when you run the software next time. You can use the
“File->Save Setup” in main menu to permanently save setting.
Load Setup
The oscilloscope can recall the last setup before the oscilloscope software was running, any saved
PC Application
User’s Manual 23
setups, or the factory setup. You can use the “File->Load Setup” in main menu to permanently
recall setup.
Factory Setup
The oscilloscope software is set up for normal operation when it is shipped from the factory. This is
the factory setup. Click the “Utility->Factory Setup” in main menu to recall this setup.
2.7 Set Horizontal System
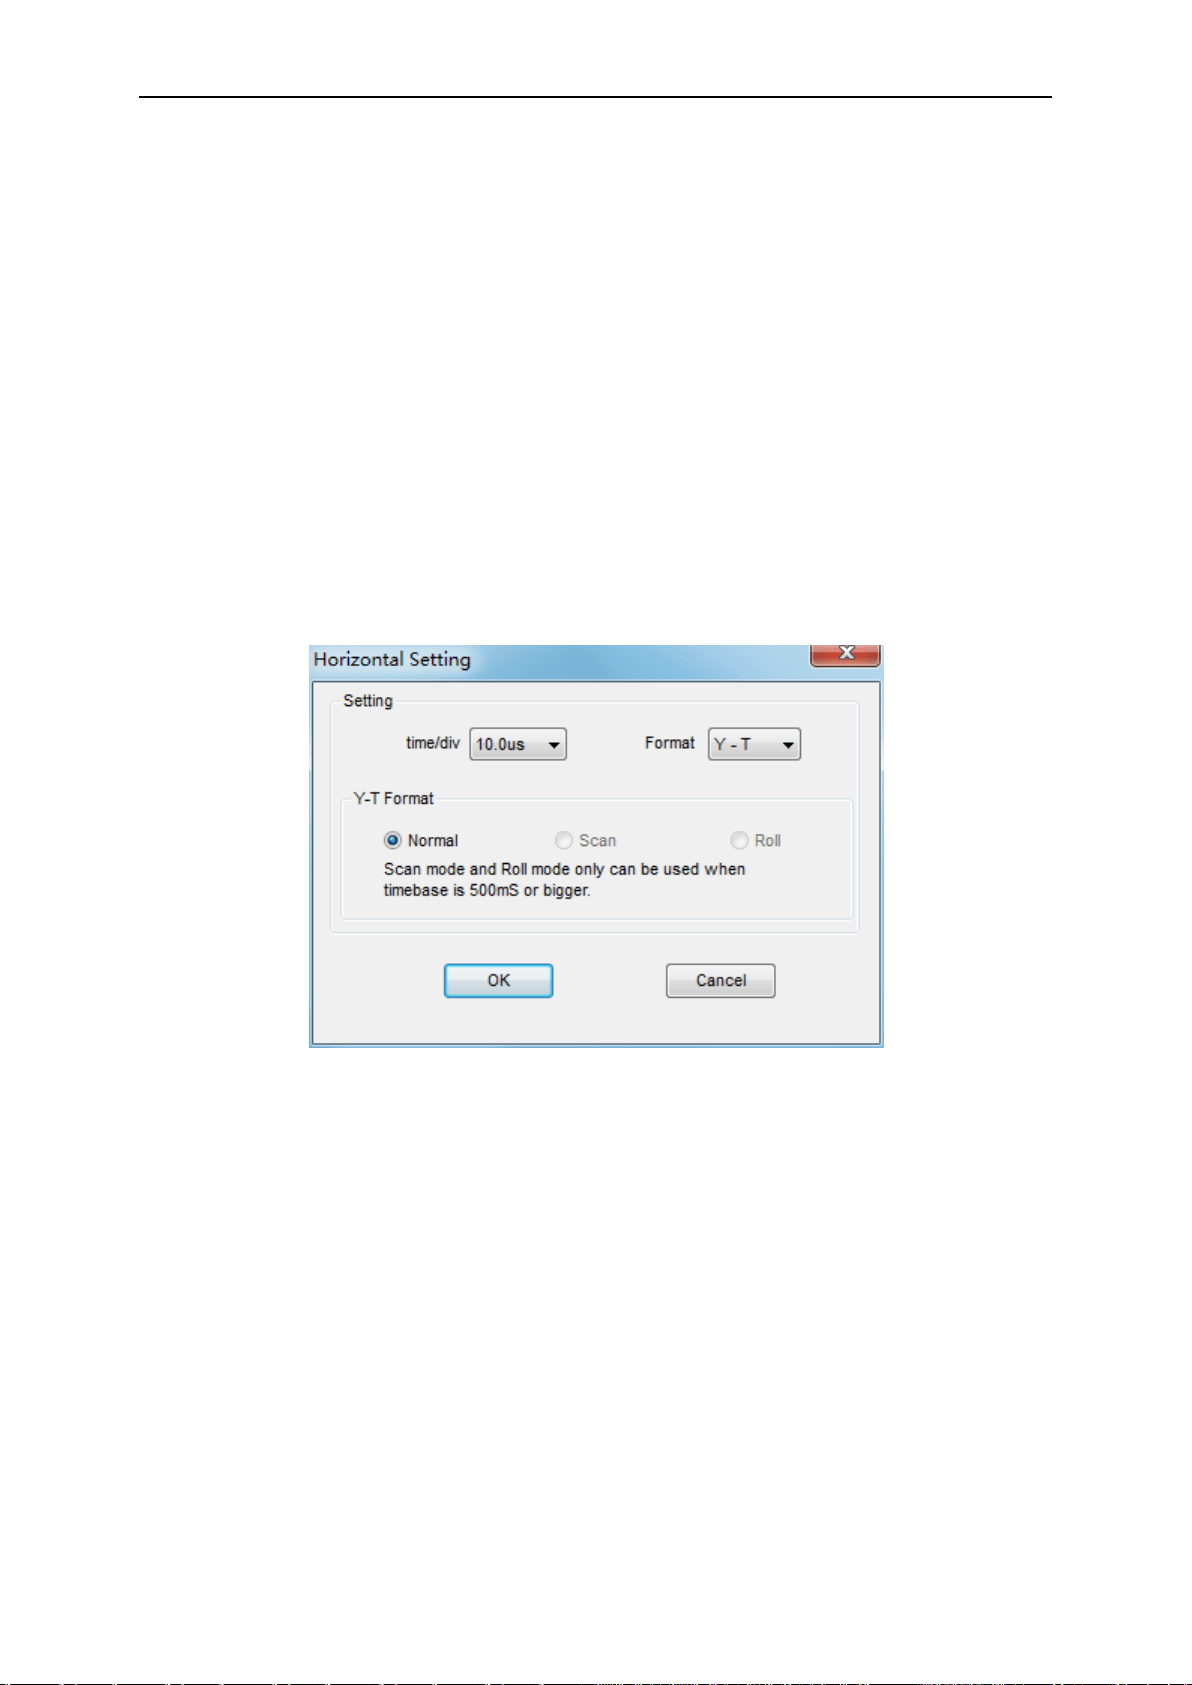
2.7.1 Horizontal Setting
Click “Setup->Horizontal” menu.
The following figure shows the Horizontal System window. It shows the horizontal parameters
settings.
Horizontal Setting
1. Time/DIV: lead the setting of the time base parameters
Select the time setting for the beam to sweep one major division on the screen. By selecting
different time/div settings it is possible to zoom in on the frozen waveform on the screen.
2. Format: lead the setting of the horizontal format parameters.
Set the waveform display format (Y-T, X-Y, Scan and Roll).
Y -T: Show the relative relation between vertical voltage and horizontal time.
X -Y: Show CH1 value at X axis; CH2 value at Y axis. The XY format is used to analyzer
phase difference, such as those represented by Lissajous patterns.
Y-T Format

PC Application
User’s Manual 24
Scan: In Scan Mode, the waveform display scan updates from left to right.
In Scan mode, trigger and horizontal offset control of waveforms are available during Scan Mode.
This mode is only available when set to 500ms/div or slower. Generally, used for measuring low
frequency signal.
Roll: In Roll Mode, the waveform display updates from right to left.
In Roll mode, the waveform display rolls from right to left. No trigger or horizontal offset control of
waveforms is available during Roll Mode. This is only available when set to 500ms/div or slower.
Caution: If the time/div bigger than or equal to 500ms, the format will change to Roll mode
automatically. If you want to select Scan mode, please click “Setup -> Horizontal ->Scan” in
main menu to set Scan mode manually.
Change Horizontal Position
Horizontal Position icon: Drag Horizontal Position icon on screen to adjust the trigger position
against screen. Double click the icon to reset the trigger point back to the screen center.
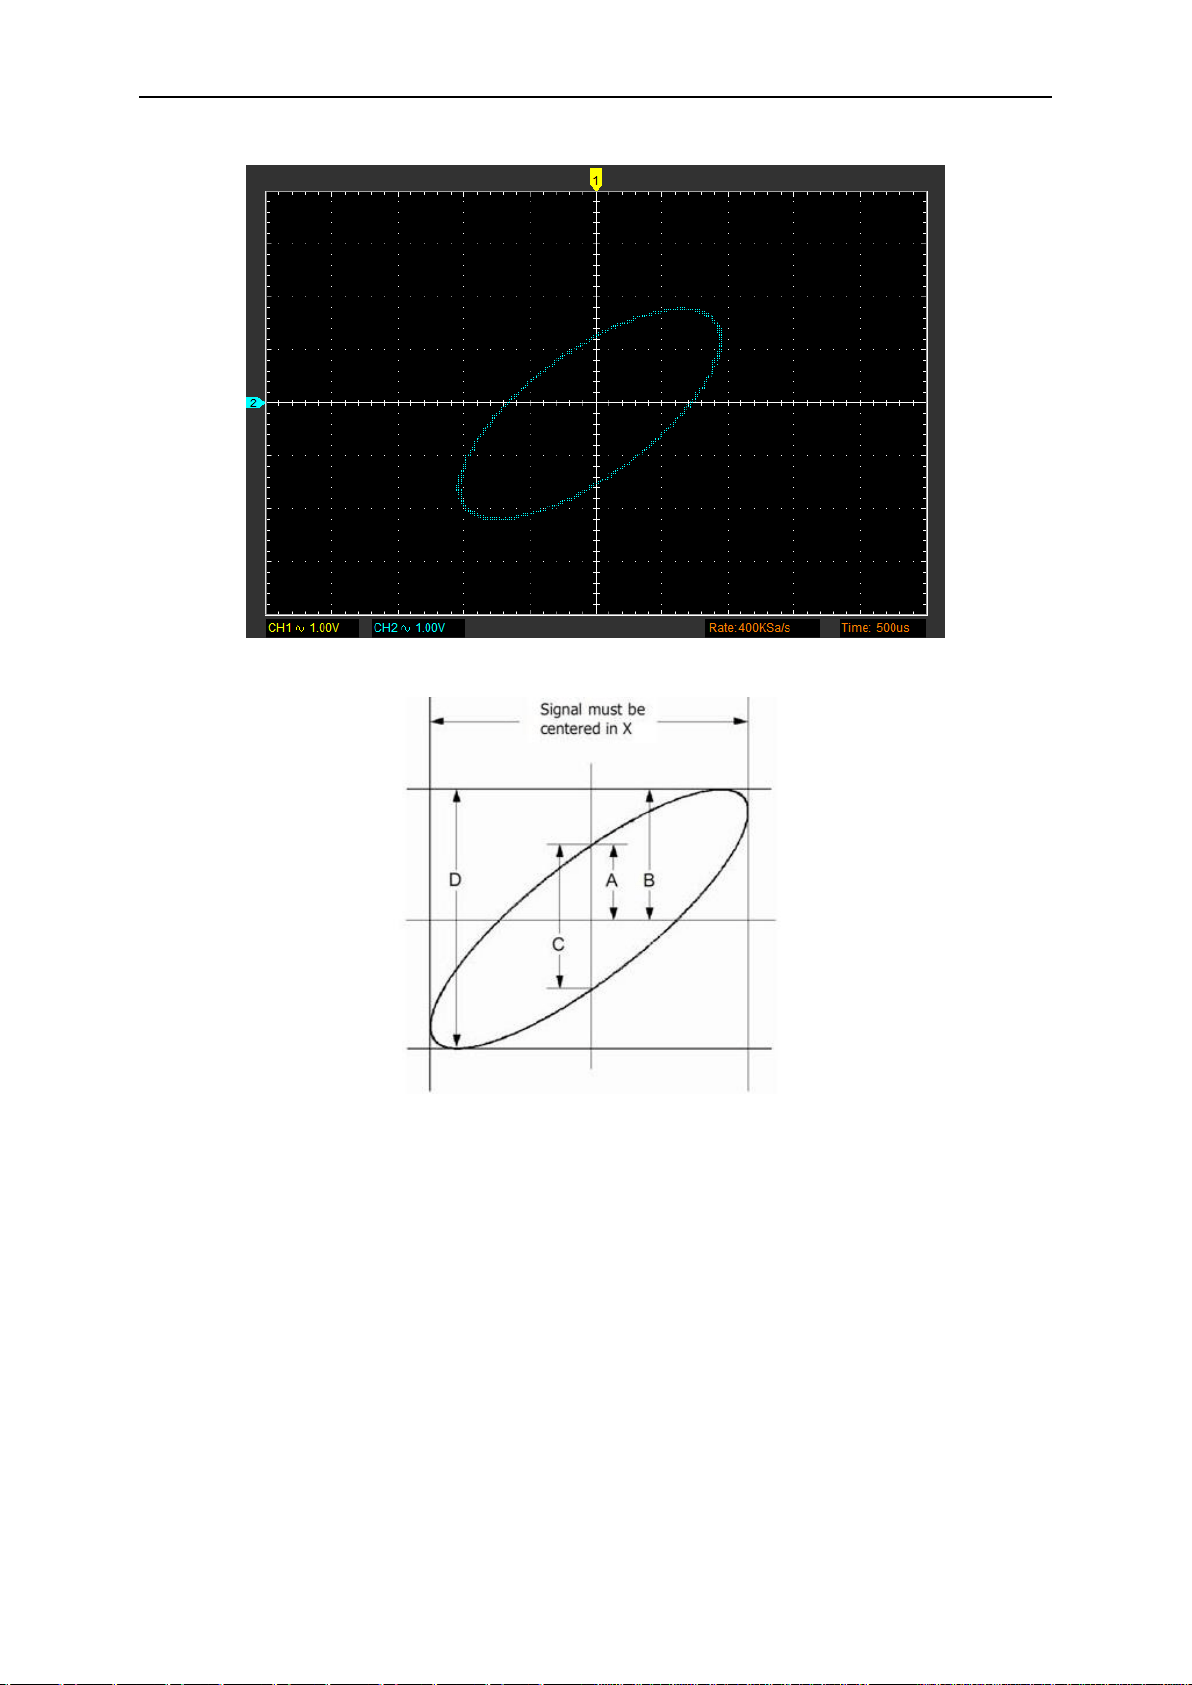
2.7.2 The Application of the X-Y Operation
X-Y Plot acts to analyze correlation of data of two channels. Lissajous diagram is displayed in the
screen when you use X-Y Plot, which enables to compare frequencies, amplitudes and phases of
counterpart waveform against the reference waveform. This makes it possible to compare and
analyze frequency, amplitude and phase between input and output.
Do these steps as follows:
1. Set the probe attenuation to “x10”. Set the switch to “x10” on the probes.
2. Connect the CH1 probe to the input of the circuit, and connect the CH2 probe to the output
of the circuit.
3. Click AUTO button.
4. Adjust the vertical scale and offset to display approximately the same amplitude signals on
each channel.
5. Select X-Y format at Horizontal window. The oscilloscope will displays a Lissajous pattern
representing the input and the output characteristics of the circuit.
6. Adjust the scale and offset of the horizontal and vertical to a desirable waveform display. The
following picture shows a typical example.
7. Apply the Ellipse Method to observe the phase difference between the two channels.
PC Application
User’s Manual 25
Signal in X-Y Format:
Instruction of the Ellipse Method:
Sinθ = A/B or C/D, where θ = phase shift (in degrees) between the two signals.
From the formula above:
θ = ±arcsine (A/B) or ±arcsine (C/D)
θ must be in the range of (0~π/2) or (3π/2~2π) if the main axis of the ellipse is between I and III
quadrant .If the main axis is at II and IV quadrant, θ must be in the range of (π/2~π) or (π~3π/2).
PC Application
User’s Manual 26
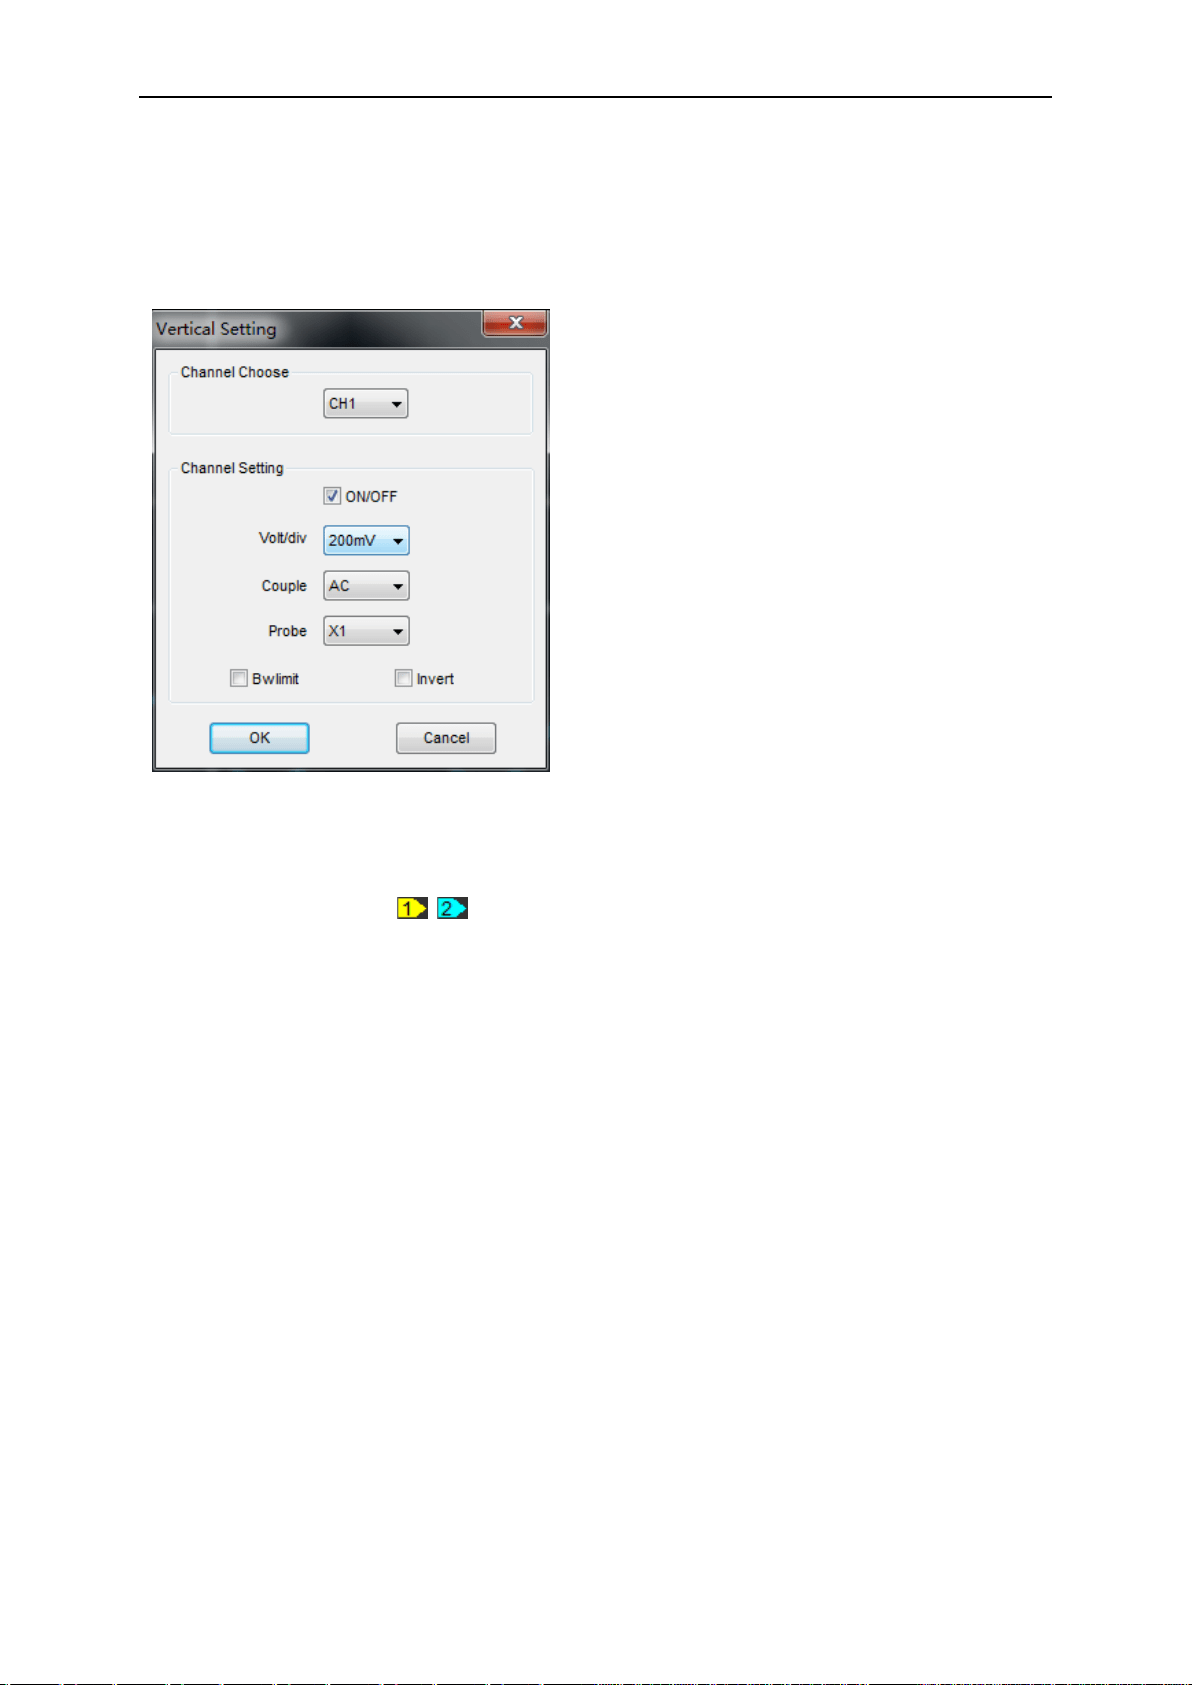
2.8 Set Vertical System
Click “Vertical” in “Setup” menu.
The following figure shows the Vertical System window. It shows the vertical parameters settings.
Also user can also set parameters in the right sidebar.
Vertical Position icon
Drag Vertical Position icon to move waveform up and down on the screen. Double click
the icon to reset the waveforms to the vertical center position on the screen.
Change Volt/Div
You can click “Volt/div” in “Vertical Setting” window to select the voltage.
You can left click and drag the mouse on the knob to change the voltage.
The signal on the screen can be enlarged or reduced vertically by adjusting the displayed voltage
per division. (V/div = voltage per division).
Set Channel Coupling
Click “Couple” in “Vertical Setup” window.
You can set the coupling to DC, AC or GND. If you set the coupling to DC, it blocks the AC
component of the input signal.
AC: the input signal is capacitive coupled to the input amplifier/attenuator. Only the AC
components are measured.
GND: the input signal is broken and the input amplifier/attenuator is connected to earth. Use
Channel Choose: User can select the channel by
clicking the Combo box.
ON/OFF: Turn on/off the channel
Volt/div: Select the channel voltage/div
Couple: Select the channel coupling
DC/AC/GND.
Probe: Set the selected one according to the
probe attenuation factor to ensure correct vertical
scale reading.
BW Limit: Reject the frequency component
higher than 20MHz.
Invert: Turn on/off the invert function.
PC Application
User’s Manual 27
this position for selecting a reference point on the display.
DC: the input signal is directly connected to the input amplifier/attenuator. Both AC and DC
voltage are measured.
Probe Attenuation Setting
Select the attenuation factor for the probe. To check the probe attenuation setting, toggle the
probe menu to match the attenuation factor of the probe.
This setting remains in effect before you changed again. Click “Probe” in “Vertical Setting”
window to select the probe attenuation.
Note: The attenuation factor changes the vertical scale of the oscilloscope so that the
measurement results refect the actual voltage levels at the probe tip.
Bandwidth Limit
The oscilloscope is set to full bandwidth and will pass the high frequency component in the signal if
the “BW Limit” was turned off.
The oscilloscope will reject the frequency component higher than 20MHz if the “BW Limit” was
turned on.
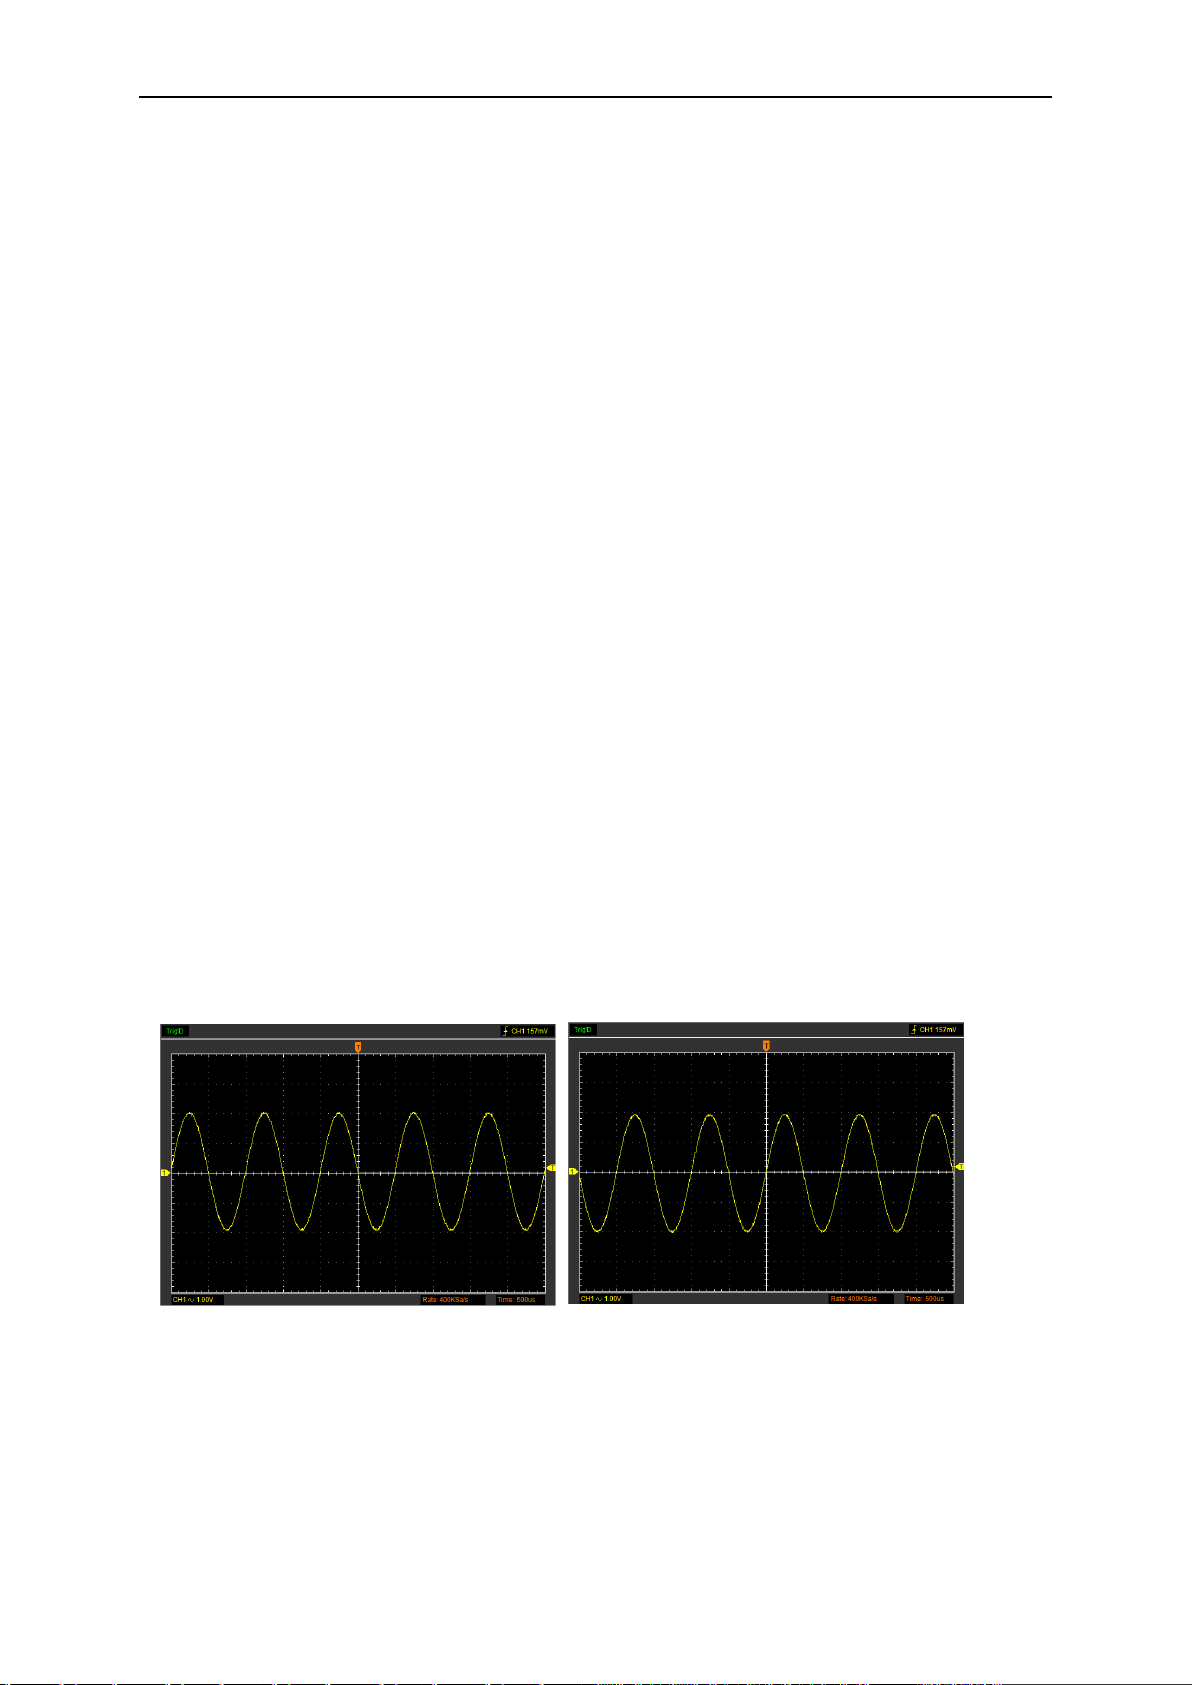
Invert
The invert function turns the displayed waveform 180 degrees, with respect to the ground level.
When the oscilloscope is triggered on the inverted signal, the trigger is also inverted.
Click “Invert” in “Vertical Setting” window.
Not select “Invert”
Select “Invert”
PC Application
User’s Manual 28
2.9 Set Trigger System
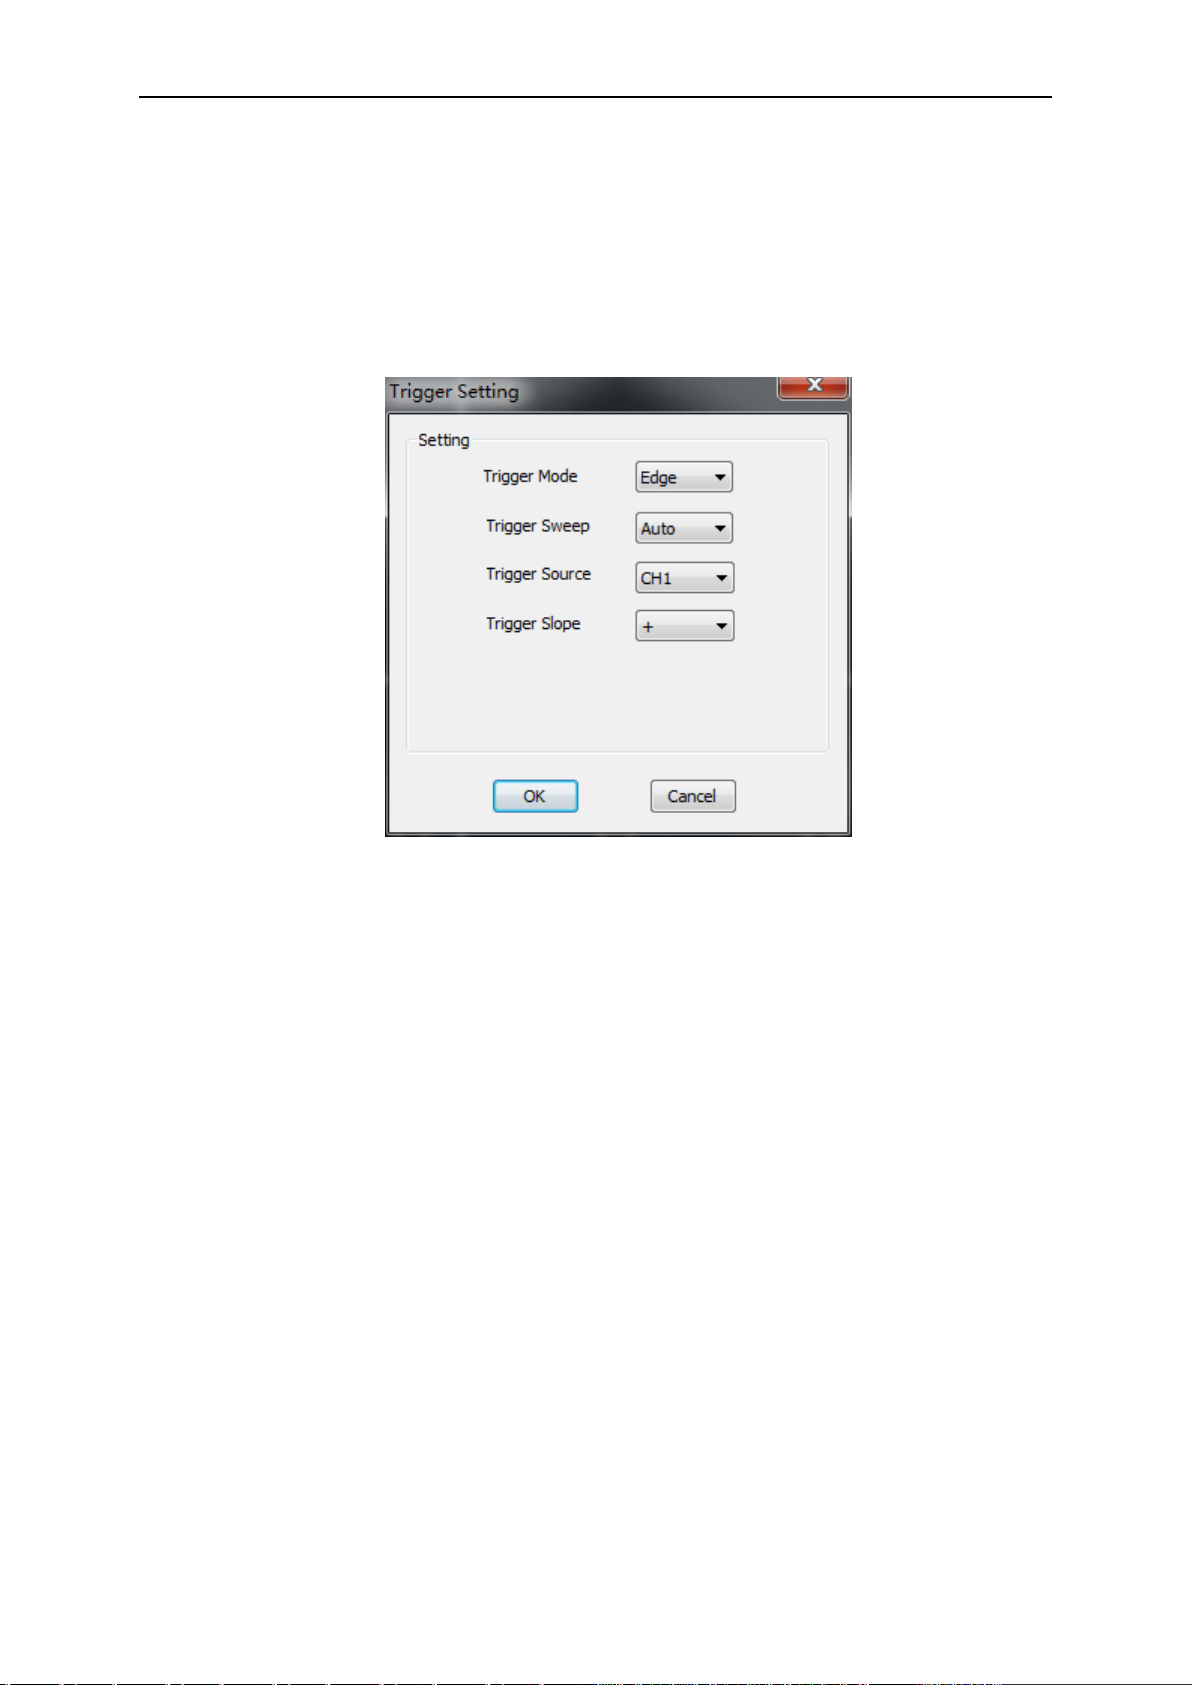
2.9.1 Trigger Setting
Click “Setup-> Trigger” menu.
The following figure shows the trigger system control.
Trigger Setting
The trigger determines when the oscilloscope starts to acquire data and display a waveform.
When a trigger is set up properly, it can convert unstable displays or blank screens into meaningful
waveforms.
If the oscilloscope wants to acquire a waveform, it collects enough data so that it can draw the
waveform to the left of the trigger point. The oscilloscope continues to acquire data while waiting
for the trigger condition to occur. The oscilloscope continues to acquire enough data so that it can
draw the waveform to the right of the trigger point after it detects a trigger.
The Edge trigger determines whether the scope finds the trigger point on the rising or the falling
edge of the signal. Select Edge trigger mode to trigger on Rising edge or Falling edge.
Trigger Mode: Edge.
Trigger Sweep: Set the sweep mode to Auto, Normal or Single.
Auto: Performs the acquisition freely in absence of valid trigger. It allows the generation of
untriggered waveforms.
Normal: Updates the displayed waveforms only when the oscilloscope detects a valid trigger
condition. Before this update, the oscilloscope still displays the old waveforms. This mode
shall be used when you want to only view the effectively triggered waveforms. In this mode,
the oscilloscope displays waveforms only after the first trigger.
Single: Acquire waveform when trigger occurred, then stop to acquire.

PC Application
User’s Manual 29
Trigger Source: You can use the trigger source options to select the signal that the oscilloscope
uses as a trigger. Select the trigger source signal (CH1, CH2 or EXT).
Trigger Slope: Set the slope to Rising (+) or Falling (-).
Rising: Trigger on rising edge
Falling: Trigger on falling edge
Also user can also set trigger parameters in the bottom right sidebar.
Change Trigger Level
Trigger Level icon: User can also drag the trigger icon on screen to adjust the trigger
level. Double click trigger icon to set trigger level to the vertical midpoint between the peaks of the
trigger signal.
2.9.2 Capturing a Single-Shot Signal
To capture a single event, it needs to gather some pre-test knowledge of the signal in order to set
up the trigger level and slope correctly. For example, if the event is derived from 3.3V COMS logic,
a trigger level of 1.2 or higher Volts should work on a rising edge.
Do these steps as follows:
1. Set the probe and the channel attenuations to “x10”.
2. Set up the trigger in the Trigger Menu, or in the Trigger Setting window.
(1) Adjust the Trigger Mode to Edge.
(2) Set the Trigger Sweep to Single.
(3) Set the Trigger Source to CH1.
(4) Set the Trigger Slope to “+” which means you select the rising edge.
(5) Adjust the Volt/Div and the time base in a proper range for the signal.
(6) Drag the trigger level sign on the waveform display screen to proper position. It ally higher a
little above the normal level.
(7) Click START button to start capturing. When the trigger conditions are met, data appears on
the display representing the data points that the oscilloscope obtained with one acquisition.
This function helps to capture the signal occurrence easily, such as the noise with large amplitude;
set the trigger level higher a little above the normal level and press and wait. When noise occurs,
the instrument will record the waveform before and after the trigger.
PC Application
User’s Manual 30
2.10 Math and FFT
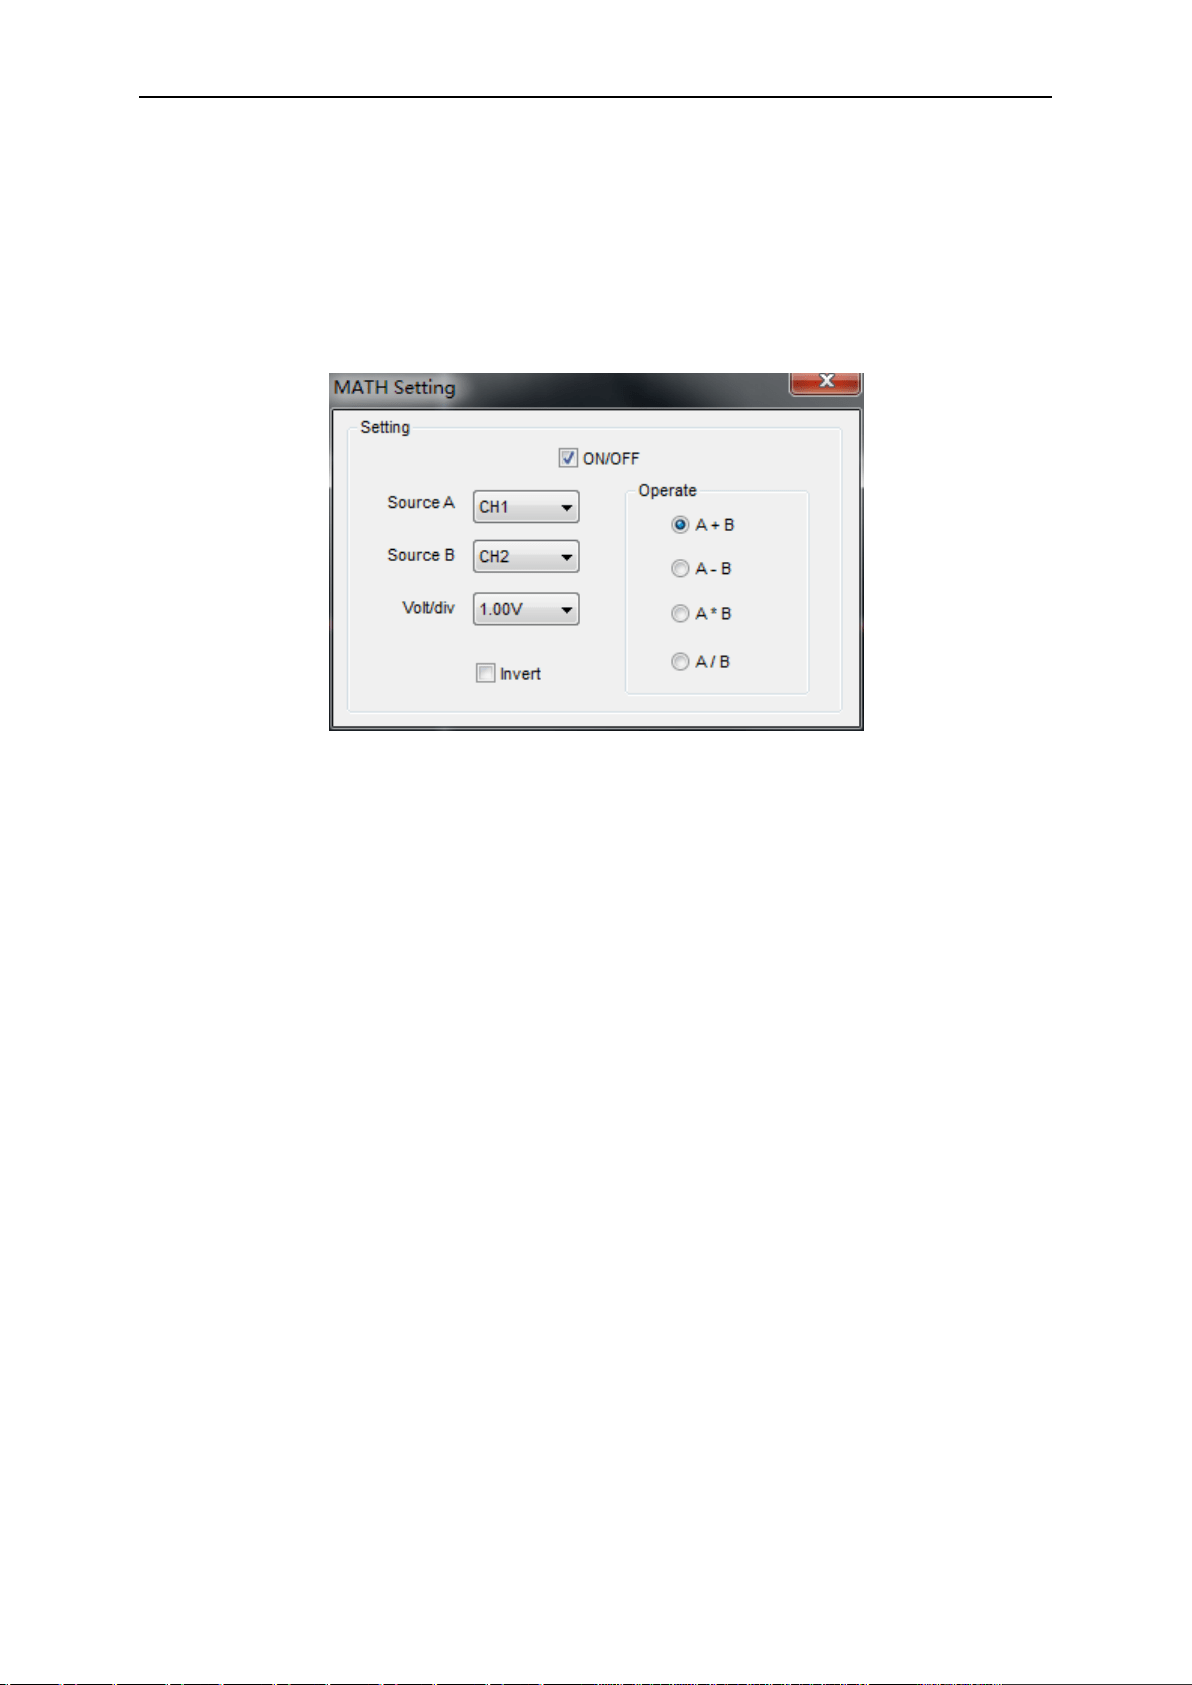
2.10.1 MATH
Click “Setup->MATH” to set MATH channel.
The MATH Setting window:
ON/OFF: Turn On/Off the MATH Channel.
Source A/B: Set the sources of the math channel.
Volt/DIV : Set the resolution of the math channel.
Operate: Set operates type of the math channel.
The mathematic functions include addition, subtraction, multiplication, division.
Operate
Four Types:
A + B Add source A and source B
A - B Subtract source B from source A
A x B Multiply source A by source B
A / B Divide source A by source B
In this function, use the addition, subtraction, multiplication, division, function to operate and
analyze the waveform.
Select the operate type in the Operate menu. Select source A and B. Then adjust the vertical
scale and offset to view the math channel clearly. The mathematic result can be measured by the
measure and the cursor.
PC Application
User’s Manual 31
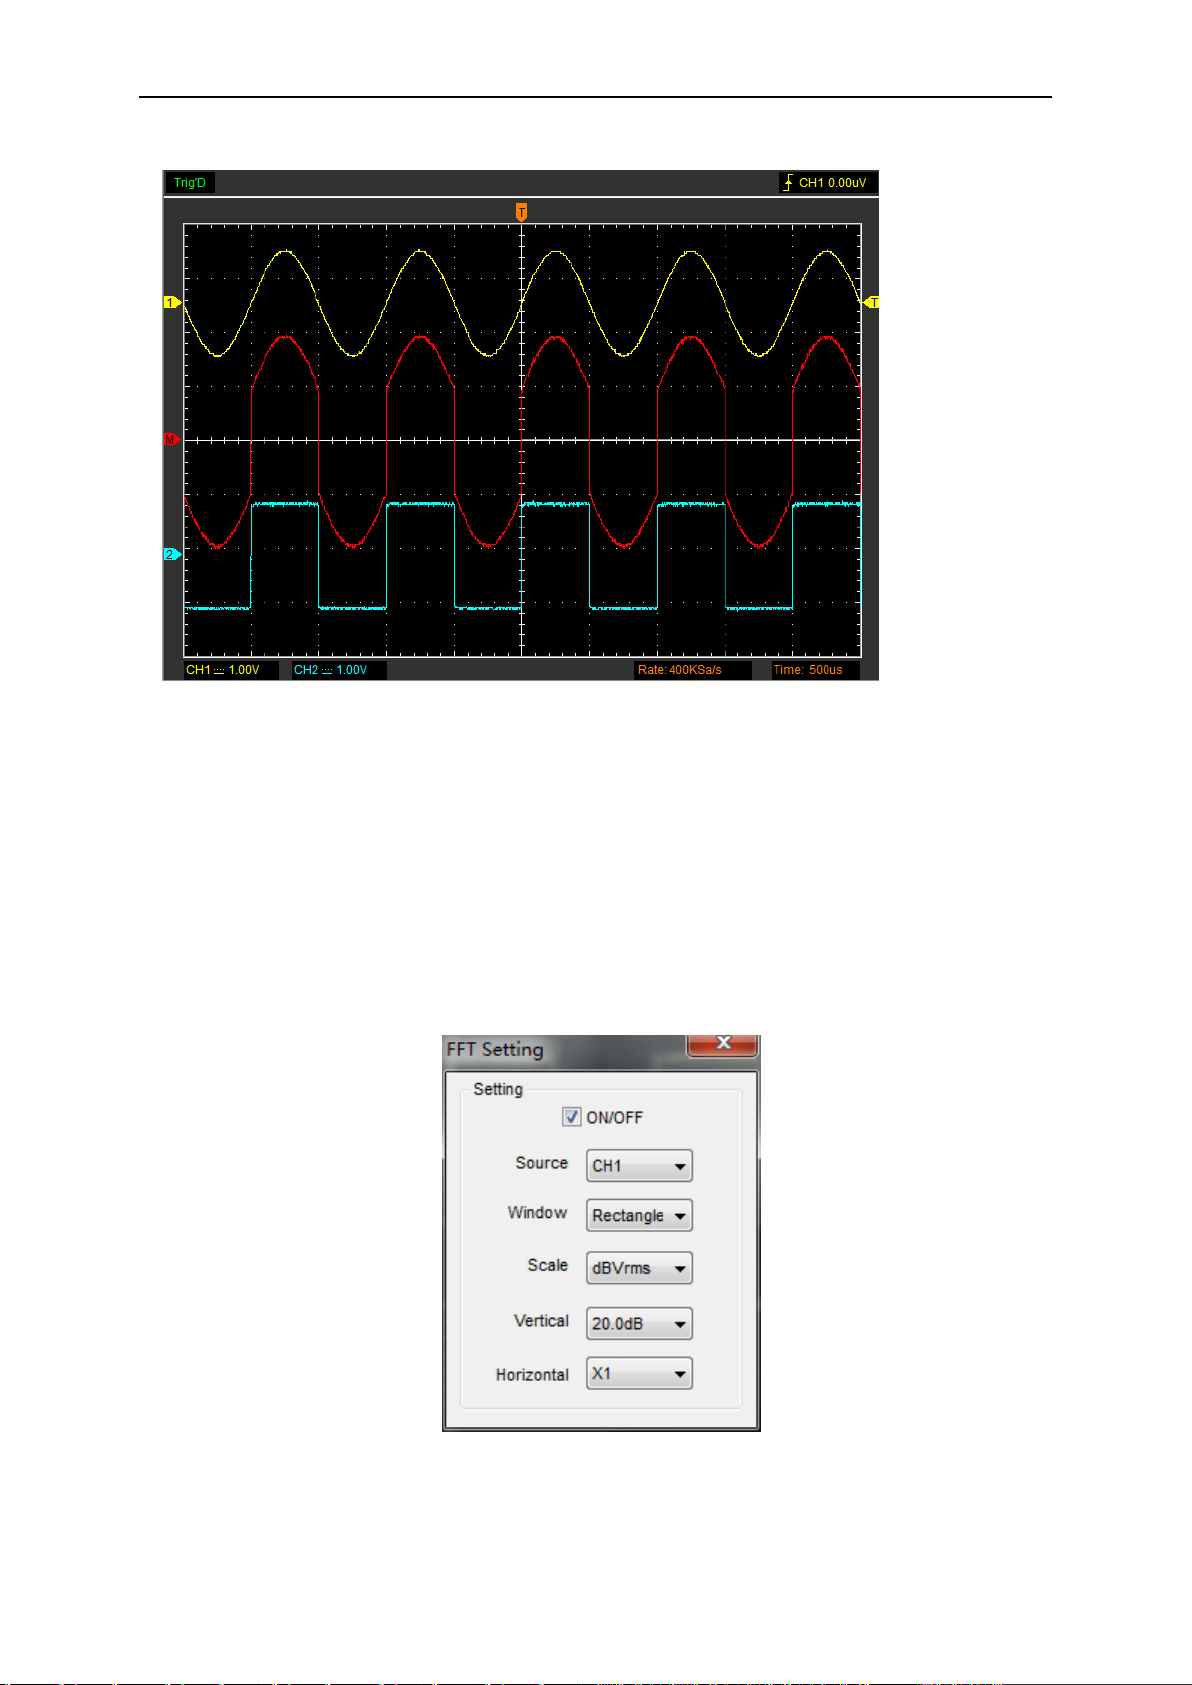
The Math Function Display:
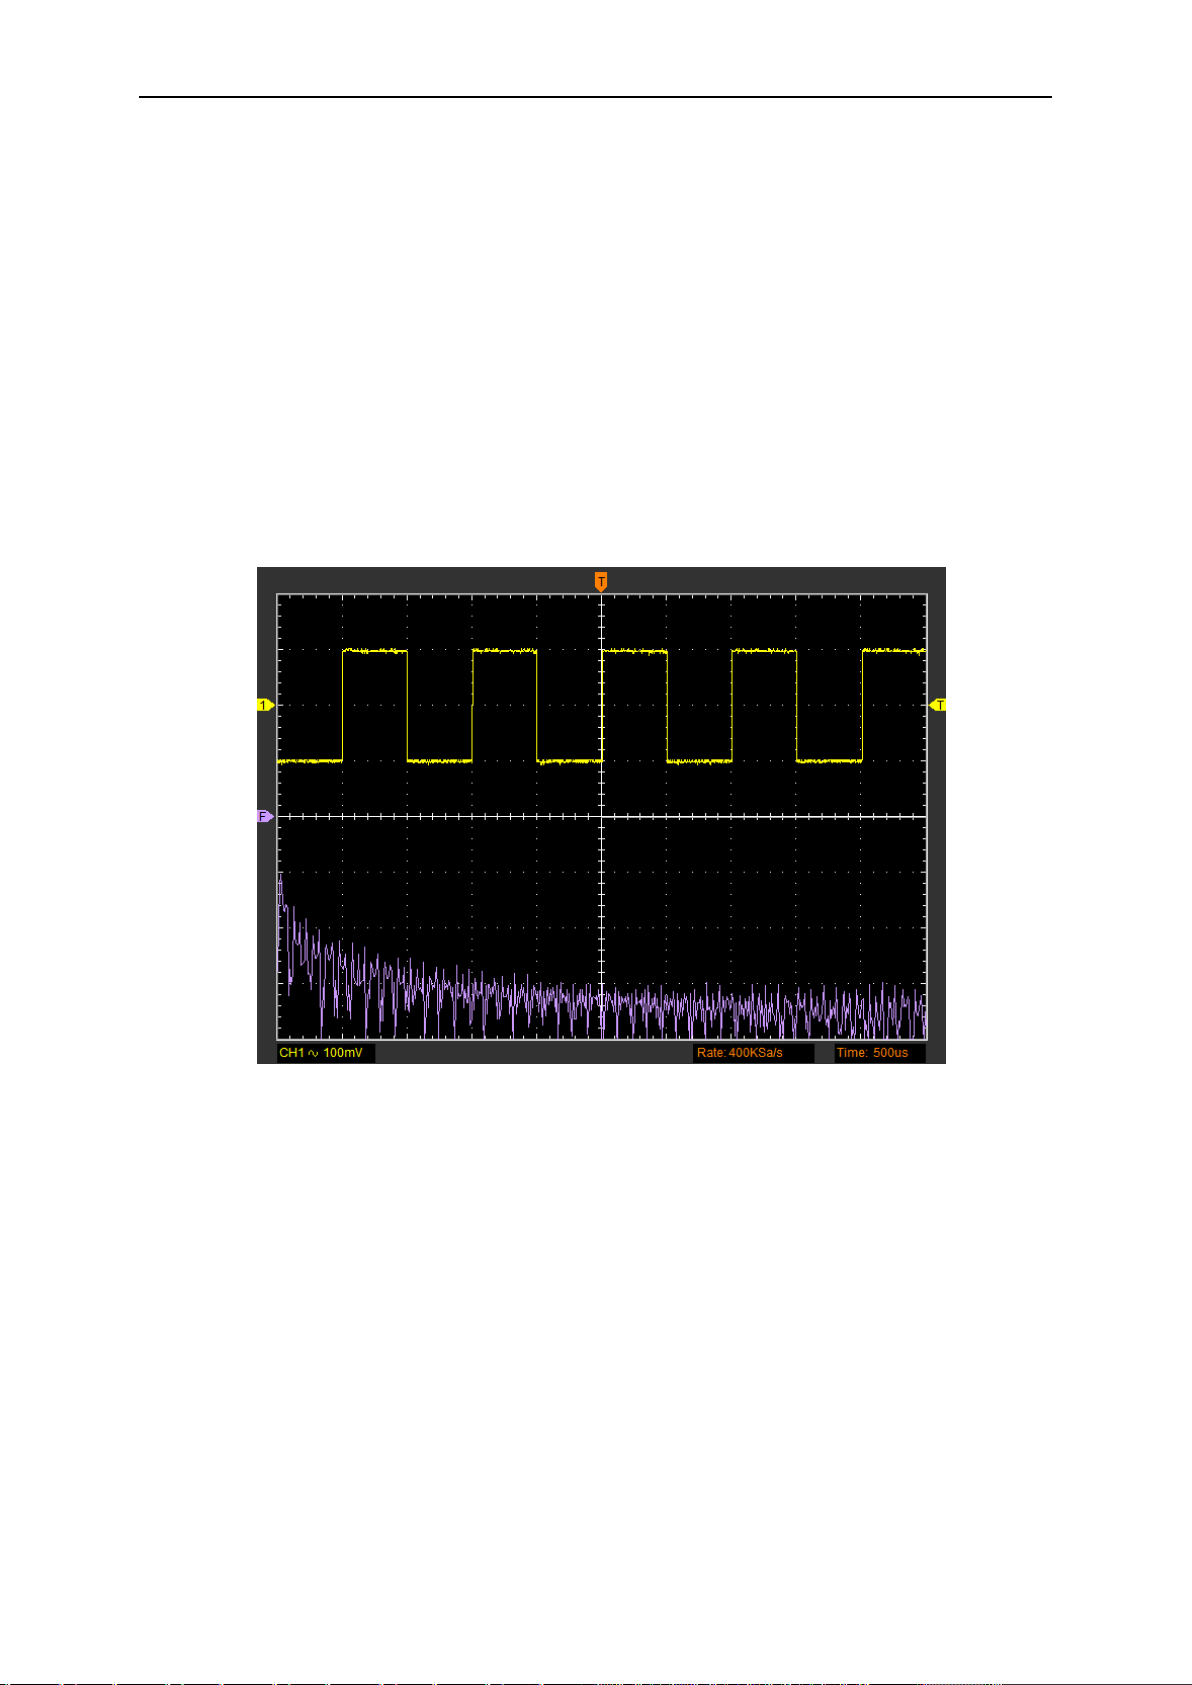
2.10.2 Fast Fourier Transform Function
User can use the FFT mode to convert a time-domain signal into its frequency components
(spectrum). You can use the FFT mode for the following types of analysis:
To use the FFT mode, you need to click “Setup-> FFT” to open the FFT setting window.
The FFT setting window:
You can select the Source channel, Window algorithm, FFT number, and FFT Zoom factor. It
displays only one FFT spectrum at a time.
PC Application
User’s Manual 32
Source: Selects the channel used as the FFT source
Window: Selects the FFT window type
The windows reduce spectral leakage in the FFT spectrum.
Scale: Selects the vertical scale units
Vertical: Selects the vertical scale
Horizontal: Selects the FFT zoom factor
Sets horizontal scale, If the information is more than the quantity displayed to the display window,
more information is displayed by using scroll bar.
The FFT display Windows:
2.11 Save and Load
2.11.1 Save and load file
Click “File” in main menu to save data, setup and image.
1. Save Data
Save waveform data as .txt, .xls, .doc, .csv or .wms file.
2. Save Image
Save the software display window as a .bmp or .jpg file.
3. Load Data
Load waveform data as .wms file.
PC Application
User’s Manual 33
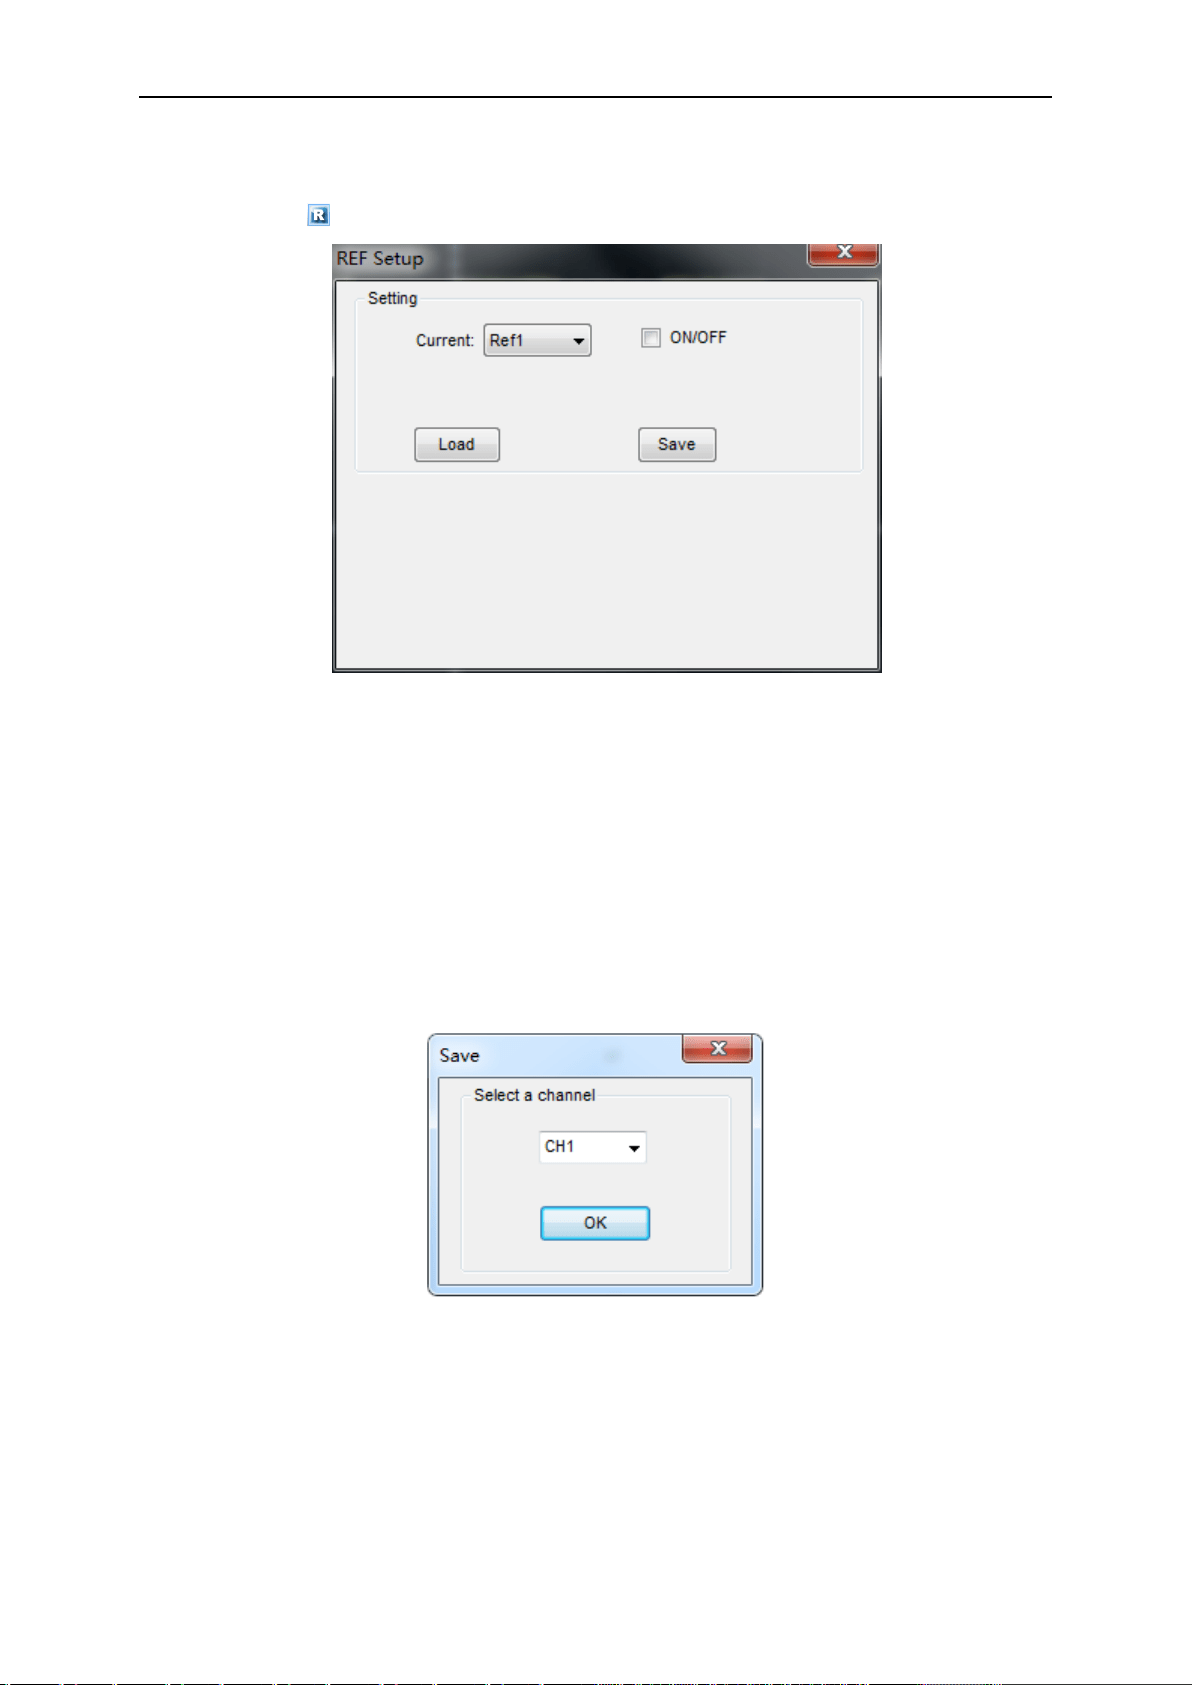
2.11.2 Set Reference
Click the button in toolbar or “Setup-> REF” on menu to set REF channel.
There are two Ref channels, Ref1 and Ref2.
The Reference Channel Function:
On/Off: Turn on/off the reference channel.
Load
Click “Load” to load the “*.rfc” file that was selected. The load file window will appear.
Save
Click “Save” to save the waveform to *.rfc file. The saved source window appears:
The save file window will appear after you selected the saved source.
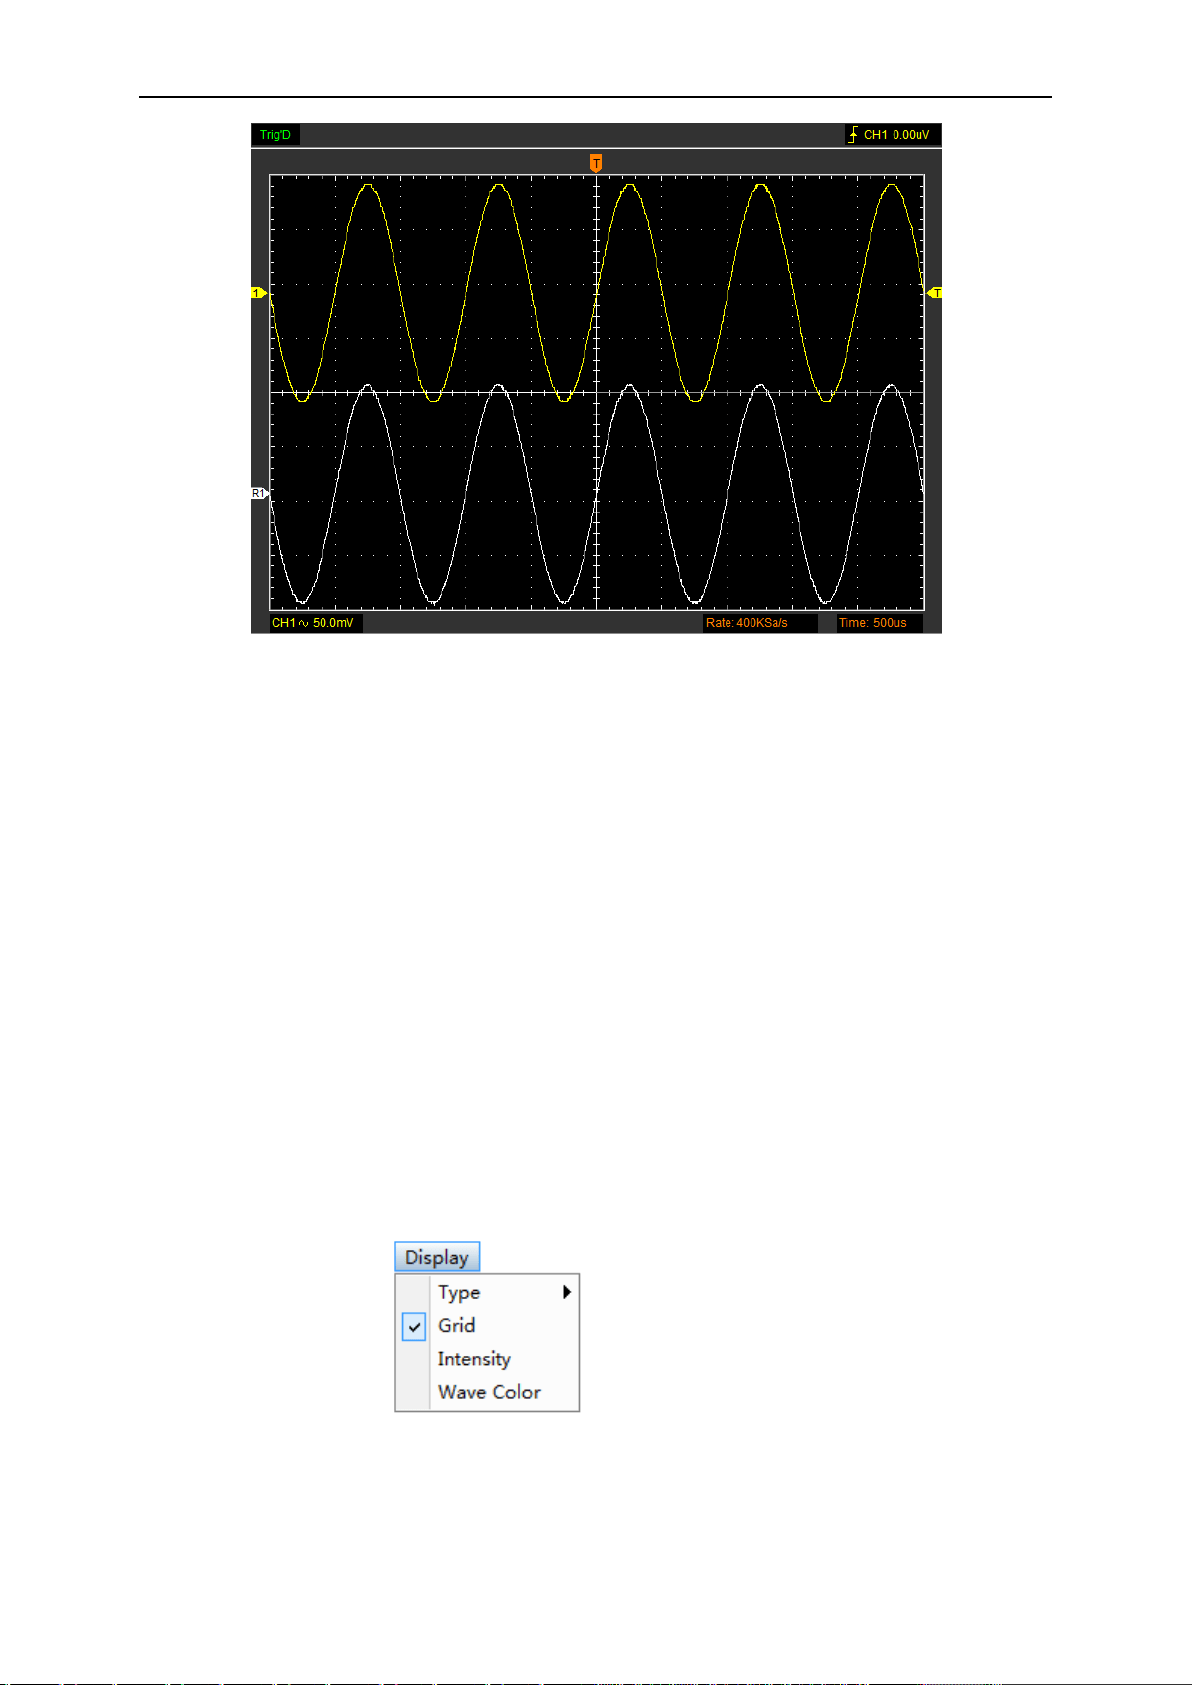
The Reference Waveform Display Window:
PC Application
User’s Manual 34
Note: If you turn on the “Reference” channel, the load file window will appear.
2.11.3 Save/Load Setup
Save Setup
You can use the “File-> Save Setups” in main menu to permanently save setting.
Load Setup
You can use the “File-> Load Setups” in main menu to permanently recall setup.
2.12 Display System
Click “Type” in “Display” menu.
The following figure shows the type parameters setting.
Display Type
Click “Display->Type” in main menu. Select display type Vectors or Dots.
PC Application
User’s Manual 35
Display Grid
Click “Display->Grid” in main menu.
The grid shows:
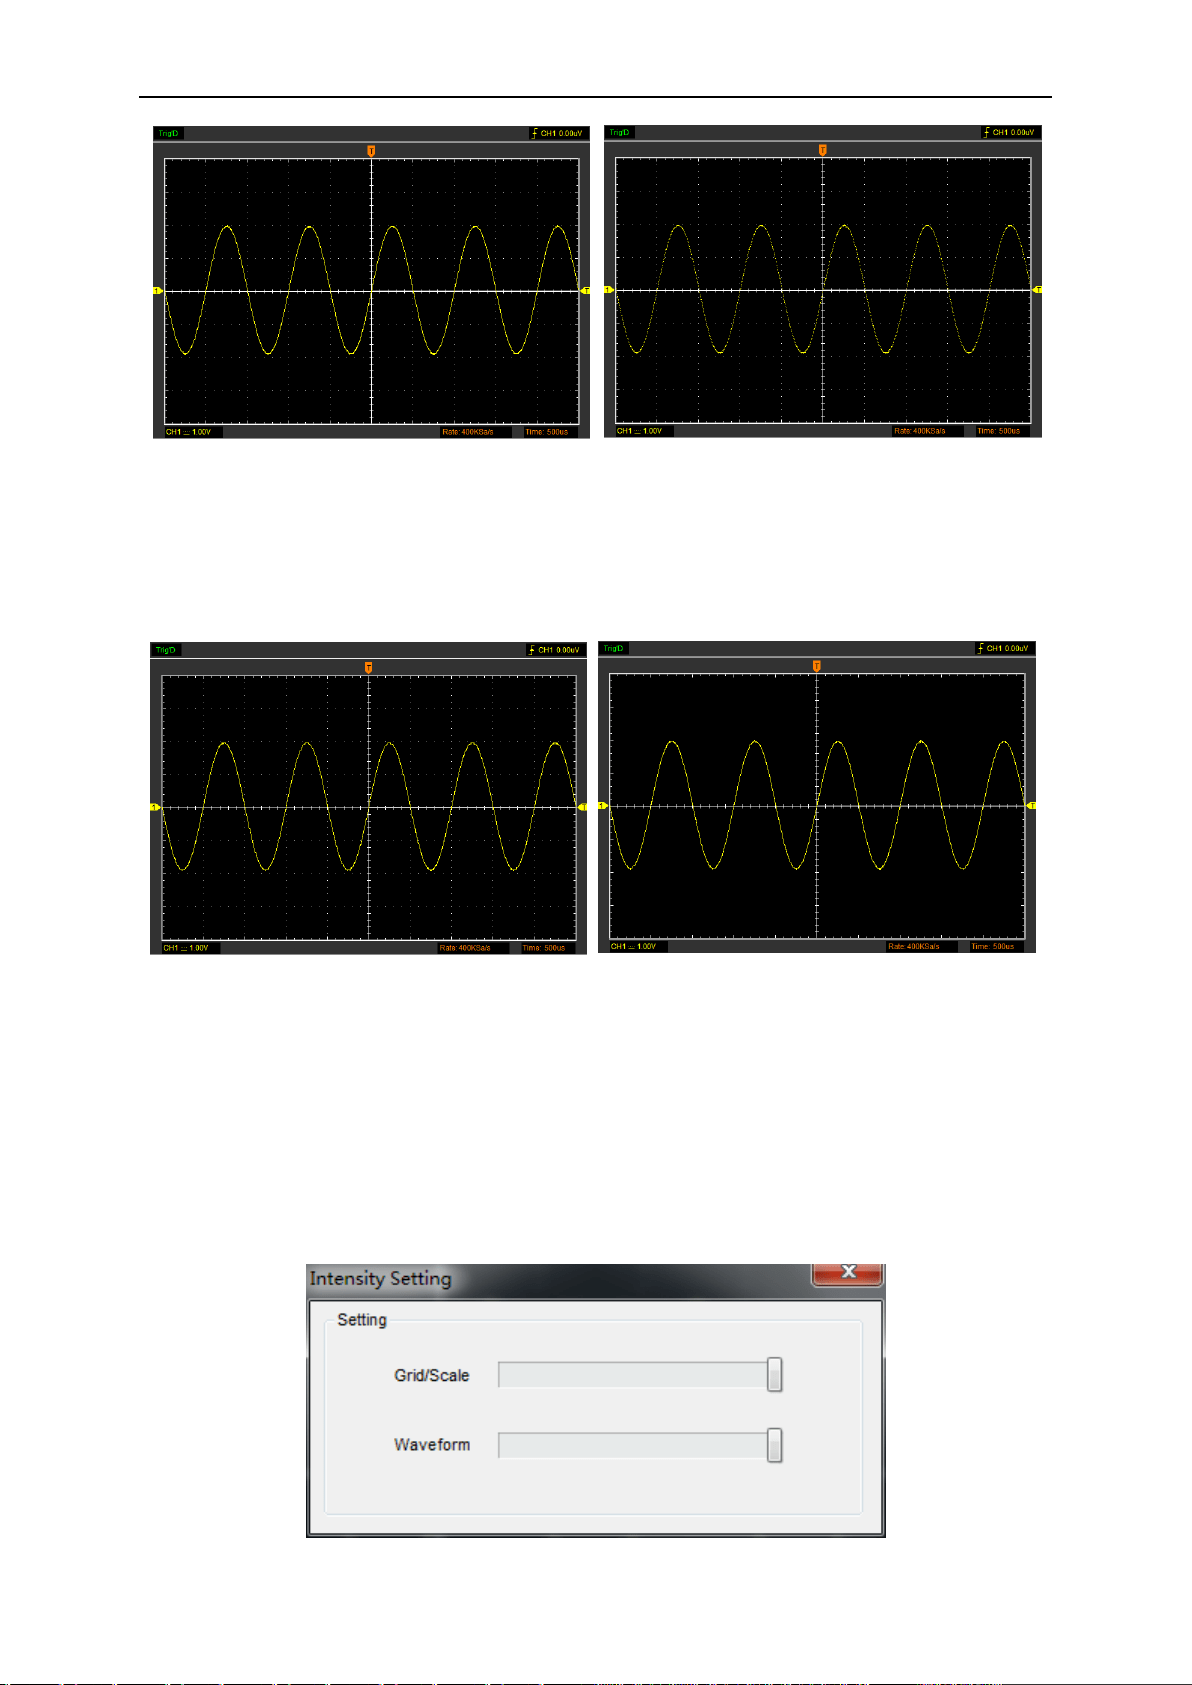
Intensity
Click “Display->Intensity” in main menu.
The following figure shows the intensity dialog. It shows the display parameters setting.
Vectors
Dots
Grid
No Grid
PC Application
User’s Manual 36
You can change the grid and waveform color intensity in this dialog.
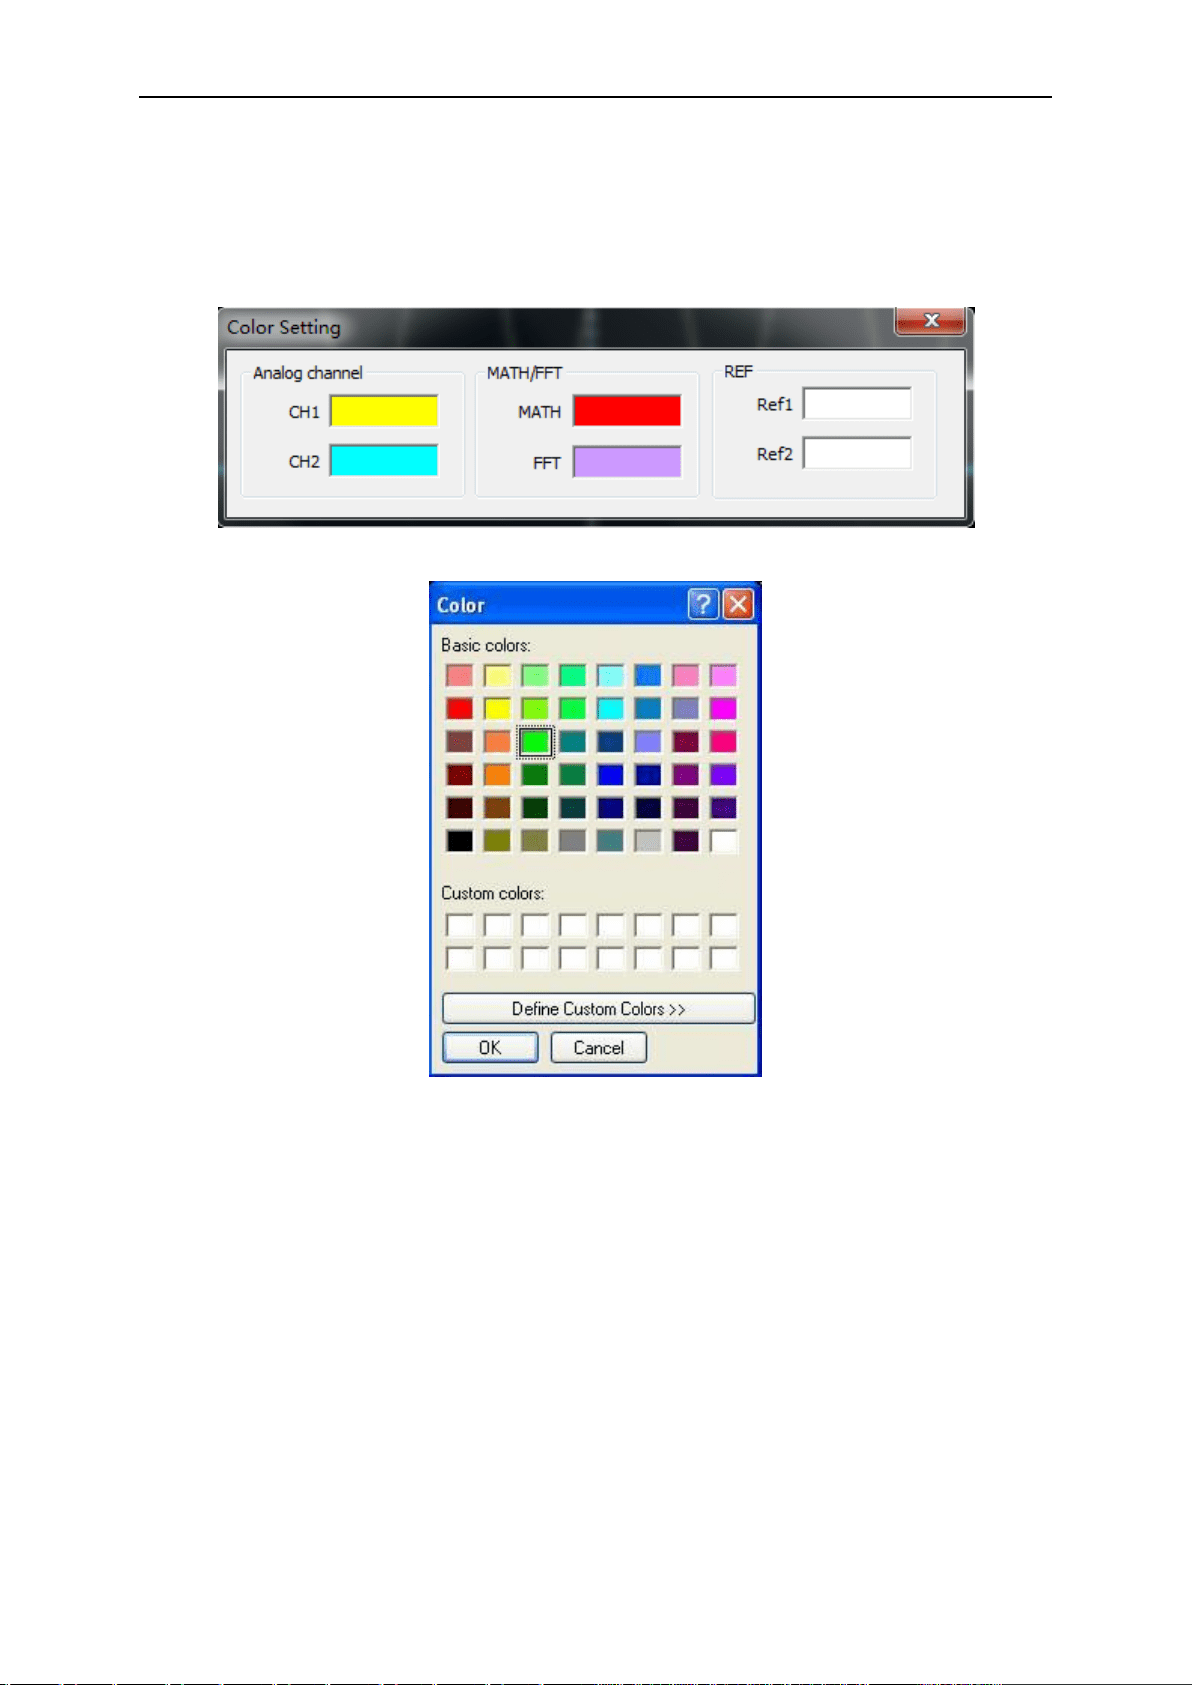
Wave Color
Click “Display->Wave Color” in main menu.
The following figure shows the waveform color dialog. It shows the waveform color setting.
If you click the color rectangle, the color dialog will be showed:
2.13 Measure System
The oscilloscope displays graphs of voltage versus time and can help to measure the displayed
waveform. There are several ways to take measurements, using the graticule, cursor
measurement or performing an automatic measurement.
2.13.1 Scale measurement
Graticule: This method allows you to make a quick, visual estimate and take a simple
measurement through the graticule divisions and the scale factor.
For example, you can take simple measurements by counting the major and minor graticule
divisions involved and multiplying by the scale factor. If you counted 6 major vertical graticule
divisions between the minimum and maximum values of a waveform and knew you had a scale

PC Application
User’s Manual 37
factor of 50mV/division, you could easily calculate your peak-to-peak voltage as follows:
6 divisions x 50mV/division = 300mV.
2.13.2 Cursor Measure
Click “Cursor” in main menu.
This method allows you to take measurements by moving the cursors.
1. Source
The user can set the source to CH1, CH2 and MATH.
When you use cursors, be sure to set the Source to the waveform on the display that you want to
measure.
2. Type
There are four types of cursors: Cross, Trace, Vertical and Horizontal.
1) Cross
The Cross cursors appear as cross lines on the display and measure the vertical and horizontal
parameters.
Do these steps:
1. Click “Cursor”-> “Source”, select CH1 (select CH2 if you want measure CH2).
2. Click “Cursor”-> “Type”, select Vertical.
3. Push left mouse button, and the vertical lines appear.
4. Drag the mouse button to the point you want to measure.
5. Release the left mouse button, the frequency difference and time difference will be
shown at the status bar.
The Cross cursor display window:
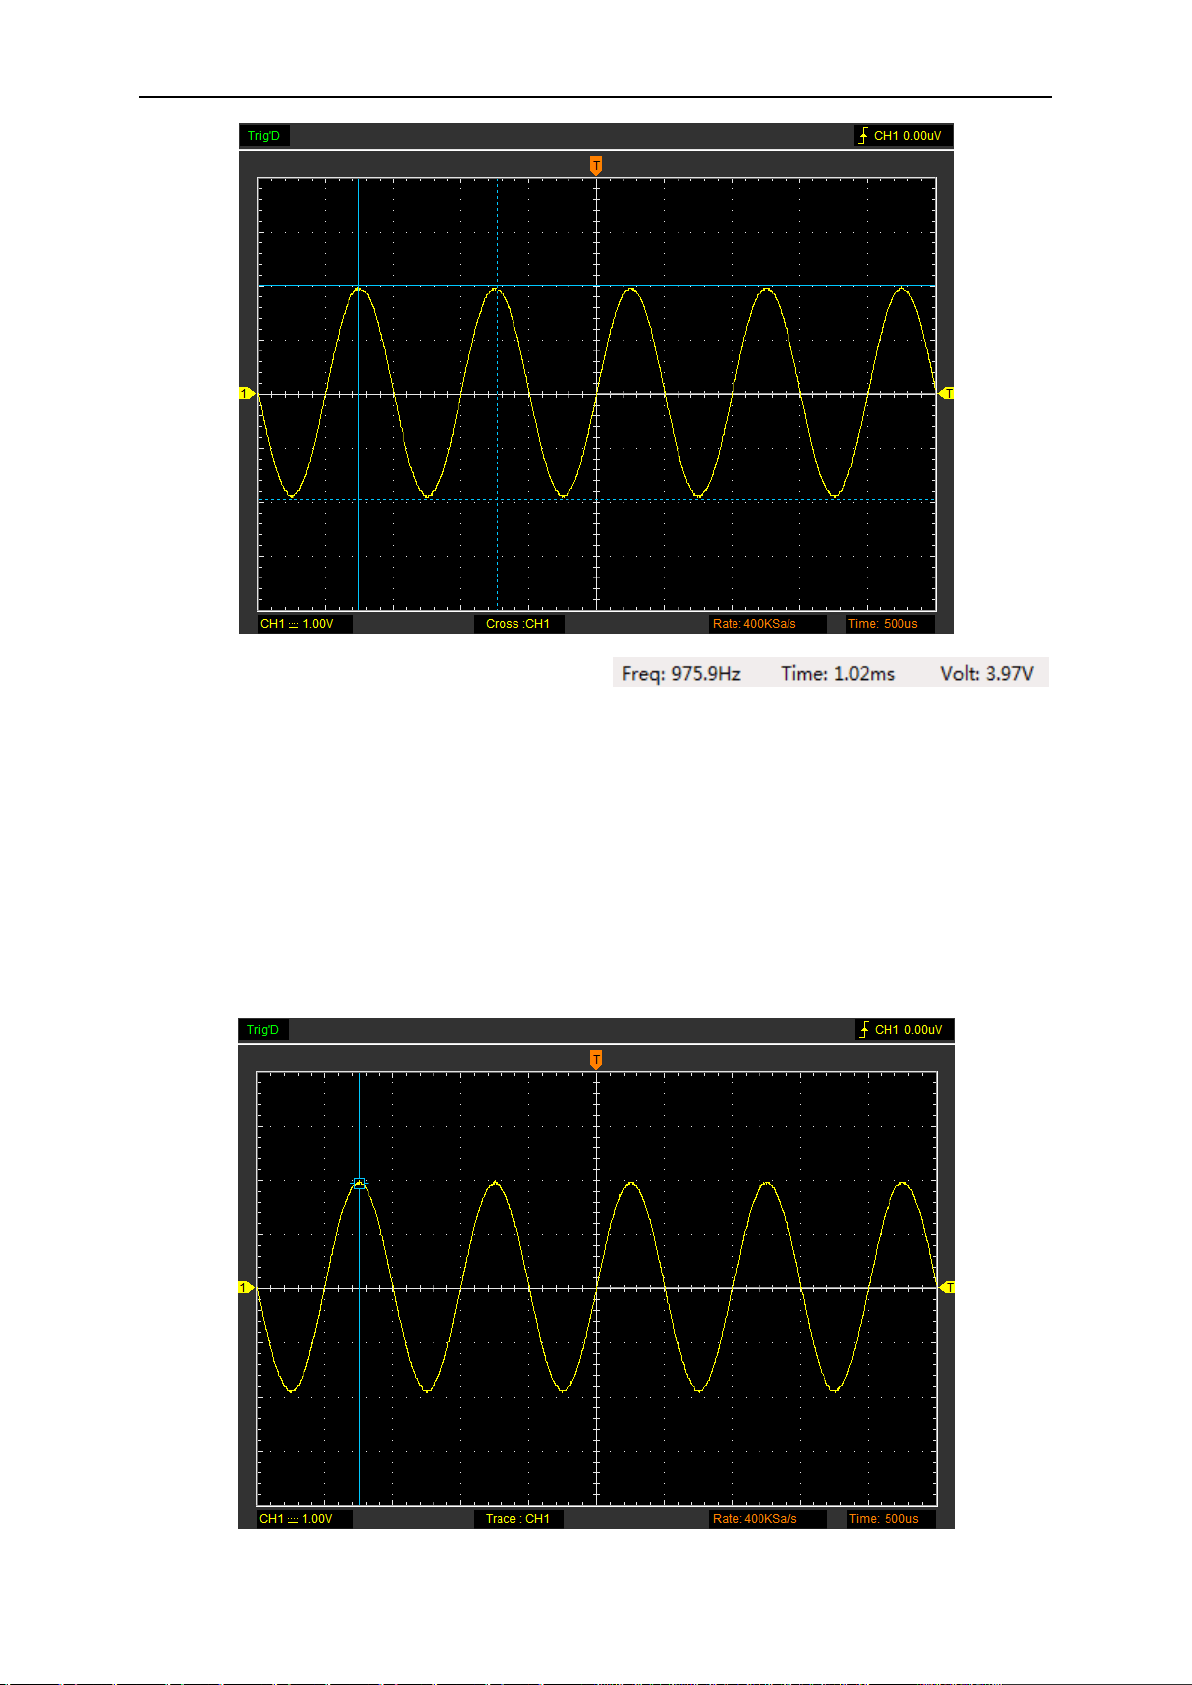
PC Application
User’s Manual 38
The Cross measure result displays on status bar:
2) Trace
The Trace cursors appear as vertical lines on the display and measure the waveform amplitude at
the point the waveform crosses the cursor.
Do these steps:
1. Click “Cursor->Source”, select CH1 (select CH2 if you want trace CH2).
2. Click “Cursor->Type”, select Trace.
3. Click the cursor at the position that you want traced of the wave in the waveform window.
The Trace cursor display window:
PC Application
User’s Manual 39
The Trace cursor measure result display on status bar:
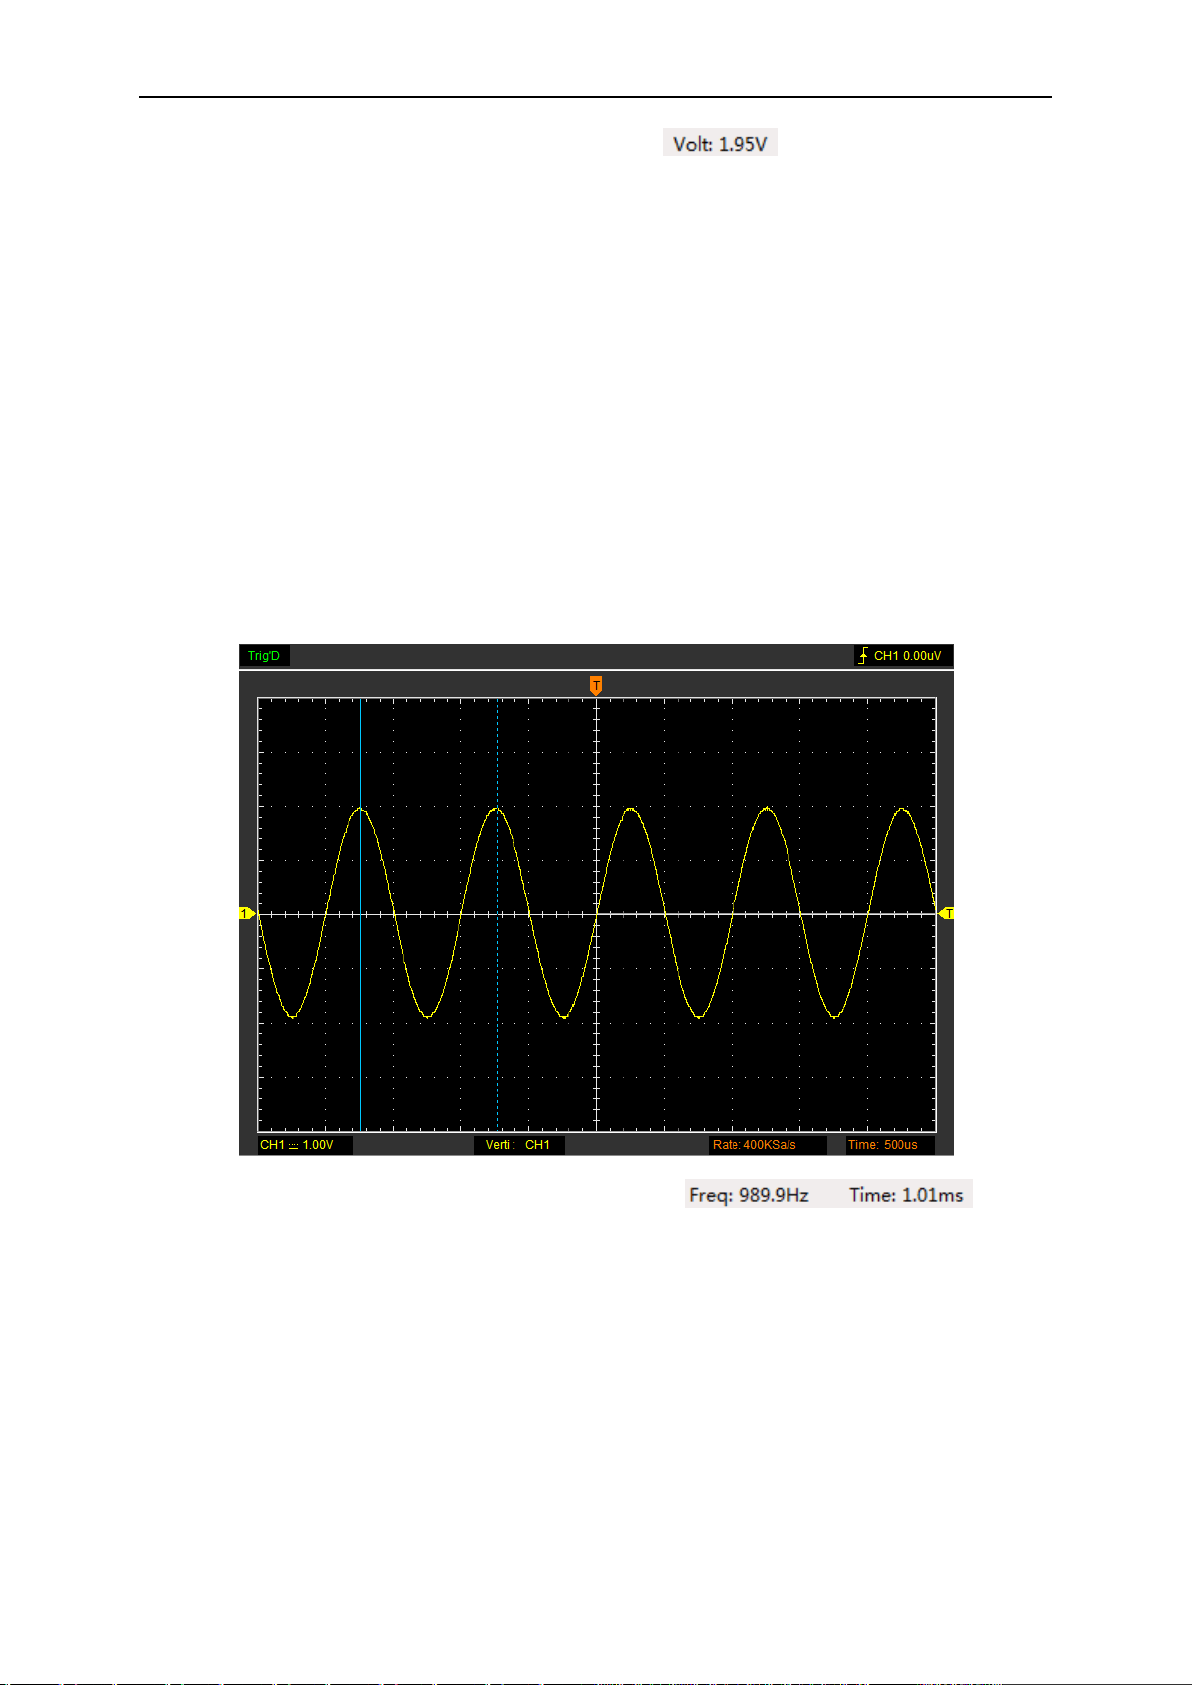
3) Vertical
The Vertical cursors appear as vertical lines on the display and measure the vertical parameters.
Do these steps:
1. Click “Cursor”-> “Source” select CH1 (select CH2 if you want measure CH2).
2. Click “Cursor”-> “Type”, select Vertical.
3. Push left mouse button, and the vertical lines appear.
4. Drag the mouse button to the point you want to measure.
5. Release the left mouse button, the frequency and time difference will be shown at the status
bar.
The Vertical cursor display window:
The Vertical cursor measure result display on status bar:
4) Horizontal
The Horizontal cursors appear as horizontal lines on the display and measure the horizontal
parameters.
Do these steps:
1. Click “Cursor”-> “Source” select CH1 (select CH2 if you want measure CH2).
2. Click “Cursor”-> “Type”, select Horizontal.
3. Push left mouse button, and the Horizontal lines appear.
4. Drag the mouse button to the point you want to measure.
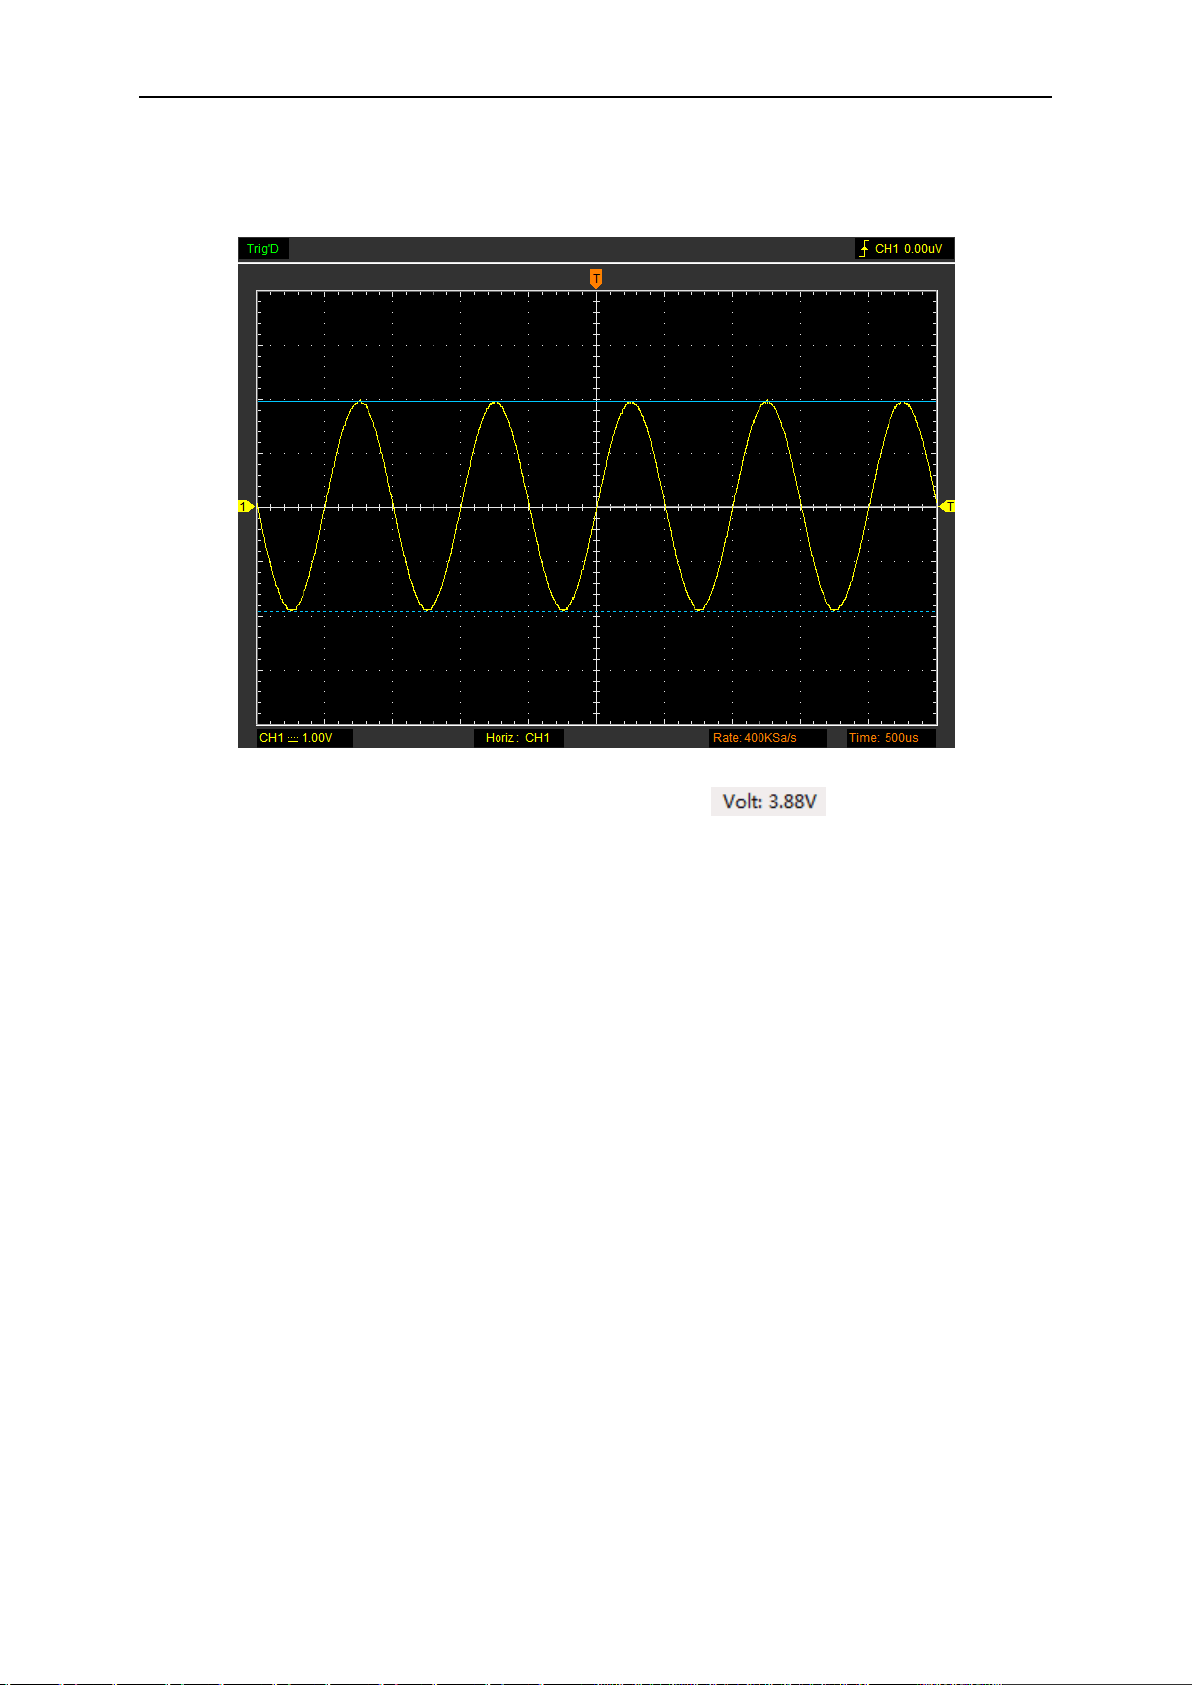
PC Application
User’s Manual 40
5. Release the left mouse button, the voltage difference will be shown at the status bar.
The Horizontal cursor display window:
The Horizontal cursor measure result display on status bar:
2.13.3 Automatic Measurement
Automatic Measurement: The oscilloscope performs all the calculations automatically in this
mode. As this measurement uses the waveform record points, it is more precise than the graticule
and cursor measurements. Automatic measurements show the measurement results by readouts
which are periodically updated with the new data acquired by the oscilloscope.
Click “Measure” in main menu.
The oscilloscope provides 20 parametric auto measurements (12 voltage and 8 time
measurements).
1. Source
The user can use the “Source” menu to select a measure source CH1 or CH2.
2. Vertical
Maximum: Voltage of the absolute maximum level, Measured over the entire waveform
Minimum: Voltage of the absolute minimum level, Measured over the entire waveform
Peak To Peak: Peak-to-peak = Max –Min, Measured over the entire waveform
Top : Voltage of the statistical maximum level, Measured over the entire waveform

PC Application
User’s Manual 41
Base: Voltage of the statistical minimum level, Measured over the entire waveform
Middle: Voltage of the 50% level from base to top
RMS: The Root Mean Square voltage over the entire waveform
Amplitude: Amp = Base - Top, Measured over the entire waveform
Mean: The arithmetic mean over the entire waveform
Cycle Mean: The arithmetic mean over the first cycle in the waveform
Positive OverShoot: Positive Overshoot = (Max - Top)/Amp x 100 %, Measured over the entire
waveform
Negative OverShoot: Negative Overshoot = (Base - Min)/Amp x 100 %, Measured over the entire
waveform.
3. Horizontal
Period: Time to take for the first signal cycle to complete in the waveform
Frequency: Reciprocal of the period of the first cycle to complete in the waveform
Rise Time: Time taken from lower threshold to upper threshold
Fall Time: Time taken from upper threshold to lower threshold
+Duty Cycle: Positive Duty Cycle = (Positive Pulse Width)/Period x 100%, Measured of the first
cycle in waveform.
-Duty Cycle: Negative Duty Cycle = (Negative Pulse Width)/Period x 100%, Measured of the first
waveform.
+Pulse Width: Measured of the first positive pulse in the waveform. The time between the 50%
amplitude points
-Pulse Width: Measured of the first negative pulse in the waveform. The time between the 50%
amplitude points
4. Clear Item
Clear all measure items on display screen.
5. Edit Item
Click “Measure->Edit Item”. User can select Maximum 8 measure options to measure.
Note: The results of the automatic measurements will be displayed on the bottom of the screen.
Maximum 8 results could be displayed at the same time. When there is no room, the next new
measurement result will make the previous results moving left, out of screen.
6. DVM
Click “Measure->DVM”, the DVM dialog will be showed.
PC Application
User’s Manual 42
Turn on/off the DVM measure column, and it will be displayed on top right corner on the screen.
Also you can drag it to any location.
DVM: Display RMS and frequency of measured waveform of CH1 or CH2.
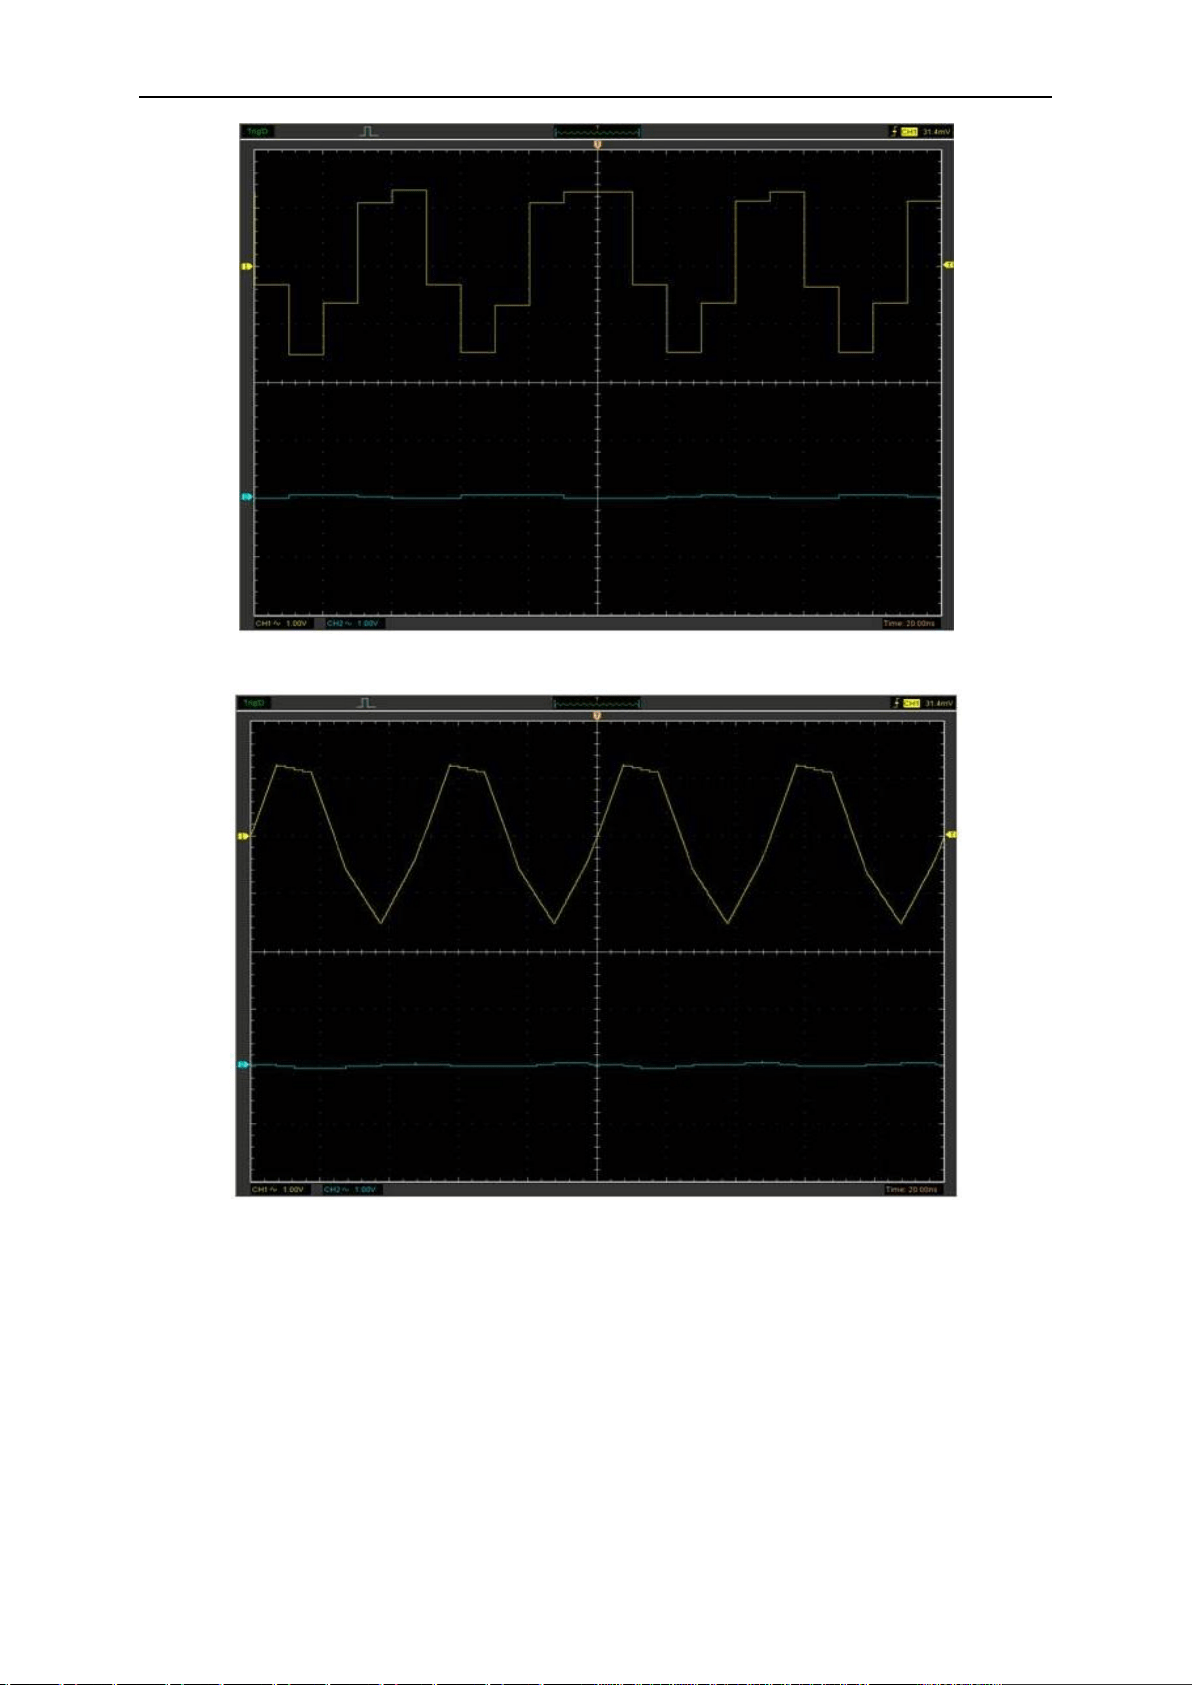
2.14 Acquisition Modes
There are two acquisition modes: Normal, Average.
Normal: In this acquisition mode, the oscilloscope samples the signal in evenly spaced intervals to
construct the waveform.
Average: In this acquisition mode, the oscilloscope acquires several waveforms, averages them,
and displays the resulting waveform. You can use this mode to reduce random noise.
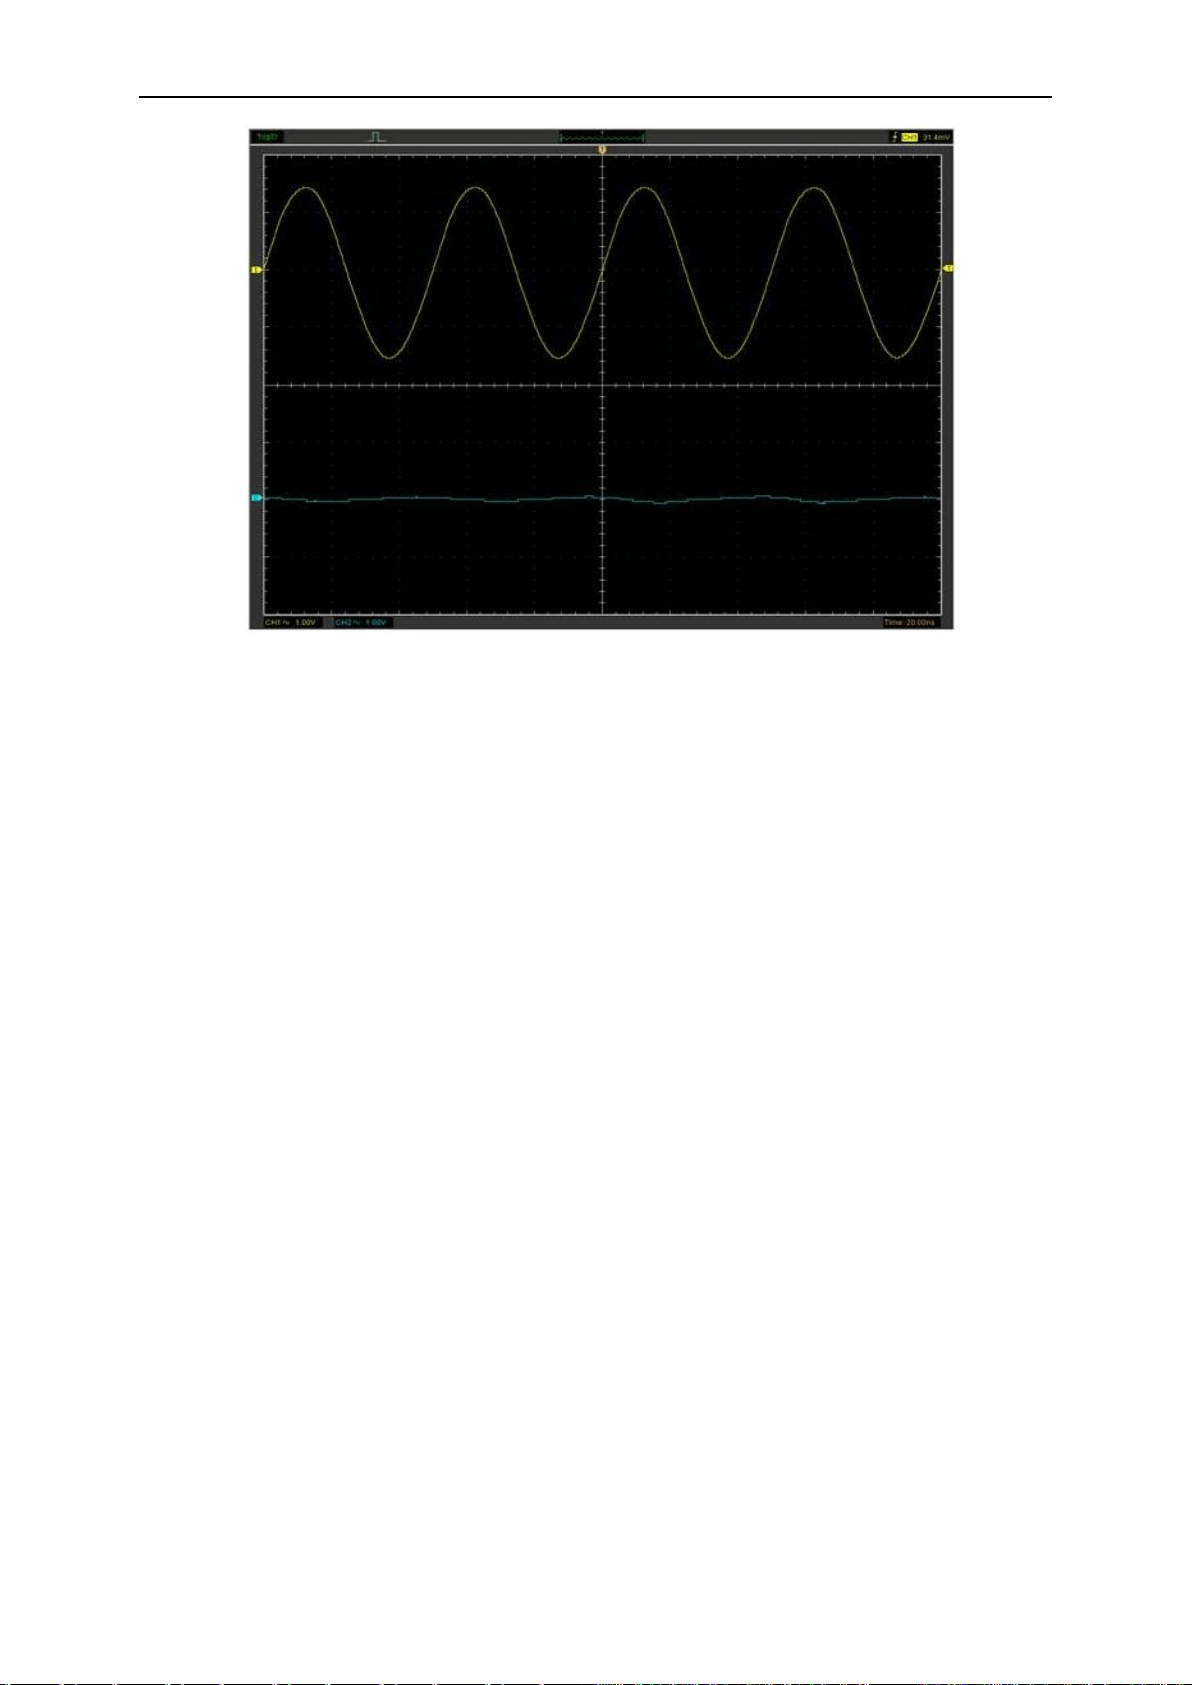
2.15 Interpolation
At the time base 50ns/div or faster, user can click “Acquire->Interpolation” to select 3 different
interpolation modes to get waveforms of different smoothness.
The Step Interpolation:
PC Application
User’s Manual 43
The Linear Interpolation:
The Sin(x)/x Interpolation:
PC Application
User’s Manual 44
Note: The default interpolation mode is Sin(x)/x.
Acquisition
When you acquire a signal, the oscilloscope converts it into a digital form and displays a
waveform. The acquisition mode defines how the signal is digitized and the time base setting
affects the time span and level of detail in the acquisition.
2.16 Utility Function
Click the “Menu -> Utility” to get into the “Utility” menu.
The “Utility” Functions:
Record
Pass/Fail
Calibrate
Factory Setup
Language
PC Application
User’s Manual 45
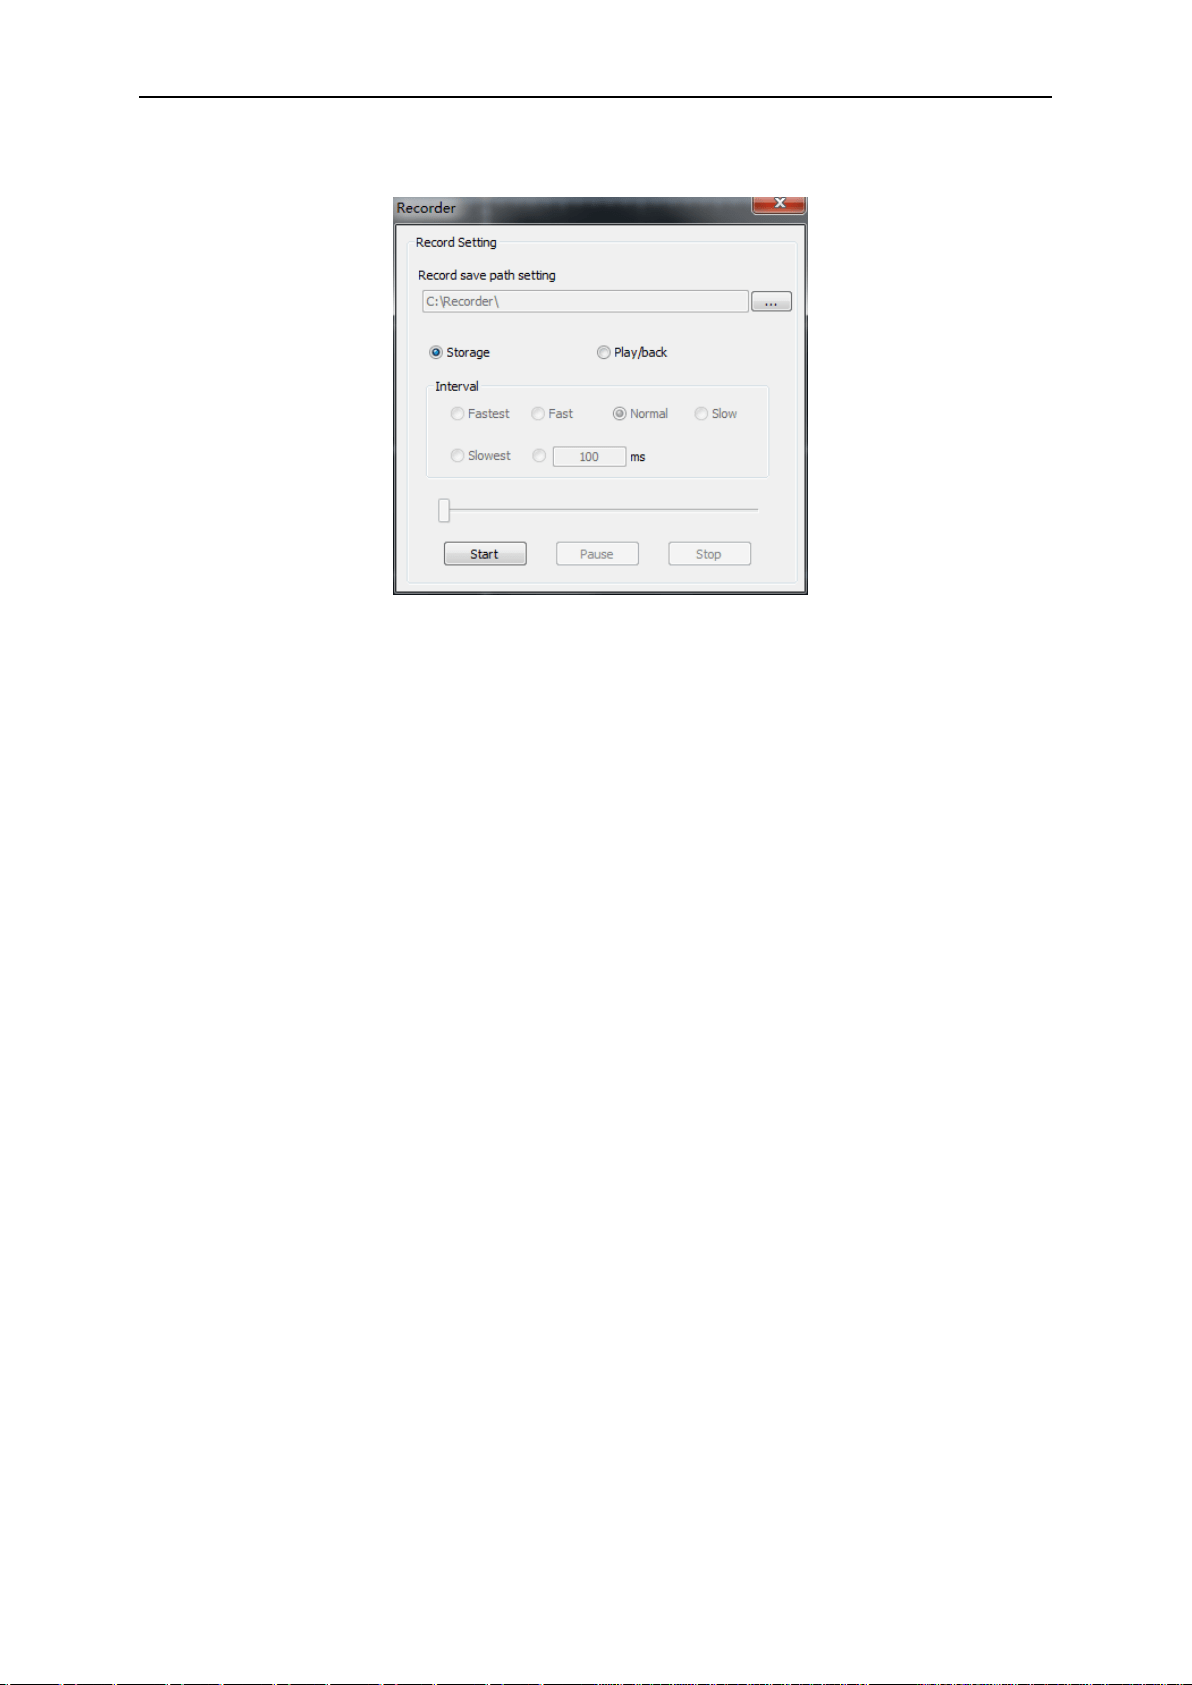
2.16.1 Record
Before you select the save path every time, you need to manually create a new folder, and then
select.
Storage
“Start” button: Start recording the waveform. And waveform files are saved in path.
“Stop” button: Stop record the waveform.
Play back
Interval: Set the time interval of play back. Also user can set time interval manually.
“Start” button: Start playing back the waveform.
“Stop” button: Stop play back the waveform.
“Pause” button: Pause play back the waveform.
“Continue” button: Continue playing back the waveform.
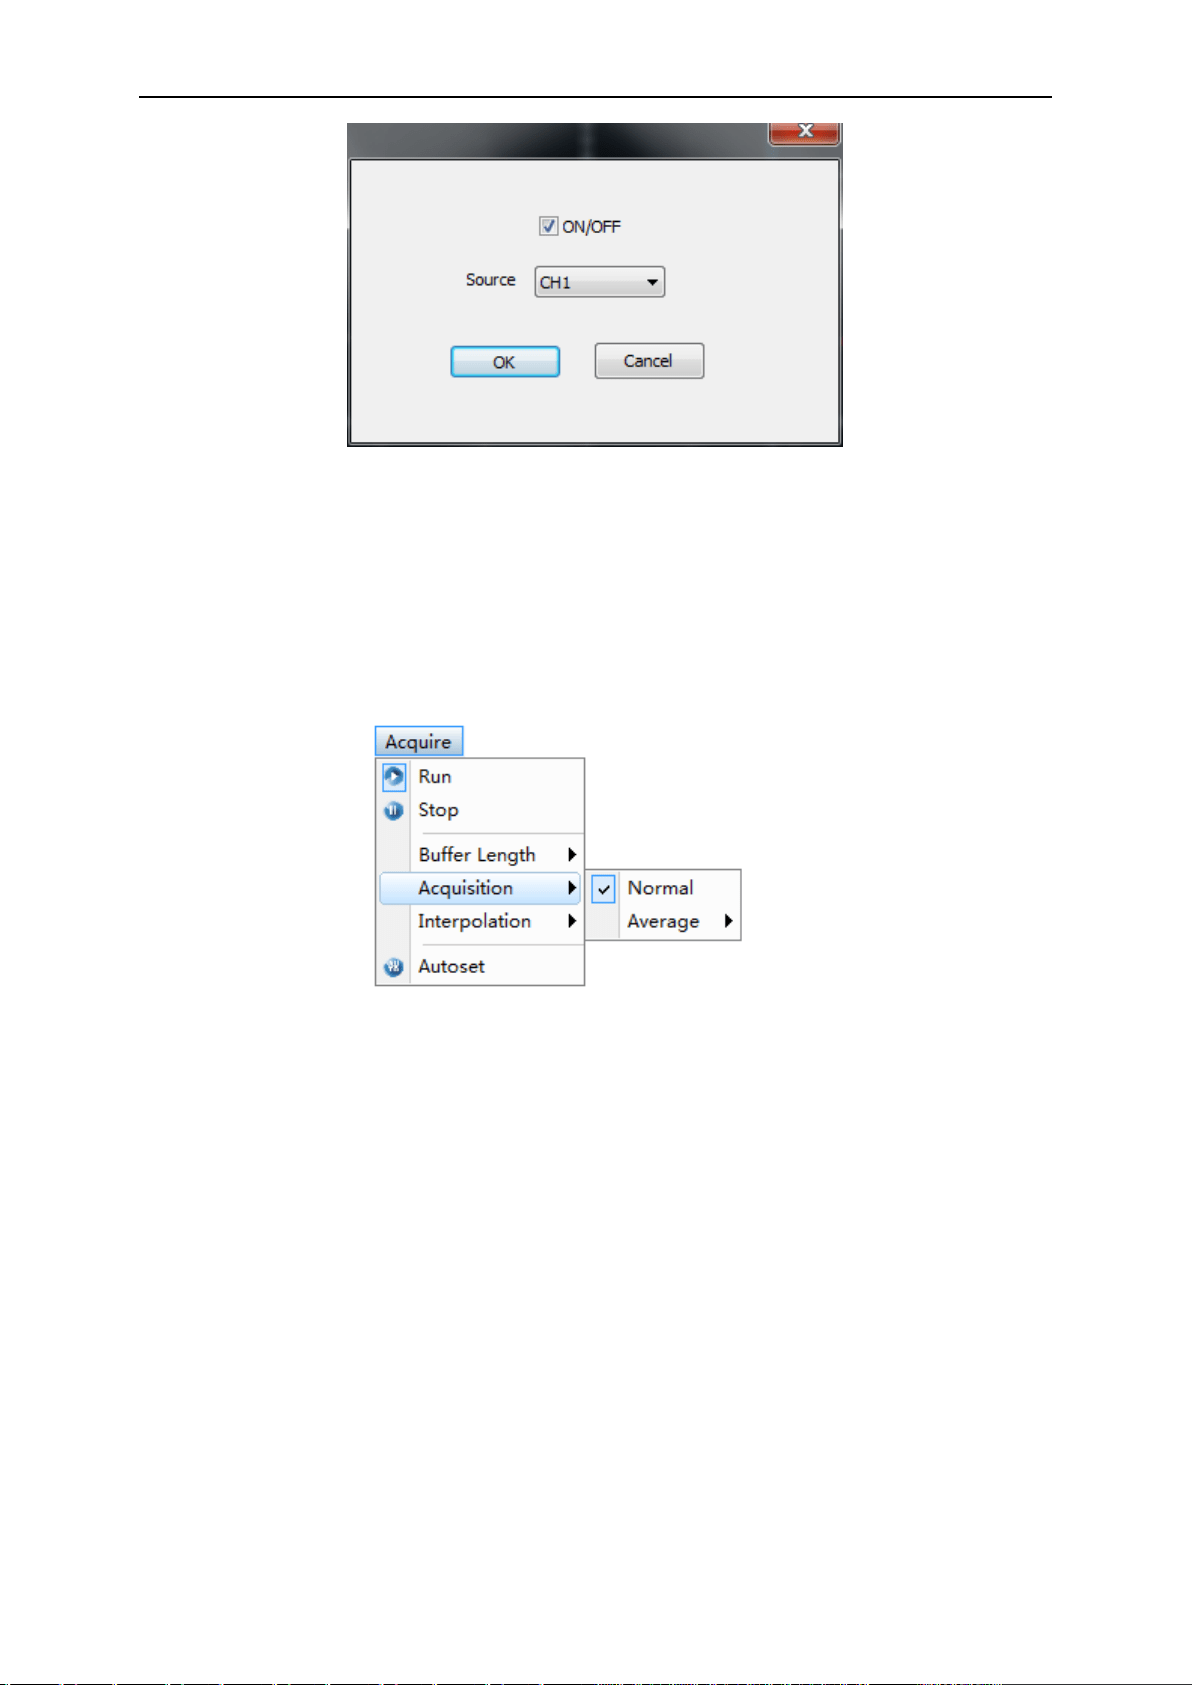
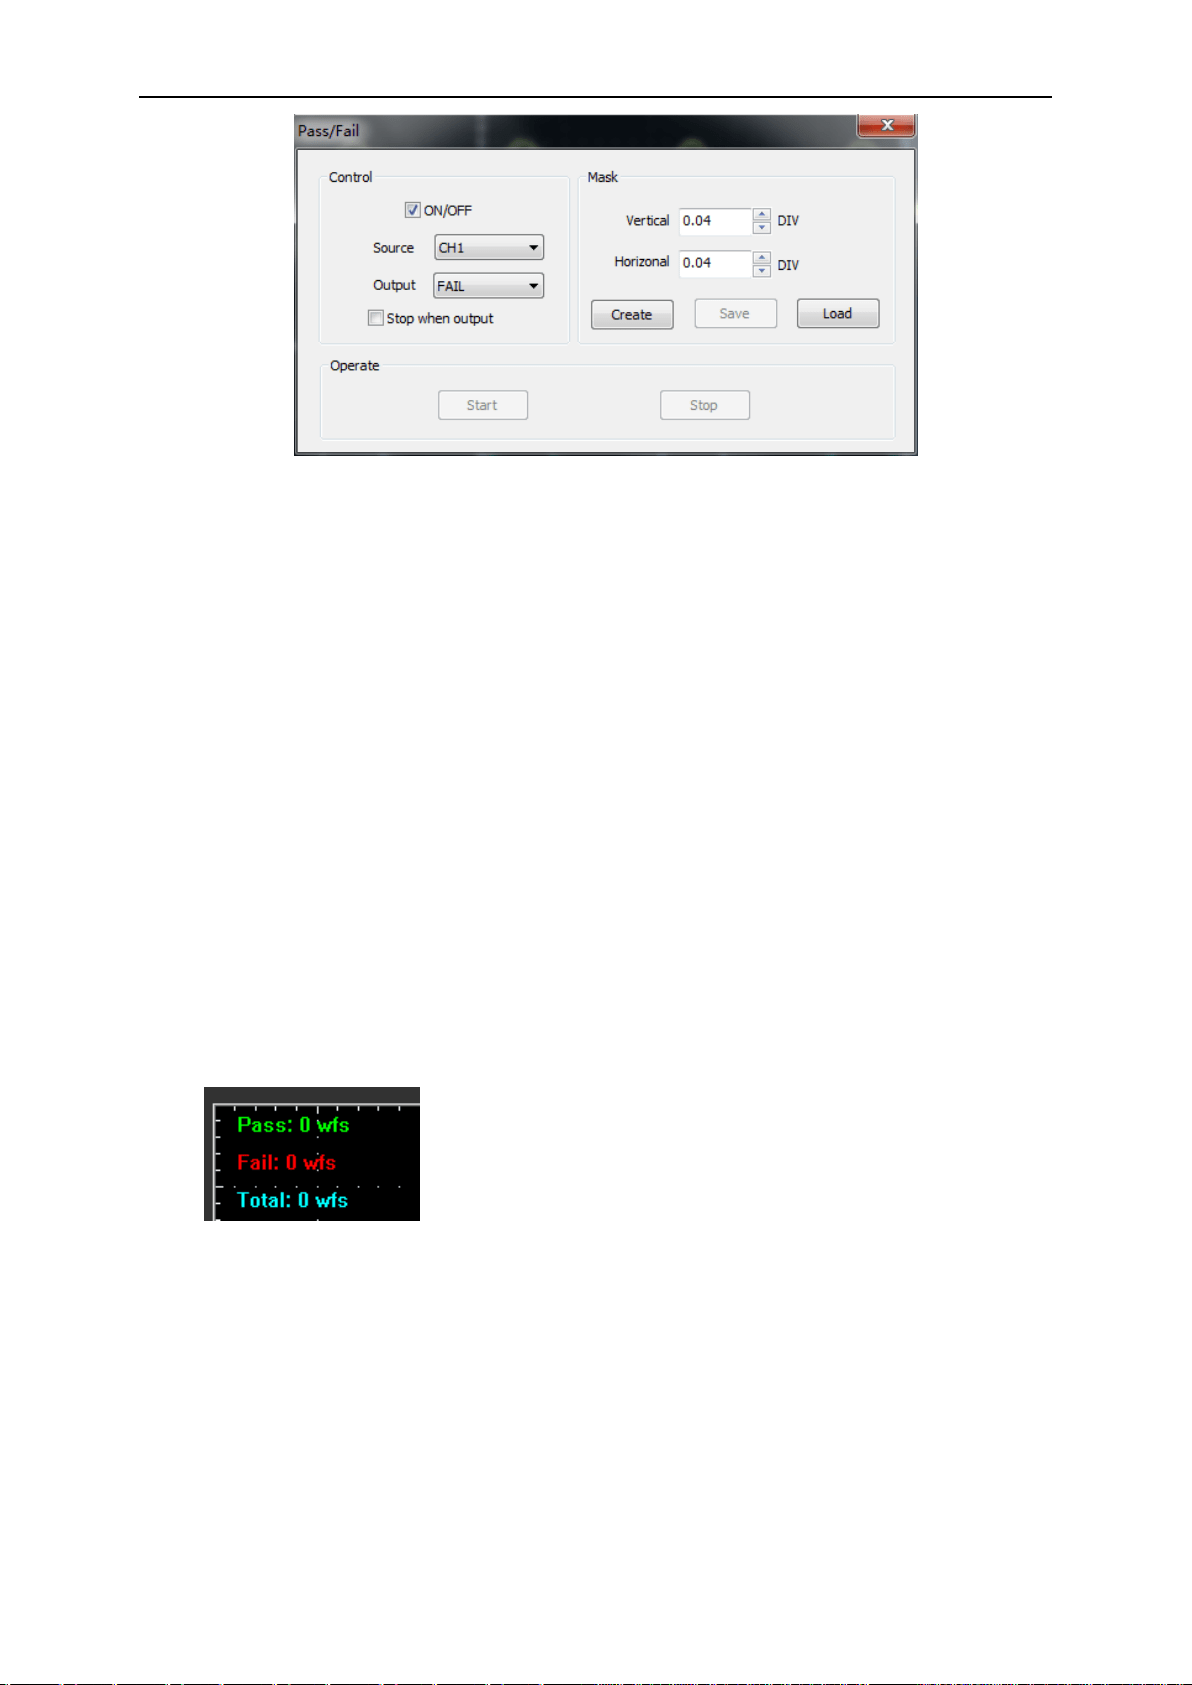
2.16.2 Pass/Fail
Click “Pass/Fail” in “Utility” menu.
The Pass/Fail window appears:
PC Application
User’s Manual 46
The Pass/Fail function monitors changes of signals and outputs pass or fail signals by comparing
the input signal with the pre-created mask.
Control Setting
ON/OFF: Turn on/off the Pass/Fail
Source: Select the Pass/Fail channel
Output: Select the Pass/Fail output condition
Stop When Output: If it was checked, the Pass/Fail will stop when output.
Mask Setting
Vertical: Set the vertical limit range
Horizontal: Set the horizontal limit range
“Create” button: Click this button to create Pass/Fail area according to the mask
“Save” button: Click this button to save the setups to file.
“Load” button: Click this button to load the saved setups file.
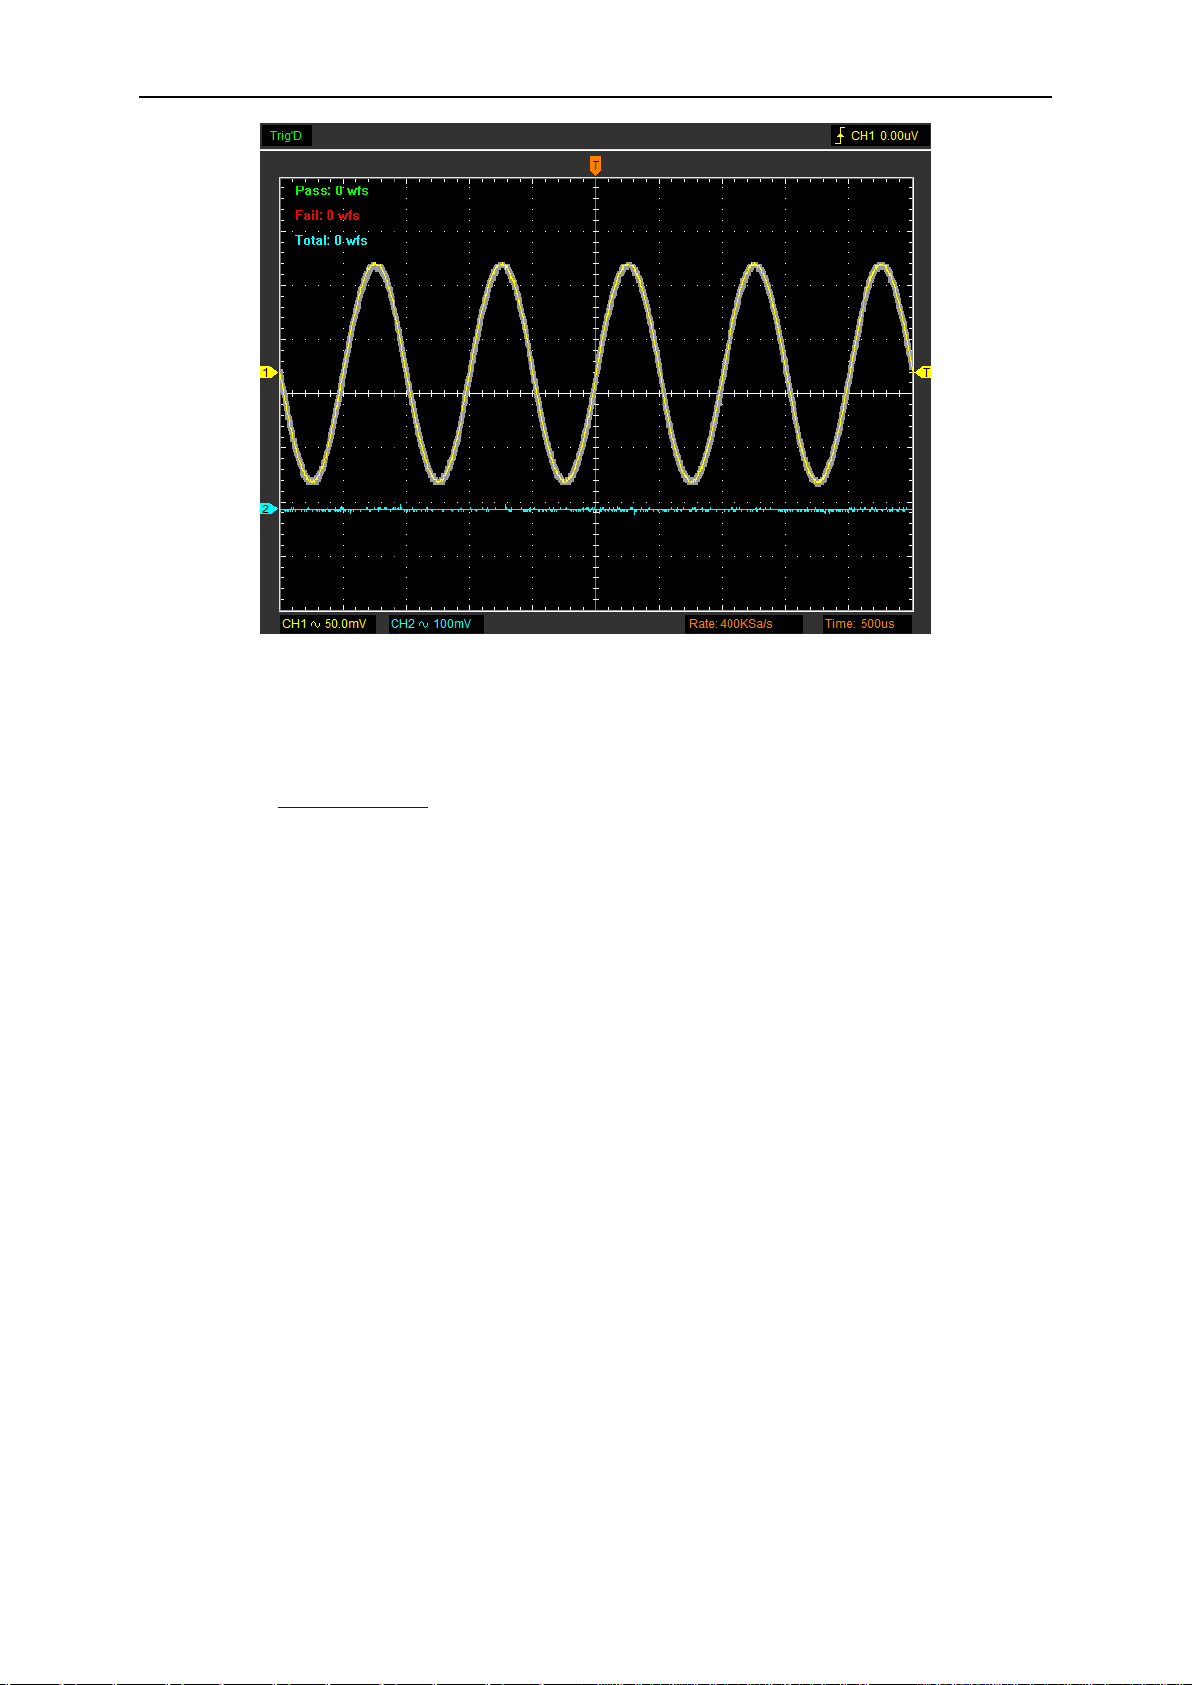
Pass/Fail information
Operation
Click “Start” button to start the Pass/Fail test. Click “Stop” button to stop the Pass/Fail test.
The Pass/Fail function display:
Fail: Displays the fail waveform number
Pass: Displays the pass waveform number
Total: Displays the l total Pass/Fail waveform number
PC Application
User’s Manual 47
NOTE:Pass/Fall function is unavailable in X-Y mode and Roll mode.
2.16.3 Self Calibration
Please refer to Self calibration.
2.16.4 Factory Setup
Click “Factory Setup” in “Utility” menu to load default setups.
When you click the Factory Setup in Utility menu, the oscilloscope displays the CH1 and CH2
waveforms and removes all other waveforms.
The oscilloscope set up for normal operation when it is shipped from the factory and can be
recalled at any time by user.
The Factory Setup function does not reset the following settings:
Language option
Date and time
2.16.5 Language
Click “Language” in “Utility” menu.
There are two languages in “Language” menu. The default language is English.

PC Application
User’s Manual 48
Note: The language of App depends on System language of iOS.
2.17 Print And Print Preview
Click “Print” in “File” menu to set the printer to print the current waveform.
1. Click “print” in “File” menu or Hotkeys “Ctrl+P” to set the current waveform.
2. Click the “Print Preview” in “File” menu to get into the Preview windows.
Click the “Print Preview” in “File” menu to get into the Preview window.
In “Print Preview” window, use the “Zoom In” button and the “Zoom Out” button to change the
size of the waveform graph. Click the “Close” button to turn this window off and click the “Print”
button to print the report.

Appendix
User’s Manual 50
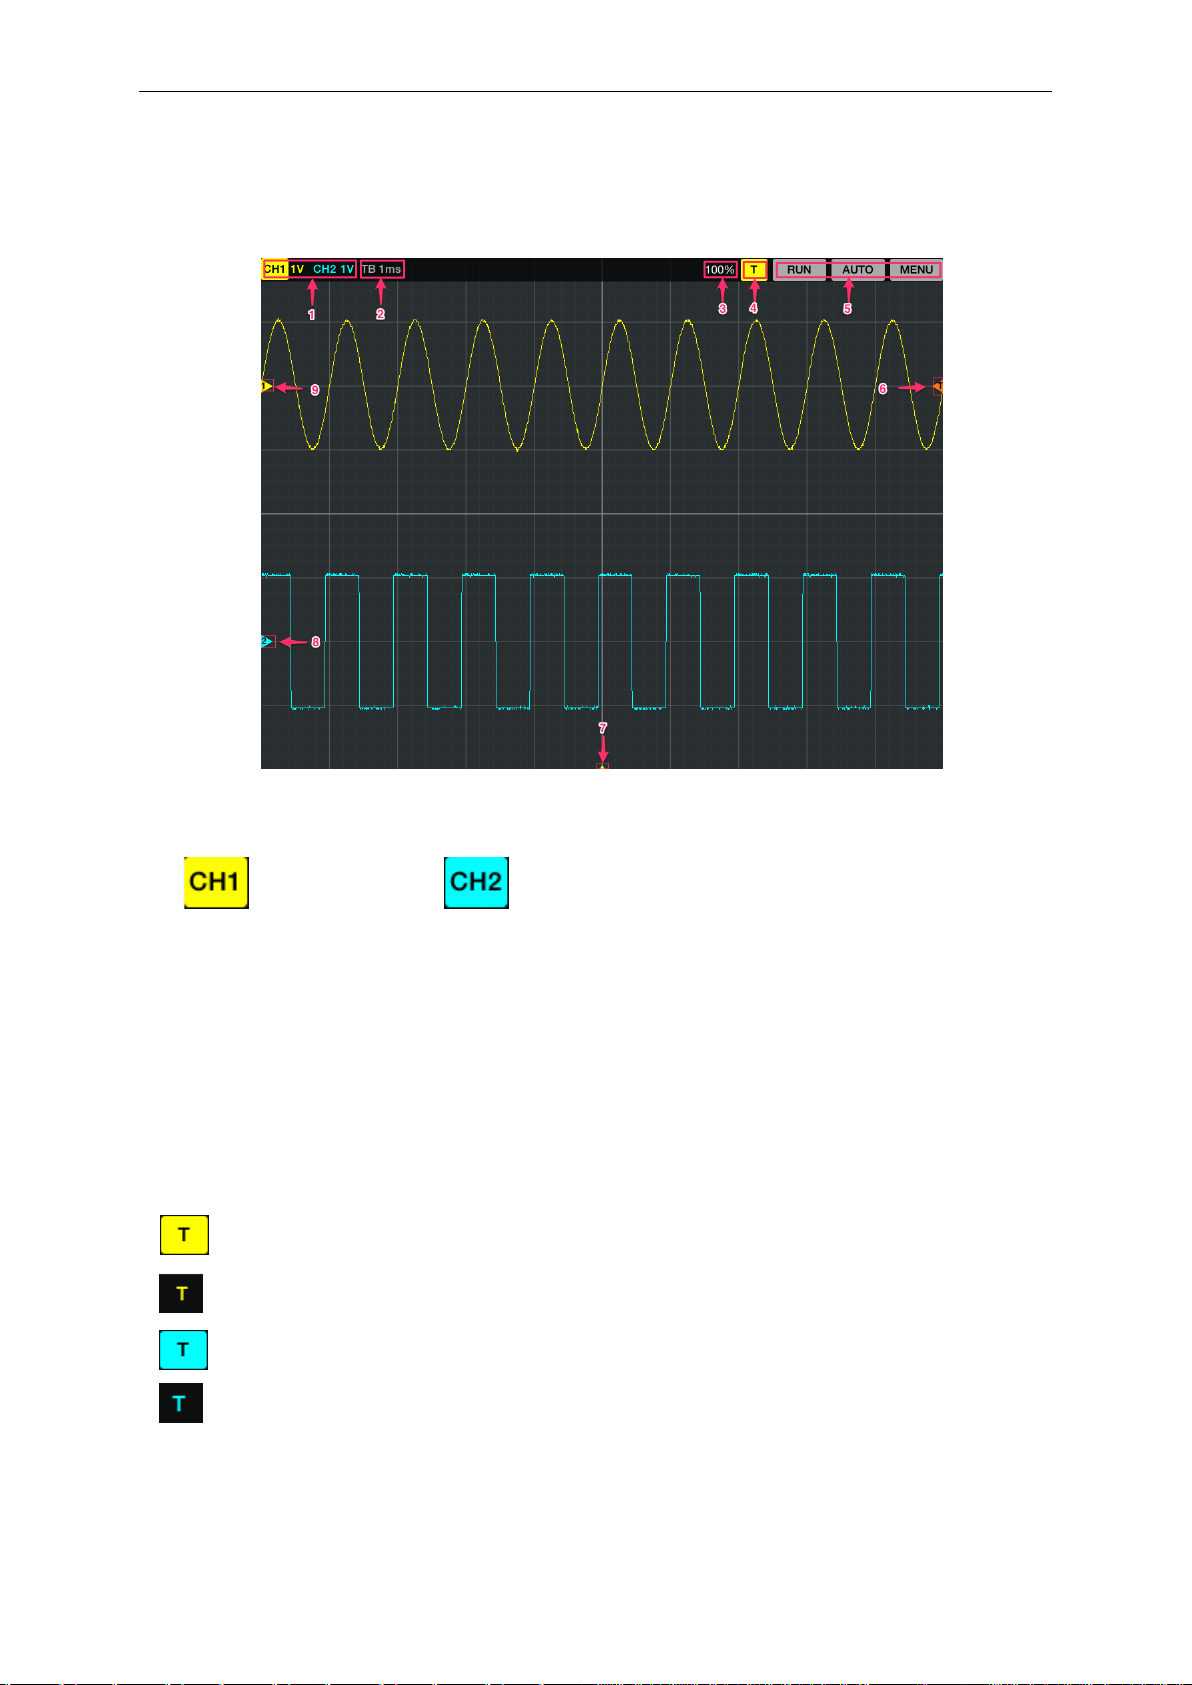
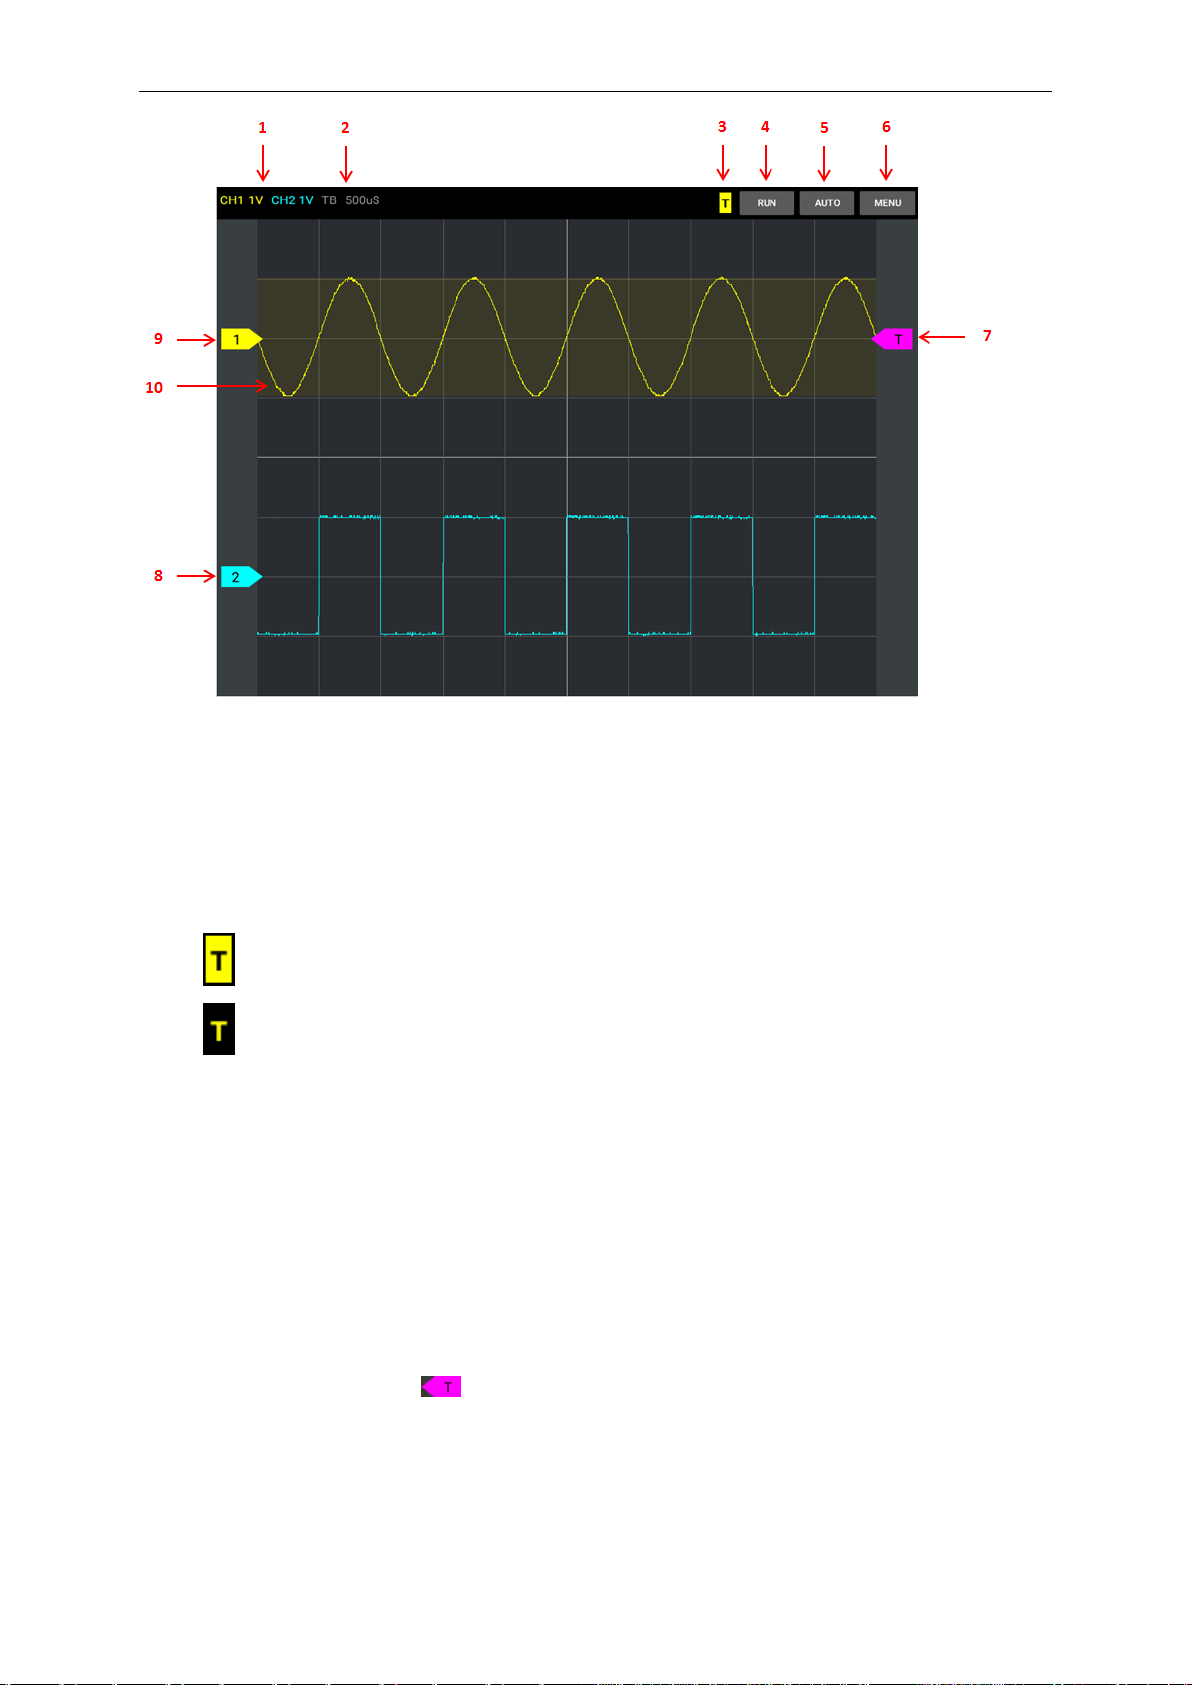
3.1 User Interface
The user’s interface:
1. Channel information and Volt/Div
: CH1 is selected. : CH2 is selected.
If the channel is select, you can see yellow background of CH1 or blue background of CH2.
2. Time/DIV: lead the setting of the time base parameters
Select the time setting for the beam to sweep one major division on the screen. By selecting
different time/div settings it is possible to zoom in on the frozen waveform on the screen.
3. Battery level
4. Trigger State
5. Function menu
RUN: Run the application. Tap RUN menu again to stop it.
A signal is triggerred and trigger source is CH1.
A signal is not triggerred and trigger source is CH1.
A signal is triggerred and trigger source is CH2.
A signal is not triggerred and trigger source is CH2.
Appendix
User’s Manual 51
AUTO: Automatically set the oscilloscope controls to generate a usable display of the input
signals. Refer to the following table for relative content.
Menu: Main menu.
6. Trigger Level
Tap the trigger level icon and move up or move down, the trigger level value will display on the
screen.
7. Horizontal Trigger position
Tap the horizontal trigger position icon and move left or move right, the horizontal trigger position
will display on the screen. Click “Trigger->Indicator” in main menu and slid the slider to enable the
function.
8. CH2 Zero level
The marker shows the reference points of the displayed waveforms of CH1.
9. CH1 Zero level
The marker shows the reference points of the displayed waveforms of CH2.
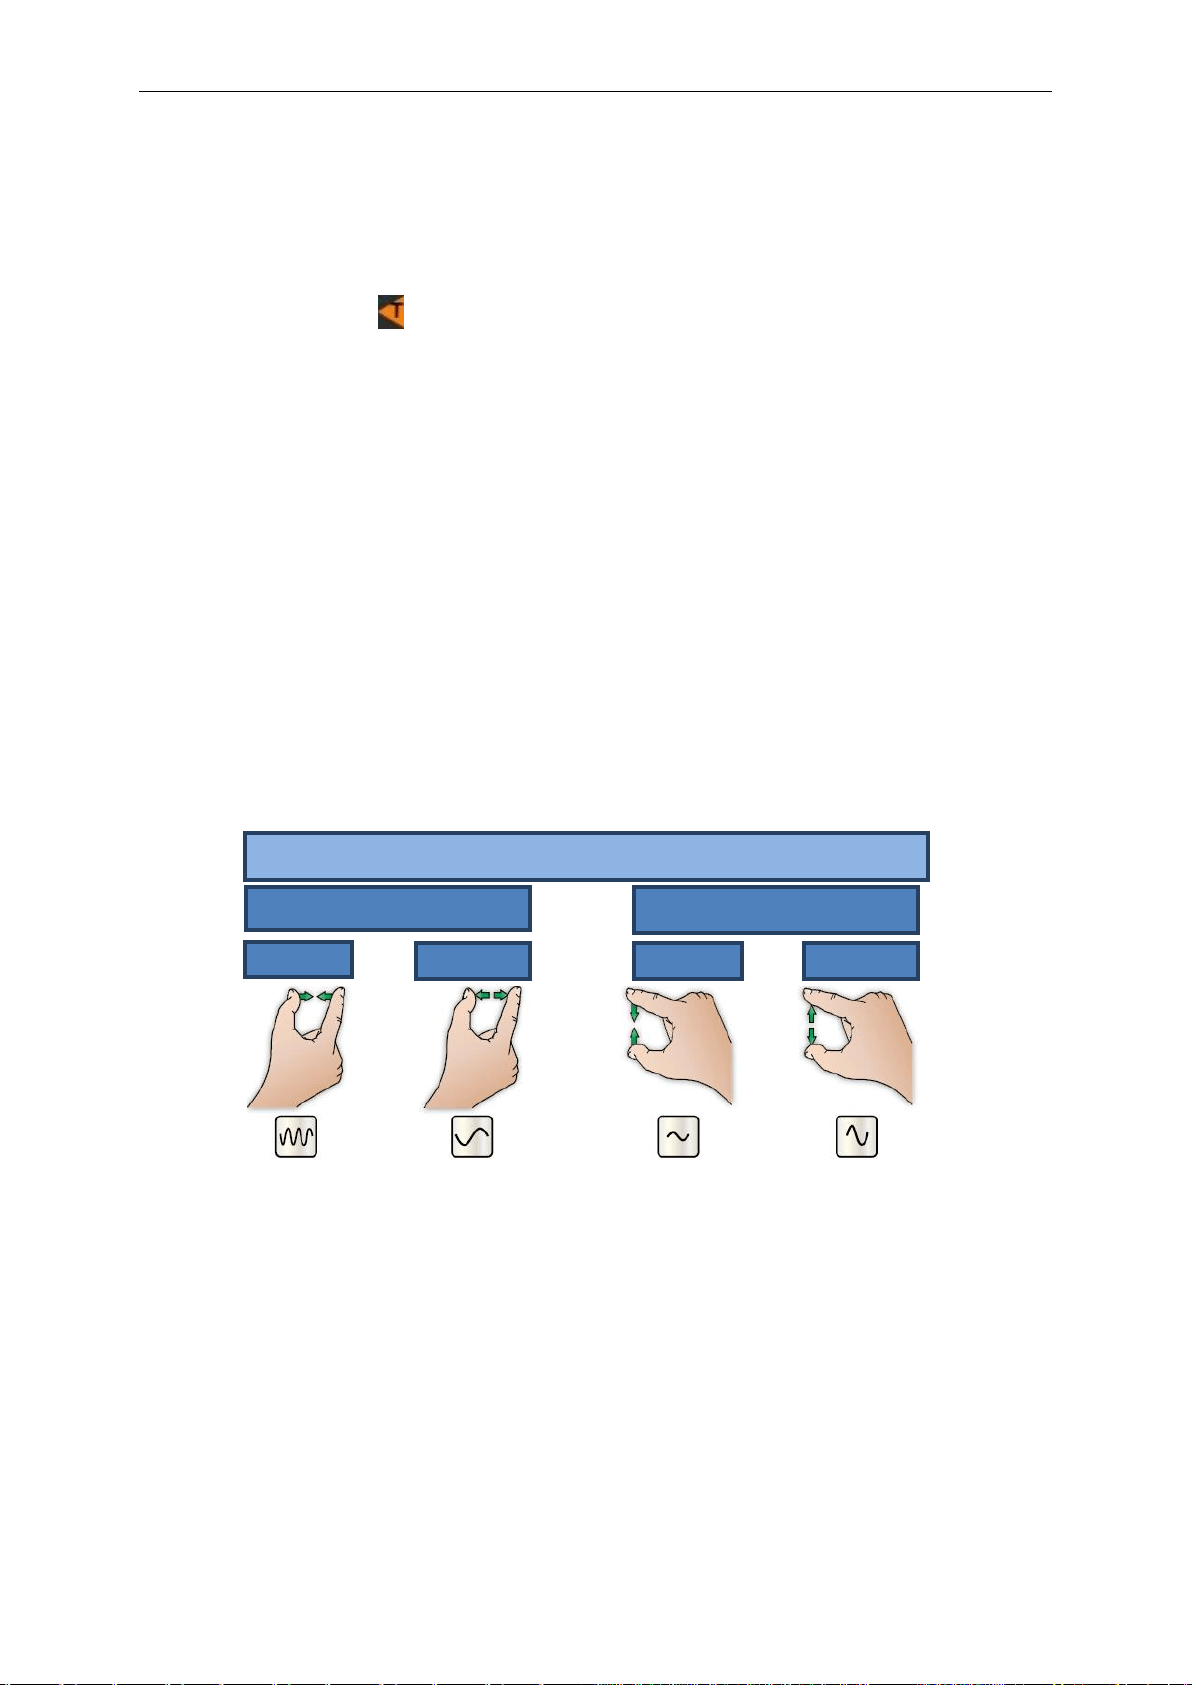
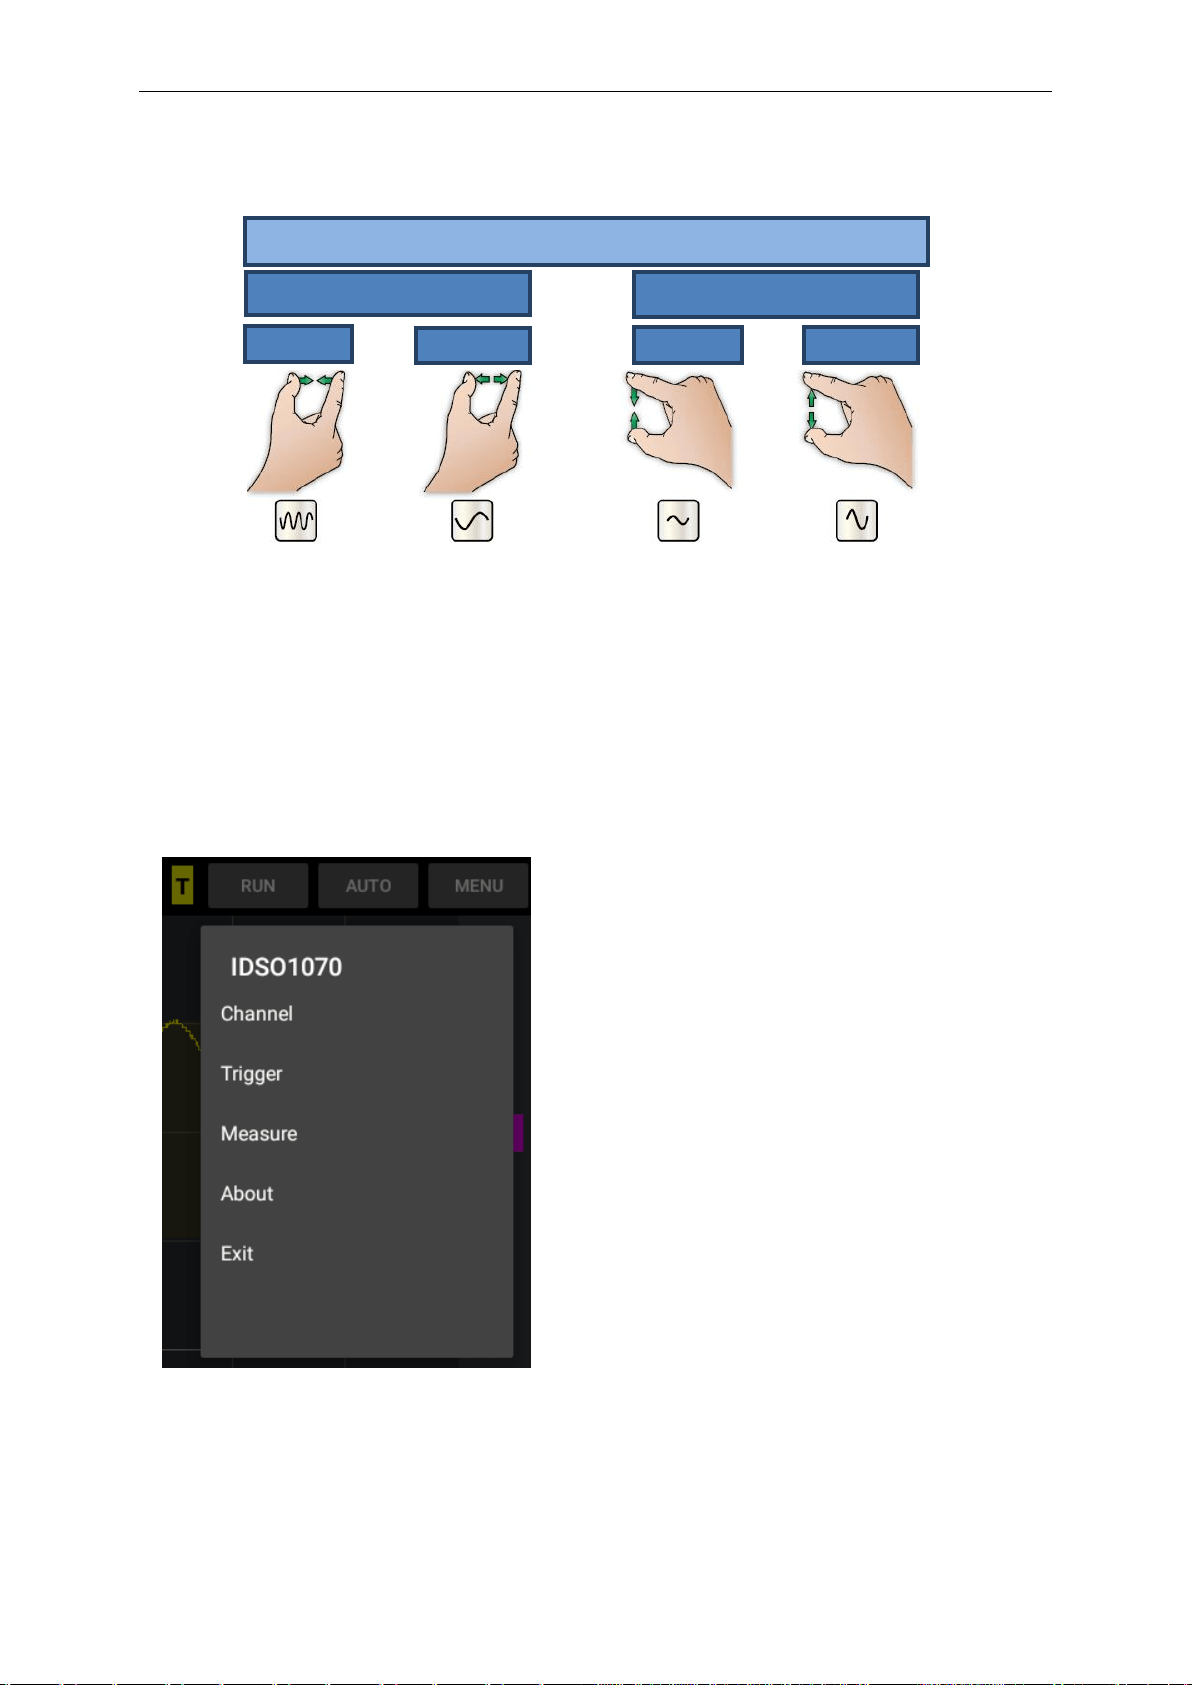
Time/Div
Volt/Div
Increase
Decrease
GESTURES FOR TABLET
Increase
Decrease
Appendix
User’s Manual 52
3.2 Menu System
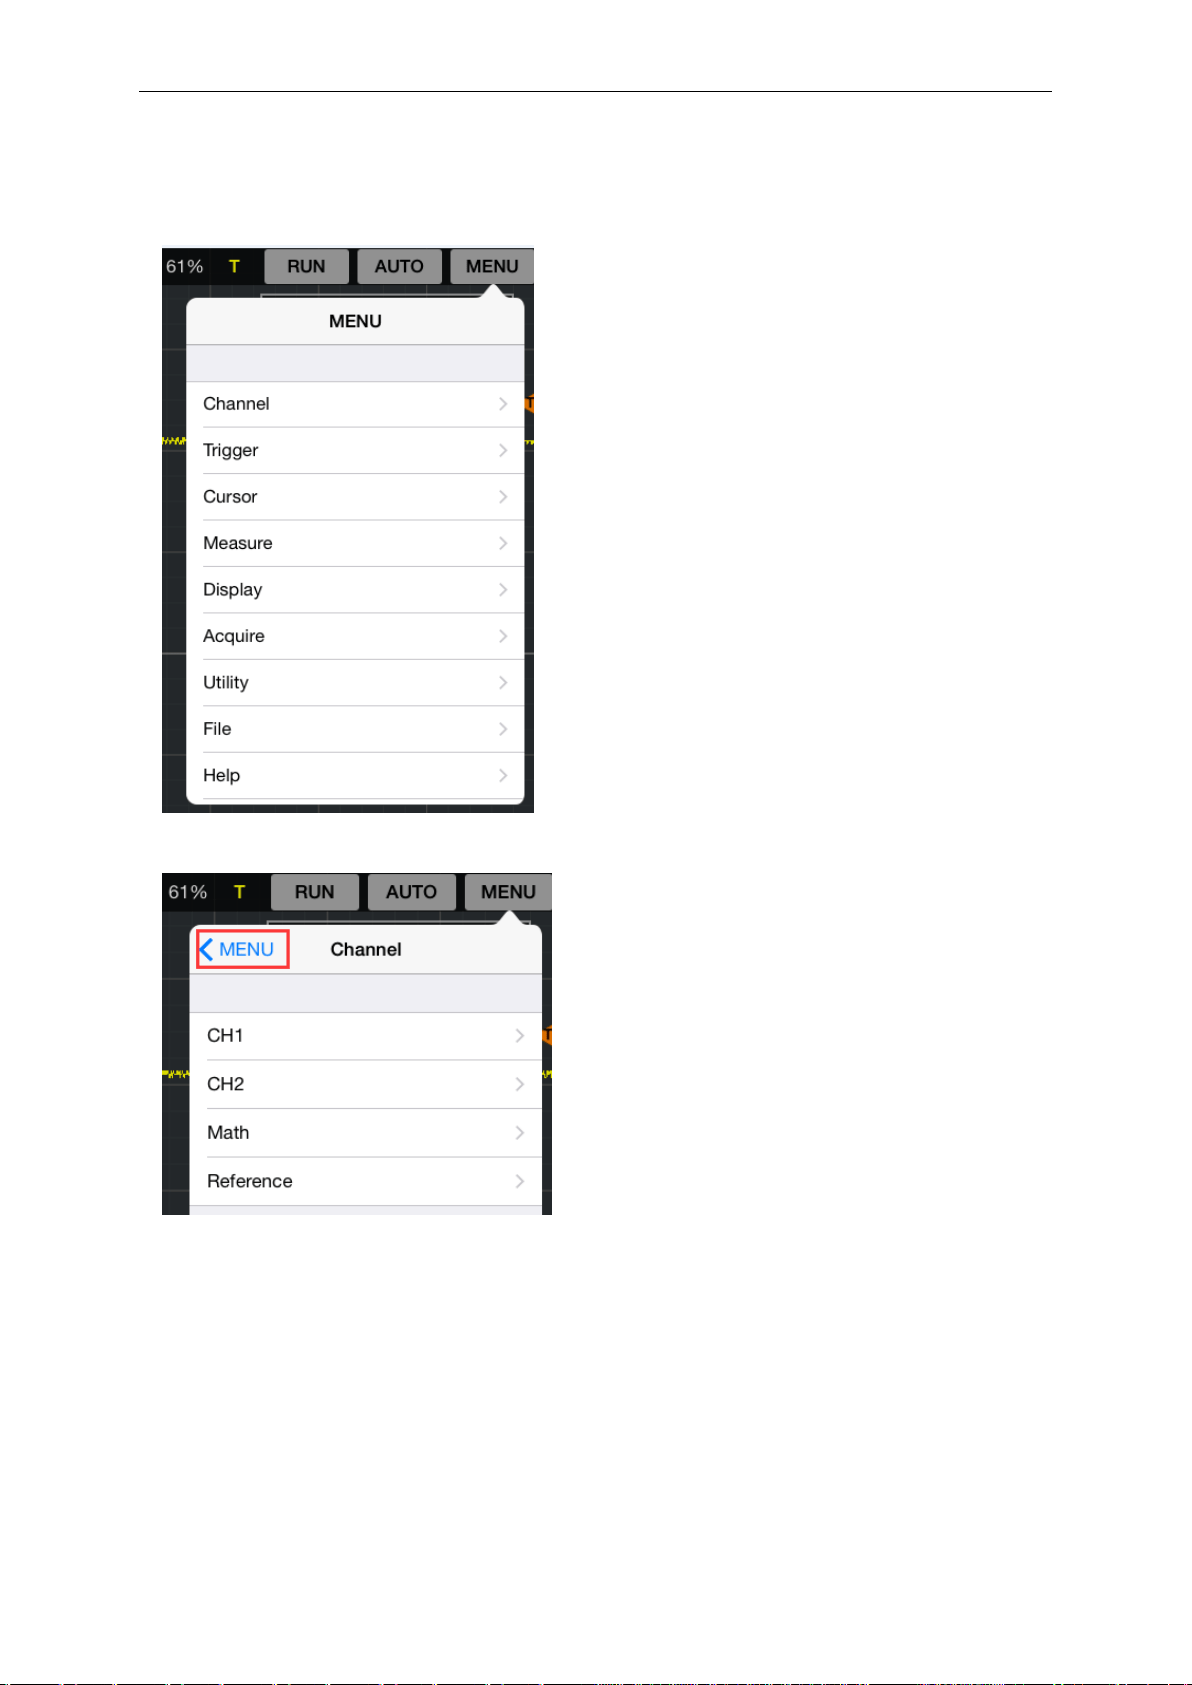
The Main Menu:
After enter submenu, please tap “<MENU” to return to main menu.
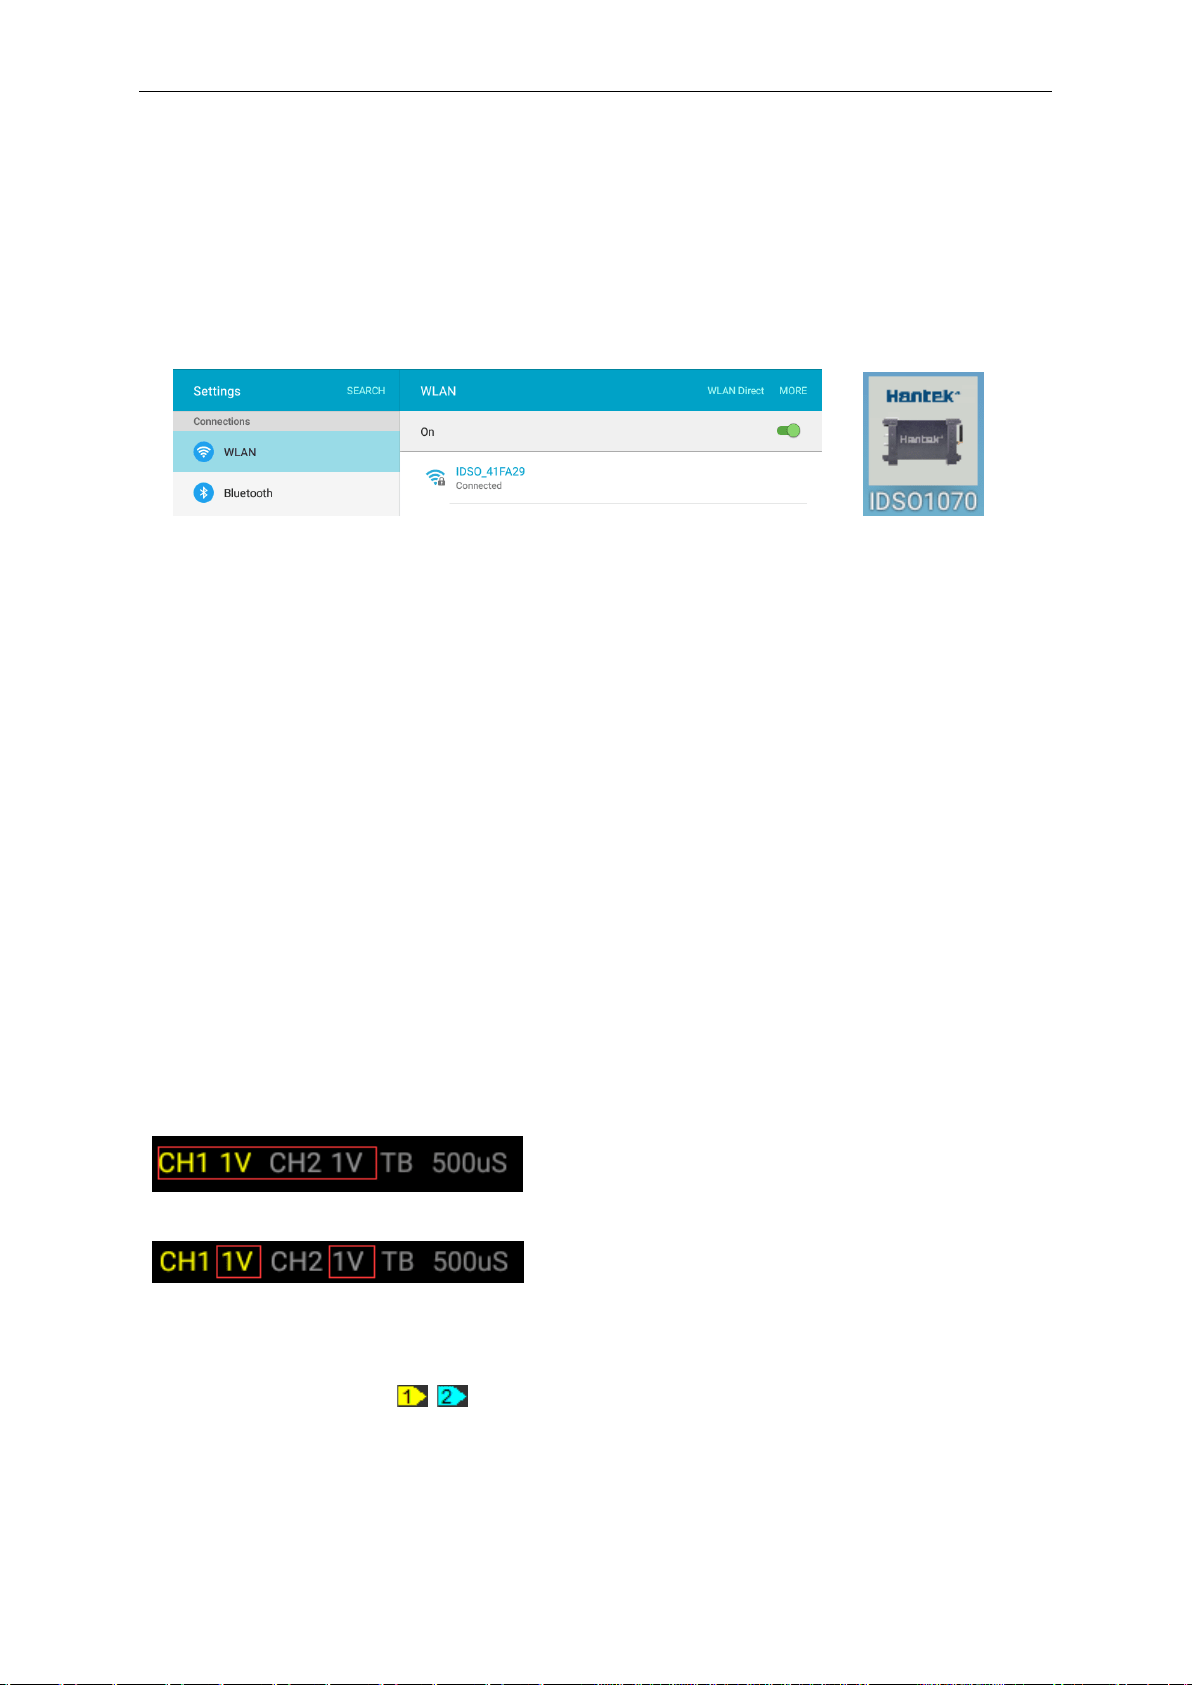
3.3 Connect IDSO With Apple
IDSO device work in direct mode
When in the direct mode, Apple/Android device is connect with the IDSO device via Wi-Fi hotspot
which created by IDSO device. IDSO device works in this mode in default.
1. Power on the IDSO.
1. Channel: CH1, CH2, Math and Reference
setting
2. Trigger: Set trigger system
3. Cursor: Set cursor measure type
4. Measure: Set measurement parameters
5. Display: Change wave display type and color.
6. Acquire: Start, Stop, Autoset and other
operation setting
7. Utility: Utility setting
8. File: Save and load waveform data and setup.
9. Help: Turn on help file
Appendix
User’s Manual 53
Keep pressing power button until power indicator lights up.
2. The indication of communication USB/WI-FI is slow blinking. Hotspot, creates own wireless
local area network (WLAN).
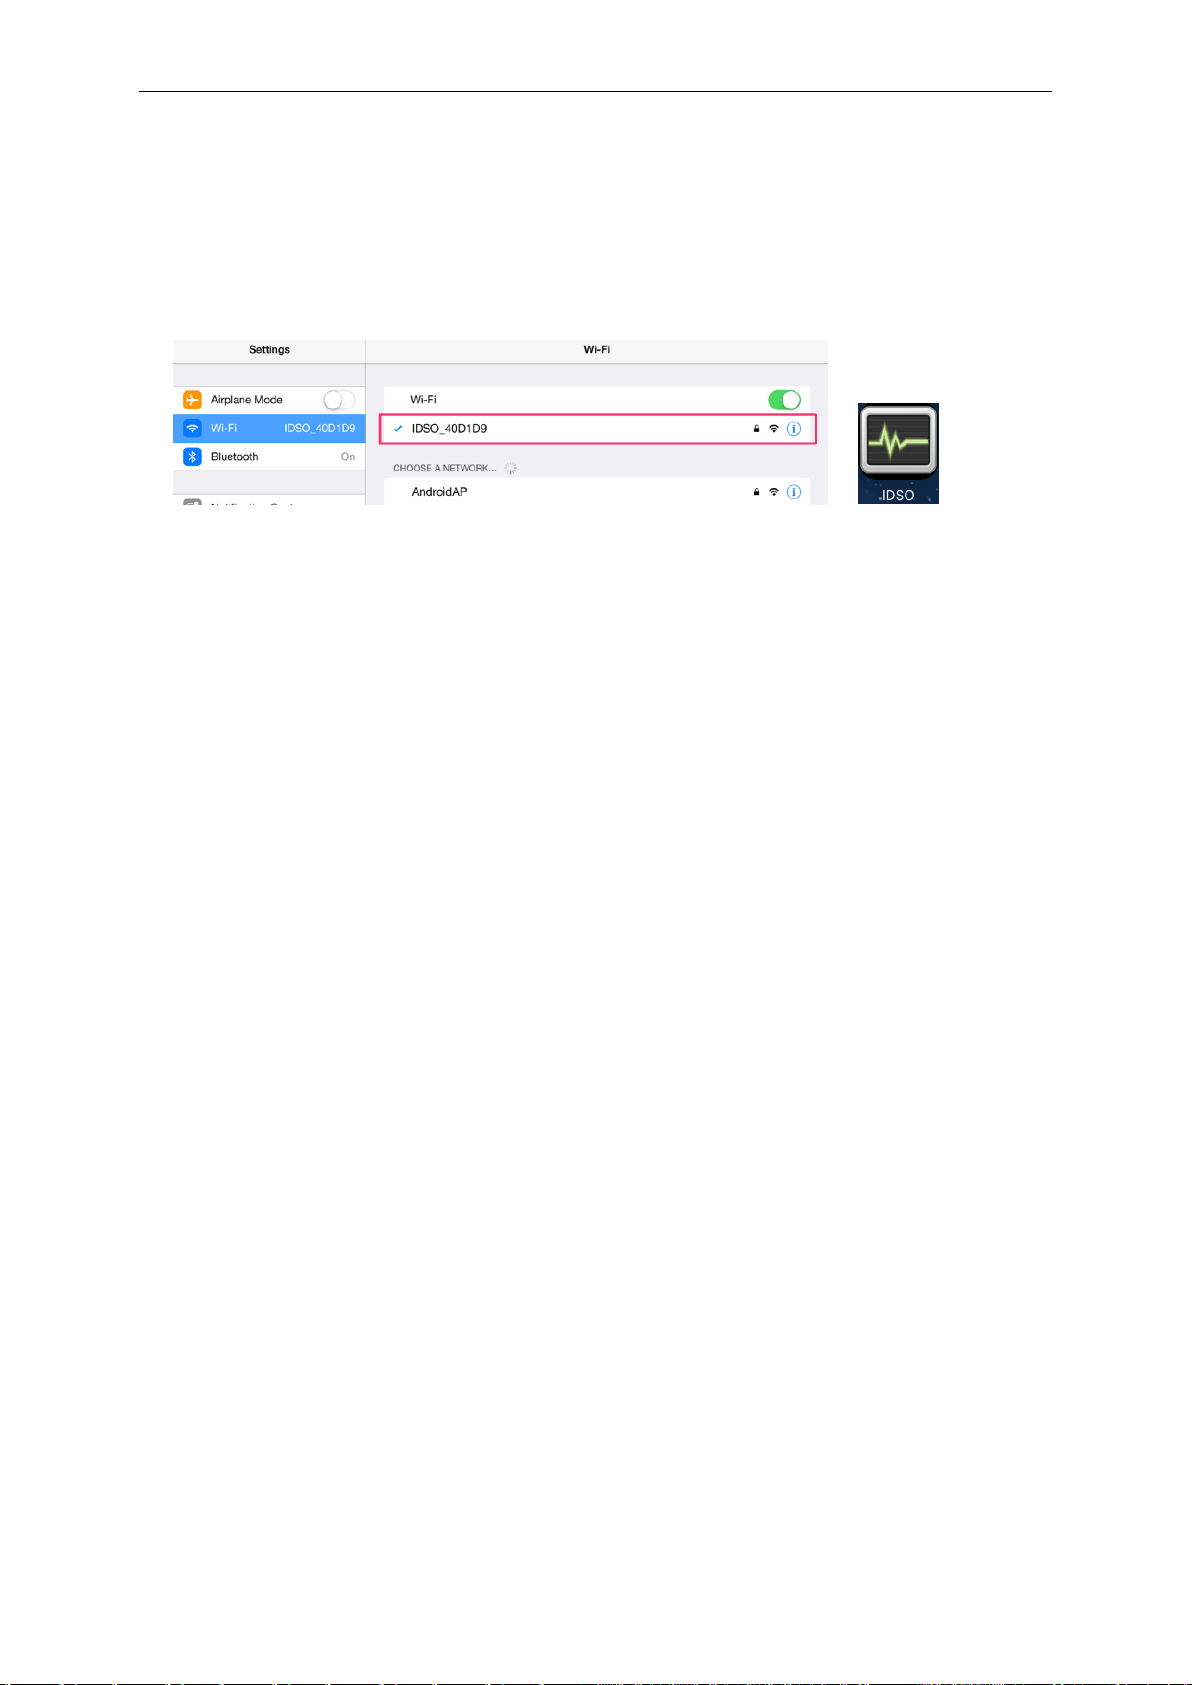
3. Connect your Apple/Android device with Wi-Fi hotspot. Click “SettingWi-Fi” options, then
select Network Name of the IDSO device. You can get Network Name from the label of IDSO’s
shell.
4. Connect the IDSO device to a signal source.
5. Tap the IDSO app to open it. Then click “RUN” button. The scope is ready to use.
If you can’t connect it successfully, please do as the followings:
1) Close the IDSO APP.
2) Long press the Easylink button until the “USB/WI-FI” LED is off, release the Easylink
button. IDSO device will reboot automatically. If the IDSO device doesn't reboot
automatically, reboot it manually.
3) After rebooted, the IDSO device will be in direct mode.
IDSO device work in Indirect Mode
When in the indirect mode, IDSO device and iOS device communicate via a third-path Wi-Fi
router.
1. If the IDSO APP is running on background, please close it firstly.
2. Connect the iOS device to the Wi-Fi router. (SettingWi-Fi )
3. Open IDSO App, MENU->Utility->Indirect Mode, input the router's password, Press Apply
button.
4. Long press the Easylink button until the “USB/Wi-Fi” LED off, release Easylink button.
IDSO device will reboot automatically. If the IDSO device doesn't reboot automatically,
reboot it manually.
After rebooted, IDSO will connect to the Wi-Fi router. IDSO App should pop up a tip.
3.4 Set Horizontal System
3.4.1 Horizontal Setting
1. Time/DIV: Use gesture to set the time base.
2. Format: leads the setting of the horizontal format parameters.
Appendix
User’s Manual 54
Format
Set the waveform display format (Y-T, X-Y). The default is YT mode.
Y -T: Shows the relative relation between vertical voltage and horizontal time.
X -Y: Show CH1 value at X axis; CH2 value at Y axis. The XY format is used to analyzer phase
difference, such as those represented by Lissajous patterns. Click “Utility->XY Mode” in main
menu.
Horizontal Trigger Position
Tap the horizontal trigger position icon and move left or move right, the horizontal trigger position
will display on the screen. Click “Trigger->Indicator” in main menu and slid the slider to enable
the function.
Double click the icon to reset the trigger point back to the screen center.
3.4.2 The Application of the X-Y Operation
Select X-Y format in Utility menu. More information, please refer to The Application of the X-Y
Operation.
3.5 Set Vertical System
Click “Channel” in main menu.
Select Channel: User can select the channel CH1, CH2, Math and Reference.
Appendix
User’s Manual 55
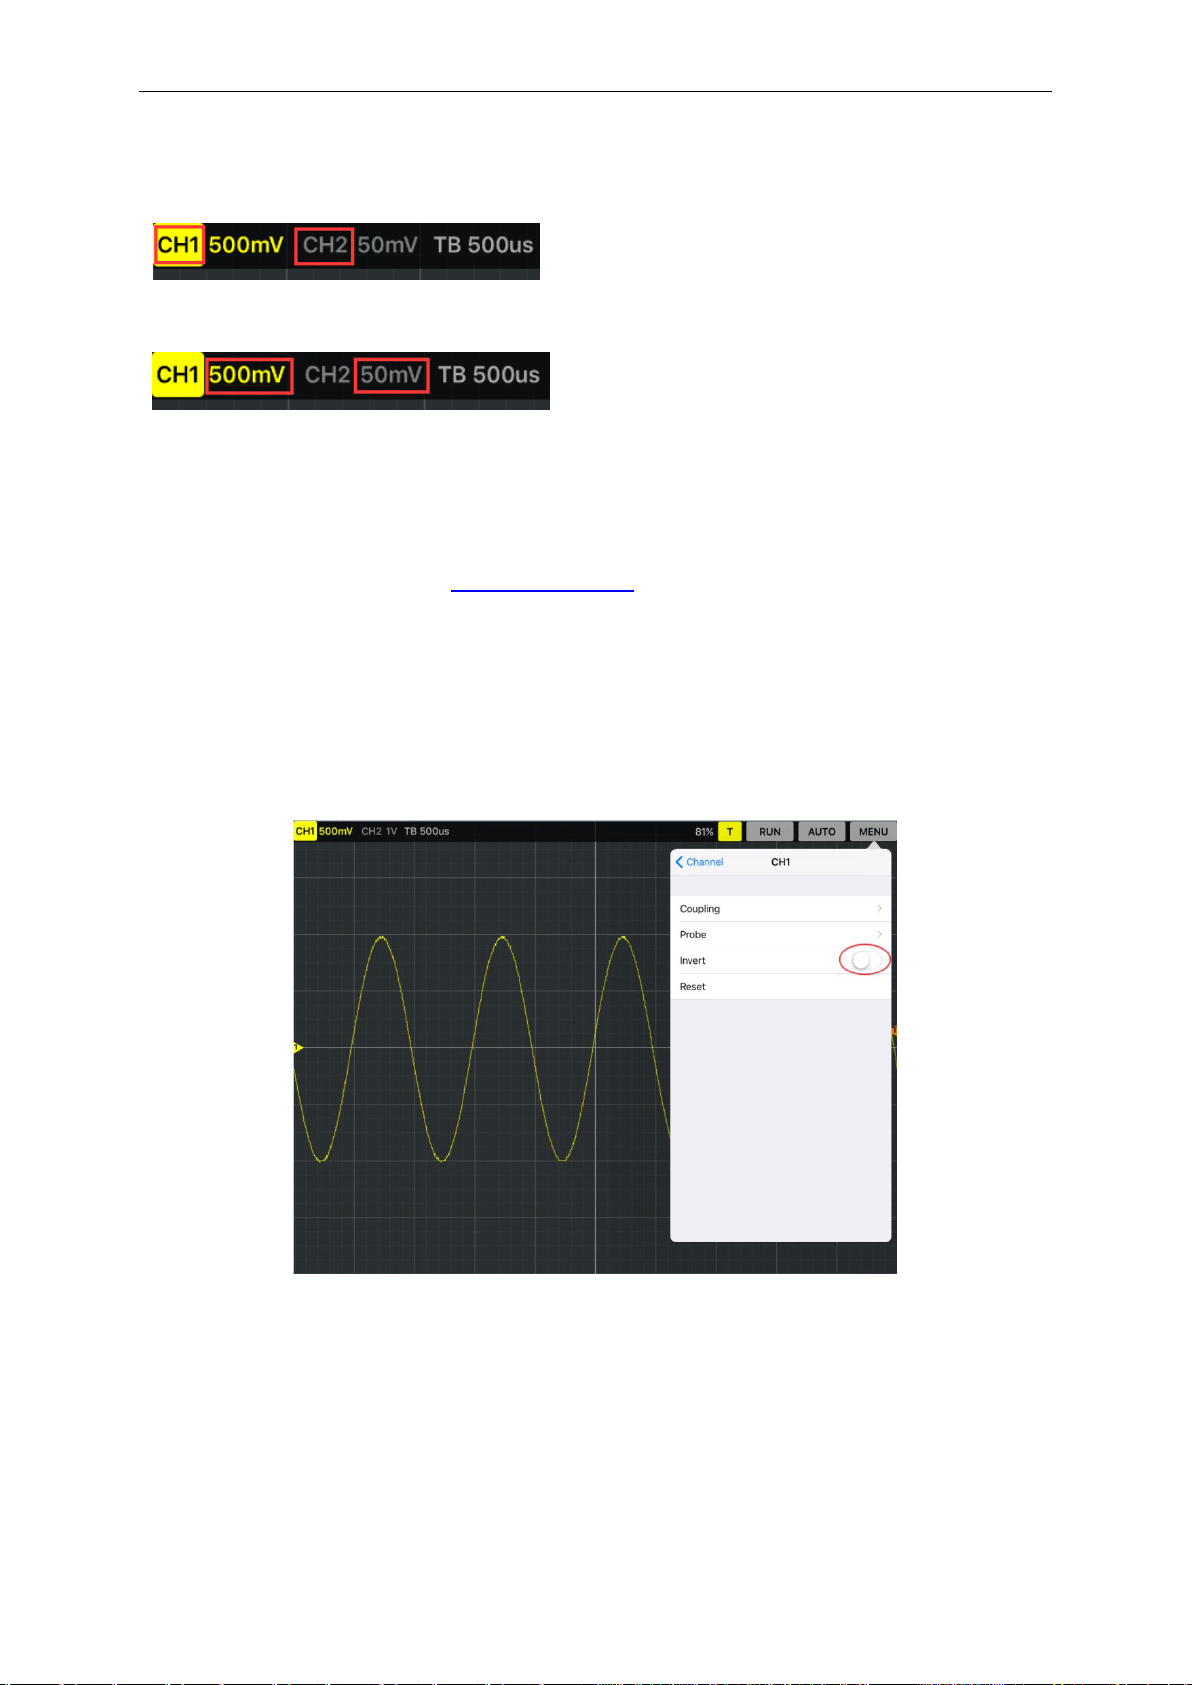
Channel Setting:
ON/OFF: Tap CH1 or CH2 icon on the top left corner of the screen.
Volt/DIV: Use gestures to set volt/div.
Coupling: Select the channel coupling DC/AC/GND.
Probe: Select the attenuation factor for the probe. To check the probe attenuation setting, toggle
the probe menu to match the attenuation factor of the probe.
More information, please refer to Set Vertical System.
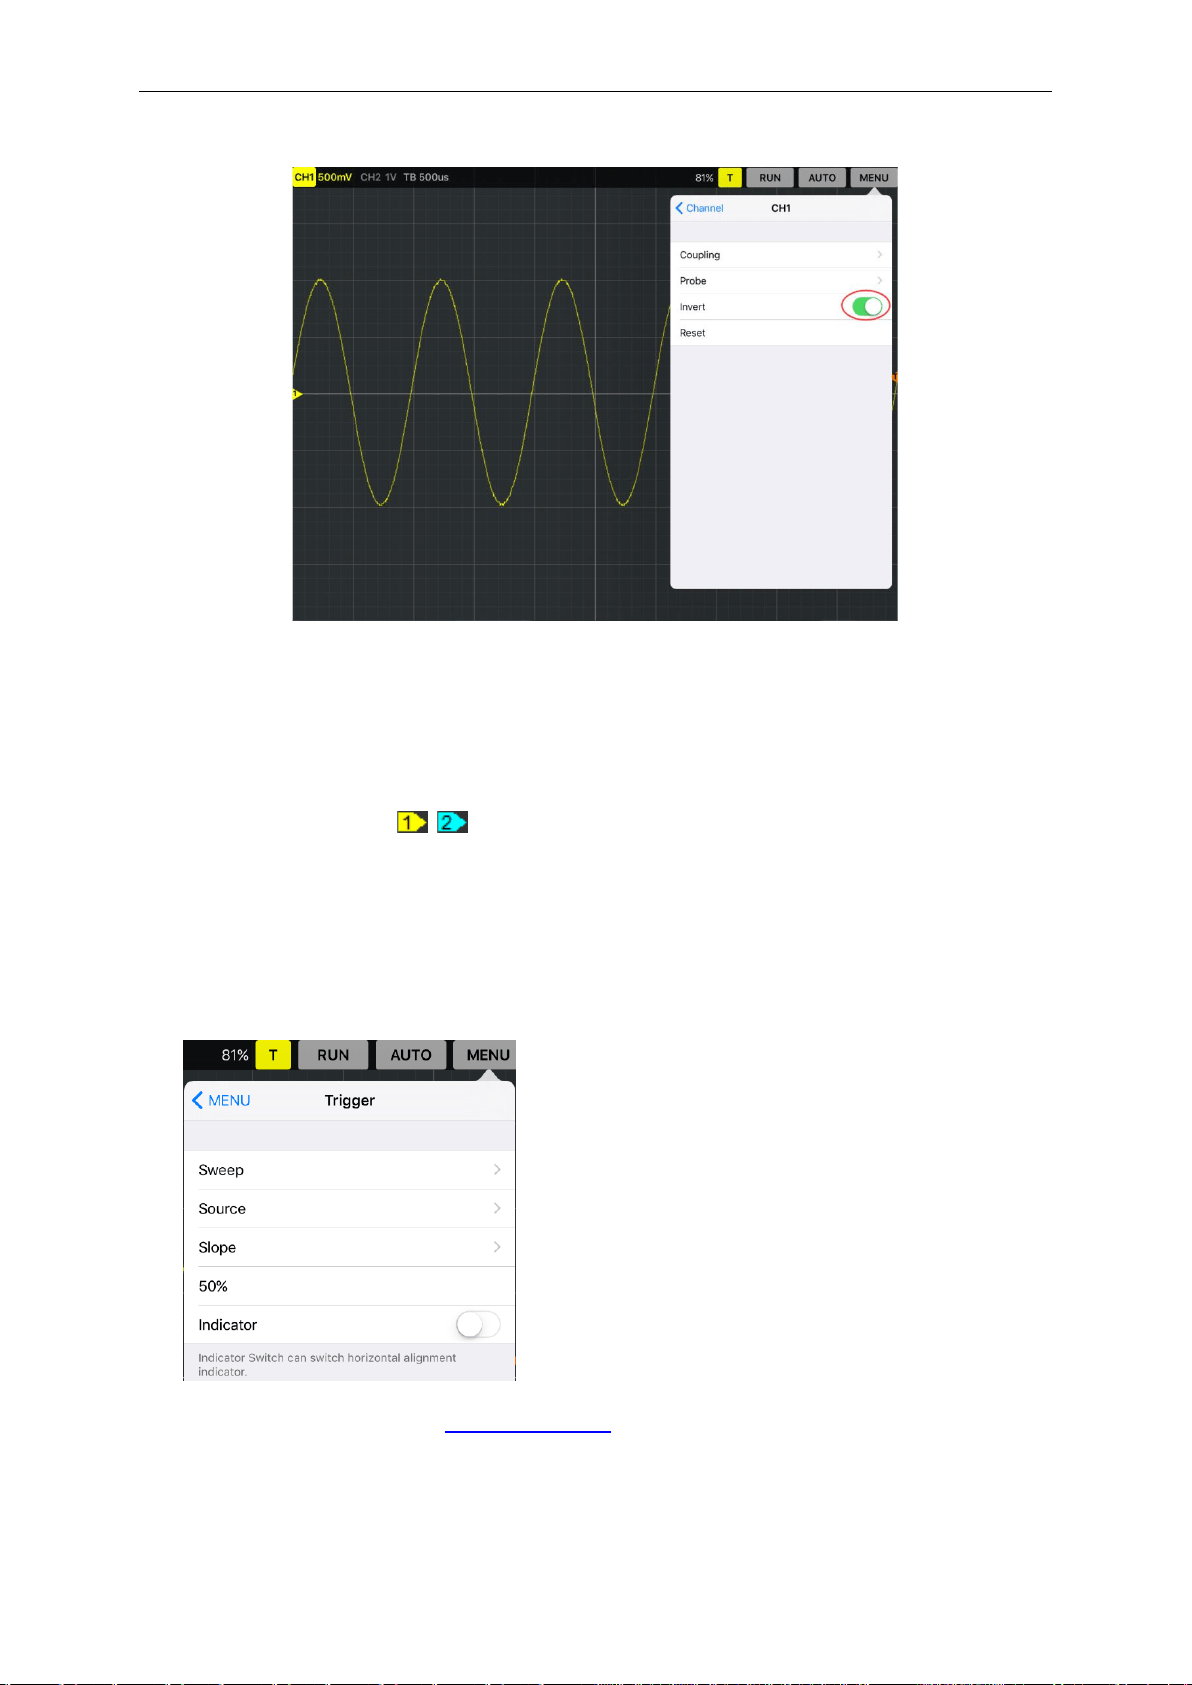
Invert
The invert function turns the displayed waveform 180 degrees, with respect to the ground level.
When the oscilloscope is triggered on the inverted signal, the trigger is also inverted.
The following picture shows the waveform before inversion:
Appendix
User’s Manual 56
The following picture shows the waveform of inversion:
Reset
Double click the icon to reset the waveforms to the vertical center position on the screen.
Move the waveform
Drag Vertical Position icon to move waveform up and down on the screen.
3.6 Set Trigger System
Click “Setup-> Trigger” menu.
Trigger Setting: Please refer to set trigger system.
50%: The trigger level is set to the vertical midpoint between the peaks of the trigger signal.
Appendix
User’s Manual 57
Trigger Level
Trigger Level icon: User can also drag the trigger icon on screen to adjust the trigger level.
Double click trigger icon to set trigger level to the vertical midpoint between the peaks of the trigger
signal.
3.7 Save and Load
3.7.1 Save/Load File
Click “File->Waveform Data” in main menu to save waveform data as CSV file and load saved
waveform data.
Export Data
Click “File->Waveform Data->Export Data” in main menu to save the current waveform data as
CSV file.
Import Data
Click “File->Waveform Data->Import Data” in main menu to load saved waveform data file.
3.7.2 Save/Load Reference
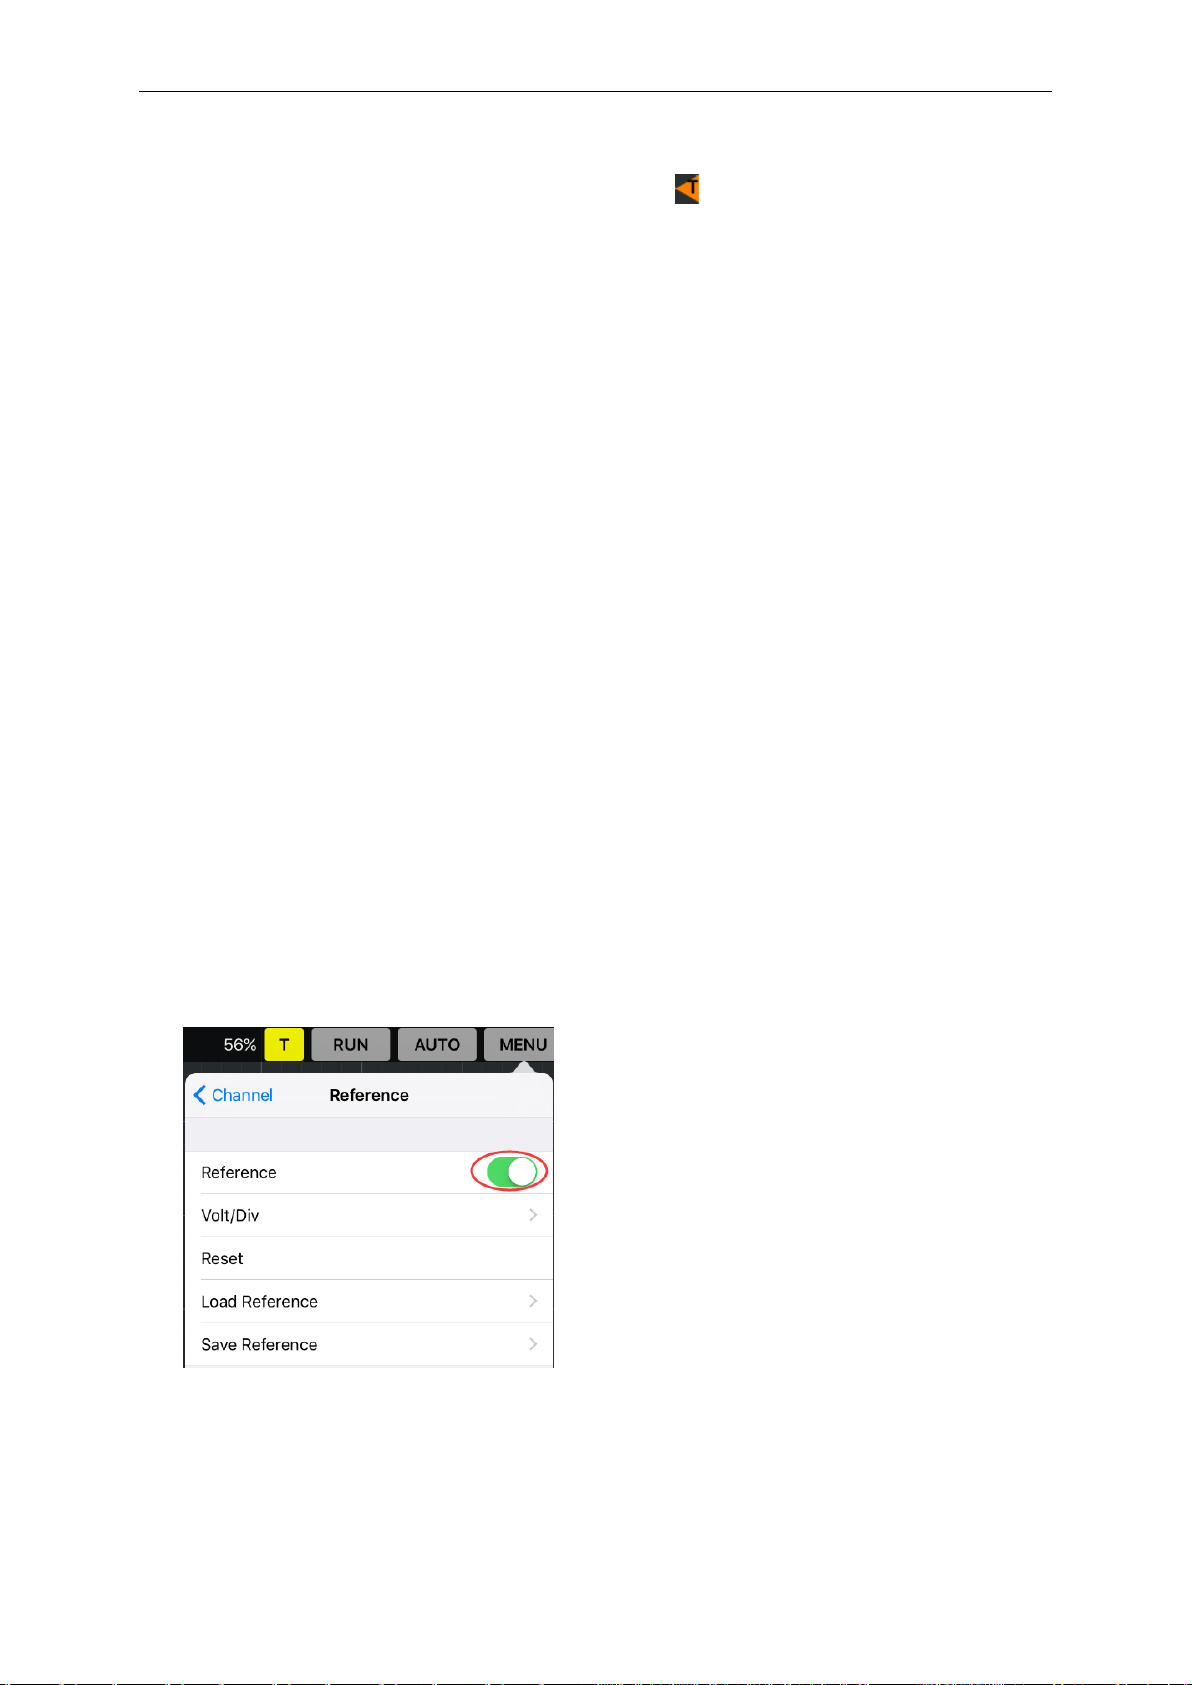
Click “Channel->Reference” in main menu.
The Reference Channel Function:
On/Off: Slid the slider to enable the function.
Volt/DIV: Channel the resolution of the reference channel.
Reset: Double click the icon to reset the waveforms to the vertical center position on the screen.
Appendix
User’s Manual 58
Load: Load the reference waveform from the “.rfc” file from your computer.
Save: Save the current reference waveform to your computer as “rfc” format.
You can change the vertical scale of a waveform. The waveform display will contract or expand
relative to the reference level.
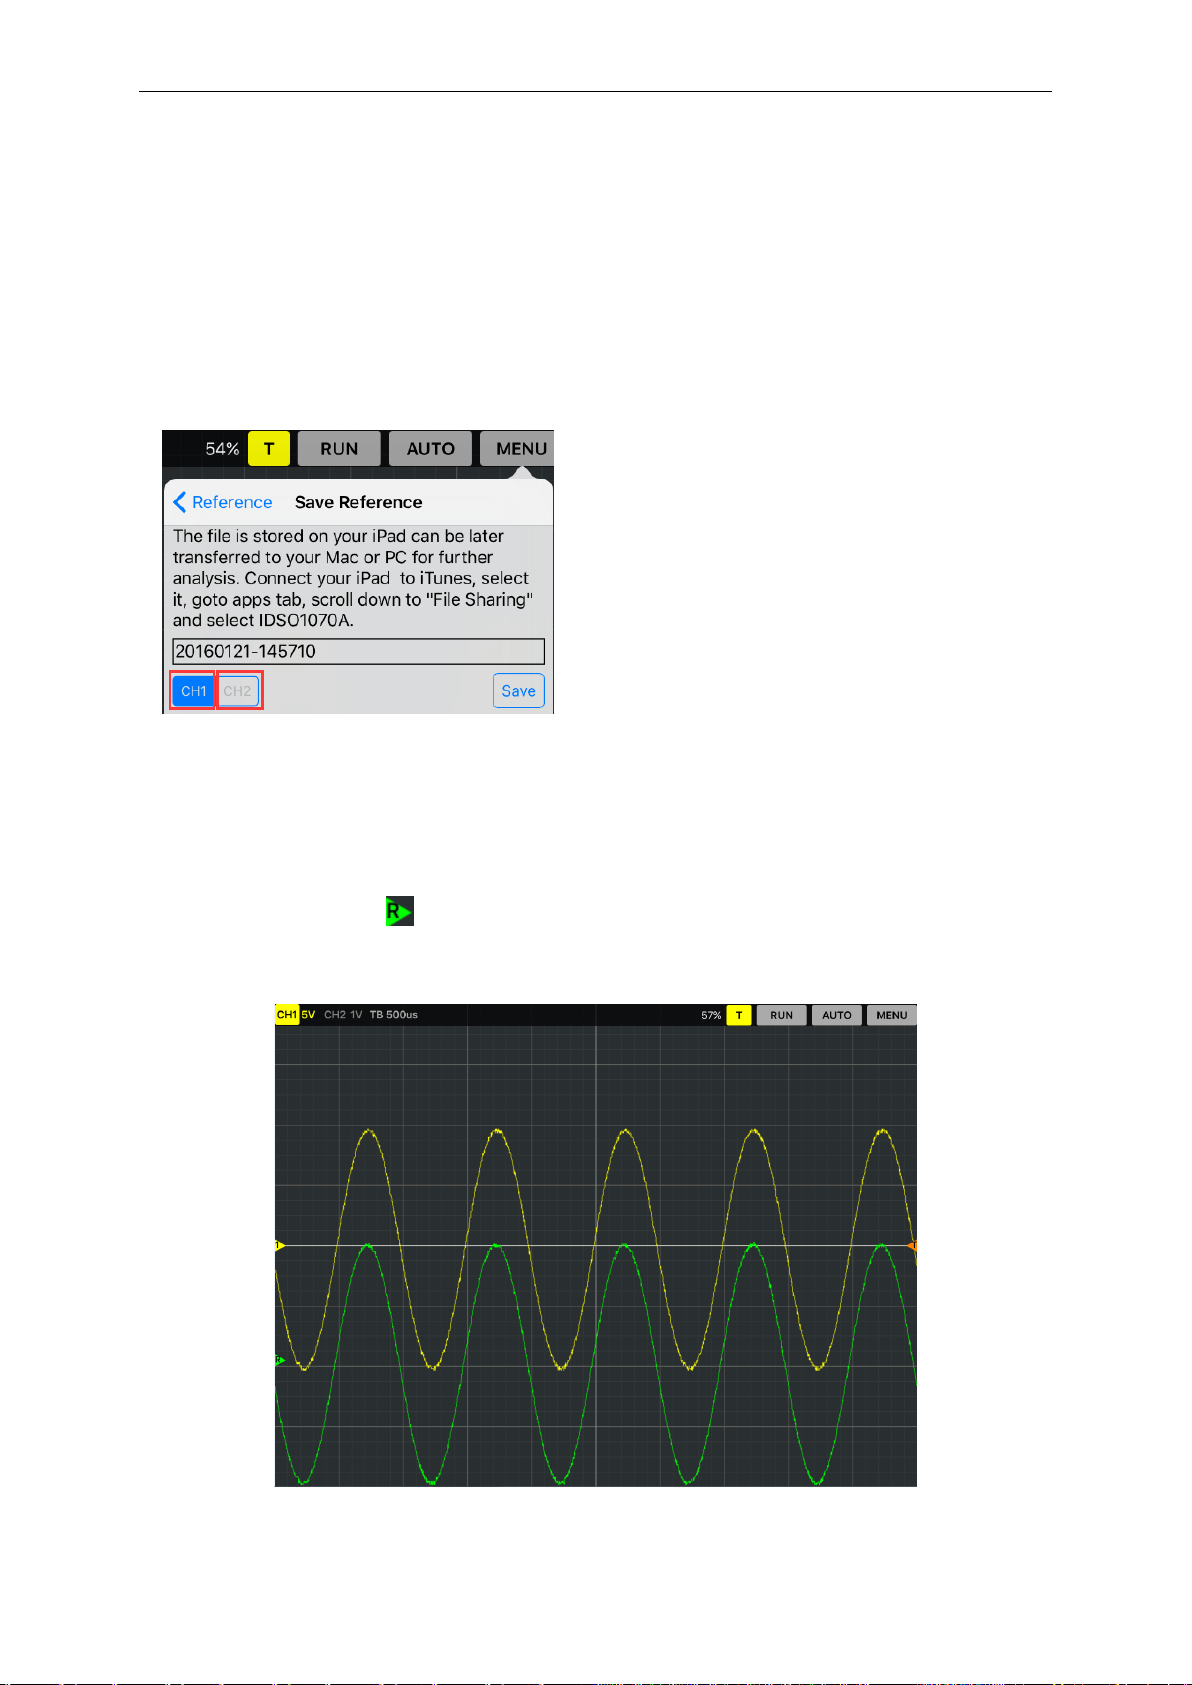
Save
Click “Save Reference” to save the waveform to *.rfc file. The saved source window appears.
Selected the saved source, then click “Save” button to save reference.
Load
Click “Load Reference” to load the “*.rfc” file that was selected. Then click “Load” button to load
selected file. You can tap and drag the reference waveform up and dowm.
The Reference Waveform Display Window:

Appendix
User’s Manual 59
3.7.3 Save/Load Setup
Save Setup
The oscilloscope software saves the current setup before you close the oscilloscope software. The
oscilloscope recalls this setup when you run the software next time. You can use the
“File->Setups->Save Setups” in main menu to permanently save setting.
Load Setup
The oscilloscope can recall the last setup before the oscilloscope software was running, any saved
setups, or the factory setup. You can use the “File->Setups->Load Setups” in main menu to
permanently recall setup.
3.8 Display System
Please refer to Display System.
3.9 Measure Signal
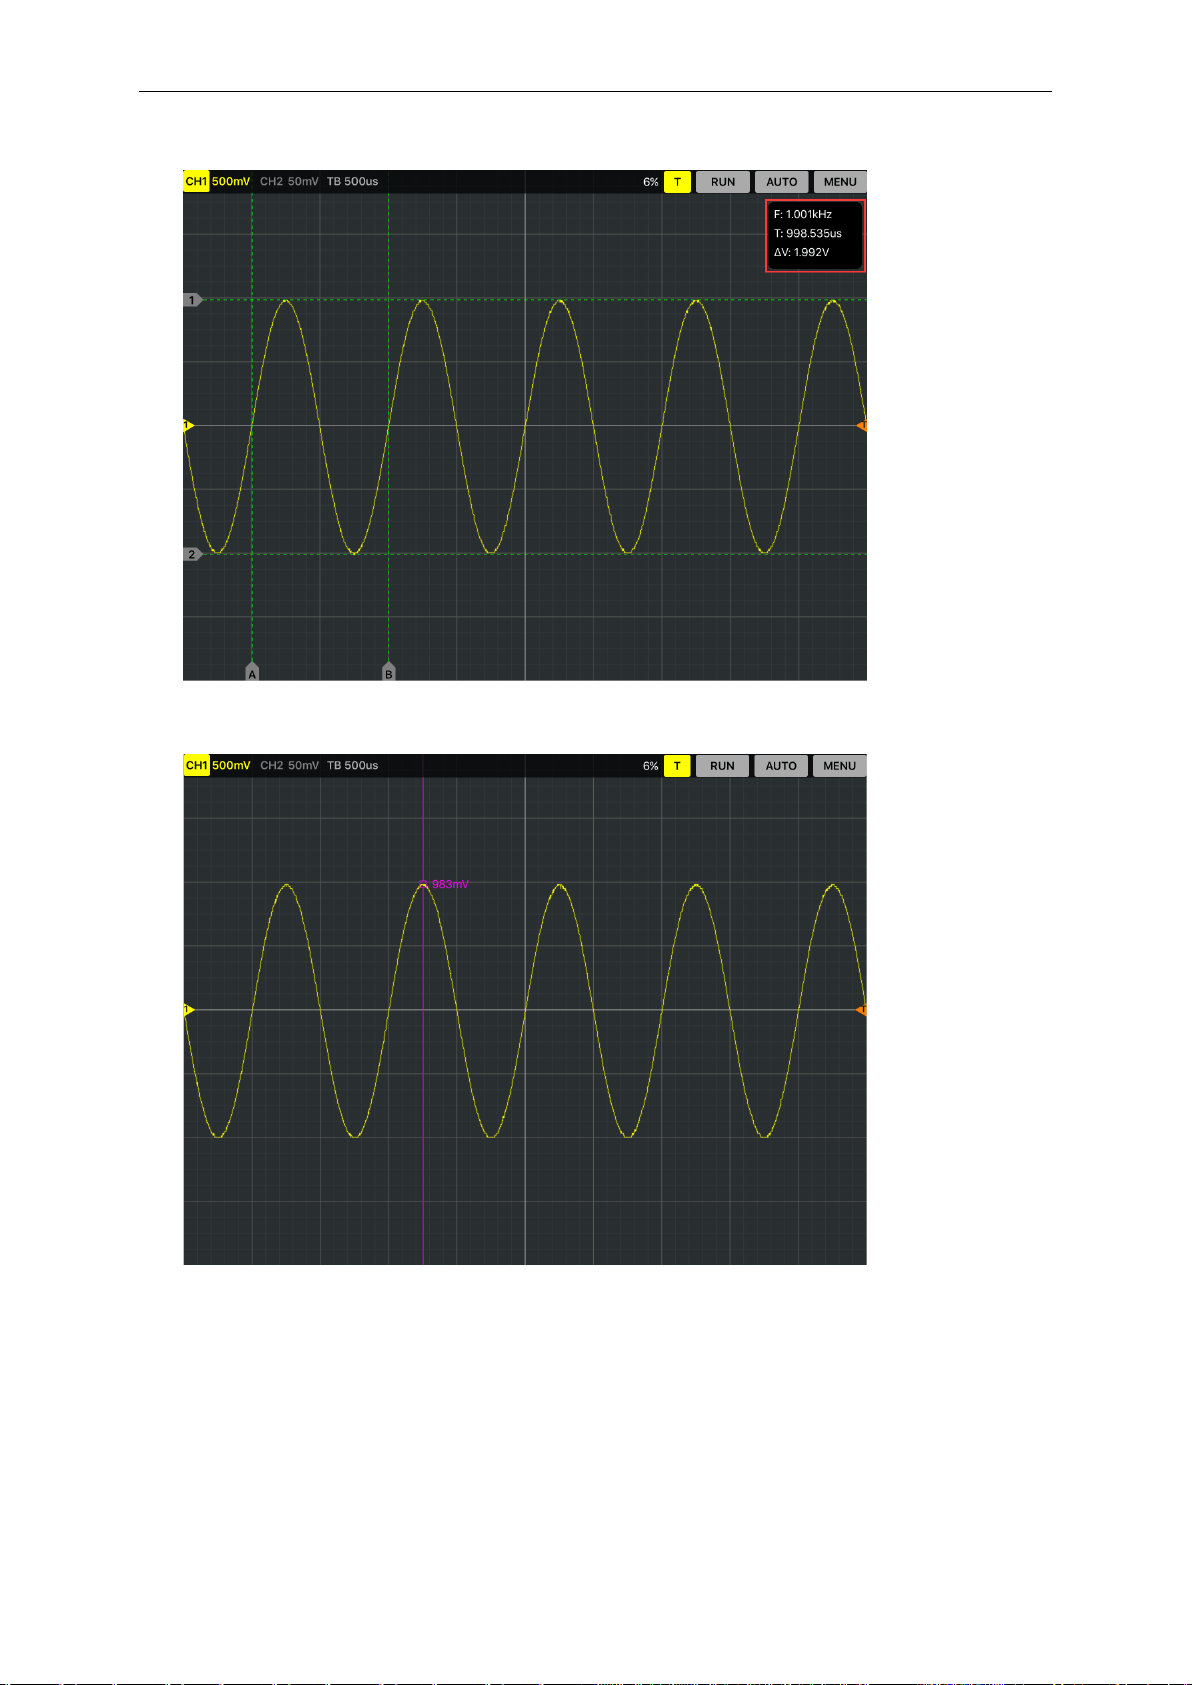
3.9.1 Cursor
Click “Cursor” in main menu. More information, please refer to Cursor.
Please slid the slider to enable or unable the cursor function.
1. Source
The user can set the source to CH1, CH2, MATH and FFT.
2. Type
There are two types of cursors: Cross and Trace.
Appendix
User’s Manual 60
The Cross cursor display window:
The Trace cursor display window:
3.9.2 Measure
Click “Measure” in main menu.
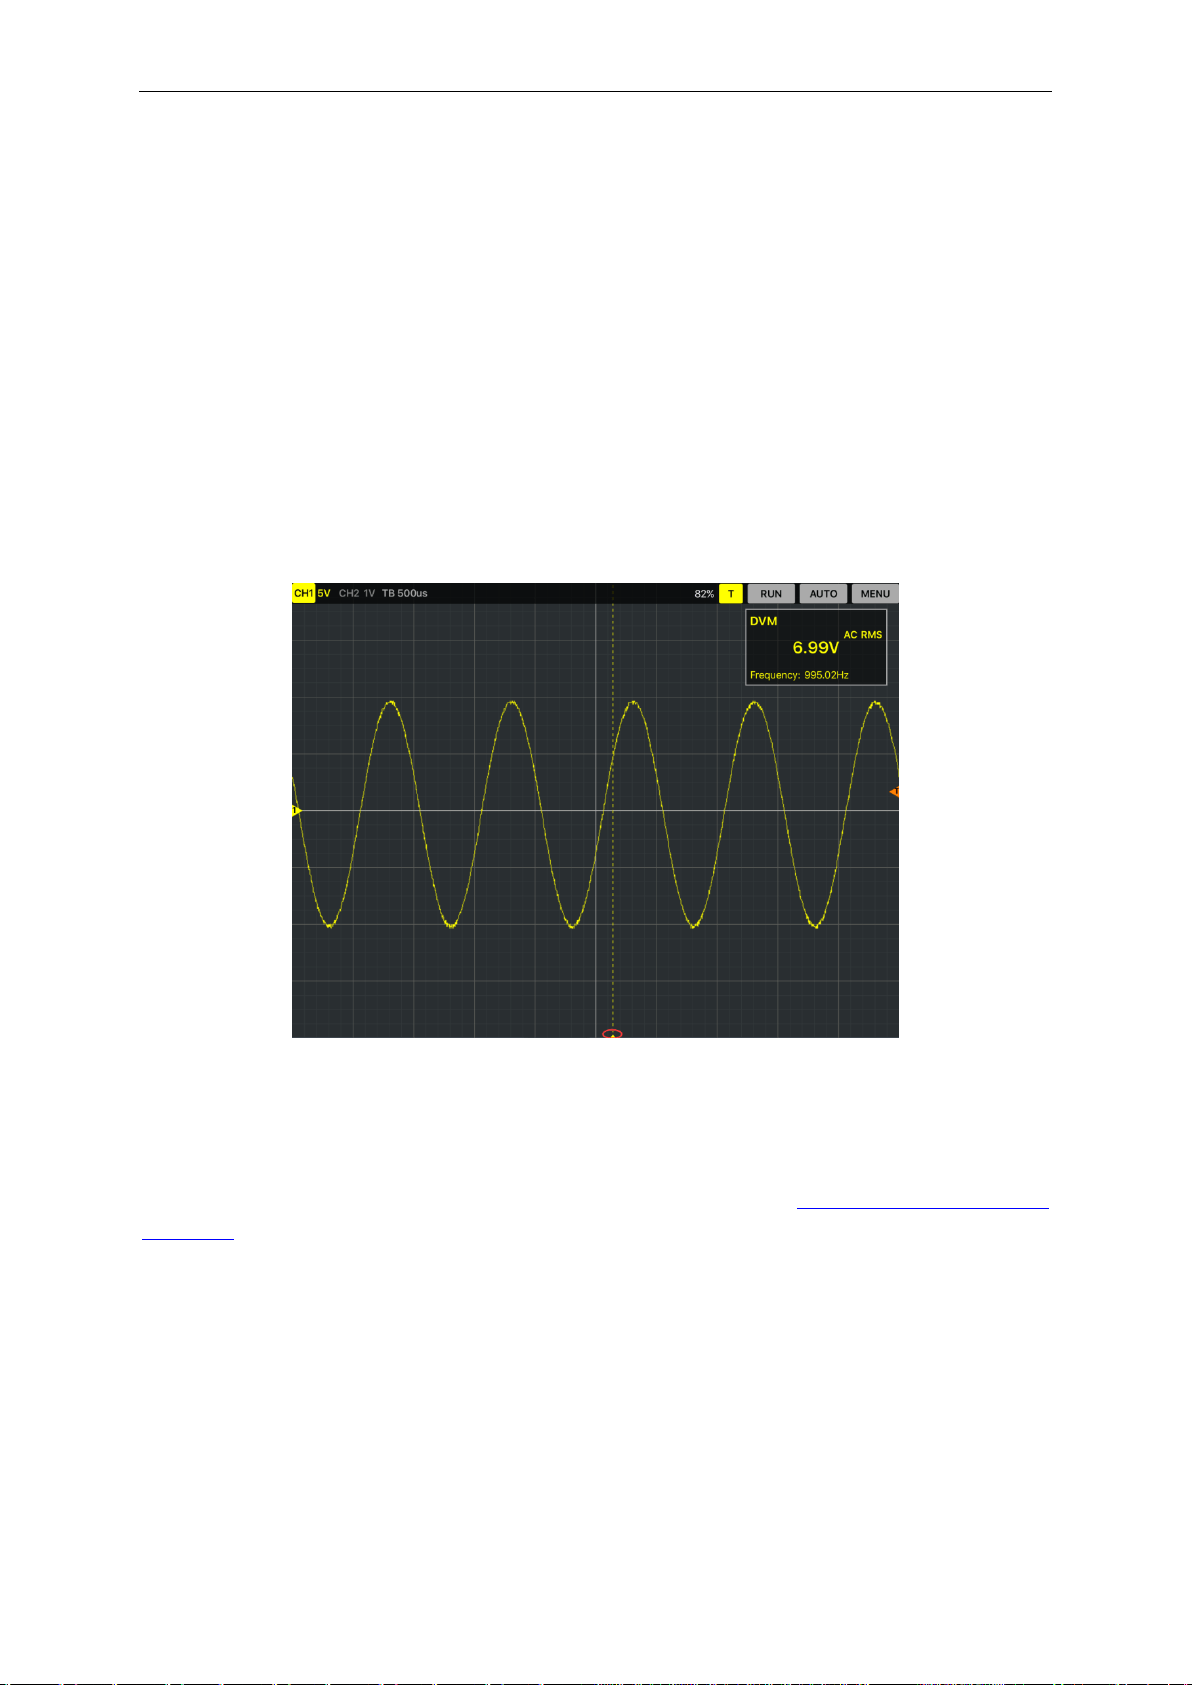
DVM
DVM: Display RMS and frequency of measured waveform of CH1 or CH2.

Appendix
User’s Manual 61
Slid the slider to enable the DVM function. You can see it on top right corner on the screen. Also
you can tap the DVM column and drag it to any location.
More information, please refer to Measure.
3.10 Acquire
3.10.1 Capture Mode
There are three capture modes Normal, Roll and Scan mode.
Please refer to Set Horizontal System Y-T Format.
3.10.2 Interpolation
Please refer to Interpolation.

Appendix
User’s Manual 63
1. Channel information and Volt/Div
2. Time/DIV: lead the setting of the time base parameters
Select the time setting for the beam to sweep one major division on the screen..
3. Trigger State
4. Function menu
RUN: Run the application. Tap RUN menu again to stop it.
5. AUTO
Automatically set the oscilloscope controls to generate a usable display of the input signals.
6. Menu
7. Trigger position
Tap the trigger level icon and move up or move down, the trigger level value will display
on the screen.
8. CH2 Zero level
The marker shows the reference points of the displayed waveforms of CH1.
A signal is triggerred.
A signal is not triggerred.
Appendix
User’s Manual 64
9. CH1 Zero level
The marker shows the reference points of the displayed waveforms of CH2.
10. CH1 waveform
Click on the waveform to select the channel. If the channel is select, you can see yellow
background of CH1 waveform or blue background of CH2 waveform.
4.2 Menu System
The Main Menu:
4.3 Connect IDSO with Android
When in the direct mode, Android device is connect with the IDSO device via Wi-Fi hotspot which
created by IDSO device. IDSO device works in this mode in default.
Time/Div
Volt/Div
Increase
Decrease
GESTURES FOR TABLET
Increase
Decrease
1. Channel: CH1, CH2 settings
2. Trigger: Set trigger system
3. Measure: Set measurement parameters
4. About: Software information
5. Exit: Exit the software.
Appendix
User’s Manual 65
1. Power on the IDSO.
Keep pressing power button until power indicator lights up.
2. The indication of communication USB/WI-FI is slow blinking. Hotspot, creates own wireless
local area network (WLAN).
3. Connect your Android device with Wi-Fi hotspot. Click “SettingWLAN” options, and then
select Network Name of the IDSO device. You can get Network Name from the label of IDSO’s
shell.
4. Connect the IDSO device to a signal source.
5. Tap the IDSO app to open it. Then click “RUN” button. The scope is ready to use.
If you can’t connect it successfully, please do as the followings:
1) Close the IDSO APP.
2) Long press the Easylink button until the “USB/WI-FI” LED is off, release the Easylink
button. IDSO device will reboot automatically. If the IDSO device doesn't reboot
automatically, reboot it manually.
3) After rebooted, the IDSO device will be in direct mode.
4.4 Set Vertical System
Click “Channel” in main menu.
Select Channel: User can select the channel CH1 and CH2.
Channel Setting:
ON/OFF: Tap CH1 or CH2 icon on the top left corner of the screen.
Volt/DIV: Use gestures to set volt/div.
Coupling: Select the channel coupling DC/AC/GND.
Move the waveform up and down
Drag Vertical Position icon to move waveform up and down on the screen.

Appendix
User’s Manual 66
4.5 Set Trigger System
Click “Setup-> Trigger” menu.
Trigger Setting: Please refer to set trigger system.
Trigger Level
Trigger Level icon: User can also drag the trigger icon on screen to adjust the trigger
level.
4.6 Measure Signal
Click “Measure” in main menu.
More information, please refer to Measure.


Appendix
User’s Manual 68
Appendix A: Specifications
Specifications Table:
Acquisition
Channels
2
Bandwidth
70 MHz analog bandwidth
Sample rate
250MSa/s(Single channel), 125MSa/s(Dual channel)
Mode
Normal, Peak Detect, Average(PC Software)
Input
Input Coupling
AC, DC,GND
Input Impedance
1MΩ, 25pF
Probe Attenuation Factors
1X, 10X, 100X, 1000X
Max. Input Voltage
35Vpk (DC + peak AC < 10 kHz, without external attenuation)
Horizontal
Scanning Speed
Range(Sec/div)
5ns/div ~ 500s/div(1-2-5 sequence)
Delay Time Accuracy
±50ppm(any interval ≥1ms)
Waveform Interpolation
Step, Linear, Sin(x)/x
Memory Depth
Max. 6K
Vertical
Vertical resolution
8 bits/channel
Gain range
10mV ~5V/div @ x1 probe(1,2,5 sequence)
100mV ~ 50V/div @ x10 probe
1V ~ 500V/div @ x100 probe
10V ~ 5KV/div @ x1000 probe
Position Range
±4 division
BandWidth
20MHz
Lower Frequency
Response(-3dB)
≤10Hz(at input BNC)
Rise Time at BNC
≤5ns
DC accuracy
±3%
Math
Addition, Subtraction, Multiplication, Division
FFT
Rectangular, Hanning, Hamming, Blackman Window
Trigger
Trigger Type
Edge trigger
Trigger Mode
Auto, Normal and Single
Source
CH1, CH2, EXT

Appendix
User’s Manual 69
Sensitivity
0.02 div increments
Trigger level
±4 divisions
Measurement
Cursor
Amplitude difference between cursors (ΔV)
Time difference between cursors (Δt)
Reciprocal of Δt in Hertz (1/ Δt)
(Cross, Trace, Horizontal, Vertical)
Auto
Measure
Voltage
Measurement
Vp-p, Vmax, Vmin, Vmean, Vamp, Vtop, Vbase, Vmid, Vrms,
Vcrms,Preshoot, Overshoot
Time
Measurement
Frequency, Period, Rise Time(10%~90%), Fall
Time(10%~90%), Positive Width, Negative Width, Duty Cycle

Appendix
User’s Manual 70
Appendix B: General Maintenance
General Care
Do not store or leave the oscilloscope where the device will be exposed to direct sunlight for long
periods of time.
Caution
To avoid damages to the device or probes, do not expose them to sprays, liquids or solvents.
To avoid damages to the surface of the device or probes not use any abrasive or chemical
cleaning agents.
Cleaning
In order to keep the instrument clean ,you need to check often whether the channels are dusty
or not .Please clean the instrument surface and the channel connecting point as per the
following cautions(Make sure the device disconnect form all power sources):
1. Remove loose dust on the outside of the oscilloscope and probes with a lint-free cloth.
2. Use a soft cloth dampened with water to clean the device.
Appendix C: Accessories
All the accessories listed below are standard accessories for the oscilloscope:
Probe×2 (1.5m), 1:1, (10:1) Passive Probes
A USB Cable
A Power Adapter
A CD