Loading ...
Loading ...
Loading ...
Title Color Gauges and Running Dynamics Data (with pod)
Identifier GUID-EE9E7F6F-49BE-4452-82E6-B40371D0AEC1
Language EN-US
Description
Version 4
Revision 4
Changes Conditioned statement for black and white screen
Status Released
Last Modified 20/01/2022 18:00:17
Author tillmonmartha
Color Gauges and Running Dynamics Data
In the Garmin Connect activity, the running dynamics data displays as colored graphs. The color zones are
based on percentiles and show you how your running dynamics data compare to those of other runners.
Garmin has researched many runners of all different levels. The data values in the red or orange zones are
typical for less experienced or slower runners. The data values in the green, blue, or purple zones are typical for
more experienced or faster runners. More experienced runners tend to exhibit shorter ground contact times,
lower vertical oscillation, lower vertical ratio, and higher cadence than less experienced runners. However, taller
runners typically have slightly slower cadences, longer strides, and slightly higher vertical oscillation. Vertical
ratio is your vertical oscillation divided by stride length. It is not correlated with height.
Go to garmin.com/runningdynamics for more information on running dynamics. For additional theories and
interpretations of running dynamics data, you can search reputable running publications and websites.
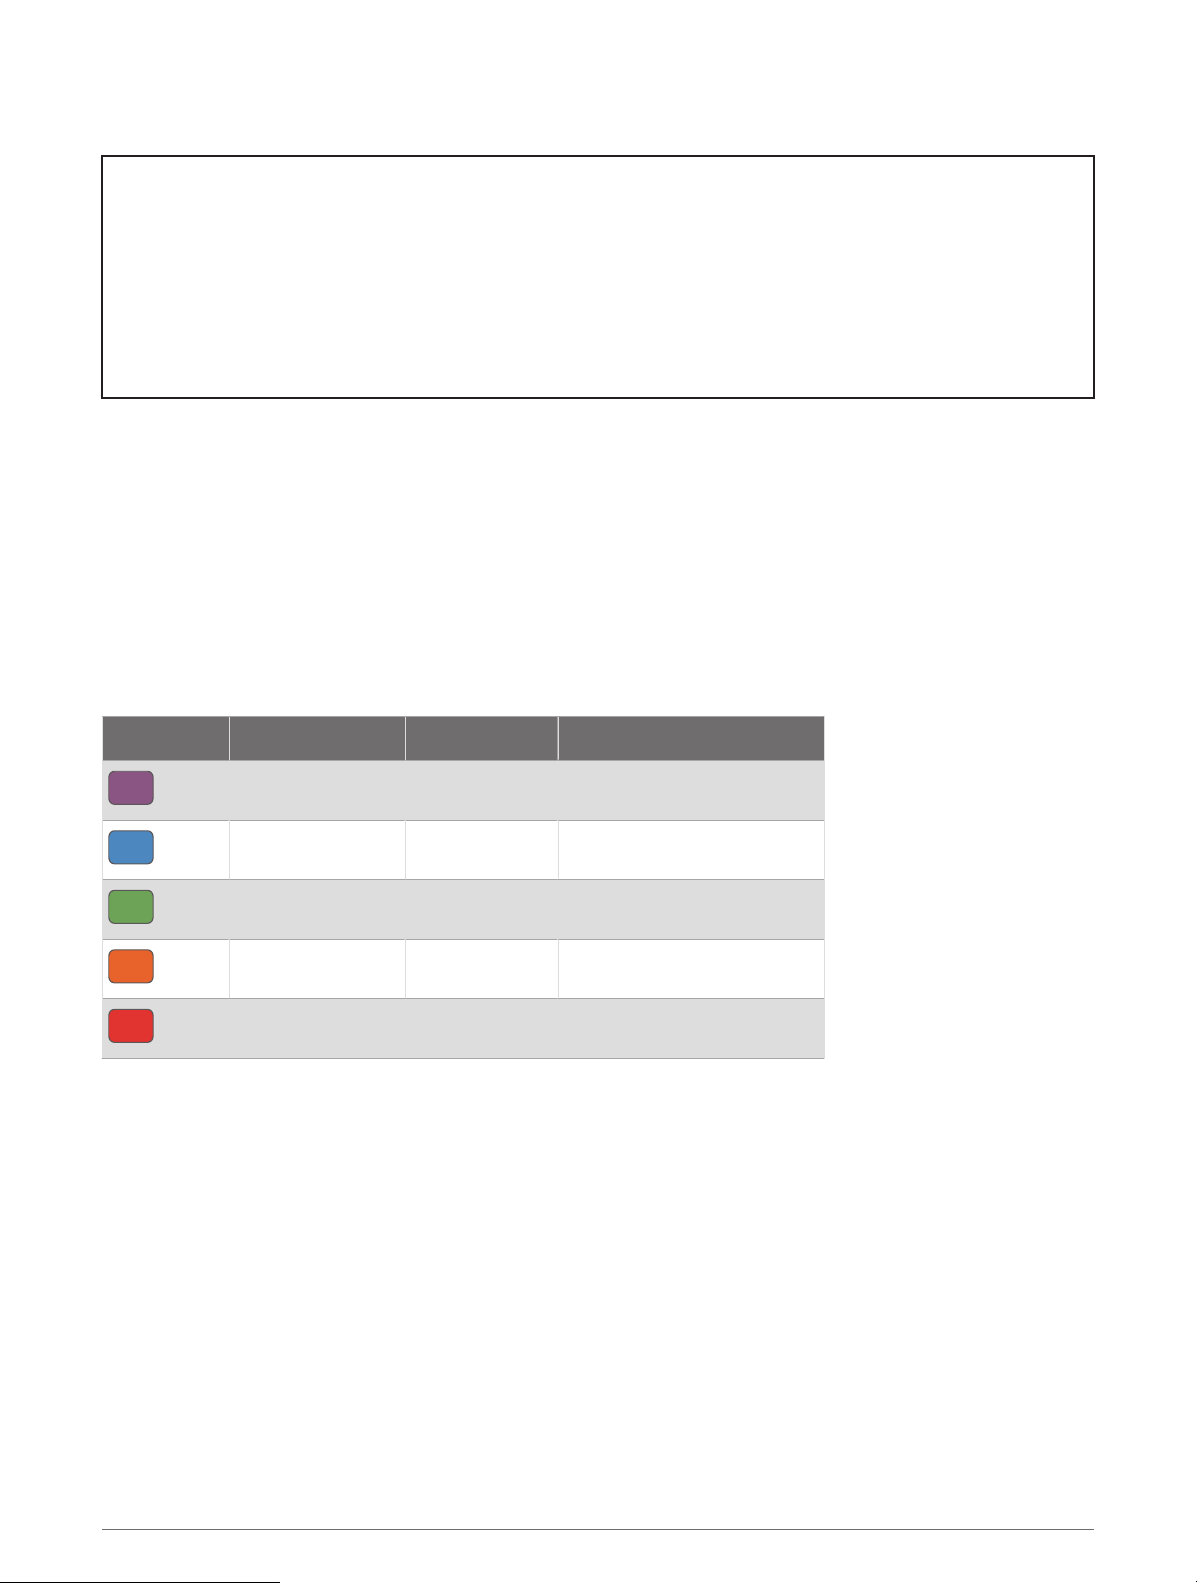
Color Zone Percentile in Zone Cadence Range Ground Contact Time Range
Purple
>95 >183 spm <218 ms
Blue
70–95 174–183 spm 218–248 ms
Green
30–69 164–173 spm 249–277 ms
Orange
5–29 153–163 spm 278–308 ms
Red
<5 <153 spm >308 ms
204 Appendix
Loading ...
Loading ...
Loading ...