Loading ...
Loading ...
Loading ...
2
Select an option:
• To receive or ignore Emergency Position Indicating Radio
Beacon (EPRIB) test signals, select AIS-EPIRB Test.
• To receive or ignore Man Overboard (MOB) test signals,
select AIS-MOB Test.
• To receive or ignore Search and Rescue Transponder
(SART) test signals, select AIS-SART Test.
Turning Off AIS Reception
AIS signal reception is turned on by default.
Select Settings > Other Vessels > AIS > Off.
All AIS functionality on all charts and 3D chart views is
disabled. This includes AIS vessel targeting and tracking,
collision alarms that result from AIS vessel targeting and
tracking, and the display of information about AIS vessels.
Chart Menu
NOTE: Not all settings apply to all chart views. Some options
require premium maps or connected accessories.
NOTE: The menus may contain some settings that are not
supported by your installed charts or your present location. If
you make changes to those settings, the changes will not impact
the chart view.
These settings apply to the chart views, except Fish Eye 3D
(Fish Eye 3D Settings, page 10).
From a chart, select MENU.
Layers: Adjusts the appearance of the different items on the
charts (Chart Layers, page 9).
Waypoints & Tracks: Adjusts how waypoints and tracks are
shown (User Data Layer Settings, page 10).
Quickdraw Contours: Turns on bottom contour drawing, and
allows you to create fishing map labels (Garmin Quickdraw
Contours Mapping, page 10).
Chart Setup: Adjusts the orientation and level of detail shown
on the chart and adjusts the data shown on the screen.
Edit Overlays: Adjusts the data shown on the screen
(Customizing the Data Overlays, page 3).
Chart Layers
You can turn on and off chart layers and customize features of
the charts. Each setting is specific to the chart or chart view
being used.
NOTE: Not all settings apply to all charts and chartplotter
models. Some options require premium maps or connected
accessories.
NOTE: The menus may contain some settings that are not
supported by your installed charts or your present location. If
you make changes to those settings, the changes will not impact
the chart view.
From a chart, select MENU > Layers.
Chart: Shows and hides chart-related items (Chart Layer
Settings, page 9).
My Vessel: Shows and hides items relating to the boat (My
Vessel Layer Settings, page 9).
User Data: Shows and hides user data, such as waypoints,
boundaries, and tracks, and opens user data lists (User Data
Layer Settings, page 10).
Other Vessels: Adjusts how other vessels are shown (Other
Vessels Layer Settings, page 10).
Water: Shows and hides depth items (
Water Layer Settings,
page 10).
Quickdraw Contours: Shows and hides Garmin Quickdraw
Contours data (Garmin Quickdraw Contours Settings,
page 12).
Chart Layer Settings
From a chart, select MENU > Layers > Chart.
Satellite Photos: Shows high-resolution satellite images on the
land or on both land and sea portions of the Navigation chart,
when certain premium maps are used (Showing Satellite
Imagery on the Navigation Chart, page 7).
NOTE: This setting must be enabled to view Standard
Mapping charts.
Tides & Currents: Shows current station indicators and tide
station indicators on the chart and enables the tides and
current slider, which sets the time for which tides and
currents are reported on the map.
Land POIs: Shows points of interest on land.
Navaid: Shows navigational aids, such as ATONs and flashing
lights, on the chart. Allows you to select NOAA or IALA
navaid type.
Service Points: Shows locations for marine services.
Depth: Adjusts the items on the depth layer (Water Layer
Settings, page 10).
Restricted Areas: Shows information about restricted areas on
the chart.
Photo Points: Shows camera icons for aerial photos (Viewing
Aerial Photos of Landmarks, page 7).
My Vessel Layer Settings
From a chart, select MENU > Layers > My Vessel.
Heading Line: Shows and adjusts the heading line, which is a
line drawn on the map from the bow of the boat in the
direction of travel (Setting the Heading Line and Angle
Markers, page 6).
Laylines: Adjusts the laylines, when in sailing mode (Laylines
Settings, page 9).
Roses: Allows you to display roses on the chart. Wind roses
show a visual representation of the wind angle or direction
provided by the connected wind sensor. The compass rose
indicates the compass direction oriented to the heading of the
boat.
Vessel Icon: Sets the icon that represents your present location
on the chart.
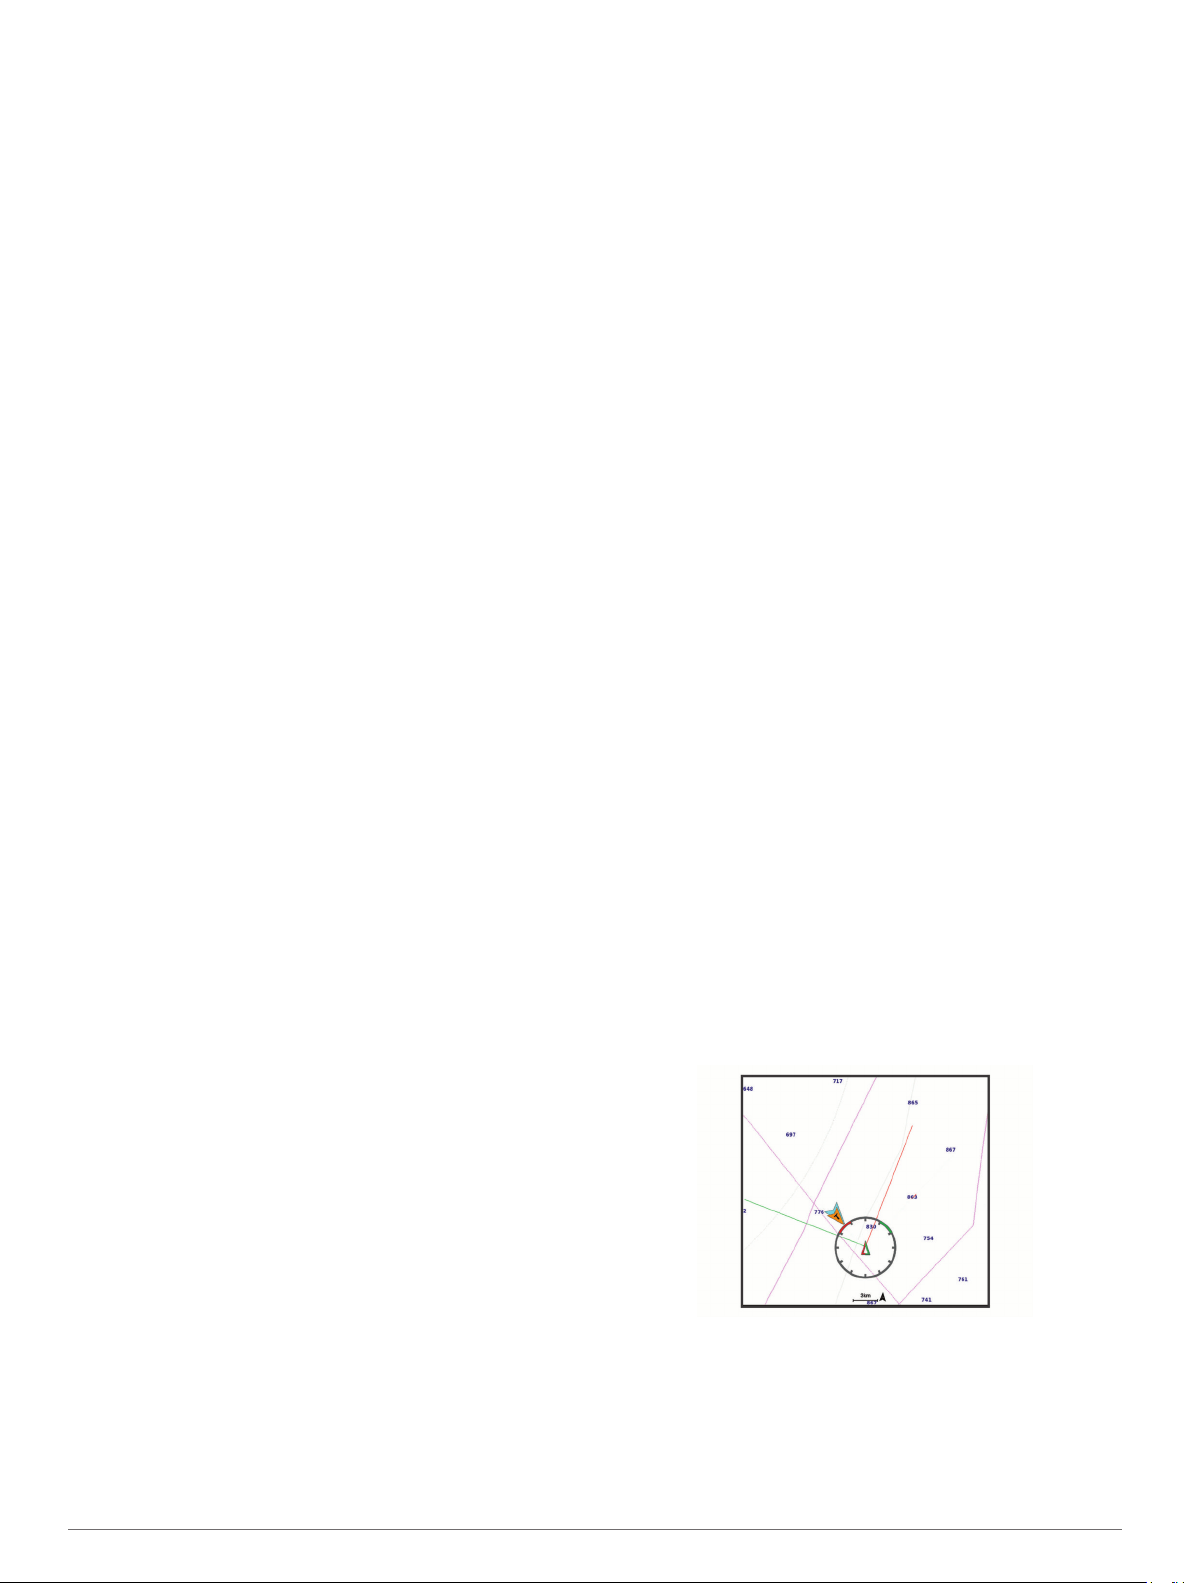
Laylines Settings
To use the laylines features, you must connect a wind sensor to
the chartplotter.
When in sailing mode (Setting the Vessel Type, page 3), you
can display laylines on the navigation chart. Laylines can be
very helpful when racing.
From the navigation chart, select MENU > Layers > My Vessel
> Laylines > Setup.
Display: Sets how the laylines and vessel appear on the chart,
and sets the length of the laylines.
Sailing Angle: Allows you to select how the device calculates
laylines. The Actual option calculates the laylines using the
measured wind angle from the wind sensor. The Manual
Charts and 3D Chart Views 9
Loading ...
Loading ...
Loading ...