Loading ...
Loading ...
Loading ...
Black plate (176,1)
北米Model "A8190BE-C" EDITED: 2013/ 8/ 6
3-42
Instruments and controls/Multi function display
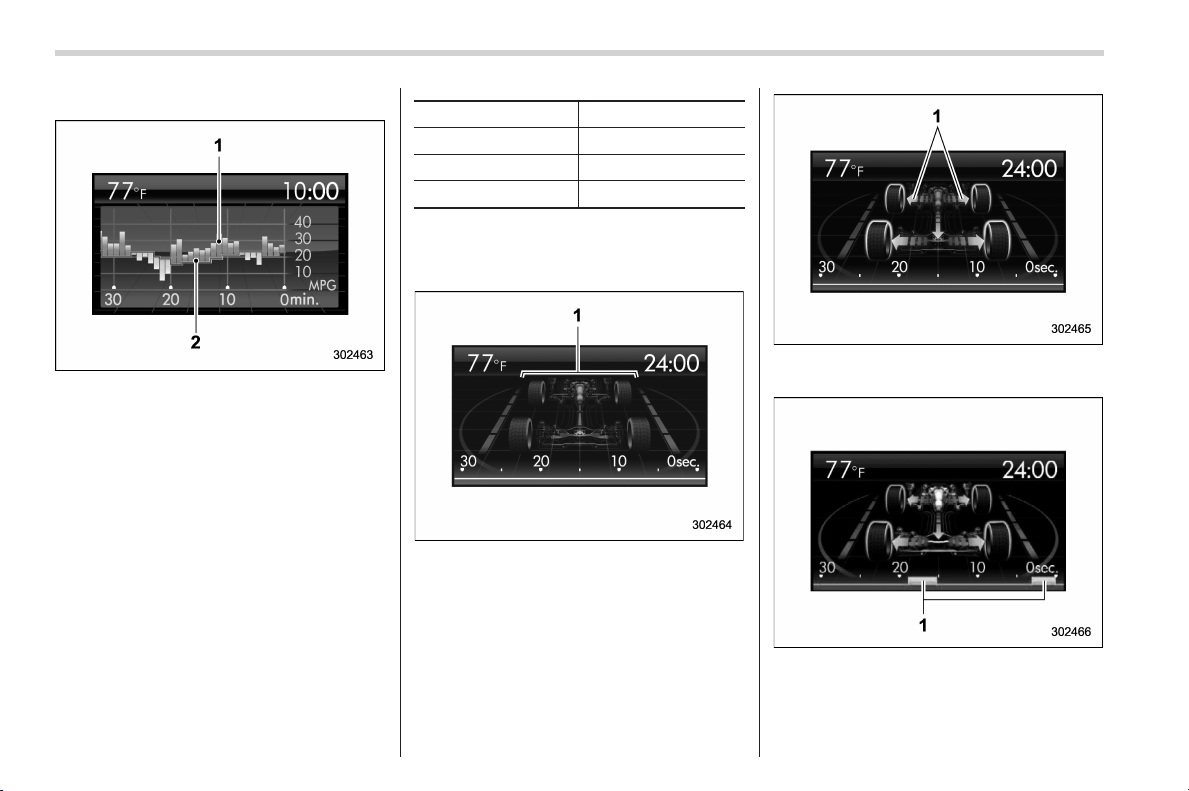
! ECO history screen
1) Average fuel consumption per unit time
(bar graph)
2) Average fuel consumption corresponding
to the driving distance of each trip meter
(red line)
This screen displays the fuel economy
history for the vehicle using a bar graph.
The horizontal scale represents the past
time range and the vertical scale repre-
sents the fuel consumption. The green
bars show driving with good fuel economy
and the yellow bars show driving with poor
fuel economy.
The time range of the history can be set.
The width of the bar graph is adjusted as
follows depending on the set time range.
Time range Width of bar graph
30 minutes 1 minute
60 minutes 2 minutes
120 minutes
4 minutes
For details about the setting, refer to
“Economy history setting” F3-61.
! Vehicle activation status screen
When the vehicle stops
1) Steering axle
When the vehicle is being driven regularly
1) Power train (illuminated in blue)
When the Vehicle Dynamics Control sys-
tem is being activated: the tires illuminate
in yellow.
1) History of Vehicle Dynamics Control
system activation
Loading ...
Loading ...
Loading ...