
Loading ...
Loading ...
Loading ...
----------------------------------------------- 9 -----------------------------------------------
RTA Real Time Analyzer
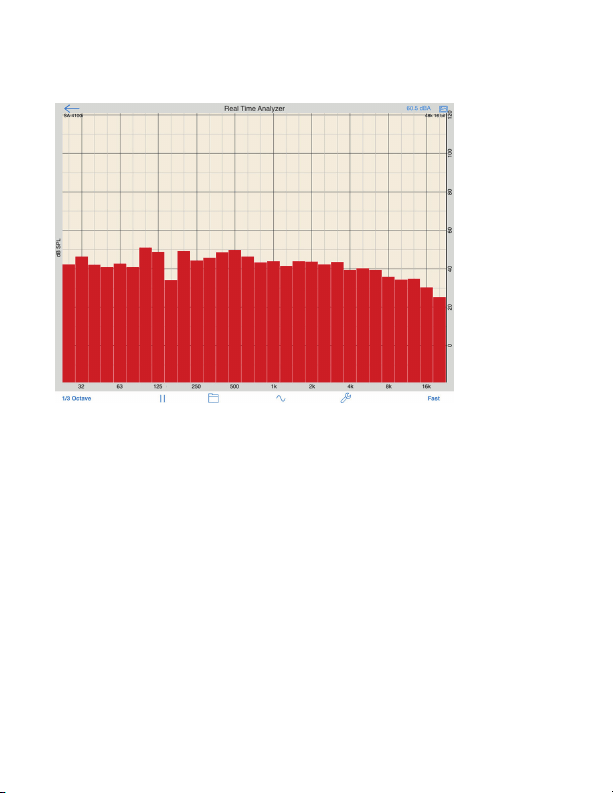
Typical RTA Page
This graph shows the Sound Pressure Level measured by the micro-
phone across the audio frequency band from 20 Hz to 20 kHz. In this
example, the measured response starts to decrease at the higher
frequencies.
Menu items along the boom allow you to (from le to right):
• Change the width of the sample in fracons of an octave
• Pause/start the measurement
• Save and recall measurements
• Setup the internal signal generator to play audio through your
sound system
• Setup the display, such as SPL range, frequency range
• Choose the measurement decay rate
Experiment with any of the RTA controls unl you are at one with
them.
Loading ...
Loading ...
Loading ...