
®
FlukeView
®
ScopeMeter
®
Software
Users Manual
September 2001
© 1996, 2001 Fluke Corporation. All rights reserved.
All product names are trademarks of their respective companies.
1.888.610.7664 sales@GlobalTestSupply.com
Fluke-Direct
.com

i
Table of Contents
Chapter Title Page
Installing FlukeView ......................................................1
Installing the FlukeView Software..................................... 1
Running the FlukeView Software...................................... 2
Connecting the ScopeMeter Test Tool............................... 3
Using FlukeView............................................................4
Using Online Help.............................................................. 4
Introducing the FlukeView Software ................................. 6
Instrument Screens......................................................... 7
Waveforms ..................................................................... 8
Readings......................................................................... 9
Instrument Setups........................................................... 10
Creating a Test Report........................................................ 11
Documenting Screens......................................................... 13
Displaying an Instrument Screen on the PC................... 13
Replaying Screens.......................................................... 15
Inserting Screens into a Document................................. 17
Analyzing Waveforms........................................................ 18
Displaying Waveforms on the PC.................................. 18
Zooming In and Out on a Waveform ............................. 21
Scaling a Waveform....................................................... 21
Replaying Waveforms.................................................... 22
Generating an FFT-Spectrum from a Waveform........... 24
Automatic Spectrum Updates......................................... 26
Logging Readings............................................................... 28
Graphing Readings......................................................... 28
Inserting Readings into a Spreadsheet ........................... 31
Transferring Instrument Setups.......................................... 32
Reading/Saving Setups from/to File .............................. 32
Saving/Recalling the Active Setup to/from ScopeMeter33
Printing Windows............................................................... 34
Saving Windows to a File................................................... 36
Optically Isolated RS-232 Interface (optional).............37
Interface Connections......................................................... 37
Interface Specifications...................................................... 38
Interface Cable.................................................................... 39
Warranty............................................................................. 40
Index...............................................................................41
1.888.610.7664 sales@GlobalTestSupply.com
Fluke-Direct
.com

SW90W Users Manual
1
Chapter 1
Installing FlukeView
Installing the FlukeView Software
FlukeView
®
software offers you simple mouse-controlled tools to
work with your ScopeMeter
®
test tool.
The setup program installs the FlukeView software on PC’s
running Windows 95, 98, ME (Millennium Edition), NT 4, 2000,
and XP.
To install FlukeView, insert the CD ROM into the CD ROM drive,
or insert the first floppy in the appropriate floppy disk drive and
run SETUP.
The setup program starts up and prompts you for information to
complete the installation.
1.888.610.7664 sales@GlobalTestSupply.com
Fluke-Direct
.com

SW90W Users Manual
2
Running the FlukeView Software
Choose from Start - Programs - FlukeView -
ScopeMeter 4.0 English to run the
FlukeView software.
Choose from Start - Programs - FlukeView -
ScopeMeter 4.0 English to create a test
report in Word.
Note
To use the QREPORT template, copy the file
QREPORT.DOT to your Word template directory (or
folder).
1.888.610.7664 sales@GlobalTestSupply.com
Fluke-Direct
.com
SW90W Users Manual
3
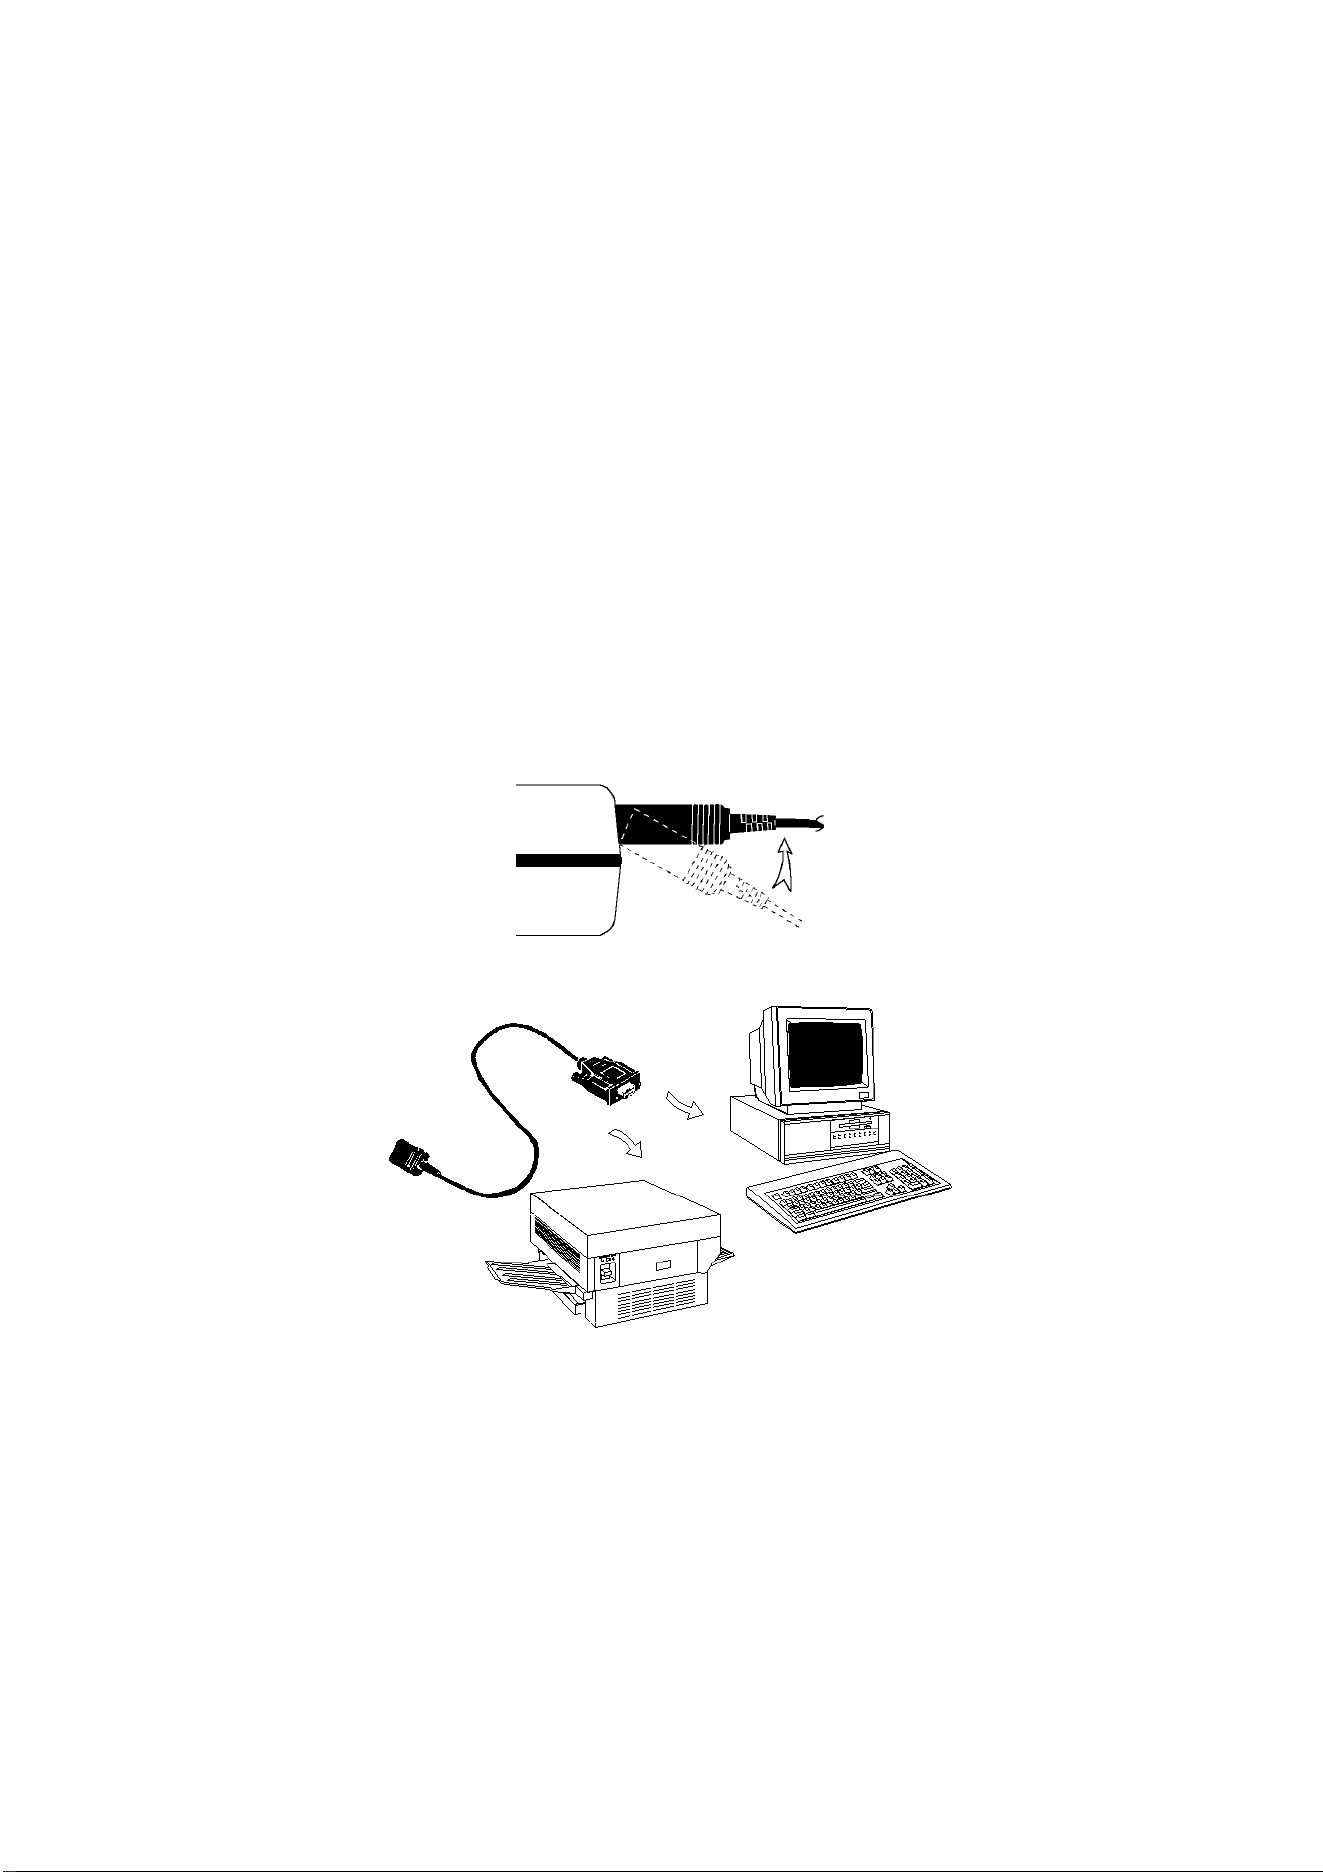
Connecting the ScopeMeter Test Tool
The FlukeView software communicates with your ScopeMeter
test tool via the optically isolated RS-232 adapter/cable (see
Appendix) connected to a COM port of the PC.
During startup (except for the first time), the FlukeView software
automatically tries to make a connection with the instrument
according to the last valid connection.
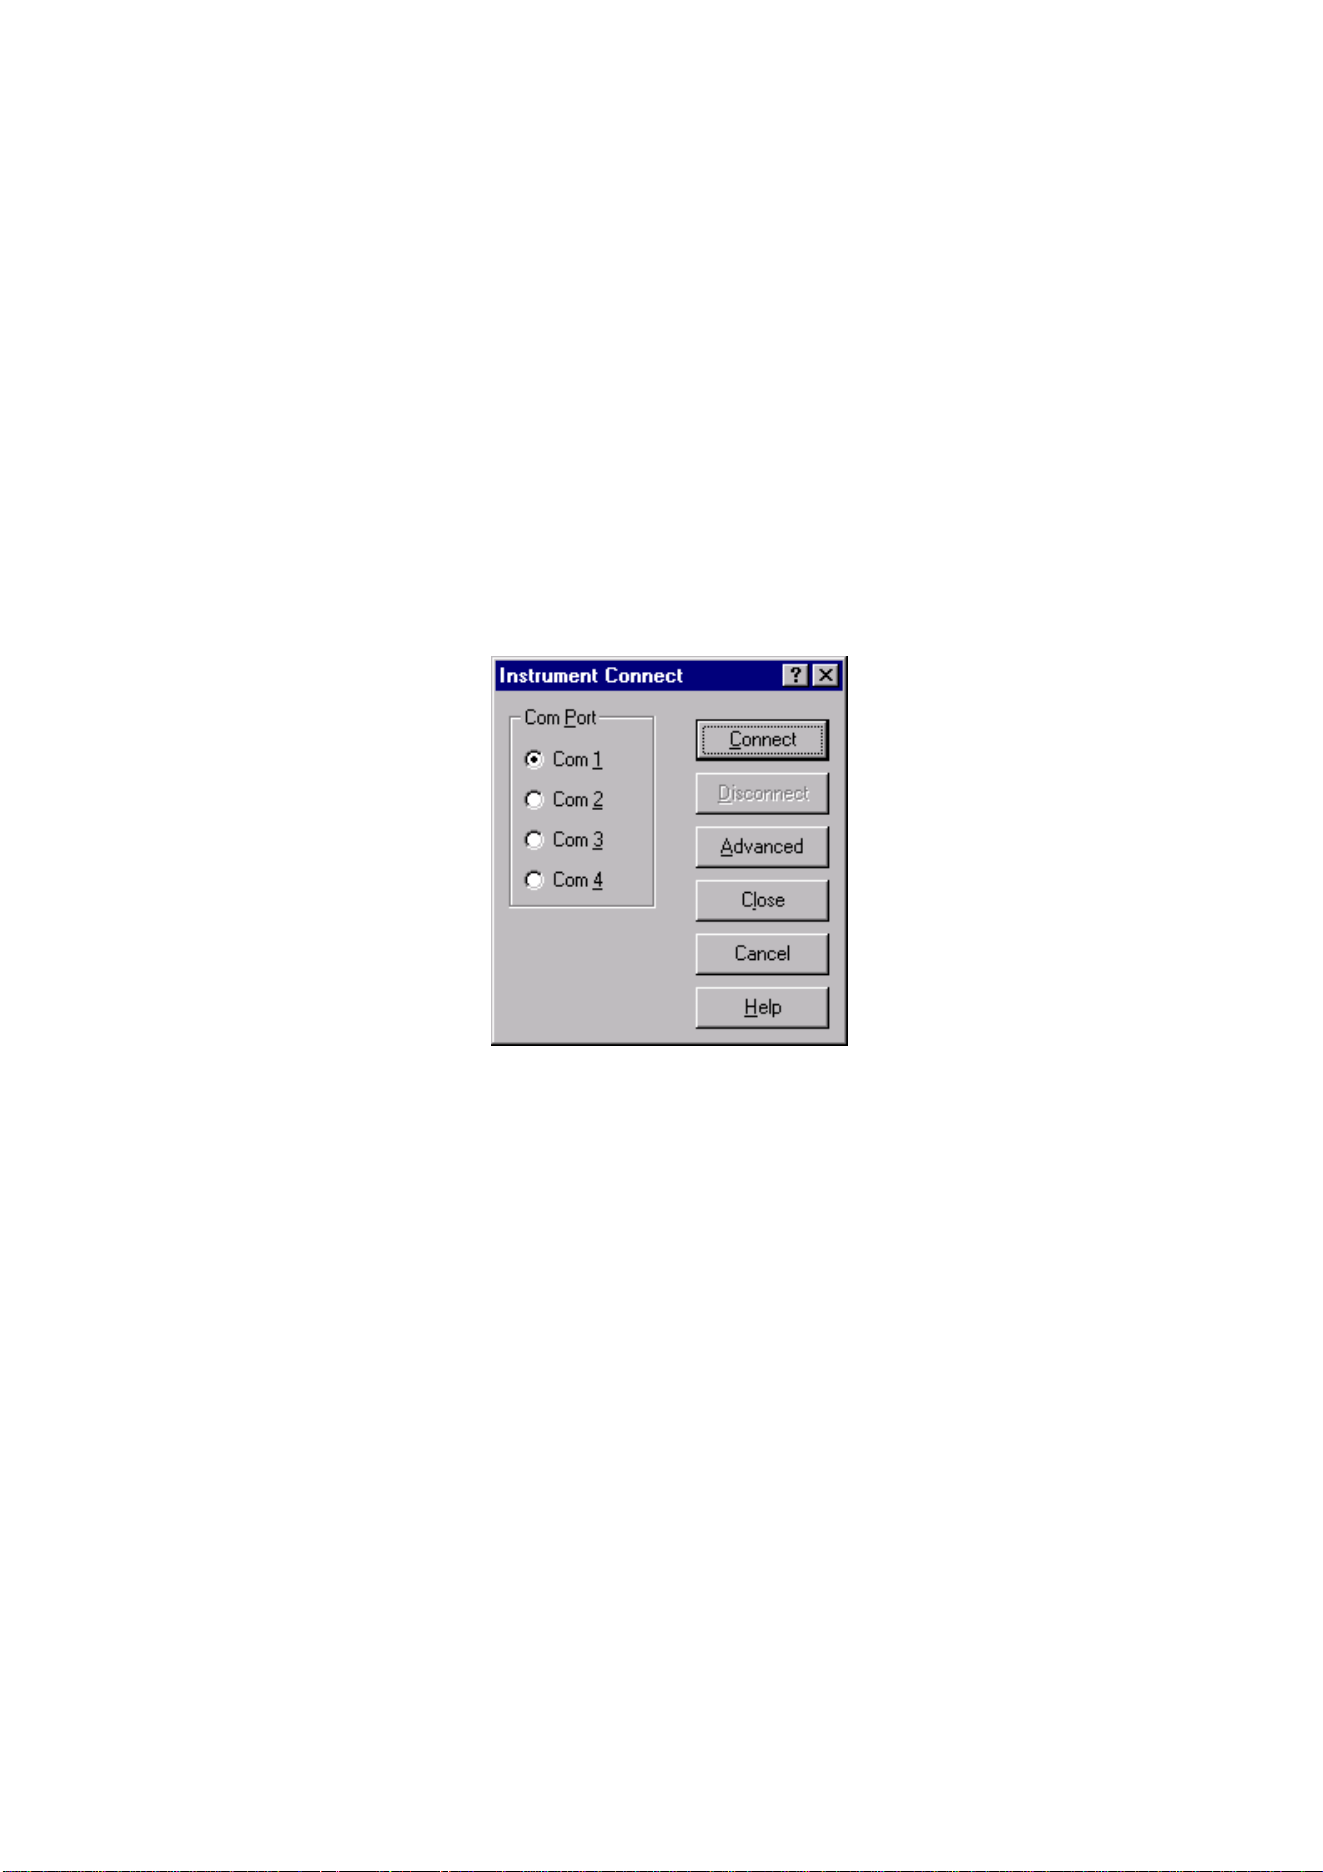
If automatic connection is not successful, the dialog box shown
below appears, allowing you to make a connection.
1 Select the Com Port that connects the instrument to the
PC.
2 Click Connect to establish a connection with the
instrument.
1.888.610.7664 sales@GlobalTestSupply.com
Fluke-Direct
.com
SW90W Users Manual
4
Chapter 2
Using FlukeView
Using Online Help
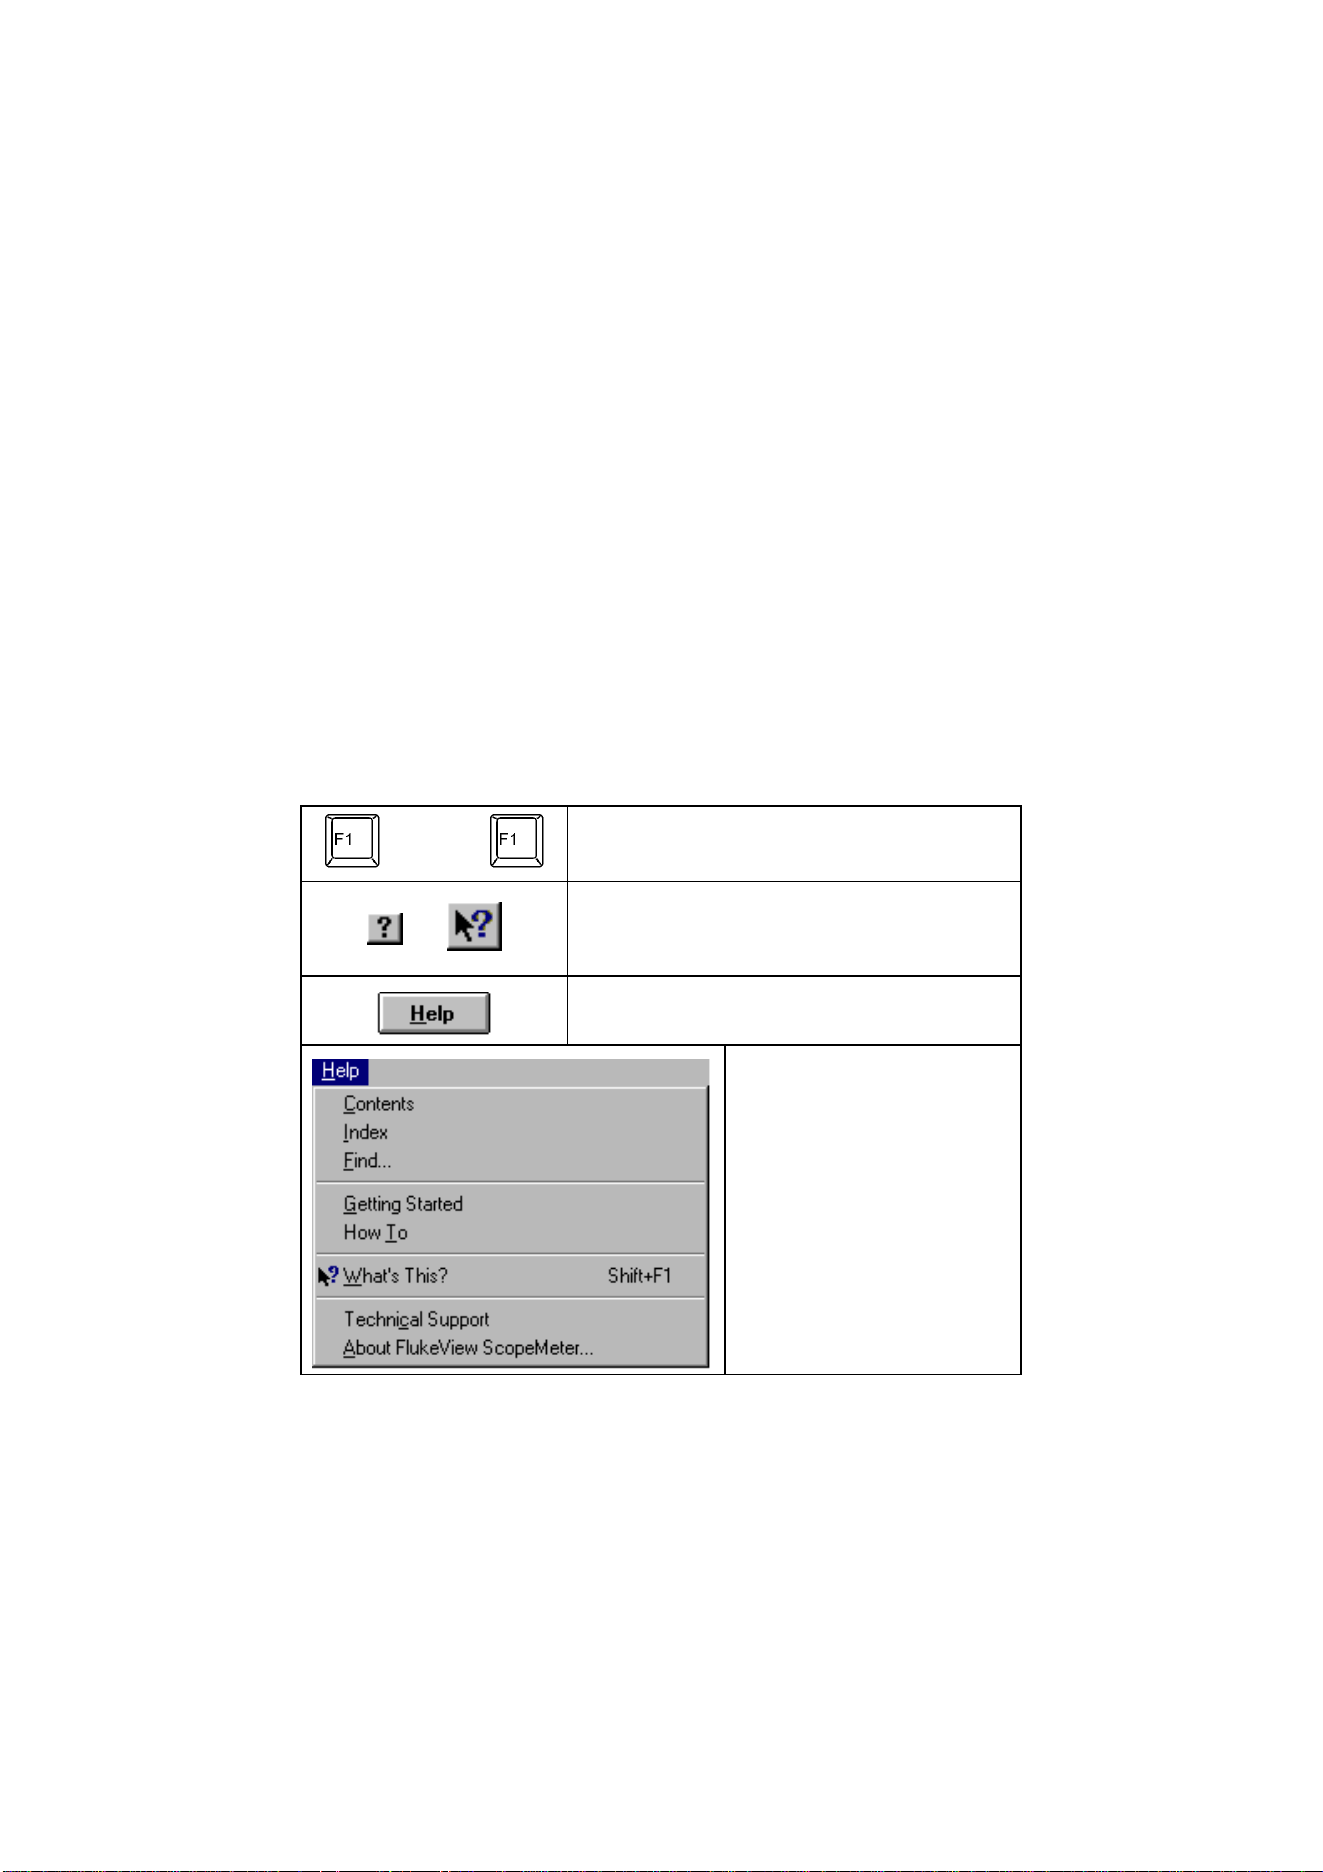
The FlukeView software offers you access to online help by
using the F1 key, a Help button, “What’s This?” help, or the
Help menu:
or Shift+
Press to get online help for the topic
that has the focus.
or
Click, move the mouse pointer on a
topic, and click again to get “What’s
This” help.
Click to get help in dialog and error
boxes.
For example:
Click Help - How To and
view the online manual
on the screen.
Click Help - Technical
Support to get access
to the Fluke home page.
1.888.610.7664 sales@GlobalTestSupply.com
Fluke-Direct
.com

SW90W Users Manual
5
Note
To show help items on a help page, do one of the
following:
• move the mouse pointer (changes to above a help
item);
• press Tab (changes the of a help item).
1.888.610.7664 sales@GlobalTestSupply.com
Fluke-Direct
.com
SW90W Users Manual
6
Introducing the FlukeView Software
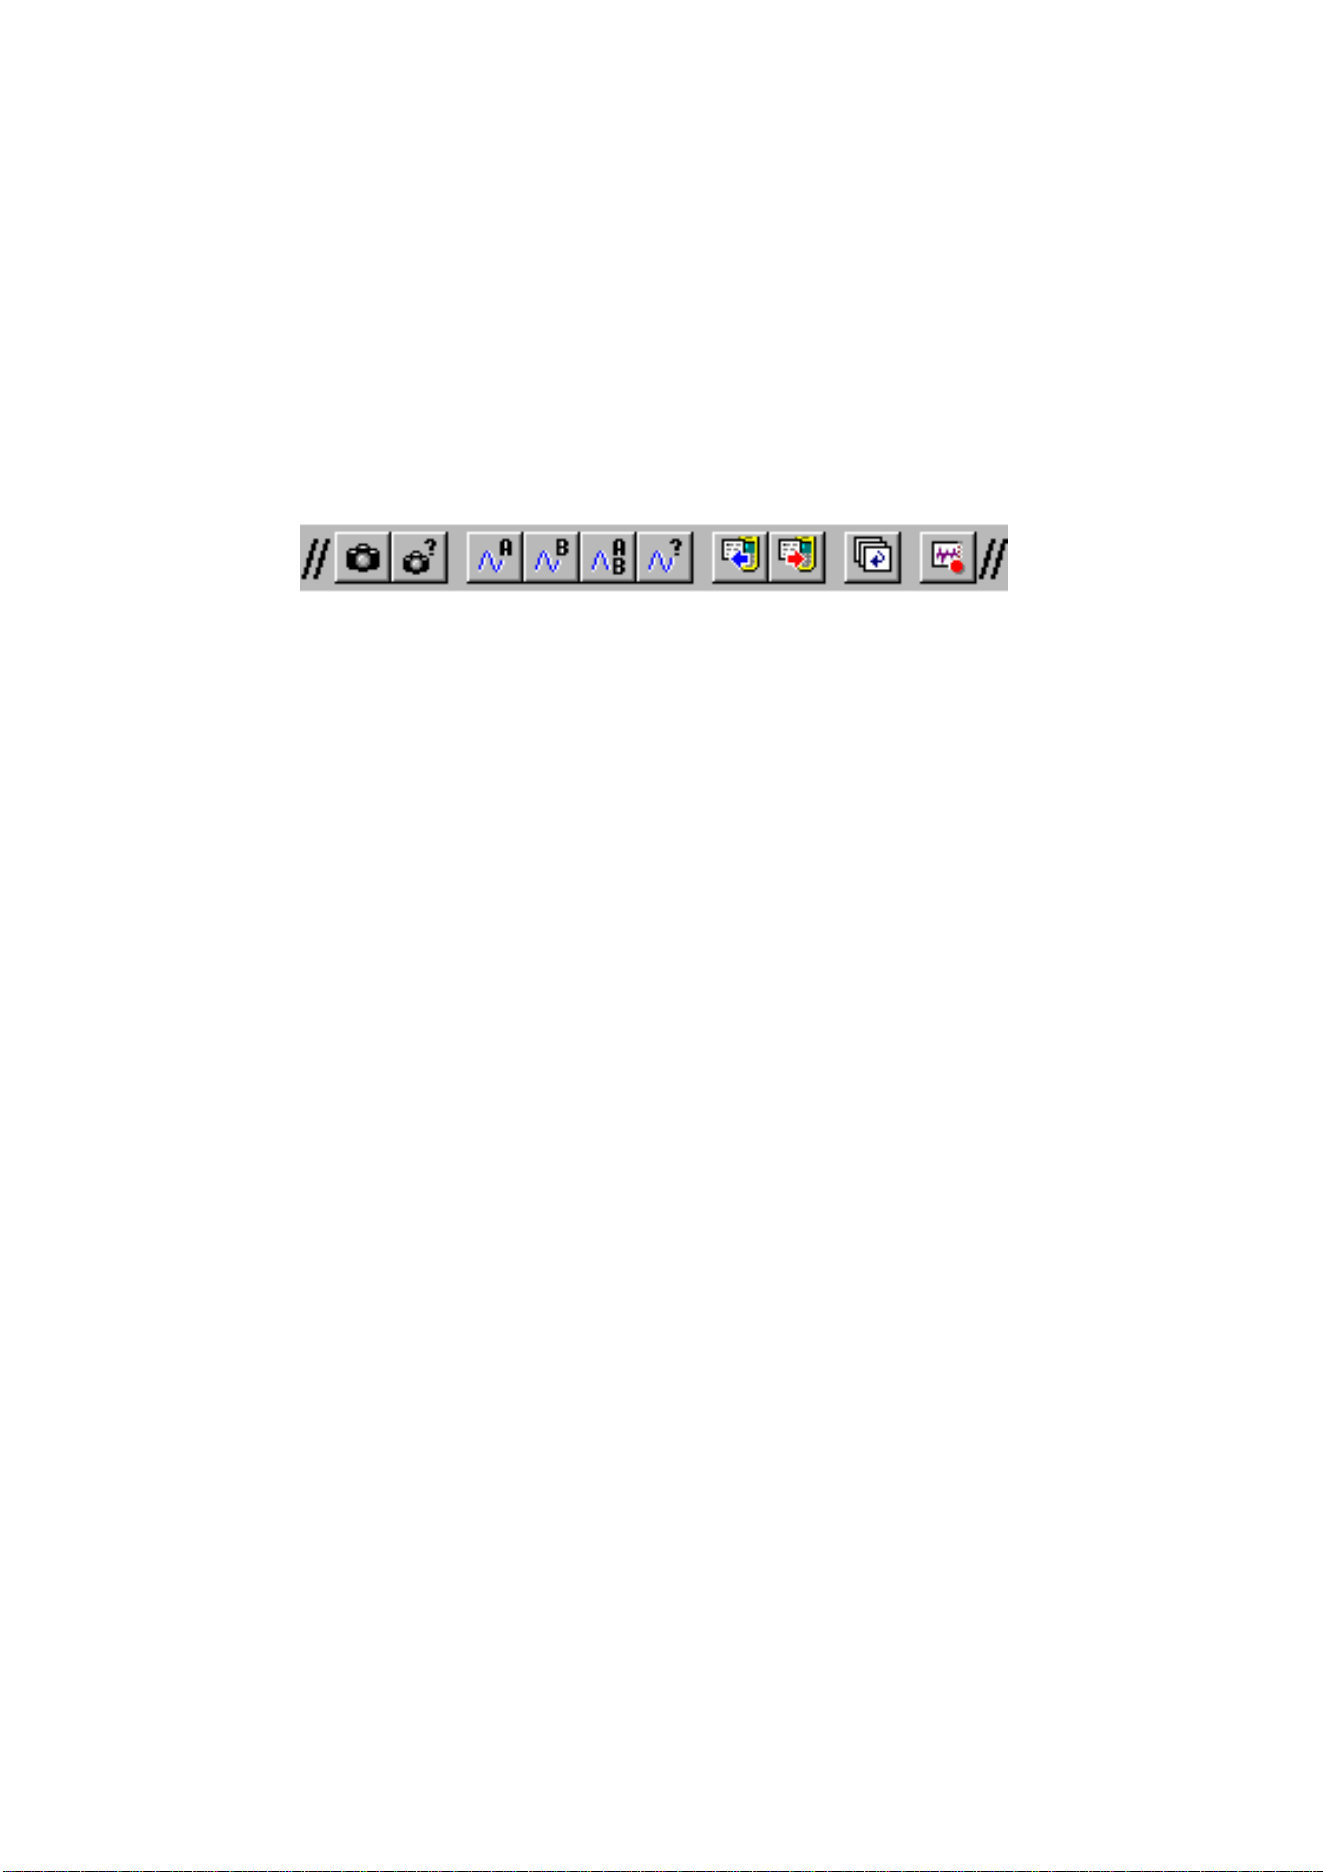
By clicking the following buttons on the toolbar, you can read
data directly from the ScopeMeter test tool:
You can save, open, and print the data, or export it to other
programs.
FlukeView software enables you to read the following types of
data from the ScopeMeter test tool into a window on the PC
screen.
screens
waveforms
setu
p
s readin
g
s
re
p
la
y
1.888.610.7664 sales@GlobalTestSupply.com
Fluke-Direct
.com
SW90W Users Manual
7
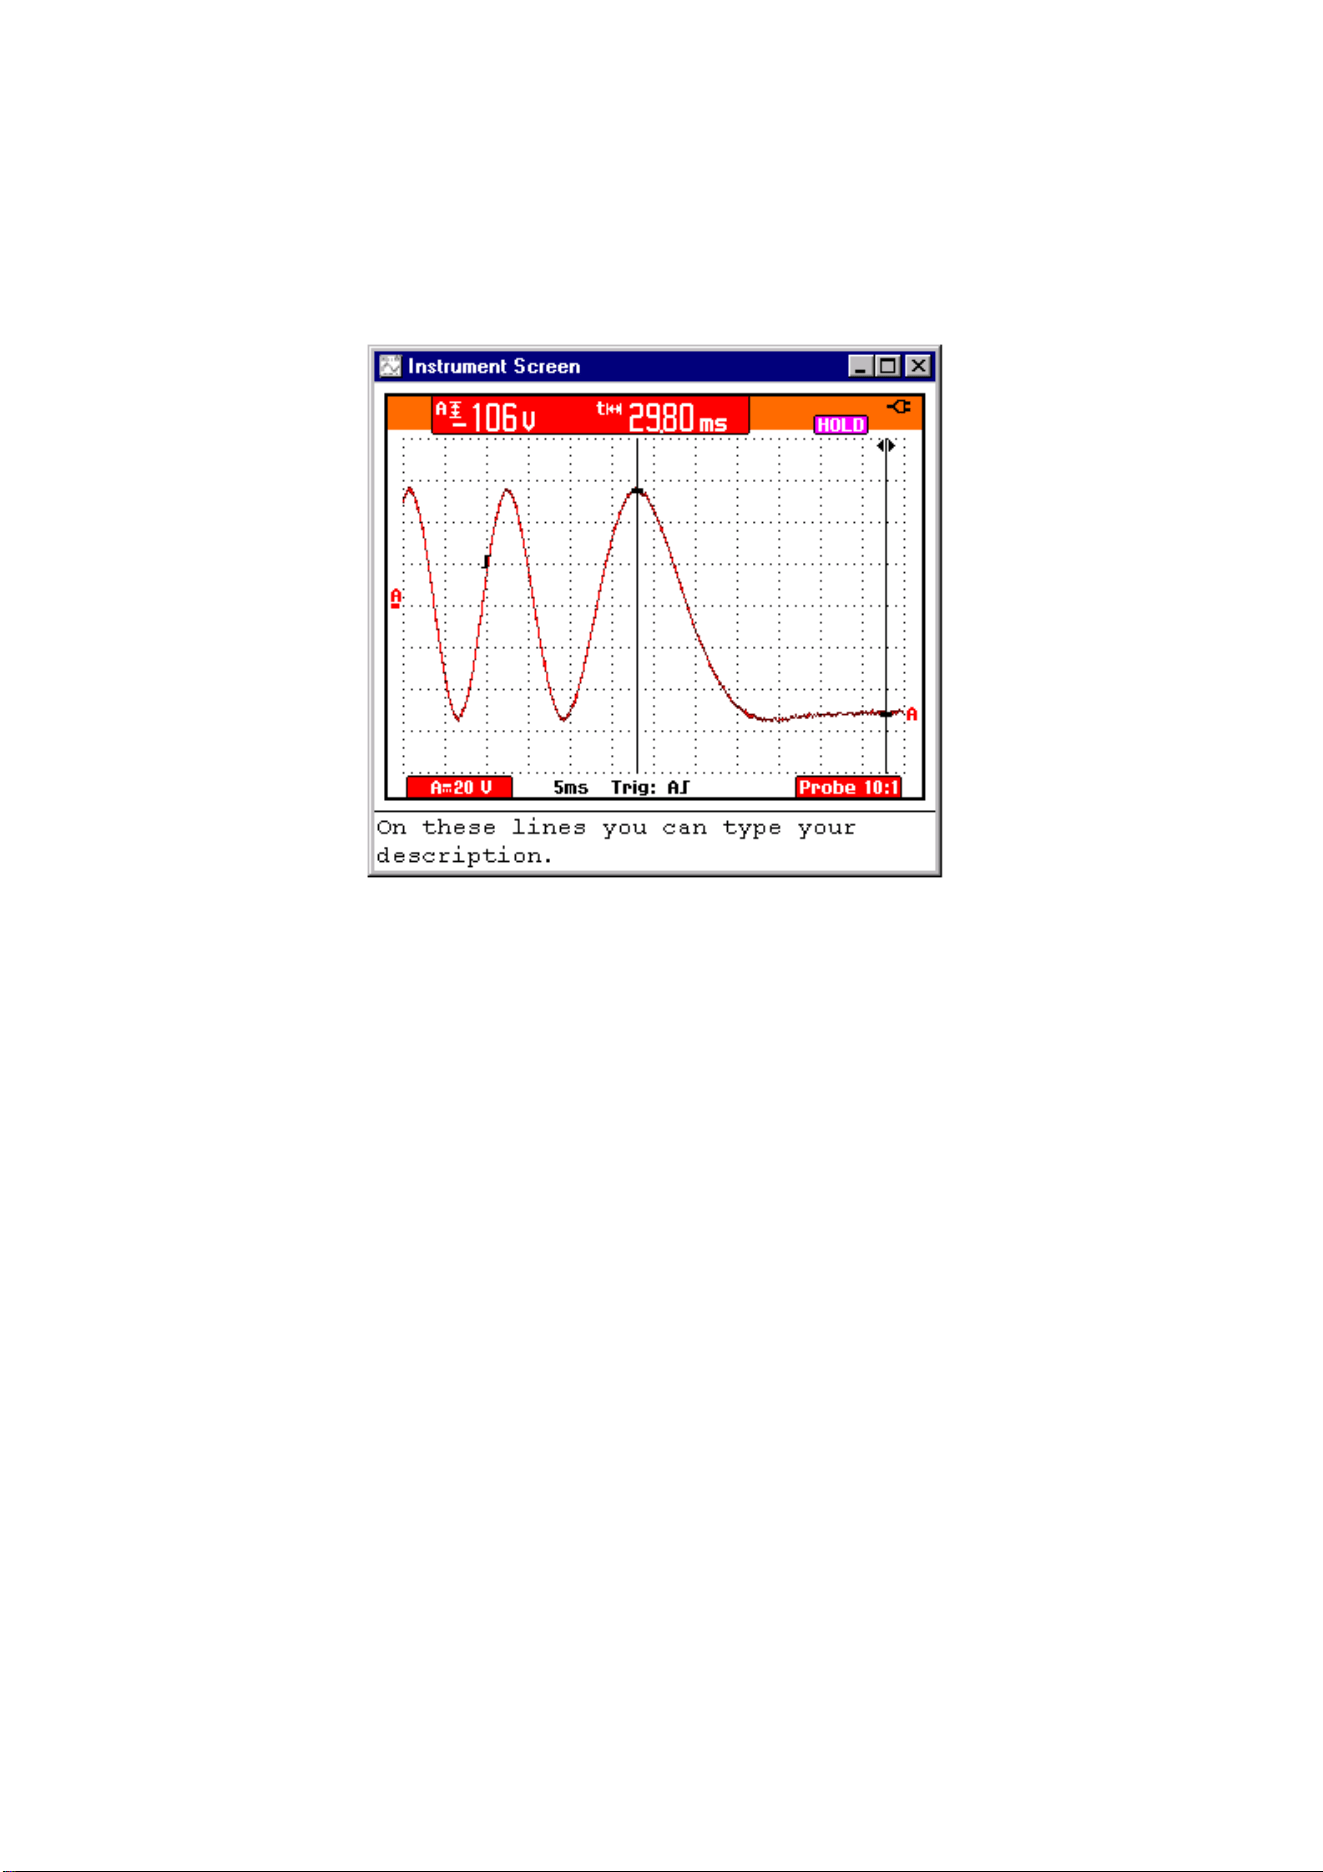
Instrument Screens
Type: bitmap graphics data from the instrument’s screen (in
pixel-format)
Use: to create documents and reports
Screen è Screen Window
1.888.610.7664 sales@GlobalTestSupply.com
Fluke-Direct
.com
SW90W Users Manual
8
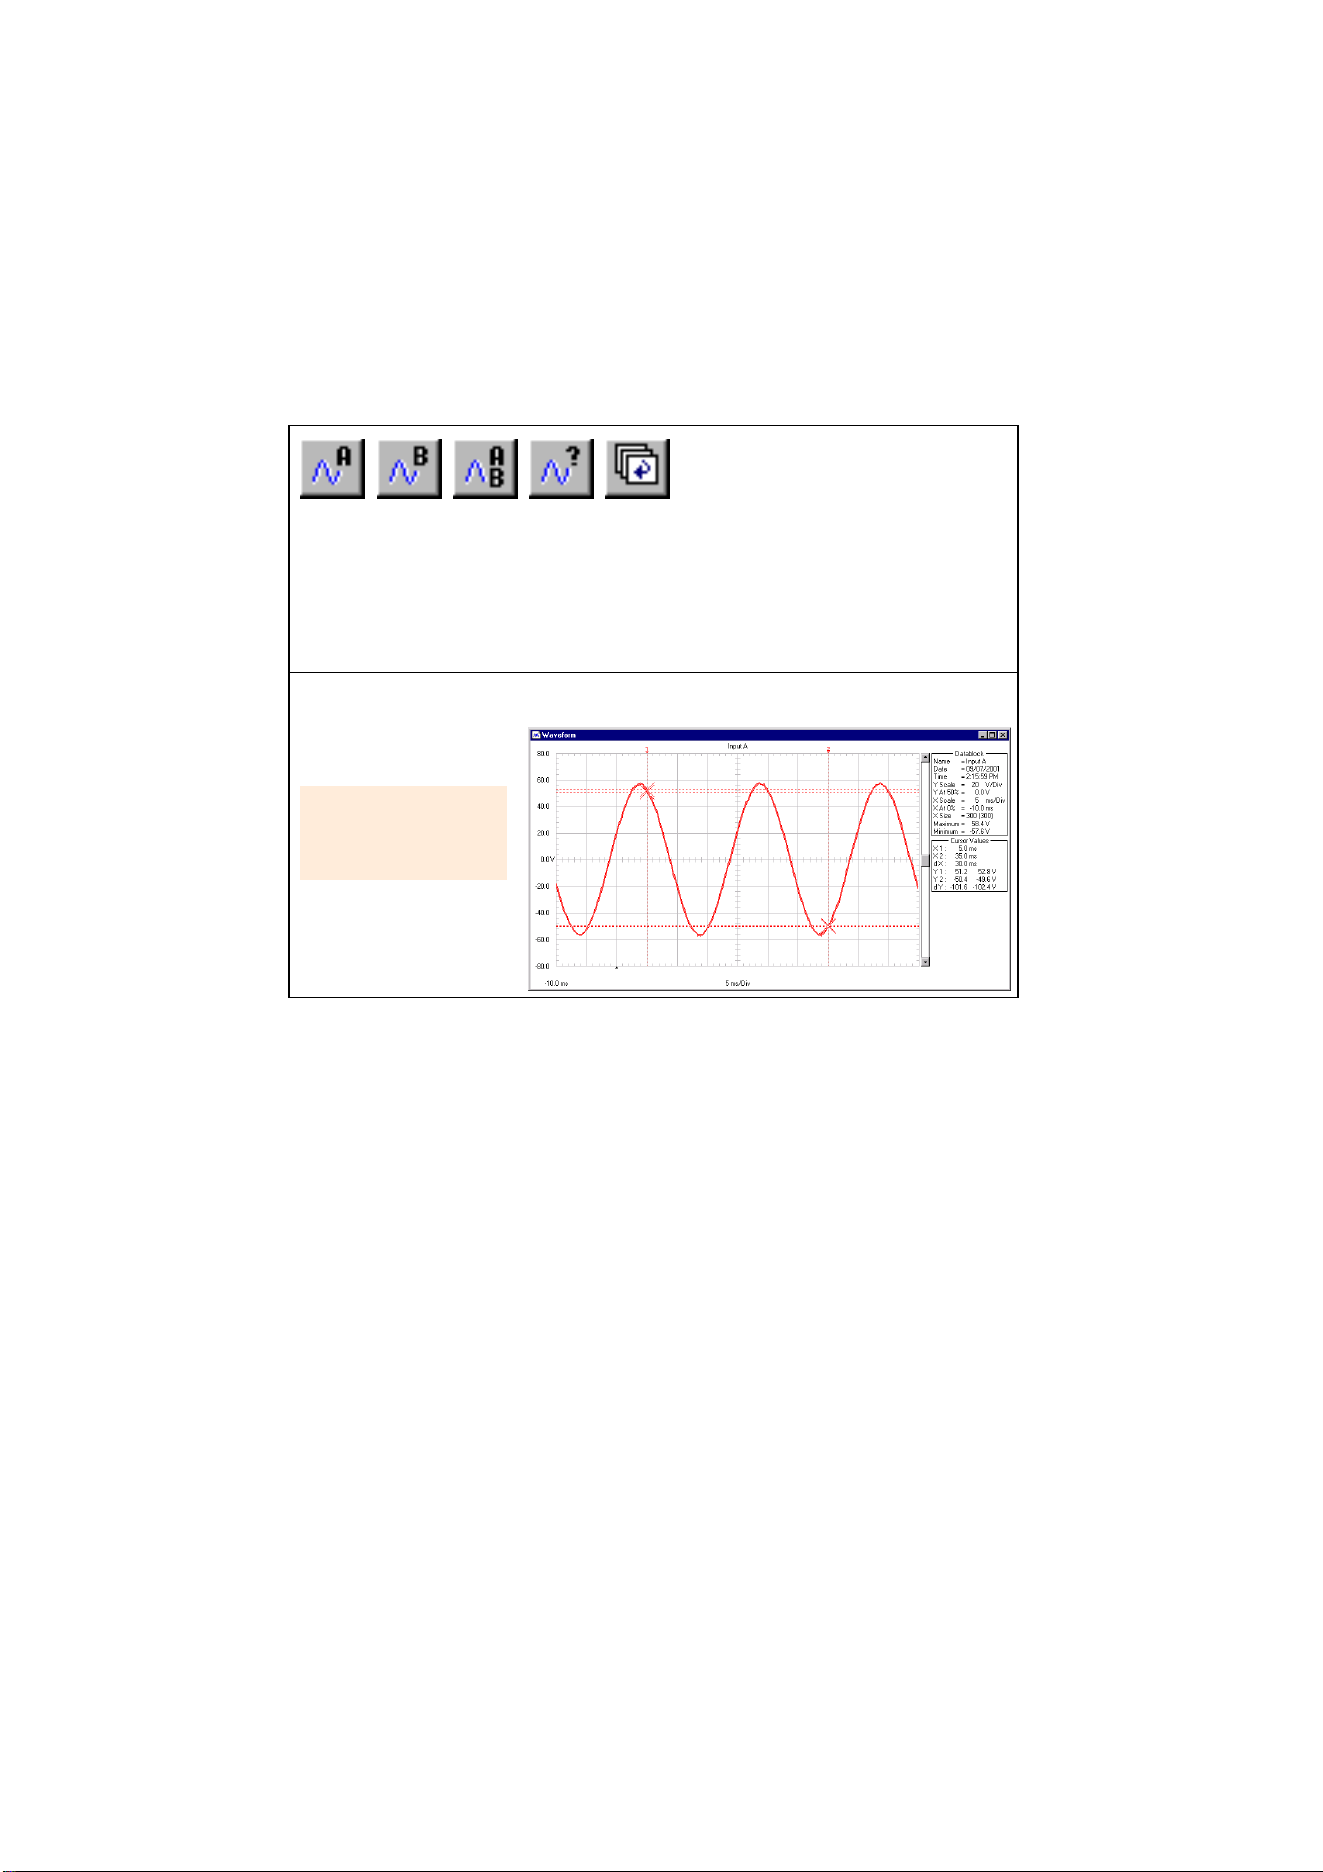
Waveforms
Type: numerical waveform points to generate Y-t vector-
graphics data
Use: to analyze by zooming, scaling, or creating a spectrum
from
Waveformè Waveform Window
1.888.610.7664 sales@GlobalTestSupply.com
Fluke-Direct
.com
SW90W Users Manual
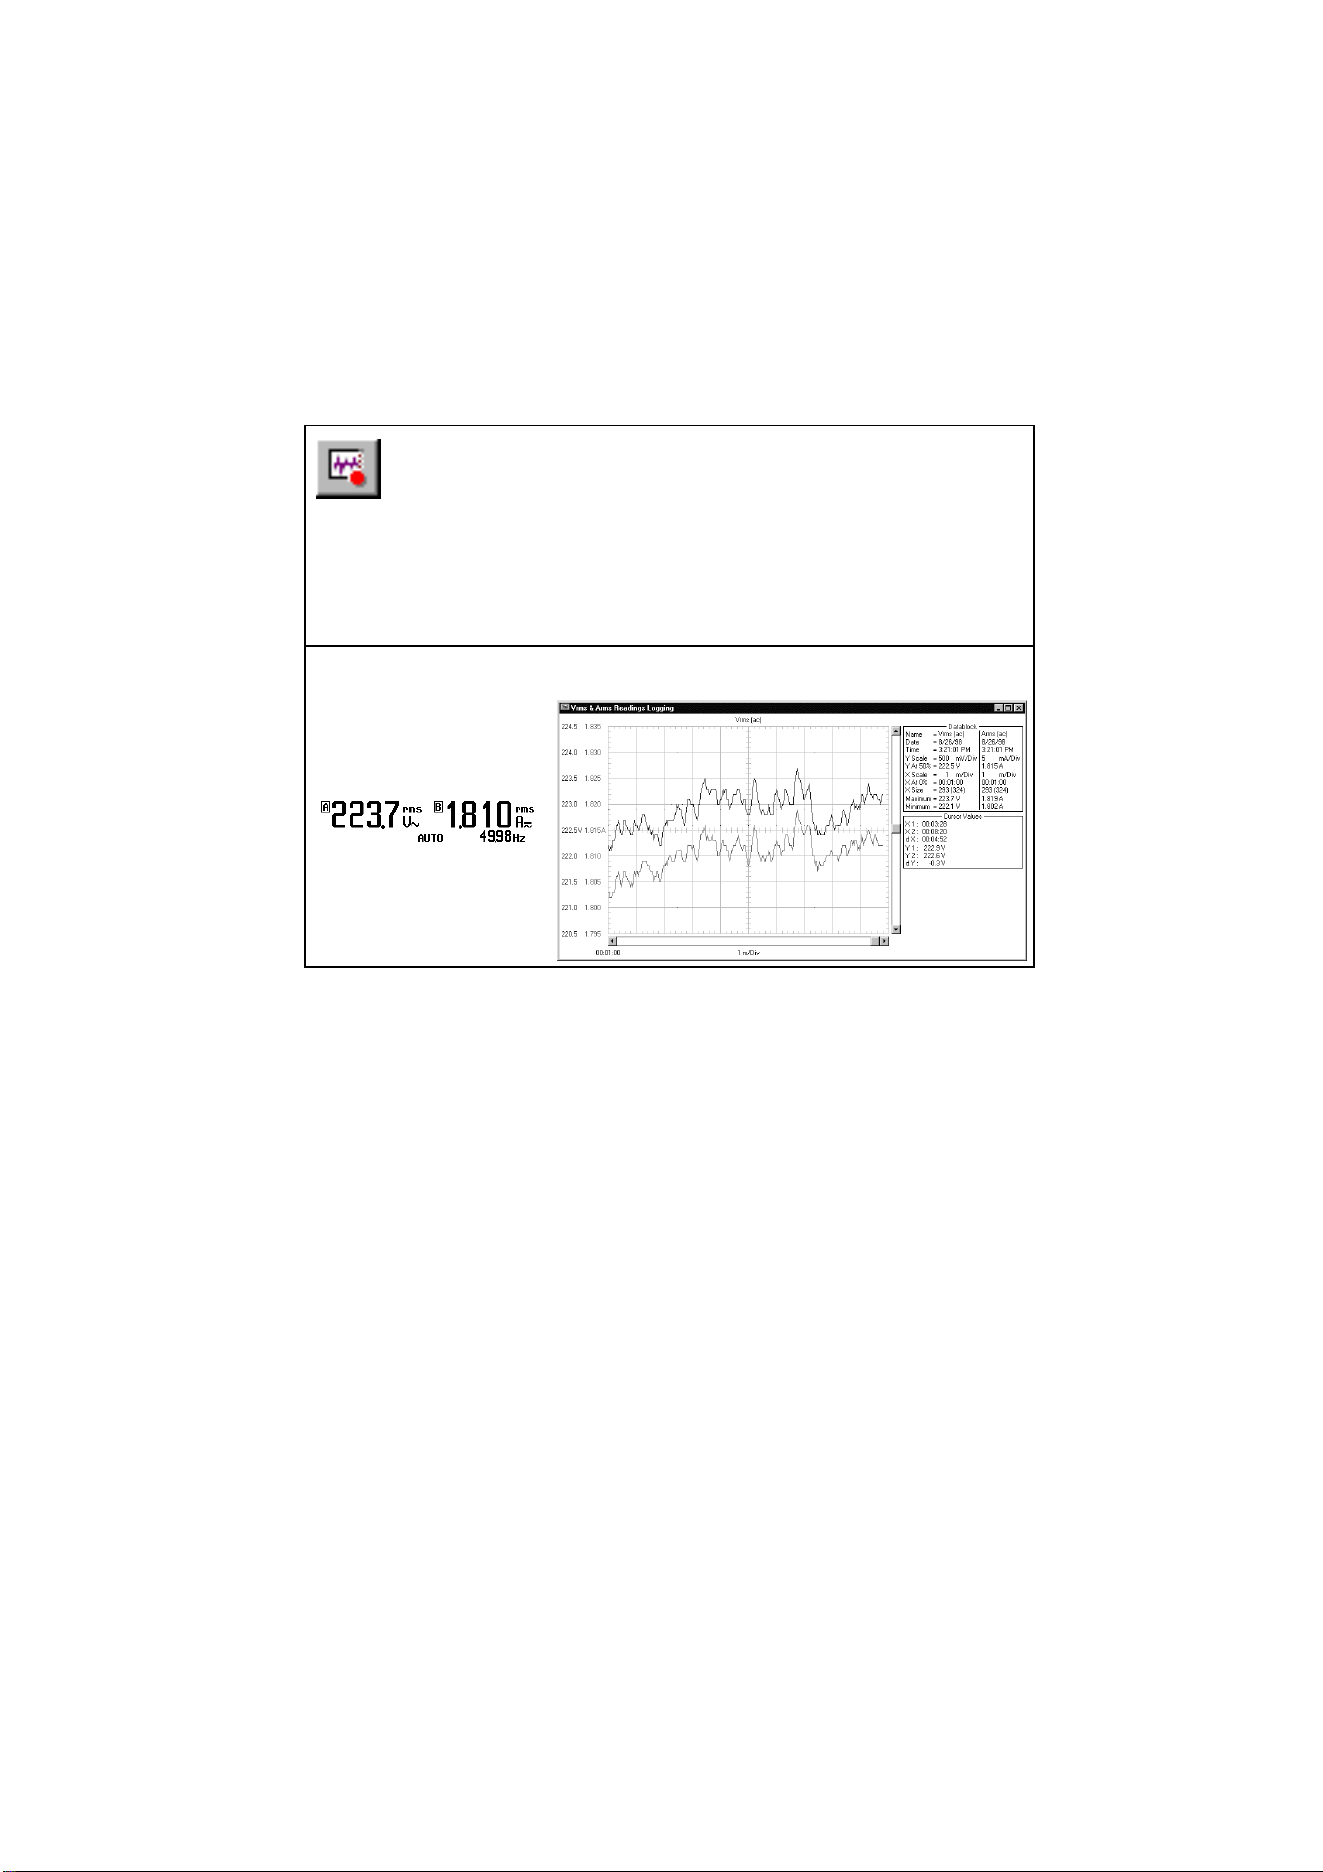
9
Readings
Type: numerical values to log Y-X vector-graphics data
Use: to analyze by zooming, scaling, or creating a spectrum
from
Readingsè Waveform (Readings) Window
1.888.610.7664 sales@GlobalTestSupply.com
Fluke-Direct
.com
SW90W Users Manual
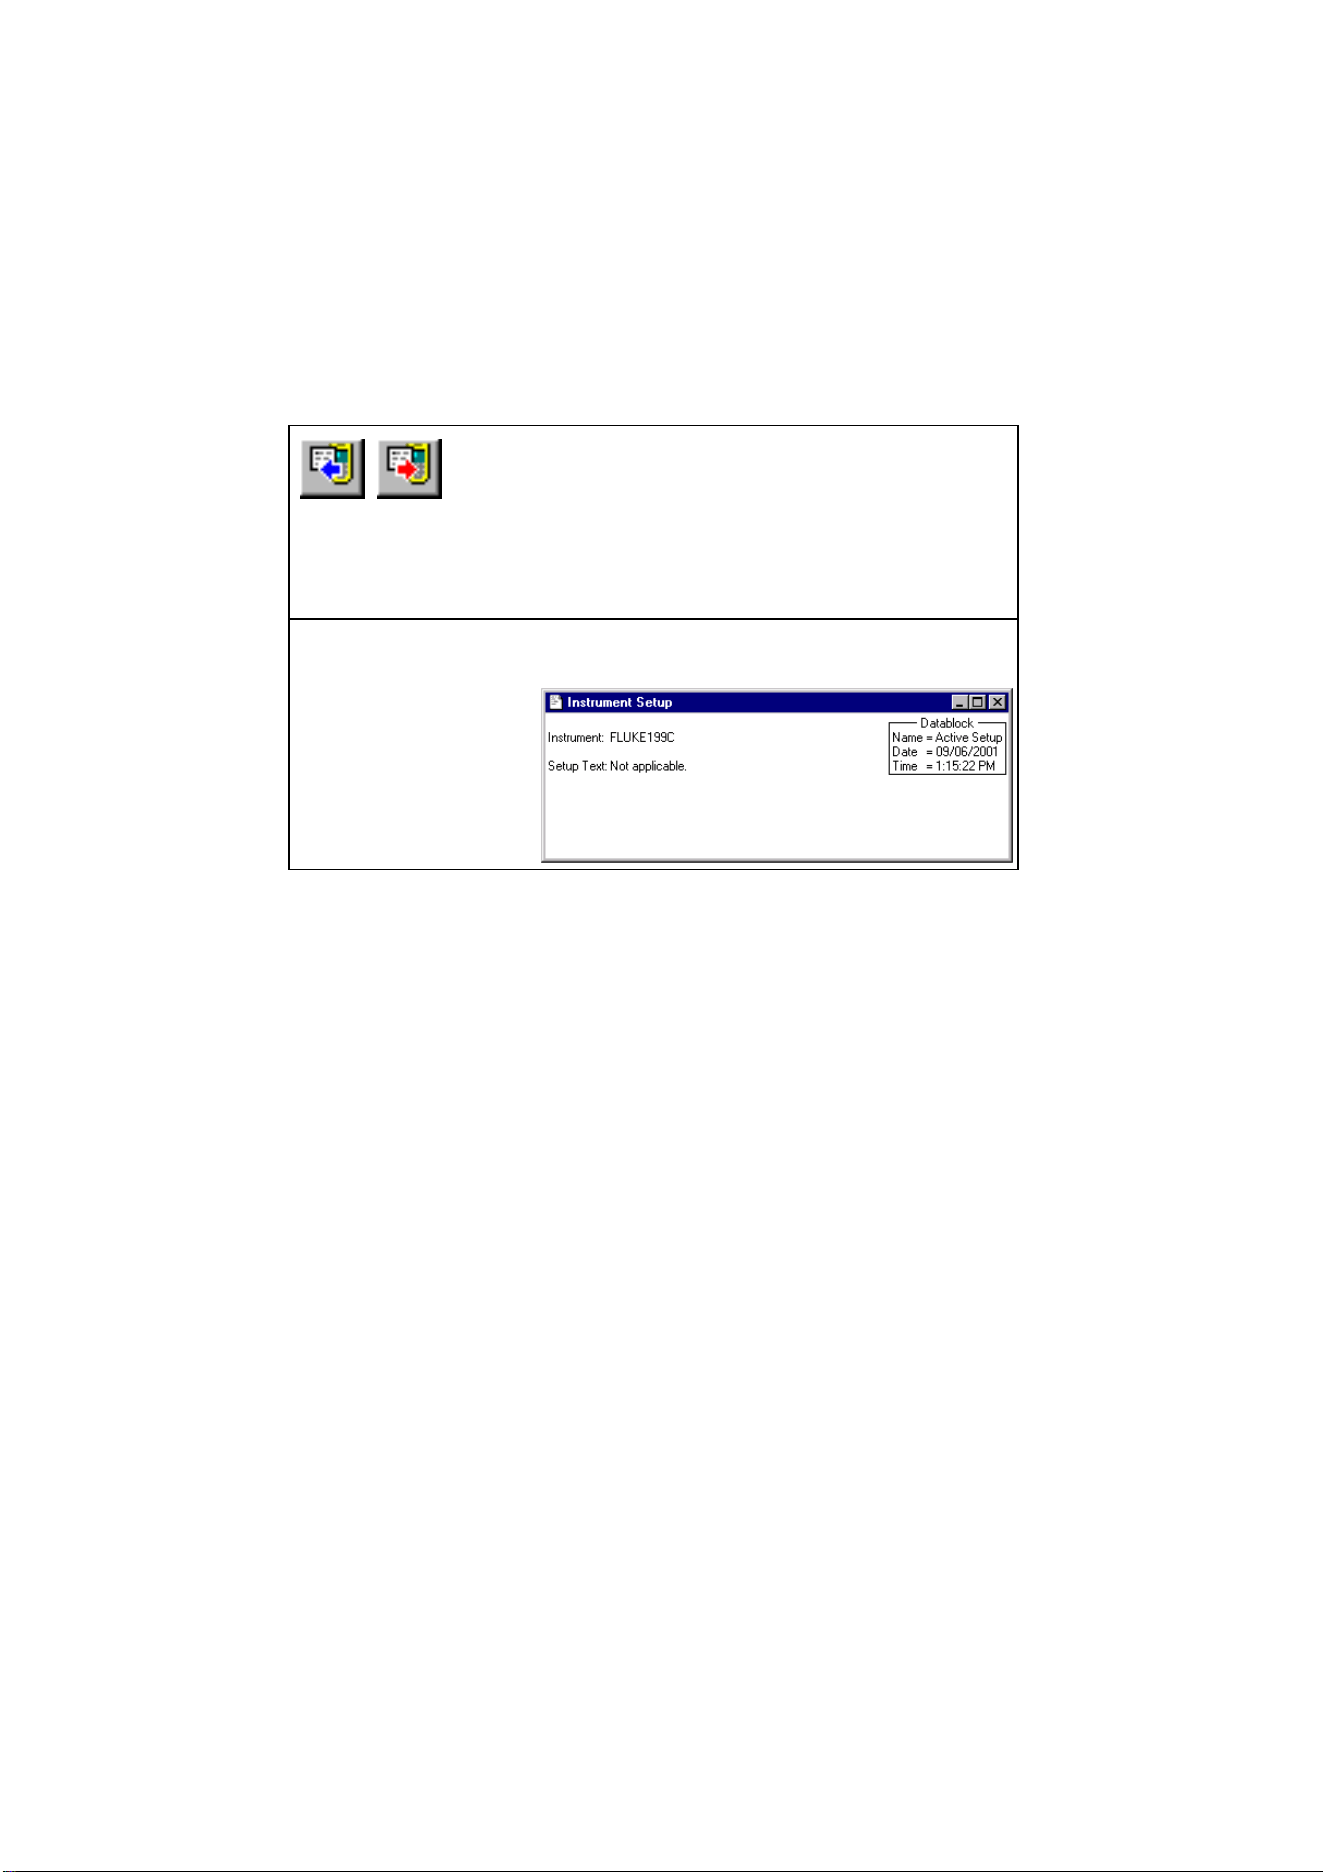
10
Instrument Setups
Type: binary settings data from the instrument
Use: to retrieve and send back instrument setups
Setup è
ç
Setup Window
[actual
ScopeMeter
settings]
1.888.610.7664 sales@GlobalTestSupply.com
Fluke-Direct
.com

SW90W Users Manual
11
Creating a Test Report
1 Choose from Start - Programs - FlukeView
- ScopeMeter 4.0 English to create a test
report (using Word).
As a result, Word is started and the required macros are loaded.
In Word, select Enable Macros when requested.
2
Click predefined fields (Company, Contact, ...) and
type your text.
3
Click to insert the active ScopeMeter screen.
As a result, FlukeView is started, a connection is
made, and the active Instrument Screen is pasted
into the document.
4
Click the Description field and type your text.
5
Click to print your test report. See the next page for an
example of a test report.
6
Click to save your test report.
7
Exit Word to continue with the next section of this
manual.
1.888.610.7664 sales@GlobalTestSupply.com
Fluke-Direct
.com

SW90W Users Manual
12
1.888.610.7664 sales@GlobalTestSupply.com
Fluke-Direct
.com

SW90W Users Manual
13
Documenting Screens
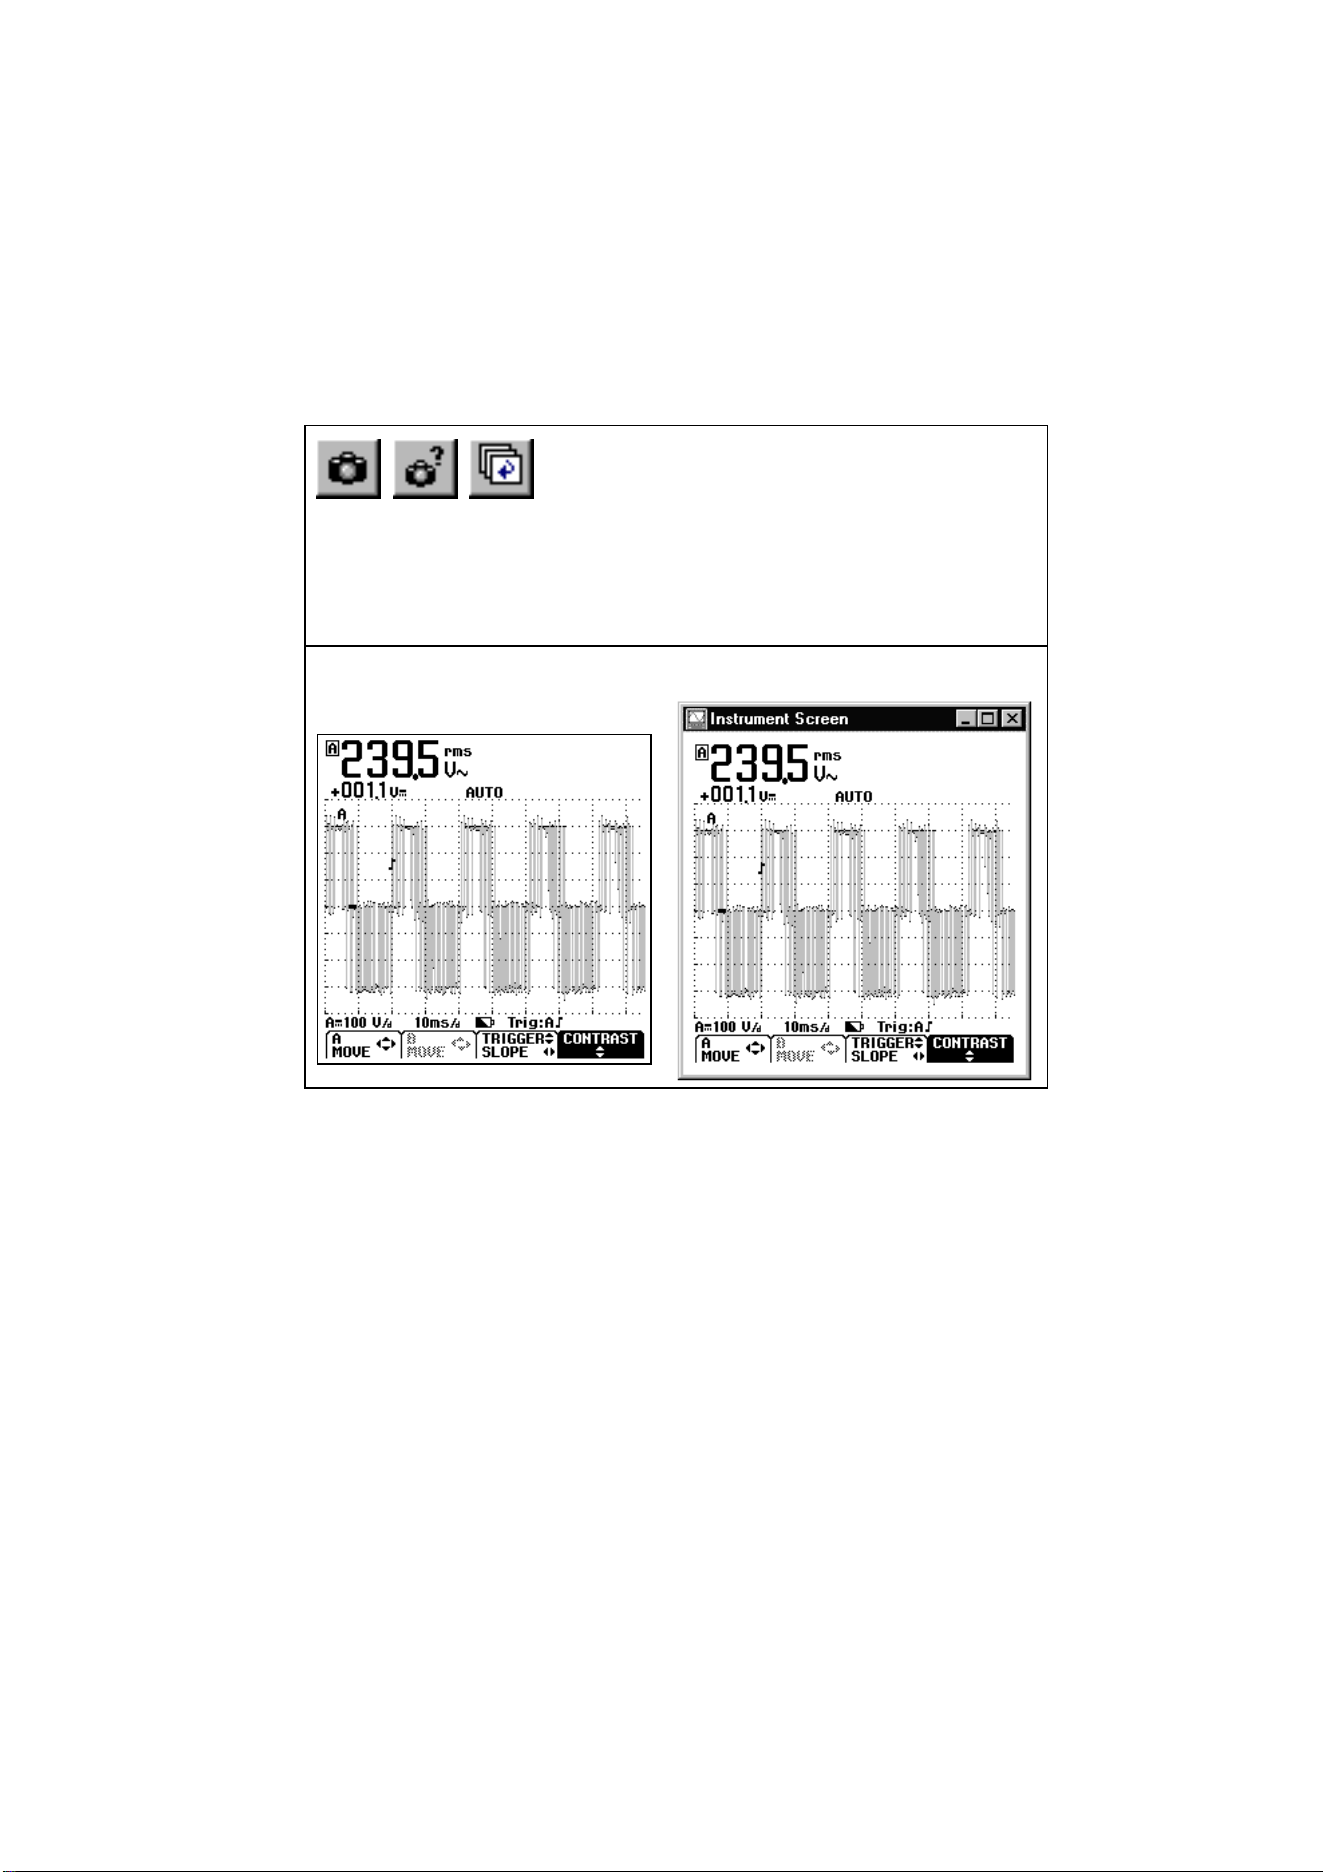
Displaying an Instrument Screen on the PC
1a
Click to display the active ScopeMeter screen in a
screen window.
1b
Click. A dialog box appears allowing you to select
specific ScopeMeter screens to display in screen
windows.
Tip
To specify conditions for transferring screens,
choose Instrument - Multiple Transfers.
To change the window to your preference:
2 Select Options - Add Description and type a description
in the text box below the window (max. 10 lines).
3 Select Options - Title to change the title of the window.
4 Select Options - Colors to change window colors.
1.888.610.7664 sales@GlobalTestSupply.com
Fluke-Direct
.com
SW90W Users Manual
14
Each ScopeMeter screen appears in a separate screen window.
1.888.610.7664 sales@GlobalTestSupply.com
Fluke-Direct
.com
SW90W Users Manual
15
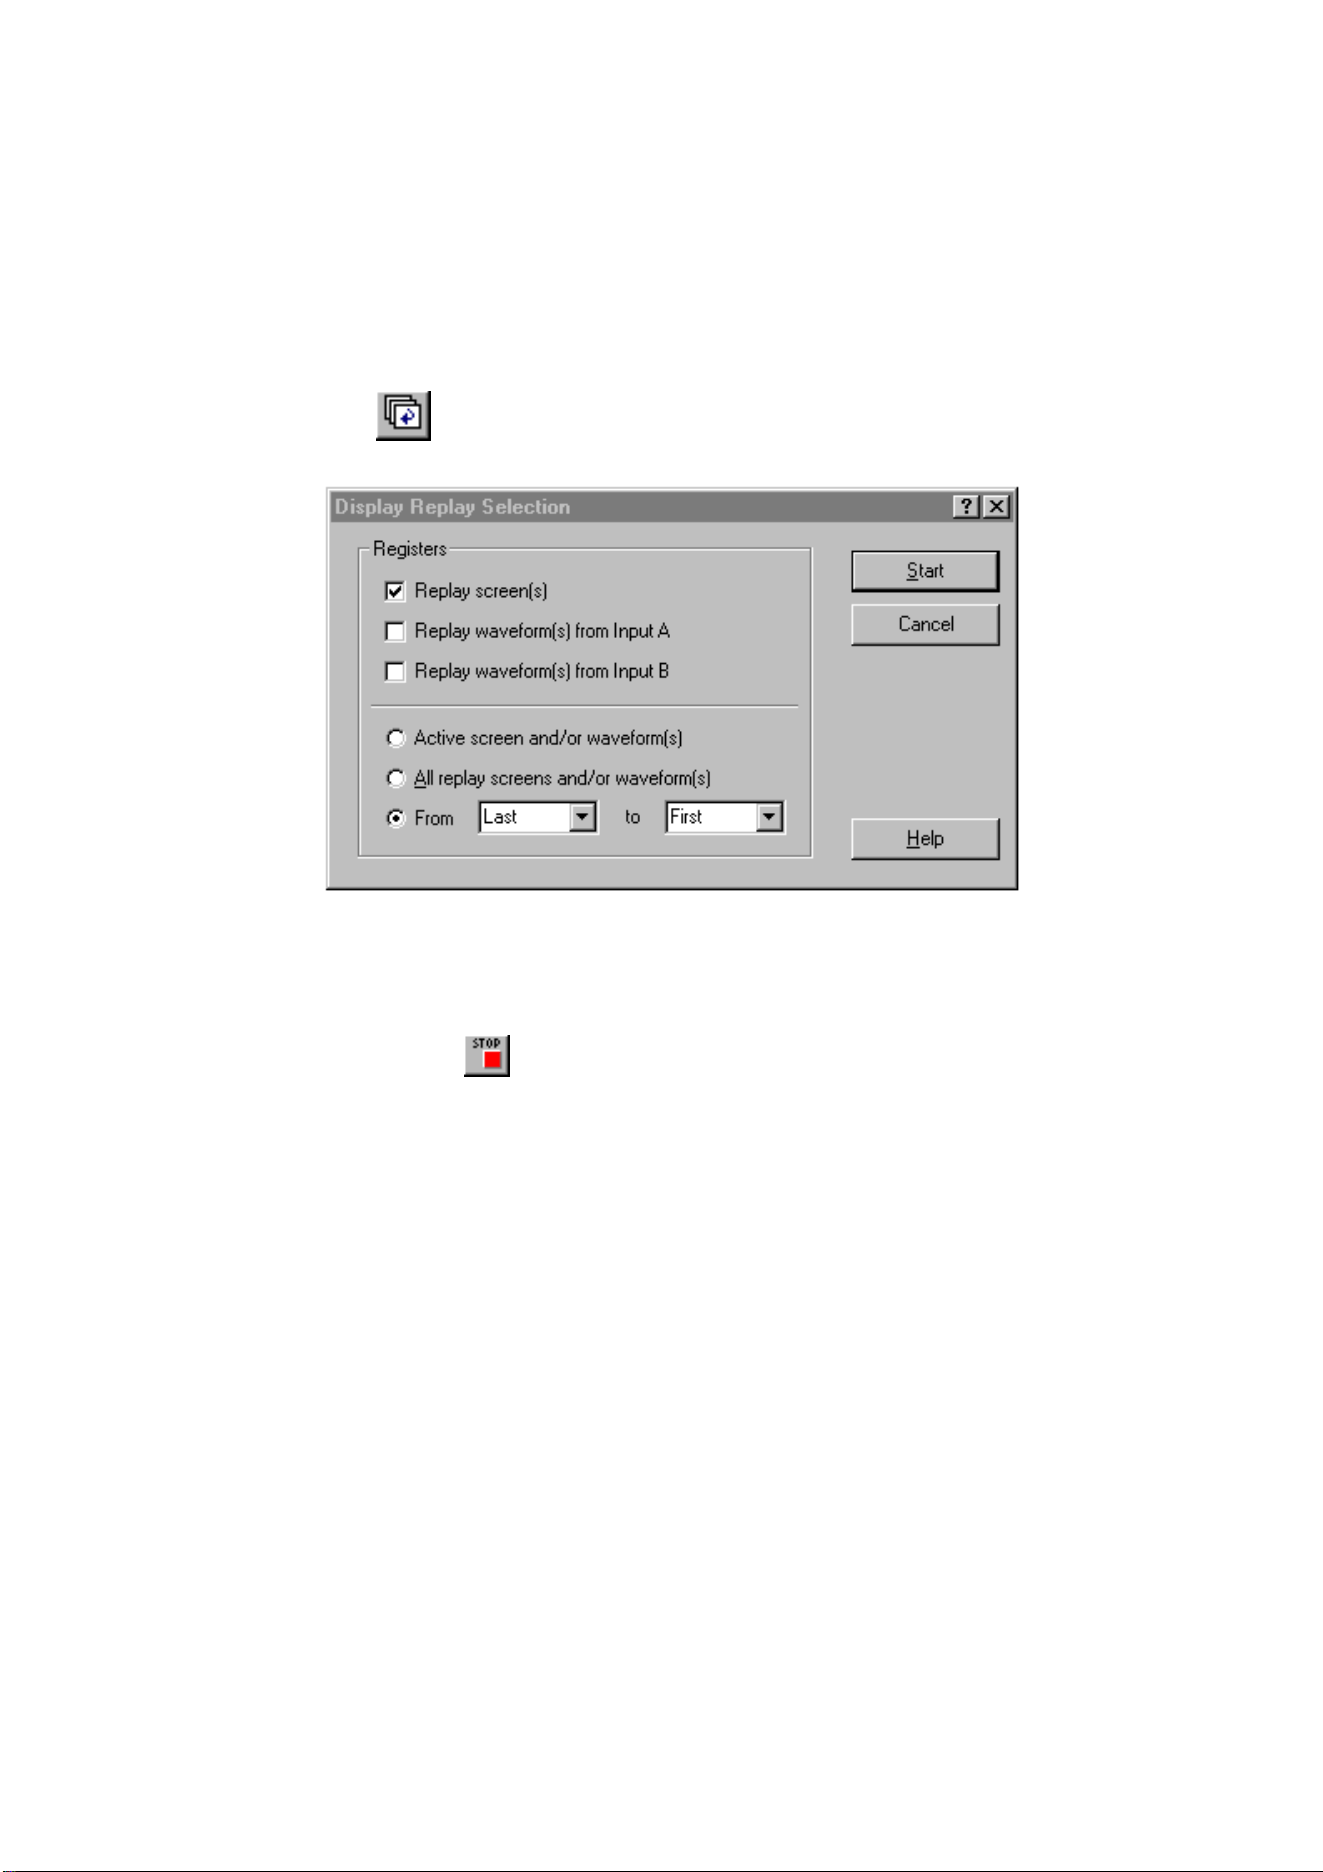
Replaying Screens
1
Click. A dialog box appears allowing you to make
the following selections:
2 Click Start to read and display the replay screens.
Note
To stop reading and displaying the replay sequence,
click
or press Esc.
3 If applicable, choose View - Ratio 4:3 to change the X:Y
ratio of the window.
1.888.610.7664 sales@GlobalTestSupply.com
Fluke-Direct
.com
SW90W Users Manual
16
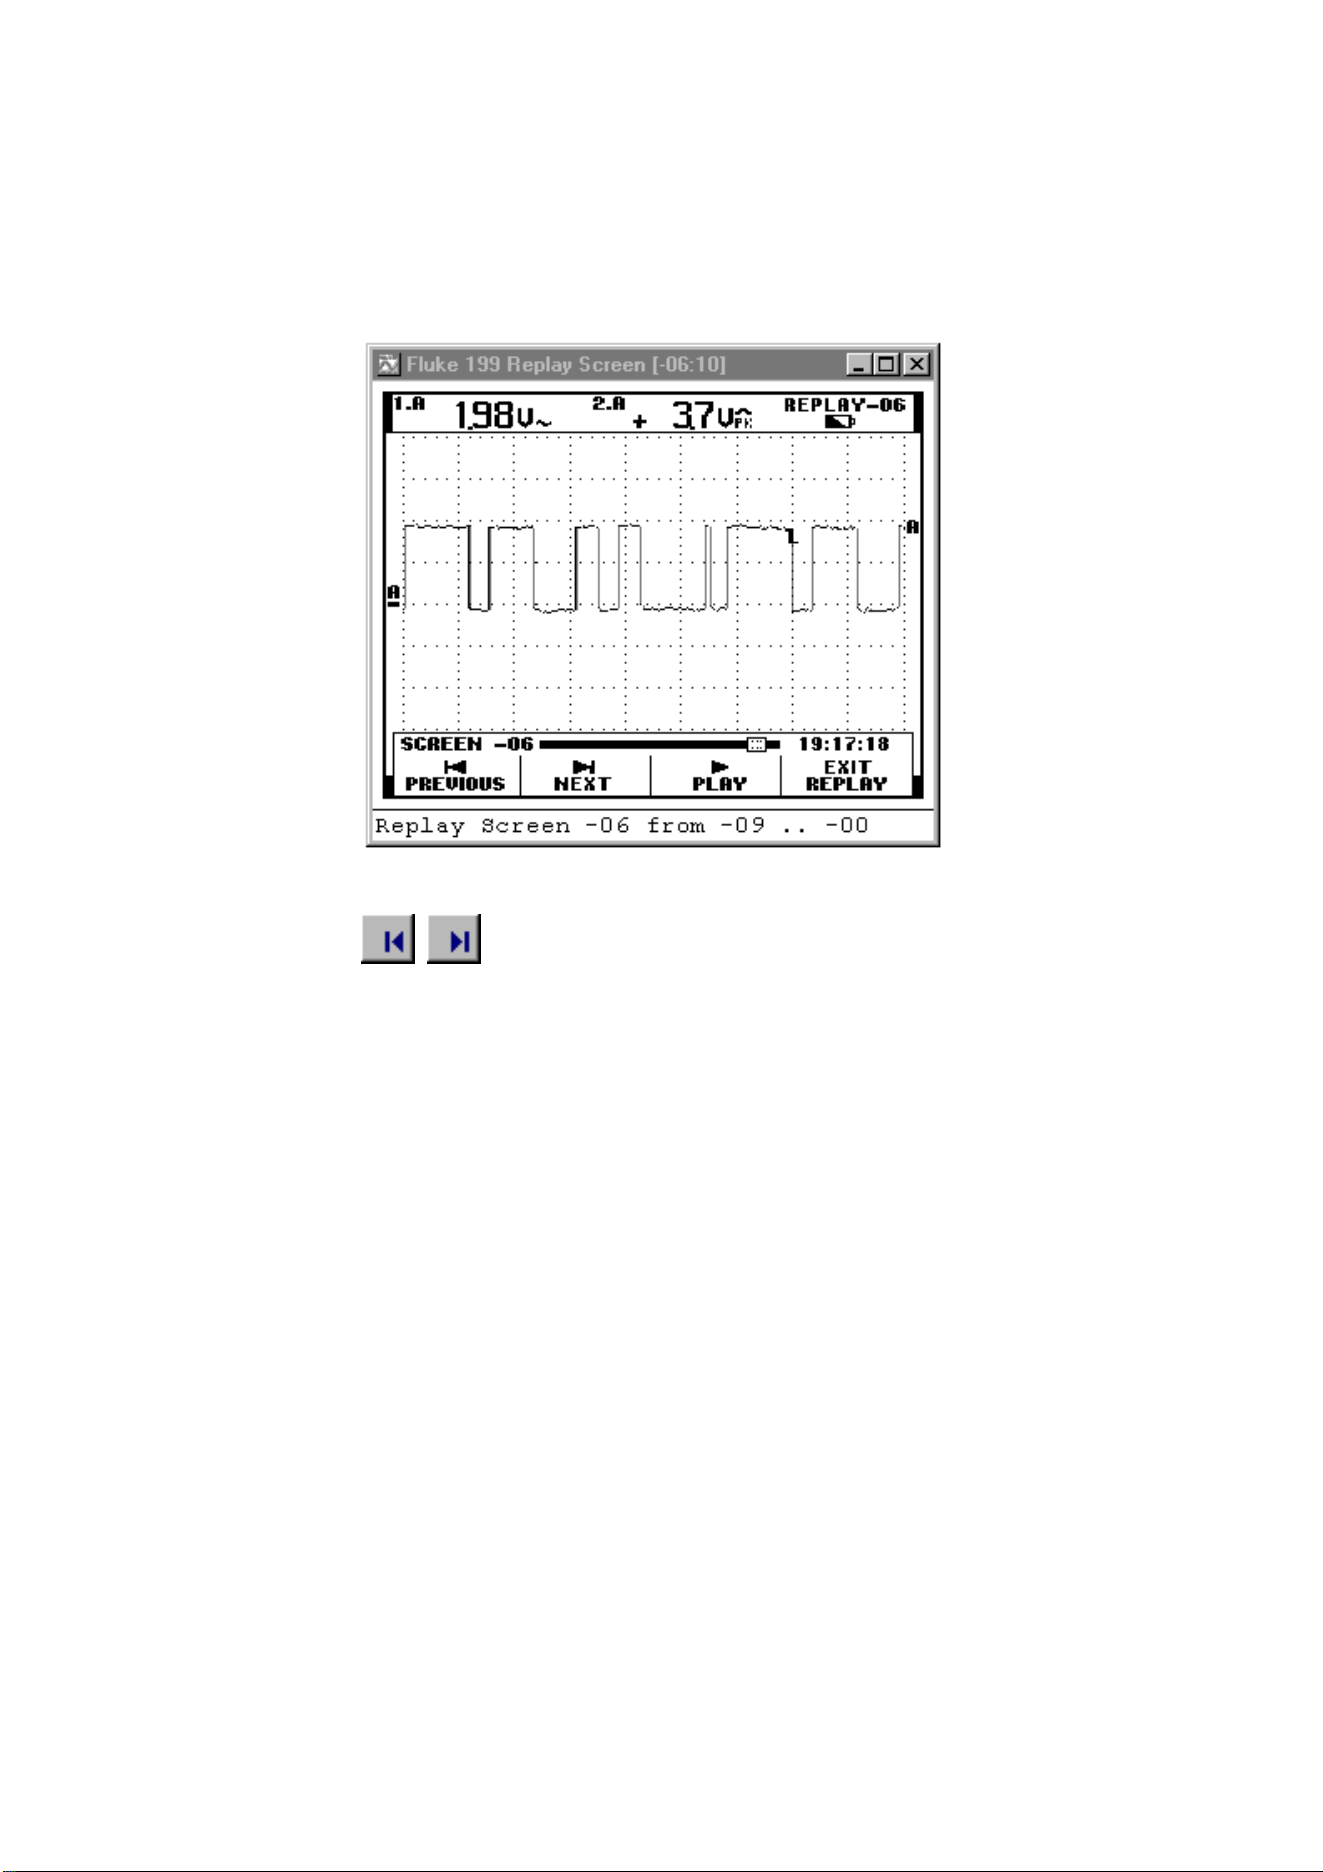
To change the window to your preference:
4
Click to view the previous or next replay
screen.
You can also choose View - Replay to scan
through the replay sequence of screens.
5 Select Options - Add Description and type a description
in the text box below the window (max. 10 lines).
6 Select Options - Title to change the title of the window.
7 Select Options - Colors to change window colors.
1.888.610.7664 sales@GlobalTestSupply.com
Fluke-Direct
.com

SW90W Users Manual
17
Inserting Screens into a Document
1 Click on the screen window you want to insert.
Tip
To avoid losing resolution because of copying to the
clipboard, choose Windows – Default Size.
2
Click to copy the window to the clipboard.
3 Switch to a wordprocessor.
4 Open or create a document and place the cursor where
you want to insert the window.
5 Select Edit - Paste to insert the screen window into the
document.
6
Click to save your document.
Note
In the same way, you can insert waveform and spectrum
windows into a document.
1.888.610.7664 sales@GlobalTestSupply.com
Fluke-Direct
.com
SW90W Users Manual
18
Analyzing Waveforms
You can read numerical waveform samples from the ScopeMeter
test tool and display these samples in a waveform window. Up to
four waveforms can be displayed in a window.
To demonstrate this, a trace will be read from Input A and B.
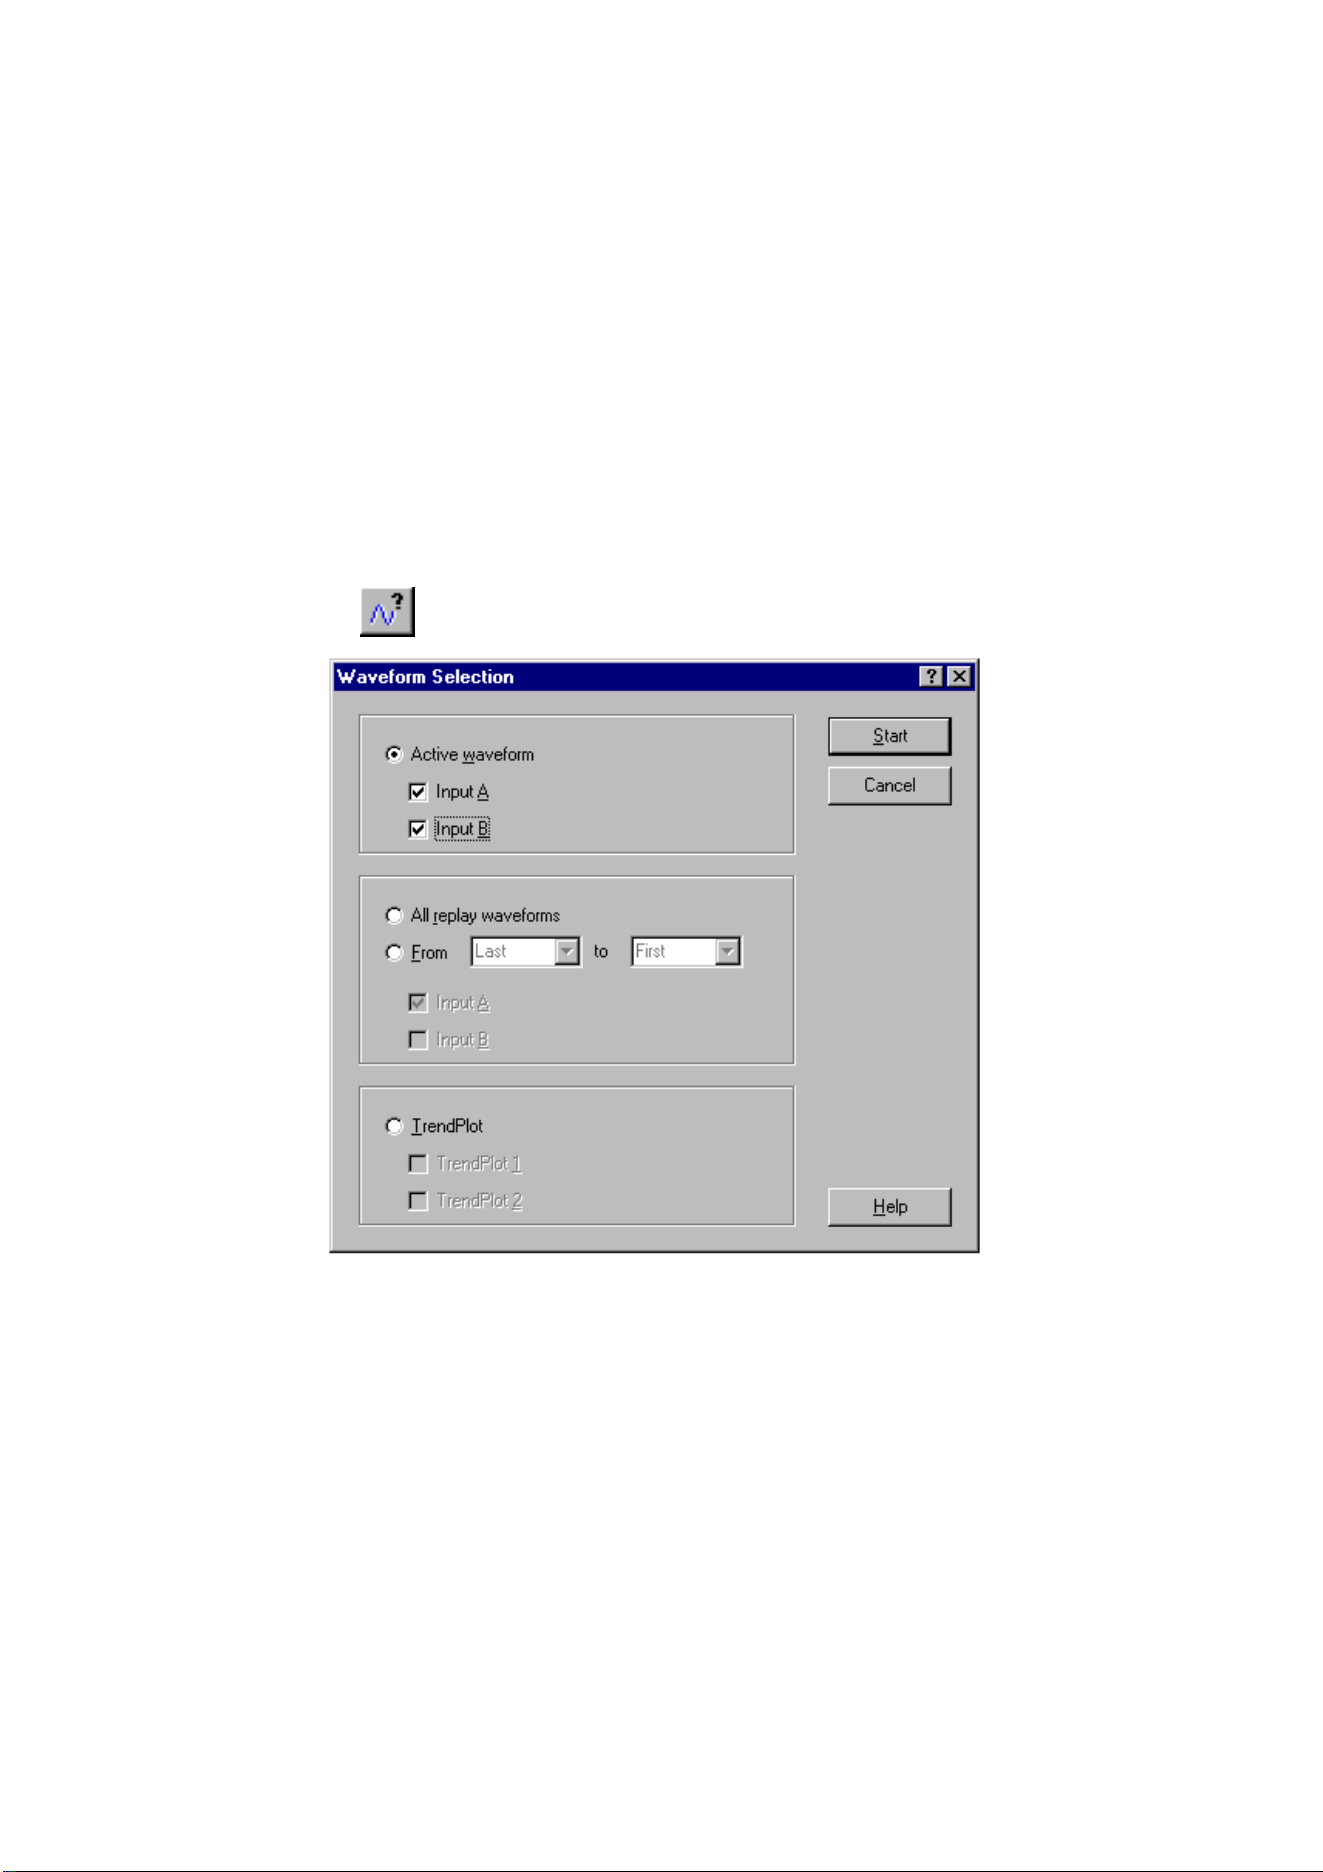
Displaying Waveforms on the PC
1
Click. A dialog box appears allowing you to select
the waveforms you want to read.
2 Choose Active waveform.
3 Choose Input A and Input B.
4 Click Start to read and display the selected waveforms.
1.888.610.7664 sales@GlobalTestSupply.com
Fluke-Direct
.com

SW90W Users Manual
19
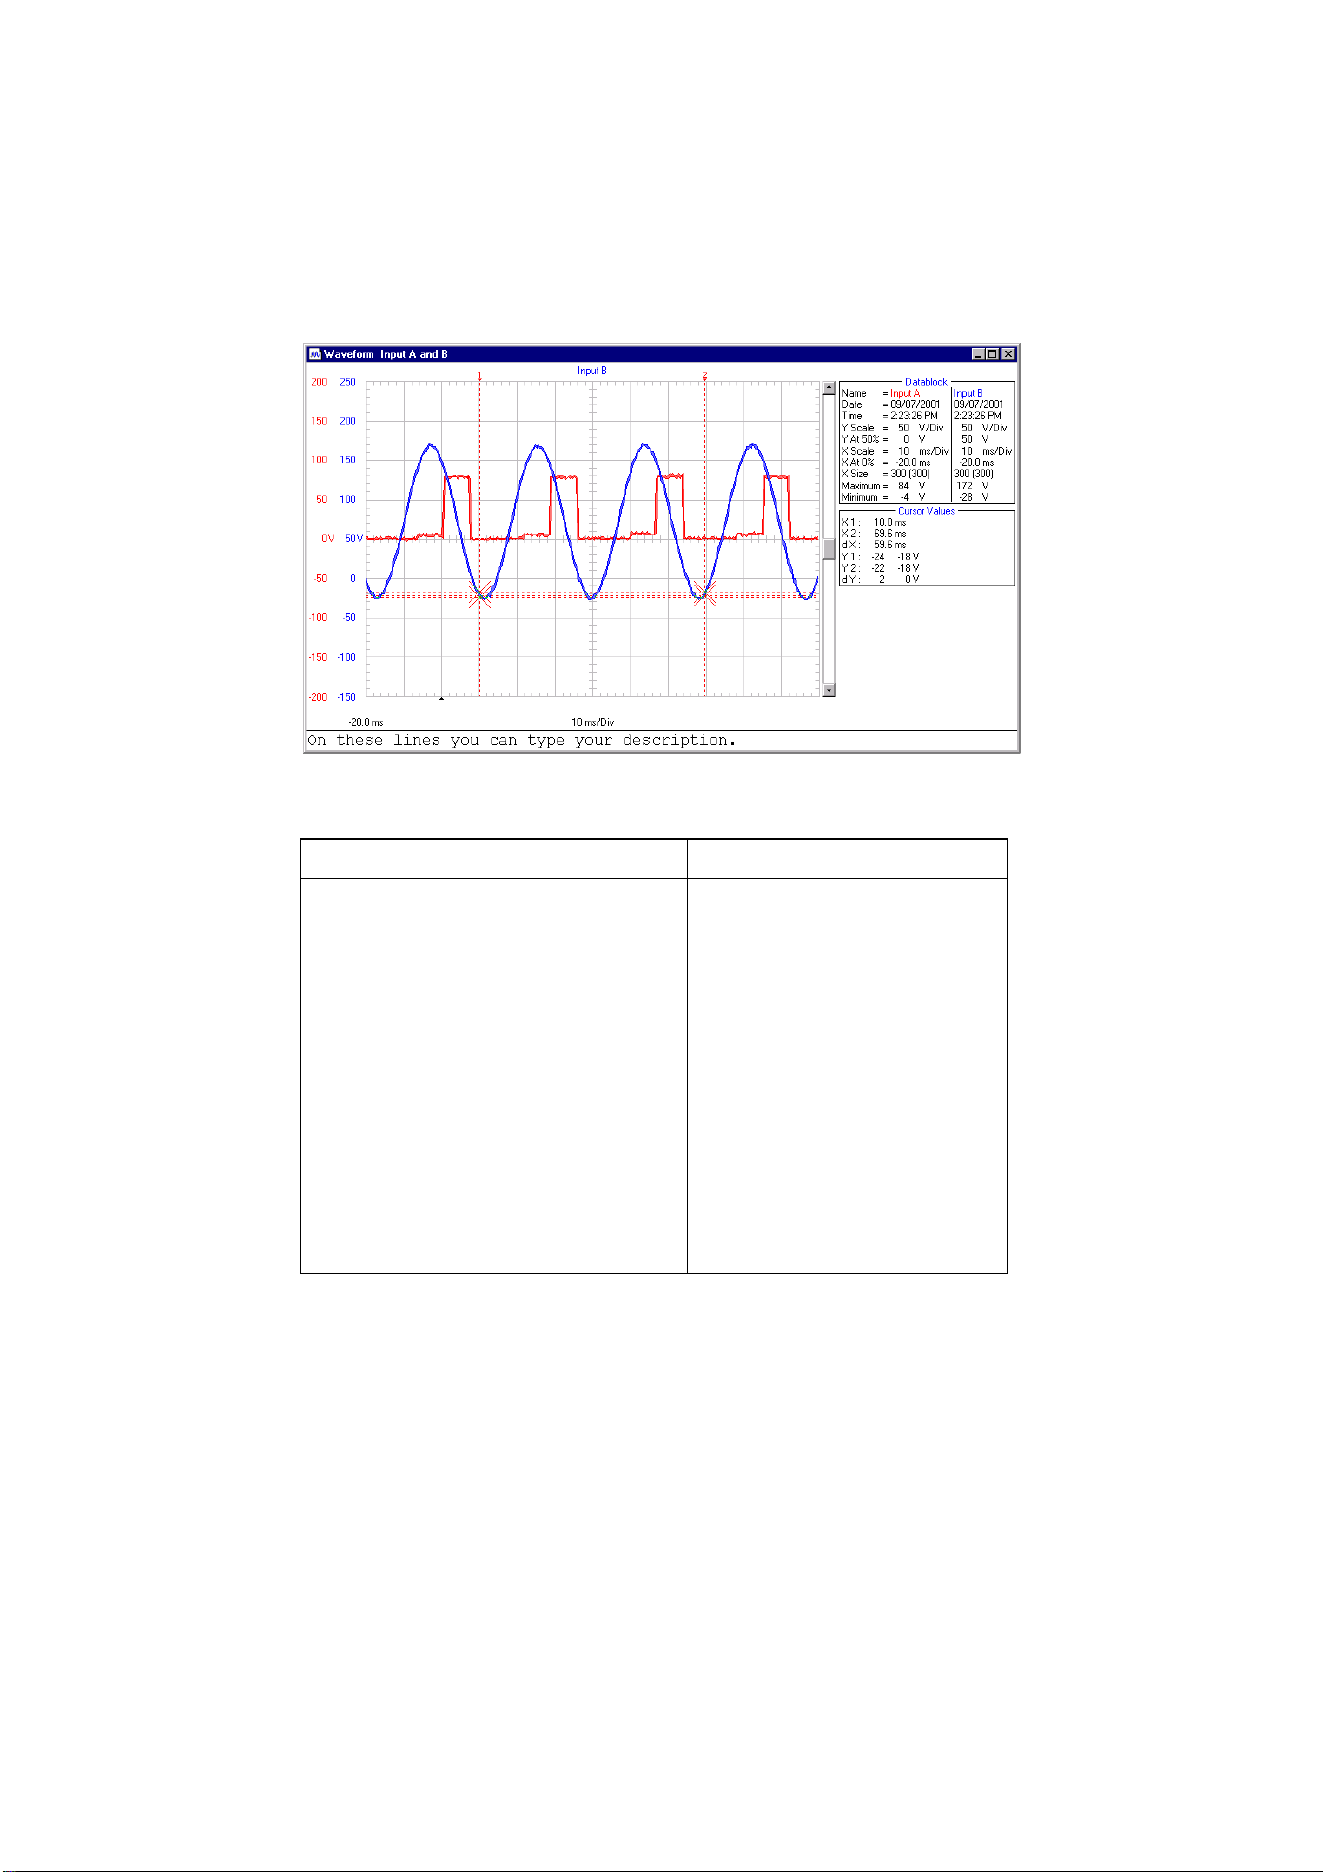
To change the window to your preference:
5 Select Options - Add Description and type a description
in the text box below the window (max. 10 lines).
6 Select View - Datablock to show the data block.
7 Select View - Cursors to show the cursors.
8 Select Options - Colors to change waveform colors.
See the next page for an example of a waveform window.
Tips
Click to quickly read the waveform from
INPUT A.
Click to quickly read the waveform from
INPUT B.
Click to quickly read the waveforms from
INPUT A
and
INPUT B.
• To specify conditions for transferring waveforms,
choose Instrument - Multiple Transfers.
• To change the scaling, select Options - Scales.
• To change window titles, select Options -
Titles.
• To show or hide the description, select View -
Description.
1.888.610.7664 sales@GlobalTestSupply.com
Fluke-Direct
.com
SW90W Users Manual
20
Use the mouse or (Shift) ß
ßß
ß à
àà
à keys to move the cursors.
Datablock Cursor Values
Name : Name of the
waveform
Date : Date of the waveform
Time : Time of the waveform
Y Scale : Vertical scale
Y At 50% : Vertical position
X Scale : Horizontal scale
X At 0% : Horizontal position
X Size : Shown (Total)
number of waveform
points
Maximum : Maximum value
Minimum : Minimum value
X1 : Time at cursor 1
X2 : Time at cursor 2
dX : X2 - X1
Y1 : Minimum and
maximum value at
cursor 1
Y2 : Minimum and
maximum value at
cursor 2
dY : Minimum and
maximum
Y2 - Y1
Notice that values apply to
the active waveform.
Note
The Date and Time formats depend on the Windows
®
settings.
1.888.610.7664 sales@GlobalTestSupply.com
Fluke-Direct
.com

SW90W Users Manual
21
Zooming In and Out on a Waveform
Drag with the mouse in the graph to select and zoom in on the
part of the waveform you want to enlarge.
Click to zoom in on a waveform.
Use the scroll bar to select the part you want to view.
Click to zoom out on a waveform (undoes one ‘zoom in’
step).
Scaling a Waveform
If a waveform is not completely shown in a window, a scroll bar
is displayed. Use this scroll bar to select the part you want to
view.
Select Options - Scales, to change the following in the active
window:
• horizontal scaling (Time axis) of all waveforms
• vertical scaling (Y axis) of the active waveform
1.888.610.7664 sales@GlobalTestSupply.com
Fluke-Direct
.com
SW90W Users Manual
22
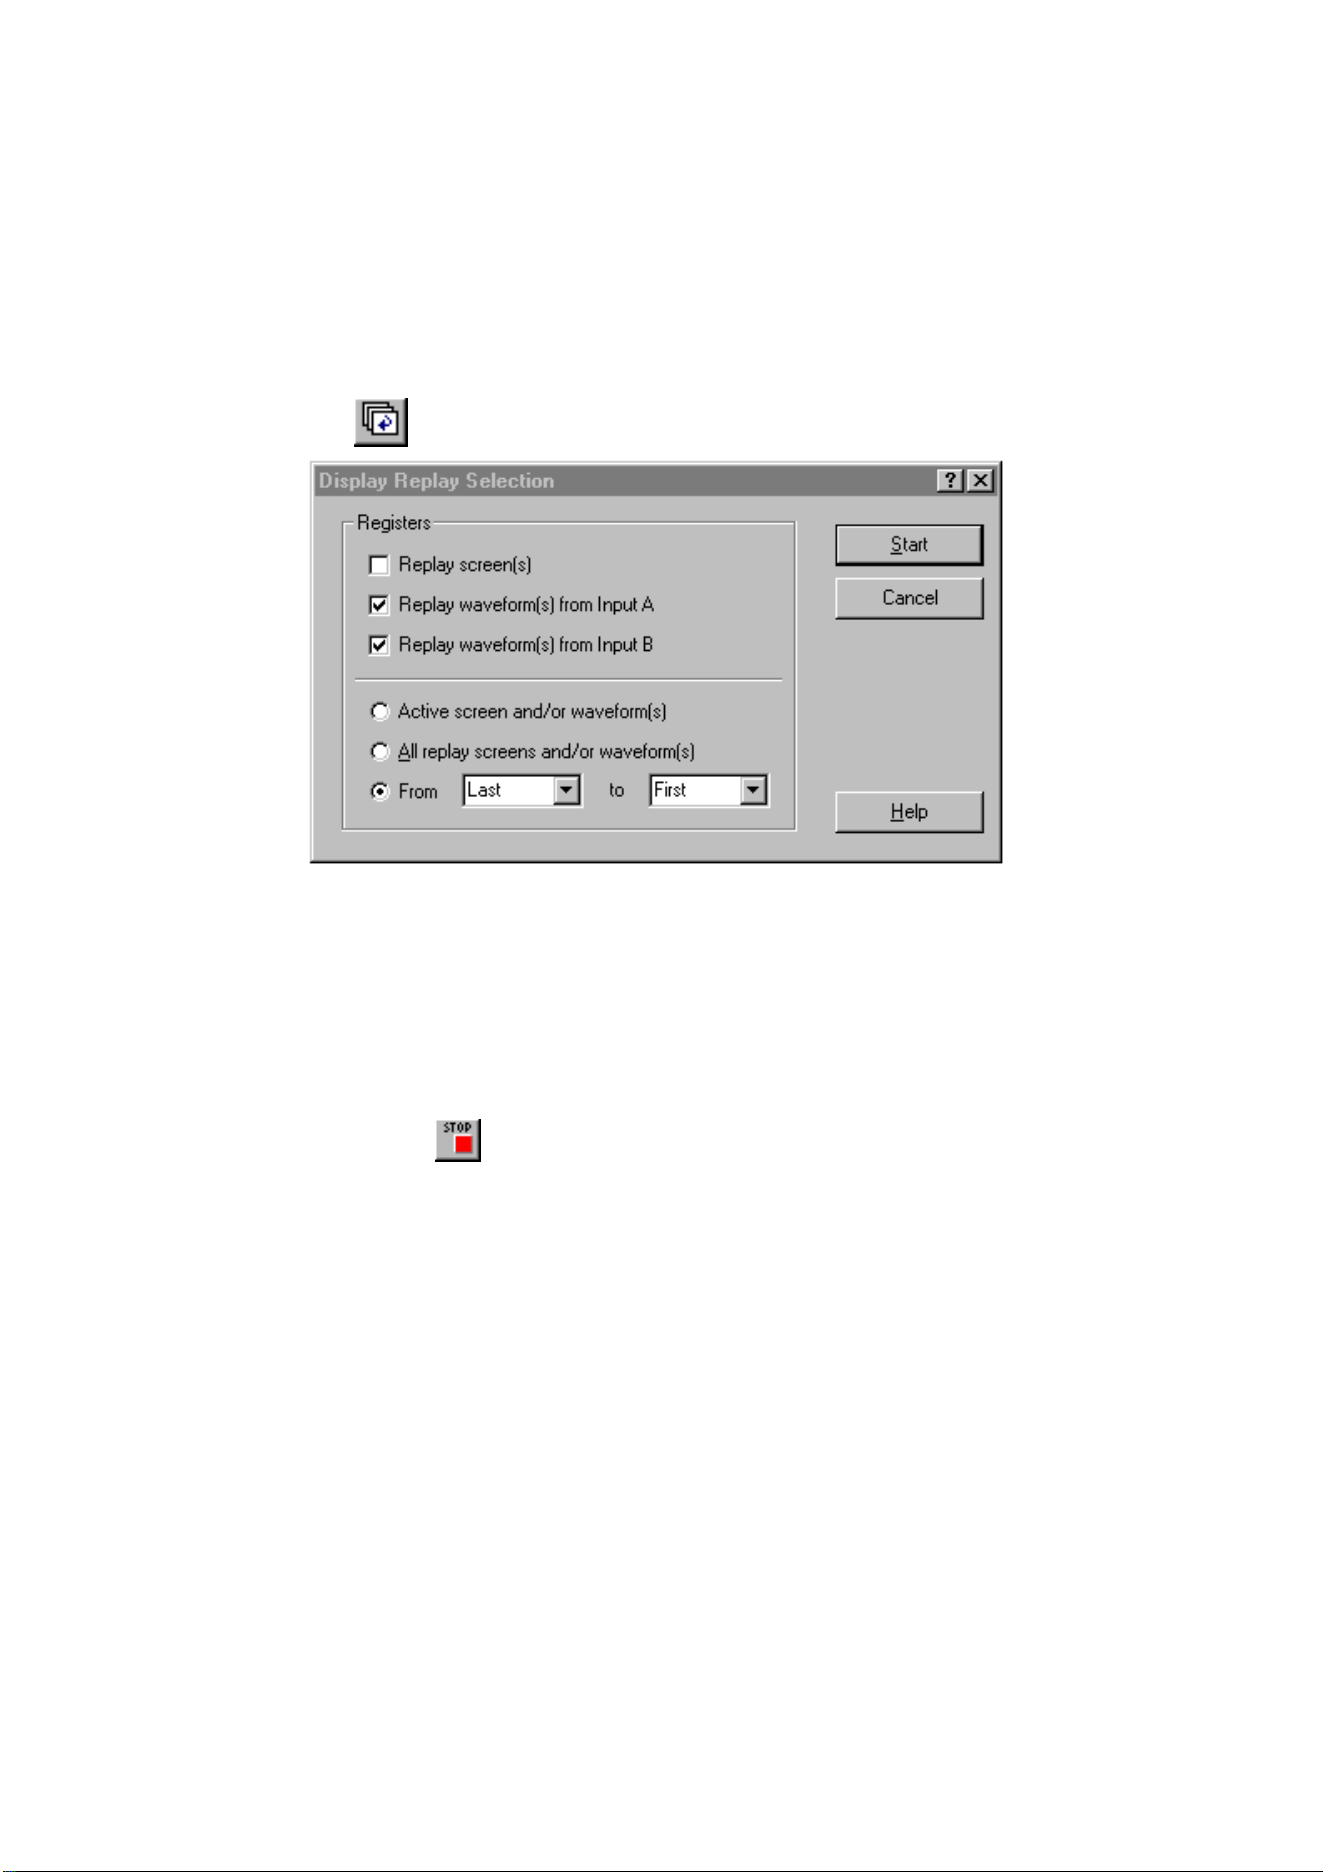
Replaying Waveforms
1
Click. A dialog box appears allowing you to make the
following selections:
2 Choose Replay waveform(s) from Input A and Replay
waveform(s) from Input B.
3 Select the range of waveforms (From - to) you want to
display.
4 Click Start to read and display the replay waveforms.
Note
To stop reading and displaying the replay sequence,
click
or press Esc.
1.888.610.7664 sales@GlobalTestSupply.com
Fluke-Direct
.com
SW90W Users Manual
23
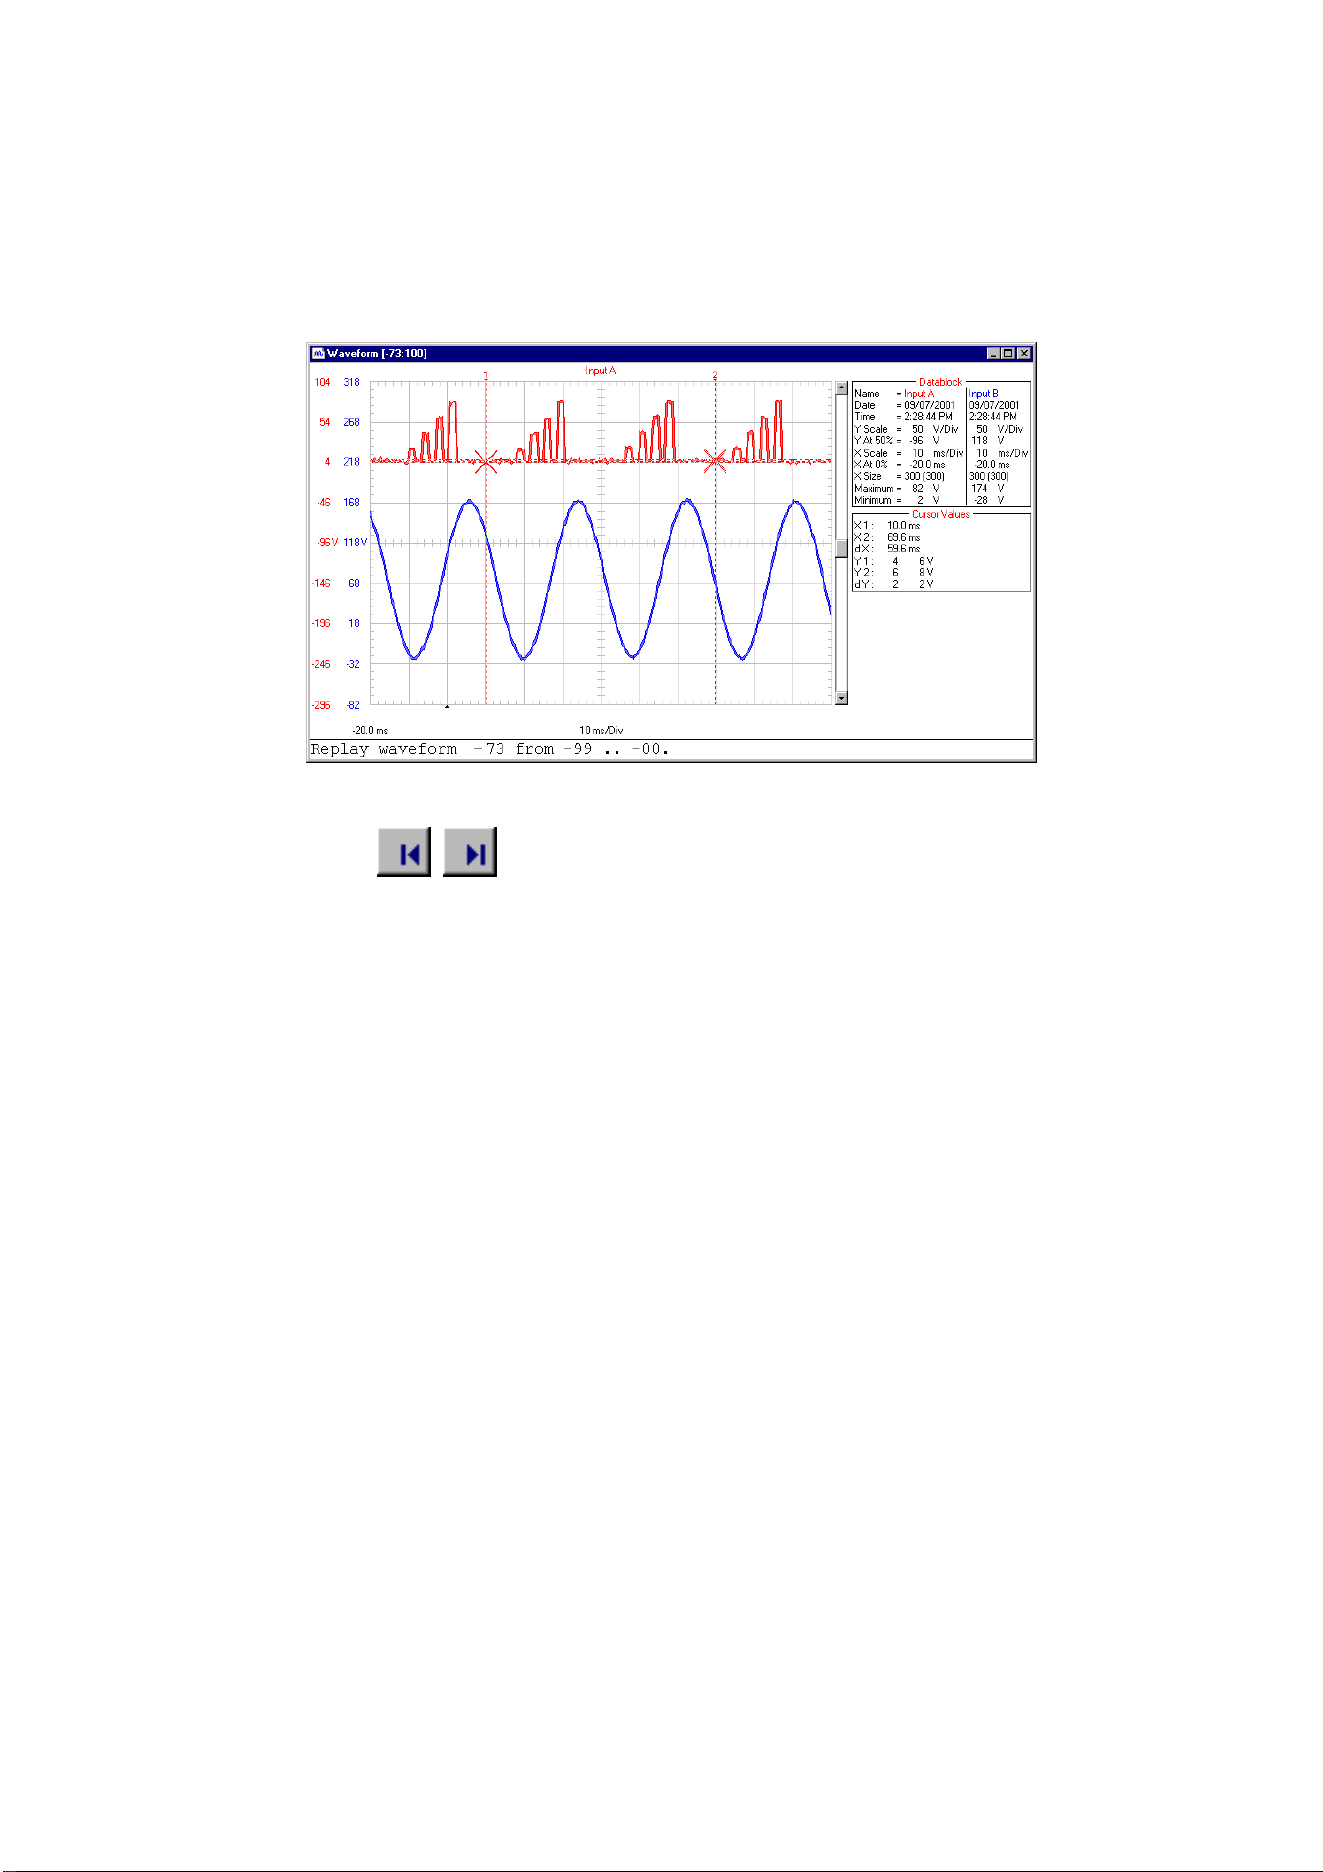
To change the window to your preference:
5
Click to view the previous or next replay
waveform.
You can also choose View - Replay to scan
through the replay sequence of waveforms.
6 Select Options - Add Description and type a description
in the text box below the window (max. 10 lines).
7 Select Options - Title to change the title of the window.
8 Select Options - Colors to change window colors.
1.888.610.7664 sales@GlobalTestSupply.com
Fluke-Direct
.com

SW90W Users Manual
24
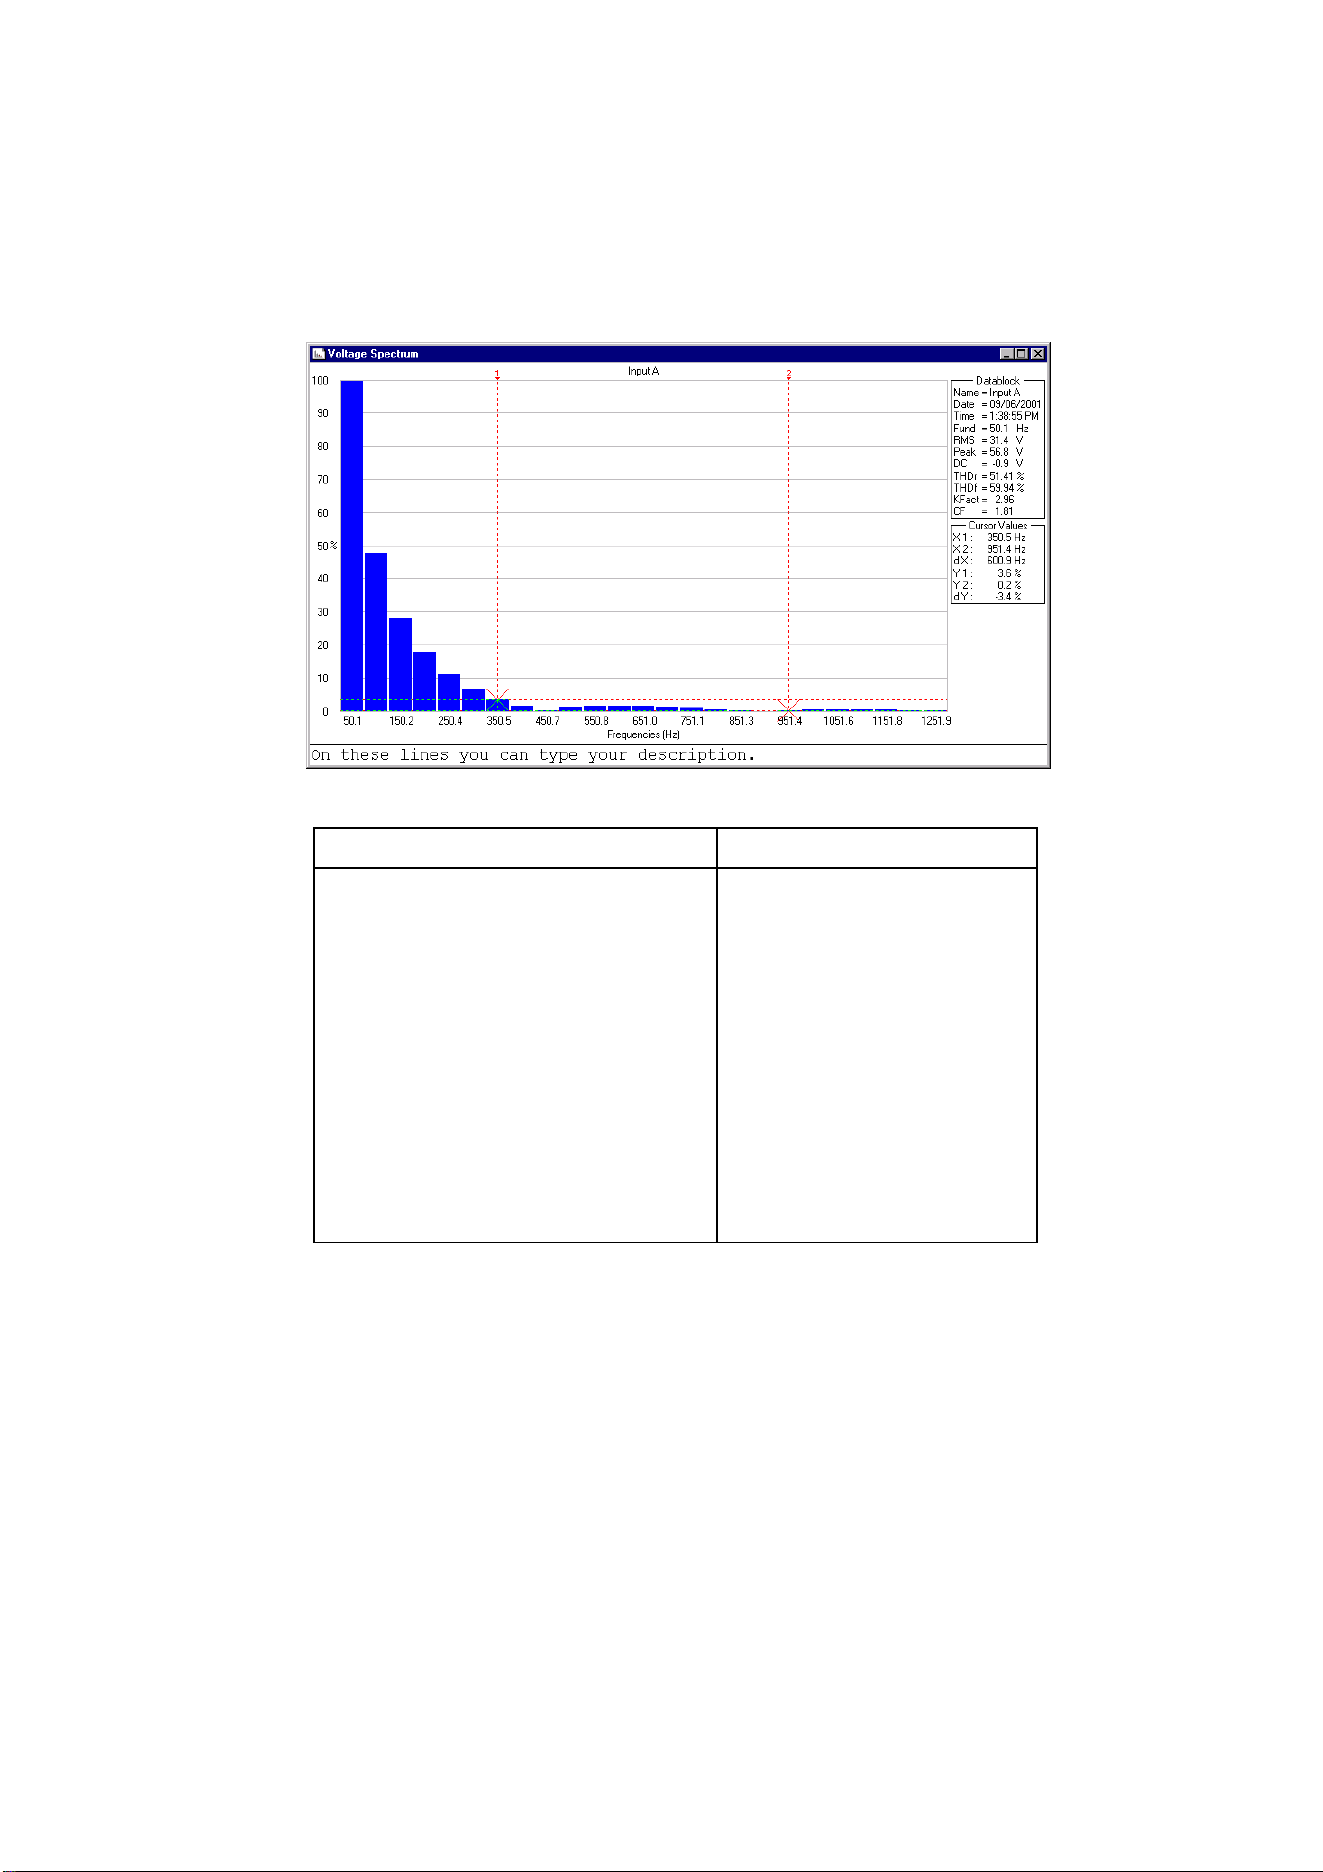
Generating an FFT-Spectrum from a Waveform
For spectrum calculations, a repetitive waveform or a waveform
that contains repetitive components is superposed of a fixed
offset value (DC component) and a number of sine waves. The
spectrum shows the amplitude and frequency of each sine wave
as a bar-graph. The value of the DC component is shown in the
datablock.
1 Select the waveform from which you want to generate a
spectrum.
In a multiple waveform window, select View - Active
Waveform or click with the mouse to choose the active
waveform.
2 Select Tools - Spectrum. The Spectrum is created and
displayed in a spectrum window.
To change the window to your preference:
3 Select Options - Add Description and type a description
in the text box below the window (max. 10 lines).
4 Select View - Datablock to show the data block.
5 Select View - Cursors to show the cursors.
6 Select Options - Colors to change spectrum colors.
See the next page for an example of a spectrum window.
Tips
• To change window titles, select Options - Titles
• To change the scaling, select Options - Scales
• To show or hide the description, select View -
Description
1.888.610.7664 sales@GlobalTestSupply.com
Fluke-Direct
.com
SW90W Users Manual
25
Use the mouse or (Shift) ß
ßß
ß à
àà
à keys to move the cursors.
Datablock Cursor Values
Name : Name of the spectrum
Date : Date of the waveform
Time : Time of the waveform
Fund : Fundamental frequency
RMS : Root Mean Square
Peak : Maximum value
DC : Direct Current value
THDr : Total Harmonic Distortion
(RMS)
THDf : Total Harmonic Distortion
(Fund)
KFact : K-factor
CF : Crest factor (Peak/RMS)
X1 : Frequency (or
Harmonic Number)
at cursor 1
X2 : Frequency (or
Harmonic Number)
at cursor 2
dX : X2 - X1
Y1 : Spectrum value at
cursor 1
Y2 : Spectrum value at
cursor 2
dY : Y2 - Y1
Note
The Date and Time formats depend on the Windows
®
settings.
1.888.610.7664 sales@GlobalTestSupply.com
Fluke-Direct
.com
SW90W Users Manual
26
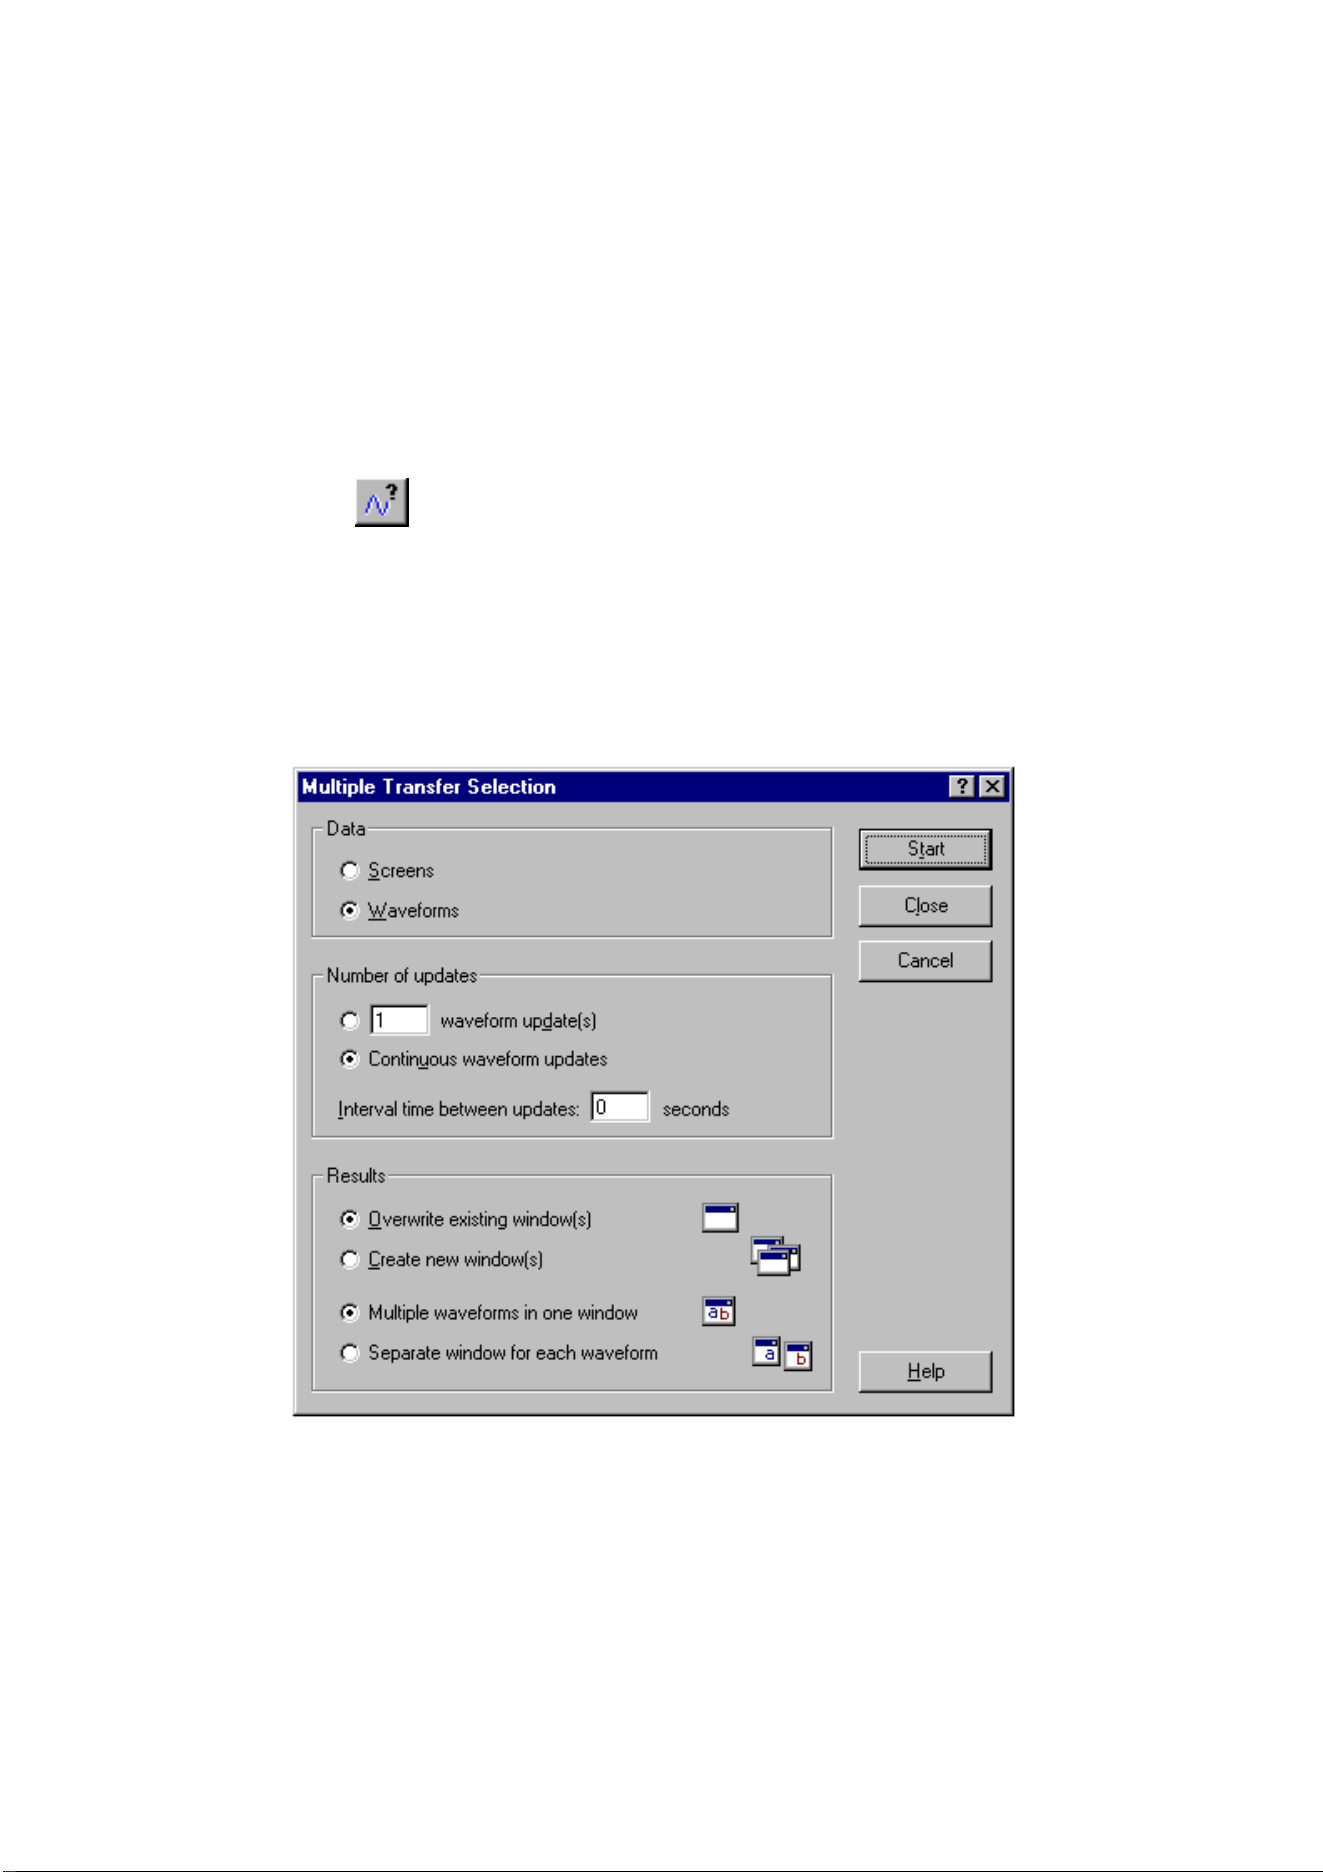
Automatic Spectrum Updates
To get continuous updates of a waveform and spectrum, do the
following:
1 Click to select and display the waveform from which
to create a spectrum.
2 Select Tools - Spectrum to create a spectrum from the
waveform.
3 Select Window - Auto Tile to tile the waveform and
spectrum window on the PC screen.
4 Select Instrument - Multiple Transfers. A dialog box
appears.
1.888.610.7664 sales@GlobalTestSupply.com
Fluke-Direct
.com

SW90W Users Manual
27
5 Choose Continuous waveform update(s) and Overwrite
existing window(s).
6
Click Start to get continuous waveform and spectrum
updates.
1.888.610.7664 sales@GlobalTestSupply.com
Fluke-Direct
.com
SW90W Users Manual
28
Logging Readings
Graphing Readings
You can transfer and graph readings taken by the ScopeMeter
test tool over a period of time. Up to four types of readings can
be displayed in a window.
To demonstrate this, four types of readings will be logged.
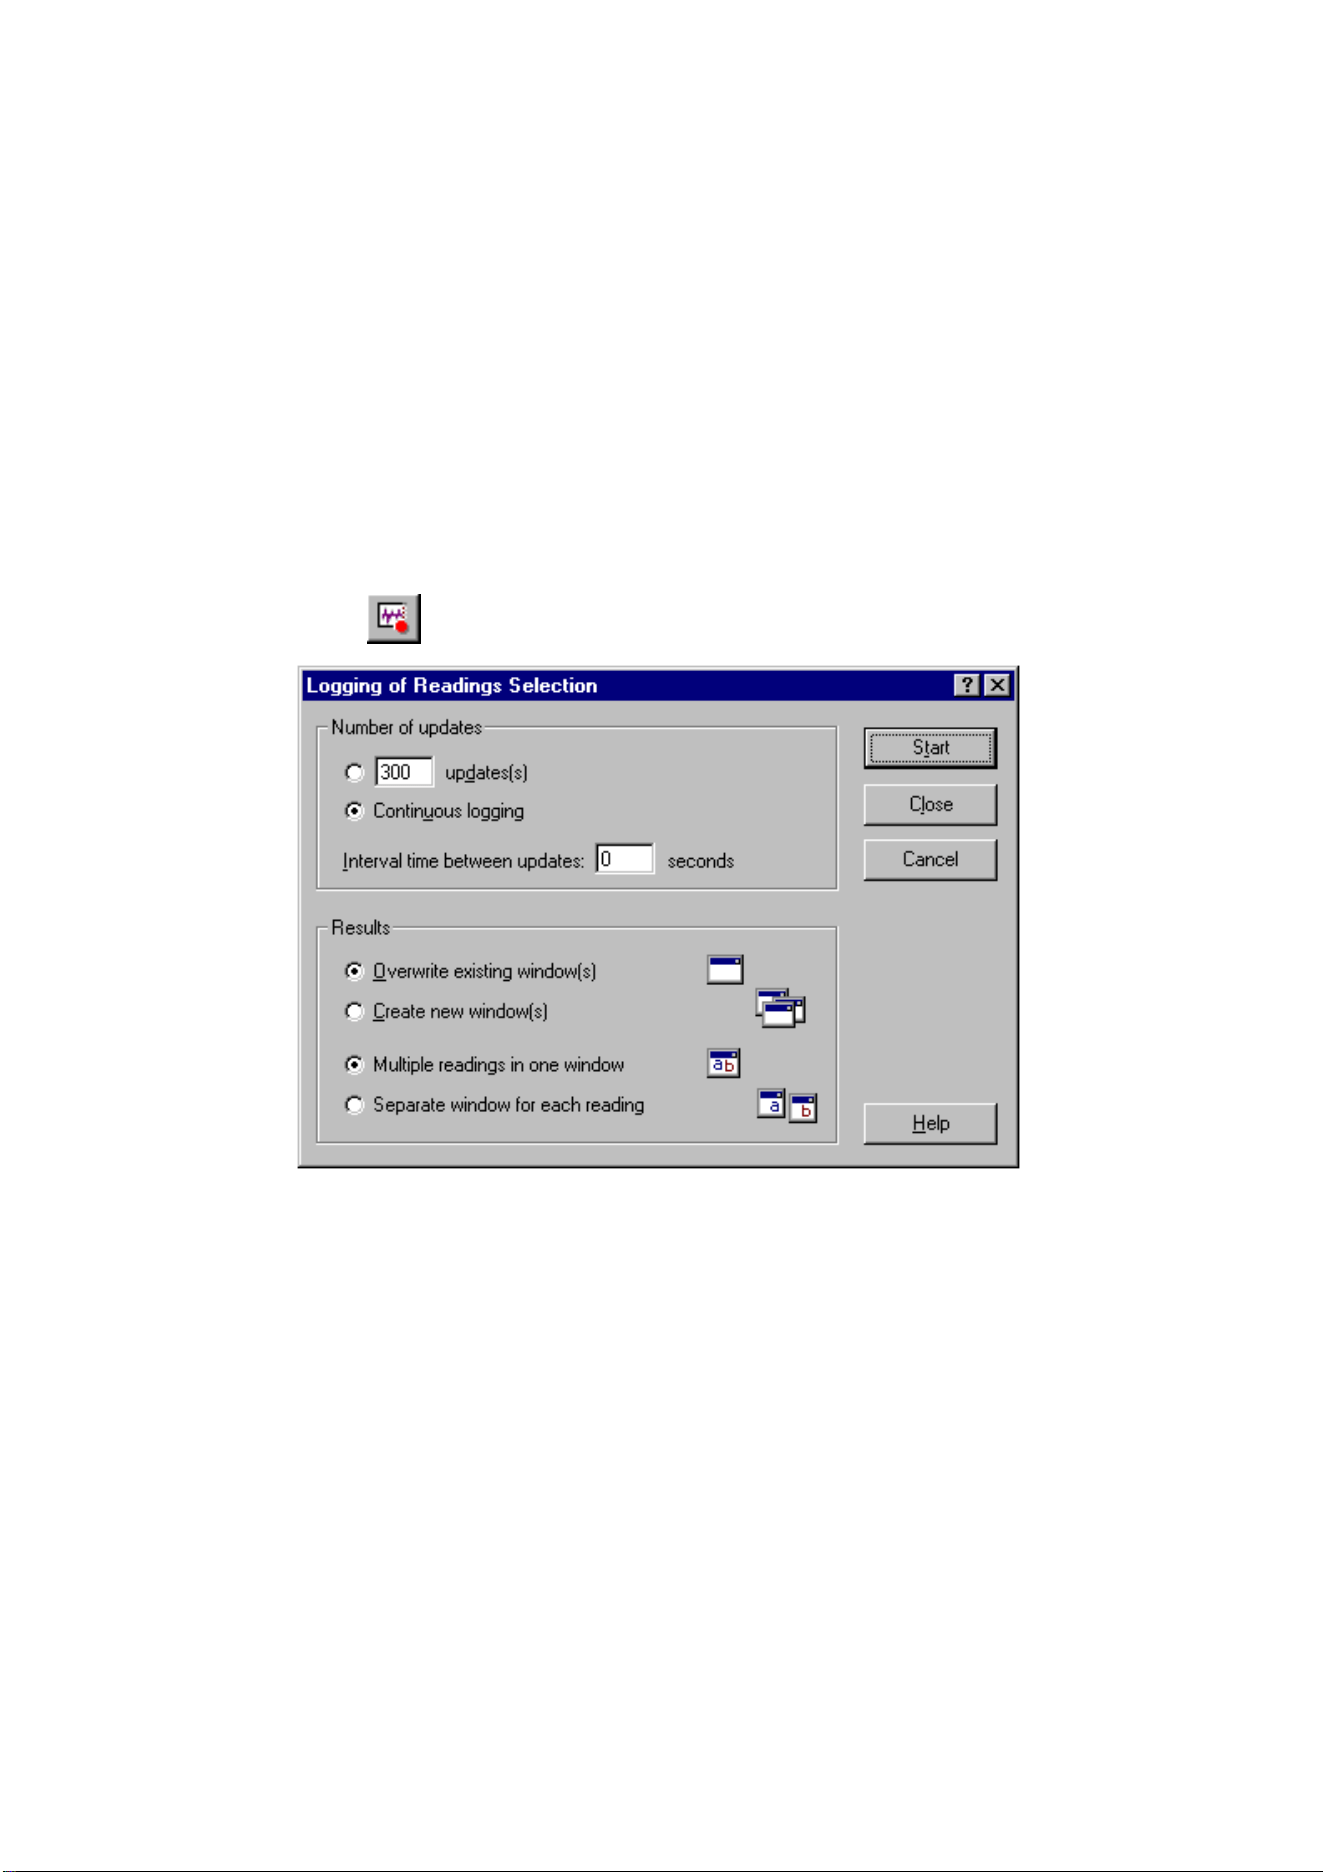
1
Click. A dialog box appears allowing you to select
the logging parameters.
2 Set Interval time to three seconds, and choose
Continuous logging, Overwrite existing window(s), and
Multiple readings in one window.
3 Click Start. A dialog box appears allowing you to select the
type of readings you want to log.
1.888.610.7664 sales@GlobalTestSupply.com
Fluke-Direct
.com
SW90W Users Manual
29
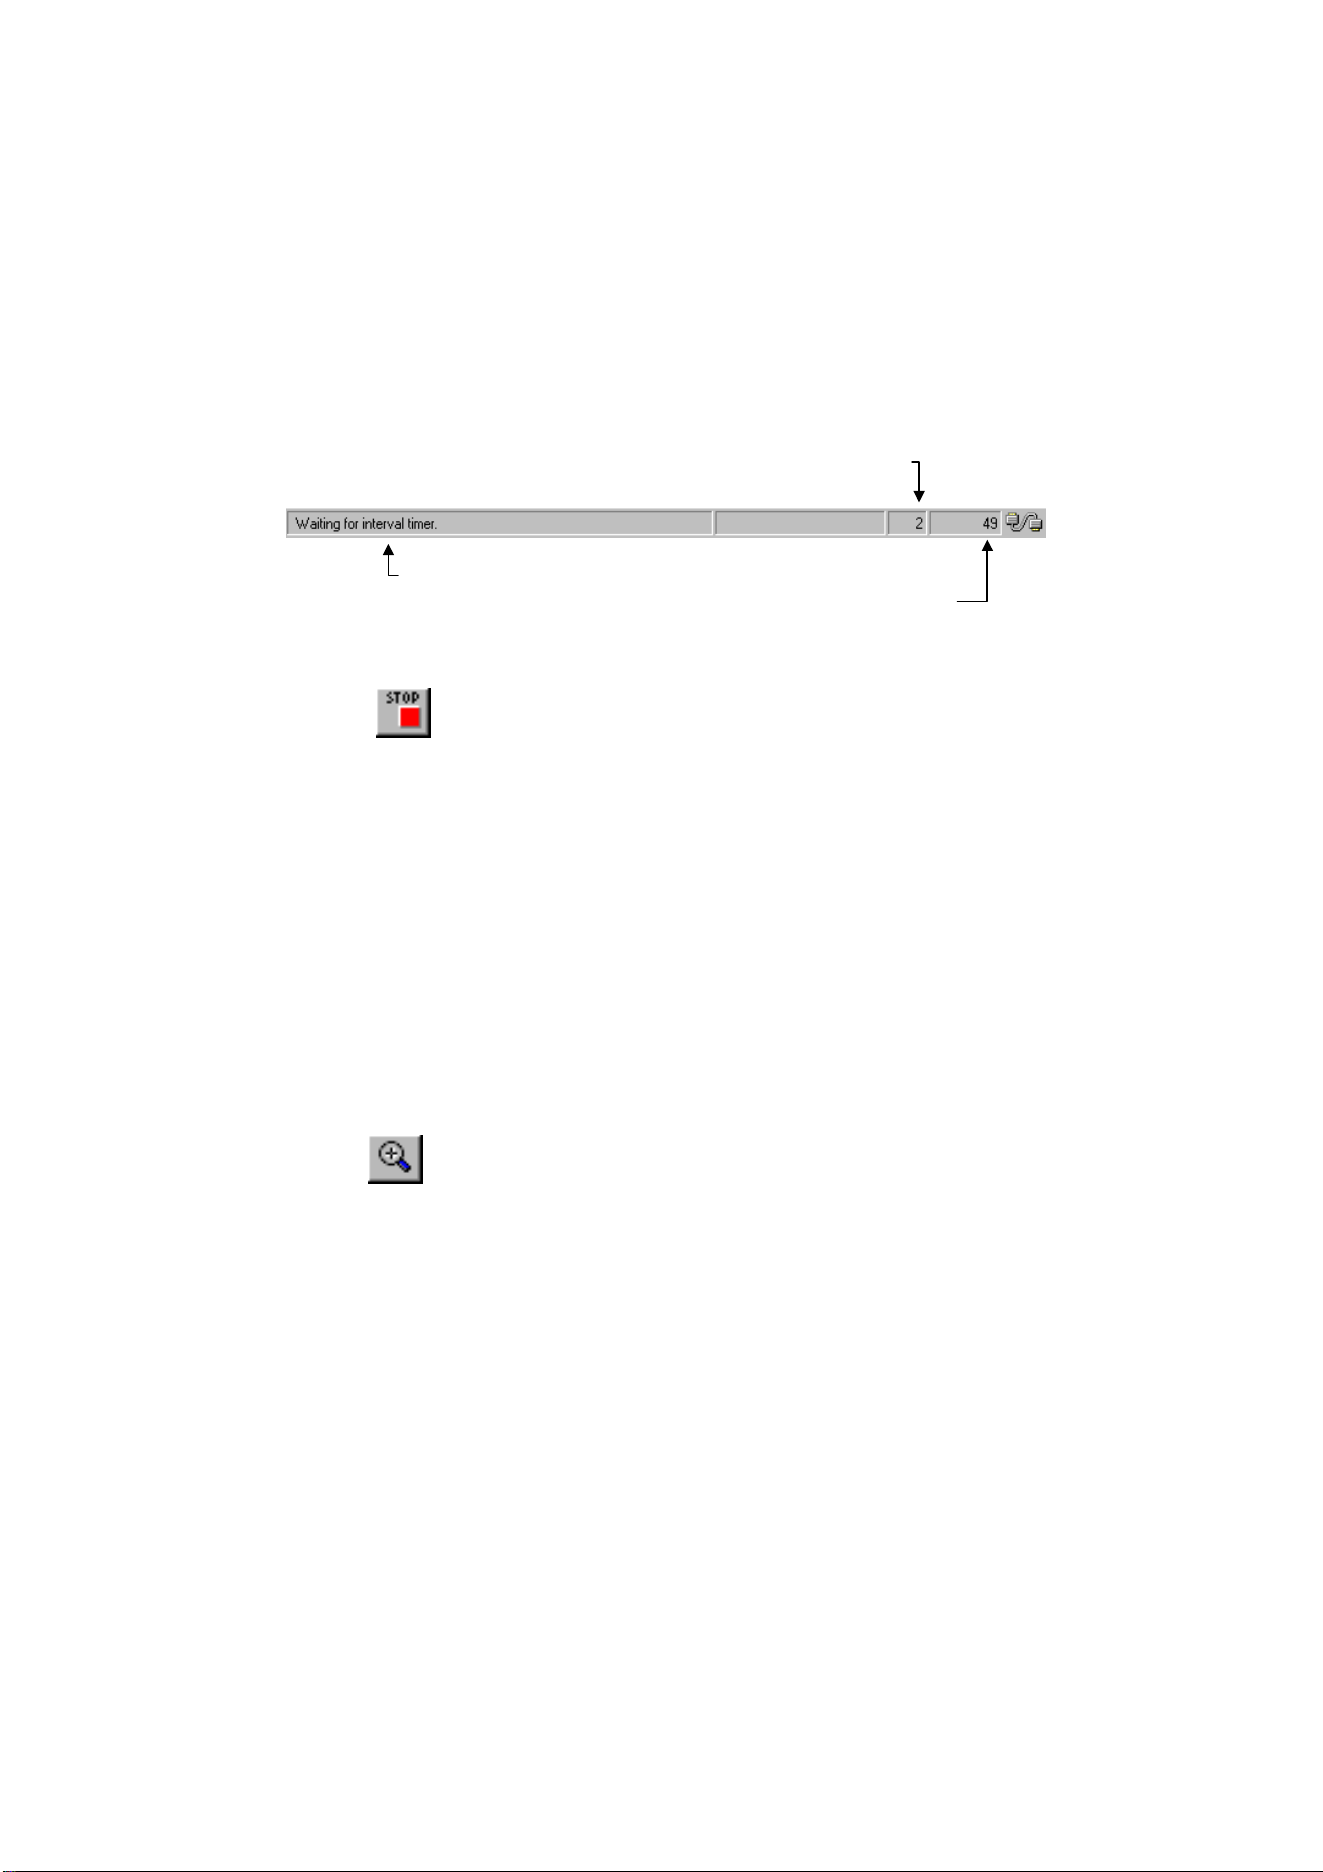
4
Click Start to start logging. The status bar shows the
logging progress.
5
Click to stop logging.
To change the window to your preference:
6 Select View - Datablock to show the datablock.
7 Select View - Cursors to display the cursors.
8 Select Options - Add Description and type a description
in the text box below the window (max. 10 lines).
9 Select Options - Colors to change waveform colors.
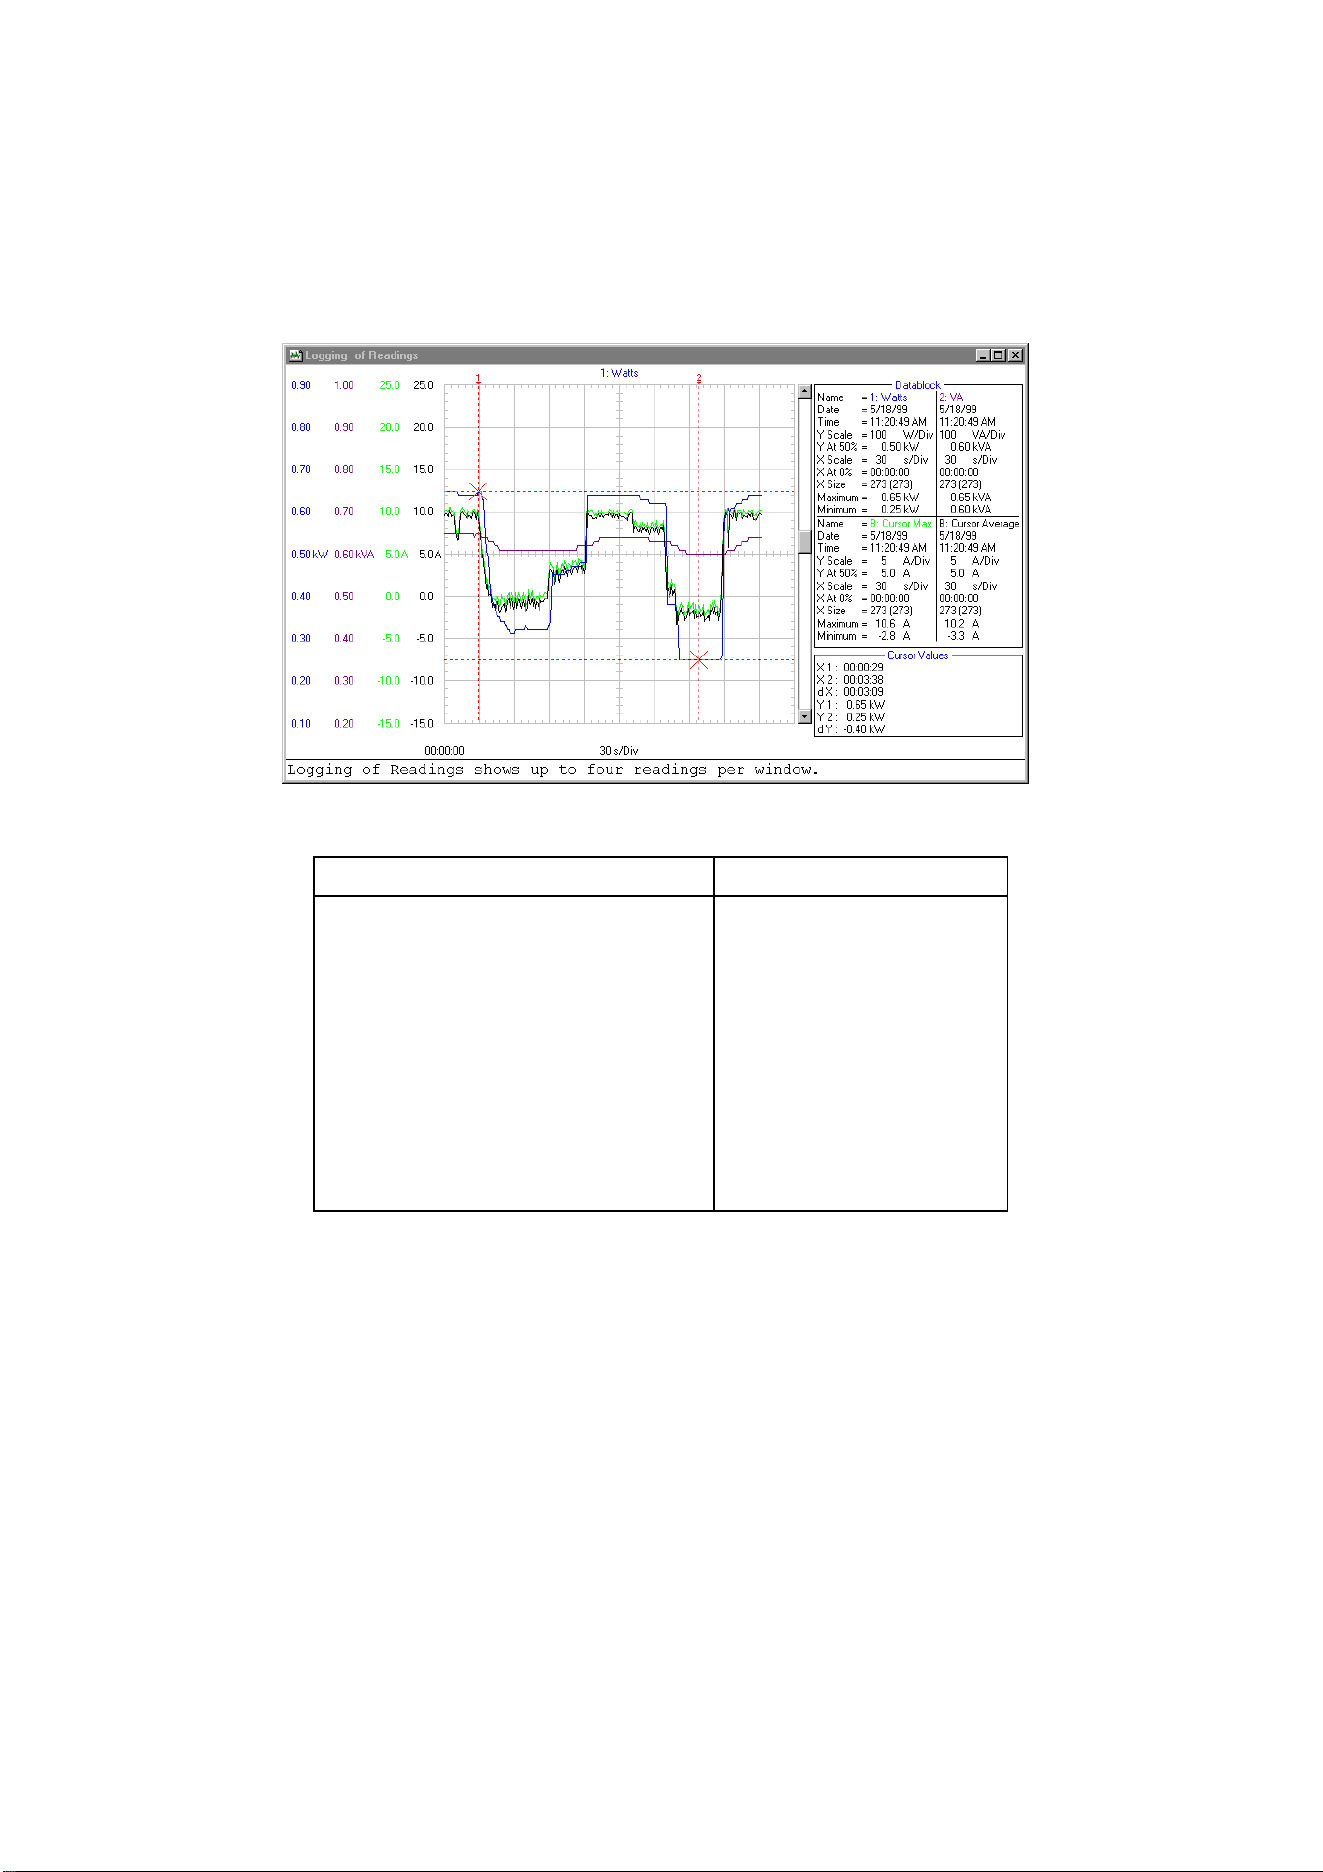
See the next page for an example of logged readings in a
waveform window.
Tips
Click to zoom in on a part of a waveform.
• To change window titles, select Options - Titles.
• To show or hide the description, select View -
Description.
• To create a spectrum from a waveform of
readings, select Tools - Spectrum.
Countdown of the interval time
Text showing the logging status
N
umber of readings so fa
r
1.888.610.7664 sales@GlobalTestSupply.com
Fluke-Direct
.com
SW90W Users Manual
30
Use the mouse or (Shift) ß
ßß
ß à
àà
à keys to move the cursors.
Datablock Cursor Values
Name : Name of the waveform
Date : Date of the waveform
Time : Time of the waveform
Y Scale : Vertical scale
Y At 50% : Vertical position
X Scale : Horizontal scale
X At 0% : Horizontal position
X Size : Shown (Total) number
of waveform points
Maximum : Maximum value
Minimum : Minimum value
X1 : Time at cursor 1
X2 : Time at cursor 2
dX : X2 - X1
Y1 : Readings value at
cursor 1
Y2 : Readings value at
cursor 2
dY : Y2 - Y1
Notice that values apply
to the active waveform.
Note
The Date and Time formats depend on the Windows
®
settings.
1.888.610.7664 sales@GlobalTestSupply.com
Fluke-Direct
.com

SW90W Users Manual
31
Inserting Readings into a Spreadsheet
1 Click on the waveform of readings you want to insert.
2 Select Edit - Copy Data to copy the reading's data to the
clipboard.
3 Switch to a spreadsheet program.
4 Open or create a worksheet and place the cursor where
you want to insert the data.
5 Select Edit - Paste to insert the data into the worksheet
with the numerical readings arranged in columns.
6
Click to save your spreadsheet.
Note
You can insert waveform and spectrum points into a
spreadsheet in the same way.
1.888.610.7664 sales@GlobalTestSupply.com
Fluke-Direct
.com
SW90W Users Manual
32
Transferring Instrument Setups
Reading/Saving Setups from/to File
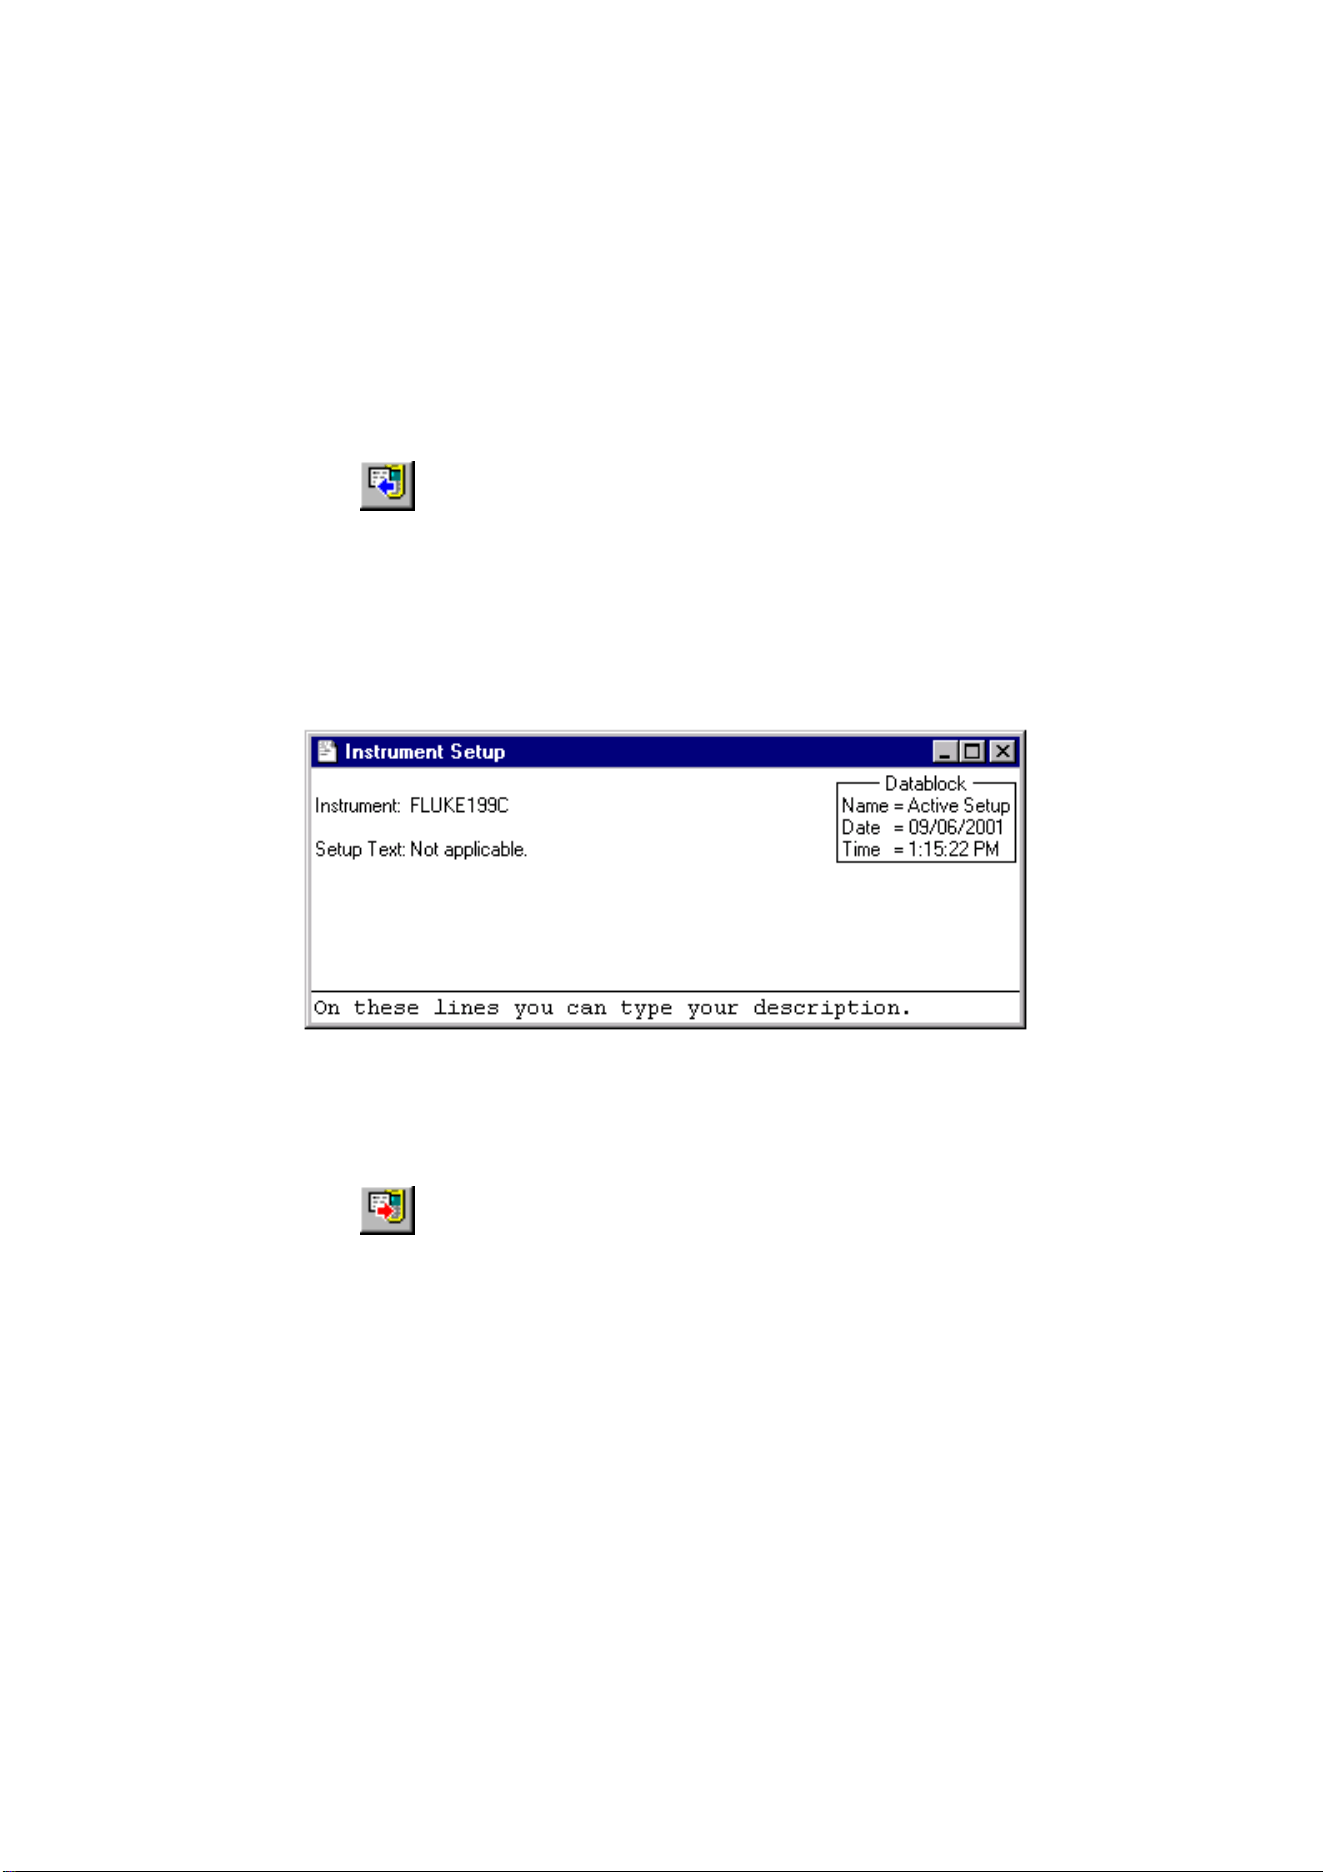
1
Click to read the active setup or setups from
ScopeMeter memories.
2 Select Options - Add Description and type a description
in the text box below the window (max. 10 lines).
3 Select Options - Title to change the title of the window.
4 Select View - Datablock to show the datablock.
5 Select Options - Colors to change window colors.
Each ScopeMeter setup appears in a separate setup window.
If available from the ScopeMeter test tool, the Setup Text box
shows setup information.
6
Click to send the setups from the selected setup
windows to ScopeMeter memories.
1.888.610.7664 sales@GlobalTestSupply.com
Fluke-Direct
.com

SW90W Users Manual
33
Saving/Recalling the Active Setup to/from ScopeMeter
1 Select Instrument - Remote Control. A dialog box
appears.
2 Click Save Setup. A dialog box appears.
3 Click on the down arrow to display the list with setup
memories.
4 Click on the memory location in which you want to save
the active setup.
5 Click Save to send the setup to the selected memory.
The active ScopeMeter setup has been saved in a ScopeMeter
memory.
6 Click Recall Setup. A dialog box appears.
7 Click on the down arrow to display the list with setup
memories.
8 Click on the memory location that contains the setup you
want to make active.
9 Click Recall to recall the new active setup.
The active ScopeMeter setup has been recalled from a
ScopeMeter memory.
Click Close to close the dialog box.
1.888.610.7664 sales@GlobalTestSupply.com
Fluke-Direct
.com

SW90W Users Manual
34
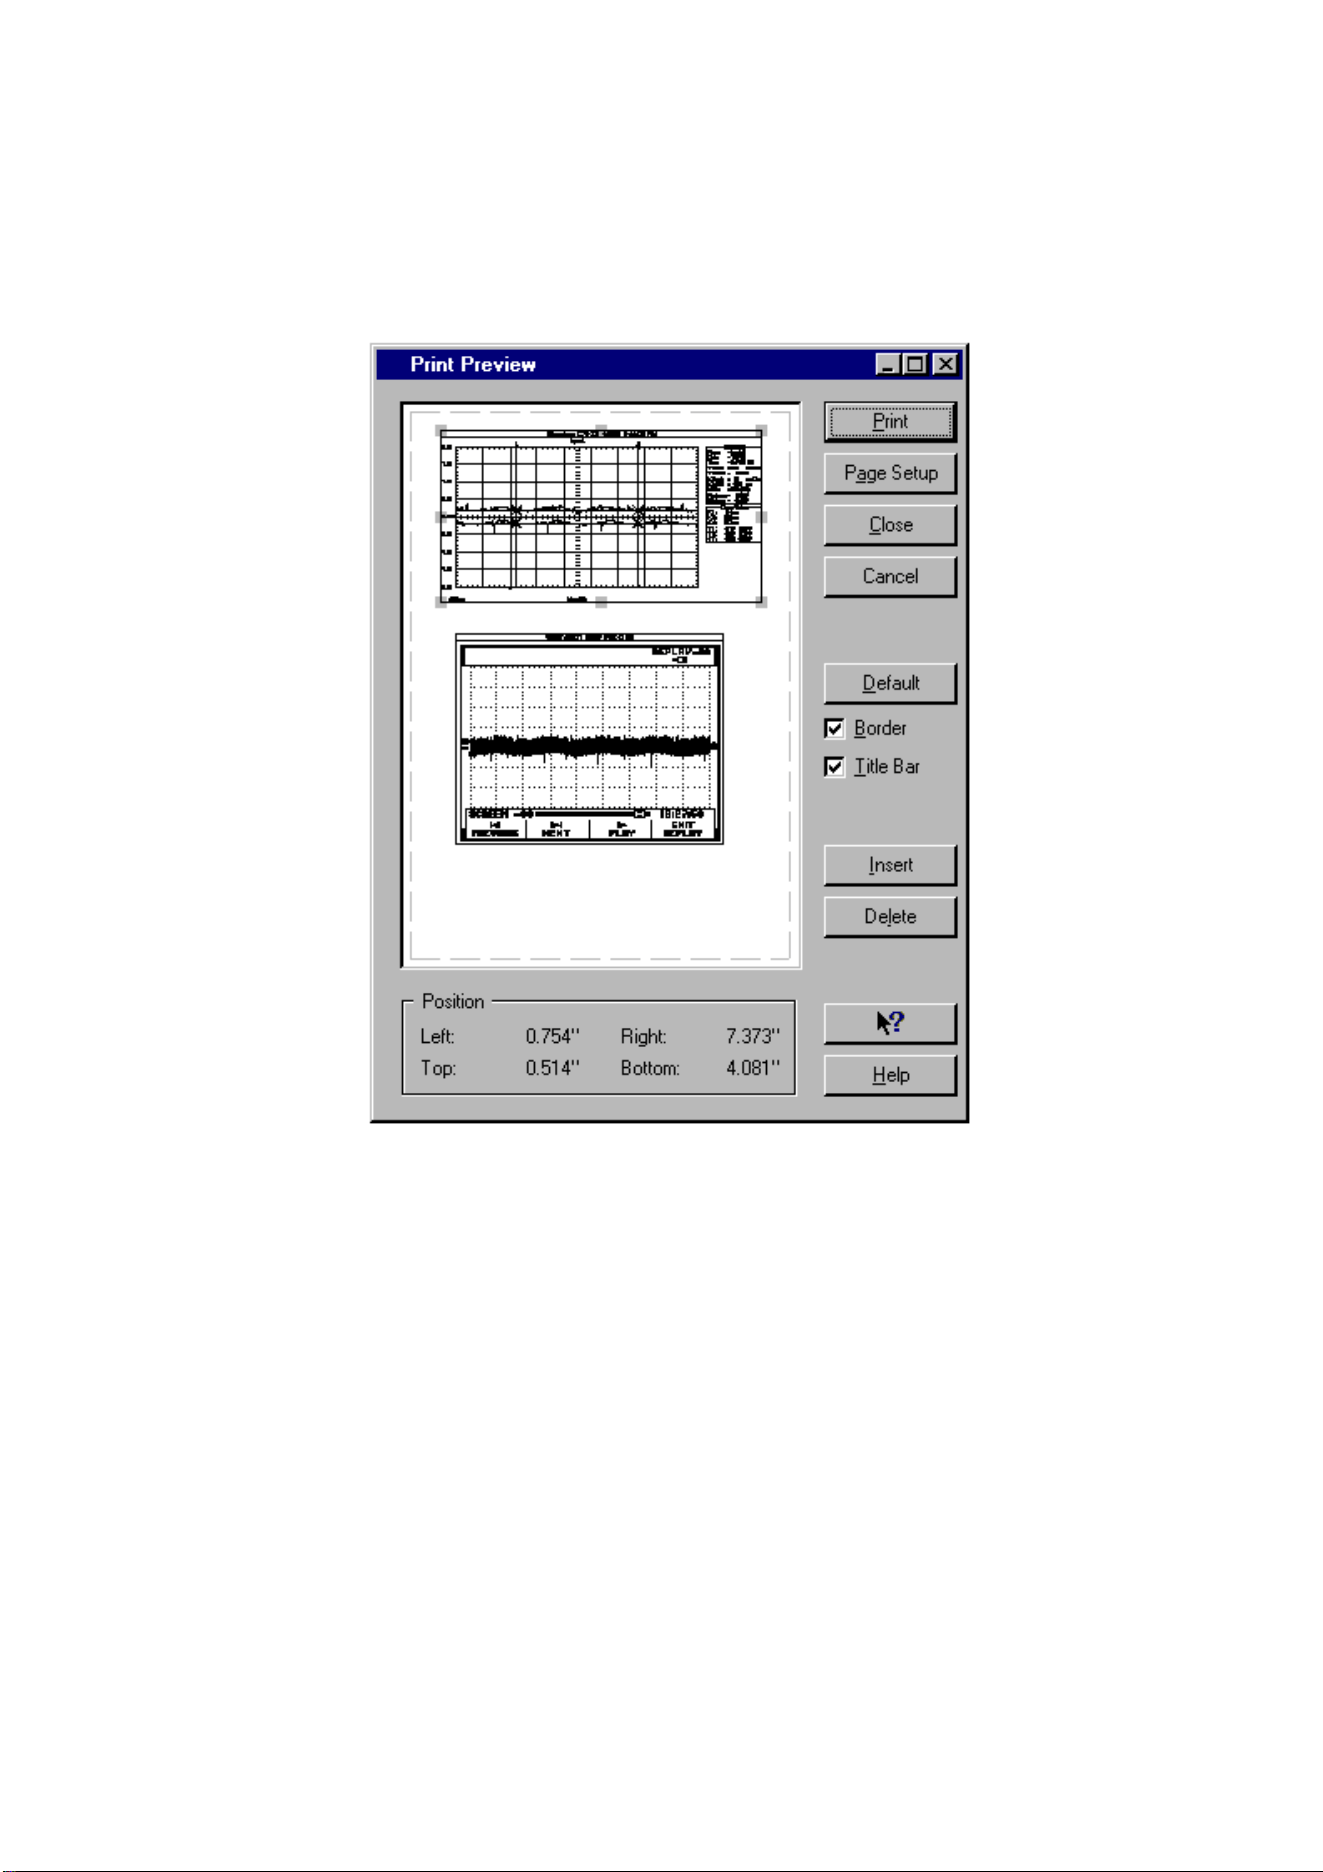
Printing Windows
The Print Preview function enables you to preview any
combination of screen, waveform, readings, spectrum, and setup
windows on a page before printing.
1 Click on the window you want to print.
2
Click to preview the window on the page.
See next page for the window.
3 Choose Border to add a border around the active window.
4 Choose Title Bar to add the title of the active window.
5 Click Insert to add more windows on a page. A dialog box
appears allowing you to select another window.
6 Click Page Setup to change the page setup
7 Click Print to start printing the window(s).
To change printer settings, select File - Print Setup.
1.888.610.7664 sales@GlobalTestSupply.com
Fluke-Direct
.com
SW90W Users Manual
35
1.888.610.7664 sales@GlobalTestSupply.com
Fluke-Direct
.com
SW90W Users Manual
36
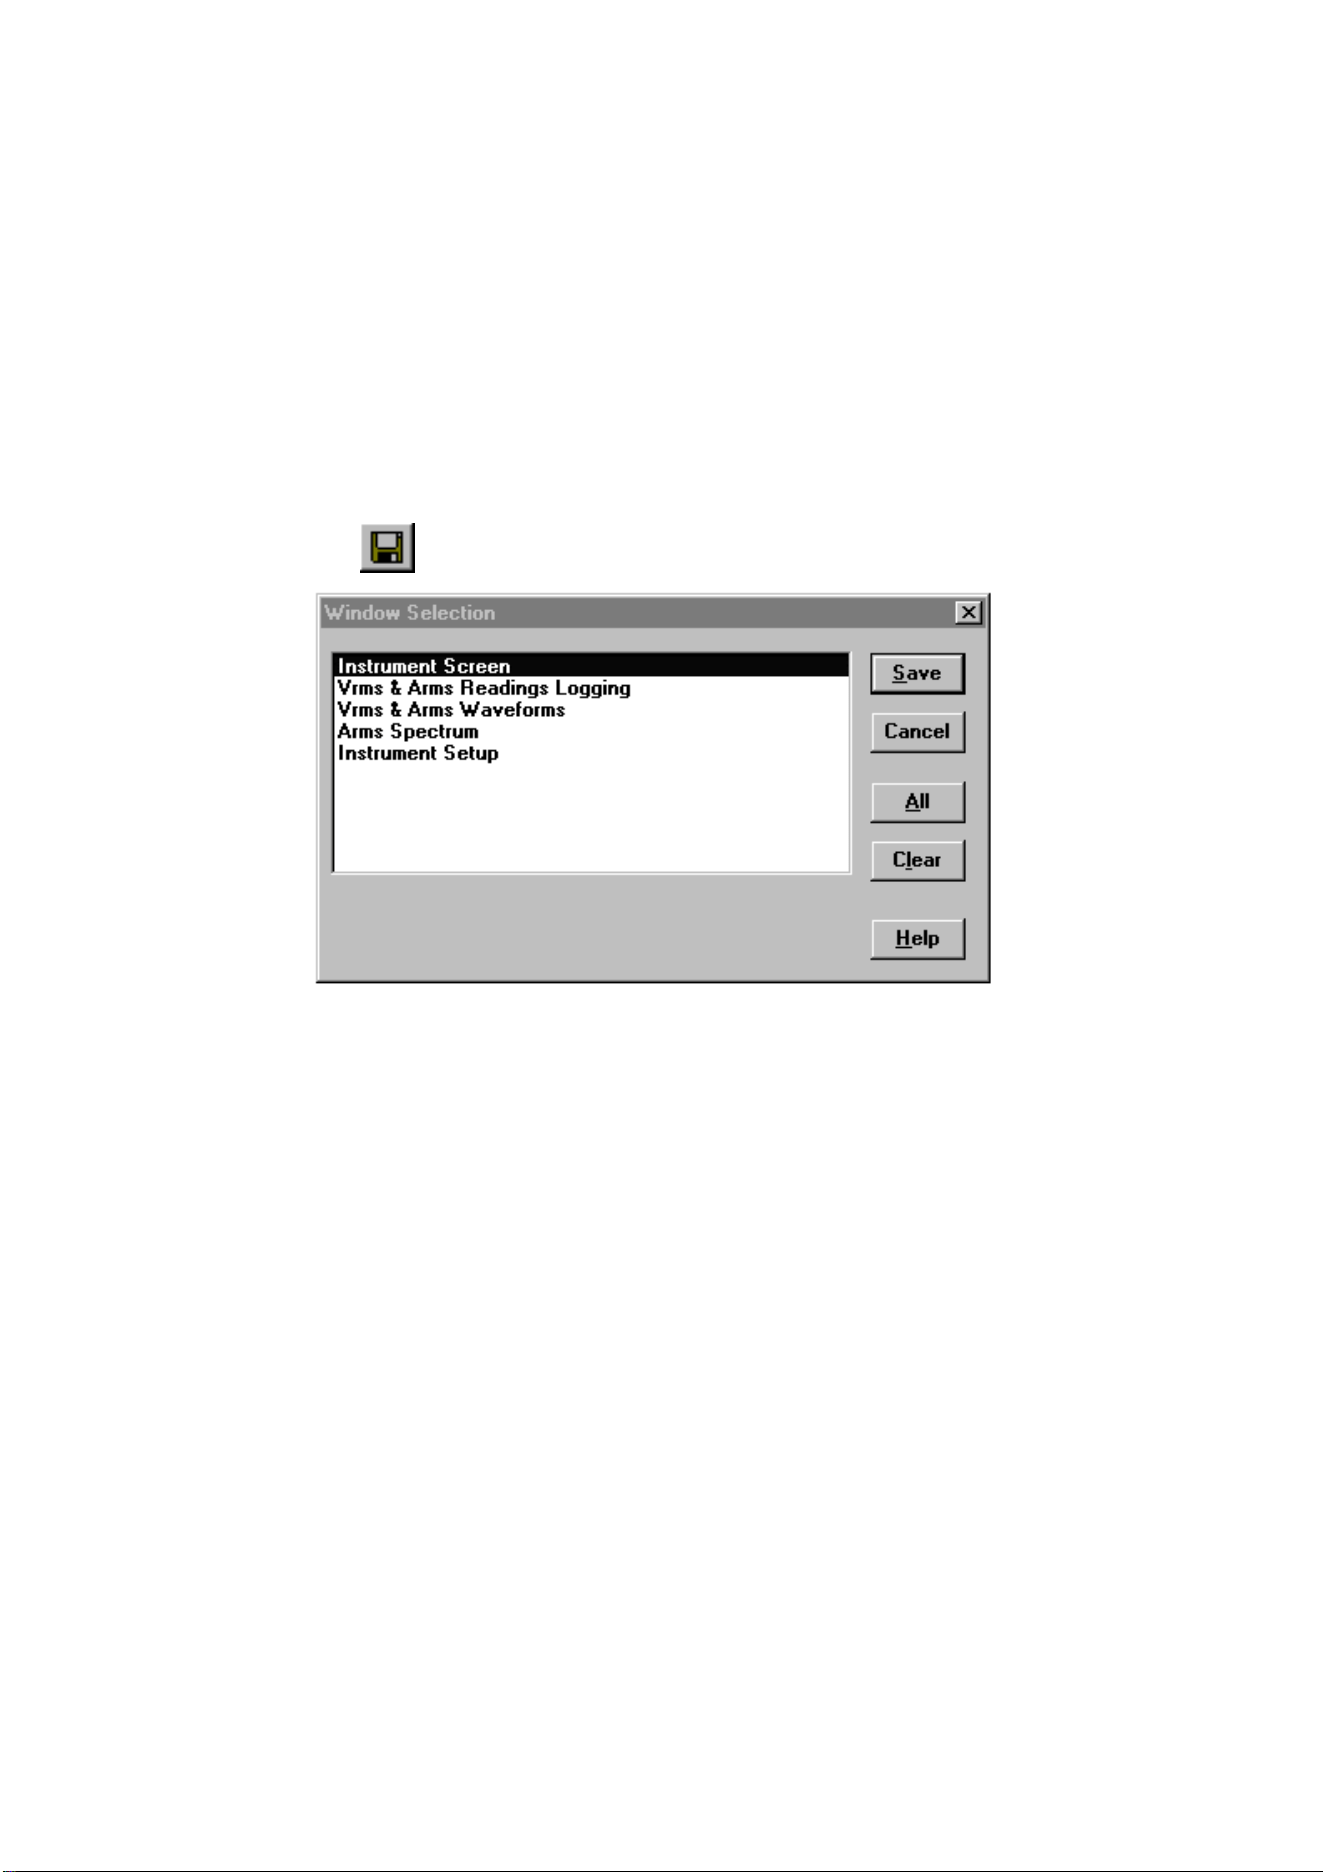
Saving Windows to a File
You can save any combination of screen, waveform, readings,
spectrum, and setup windows to an FVF file.
1 Click on the window you want to save.
2
If there are more windows, a dialog box appears.
3 Select the windows of your choice or click All to select all
windows.
Click Save. Another dialog box appears.
4 Enter a name for the file in the File Name box (FVF is
default file type).
5 Click OK to start saving the windows you selected to the
file.
For more information on saving to a file, select Index - File
Formats from the Help menu.
1.888.610.7664 sales@GlobalTestSupply.com
Fluke-Direct
.com
SW90W Users Manual
37
Appendix A
Optically Isolated RS-232
Interface (optional)
Interface Connections
1.888.610.7664 sales@GlobalTestSupply.com
Fluke-Direct
.com

SW90W Users Manual
38
Interface Specifications
Type of interface:
RS-232 / EIA-232-D, optically isolated
States:
• SPACE = 0 Light
• MARK = 1 No light
Wavelength = 800 nm
RXD signal levels:
• SPACE = +10V to +4V Max. input = +15V
• MARK = -4V to -10V Min. input = -15V
Other signal levels:
• SPACE = +12V to +7V Max. input = +15V
• MARK = -7V to -12V Min. input = -15V
Handshake method:
X
ON/XOFF, software handshake only
Environmental:
• Meets requirements of MIL-T-28800D Type III, Class 3
• Temperature: Operating = 0 °C to +50 °C
Storage = -20 °C to +70 °C
Mechanical:
• Cable length = 1.5 m
• Weight = 0.14 kg
1.888.610.7664 sales@GlobalTestSupply.com
Fluke-Direct
.com
SW90W Users Manual
39
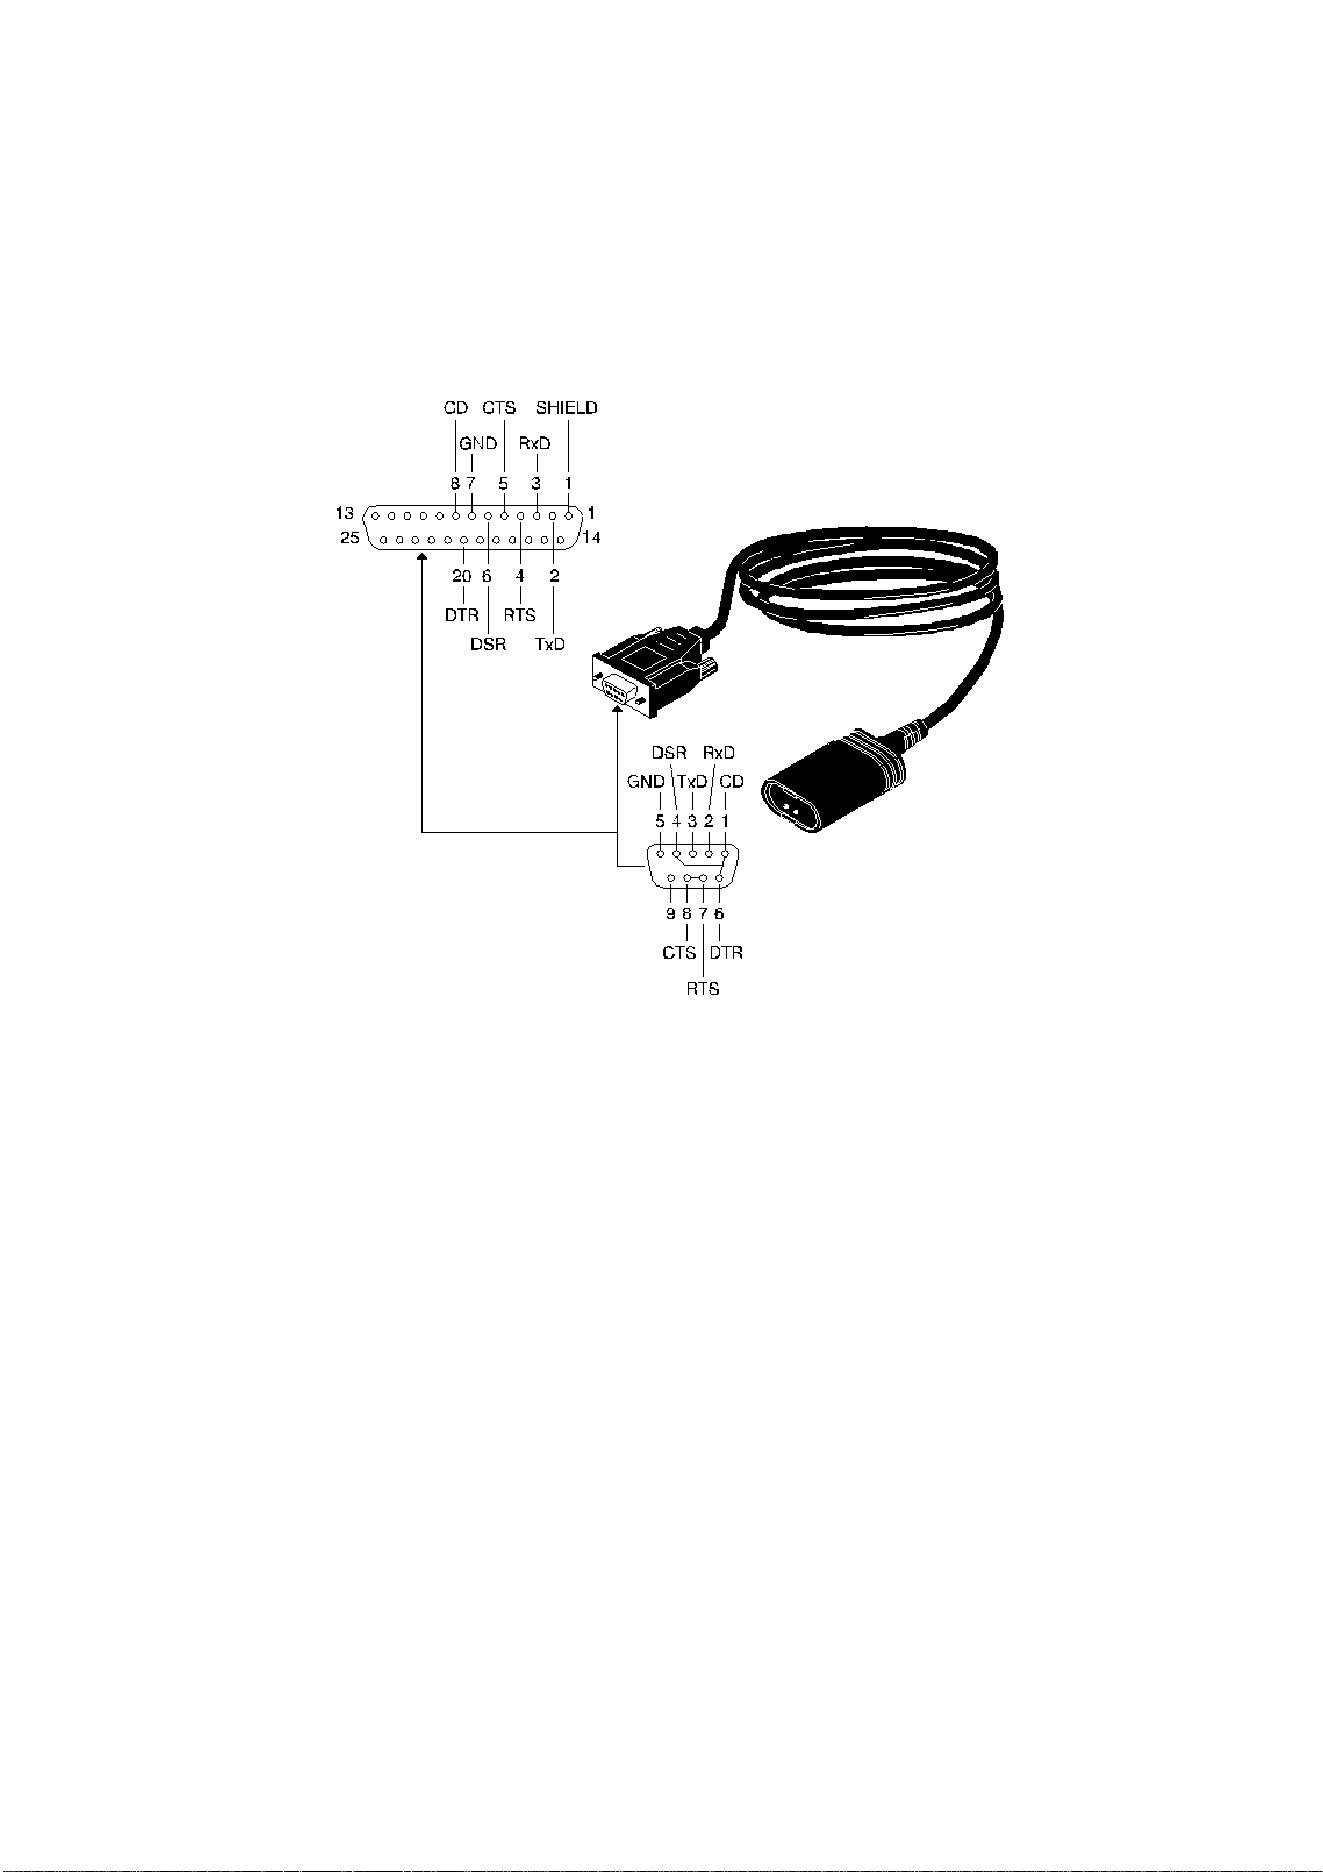
Interface Cable
1.888.610.7664 sales@GlobalTestSupply.com
Fluke-Direct
.com

SW90W Users Manual
40
Warranty
LIMITED WARRANTY & LIMITATION OF LIABILITY
This Fluke product will be free from defects in material and
workmanship for three years from the date of purchase. This
warranty does not cover damage from accident, neglect, misuse
or abnormal conditions of operation or handling. Resellers are
not authorized to extend any other warranty on Fluke’s behalf.
To obtain service during the warranty period, send your defective
product to the nearest Fluke Authorized Service Center with a
description of the problem. Fluke warrants that software will
operate substantially in accordance with its functional
specifications for 90 days and that it has been properly recorded
on non-defective media. Fluke does not warrant that software
will be error free or operate without interruption.
THIS WARRANTY IS YOUR ONLY REMEDY. NO OTHER
WARRANTIES, SUCH AS FITNESS FOR A PARTICULAR
PURPOSE, ARE EXPRESSED OR IMPLIED. FLUKE IS NOT
LIABLE FOR ANY SPECIAL, INDIRECT, INCIDENTAL OR
CONSEQUENTIAL DAMAGES OR LOSSES, ARISING FROM
ANY CAUSE OR THEORY.
Since some states or countries do not allow the exclusion or
limitation of an implied warranty or of incidental or consequential
damages, this limitation of liability may not apply to you.
1.888.610.7664 sales@GlobalTestSupply.com
Fluke-Direct
.com

SW90W Users Manual
41
Index
A
Active Waveform ..............................................................................24
Analyzing Waveforms.......................................................................18
Automatic Spectrum Updates...........................................................26
B
Bitmap-graphics..................................................................................7
C
Cable
RS-232..........................................................................................39
Colors ...........................................................13, 16, 19, 23, 24, 29, 32
COM Port............................................................................................3
Continuous Waveform and Spectrum Updates................................27
Continuous waveform update(s) ................................................27, 28
Crest-factor.......................................................................................25
Cursor Values.......................................................................20, 25, 30
Cursors .................................................................................19, 24, 29
D
Datablock......................................................19, 20, 24, 25, 29, 30, 32
DC ..............................................................................................24, 25
Description....................................................13, 16, 19, 23, 24, 29, 32
Document .........................................................................................17
F
FFT-Spectrum ..................................................................................24
Fundamental Frequency...................................................................25
FVF File ............................................................................................36
1.888.610.7664 sales@GlobalTestSupply.com
Fluke-Direct
.com

SW90W Users Manual
42
G
Graphics............................................................................................. 7
Graphing Readings .......................................................................... 28
H
Help.................................................................................................... 4
I
Installing FlukeView ........................................................................... 1
Instrument Screen........................................................................ 7, 13
Instrument Setup........................................................................ 10, 32
Interface Cable................................................................................. 39
Interface Specifications .................................................................... 38
K
K-factor............................................................................................. 25
L
Logging Readings ............................................................................ 28
M
Meta-graphics .................................................................................... 8
More Windows on a Page................................................................ 34
Multiple readings in one window ...................................................... 28
Multiple Transfers................................................................. 13, 19, 26
O
Online Help ........................................................................................ 4
Overwrite Existing Window ........................................................ 27, 28
1.888.610.7664 sales@GlobalTestSupply.com
Fluke-Direct
.com

SW90W Users Manual
43
P
Peak .................................................................................................25
Print Preview.....................................................................................34
Print Setup........................................................................................34
Printing Windows..............................................................................34
Print-Preview Window ......................................................................34
R
Ratio 4:3 ...........................................................................................15
Read Instrument Setups...................................................................32
Readings ......................................................................................9, 28
Readings Window ............................................................................30
Replay screens.................................................................................15
Replay waveforms ............................................................................22
RMS..................................................................................................25
RS-232 Cable ...................................................................................39
S
Saving Windows to a File .................................................................36
Scaling........................................................................................21, 24
Screen ..........................................................................................7, 13
Screen Window ................................................................................14
Selection Window.............................................................................36
Send Instrument Setups ...................................................................32
Serial Cable ......................................................................................39
Setup ..........................................................................................10, 32
Setup Window ..................................................................................32
Spectrum ..........................................................................................24
Spectrum Window ............................................................................25
Spreadsheet .....................................................................................31
T
Test Report.......................................................................................11
THDf .................................................................................................25
THDr .................................................................................................25
Titles .............................................................13, 16, 19, 23, 24, 29, 32
Tools.................................................................................................24
Type of Readings .............................................................................28
1.888.610.7664 sales@GlobalTestSupply.com
Fluke-Direct
.com

SW90W Users Manual
44
V
Vector-graphics .................................................................................. 8
View - Active Waveform................................................................... 24
View - Replay ............................................................................. 16, 23
W
Waveform............................................................................... 8, 18, 28
Waveform Window........................................................................... 20
What’s This help ................................................................................ 4
Window
Waveform..................................................................................... 20
Window
Print Preview ................................................................................ 34
Readings ...................................................................................... 30
Screen .......................................................................................... 14
Selection....................................................................................... 36
Setup ............................................................................................ 32
Spectrum ...................................................................................... 25
Wordprocessor................................................................................. 17
Worksheet........................................................................................ 31
X
X At 0% ...................................................................................... 20, 30
X Scale....................................................................................... 20, 30
X Size......................................................................................... 20, 30
Y
Y At 50% .................................................................................... 20, 30
Y Scale....................................................................................... 20, 30
Z
Zooming ........................................................................................... 21
1.888.610.7664 sales@GlobalTestSupply.com
Fluke-Direct
.com