
NORMA 6003/NORMA 6003+/
NORMA 6004/NORMA 6004+
Power Analyzers
Users Manual
July 2019 Rev. 2, 3/20
(English)
© 2019-2020 Fluke Corporation. All rights reserved. Specifications are subject to change without notice.
All product names are trademarks of their respective companies.
1.888.610.7664 sales@GlobalTestSupply.com
Fluke-Direct.com

LIMITED WARRANTY AND LIMITATION OF LIABILITY
Each Fluke product is warranted to be free from defects in material and workmanship under normal use and
service. The warranty period is two years and begins on the date of shipment. Parts, product repairs, and services
are warranted for 90 days. This warranty extends only to the original buyer or end-user customer of a Fluke
authorized reseller, and does not apply to fuses, disposable batteries, or to any product which, in Fluke's opinion,
has been misused, altered, neglected, contaminated, or damaged by accident or abnormal conditions of operation
or handling. Fluke warrants that software will operate substantially in accordance with its functional specifications
for 90 days and that it has been properly recorded on non-defective media. Fluke does not warrant that software
will be error free or operate without interruption.
Fluke authorized resellers shall extend this warranty on new and unused products to end-user customers only but
have no authority to extend a greater or different warranty on behalf of Fluke. Warranty support is available only if
product is purchased through a Fluke authorized sales outlet or Buyer has paid the applicable international price.
Fluke reserves the right to invoice Buyer for importation costs of repair/replacement parts when product purchased
in one country is submitted for repair in another country.
Fluke's warranty obligation is limited, at Fluke's option, to refund of the purchase price, free of charge repair, or
replacement of a defective product which is returned to a Fluke authorized service center within the warranty
period.
To obtain warranty service, contact your nearest Fluke authorized service center to obtain return authorization
information, then send the product to that service center, with a description of the difficulty, postage and insurance
prepaid (FOB Destination). Fluke assumes no risk for damage in transit. Following warranty repair, the product will
be returned to Buyer, transportation prepaid (FOB Destination). If Fluke determines that failure was caused by
neglect, misuse, contamination, alteration, accident, or abnormal condition of operation or handling, including
overvoltage failures caused by use outside the product’s specified rating, or normal wear and tear of mechanical
components, Fluke will provide an estimate of repair costs and obtain authorization before commencing the work.
Following repair, the product will be returned to the Buyer transportation prepaid and the Buyer will be billed for the
repair and return transportation charges (FOB Shipping Point).
THIS WARRANTY IS BUYER'S SOLE AND EXCLUSIVE REMEDY AND IS IN LIEU OF ALL OTHER
WARRANTIES, EXPRESS OR IMPLIED, INCLUDING BUT NOT LIMITED TO ANY IMPLIED WARRANTY OF
MERCHANTABILITY OR FITNESS FOR A PARTICULAR PURPOSE. FLUKE SHALL NOT BE LIABLE FOR ANY
SPECIAL, INDIRECT, INCIDENTAL OR CONSEQUENTIAL DAMAGES OR LOSSES, INCLUDING LOSS OF
DATA, ARISING FROM ANY CAUSE OR THEORY.
Since some countries or states do not allow limitation of the term of an implied warranty, or exclusion or limitation
of incidental or consequential damages, the limitations and exclusions of this warranty may not apply to every
buyer. If any provision of this Warranty is held invalid or unenforceable by a court or other decision-maker of
competent jurisdiction, such holding will not affect the validity or enforceability of any other provision.
11/99
LIMITED WARRANTY AND LIMITATION OF LIABILITY
1.888.610.7664 sales@GlobalTestSupply.com
Fluke-Direct.com

i
Table of Contents
Title Page
Introduction ........................................................................................................... 1
How to Contact Fluke............................................................................................ 2
Safety Information................................................................................................. 2
Preparation ........................................................................................................... 3
Standard Equipment ........................................................................................ 3
Setup ............................................................................................................... 5
Connect to the Power Supply .......................................................................... 6
Charge the Battery........................................................................................... 7
The Product .......................................................................................................... 8
Control Panel ................................................................................................... 9
Display Screen................................................................................................. 12
Status bar ................................................................................................... 13
Main Display Area ...................................................................................... 13
Soft Keys .................................................................................................... 13
Interface Panel................................................................................................. 14
Operation .............................................................................................................. 15
Global Configuration ........................................................................................ 15
Set Range................................................................................................... 15
Motor Speed / Torque Channel Configuration............................................ 19
Set the Wiring Selection ............................................................................. 20
Wiring Group .............................................................................................. 24
Set Sync Source and Update Rate............................................................. 26
Zero ............................................................................................................ 27
Define Calculation Formula ........................................................................ 28
Meter................................................................................................................ 30
Preview....................................................................................................... 31
User Item View ........................................................................................... 32
Integration................................................................................................... 34
Harmonic ......................................................................................................... 35
Change View Mode .................................................................................... 36
Select the Harmonics to Display................................................................. 36
Harmonic Bar.............................................................................................. 37
FFT ............................................................................................................. 38
Linear and Logarithmic Axis ....................................................................... 39
Phasor ............................................................................................................. 40
Select the Phasor Data to Display.............................................................. 42
Select Circuit Type ..................................................................................... 42
Zoom Phasor .............................................................................................. 42
Scope............................................................................................................... 43
1.888.610.7664 sales@GlobalTestSupply.com
Fluke-Direct.com

TiS55+/TiS75+
Users Manual
ii
Select the Waveform to Display .................................................................. 46
Trigger Setup .............................................................................................. 46
Measure with The Cursor............................................................................ 48
Zoom and Shift the Waveform .................................................................... 49
Trend................................................................................................................ 50
Select the Trend to Display ......................................................................... 52
Set Measurement Period ............................................................................ 53
Zoom and Shift the Trend ........................................................................... 54
Data Management............................................................................................ 55
Save Data ................................................................................................... 55
Logger......................................................................................................... 55
Auto Logger ................................................................................................ 56
Logger Interval ............................................................................................ 56
Dual-Unit Interconnection................................................................................. 59
Dual-Unit Interconnection Measurement .................................................... 60
Connect the Computer ..................................................................................... 61
System Settings .................................................................................................... 62
General Settings .............................................................................................. 63
Language .................................................................................................... 63
Set Time and Date ...................................................................................... 63
Auto-Off....................................................................................................... 63
Memory ....................................................................................................... 64
Set Communication Parameters ...................................................................... 64
Remote............................................................................................................. 65
Instrument Maintenance................................................................................... 65
Calibration ........................................................................................................ 66
Maintenance.......................................................................................................... 66
Cleaning ........................................................................................................... 66
Change the Battery .......................................................................................... 66
Change the Fuse.............................................................................................. 68
Firmware Upgrade ........................................................................................... 69
Specifications ........................................................................................................ 70
General Specifications ..................................................................................... 70
Electrical Specifications ................................................................................... 71
Voltage........................................................................................................ 71
Accuracy ..................................................................................................... 71
Current ........................................................................................................ 72
Accuracy ..................................................................................................... 72
Motor (NORMA 6003+、NORMA 6004+) ................................................... 72
Frequency Domain Measurement............................................................... 73
Appendix A ............................................................................................................ 75
Measurement Calculation Method ................................................................... 75
How to Make More Accurate Measurements ................................................... 80
Measurement Error Caused by the Channel Resistance............................ 80
Effects of Leakage Capacitance ................................................................. 81
Broadband Measurement ........................................................................... 82
1.888.610.7664 sales@GlobalTestSupply.com
Fluke-Direct.com

1
Introduction
The Fluke NORMA 6003/NORMA 6003+/NORMA 6004/NORMA 6004+ Power Analyzers (the Product
or Analyzer) are portable, precision wideband power analyzers. Use the product with the Fluke current
clamp 80i-2010s and High Voltage Differential Probe U1500s for a broad range of electrical loads
including those with electronic switching (inverter type).
The Product has these benefits:
• Up to 4 voltage and 4 current channels (NORMA 6003+, NORMA 6004+).
• Motor Speed and Torque measurements (NORMA 6003+, NORMA 6004+)
• 0.1 % accuracy, 500 kHz bandwidth, 200 kHz sample rate.
• The channels are isolated (basic insulation) with the measurement category of CAT III 1000V /
CAT IV 600V.
• Flexible configurations according to the measuring requirements, synchronize 2 Analyzers to
configure 6 to 8 channels.
• 9.6 cm thickness makes it easy to use in tight spaces.
• 5000 mAh Li-ion battery for 10 hours continuous operation with one single charge.
• CAT rating: CAT III 1000 V, CAT IV 600 V
• 100 ms to 1 s configurable update rate, 32 GB storage available for continuous logging.
• Main functions: Meter, Scope, Harmonic, Phasor and Trend.
• USB and RS485 interface with open communication protocol support user defined system
integration and software.
• Simplified UI for better operation experience, suitable for in-field application.
• PC software (Fluke Power Analyzer Software) for online measuring, data downloading, and
analysis.
1.888.610.7664 sales@GlobalTestSupply.com
Fluke-Direct.com
Power Analyzers
Preparation
3
Preparation
Standard Equipment
The Product is shipped in a container designed to prevent damage during shipment. Inspect the
Product carefully for damage, and immediately report any damage to the shipper.
Figure 1 and Table 1 list the equipment and accessories included with this Product. For specific
information on each part and more accessories, see the printed Getting Started Manual that ships with
Unpack the Product and check for all the standard equipment listed in
Table 1 and check the shipping
order for additional items ordered. Report any shortage to the place of purchase or to the nearest
Technical Service Center.
If it is necessary to reship the Product, use the original container. If it is not available, you can order
new packaging from Fluke by identifying the Product model and serial number.
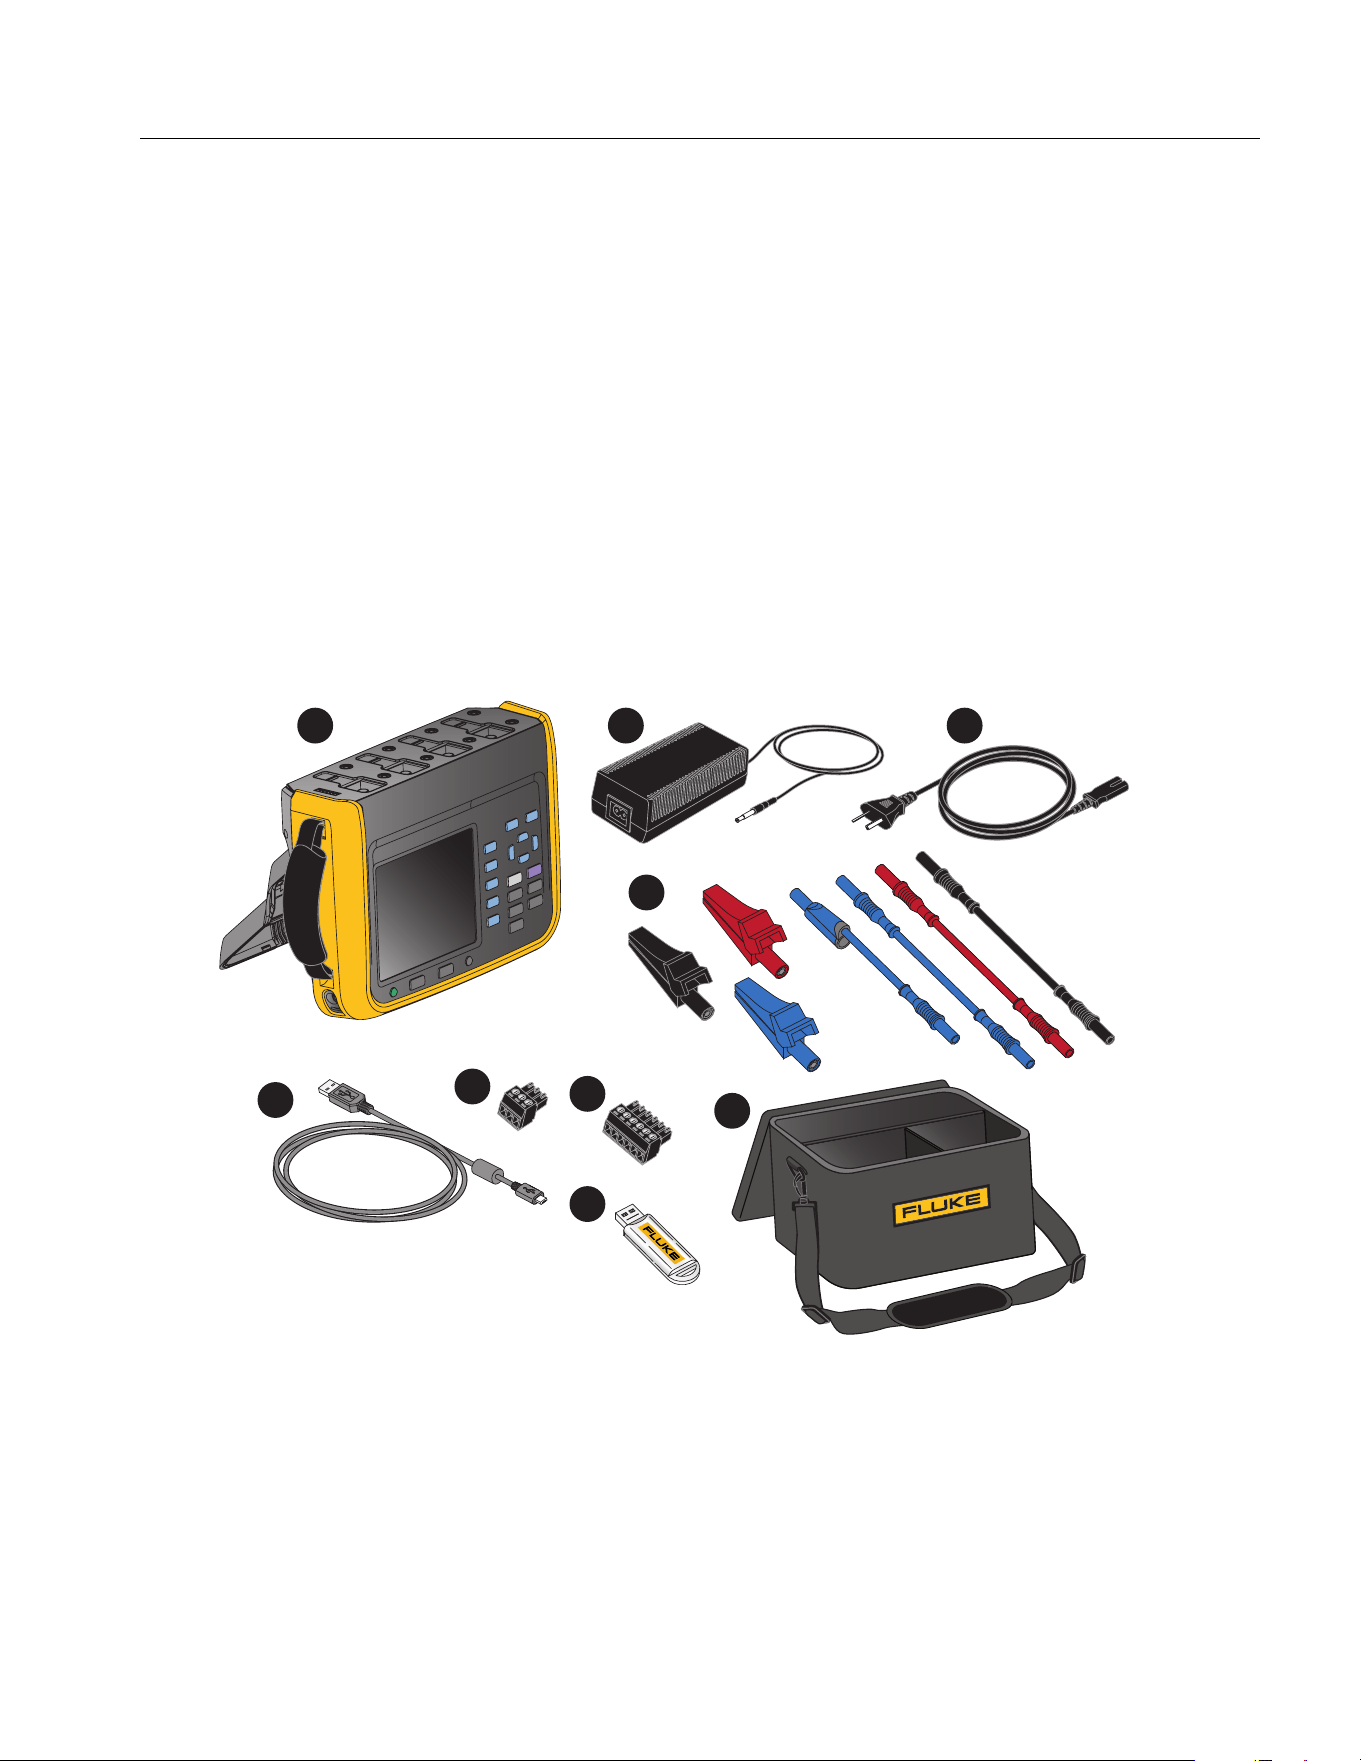
Figure 1. Standard Equipment
1 2 3
4
5
6
7
8
9
1.888.610.7664 sales@GlobalTestSupply.com
Fluke-Direct.com
NORMA 6003/NORMA 6003+/NORMA 6004/NORMA 6004+
Users Manual
4
Table 1. Standard Equipment
Item Description
Quantity
NORMA
6004/6004+
NORMA
6003/6003+
Main unit, including battery BP291: 3894688 1 1
Power Supply Adapter (18V DC, CAT IV 600V
Adapter)
11
Power line cord (for China): 4894155
Power line cord (for international): 4894137
Mains Adapter set (for international): 4894143
11
D
Test lead set
4-channel model:
Test leads, 1.5 m, (4) red, (4) black, (4) blue
Test leads, 0.18 m, (8) blue
Alligator clips, (4) red, (4) black, (4) blue
3-channel model:
Test leads, 1.5 m, (3) red, (3) black, (3) blue
Test leads, 0.18 m, (6) blue
Alligator clips, (3) red, (3) black, (3) blue
11
E USB (mini B) cable 1 1
F RS-485/synchrony adapter (3.81 mm, black, 3 pin) 1 1
G Speed / torque adapter (3.81 mm, black, 6 pin) None/1 None/1
H
USB Flash Drive for PC SW, (contains User
Manual)
11
Not Shown
Getting Started Manual 1 1
Product Warranty and Certification (China only) 1 1
Calibration Report 1 1
QC certificate (for China only) 1 1
1.888.610.7664 sales@GlobalTestSupply.com
Fluke-Direct.com
Power Analyzers
Preparation
5
Setup
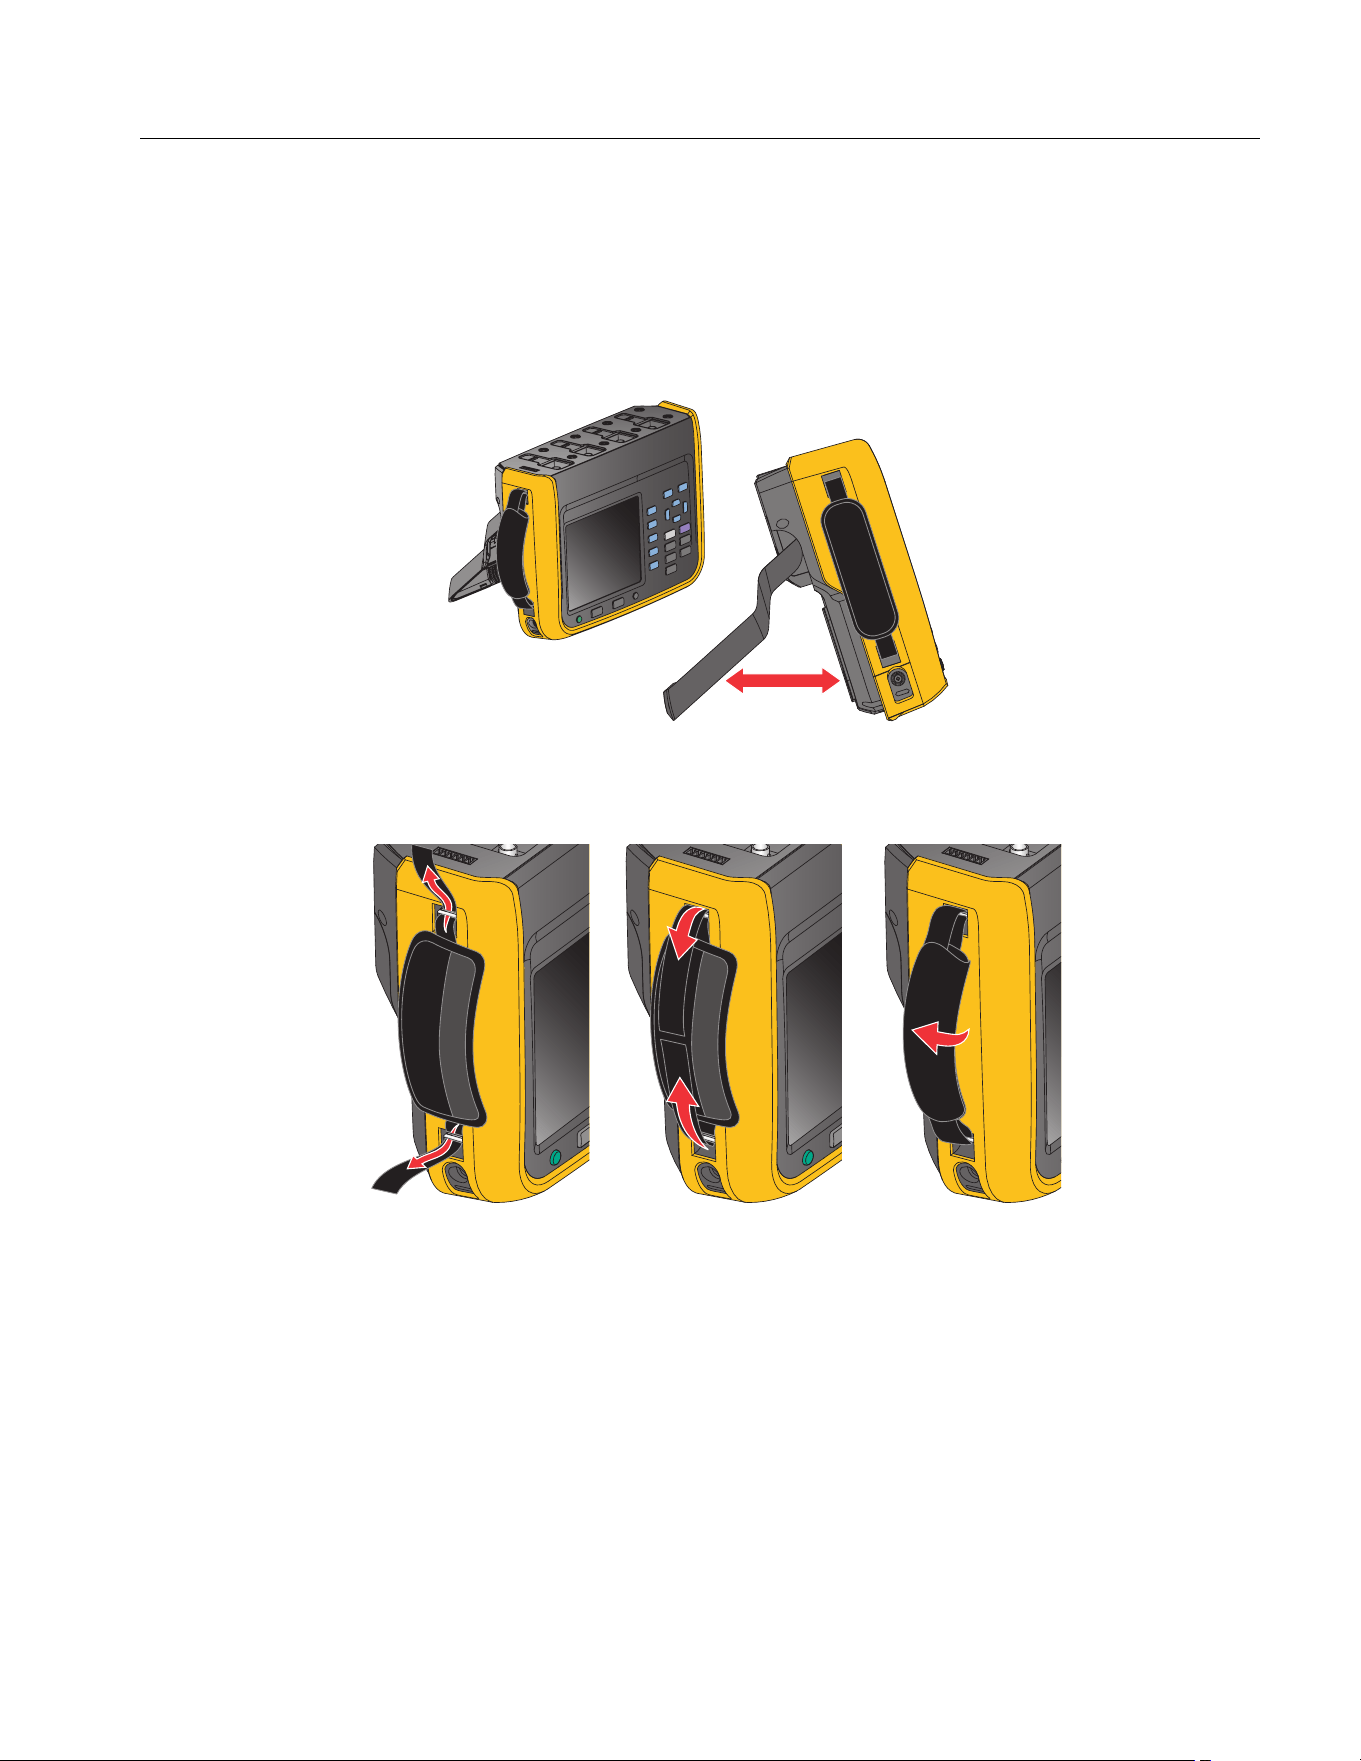
The Analyzer is portable and equipped with a tilt stand that allows the Analyzer to be placed on a flat
surface for users to view the screen from a certain angle, as shown in
Figure 2.
Note
Do not use the tilt stand to carry the Product.
Figure 2. Use the tilt stand
Install the supplied hand strap on the left side of the Product. Adjust the handstrap, as shown in
Figure 3.
Figure 3. Install the hand strap
You can hold the Product in one hand when working and use the hand strap to carry the Product when
the Product is not in use.
1.888.610.7664 sales@GlobalTestSupply.com
Fluke-Direct.com
NORMA 6003/NORMA 6003+/NORMA 6004/NORMA 6004+
Users Manual
6
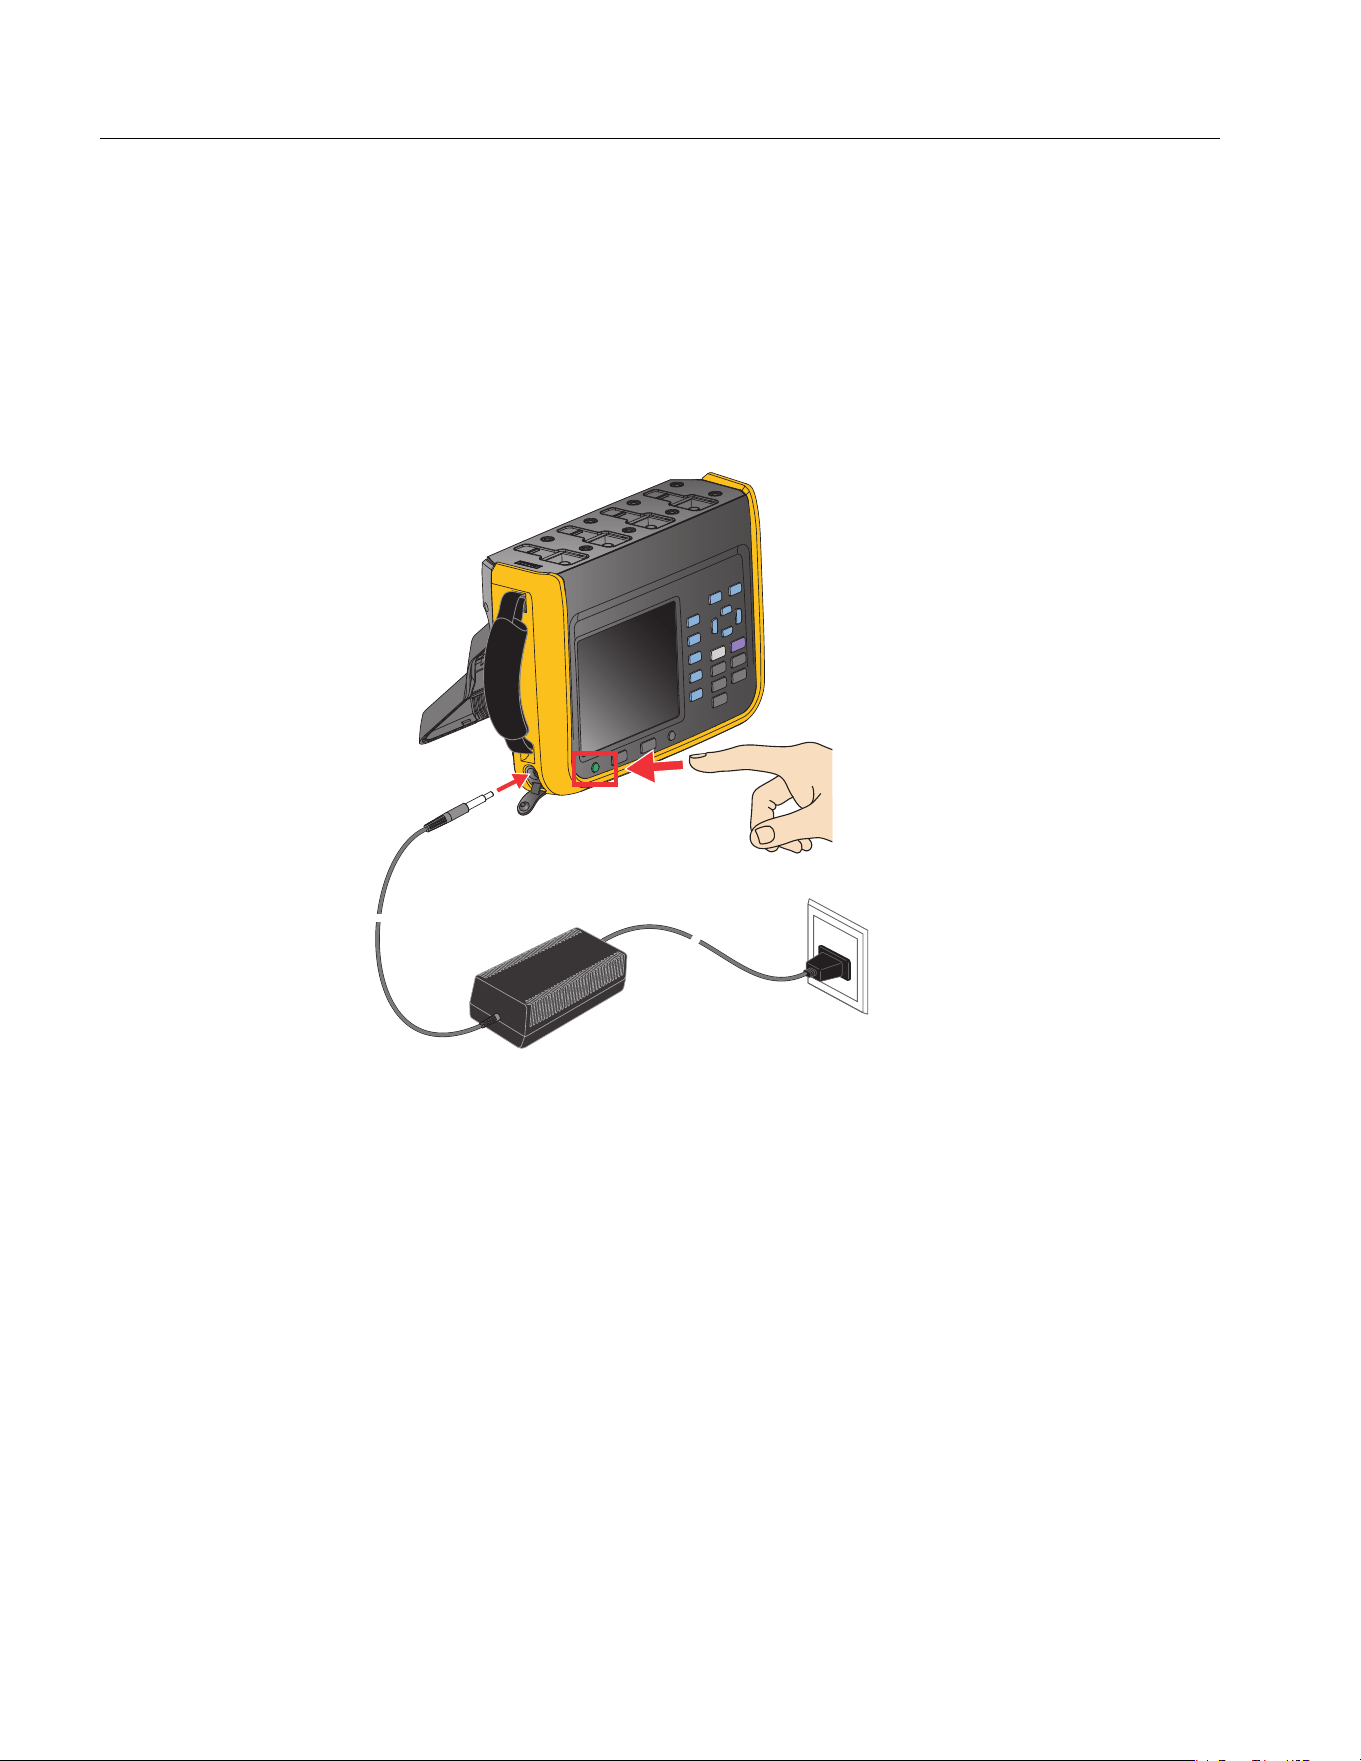
Connect to the Power Supply
Connect the Analyzer to a standard AC power supply according to Figure 4 and turn on the Analyzer:
1. Connect the connector end of the power cord to the power adapter/charger and insert the plug into
a standard wall outlet.
2. Open the protective cover and insert the power adapter/charger plug into the power jack on the
Analyzer.
3. Push O on the front panel to turn on the Analyzer.
Figure 4. Connect to the Power Supply
Warning
To prevent electric shock, connect the Product to a standard outlet using a factory-
supplied power cord.
1.888.610.7664 sales@GlobalTestSupply.com
Fluke-Direct.com
Power Analyzers
Preparation
7
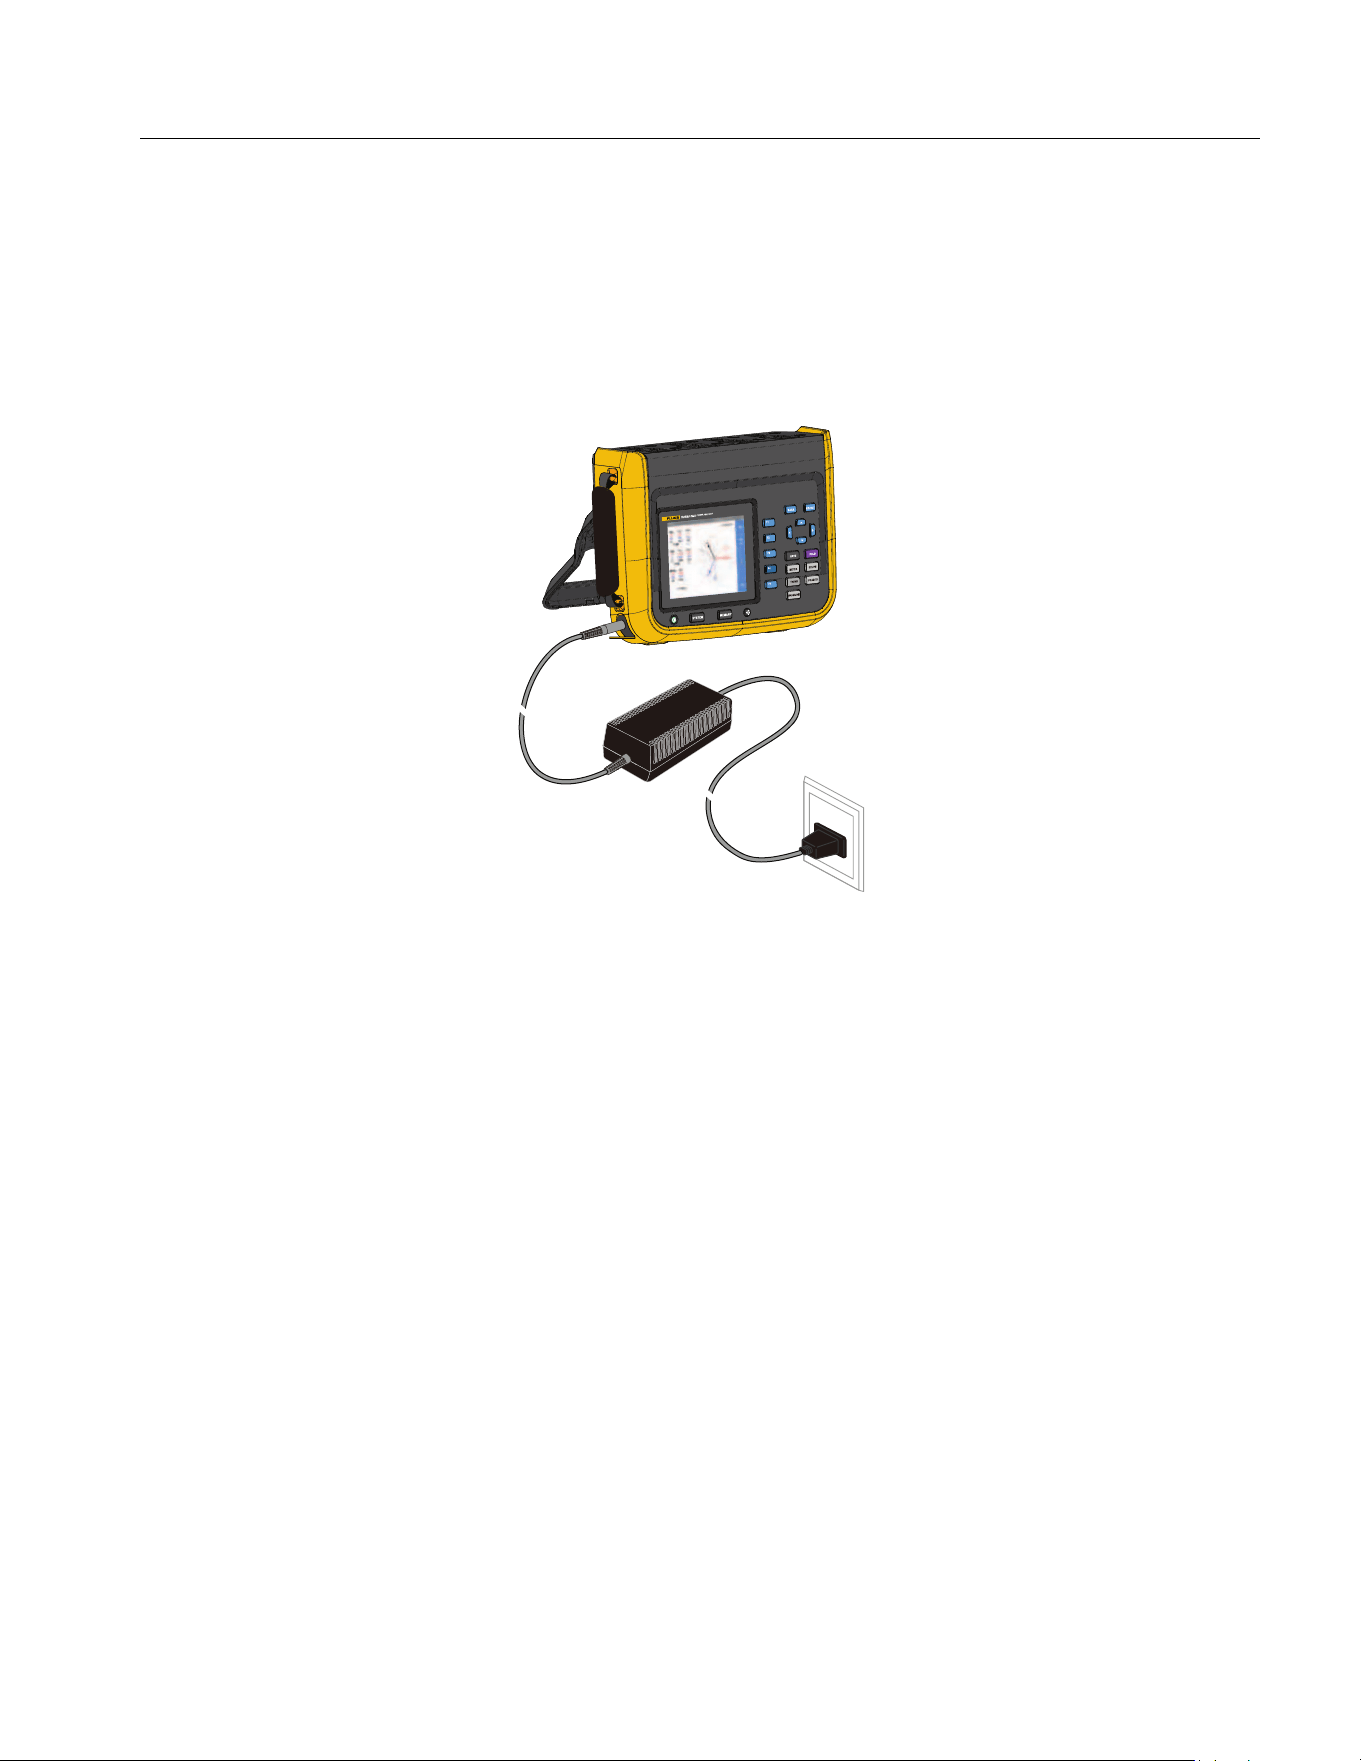
Charge the Battery
Before you use the Product for the first time, charge the battery.
When powered by a battery, the battery symbol at the top of the screen indicates the condition of the
battery. indicates low battery power, charge the battery immediately.
To charge the battery and power the instrument, connect the power adapter as shown in Figure 5. To
increase the battery charging speed turn off the Analyzer.
Figure 5. Battery Charging
Caution
To prevent overheating of the battery during charging, do not charge in extremely hot
or cold environments. If the battery is charged under extreme temperatures, the battery
capacity may be reduced. Refer to charging temperature specifications.
Note
Charge the Product for a two-hour minimum at three-month intervals for maximum battery life.
When not in use, the full charged battery will self-discharge in approximately six months.
Batteries stored for long periods will need two to ten charging cycles for full capacity.
1.888.610.7664 sales@GlobalTestSupply.com
Fluke-Direct.com

NORMA 6003/NORMA 6003+/NORMA 6004/NORMA 6004+
Users Manual
8
The Product
This section describes the operation panel of the Product and the location and function of the display.
Please read this section carefully before operating the Product. This manual is applicable to many
models. Because models have different features and accessories, not all of the information in the
manual may apply to your Product.
Table 2 is a list of functional comparison of different models.
Table 2. Product Features Table
Feature NORMA 6003 NORMA 6003+ NORMA 6004 NORMA 6004+
Number of channels for
voltage / current
3/3 3/3 4/4 4/4
Motor speed / torque
measurement
-
@
-
@
Basic accuracy 0.1%
Bandwidth 500kHz (High voltage/current range)
Sample rate 200 kHz
Channel-to-channel
isolation
@
Meter (V / I / P / η etc.)
@
Waveform
@
Trend
@
Harmonic
@
Phasor
@
CAT rating CAT III 1000V, CAT IV 600V
Ingress protection IP50
Color screen 5.7" backlight, 4:3
Lithium battery 10.8 V/5000 mAh, 54 Wh
Charging indication when
power off
Charging: power indicator is orange
Fully charged: power indicator is green
Charger Charging/powering
PC software
@
USB (device) – Mini B
@
485 / sync interface
@
(up to 921,600 bps)
Low battery indicator
@
1.888.610.7664 sales@GlobalTestSupply.com
Fluke-Direct.com
Power Analyzers
The Product
9
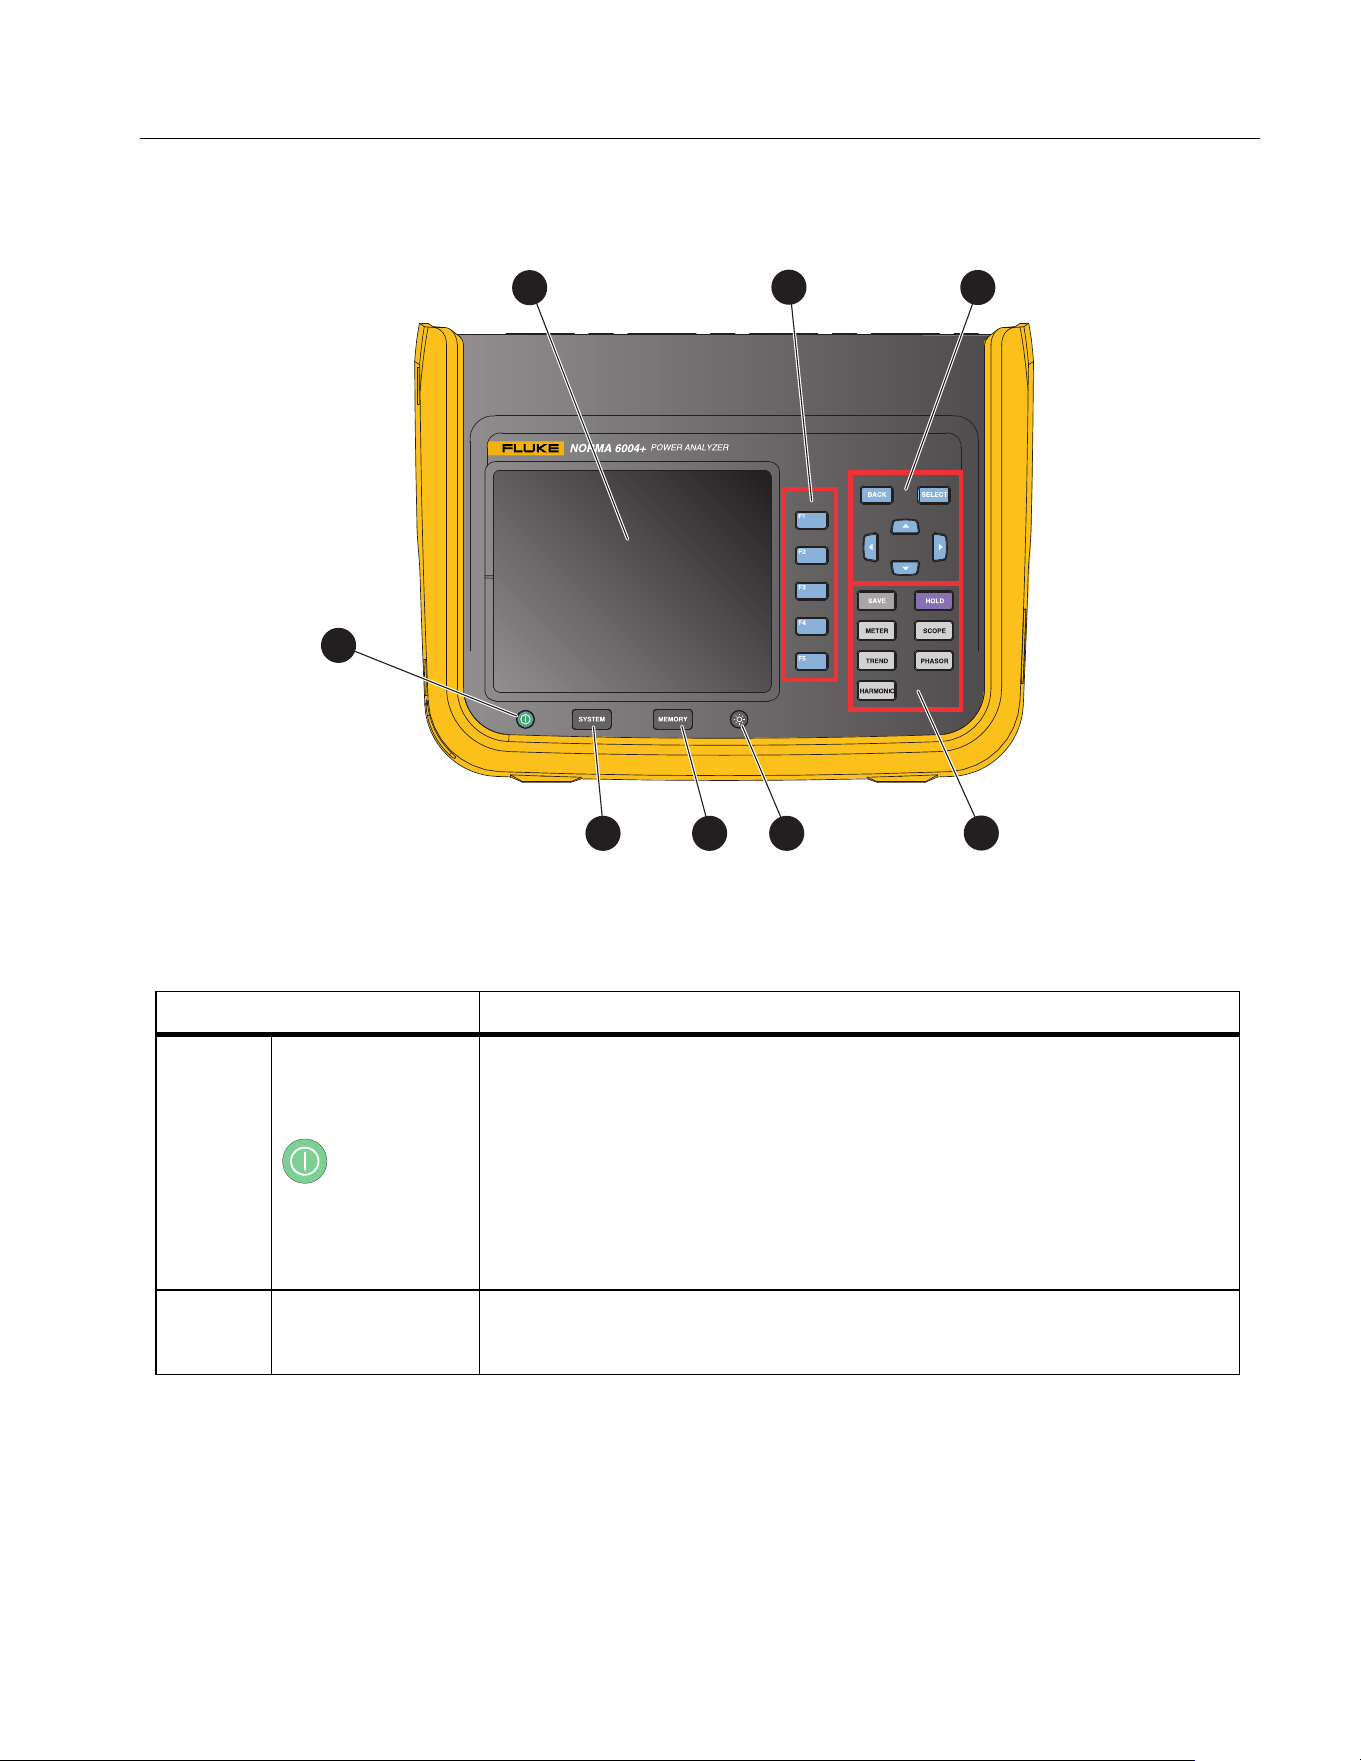
Control Panel
Figure 6 and Table 3 list the features and function of each component on the control panel.
Figure 6. Control Panel
Table 3. Components on the Control Panel
Item Description
Power button
The power button also indicates the AC power connection. If the
indicator light is lit, when the Product is off, the AC power is
connected. The button is orange when the battery is being charged
and green when the battery is fully charged.
• Push to turn on/off the Analyzer.
• Push and hold for 15 seconds to force the Analyzer to shut down.
Screen
See
Display Screen.
1
2
3
4
5
678
1.888.610.7664 sales@GlobalTestSupply.com
Fluke-Direct.com
NORMA 6003/NORMA 6003+/NORMA 6004/NORMA 6004+
Users Manual
10
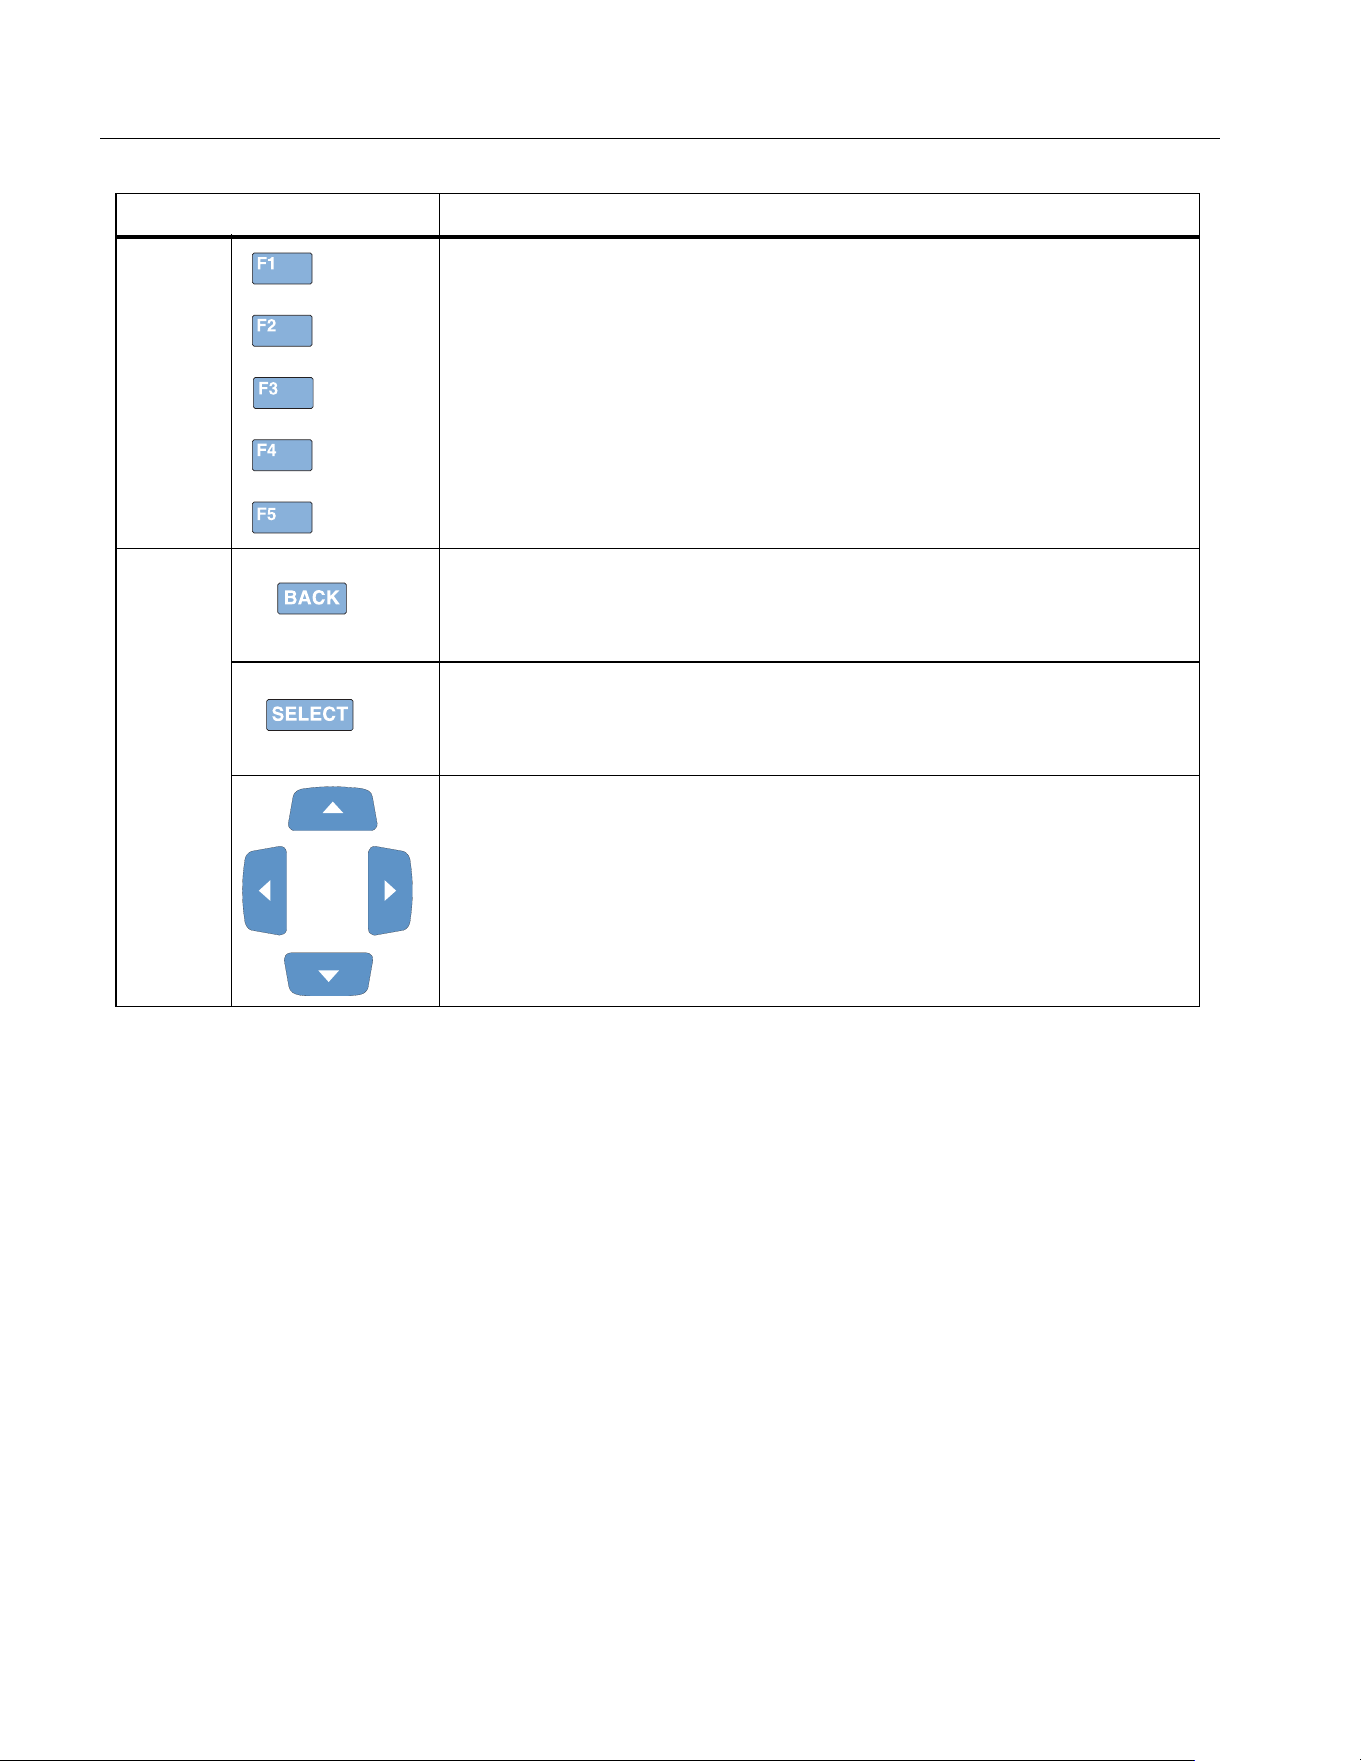
Function keys
The 1 to 5 function keys correspond to the soft keys from top
to bottom on the right next to the screen, the corresponding function
keys are equivalent to the soft keys. The label of the soft key varies
depending on the function and interface.
D
Back key
Push J to exit the current screen and return to the previous
screen or the previous menu
Select key
When a function on the screen is selected (highlighted in yellow),
push S to select or enter the function.
Arrow keys (up, down, left, and right)
Push the keys to go through all selectable functions on the screen
and select one of them, the currently selected function is highlighted
in yellow.
Table 3. Components on the Control Panel (cont.)
Item Description
1.888.610.7664 sales@GlobalTestSupply.com
Fluke-Direct.com
Power Analyzers
The Product
11
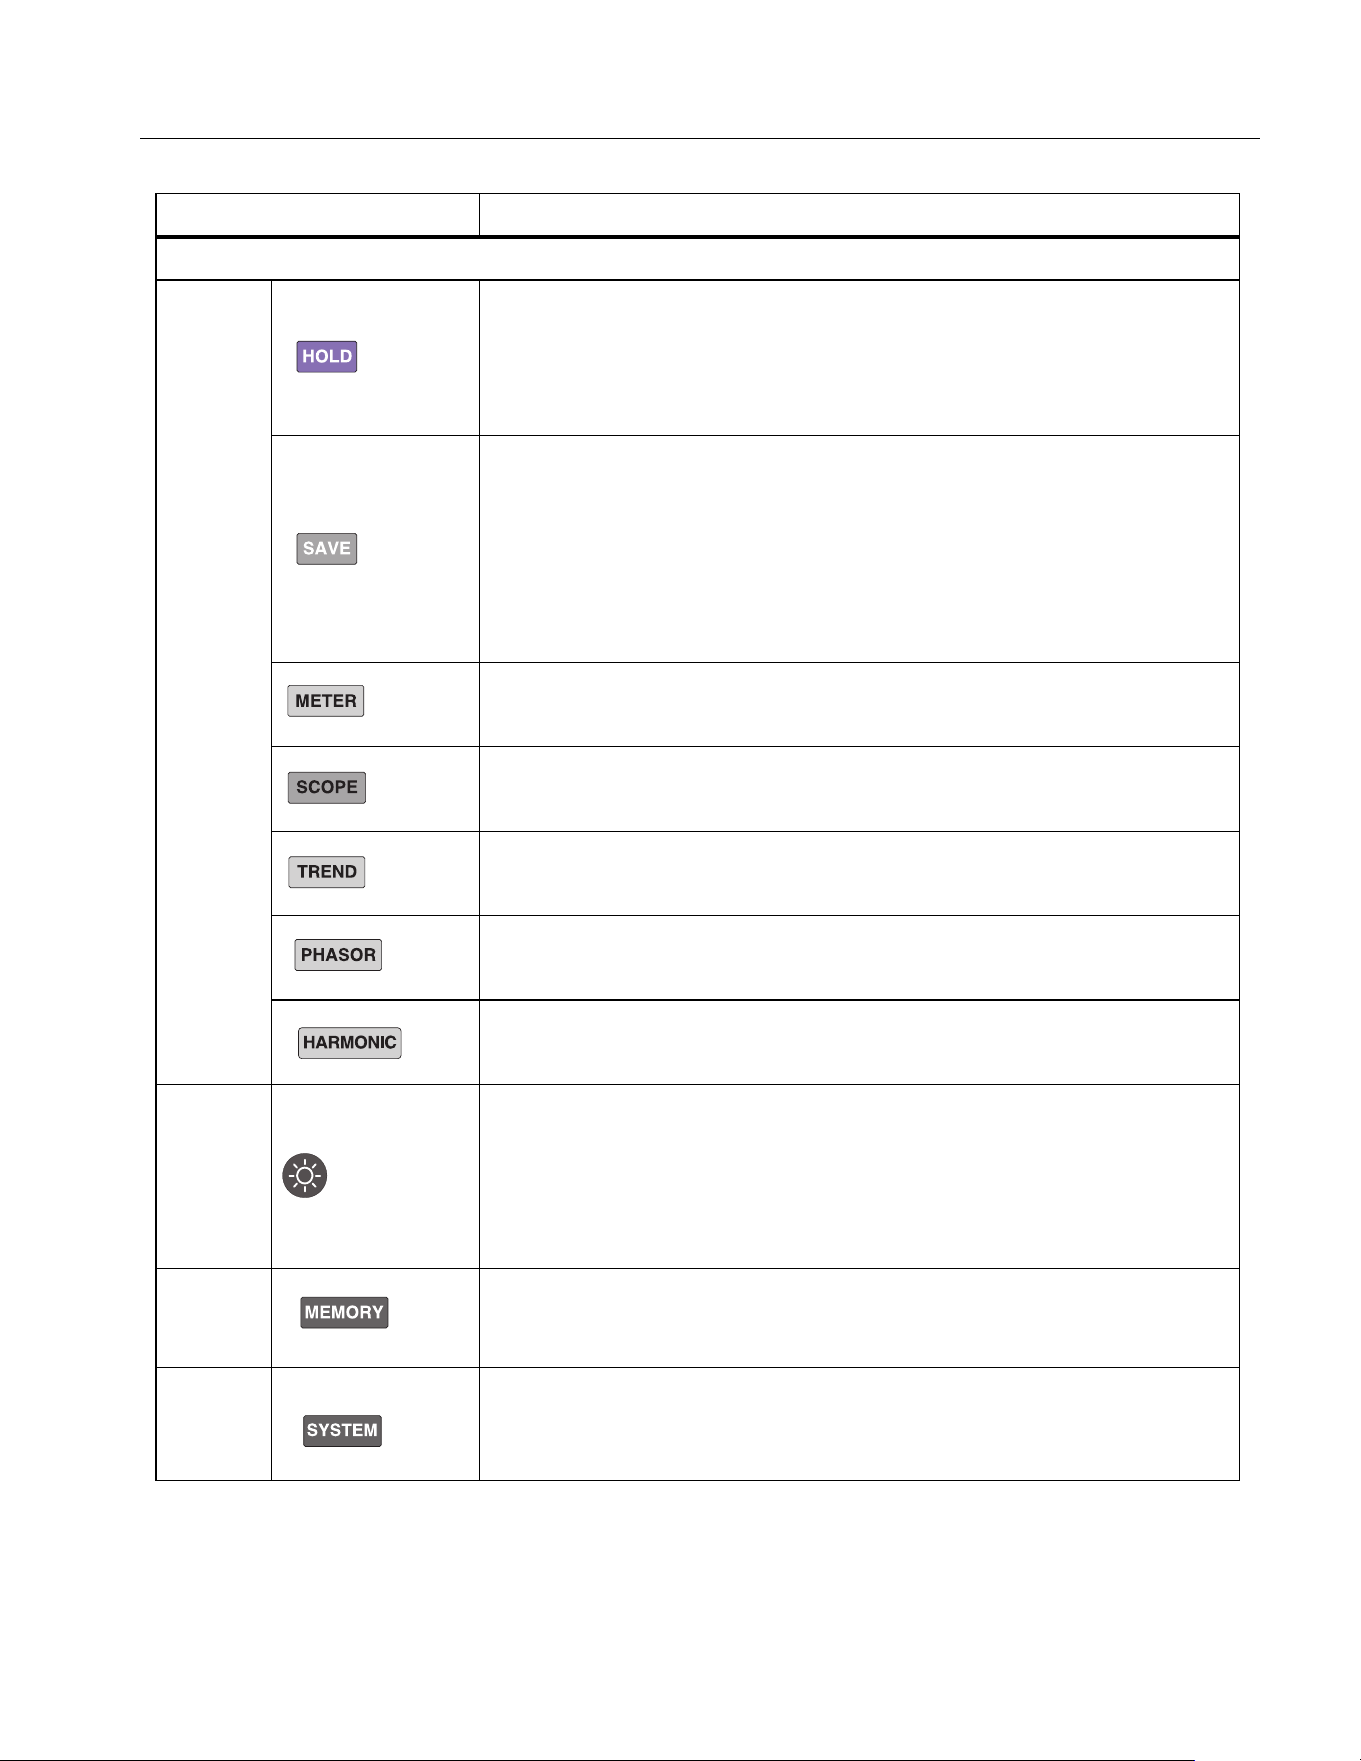
Interface buttons
E
Hold/Run
Push h, the Product freezes the reading on the screen and the
screen will not refresh until you push h again.
Although the screen is frozen, the Product continues to measure.
Save/Logger
• Short push: Save the current data or settings of the Analyzer.
• Push and hold for 2 seconds: Enter the logger mode to
continuously log the measurements of the current screen (for
Meter mode only).
See
Data Management for details.
Meter
Enter Meter Mode. See
Meter for details.
Scope
Enter Scope Mode. See
Scope for details.
Trend
Enter Trends Mode. See
Trend for details.
Phasor
Enter Phasor Mode. See
Phasor for details.
Harmonic
Enter Harmonics Measurement Mode. See
Harmonic for details.
F
Backlight / Prt Scr (Print Screen)
• Short push: adjust the brightness of the backlight, which can be
adjusted in multiple levels.
• Push and hold for 2 seconds: capture the current screen and
save it as a PNG format.
G
Memory operation
Manage data stored in internal memory. See
Memory for details.
H
System setting buttons
Instrument information, instrument settings, communication settings.
See
System Settings for details.
Table 3. Components on the Control Panel (cont.)
Item Description
1.888.610.7664 sales@GlobalTestSupply.com
Fluke-Direct.com
Power Analyzers
The Product
13
Status bar
Main Display Area
The main display area is the main display area of the screen for displaying various setting options,
current measurements, charts and lists.
The main display area displays different content depending on the current interface mode and location,
as detailed in the relevant sections below.
Soft Keys
The soft keys, at the right side of the display, have labels that will vary depending on the functions and
interfaces. The soft keys correspond to the function keys (F1 to F5) on the right side of the screen.
If a soft key has no label, the key has no function.
Except for the main screen, the first menu item for the main measurement screens,
1 is Configure,
which is used for global configuration. Therefore, the function of the
1 (Configure) key is not
described again in the menus.
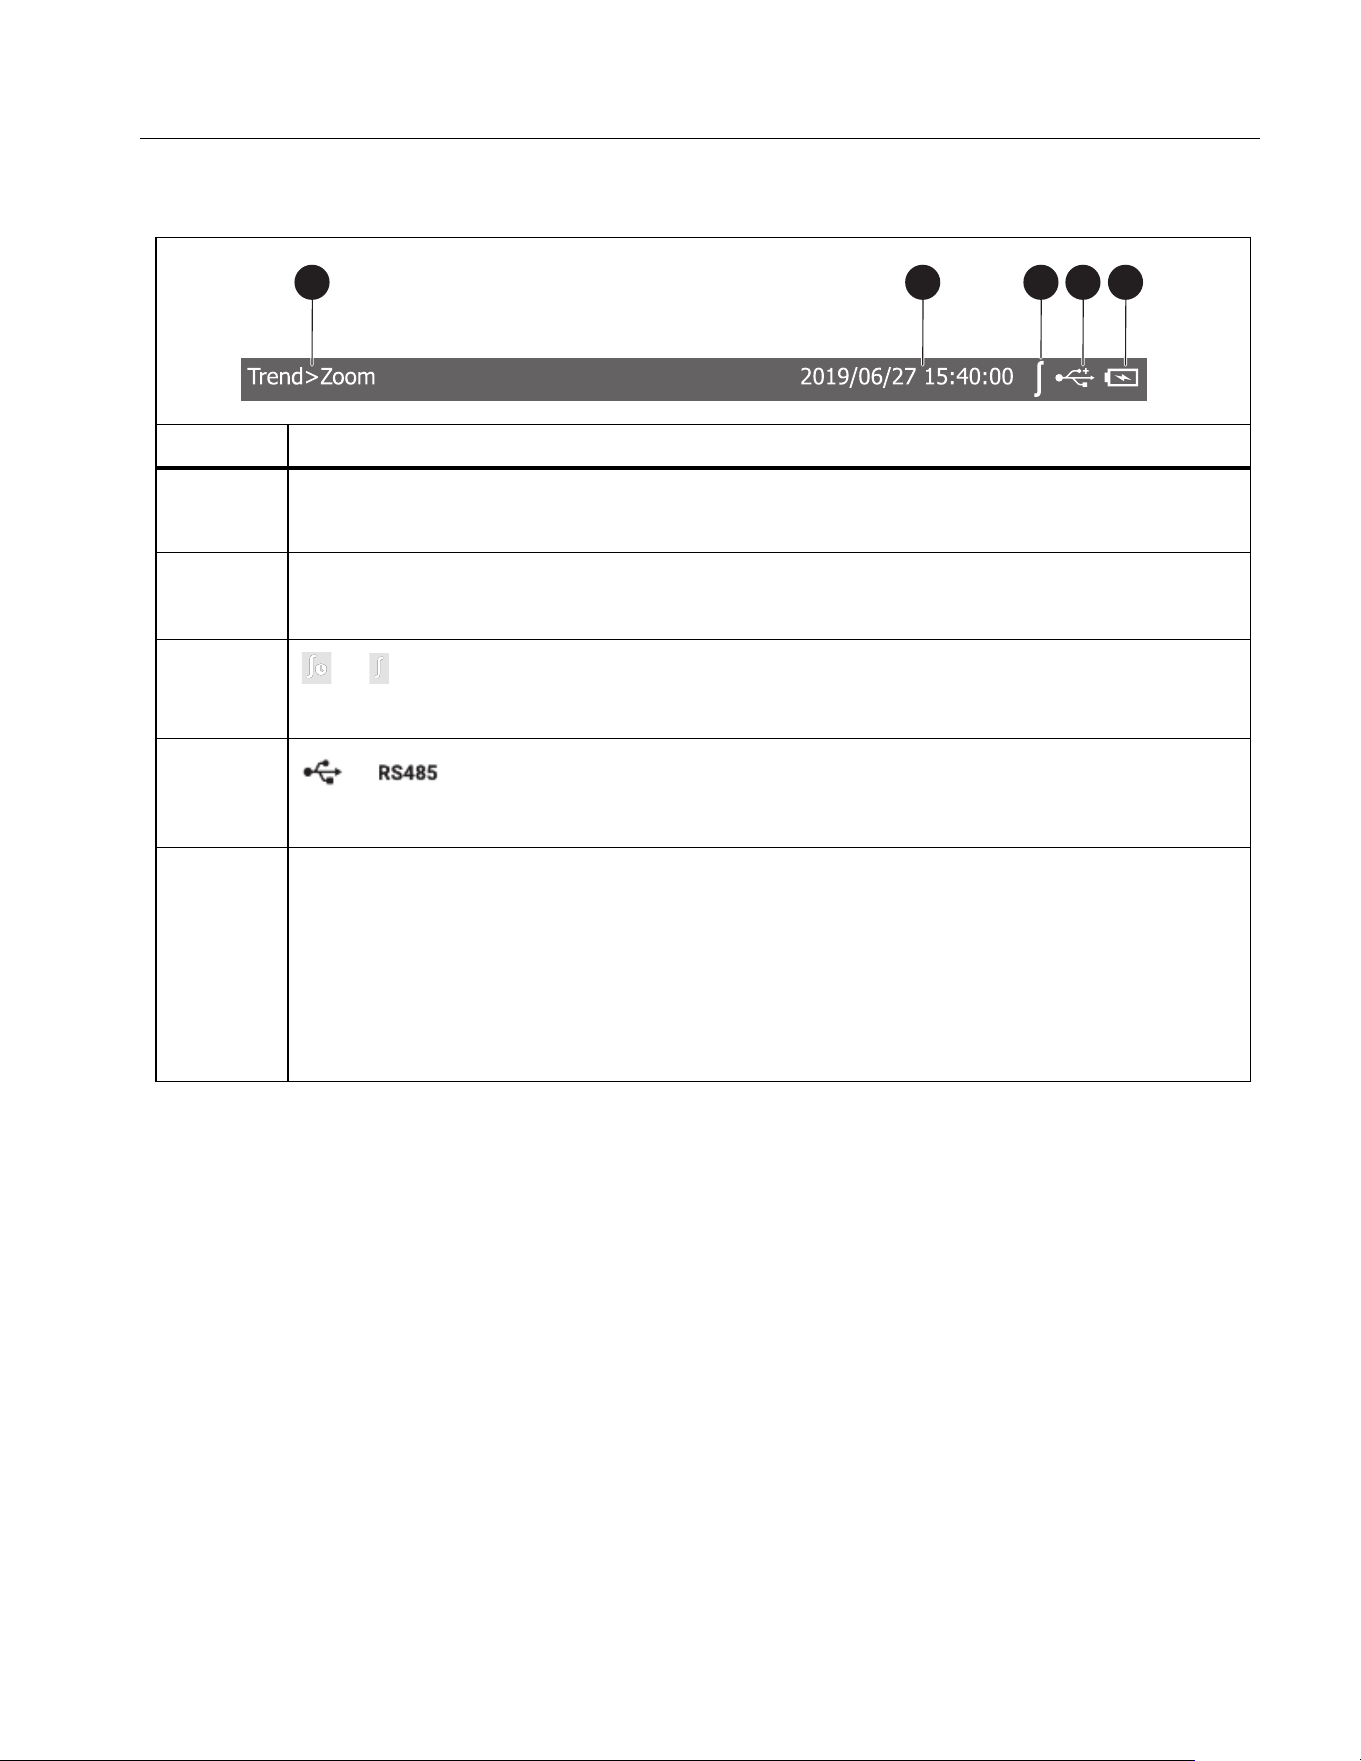
Table 4. Status Bar
Item Description
Menu navigation
Displays the menu path of the current screen, for example: Configure > Wiring.
Clock
Shows the current date and time of the Analyzer.
or Integration timer
When integrating, the status bar shows the integral indicator. See
Integration for details.
D
or
Indicates that the communication is connected.
E
Battery status
Displays battery status.
• d the charging indicator, this shows that the Product is connected to the main
power.
•
the main power is not connected, and the vertical bar in the icon indicates the
battery level.
1 2 3 4 5
1.888.610.7664 sales@GlobalTestSupply.com
Fluke-Direct.com
NORMA 6003/NORMA 6003+/NORMA 6004/NORMA 6004+
Users Manual
14
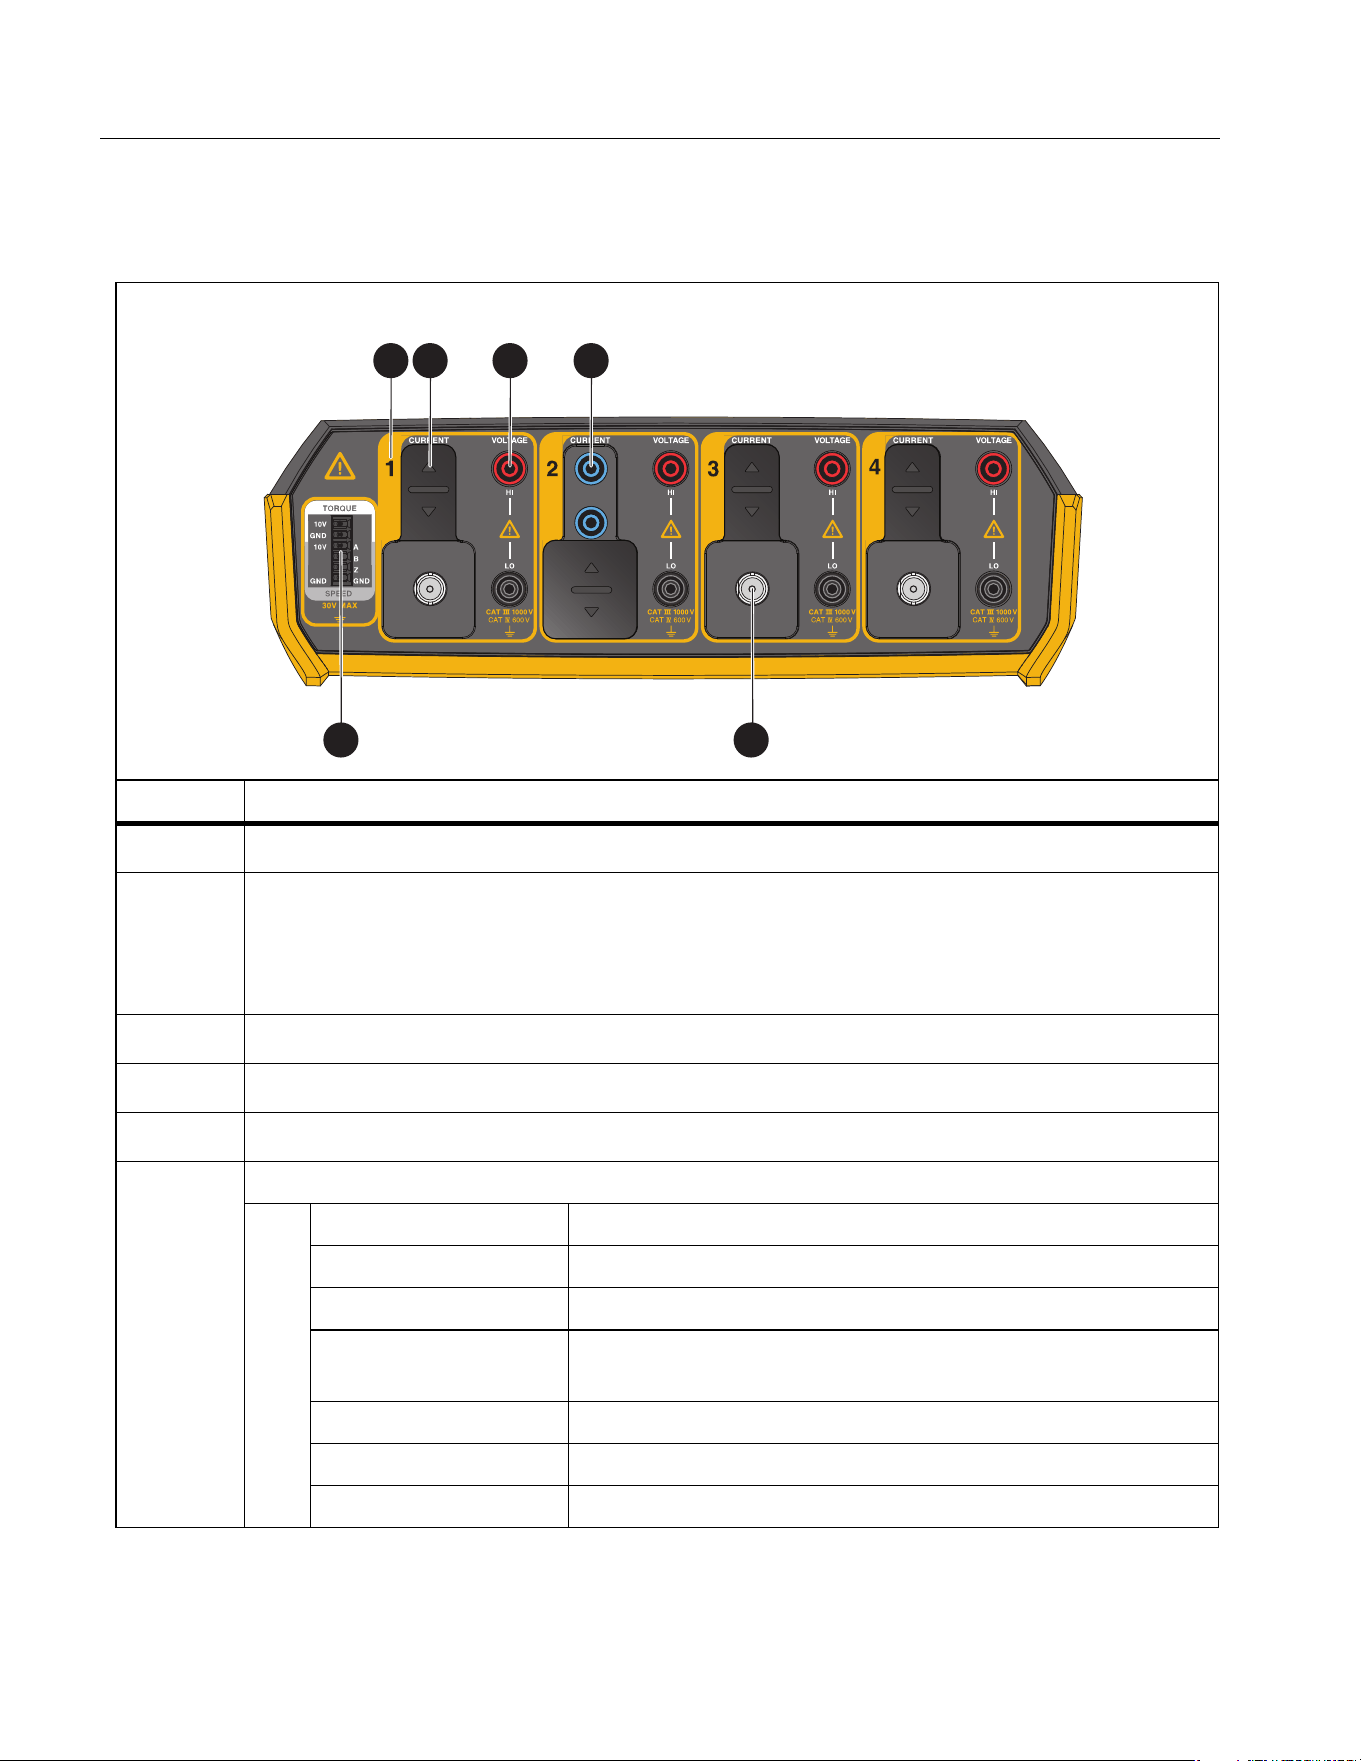
Interface Panel
Table 5 shows the connections on the interface panel.
Table 5. Connector Panel
Item Description
Voltage/current input channel number
Current port protection cover
The protective cover can slide back and forth. When the protective cover slides forward,
the external current sensor input port is exposed. When the protective cover slides back,
the current input port is exposed.
Voltage input port
D
Current input port
E
Input port for external current sensor
F
Input port for motor speed / torque signal
Pin Signal
1 Input for torque analog quantity, 10 V range
2 Common port for torque input
3
Input for speed analog quantity, 10 V range or input for
speed pulse, A pulse
4 Input for speed pulse, pulse B
5 Input for speed pulse, pulse Z
6 Common port for speed input
10A MAX
EXT SE NSOR
10A MAX
EXT SE NSOR
HI
LO
10A FUSED
10A MAX
EXT SE NSOR
3 421
6 5
1.888.610.7664 sales@GlobalTestSupply.com
Fluke-Direct.com

Power Analyzers
Operation
15
Operation
Global Configuration
Under all view modes (Meter, Scope, Trend, Phasor and Harmonic), the soft key 1 is Configure.
The Configure soft key is global configuration and is applied to all other modes.
Use the Configure menu to set the range for each channel, timing synchronization, wiring, formula,
zero and formula editing.
Enter the Configure Menu:
• From the Main screen of any view mode select
1 (Configure).
The functions in the Configure menu are as shown in
Table 6.
Set Range
From the Main screen of any view mode:
1. Select
1 (Configure) > 1 (Range) > 1 (CH1).
The Configuration interface of channel 1 is as shown in
Table 7.
Vol. Range is selected by default.
2. Push S and use the up and down arrow (K L) keys to select the corresponding option. Then
push S again to confirm the option.
3. Use the up and down arrow (K L) keys to move the cursor to Scale. Volt.. Then push S.
An input keyboard appears.
4. Use the arrow (K LM N) keys to move the cursor over the corresponding character on the
keyboard, then push Sto enter the value into the input box at the top. Repeat until all
characters are entered.
Table 6. Global Configuration
Item Description
1 Range
Sets the voltage/current range for each channel, ratio, filter, and selects
whether to use an external sensor. NORMA 6003+ and NORMA 6004+
can also set the mode and ratio of the motor torque/speed measurement.
See
Set Range for details.
2 Wiring
Sets the wiring selection and the synchronization source of each wiring
group. For detailed information, see
Set the Wiring Selection.
3 Timing Sync
Sets the sync source of each wiring group. For detailed information, see
Set Sync Source and Update Rate.
4 Zero Eliminates the input offset by zeroing. See
Zero.
5 Formula
Defines the efficiency formula and the formula for some numerical
calculation. See
Define Calculation Formula for details.
1.888.610.7664 sales@GlobalTestSupply.com
Fluke-Direct.com

NORMA 6003/NORMA 6003+/NORMA 6004/NORMA 6004+
Users Manual
16
Note
For the characters on the keyboard:
k = ×10
3
: m = ×10
-3
: μ = ×10
-6
: M = ×10
6
is the backspace key, which deletes the character before the cursor.
5. Use the up and down arrow (K L) keys to highlight Ok on the keyboard, then push S to
confirm the input value. To abandon your changes, select Exit on the keyboard and push S or
J.
6. Use the up and down arrow (K L) keys and S to complete the configuration of the remaining
items.
7. Push J to go to the Configure menu.
8. Push 2 to set the range and ratio of CH1 to CH4.
9. Push J repeatedly to go back to the main screen.
Warning
Set the parameters strictly according to the scale of external voltage divider, current
shunt and current clamp. Otherwise, the measurement will not reflect the actual signal
and there is danger of electric shock.
Note
The nameplate of the shunt or probe is usually marked with its parameter settings. Refer to the
relevant information of the external sensor if necessary.
Note
The 10 kHz anti-aliasing filter is in the measurement channel. The anti-aliasing filter is
necessary to analyze Fast Fourier Transform (FFT) data correctly and can be used to ensure
that the measurement bandwidth is much less than 1⁄2 sample rate to avoid signal aliasing.
650 Hz low-pass filtering is implemented by a digital filter that helps distinguish the synthesis
frequency and carrier signals of the variable frequency system. Turn on this filter to easily
observe the synthesis frequency of the frequency conversion system.
If measuring a 3-phase system, Fluke recommends that the line filter settings for each channel
in the 3-phase system should be consistent.
The filter is off by default.
1.888.610.7664 sales@GlobalTestSupply.com
Fluke-Direct.com

Power Analyzers
Operation
17
.
Table 7. Range Configuration
Item Description
Vol. Range
Voltage range options:
• Auto: Autorange. The Analyzer automatically selects the voltage
measurement range with the best resolution.
• 10 V
• 100 V
• 1000 V
Vol. Ratio (V/V)
Scale of an external voltage sensor (PT). After setting the scale of the
external voltage sensor correctly, the Analyzer automatically calculates the
actual voltage value of the measured signal based on the voltage scale and
the measured value.
The Vol. Ratio represents the voltage ratio of the external sensor.
For example, when connecting the U1500s high-voltage probe with a voltage
ratio of 4mV/V, which represents a voltage ratio of 4:1000, the Vol.
Ratio (V/V) on the Analyzer should be set to 0.004.
Warning
If the voltage input terminal is not connected to an external
voltage divider in series, set the scale to 1, otherwise the
measured voltage will not be consistent with the actual
voltage, and there is a danger of electric shock.
If the voltage input terminal is connected with an external
voltage divider in series, the actual voltage will be calculated
according to the set scale.
Vol. Line Filter
Voltage signal filter options:
• OFF: No filter is used.
• 650 Hz: Automatically turn on the line filter, and the cutoff frequency is
650 Hz. Use to observe the synthesis frequency signal of the frequency
conversion system.
• 10 kHz: Automatically turn on the line filter, and the cutoff frequency is
10 kHz. Use for anti-aliasing.
Inserting a voltage measurement circuit has a direct impact on the
measurement of voltage and power. When the line filter is turned on, the
measurements do not contain high frequency components. Noise from the
frequency inverter or distorted waveform can be removed.
1.888.610.7664 sales@GlobalTestSupply.com
Fluke-Direct.com

NORMA 6003/NORMA 6003+/NORMA 6004/NORMA 6004+
Users Manual
18
Cur. Range
Current range options:
• Shunt: Auto, 0.1A, 1A, 10A (when "Ext. Sensor" is not selected)
• Ext. Sensor: Auto, 0.1V, 1V, 10V (when "Ext. Sensor" is selected)
Ext. Sensor
Choose whether to use an external sensor.
When the external sensor is selected/deselected, you must reset the current
range.
If an external sensor is not selected, the current signal is directly connected
to the current channel of 10A, and the current is measured via the internal
shunt.
If an external sensor is selected, the current is measured by connecting the
current signal of external sensor output to the BNC interface.
Cur. Ratio (A/A, V/A)
Scale of an external current sensor (CT). After setting the scale of the
external current sensor correctly, the Analyzer automatically calculates the
actual current value of the measured signal based on the current scale and
the measured value.
The ratio settings are, A/A or V/A.
If the internal shunt is selected, the current scale represents the ratio of the
actual current (A) to the input current (A) on the shunt (that is A/A).
If an external sensor (BNC) is selected, the current ratio represents input
voltage (V) on the BNC port to the ratio of the actual current (A) of the
connected sensor (expressed as mV/A).
For example, when connecting a current sensor probe with an output
sensitivity of 1 mV/A, which represents a 1:1000 ratio, the Cur. Ratio (V/A) on
the Analyzer should be set to 0.001.
Cur. Line Filter
Current signal filter options:
• Off: No current filter is used.
• 650 Hz: Automatically turn on the line filter, and the cutoff frequency is
650 Hz. Use to observe the synthesis frequency signal of the frequency
conversion system.
• 10 kHz: Automatically turn on the line filter, and the cutoff frequency is
10 kHz. Use for anti-aliasing.
Inserting a current measurement circuit has a direct impact on current and
power measurements. When the line filter is turned on, the measurements
do not contain high frequency components. Noise from the frequency
inverter or distorted waveform can be removed.
Table 7. Range Configuration (cont.)
Item Description
1.888.610.7664 sales@GlobalTestSupply.com
Fluke-Direct.com
Power Analyzers
Operation
19
Motor Speed / Torque Channel Configuration
From the Main screen of any view mode:
1. Select
1 (Configure) > 1 (Range) > 5 (Motor).
The Configuration interface of Motor Speed / Torque is as shown in
Table 8.
The Mode is selected by default (the drop-down menu is highlighted in yellow).
2. Push S and use the up and down arrow (K L) keys to select the corresponding option. Then
push S again to confirm the option.
3. Use the up and down arrow (K L) keys to move the cursor to Ratio. Then push S.
4. Enter the correct values on the keyboard by using the up and down arrow (K L) keys and push
S.
5. Use the up and down arrow (K L) keys to highlight the Ok button on the keyboard, then push
S to confirm the input value.
6. For the Ratio option of the torque, repeat step
3 to 5 to configure the torque ratio in V/Nm.
7. Use the arrow (K L M N) keys to move the cursor to the Apply button and push S. The
settings are not saved to the device if you do not select Apply.
8. Push J repeatedly to go back to the main screen.
Table 8. Motor Speed / Torque Channel Configuration
Item Description
Speed
Mode
Speed signal mode options:
• 10V (default): Use for speed sensor for analog voltage output. If the
sensor uses current, frequency or other analog output, it must be
converted to voltage before input.
• A: For encoders with single pulse, only the speed value is measured
and recorded, the direction of rotation is not measured and recorded.
• AB: For encoders with AB double-pulse, both speed value and
direction are measured and recorded.
• ABZ: For ABZ incremental encoder, both speed value and direction are
measured and recorded.
Ratio
Speed sensor ratio.
When Mode is set to 10V, the ratio is in V/rpm, which indicates that how
much voltage (V) it is related to the motor speed (rpm). The formula for the
Analyzer to calculate the actual speed is as follows:
Speed = Voltage/ Ratio
When Mode is set to another option, the unit of the ratio is the number of
pulses per revolution (PPR). The formula for the Analyzer to calculate the
actual speed is as follows:
Speed (rpm) = Pulses per Minute / Ratio
1.888.610.7664 sales@GlobalTestSupply.com
Fluke-Direct.com
NORMA 6003/NORMA 6003+/NORMA 6004/NORMA 6004+
Users Manual
20
Set the Wiring Selection
To measure the power of various single-phase or three-phase power, different wiring selections are
required, and multiple channel combinations are used. For more information on the connections, see
the Getting Started Manual, shipped with the product or available online.
The Analyzer provides these basic wiring selections:
• 1P2W1M, 1-phase 2-wire 1-meter
• 3P3W2M, 3-phase 3-wire 2-meter
• 3P4W3M, 3-phase 4-wire 3-meter
• 3P3W3M, 3-phase 3-wire 3-meter
Note
In the abbreviation of the wiring selection, letter "P" indicates "Phase", letter "W" indicates
"Wire", letter "M" indicates "Meter", that is power meter (includes one set of voltmeter and
ampmeter).
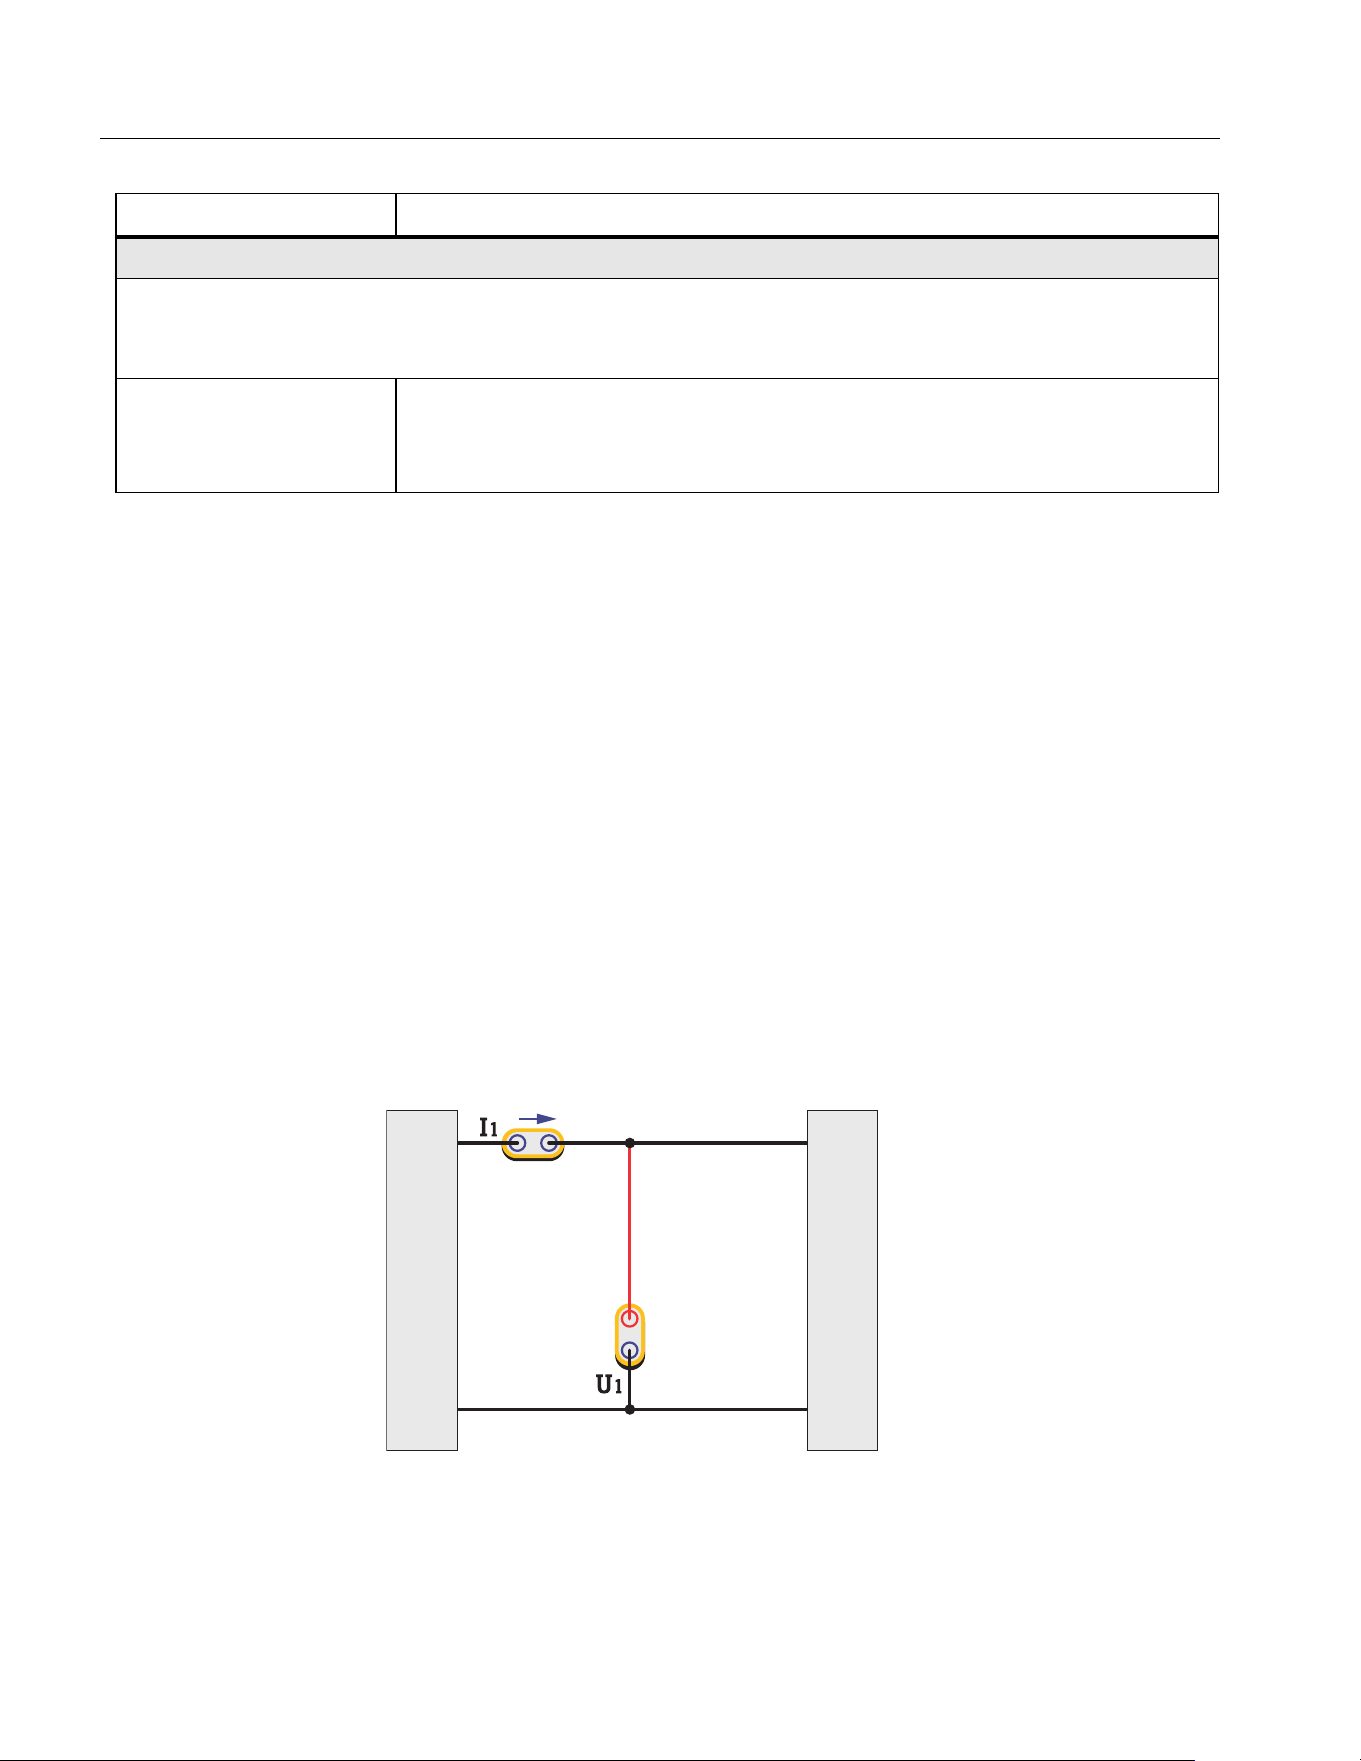
1P2W1M
Figure 8. 1P2W1M Wiring
For 1P2W1M wiring, connect a voltage measurement channel between the phase line and the zero
line. Connect a current measurement channel in series with the phase line or the zero line (note the
direction) or clamped on the phase line or the zero line with a current sensor.
Torque
Mode: The torque input is -10 V to 10 V the supported input signals must be conditioned to operate
within these limits. If the sensor has a current output this must be converted using a shunt resistor
before applying to the input.
Ratio
Torque sensor ratio. The formula for the Analyzer to calculate the actual
torque is:
Torque = Voltage / Ratio
Table 8. Motor Speed / Torque Channel Configuration (cont.)
Item Description
A
N
Source
Load
1.888.610.7664 sales@GlobalTestSupply.com
Fluke-Direct.com
Power Analyzers
Operation
21
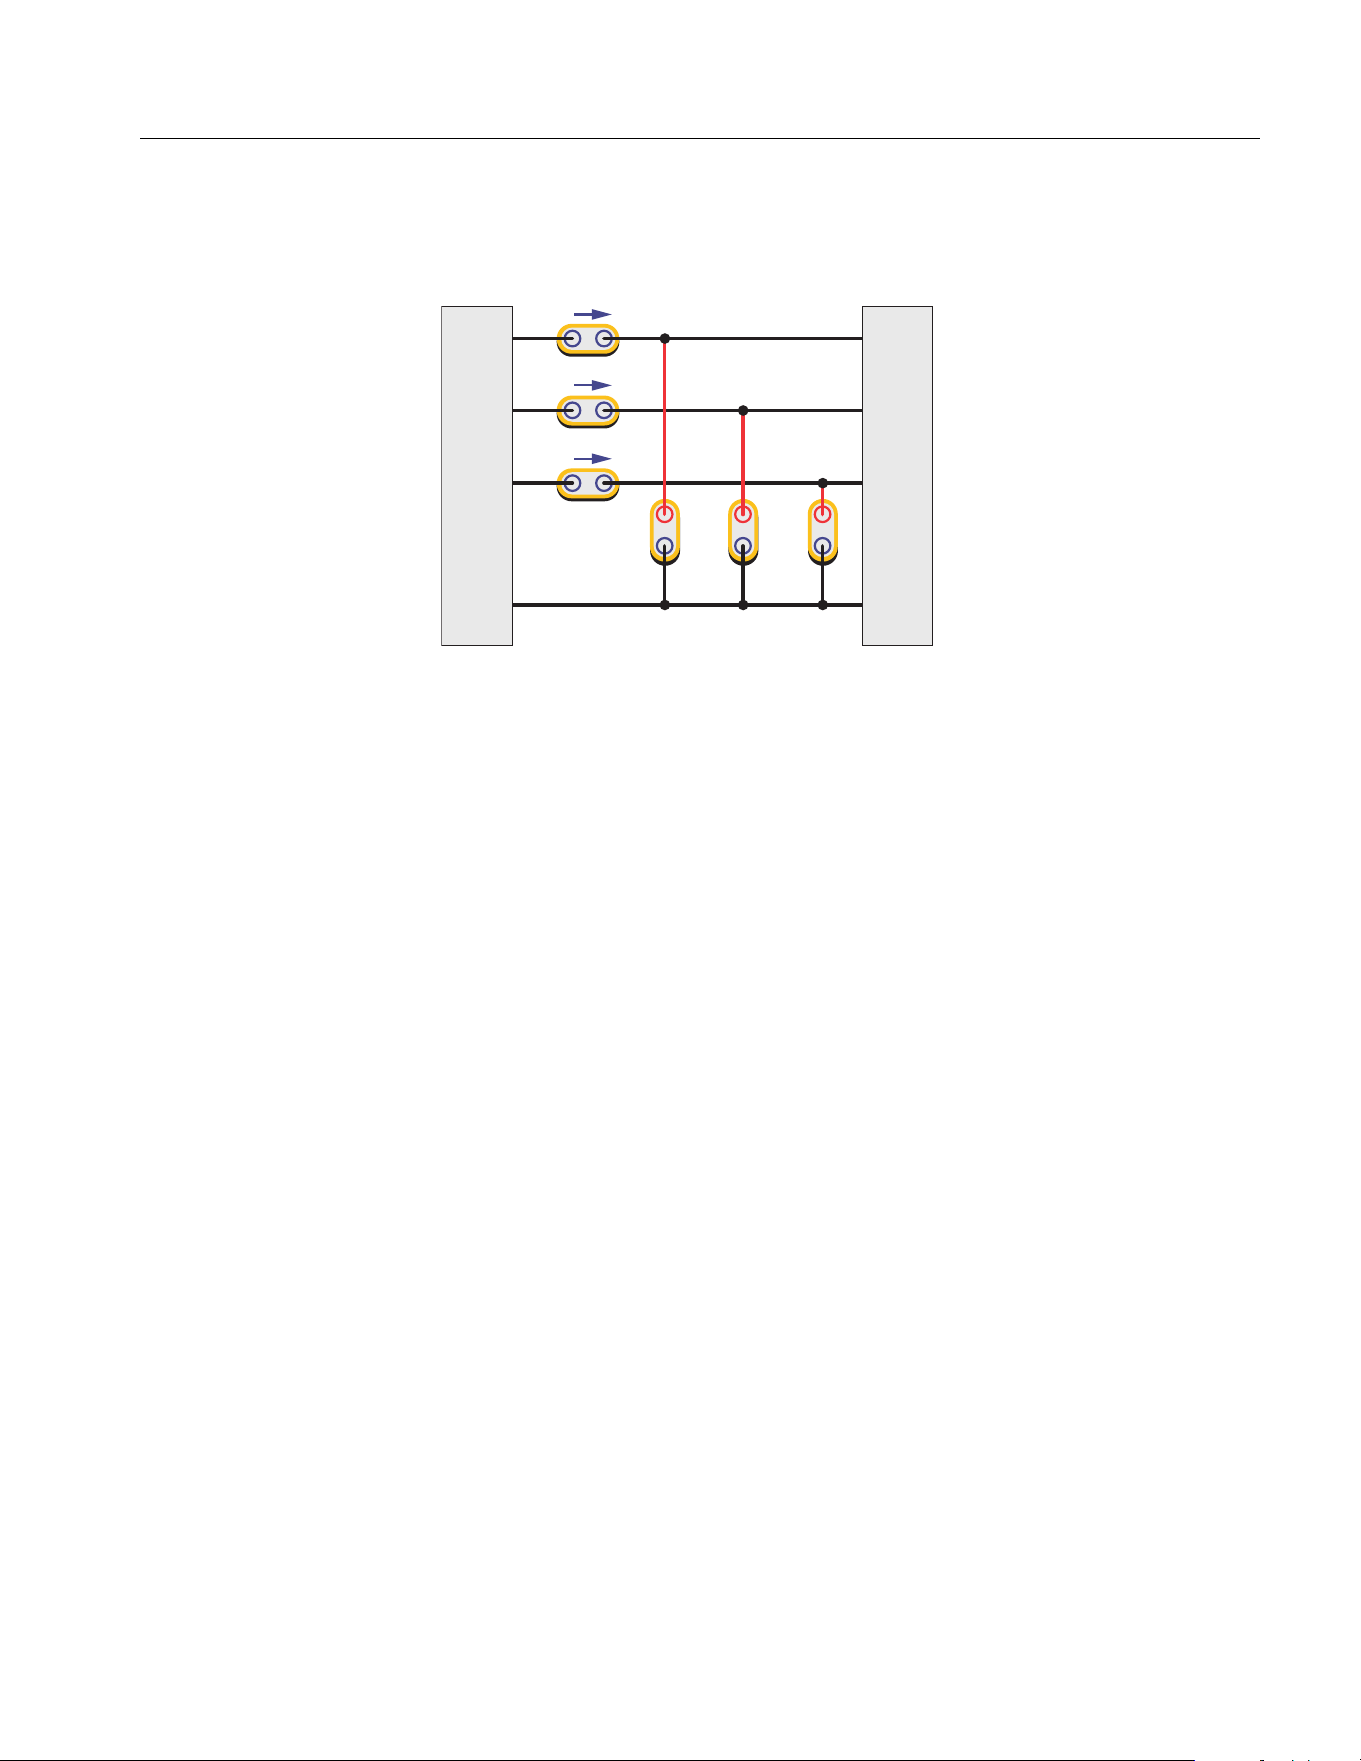
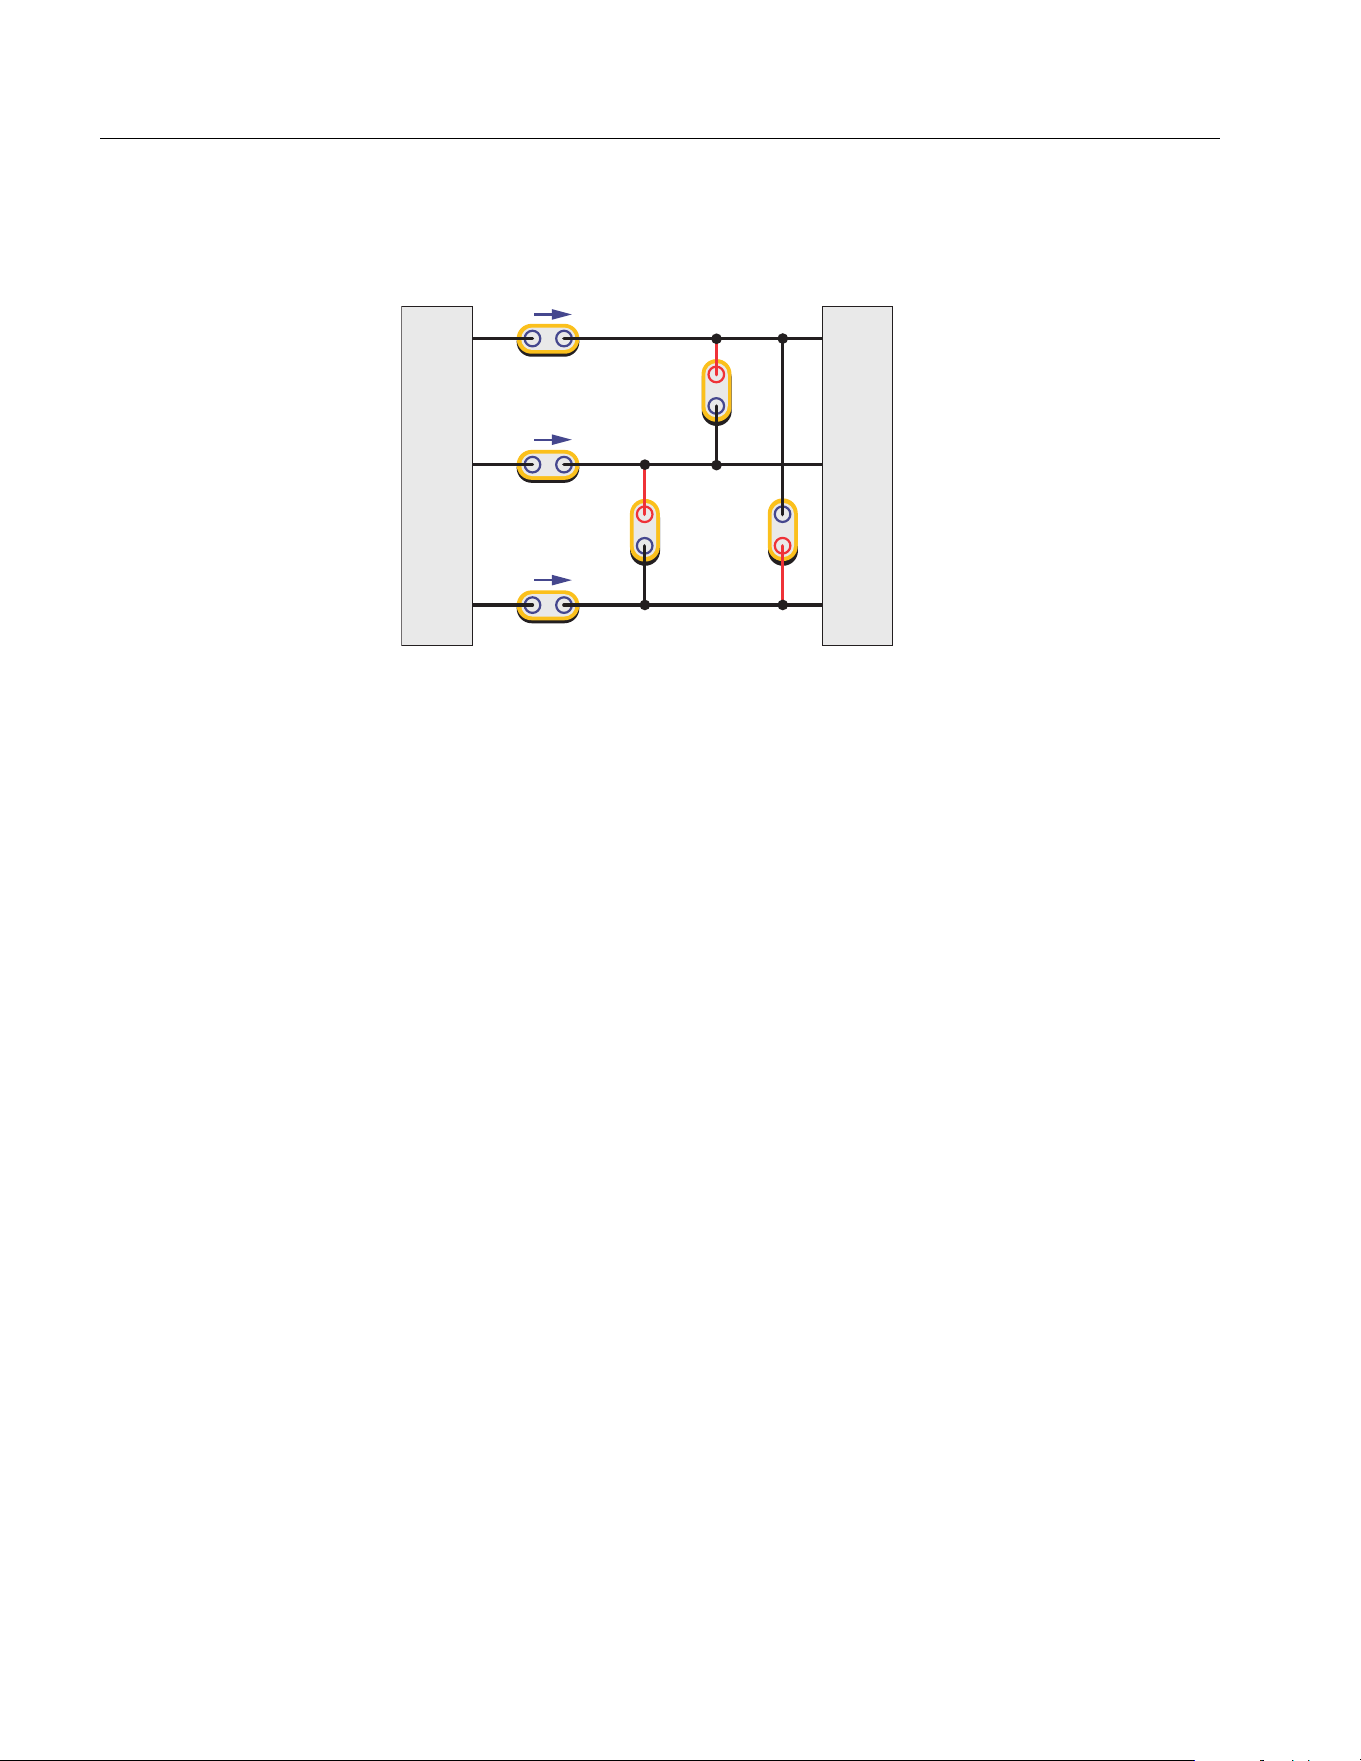
3P4W3M
Figure 9. 3P4W3M Wiring
For 3P4W3M wiring, 3 voltage measurement channels are respectively connected between each
phase line and the neutral line. 3 current measurement channels are respectively connected in series
with each phase line or clamped on each phase line with a current sensor.
For systems without neutral lines, connect 3 voltage measurement channels between the 3 phase lines
and the common ground line. For a 3P5W system, you can use a wiring group of 3P4W3M to measure
the phase and neutral line. You can select one channel and configure it as 1P2W1M to measure the
parameters between the neutral and ground line (NORMA 6004/6004+ only). If the ground and neutral
lines do not exist, connect the common ends of the 3 channels together and suspend, and the total
power measured is still valid.
For this wiring system:
1. The wiring system has the same impedance characteristics for 3 phases, a balanced measurement
system can be established.
2. The wiring system has a terminal for neutral or ground, the common mode component input to the
instrument is small, which reduces the effect of common mode components on the measurement
results.
3. The phase voltage is directly measured, and the line voltage is calculated by Δ. It is more suitable
for measuring systems of star connections.
A
I1
I2
I3
U1 U2 U3
B
C
N
Source
Load
1.888.610.7664 sales@GlobalTestSupply.com
Fluke-Direct.com
NORMA 6003/NORMA 6003+/NORMA 6004/NORMA 6004+
Users Manual
22
3P3W3M
Figure 10. 3P3W3M Wiring
For 3P3W3M wiring, 3 voltage measurement channels are respectively bridged between 2 phase lines.
3 current measurement channels are respectively connected in series with each phase line or clamped
on each phase line with a current sensor.
For this wiring system:
1. This wiring system has the same impedance characteristics for 3 phases, a balanced
measurement system can be established.
2. When measuring the frequency conversion system with the power frequency input, this wiring
system can appropriately eliminate the power frequency component in the frequency conversion
signal, which is conducive to more accurately capturing the conversion frequency.
3. The line voltage is directly measured, and the phase voltage is calculated by Δ. It is more suitable
for measuring systems of Δ connections.
4. The neutral line current can be measured by summing 3 current channel, but the neutral line
voltage cannot be measured. When the neutral line voltage/neutral line current is present, the total
power measured is also inaccurate.
I3
A
I1
I2
U2
U1
U3
B
C
Source
Load
1.888.610.7664 sales@GlobalTestSupply.com
Fluke-Direct.com
Power Analyzers
Operation
23
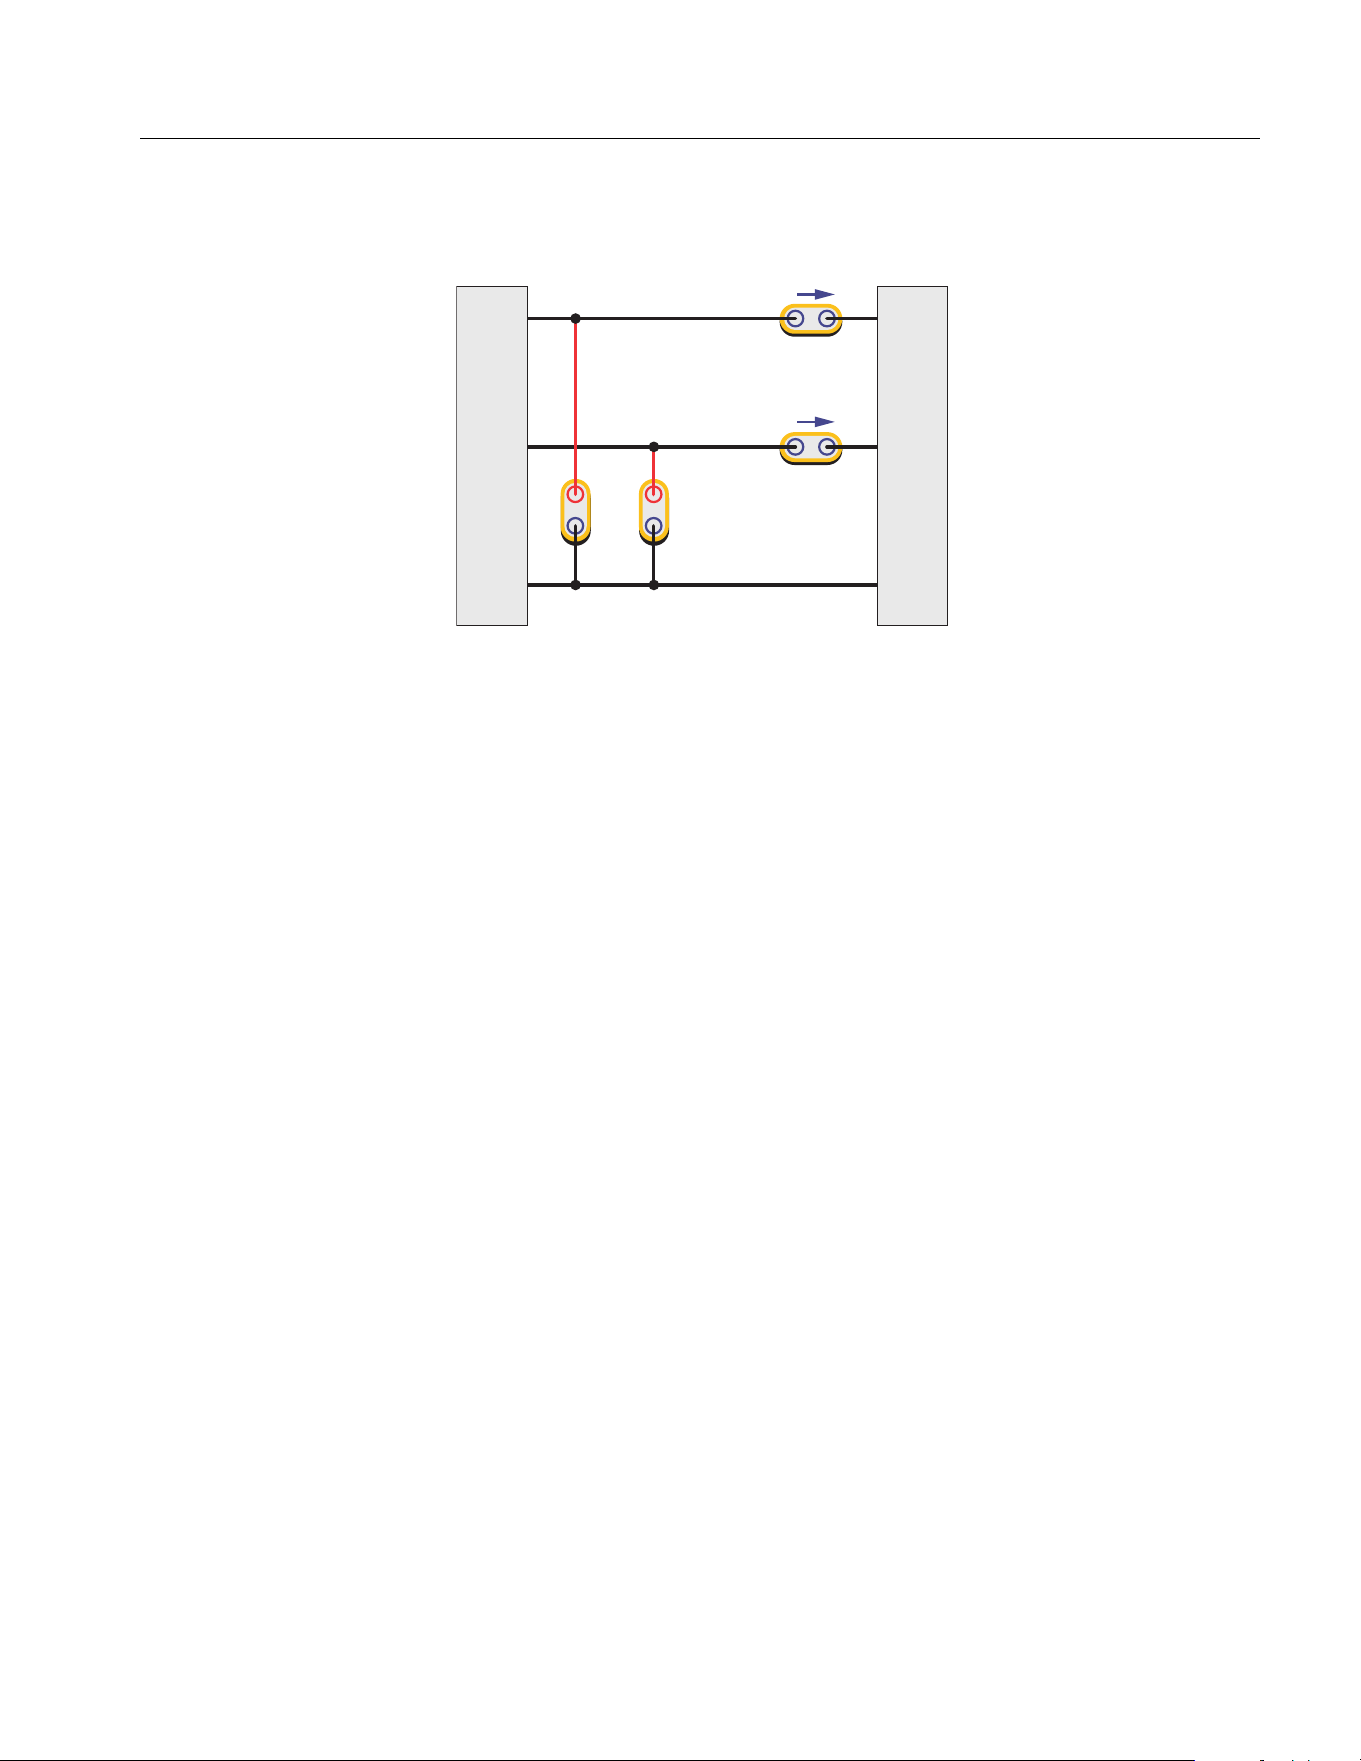
3P3W2M
Figure 11. 3P3W2M Wiring
For 3P3W2M wiring, 1 phase line (C) is used as a common line, 2 voltage measurement channels are
respectively bridged between the other 2 phase lines and this phase line. 2 current measurement
channels are respectively connected in series to the other 2 phase lines, or a current sensor is clamped
on the other 2 phase lines (Also known as two-wattmeter method or Aron method).
For this wiring system:
1. The wiring system can measure 3-phase system with only 2 channels, and 1-2 channels can be
reserved for measuring DC, single-phase AC or 3-phase AC (simultaneous measurement of 2-
channel 3-phase AC is only available for NORMA 6004/6004+).
2. When measuring the frequency conversion system with the power frequency input, this wiring
system can appropriately eliminate the power frequency component in the frequency conversion
signal, which is conducive to more accurately capturing the conversion frequency.
3. The system impedance for the 3 phases is different. The phase voltage and part of the line voltage
are calculated by Δ. In addition, this wiring system cannot measure the voltage and current of the
neutral line. When the neutral line voltage/neutral line current is present, the total power measured
is also inaccurate.
A
I1
I2
U1 U2
B
C
Source
Load
1.888.610.7664 sales@GlobalTestSupply.com
Fluke-Direct.com
NORMA 6003/NORMA 6003+/NORMA 6004/NORMA 6004+
Users Manual
24
Note
Where the current is measured may have some effect on the measurement results. To mitigate
this effect, consider where the voltage and current are measured. For a signal with high
voltage and low current, the voltage channel should be connected to the side that is closest to
the source, the current channel should be connected in series (or the sensor should be placed)
to the side that is closest to the load (as shown in the wiring diagrams). For a signal with low
voltage and high current, connect the voltage channel to the side that is closest to the load,
and connect the current channel in series (or the sensor should be placed) to the side that is
closest to the source. Please refer to the appendix
Measurement Error Caused by the Channel
Resistance
.
Wiring Group
When you select a specific wiring selection, use a combination of 2 or more channels, which is called a
wiring group.
For example, when the wiring selection of channel 1 is set to 3P3W2M, channel 1 and channel 2 form
a wiring group.
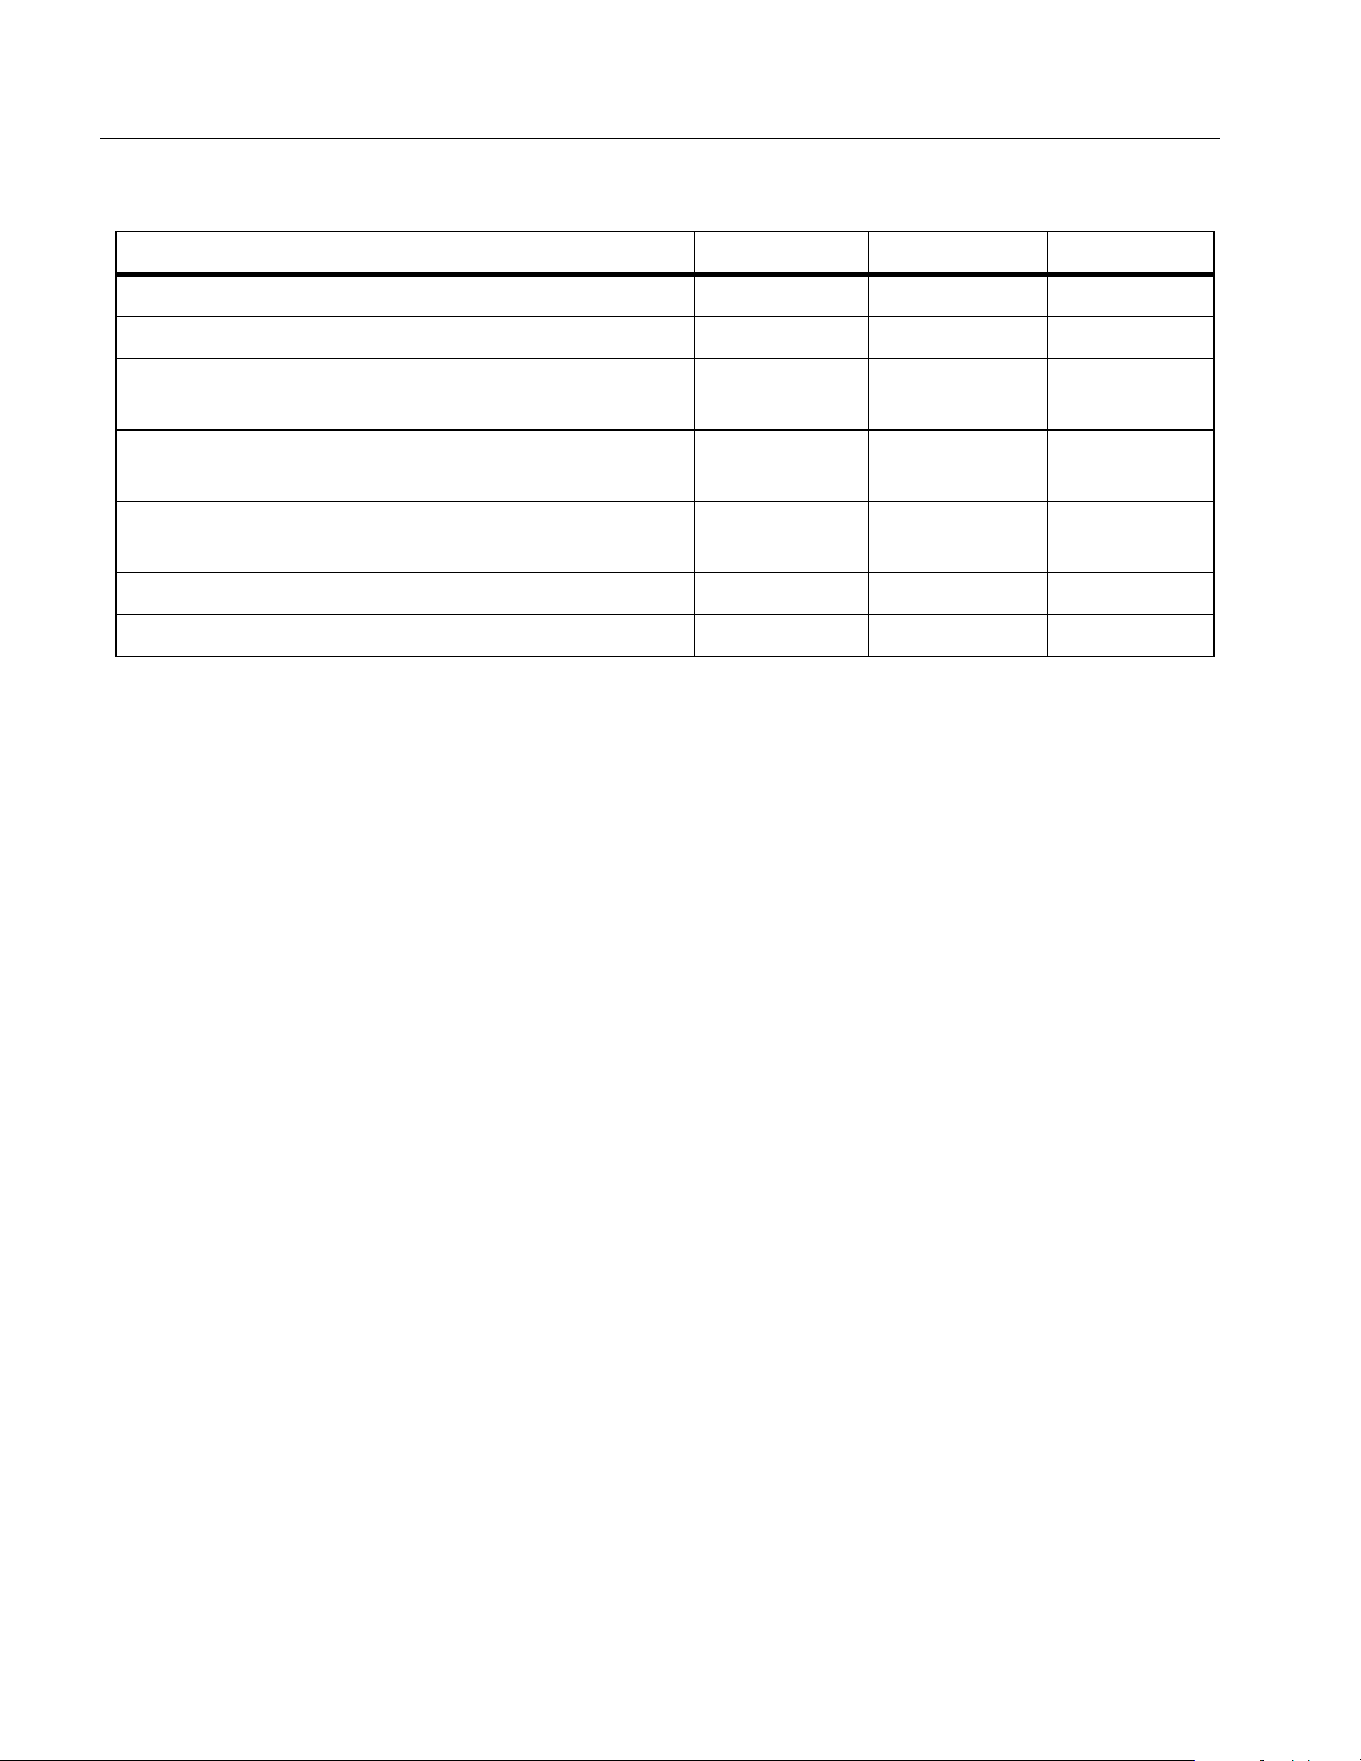
Table 9. Wiring System Comparison
3P4W3M 3P3W3M 3P3W2M
Number of channels occupied 3 3 2
Balanced test impedance Yes Yes No
The power frequency components of frequency
conversion systems can be eliminated
No Yes Yes
Phase voltage
Direct
measurement
Indirect
calculation
Indirect
calculation
Line voltage
Indirect
calculation
Direct
measurement
Partial direct
measurement
Common mode interference voltage inputted Low Moderate High
Neutral line current measurement Yes Yes No
1.888.610.7664 sales@GlobalTestSupply.com
Fluke-Direct.com
Power Analyzers
Operation
25
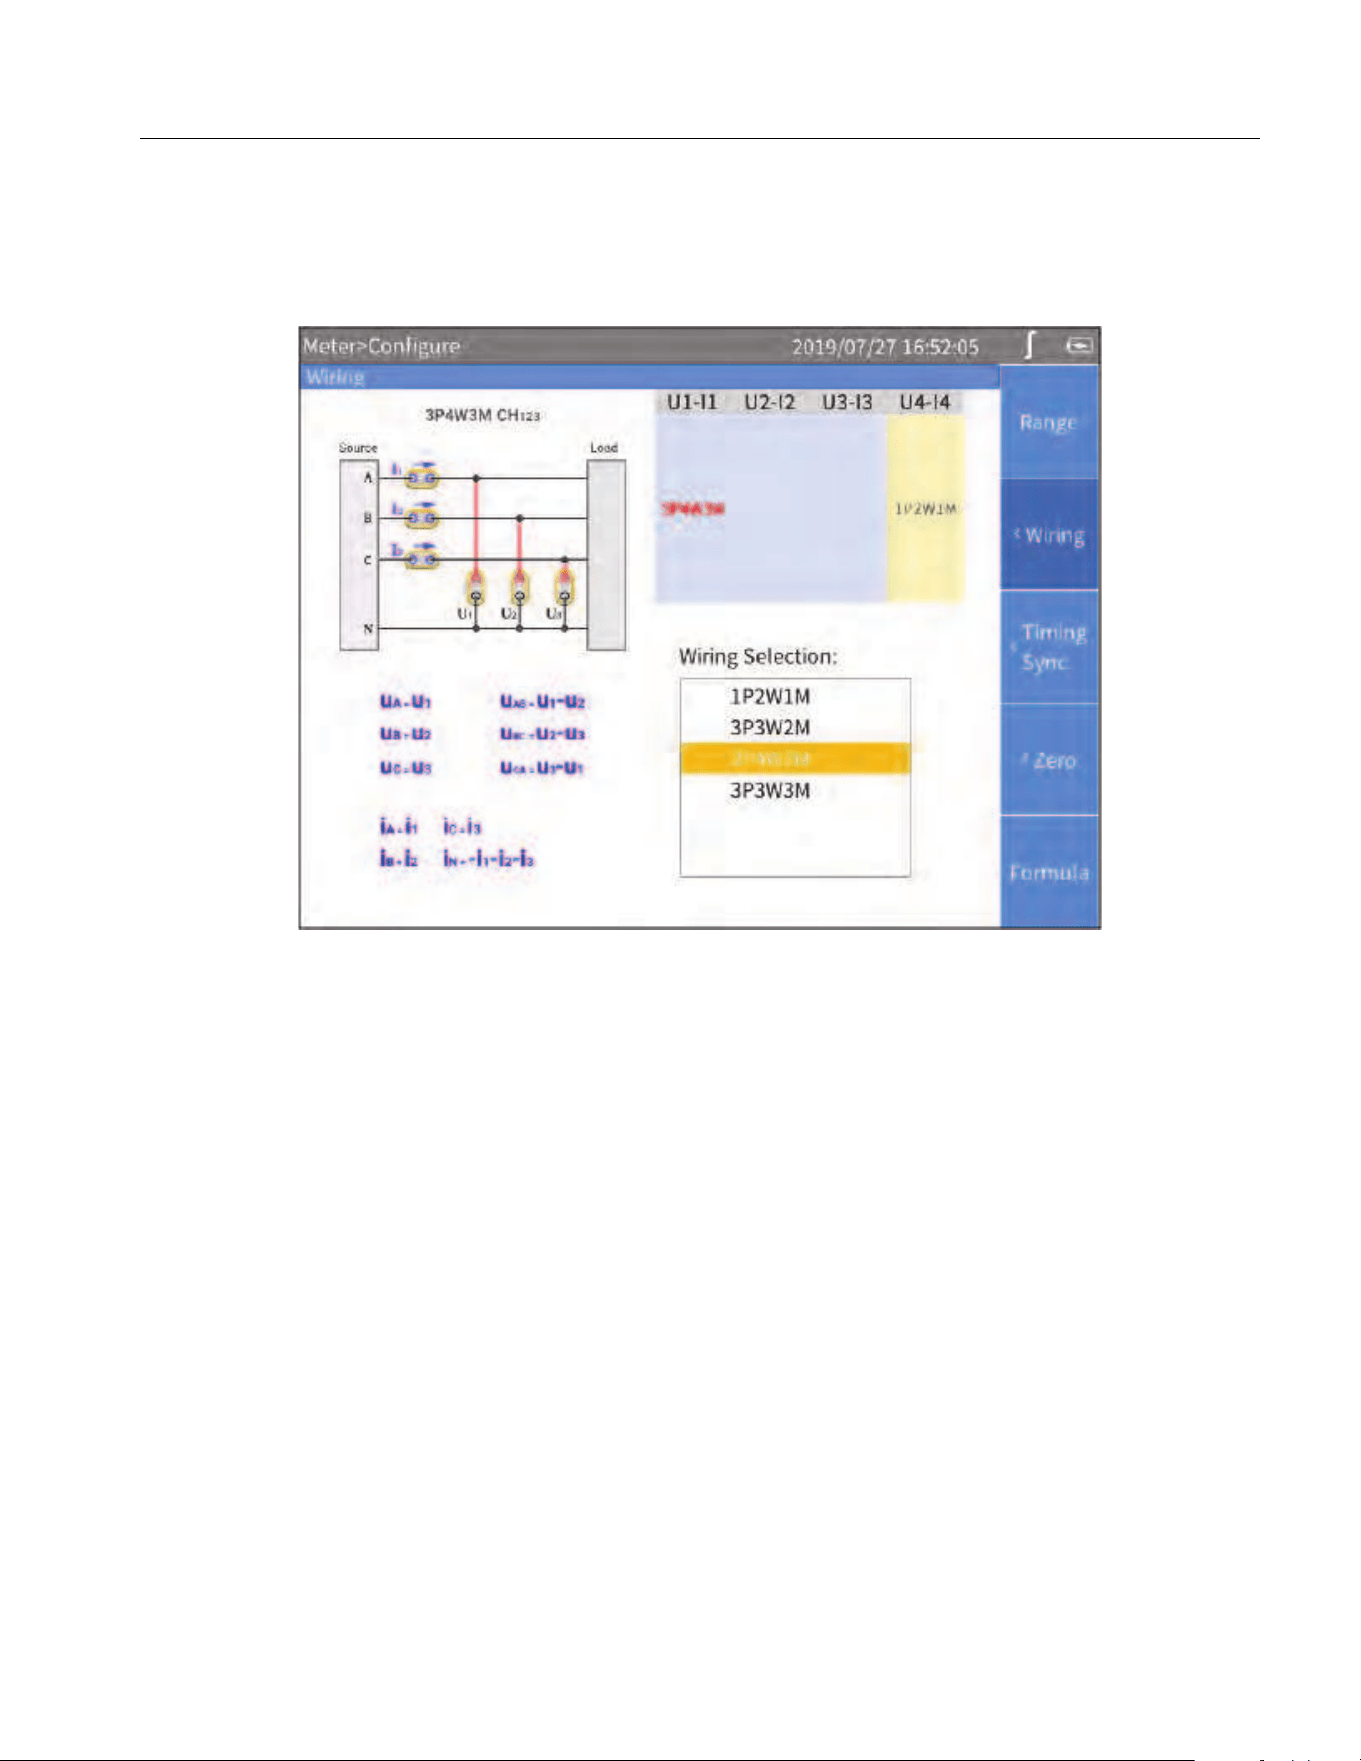
Enter the Wiring Selection Configuration:
1. From the Main screen of any view mode select
1 (Configure) > 2 (Wiring).
2. The Configuration interface of wiring selection is as shown in
Figure 12.
Figure 12. Wiring
Note
The optional wiring selection is related to the number of channels equipped with the Analyzer,
and the interface of wiring selection will be different. Proper selection of wiring is conducive to
ensuring more accurate measurements.
The wiring Configuration interface is generally divided into these parts:
• Channel selection: The upper right part shows the wiring group configuration of all 3/4 channels.
Different wiring groups can be selected by using the left and right arrow (M N) keys. The name of the
selected wiring group is highlighted in red.
• Wiring selection: The lower right part shows the wiring options supported by the currently selected
channel. Use the up and down arrow (K L) keys to select the wiring mode of the corresponding
channel.
• Wiring diagram: The upper left part shows the wiring diagram of the currently selected wiring
mode in the “Wiring Selection”.
• Formula: The lower left part shows the parameter calculation method of the currently selected
“Wiring Selection”.
1.888.610.7664 sales@GlobalTestSupply.com
Fluke-Direct.com

NORMA 6003/NORMA 6003+/NORMA 6004/NORMA 6004+
Users Manual
26
Make a Wiring Selection:
1.
In the Wiring screen (
Figure 12), use the left and right arrow (M N) keys to select a channel or wiring
group in Channel Configuration. The wiring selection of the selected channel/wiring group is
highlighted.
2. Use the up and down arrow (K L) keys to select the appropriate wiring mode in Wiring Selection.
3. Push S.
4. Use the arrow keys (M N K L) and S to complete the configuration of the remaining items.
5. Push J to go back to the previous menu. Push the button continuously to go back to the main
screen.
Set Sync Source and Update Rate
The sync source is a reference input signal, and the time interval of the measurement is determined
according to the frequency of the selected sync source signal, and the sample values in this interval
are used to generate measurements such as voltage, current and power, thereby ensuring calculation
with the signal of the entire cycle to avoid measurement errors due to signal truncation.
1. From the Main screen of any view mode select
1 (Configure) > 3 (Timing Sync).
The setup interface of Timing/Sync is as shown in
Table 10.
Note
The wiring groups that can be configured in the interface depends on the wiring selection. See
Set the Wiring Selection for details.
2. Use the up and down arrow (K L) keys to move the cursor to Update Rate.
3. Push S and use the up and down arrow (K L) keys to select the corresponding option. Then
push S again to confirm the option.
4. Use the up and down arrow (K L) keys to move the cursor to the first wiring group in Source.
5. Push S and use the up and down arrow (K L) keys to select the corresponding option. Then
push S again to confirm the option.
Table 10. Timing and Sync
Item Description
Update rate
The time interval at which the DSP calculates the data values.
• 100 ms
• 200 ms
• 500 ms
•1 s
Source
The sync source of each wiring group.
All channels in each wiring group can only share the same sync source.
The available sync sources include voltage and current signals for all
channels in the wiring group.
1.888.610.7664 sales@GlobalTestSupply.com
Fluke-Direct.com
Power Analyzers
Operation
27
6. Use the left and right arrow (M N) keys and S to select each of the remaining wiring groups one
by one.
7. Push J to go back to the previous menu. Push Jcontinuously to go back to the main
screen.
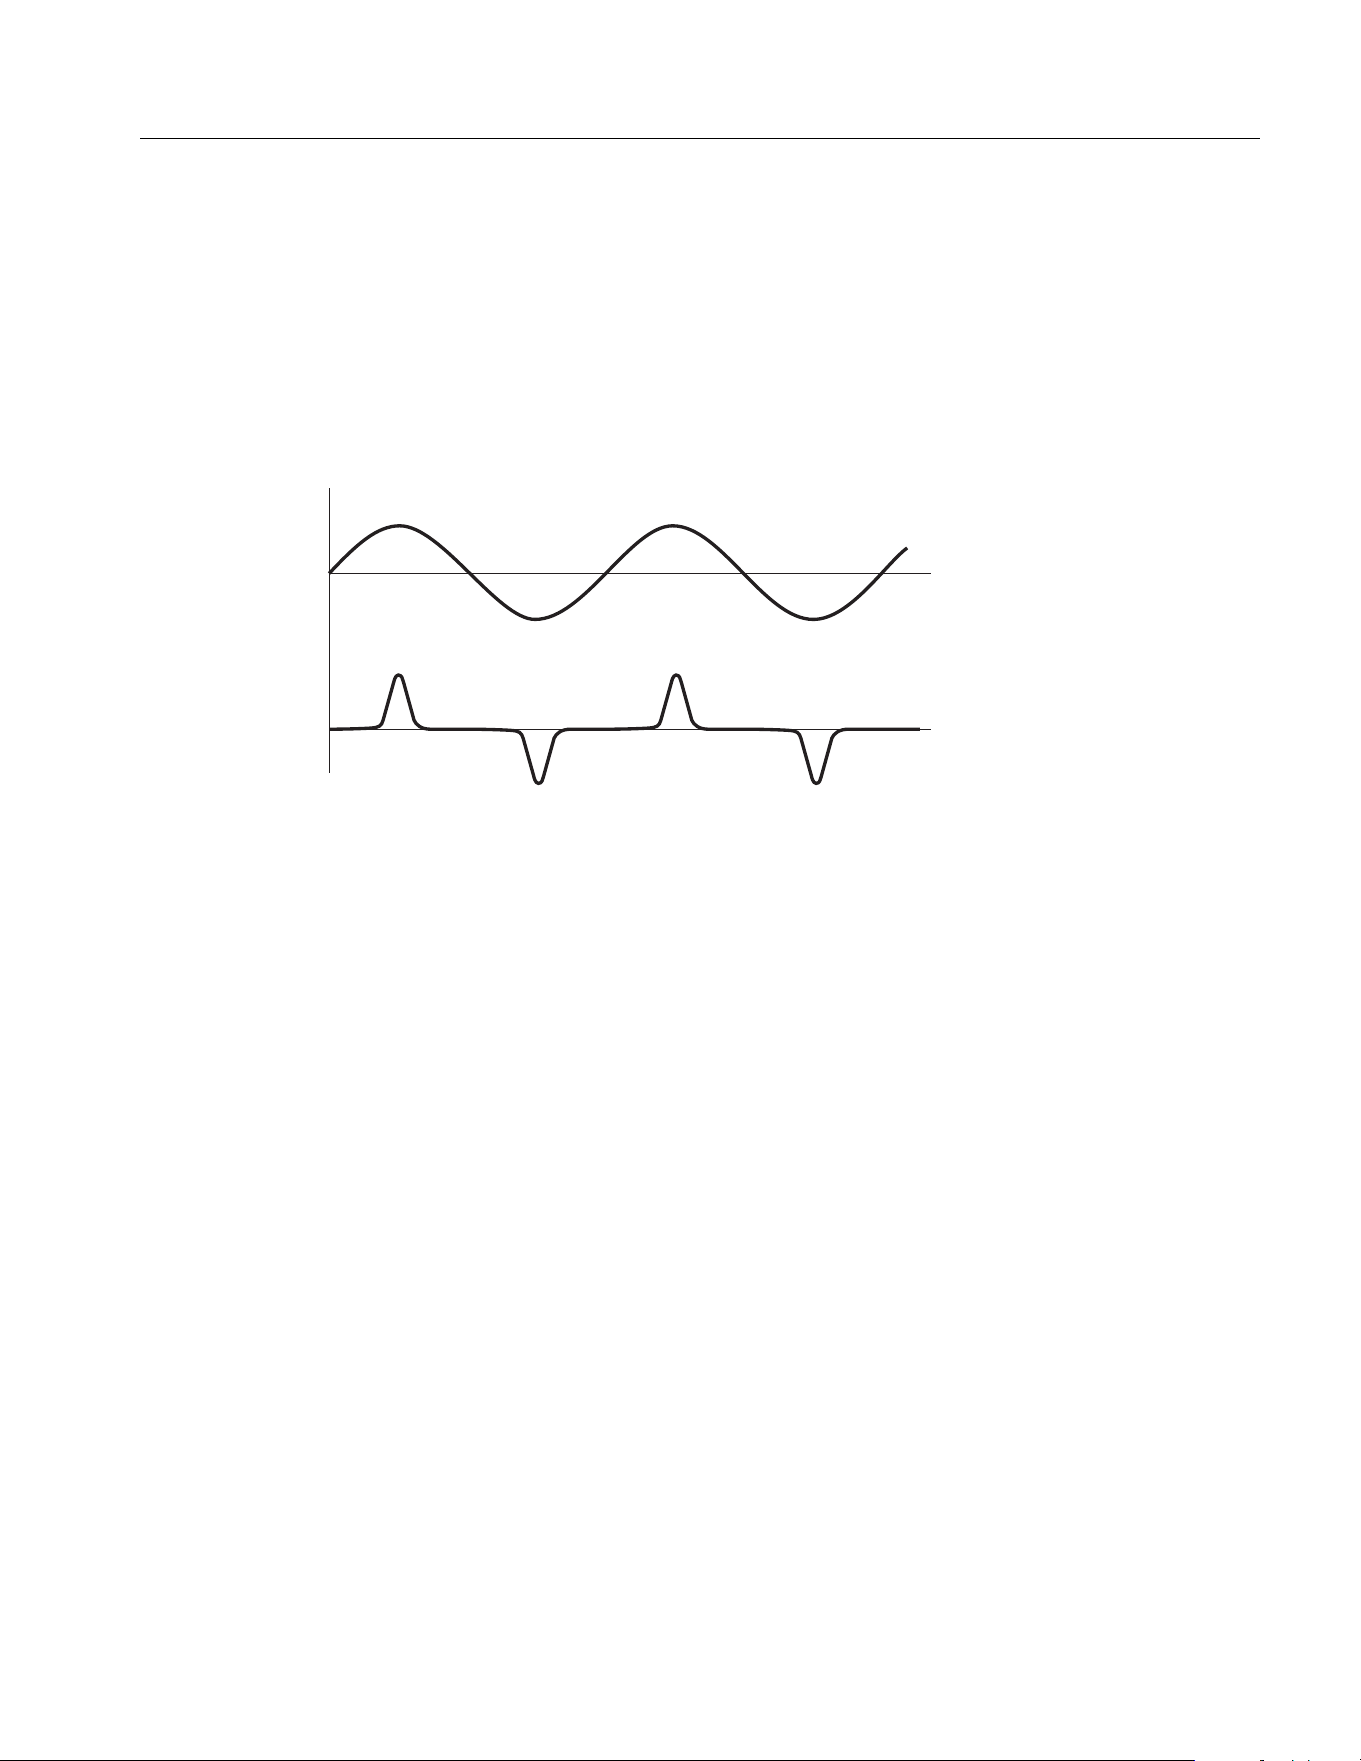
Set Sync Source
When the Analyzer measures AC signals, most of the measurements are calculated using the full-cycle
sampling method to reduce the truncation error. In this case, a channel needs to be selected as the
sync source to determine the length of the entire cycle.
Figure 13. Set Sync Source
For each wiring group, you can select a sync source, and the voltage or current of any channel in the
wiring group can be selected as the sync source. In general, the voltage of the power frequency system
is more stable than the current. Fluke recommends using the voltage as the sync source. The voltage
of the frequency conversion system has a large high-frequency component, while the high-frequency
component of the current is relatively small. Therefore, when the current is relatively stable, the current
can be selected as the sync source. However, if the current value is small or it is not stable, then the
voltage should be selected as the sync source.
Zero
The function of zeroing is to reset the current value of the specified channel to calibrate the zero
position of the Analyzer itself and the external sensor. The Analyzer supports zeroing each channel.
1. From the Main screen of any view mode select 1 (Configure) > 4 (Zero).
2. For each channel you want to zero:
a. Use the arrow (K L M N) keys to move the cursor to the option you want to zero,
b. Push S, the selection box of the current item turns yellow and a black “×” symbol shows,
indicating that it has been selected. If you push S again, the selection box will be restored
to blank, indicating that it is not selected.
3. Use the arrow (K L M N) keys to move the cursor to the Zero button and push S.
Voltage
Current
Synchronous Source: Voltage
1.888.610.7664 sales@GlobalTestSupply.com
Fluke-Direct.com
NORMA 6003/NORMA 6003+/NORMA 6004/NORMA 6004+
Users Manual
28
Define Calculation Formula
The Analyzer allows the user to define efficiency and some numerical calculation formulas.
Define Efficiency Calculation Formula
The Analyzer allows the user to edit the efficiency calculation formula as needed.
1. From the Main screen of any view mode select 1 (Configure) > 5 (Formula) > 1 (ƞ).
The interface of calculation formula definition is as shown in
Table 11.
2. Use the up and down arrow (K L) keys to move the cursor to the numerator of the efficiency (ƞ)
formula. When the numerator portion turns yellow, push S.
A keyboard shows on the screen.
The keyboard is divided into 3 parts: the top area shows all the measured parameters of the main
unit, the middle “Remote” area shows the measured parameters of the remote slave unit in the
dual-unit interconnection mode (in single unit mode, this area is gray and not selectable). The
bottom area contains operators and buttons.
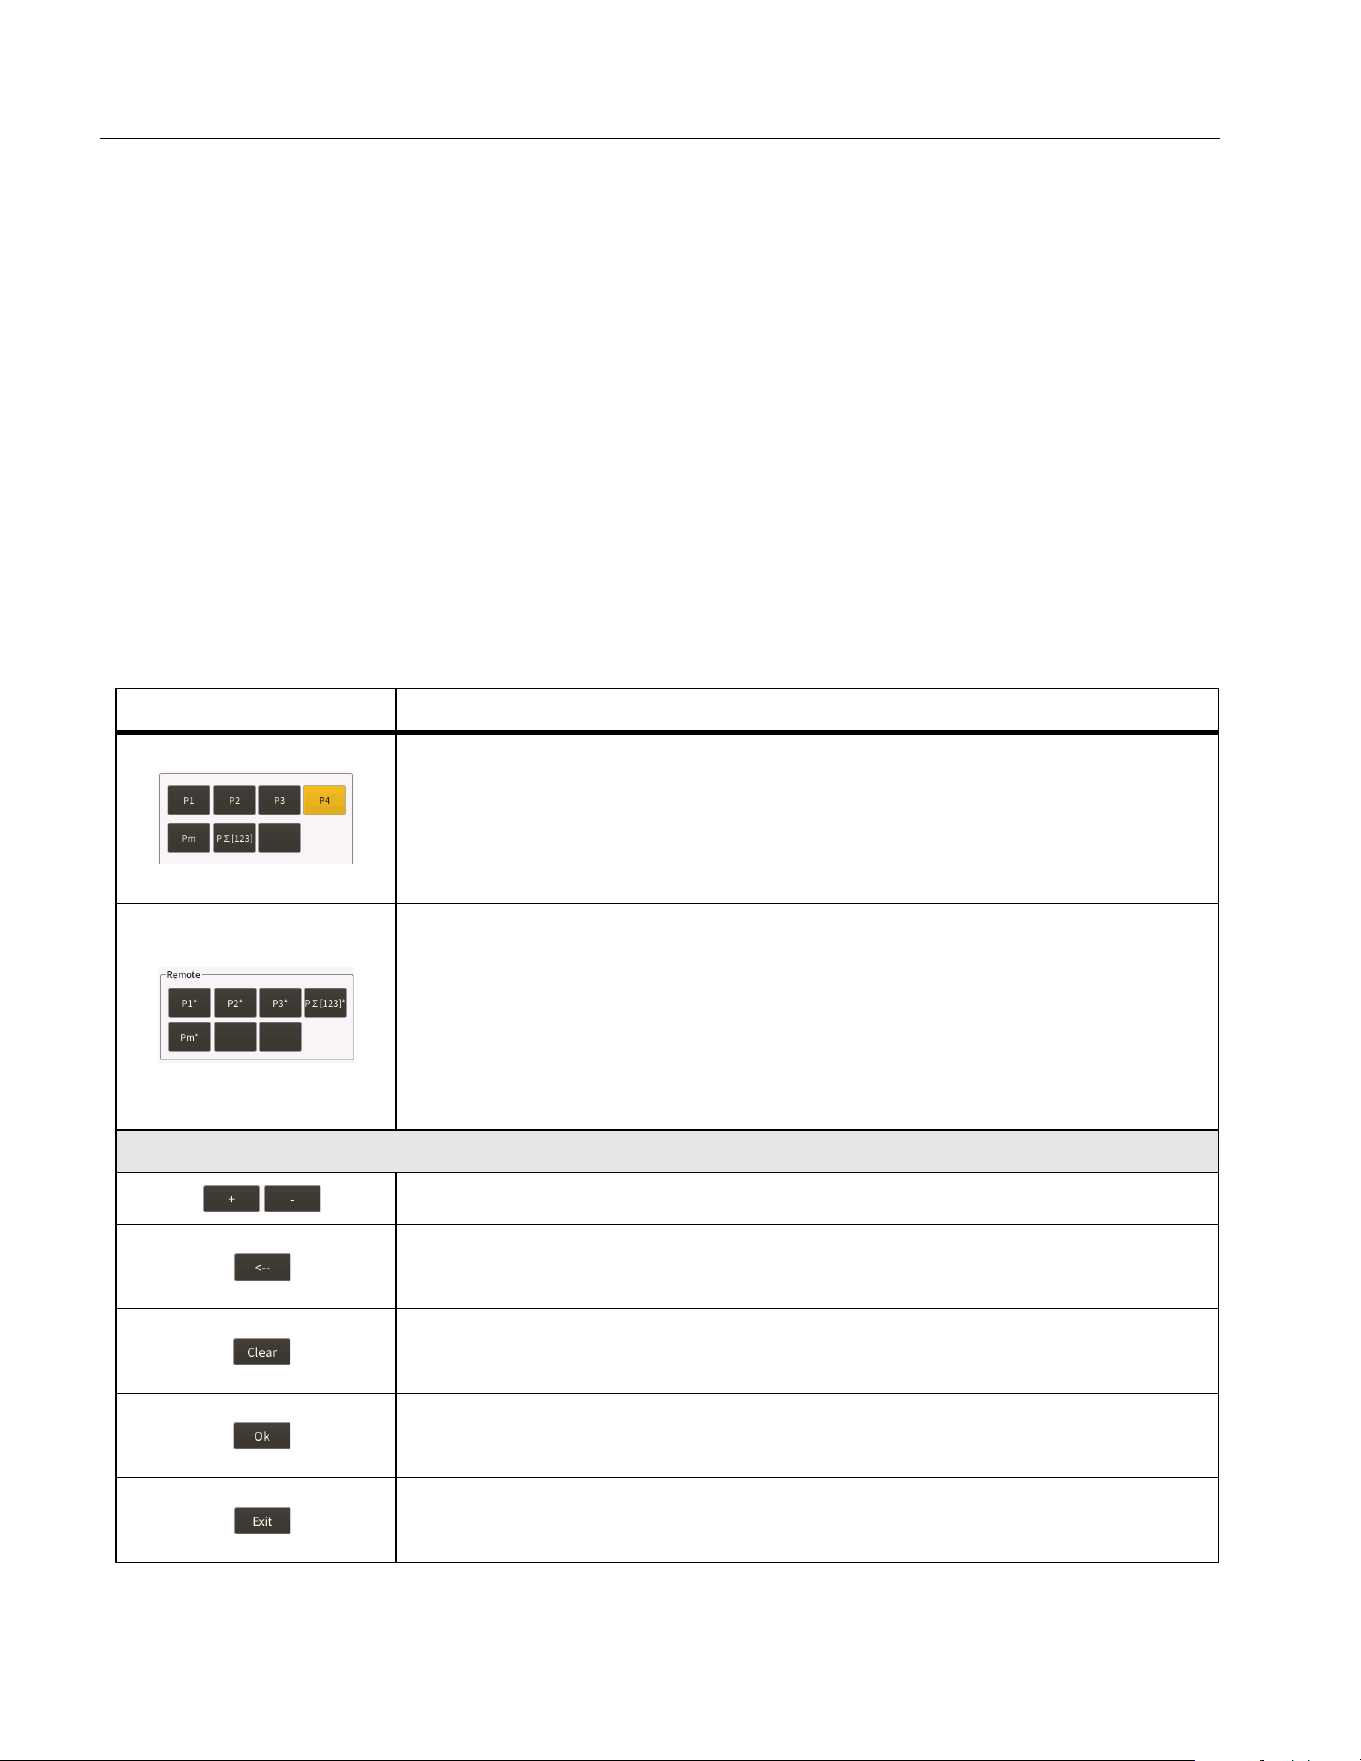
Table 11. Define Calculation Formula
Item Description
Measured parameters from main unit
This part of the keyboard lists all measurable power symbols for the
Analyzer's current wiring selection. For the specific meaning of each
parameter, refer to section Measurement Calculation Method in the
appendix.
Measured parameters from the slave
• The measured parameters of the remote slave unit in the dual-unit
interconnection mode.
• In single unit mode, this part is gray and cannot be selected.
• For the specific meaning of each parameter, refer to section
Measurement Calculation Method in the appendix.
Operators and buttons
Operators of addition and subtraction
Delete key
Delete a symbol before the cursor.
Clear key
Clear all characters in the input box.
OK key
Accept the current input and go back.
Exit key
Go back and ignore this modification.
1.888.610.7664 sales@GlobalTestSupply.com
Fluke-Direct.com
Power Analyzers
Operation
29
3. Use the arrow (K L M N) keys to move the cursor over the corresponding character on the
keyboard, then push S to enter the value into the input box at the top.
4. Continue to use the arrow (K L M N) keys and S to enter an expression that conforms to the
efficiency calculation rule in the input box.
Note
During input process, if the input does not conform to the rules, the Analyzer will indicate the
input is incorrect. Please double check that the input conforms to the efficiency calculation
expression rules.
5. Use the arrow (K L M N) keys to move the cursor to OK and push S.
6. For the denominator of the efficiency (ƞ) formula, continue to use the arrow (K L M N) keys and
S to enter a formula.
7. Push Jto go back to the main screen.
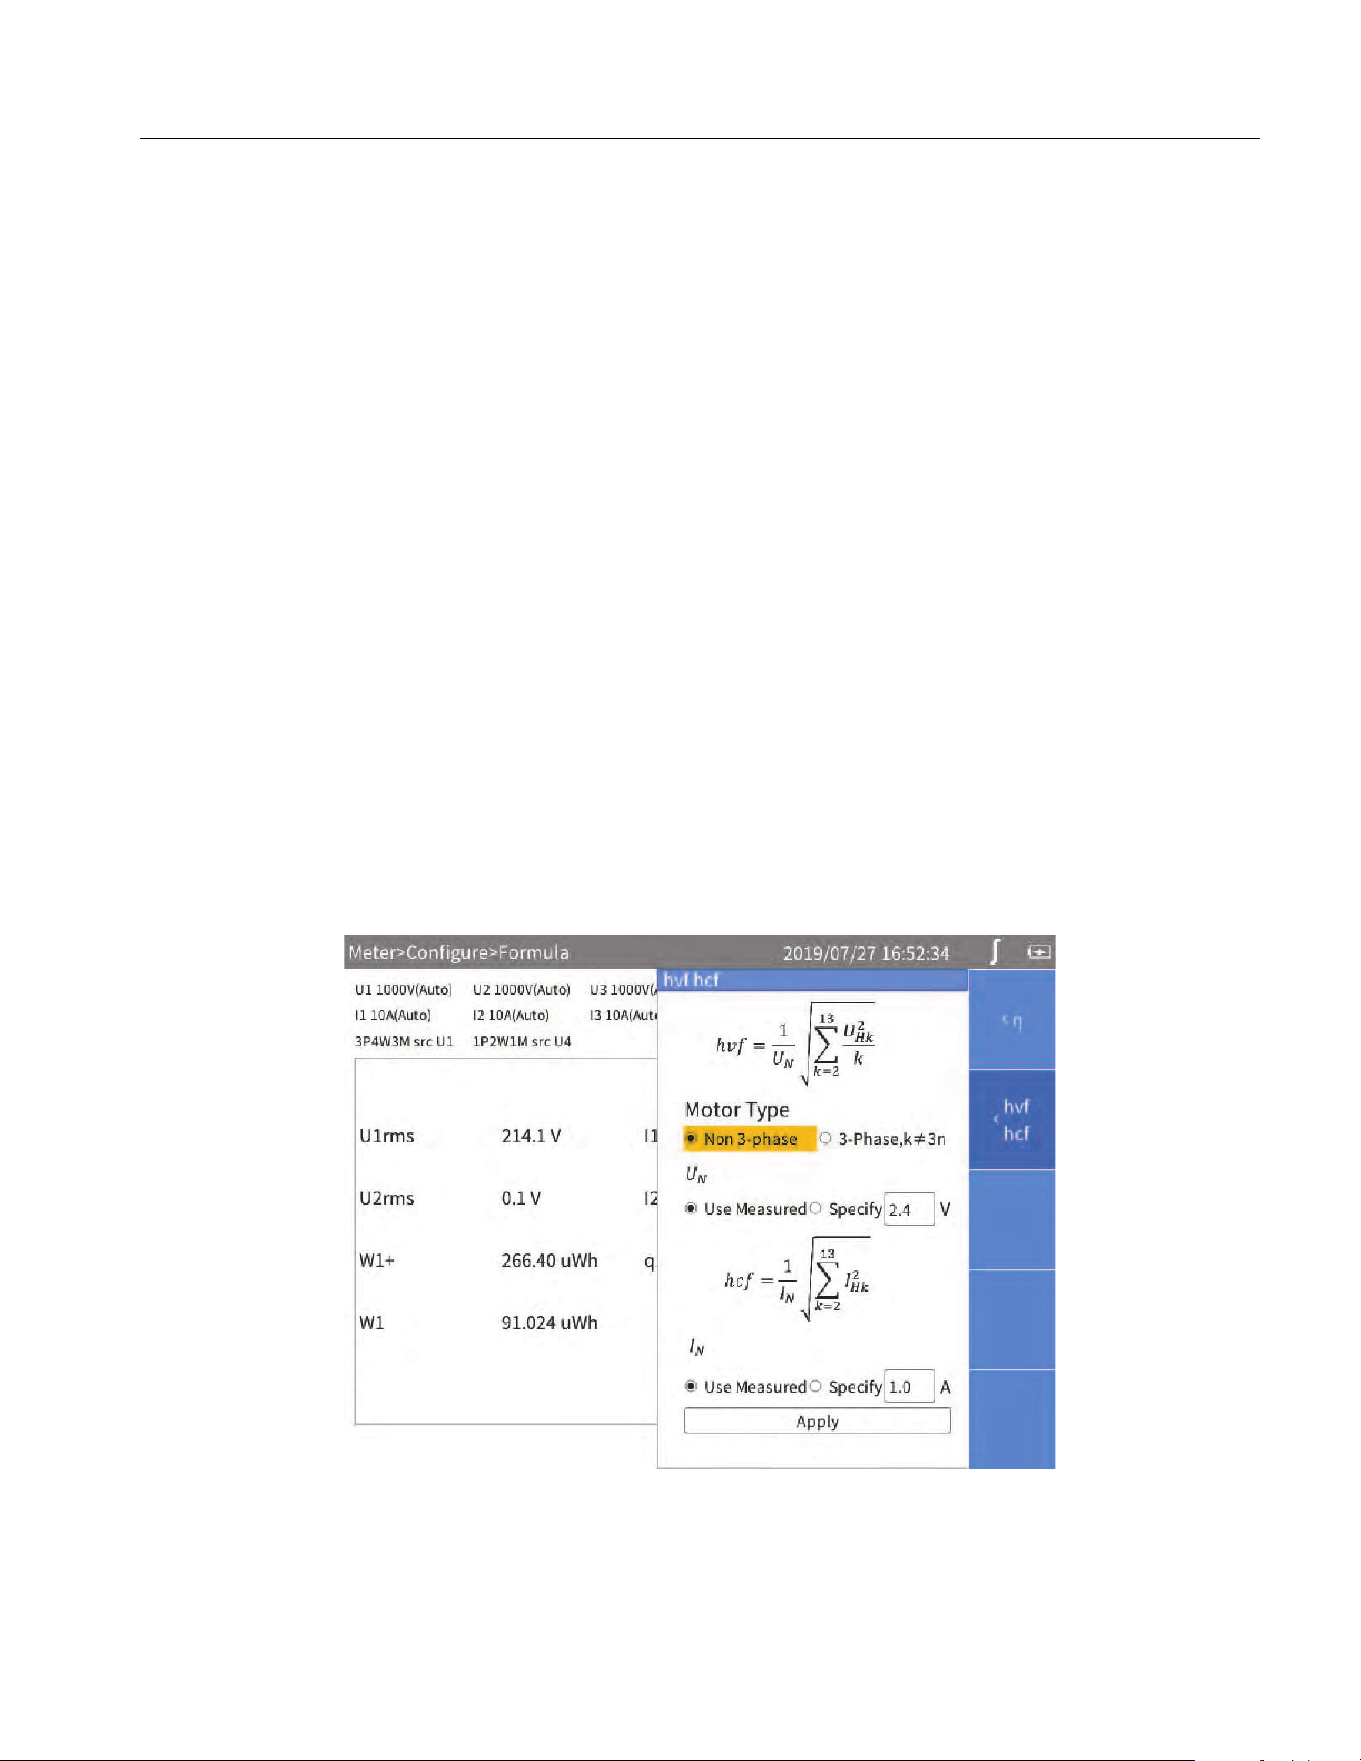
Define hvf/hcv Calculation
hvf/hcv is a numerical measurement item used for measuring rotating motors according to IEC60034. It
is necessary to configure the type of motor and rated voltage/current according to the actual test
requirements.
1. From the Main screen of any view mode select 1 (Configure) > 5 (Formula) >
2 (hvf hcf).
The interface of calculation formula definition is as shown in
Figure 14.
In the hvf/hcv calculation page, the upper part is used to calculate hvf, and the lower part is used to
calculate hcf.
Figure 14. hvf/hcf Calculation Formula
2. Use the arrow (K L M N) keys to move the cursor to Motor Type, select Non 3-phase or 3-phase,
k≠3n and then push S.
1.888.610.7664 sales@GlobalTestSupply.com
Fluke-Direct.com

NORMA 6003/NORMA 6003+/NORMA 6004/NORMA 6004+
Users Manual
30
3. Use the arrow (K L M N) keys to move the cursor to “U
N
” (rated voltage) select Use Measured or
Specify and then push S.
o If Use Measured is selected, the measured voltage fundamental amplitude is used as the rated
voltage.
o If Specify is selected, you can specify the rated voltage. Move the cursor to the corresponding
input box, then push S, and input the corresponding value using the on-screen keyboard,
then move the cursor to OK key on the keyboard, and push S.
4. Use the arrow (K L M N) keys and Sto enter the hcf settings.
For I
N
,
o If Use Measured is selected, the measured current fundamental amplitude is used as the rated
current.
o If Specify is selected, the rated current can be specified.
5. Use the arrow (K L M N) keys to move the cursor to the Apply button and push S. The
settings are not saved to the device if you do not select Apply.
6. Push J to go back to the previous menu.
Meter
When the Analyzer is turned on, it defaults to the Meter mode, and the current measurements are
displayed in a list on the main screen.
You can also push l to enter the Meter mode.
Table 12 lists the items displayed on the screen.
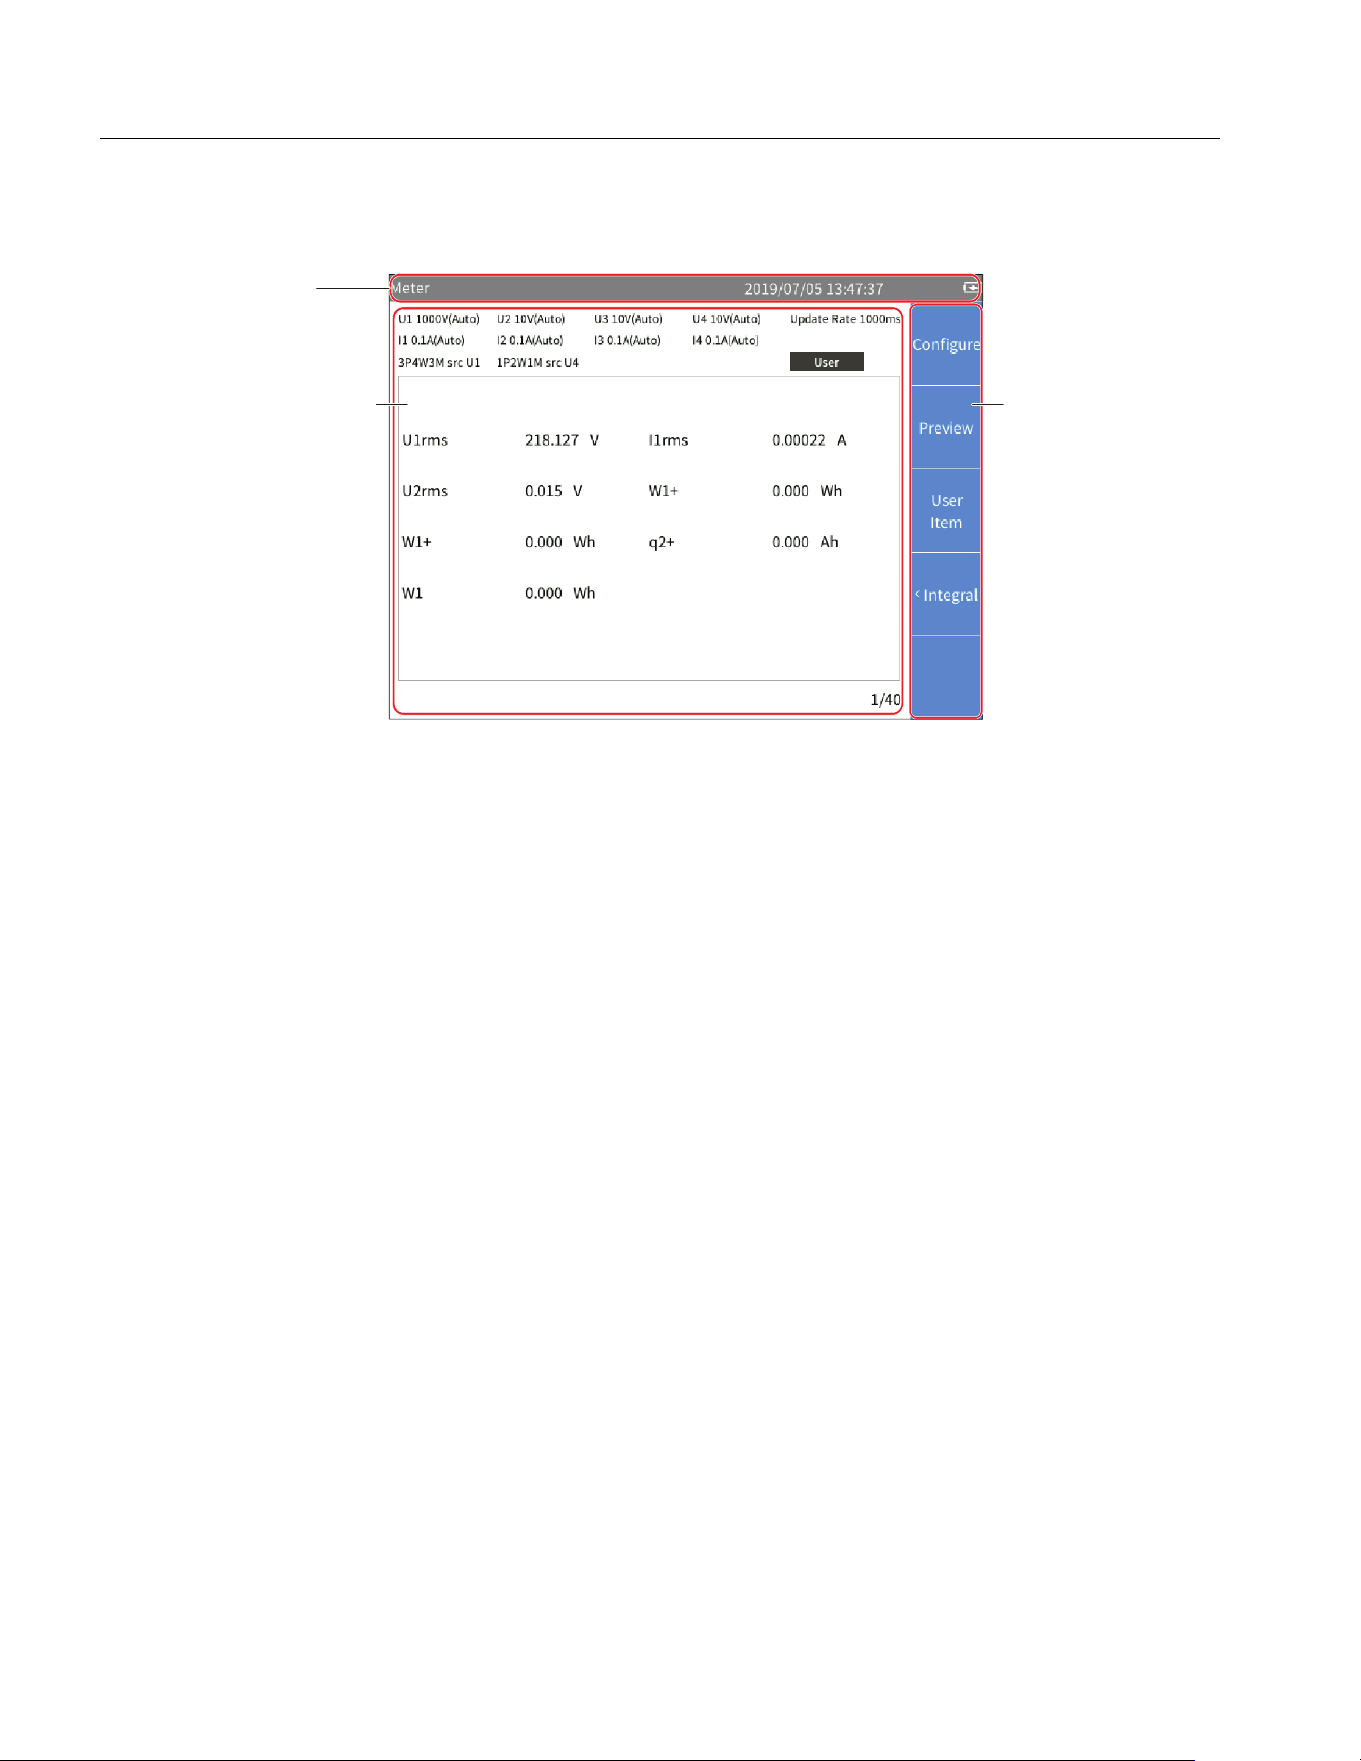
Table 12. Meter Screen
Item Description
Range configuration
information
Current range information for each module
• The representation with (Auto) indicates auto range, which
automatically switches the range according to the signal.
• The representation without (Auto) indicates that the current range is
fixed, the range of the value displayed and the range will not change
with the signal.
Wiring configuration
information
Current wiring selection for each wiring group.
Update rate
The current update rate of the Analyzer. See
Set Sync Source and Update
Rate
.
Current state
• Preview: Currently in Preview mode.
• User Item: Currently in User Item mode.
• HOLD: Currently in data hold state. The value displayed in the value
list area does not change with the actual signal.
Value List
The measurement items are displayed in a list according to the user's
settings. See
Preview and User Item View for details.
1.888.610.7664 sales@GlobalTestSupply.com
Fluke-Direct.com
Power Analyzers
Operation
31
Preview
In Preview mode, all currently available measurements are shown in a certain order on the screen.
Enter Preview Mode:
• From the Main screen of Meter select 2 (Preview).
The Preview screen is as shown in
Table 13 and the state label shows Preview.
Soft keys
1 (Configure): Global configuration, see
Global Configuration.
2 (Preview): Enter Preview mode, see
Preview.
3 (User Item): Enter User-defined Mode, see
User Item View.
4 (Integral): Integration Operation, see
Integration
Bottom Bar Displays the current page number.
Table 13. Meter Screen - Preview
Item Description
1 Sort by Function
Push 1 (Sort by Func.) to sort the measurements by functions.
The label of Sort by Func. is highlighted in dark blue.
2 Sort by Channel
Push 2 (Sort by CHANNEL) to sort the measurements by
channels.
3 Display
Displays the number of items
The number of measurements shown on each screen up to
20 measurements:
•4
•8
•12
•16
•20
4
Page up key
When the number of measurements available exceeds the number
of items displayed on each screen, the and keys can be used
to scroll forward or backward to display more measurements.
The page number of the current screen is displayed in the prompt
bar at the bottom. “1/40” means there are 40 pages in total, and the
current screen is page 1.
5
Page down key
Page down key for scrolling backward to display next page.
Table 12. Meter Screen (cont.)
Item Description
1.888.610.7664 sales@GlobalTestSupply.com
Fluke-Direct.com
NORMA 6003/NORMA 6003+/NORMA 6004/NORMA 6004+
Users Manual
32
User Item View
The number of measurements can be very large depending on different wiring selection and the
number of channels. Even if the maximum number of measurements is displayed on each screen,
there could be dozens of screen pages.
The Analyzer features a User Item View function, which allows users to select up to 20 most interesting
measurements and display them on a single screen, thus avoiding frequent use of the and keys.
Enter User Item View:
• From the main screen of Meter select 3 (User Item).
The User Item view is as shown in
Table 14 and the data source label shows User Item”
Note
When you enter the User Item view for the first time, the default items are U1rms... U4rms,
I1rms... I4rms dependent on models. You can add up to 20 measurements to the list.
The Analyzer can remember the User Item views. Even if the Analyzer is turned off, the list
defined last time will be automatically displayed when you enter the User Item view next time.
Add Measurement Items
1. From the main screen of Meter, select 3 (User Item) > 2 (Add).
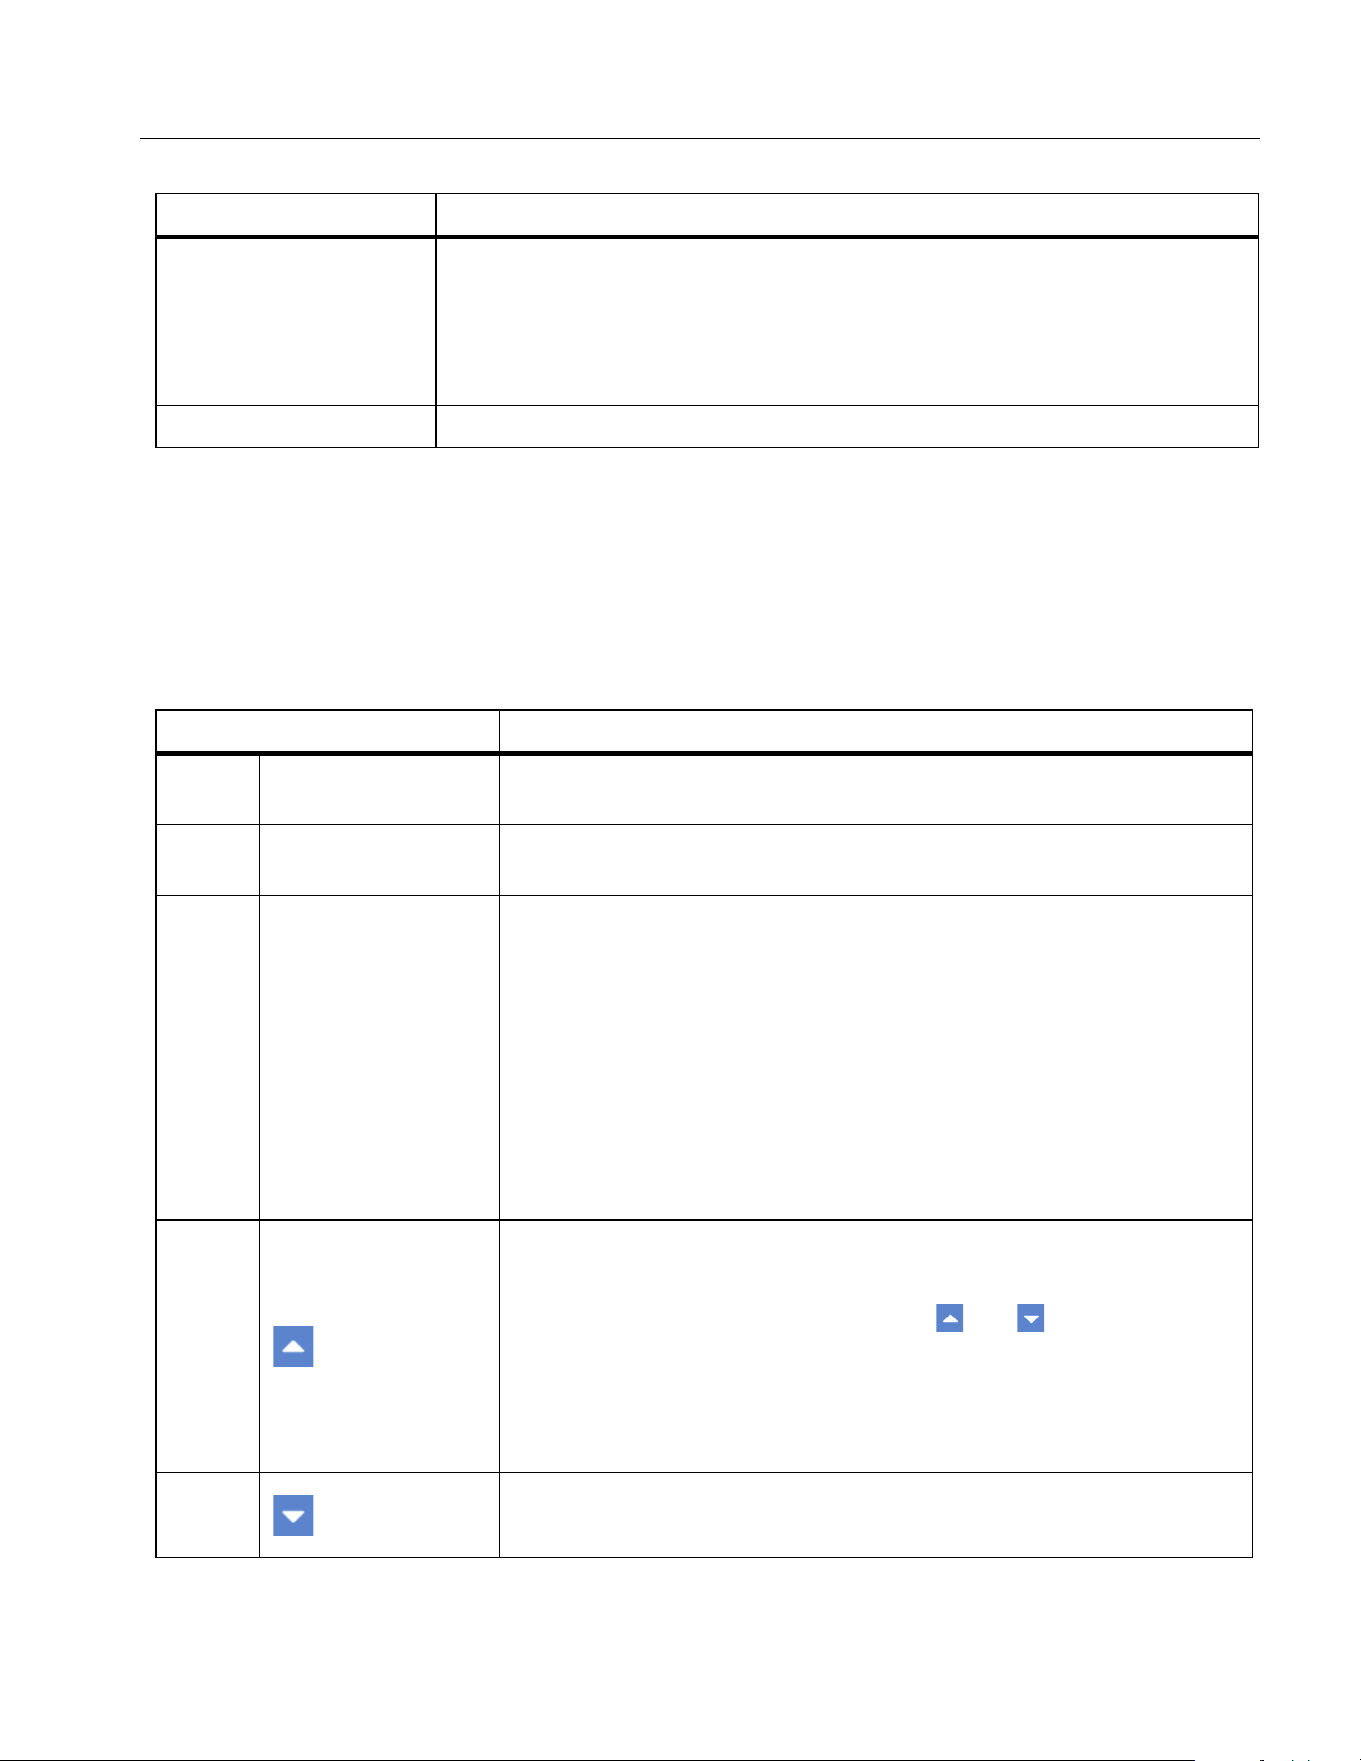
Table 14. Meter Screen - User Item View
Item Description
1 Edit
Edit the current item
Change the item selected at the current location.
2 Add
Add measurements
Add measurements at the end of the list. Up to 20 measurements can be
added.
3 Del
Delete the current item
Delete the item at the current location.
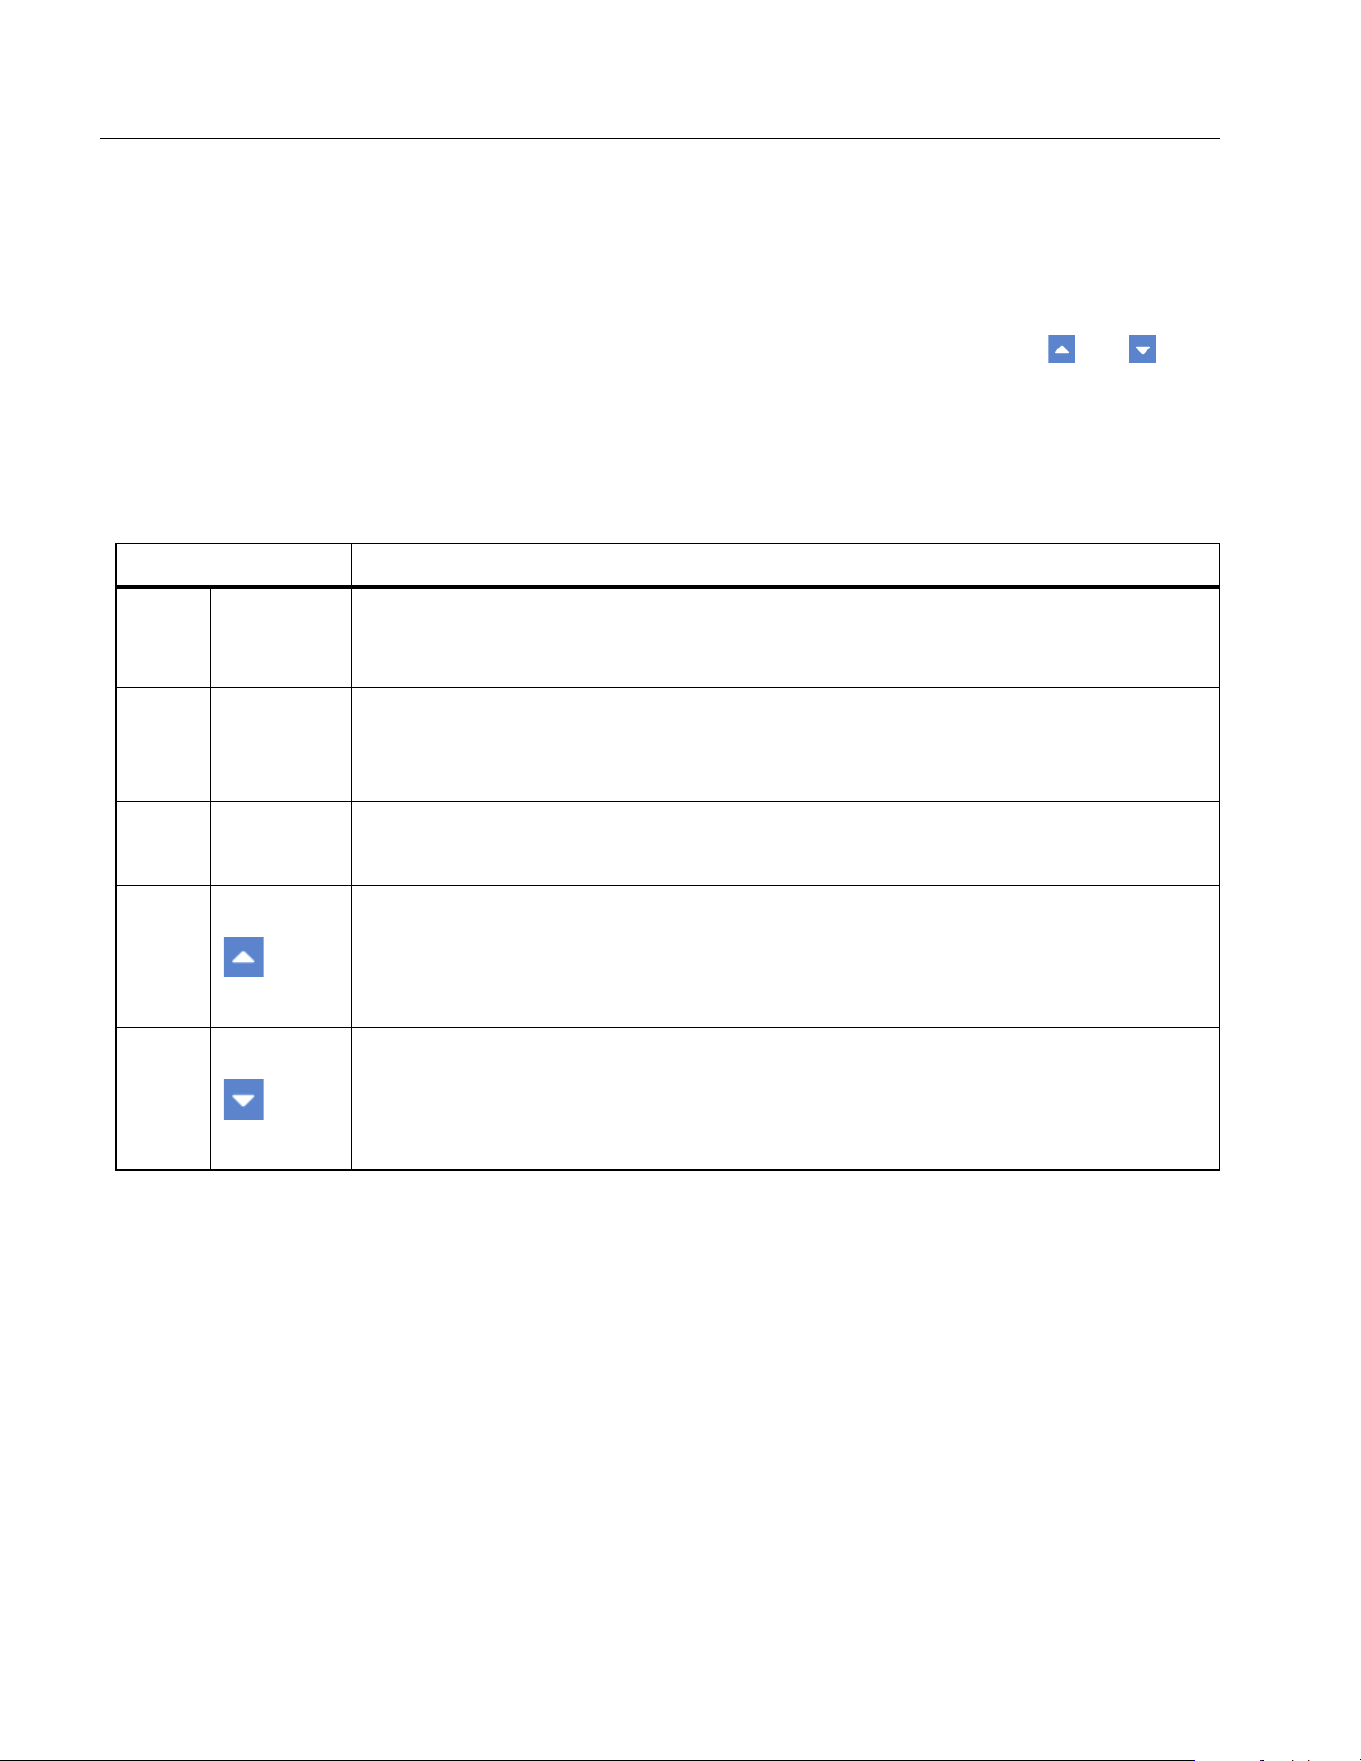
4
Move forward the currently selected item
Moves the currently selected measurement forward by one position in the list. If
the currently selected measurement is already at the top of the list, no action is
taken when the button is pushed.
5
Move backward the currently selected item
Moves the currently selected measurement forward by one position in the list. If
the currently selected measurement is already at the end of the list, no action is
taken when the button is pushed.
1.888.610.7664 sales@GlobalTestSupply.com
Fluke-Direct.com

Power Analyzers
Operation
33
All available measurement items are listed by categories in a tree structure. See Measurement
Calculation Method
for details of measurement items.
2. For each measurement to add (up to 20 measurements):
a. Use 1 through 4to select a category.
b. Use the arrow (K L M N) keys to move the cursor over the corresponding item.
In most cases, there are 2 dialog boxes displayed in the measurement tree menu, the one on
the left lists measurement items, and the one on the right lists the supported channels or wiring
groups. The yellow block represents the cursor position, and the yellow box indicates the
corresponding branch in the current tree structure.
Note
Under Dual-Unit Interconnection mode, "Remote" option appears in this menu. See
Dual-Unit
Interconnection
for details.
c. Push S to add the current option to the end of the list.
If the left and right dialogs are displayed, first select the name of the measurement item in the
left dialog box, then select the channel or wiring group to be added in the right dialog box, and
finally push S to confirm.
3. Push J repeatedly to go back to the main screen of Meter.
Delete Measurement Items
1. From the main screen of Meter, select 3 (User Item).
2. For each item to delete:
a. Use the arrow (K L M N) keys to move the cursor to the measurement item you want to delete.
b. Push 3 (Del).
3. Push J to go back to the main screen of Meter.
Edit the Current Measurement Item
1. From the mains screen of Meter, select 3 (User Item) > 1 (Edit).
2. Use the arrow (K L M N) keys to move the cursor to the measurement item you want to edit.
3. Select the measurement item by following the operation similar to section
Add Measurement Items.
Unlike the section
Add Measurement Items, the measurement items added will directly replace the
measurement items at the cursor position, instead of adding the newly added measurement to the
end of the list.
Change the Position of the Measurement Item
You can sort the measurement items displayed in the User Defined view:
1. From the main screen of Meter select 3 (User Item).
2. To move each item:
a. Use the arrow (K L M N) keys to move the cursor to the measurement you want to move.
b. Push 4() or 5 ( ).
1.888.610.7664 sales@GlobalTestSupply.com
Fluke-Direct.com
NORMA 6003/NORMA 6003+/NORMA 6004/NORMA 6004+
Users Manual
34
Each time you push 4() or 5 ( ), the item at the cursor position moves forward or
backward by one position.
3. Push J to go back to the main screen of Meter.
Integration
The Analyzer supports integral function to measure power energy, electric quantity and mechanical
energy. The integral methods are:
• Manually start and stop:
o Push 1 (Start) to start an integral,
o Push 2 (Stop) key to stop the running integral
o Push 3 (Reset) to clear the integral values.
• Auto start and manually stop:
o Set the auto start date and time and push 4 (Confirm)
An integral starts automatically when the date and time is reached,
o Push 2 (Stop) to stop the integral.
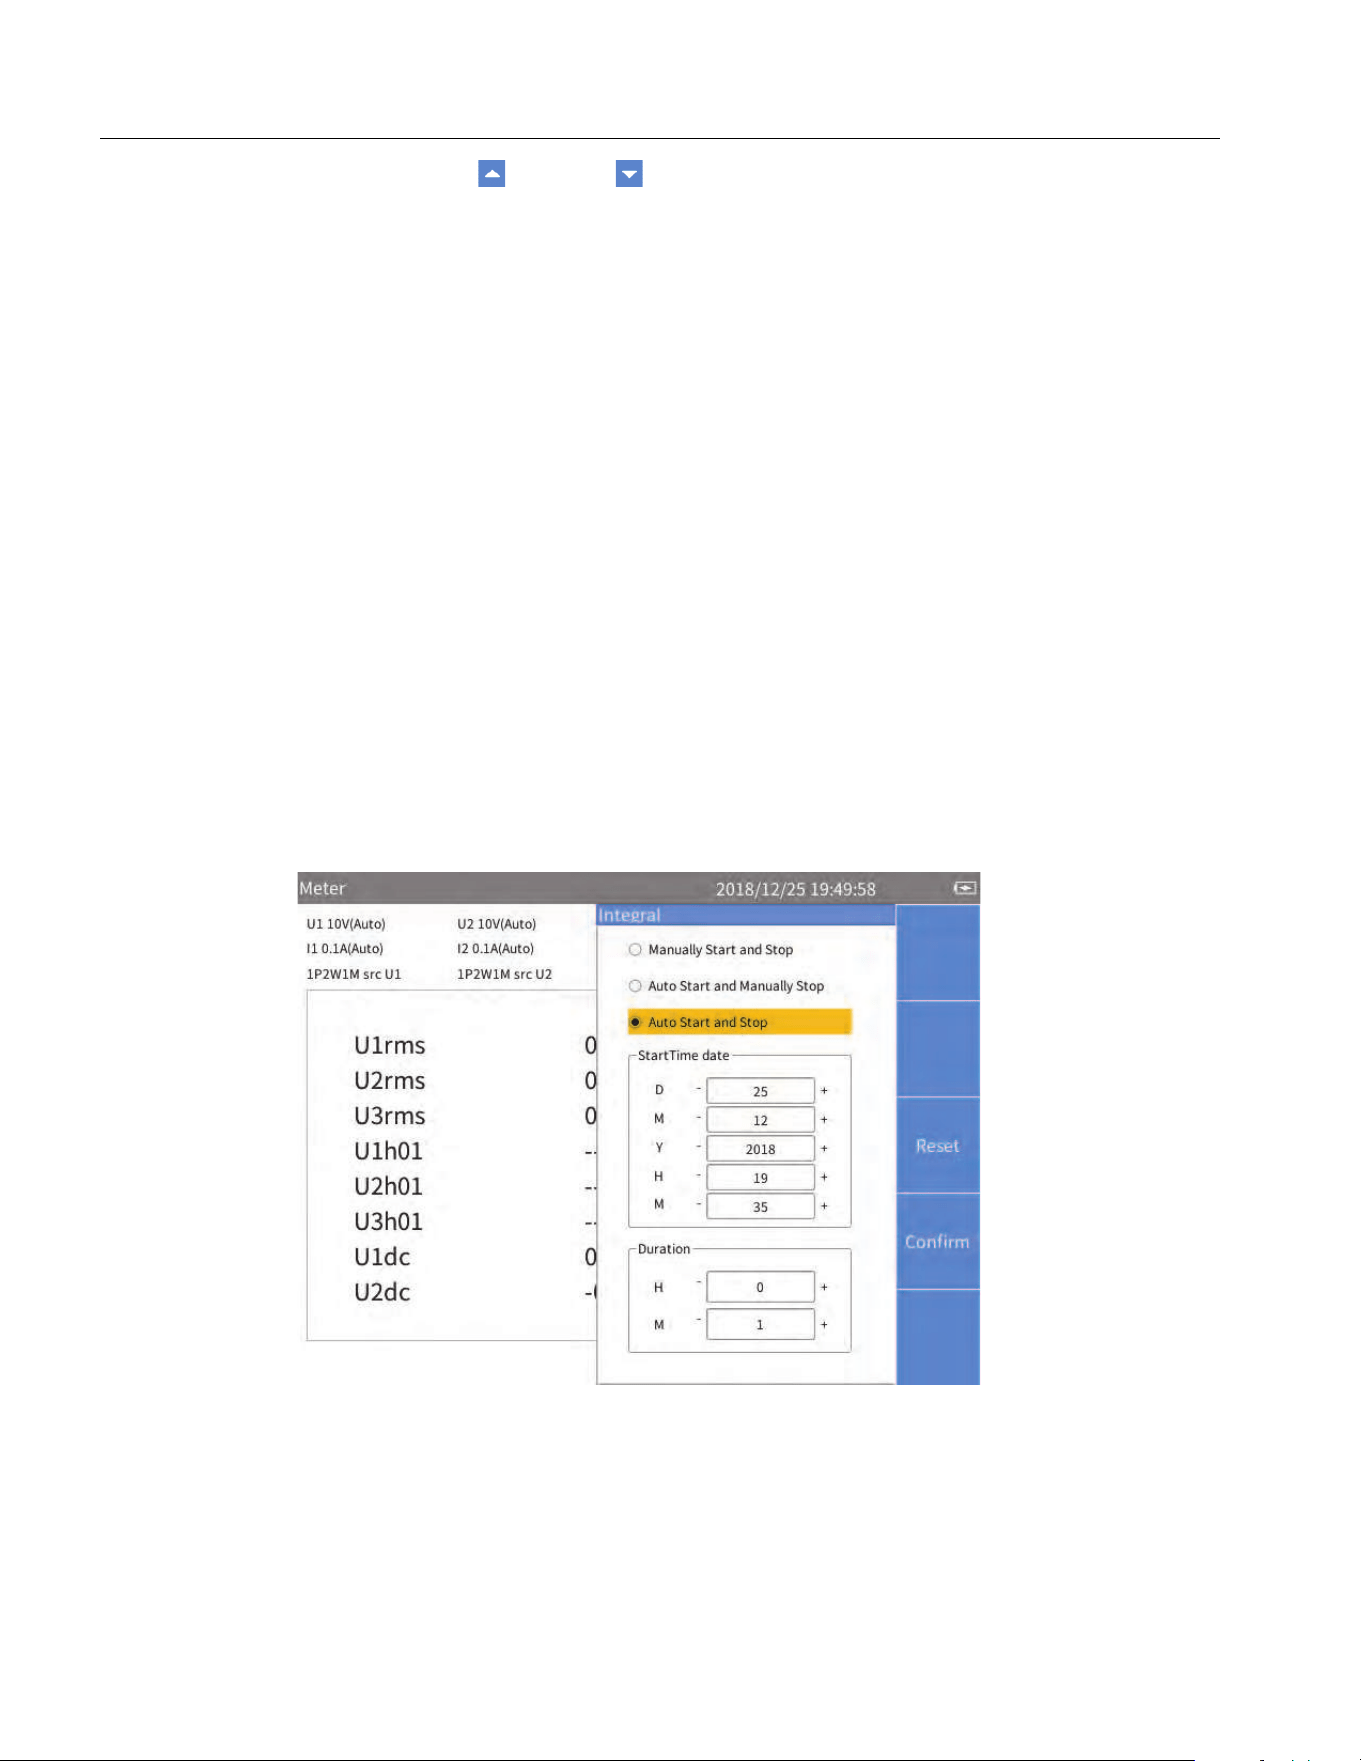
• Auto start and auto stop:
o Set the auto start date, time, and Duration and push 4 (Confirm) (See
Figure 15.)
An integral starts automatically when the date and time is reached, and stopped automatically
after the Duration is complete.
Figure 15. Auto Start and Auto Stop
1.888.610.7664 sales@GlobalTestSupply.com
Fluke-Direct.com
Power Analyzers
Operation
35
Note
A settling time is required during the automatic range switching, and the sampled value during
this time is not accurate, which will cause integral error. Therefore, in order to obtain accurate
integration results, Fluke recommends setting the channel used for integration to manual
range, and the range should cover the instantaneous voltage and current.
Harmonic
In HARMONIC mode, the user can analyze the signals in the form of a table/bar/FFT.
Enter Harmonic Mode
• From the main screen of current measurement screen select k.
Table 15 lists the items displayed on the screen.
Table 15. Harmonic Screen
Item Description
Items
The name of the currently selected items depends on the options in Item.
See
Select the Harmonics to Display for details.
Basic Frequency The fundamental frequency (Hz) of the reference signal (sync source).
Total Harmonic
Distortion
Total harmonic distortion of the voltage or current of the currently item, U
thd
or I
thd
. The unit is %.
Fundamental Content
Fundamental content of the voltage or current of the currently selected
Item, U
fc
or I
fc
. The unit is %.
Harmonic Content
Harmonic content of the voltage or current of the currently selected Item,
U
hc
or I
hc
. The unit is%.
Harmonic
Voltage/Current
Factors
Harmonic voltage or current factor of the currently Item, hvf or hcf.
Table, Bar and FFT Displays table, bar or FFT depending on the selected display mode.
Soft Keys
1 (Configure): Global configuration, see
Global Configuration.
2 (Item): Select the harmonic items displayed on the screen see
Select
the Harmonics to Display
.
3 (Mode): Harmonic display mode. You can push this button to cycle
through harmonic table, bar and FFT.
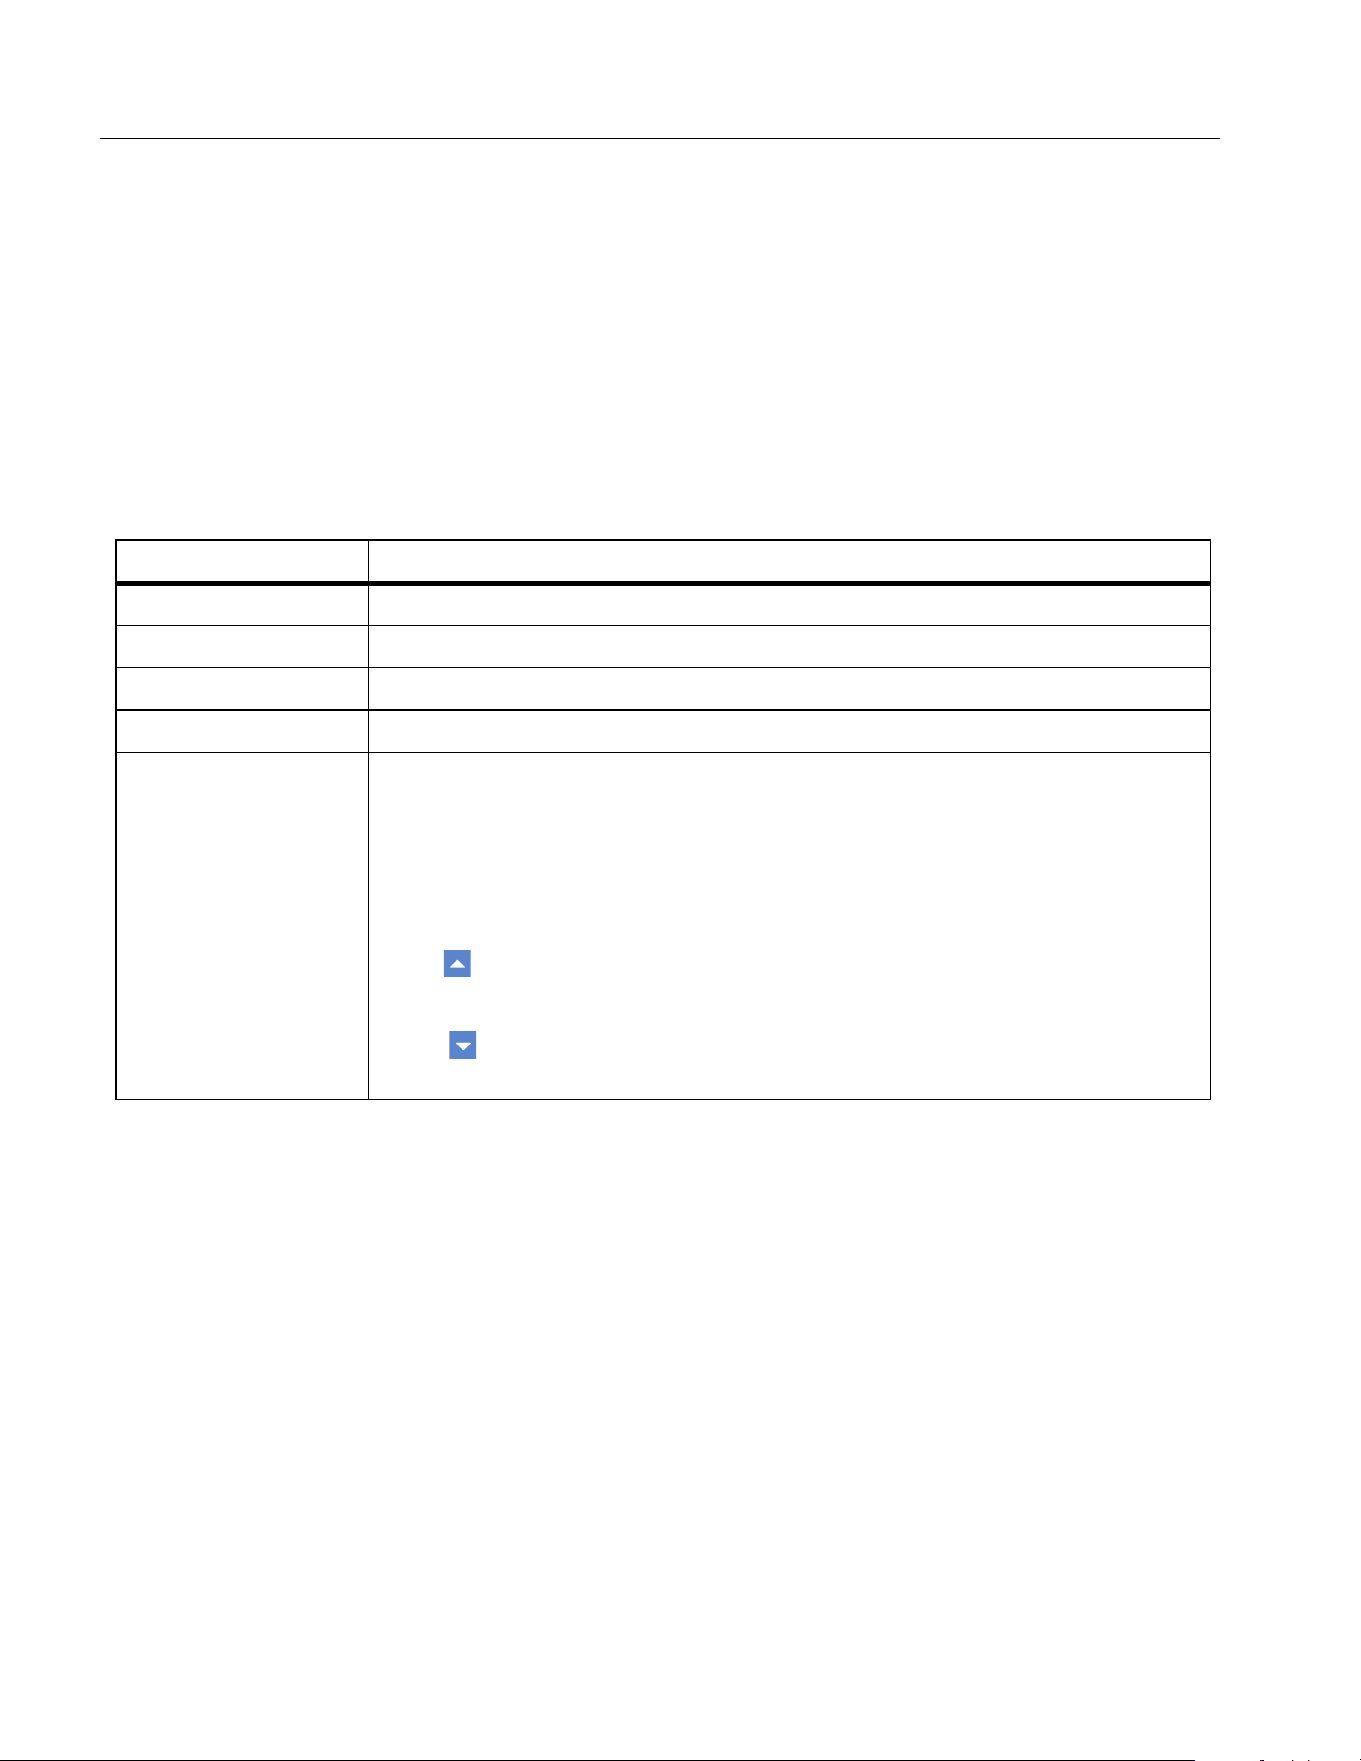
4( /Axis): Page Up key or Axis Setup key. It is the Page Up key
under the table display mode, and it is the Axis Setup key under the bar
and the FFT mode. See Linear and Logarithmic Axis.
5 ( ): Page Down, is used to scroll down the page to display more
content.
Bottom Bar Displays the current page.
1.888.610.7664 sales@GlobalTestSupply.com
Fluke-Direct.com
NORMA 6003/NORMA 6003+/NORMA 6004/NORMA 6004+
Users Manual
36
Change View Mode
• From the main screen of HARMONIC select 3 (Mode). Cycle through the table, bar and FFT.
Select the Harmonics to Display
From the main screen of HARMONIC:
1. Select 2 (
Item).
The “
Item” menu lists all currently available parameters, including voltage and current.
2. Use the arrow (K L M N) keys to move the cursor over the corresponding item.
3. Push S.
Table 16. Harmonic Table
Item Description
Harmonic Order Harmonic Order
Magnitude Harmonic magnitude, absolute value, in V or A.
Percentage Harmonic percentage, relative to fundamental wave.
Phase Harmonic phase angle, relative to fundamental wave.
Soft Keys
1 (Configure): Global configuration, see
Global Configuration.
2 (Item): Select the harmonics displayed on the screen, see
Select the
Harmonics to Display
.
3 (Mode): Harmonic display mode. You can push this button to cycle
through harmonic table, bar and FFT.
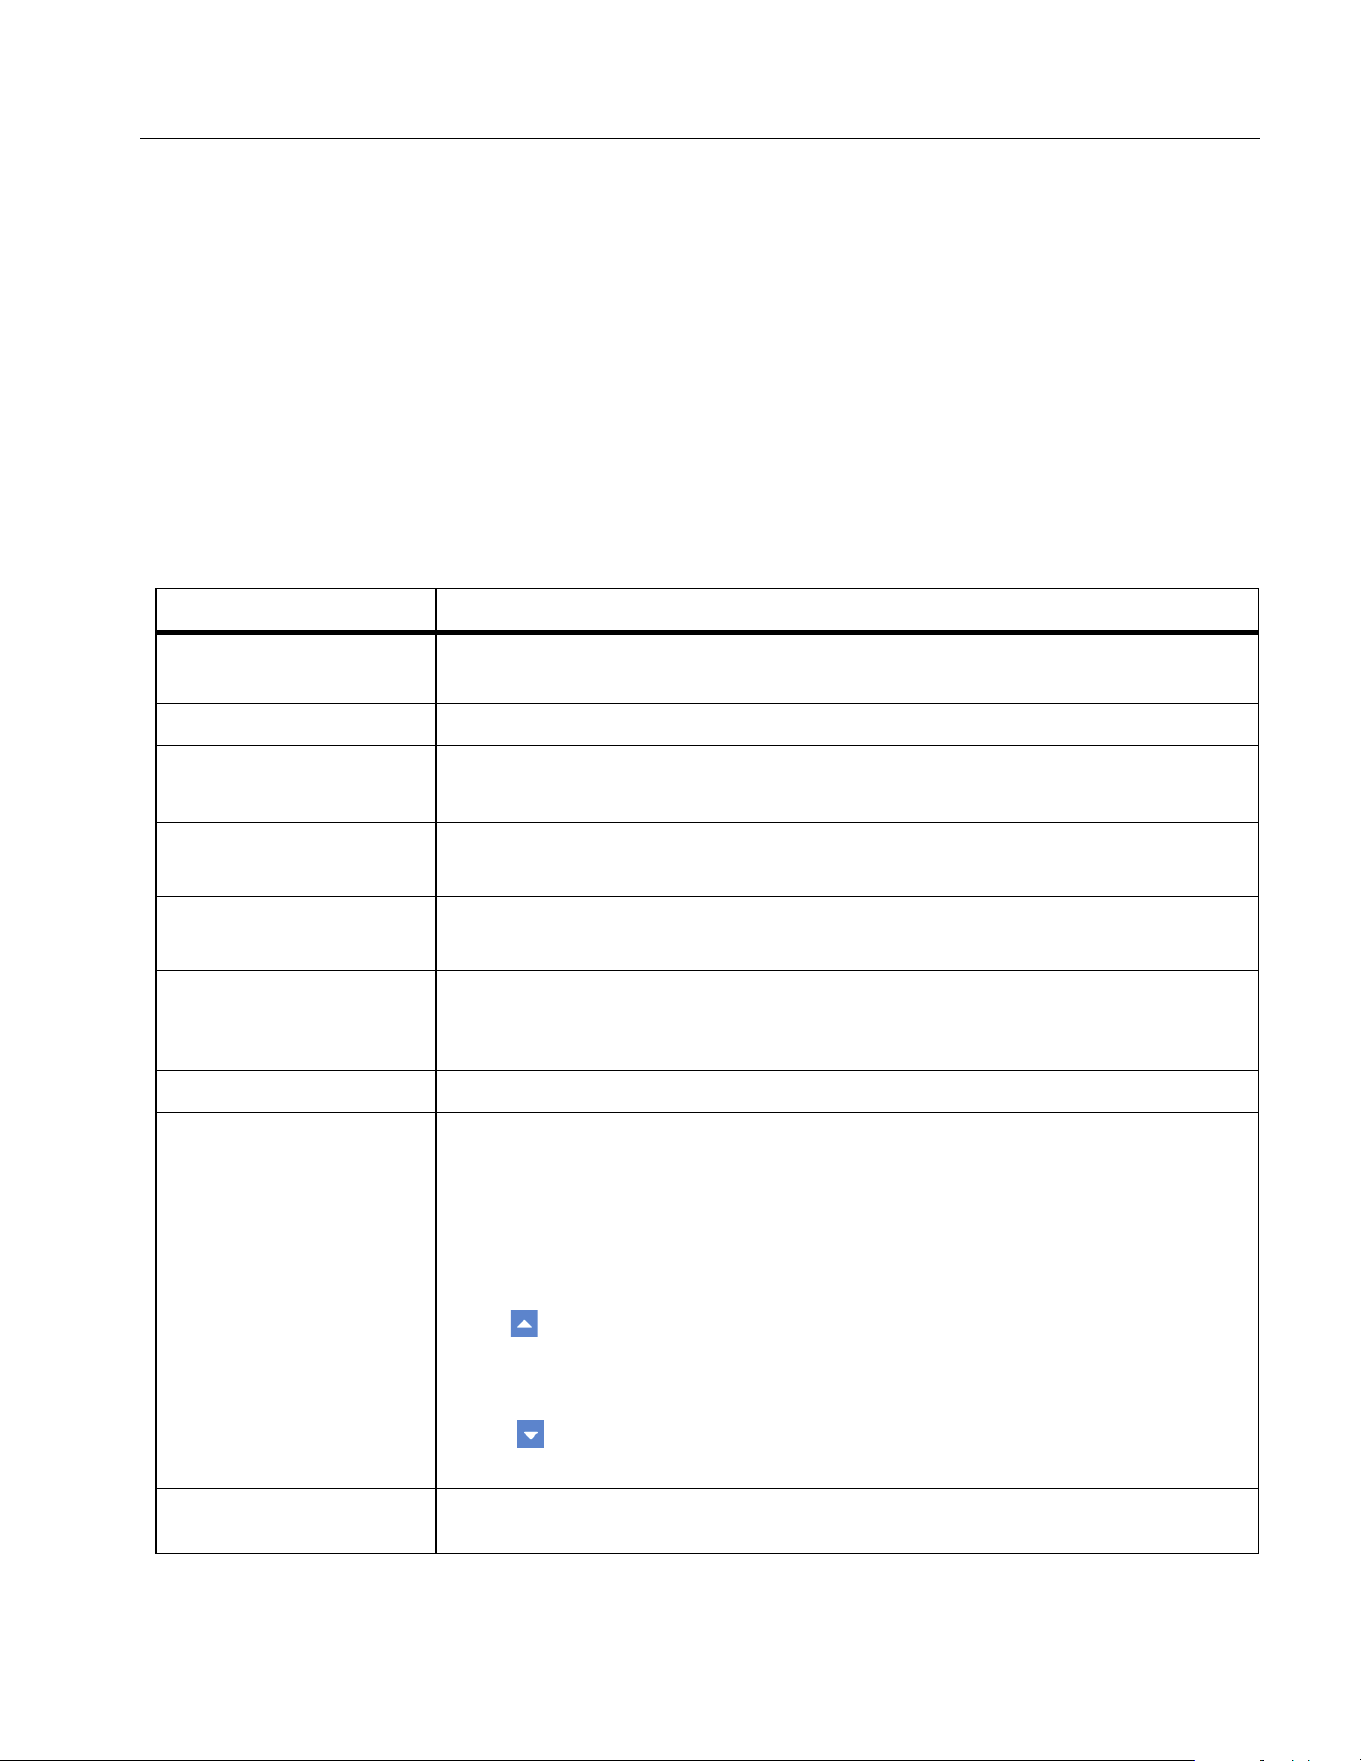
4( ): Page up key. Each page can display 10 harmonics. When you
need to view more harmonic data, use 4 and 5 to page up or down.
5 ( ): Page Down key, it is used to scroll down the page to display more
content.
1.888.610.7664 sales@GlobalTestSupply.com
Fluke-Direct.com
Power Analyzers
Operation
37
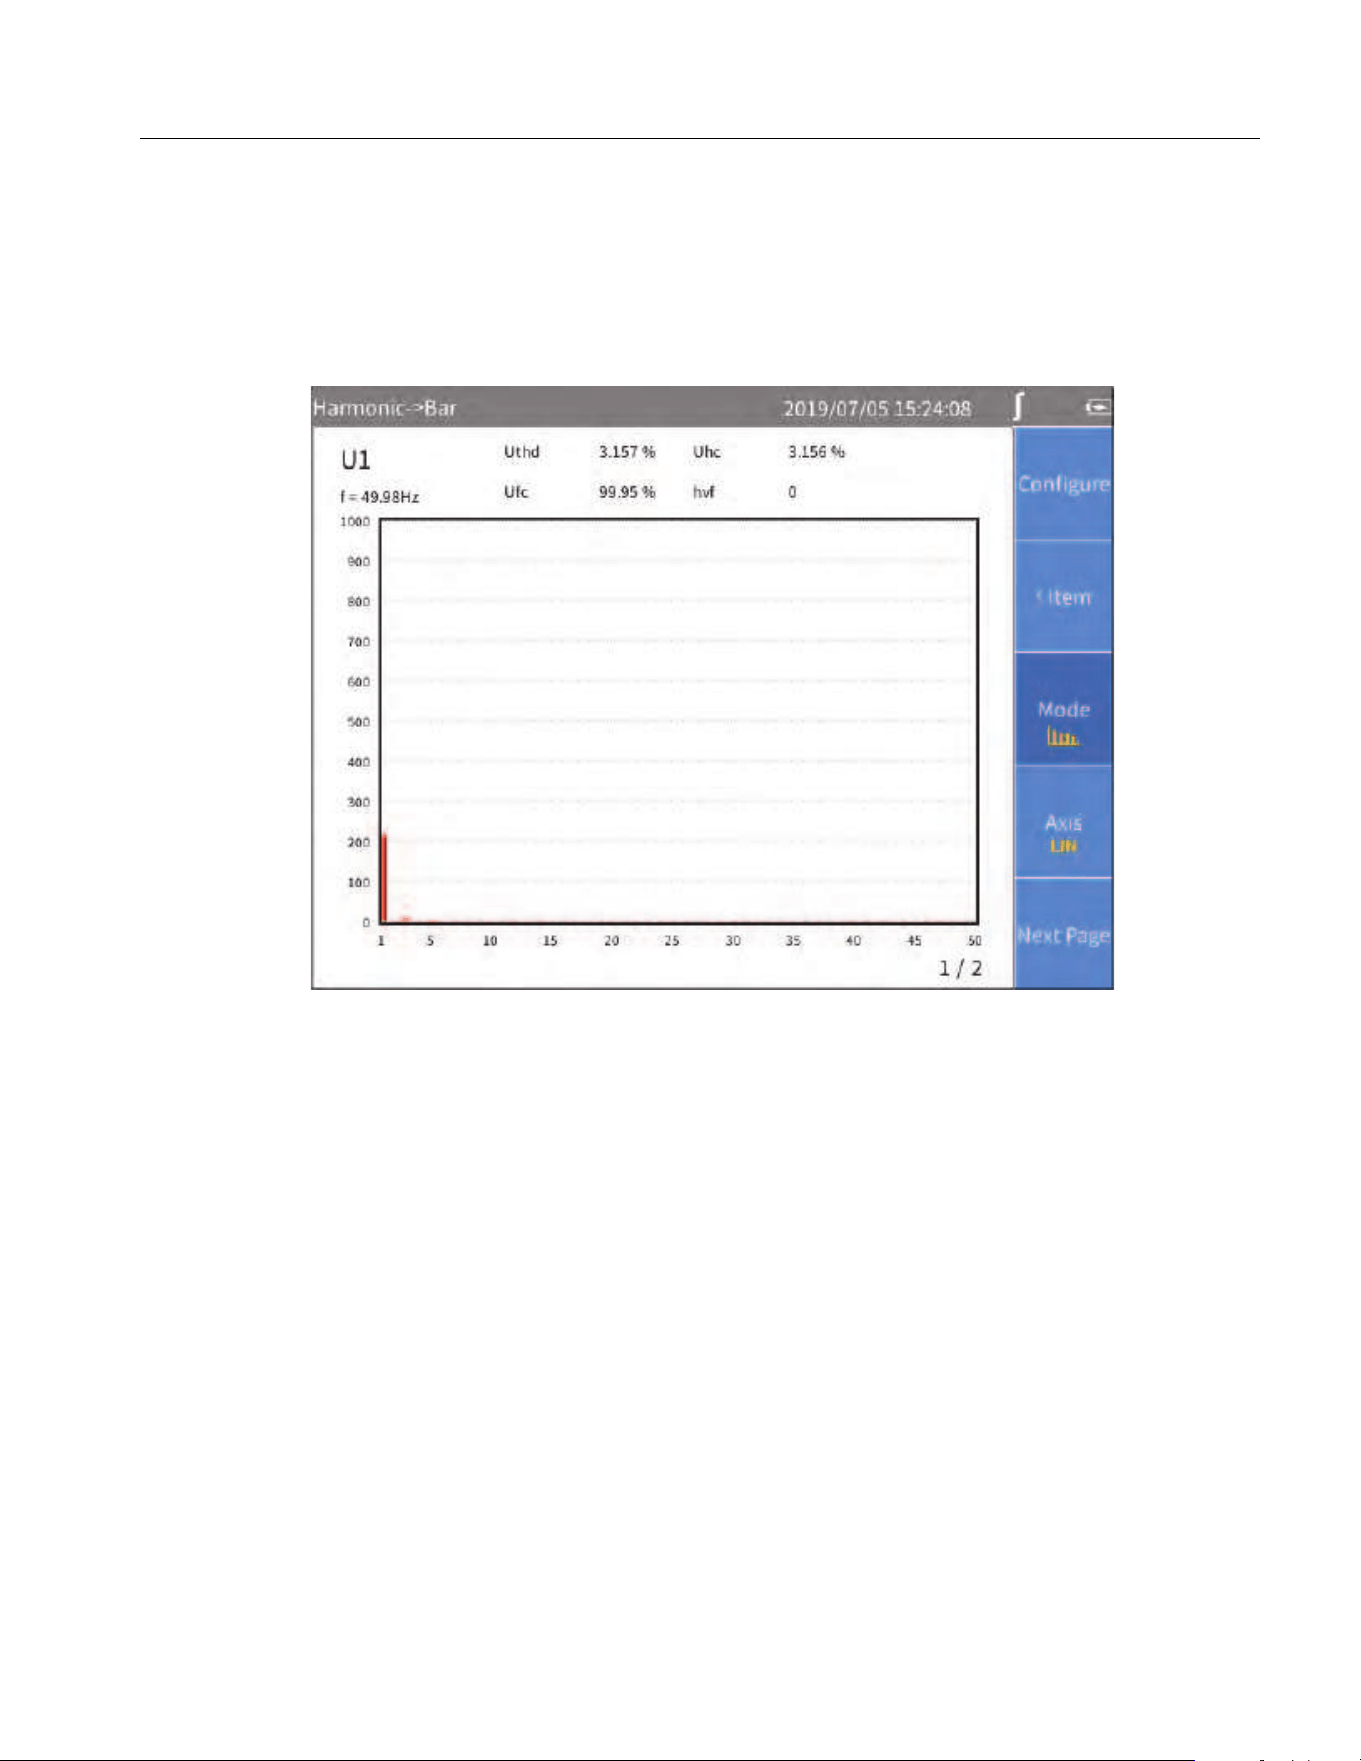
Harmonic Bar
The harmonic bar is as shown in Figure 16 where the horizontal axis represents the harmonic order
and the vertical axis represents the harmonic amplitude in V or A.
The harmonic bar of each screen shows 50 harmonics. The pages can be turned forward or backward
through 5 (Next Page) button to display more harmonic bar.
Figure 16. Harmonic Bar
1.888.610.7664 sales@GlobalTestSupply.com
Fluke-Direct.com
NORMA 6003/NORMA 6003+/NORMA 6004/NORMA 6004+
Users Manual
38
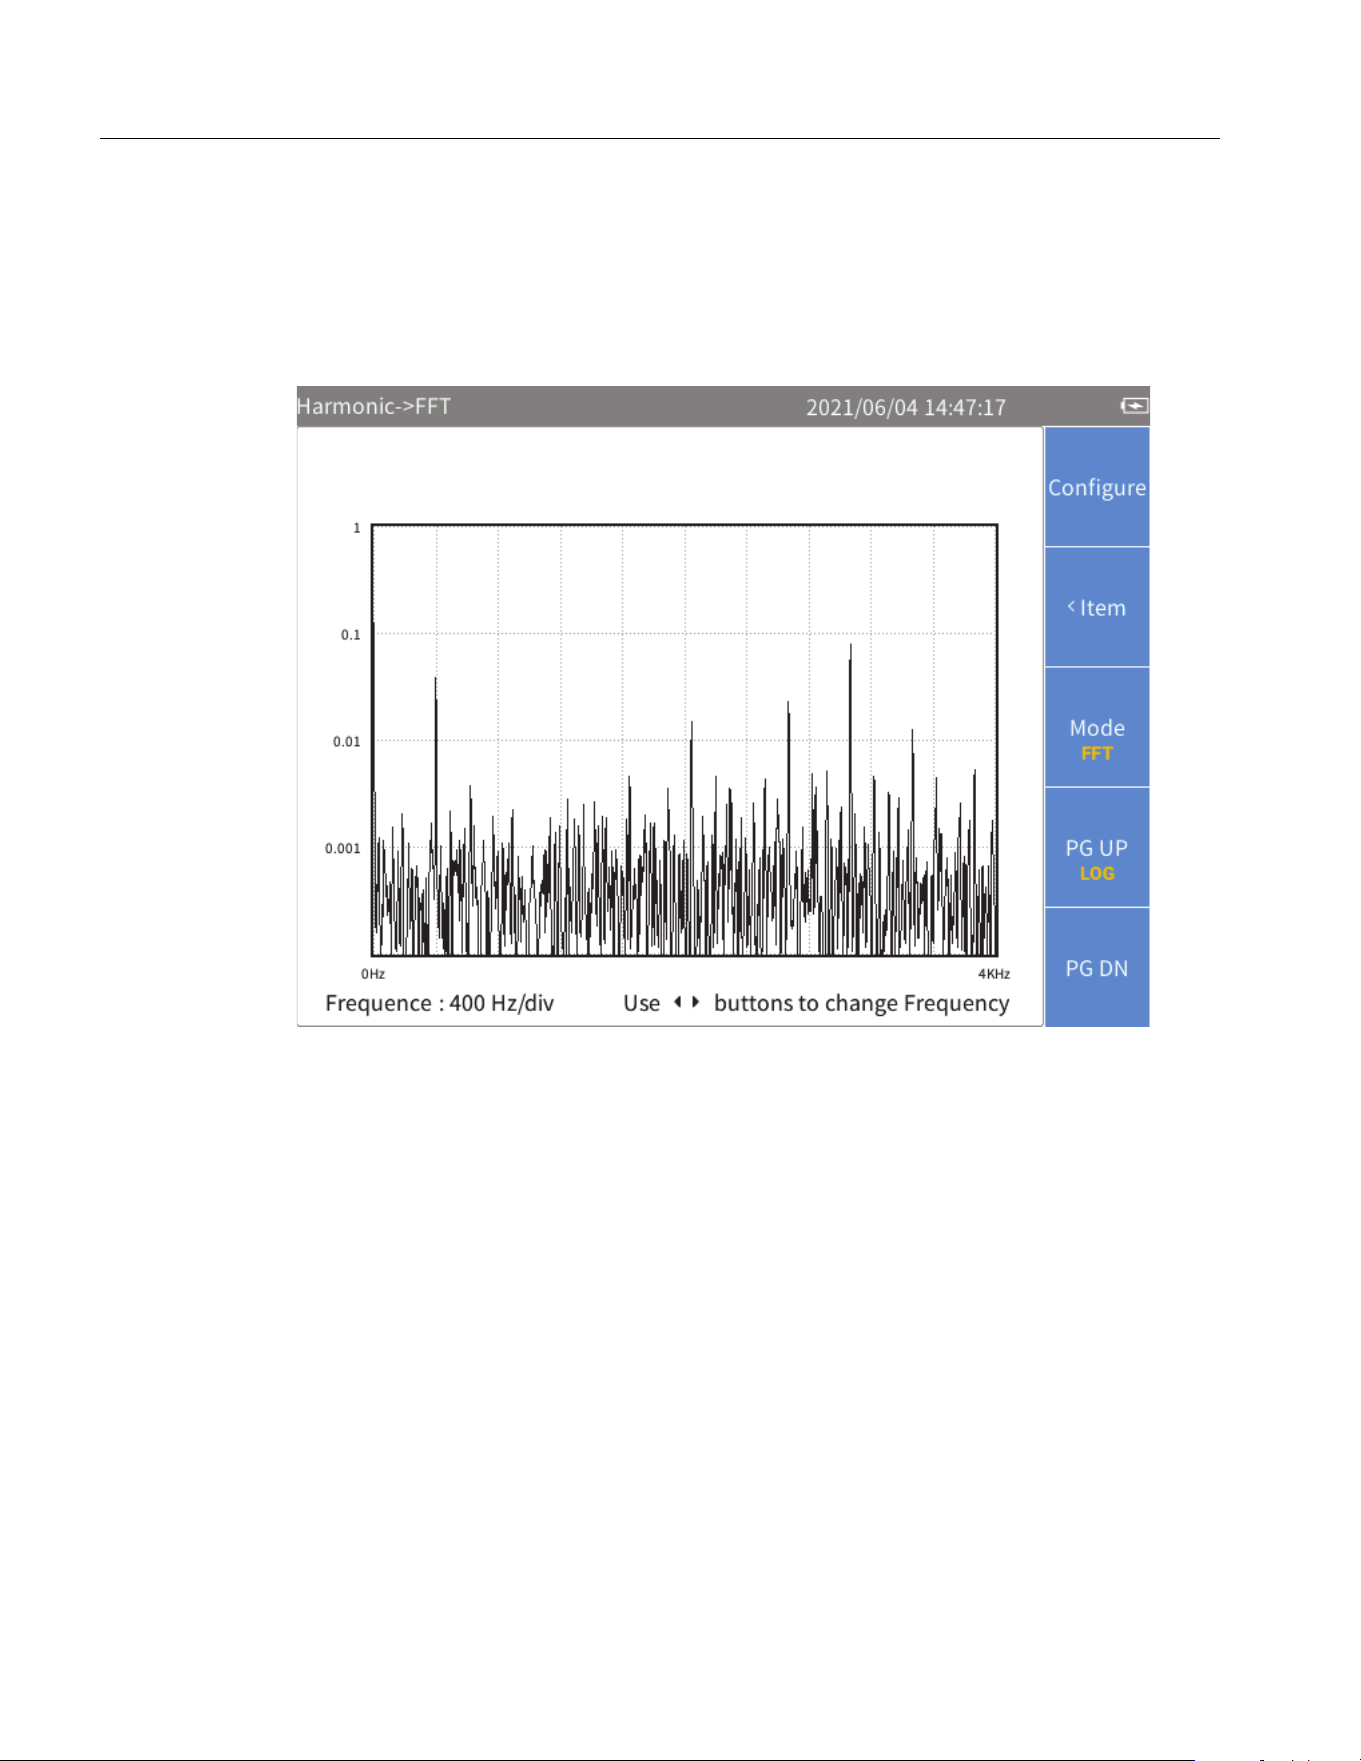
FFT
The harmonic FFT is as shown in Figure 17, where the horizontal axis represents frequency and the
vertical axis represents magnitude.
Use the left and right arrow (M N) keys to scroll the horizontal axis to see FFT curves in different
frequency ranges.
Figure 17. Harmonic FFT
1.888.610.7664 sales@GlobalTestSupply.com
Fluke-Direct.com
Power Analyzers
Operation
39
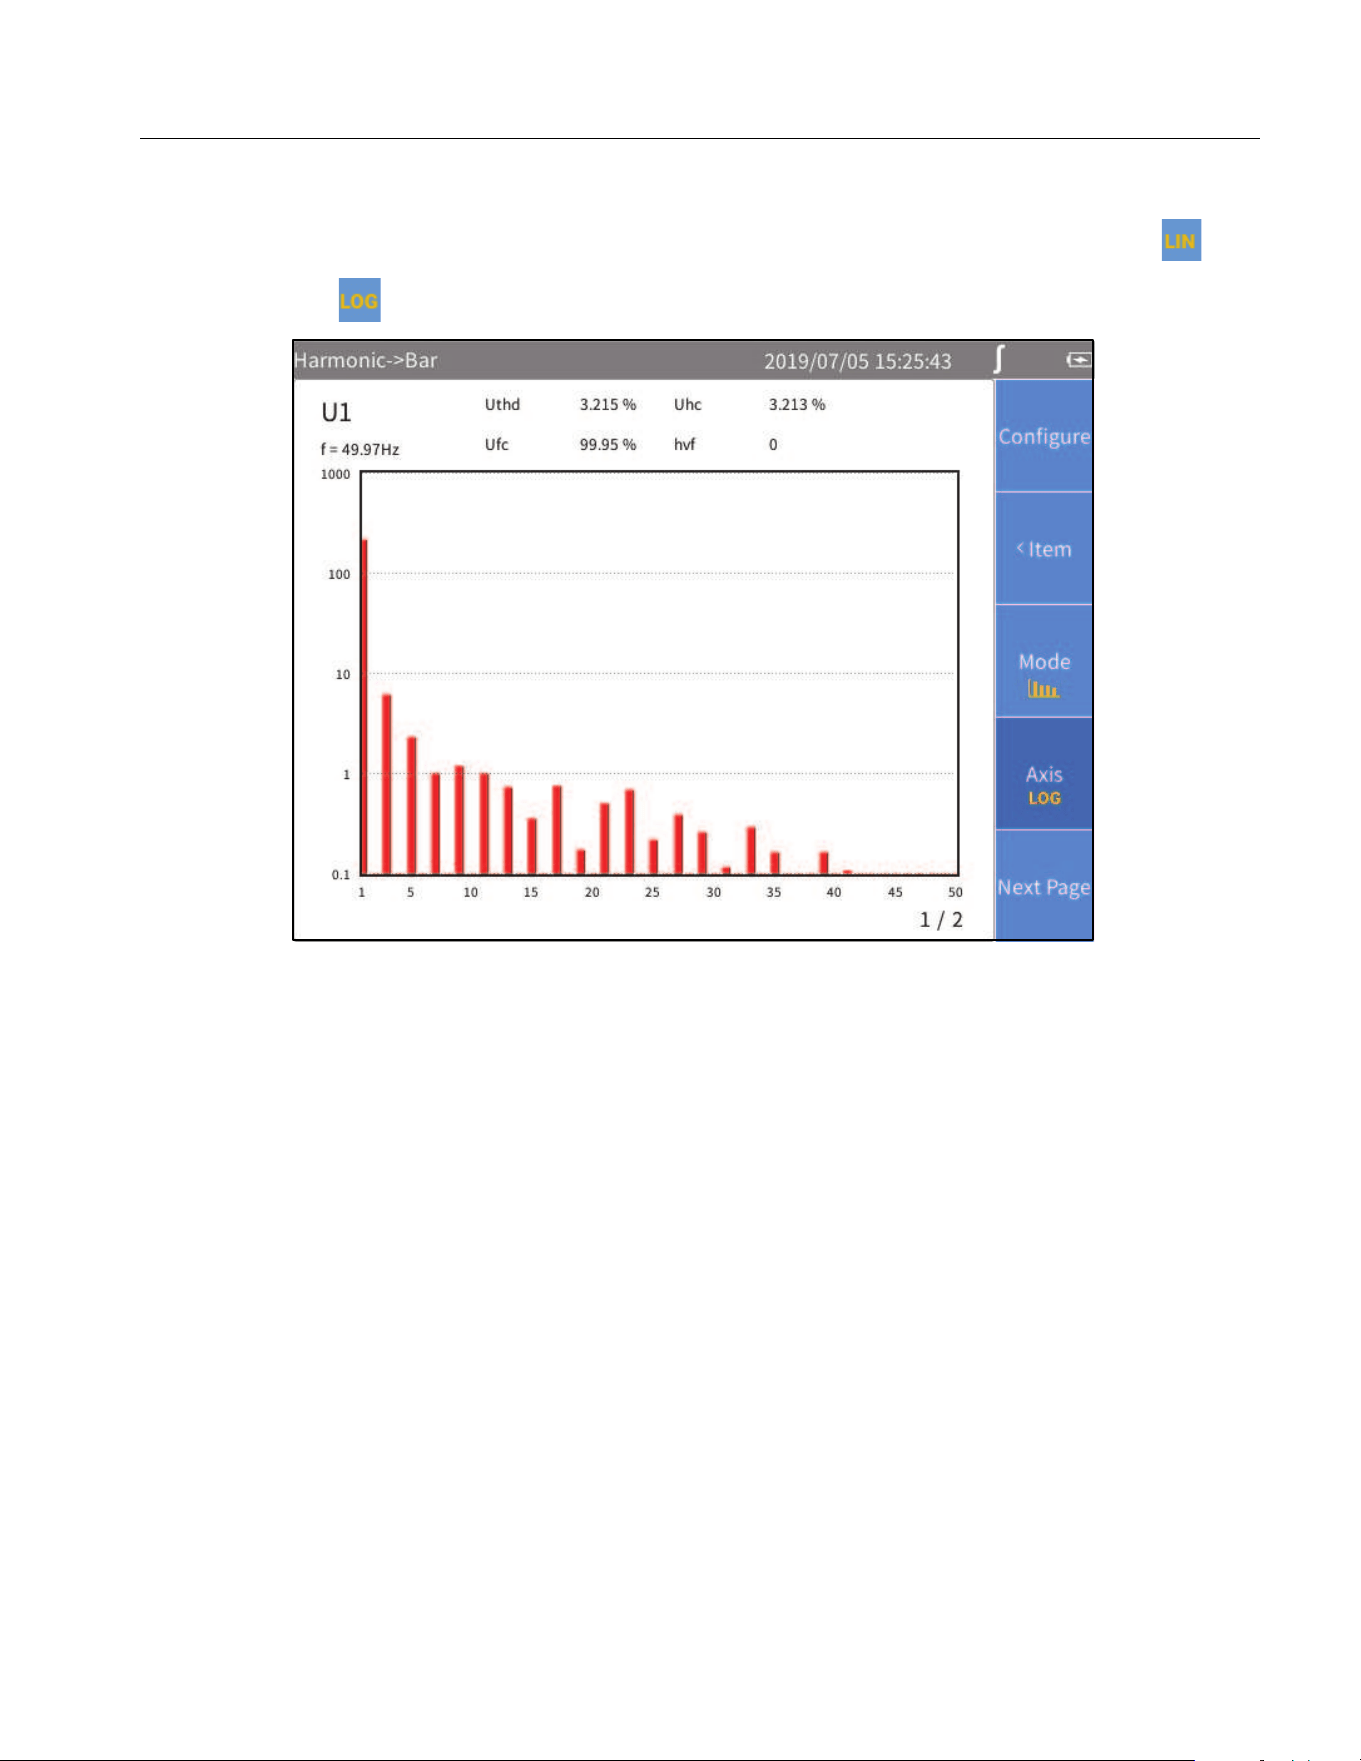
Linear and Logarithmic Axis
In the harmonic bar and FFT view, use 4(AXIS) button to switch the vertical axis to linear ( ) or
logarithmic axis ( ).
Figure 18. Harmonic - Logarithmic Axis
1.888.610.7664 sales@GlobalTestSupply.com
Fluke-Direct.com
NORMA 6003/NORMA 6003+/NORMA 6004/NORMA 6004+
Users Manual
40
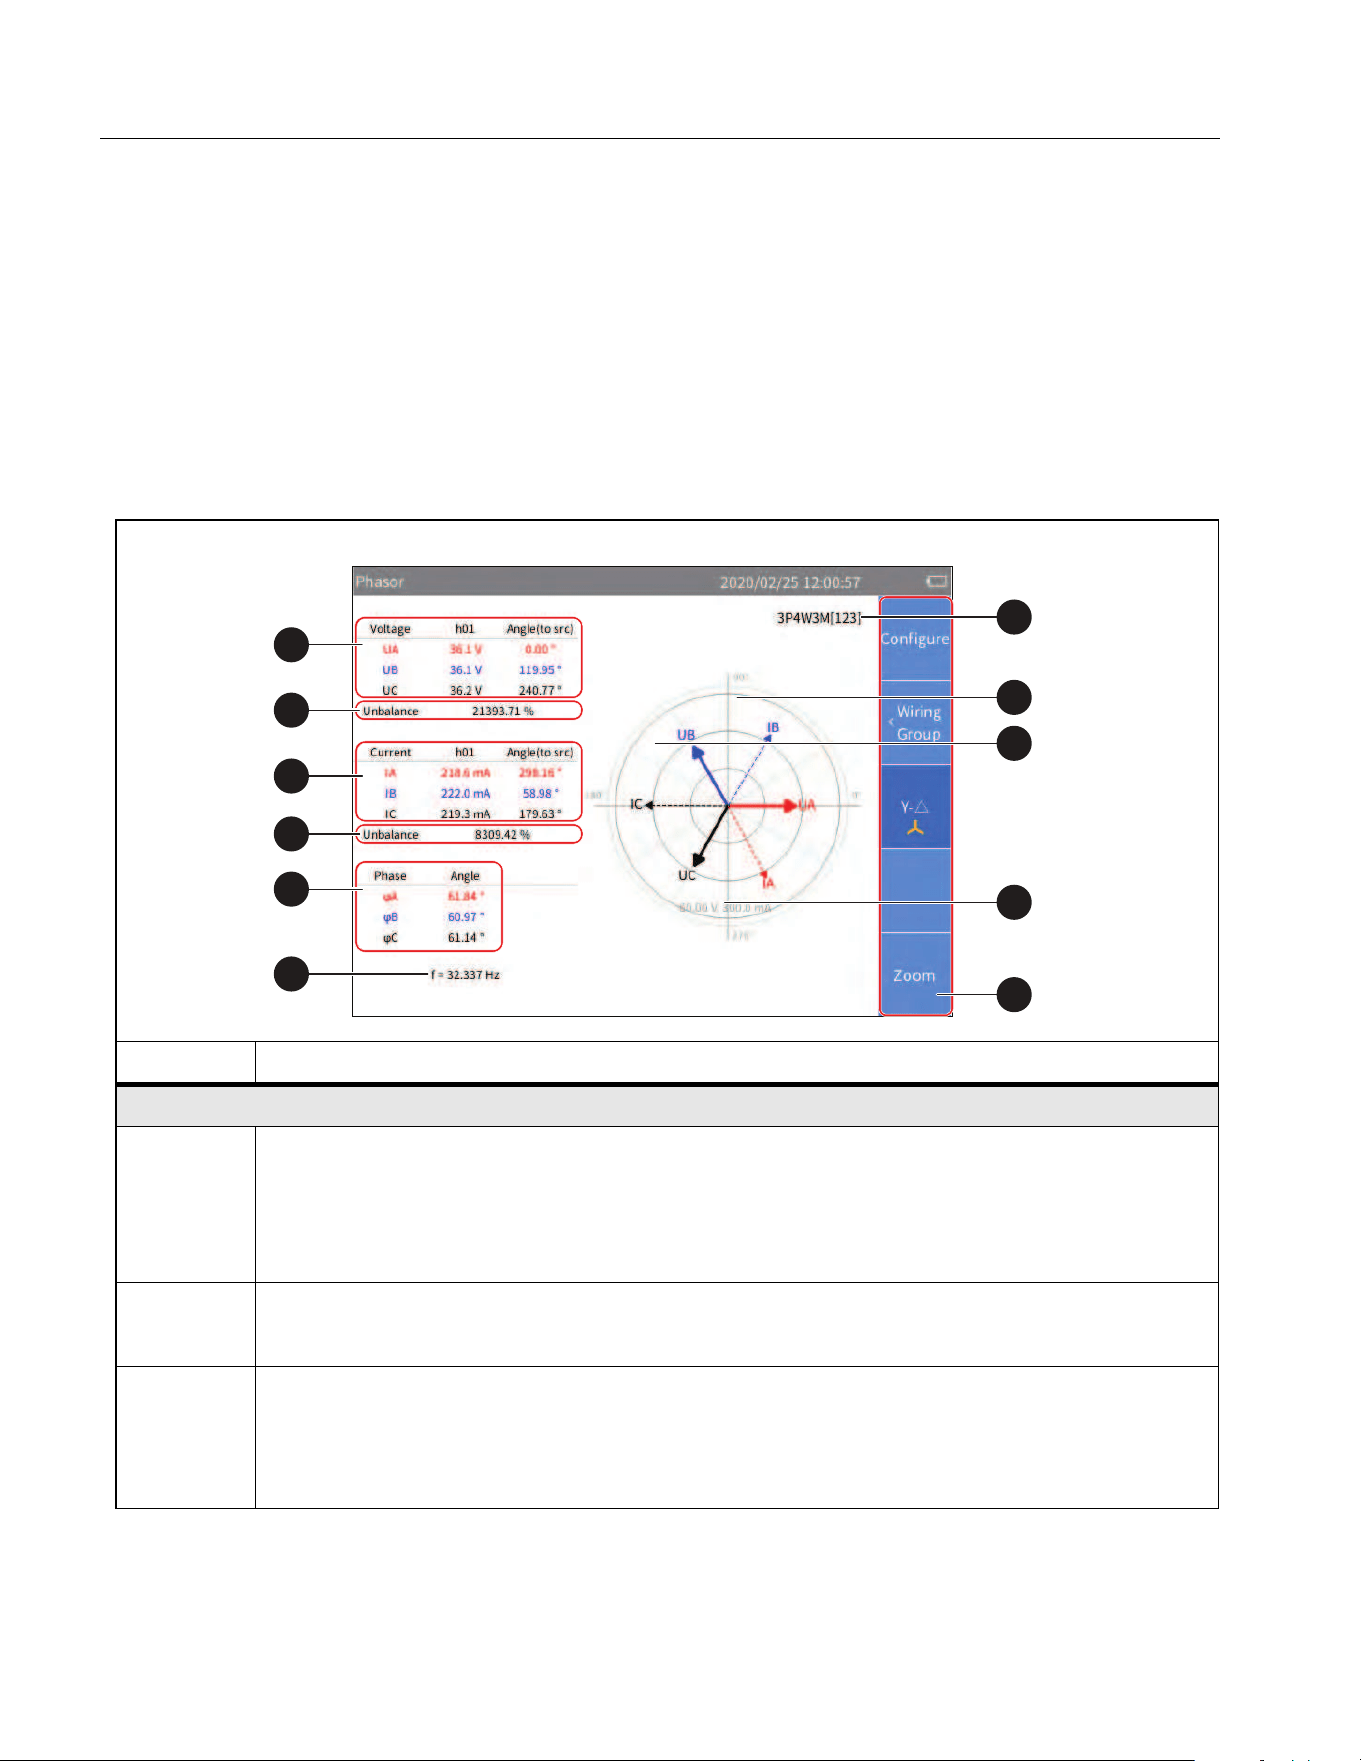
Phasor
The Phasor mode displays the magnitude and phase relationship of the voltage and current of each
phase in the selected wiring group in tabular and graphical form.
Enter Phasor Mode:
• From the Current measurement screen push p.
The phasor screen shown in
Table 17 is divided into left and right parts, the left part is a phasor
table, and the right part is a phasor graph. The content displayed in the table on the left will be
displayed synchronously in the graph on the right.
Table 17. Phasor Screen
Item Description
Table
Voltage phasor information
The voltage phasor information of each phase or line in the selected wiring group,
including fundamental amplitude and phase angle relative to sync source.
See
Set the Wiring Selection for information on wiring group.
Voltage unbalance
The 3-phase voltage unbalance of the currently selected wiring group.
Current phasor information
The current phasor information of each phase in the selected wiring group, including
fundamental amplitude and phase angle relative to sync source. See
Select the Phasor
Data to Display
for details. See Set the Wiring Selection for information on wiring group.
1
2
3
4
5
6
7
8
9
10
11
1.888.610.7664 sales@GlobalTestSupply.com
Fluke-Direct.com

Power Analyzers
Operation
41
Table 18. Phasor Screen (cont.)
Phasor diagram
D
Current unbalance
The 3-phase current unbalance of the currently selected wiring group.
E
Phase information
The relative phase angle between the voltage and current of each phasor in the
currently selected wiring group, the unit is degrees (°).
F
Frequency
The frequency of the sync source signal in the currently selected wiring group. See
Set Sync Source and Update Rate for details.
G
Wiring Selection
The wiring selection of the selected wiring group. The current interface data shows
the corresponding wiring group, and to switch the wiring group use 2 (Wiring
Group).
H
Voltage phasor
The voltage phasor of the selected wiring group. The right side of the horizontal axis
is the reference and the phase angle of the reference signal is 0°.
I
Current phasor
The current phasor of the selected wiring group. The right side of the horizontal axis
is the reference and the phase angle of the reference signal is 0°.
J
Voltage and current scale
For ease of reading, only the outermost circle scale is marked in the phasor graph.
K
1 (Configure): Global configuration, see
Global Configuration.
2 (Wiring Group): Select a wiring group for measurement, see
Set the Wiring
Selection
.
3 (Y-Δ): Switch the circuit connection (Y/Δ). represents a star connection.
represents a triangle connection. See
Select Circuit Type.
5 (ZOOM): Zoom in/ out phasor, see
Zoom Phasor.
1.888.610.7664 sales@GlobalTestSupply.com
Fluke-Direct.com

NORMA 6003/NORMA 6003+/NORMA 6004/NORMA 6004+
Users Manual
42
Select the Phasor Data to Display
Only phasor data of one wiring group can show on the phasor screen at the same time. The user can
select a group from the currently active wiring groups to display its phasor data on the phasor screen.
Enter Wiring Group Menu:
• From the main screen of Phasor, select 2 (Wiring Group).
Select the Phasor Data to Display:
1. In Wiring Group, use the left and right arrow (M N) keys to select a channel or wiring group in
Channel Configuration. The wiring selection of the selected channel/wiring group is highlighted.
As you move the cursor, you can observe that the data displayed in the
Phasor screen is updated
instantly according to the current options.
2. Push J to go back to the main screen of Phasor.
Note
The wiring group currently available for display depends on the wiring selection. See
Set the
Wiring Selection
for details.
Select Circuit Type
From the main screen of Phasor:
1. Select 3 (Y-Δ).
2. Push 3 (Y-Δ) to switch between the star (Y) and the delta (Δ) connection. The current
connection type is displayed on the tab page.
Note
The Y-Δ option is only valid when a 3-phase wiring group is selected. When Y is selected, the
phasor table displays the voltage of each phase, and the phasor diagram is plotted in the form
of Y. When Δ is selected, the phasor table displays the voltage of each line, and the phasor
diagram is plotted in the form of Δ.
Zoom Phasor
In the Phasor screen, the Analyzer automatically determines the magnitude of each phasor in the
phasor diagram based on the current measurements. However, the user can also manually zoom the
phasor diagram of the voltage and current for ease of viewing.
Enter the Zoom Menu:
1. From the main screen of Phasor select 5 (Zoom).
The options are as shown in
Table 18.
2. Push 1 (
ZOOM) to display or below its label as needed.
3. Push 3 () or 4( )to zoom in or out the currently selected phasor.
4. To restore to default Auto Zoom, push 5 (
Auto).
5. Push J to go back to the main screen of Phasor.
1.888.610.7664 sales@GlobalTestSupply.com
Fluke-Direct.com
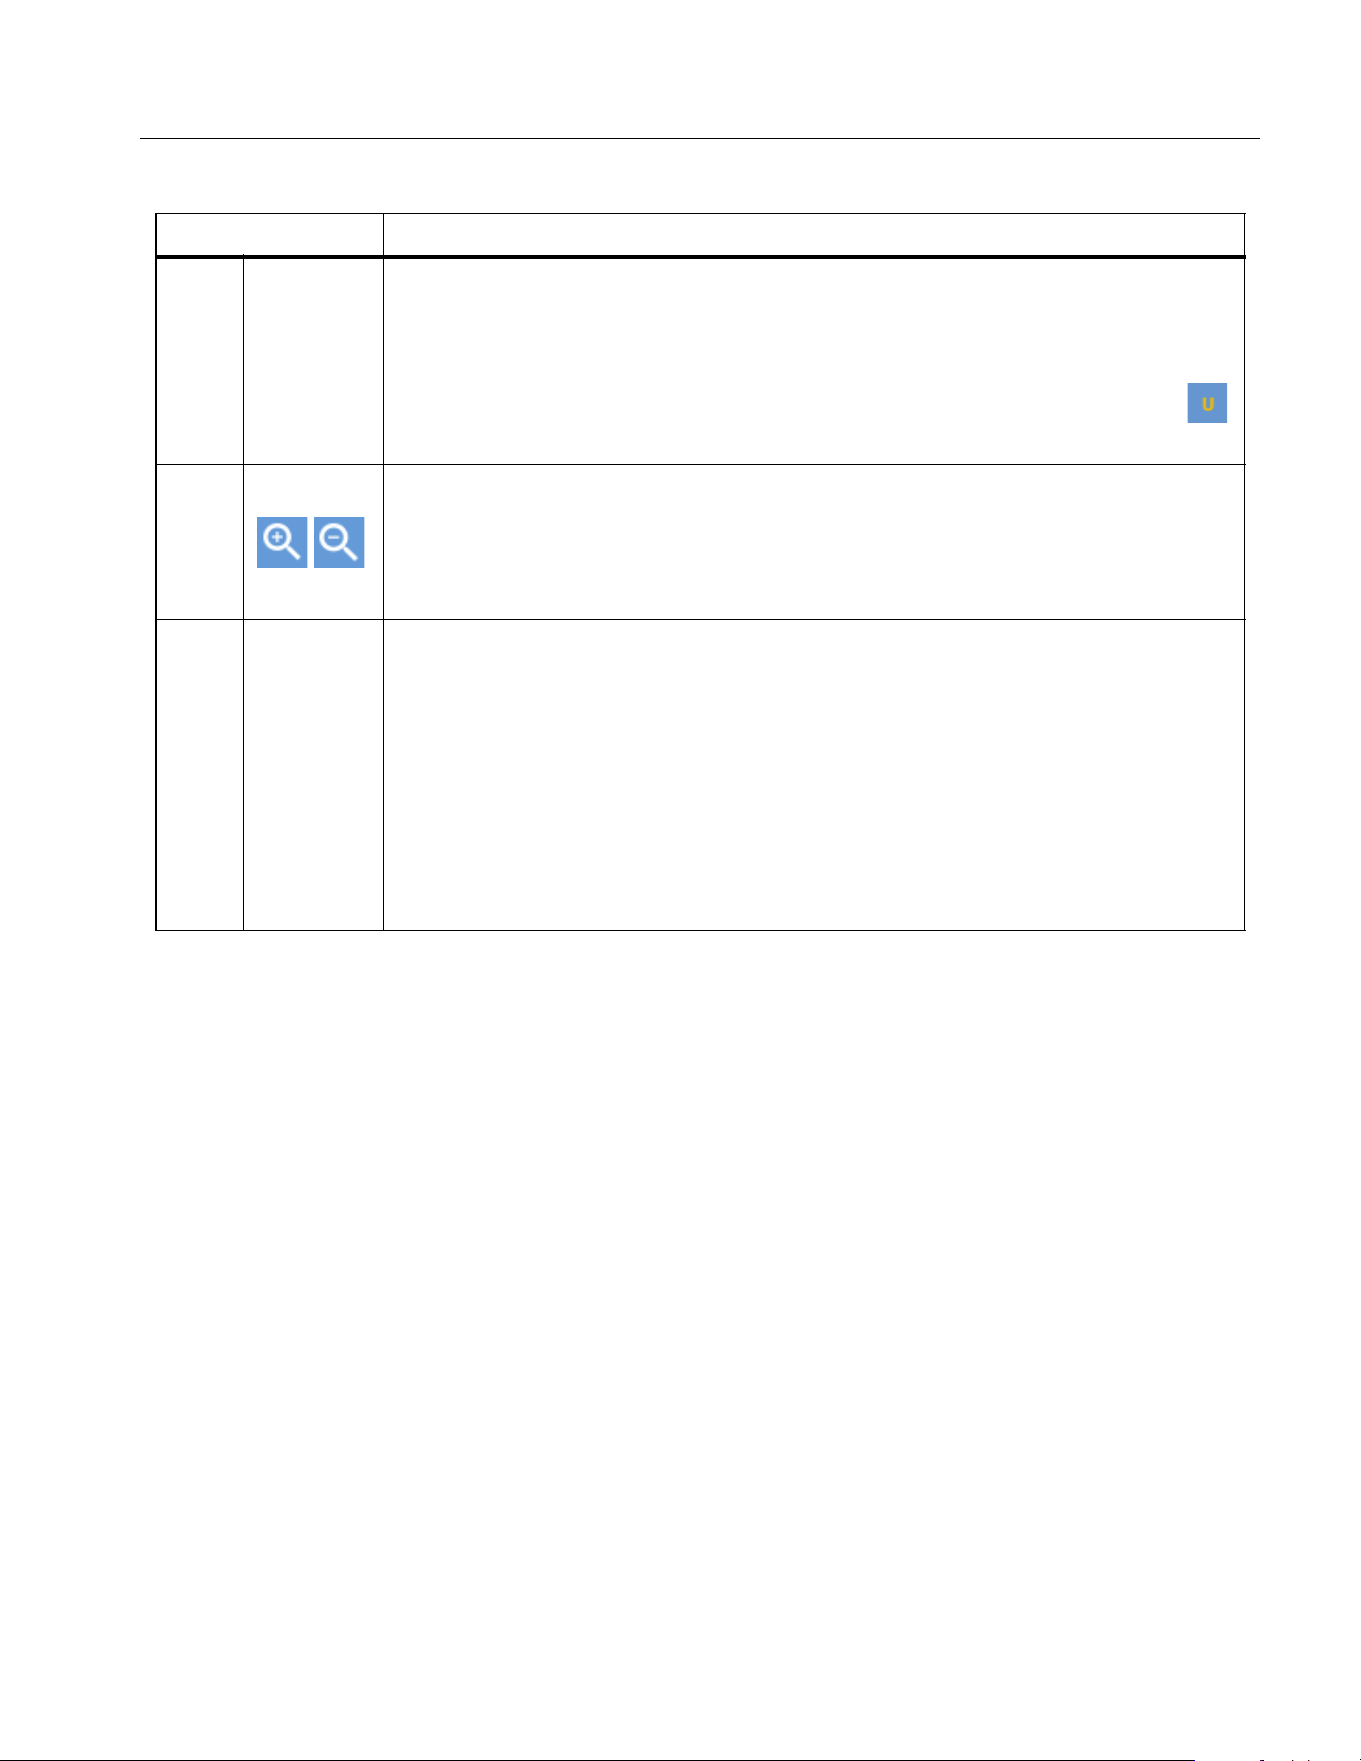
Power Analyzers
Operation
43
Scope
Use Scope mode to view the waveform of the signal under measurement. The supported signals
include voltage and current for example. Up to 4 signals can be selected simultaneously for waveform
display.
In addition, the Product provides cursor measurement function that can be used for various
measurements or calculations of waveforms. See
Measure with The Cursor for details.
Enter Scope Mode:
• From the Current measurement screen, push q.
The Scope screen is shown in
Table 19.
Table 18. Zoom In/Out Vector
Item Description
1
ZOOM
U/I
Select the Phasor to Zoom
Push 1 (ZOOM) to cycle through the currently selected phasor, namely U
or I.
The currently selected phasor shows under the “ZOOM” softkey, such as ,
which means the currently selected phasor is voltage.
3
4
Zoom in/out phasor
Each time you push 3 (zoom in) or 4(zoom out), the currently selected
phasor is zoomed in or out by a certain step.
The steps to zoom in/out the coefficient are: 1, 2, 5, 10.
5 Auto
Auto zoom
Push 5 to enter AUTO mode, and the system automatically determines the
most appropriate display scale. All manual zooming settings are ignored.
Auto zoom features:
• The largest phasor does not exceed the outermost circle in polar
coordinates
• Clearly display each phasor direction point in polar coordinates
• Clearly display the name of each phasor
1.888.610.7664 sales@GlobalTestSupply.com
Fluke-Direct.com
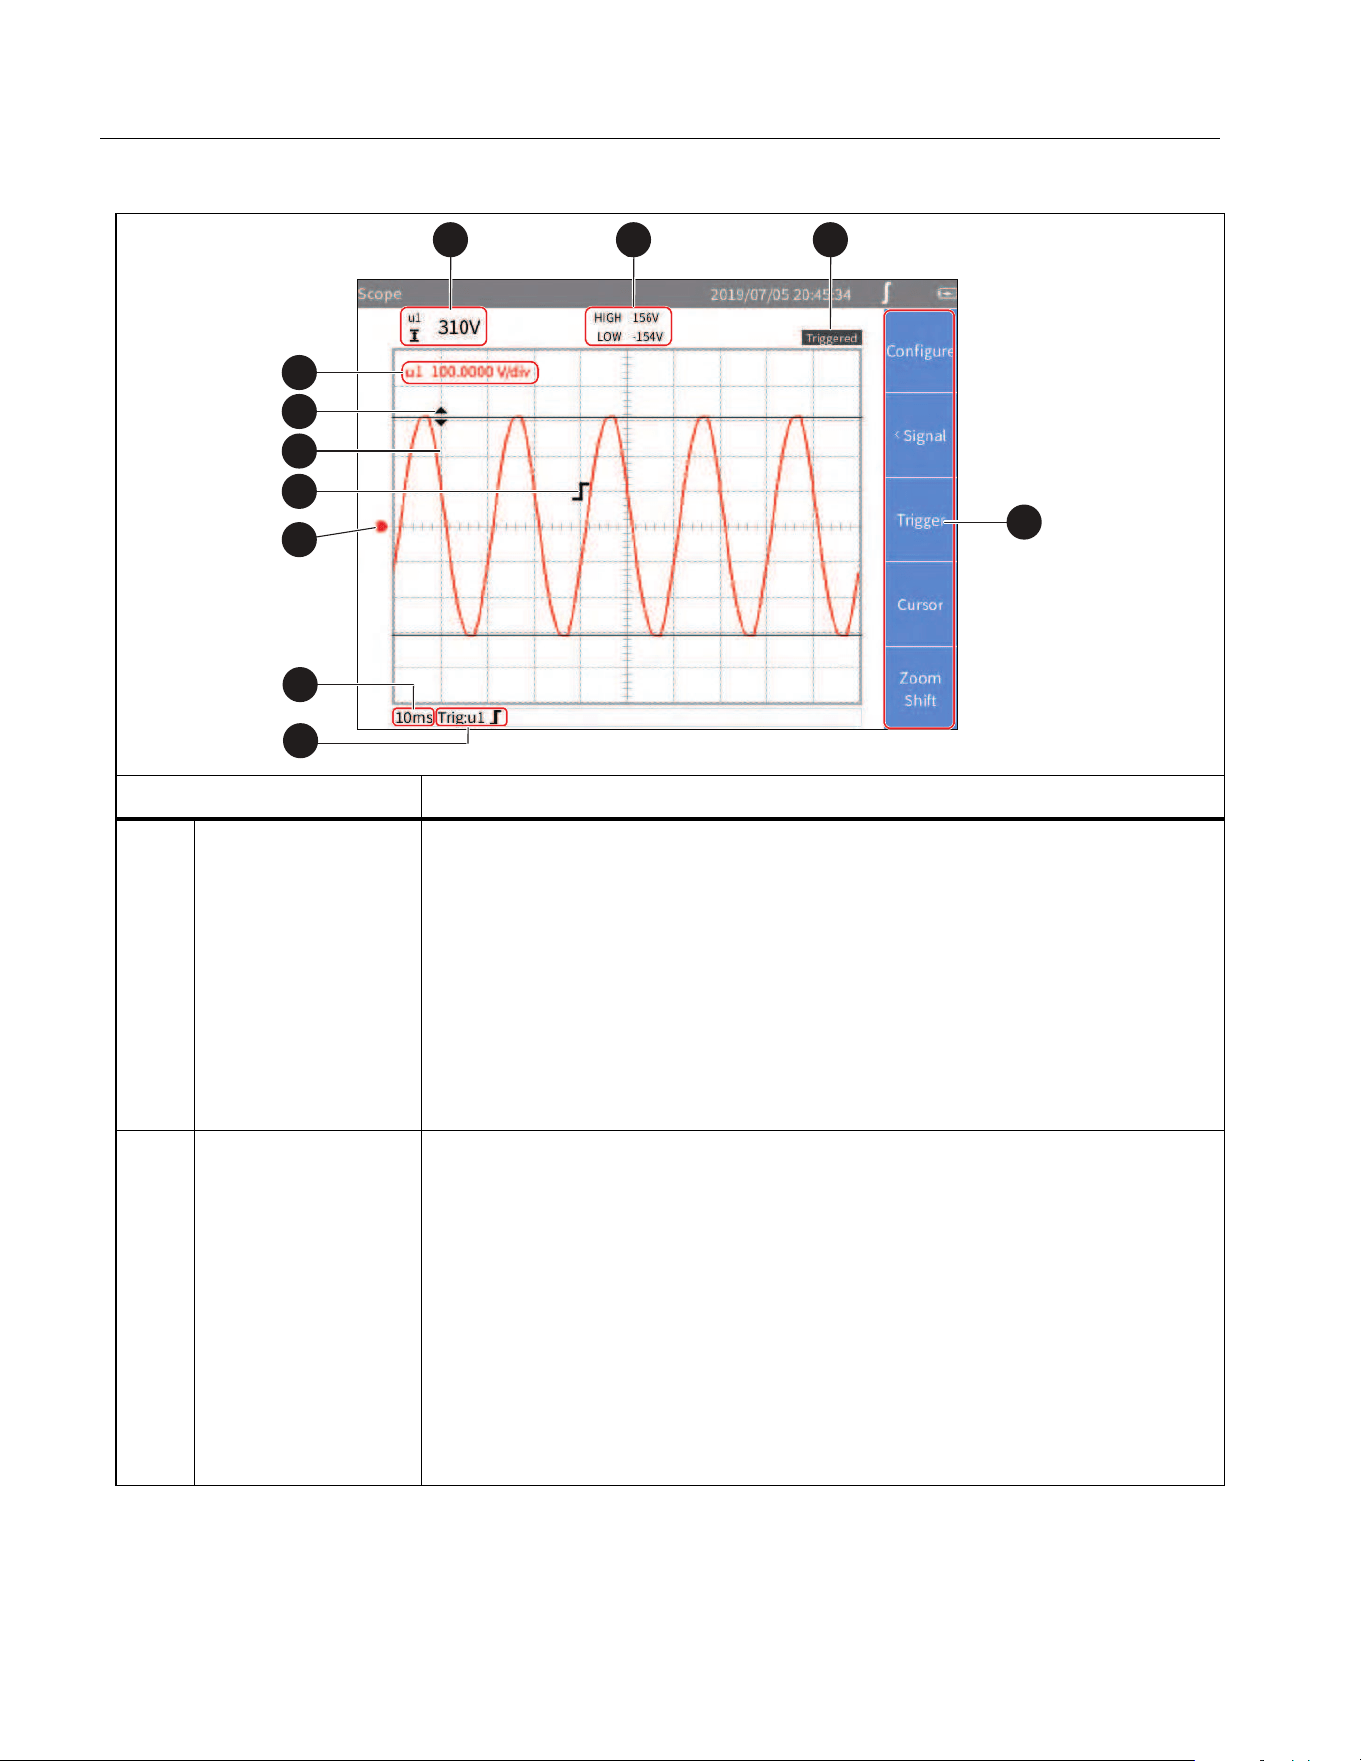
NORMA 6003/NORMA 6003+/NORMA 6004/NORMA 6004+
Users Manual
44
Table 19. Scope Sceen
Item Description
Difference
between cursors /
average at cursor
• The difference between the 2 cursors is displayed when the double
horizontal cursors are activated.
• The average value of the cursor position is displayed when the single
vertical line cursor is activated.
• The difference between the 2 cross points of the 2 cursors and
waveform is displayed when the double vertical cursors are activated.
• If the cursor is off, no values are displayed in this area.
See
Measure with The Cursor for details.
Value at cursor
/time difference
• The values of the 2 cursors show separately when the double
horizontal cursors are activated. HIGH: Value of the upper cursor.
LOW: Value of the lower cursor.
• The maximum and minimum values of the cursors show when the
single vertical cursor is activated. MAX: Maximum value. MIN:
Minimum value.
• The time difference (t) between 2 cursors and the frequency value
(1/t) calculated accordingly are shown when the double vertical
cursors are activated.
• If the cursor is off, no values are shown in this area.
2
31
4
5
6
7
10
8
9
11
1.888.610.7664 sales@GlobalTestSupply.com
Fluke-Direct.com

Power Analyzers
Operation
45
Table 20 Scope Screen (cont.)
Item Description
Trigger Status Displays the current trigger status. See
Trigger Setup for details.
D
Vertical Axis Scale
Displays the vertical axis scale of each waveform on the current
screen, which is the value represented by each grid.
The left side is the parameter symbol, and the right side is the vertical
axis scale of the parameter. The specific unit depends on the
corresponding waveform.
The color of the scale depends on the color of the corresponding
waveform.
E
Cursor
Cursor mode includes single vertical line, double vertical lines and
double horizontal lines. See
Measure with The Cursor for details.
F
Waveform
Up to 4 user-selectable waveforms can be shown simultaneously on
the screen. See
Select the Waveform to Display for details.
G
Trigger Identifier
Indicates the trigger position and level. The shape of the trigger
identifier depends on the current trigger mode. See
Trigger Setup for
details.
H
Ground Level Represents the ground potential.
I
Horizontal Axis
Scale
Horizontal axis (the time axis) scale, the length of time represented by
each grid.
Horizontal axis supports manual zoom. See
Zoom and Shift the
Waveform
for details.
J
Trigger Source
and Trigger Mode
Current trigger setting, showing the current trigger source and trigger
mode. See Trigger Setup for details.
K
Soft Keys
1 (Configure): Global configuration, see
Global Configuration.
2 (Signal): Select the waveform displayed on the screen, see
Select the Waveform to Display.
3 (Trigger): Trigger settings, see
Trigger Setup.
4(Cursor): Turn cursor on/off and set cursor mode, see
Measure
with The Cursor
.
5 (Zoom/Shift): Zoom and shift waveform, see
Zoom and Shift
the Waveform
.
1.888.610.7664 sales@GlobalTestSupply.com
Fluke-Direct.com

NORMA 6003/NORMA 6003+/NORMA 6004/NORMA 6004+
Users Manual
46
Select the Waveform to Display
Up to 4 waveforms can be displayed simultaneously on the screen, and the user can select 1 to 4 items
from all available items for display.
Enter the Signal Menu:
• From the main screen of Scope select 2 (Signal).
The Signal menu lists all currently available parameters, including voltage and current for
example.The specific parameters depend on the current system configuration. See
Set the Wiring
Selection
.
Select the Waveform to Display:
1. In the Signal menu, select up to 4 parameters:
a. Use the arrow (K L M N) keys to move the cursor over the corresponding item.
b. Push S, the selection box of the current item turns yellow and a black “×” symbol is
appears, indicating the selection. To remove a selection, push S again, the selection box
will be cleared.
When a parameter is selected or cleared, the state is reflected in the waveform screen.
2. Push J to go back to the main screen of Scope.
Note
If 4 signals are selected, all other signals are grayed out. When you push the arrow (K L M N)
keys, the cursor can only move among the selected 4 signals. To select a different signal, you
must clear 1 of the 4 signals and then add a new one.
Trigger Setup
Use Trigger to determine when the Analyzer should start displaying waveforms on the screen so that
the waveforms displayed by each refresh can be aligned. Once the set trigger condition is met, the
screen is triggered, the waveform displayed on the screen is aligned at that point.
The Analyzer offers a variety of trigger methods to support multiple trigger sources and trigger modes.
Enter the Trigger Setup Menu:
• From the main screen of Scope select, 3 (Trigger).
The options are as shown in
Table 20.
Table 20. Trigger Setup
Item Description
1 Source
Push 1 (Source) to cycle through the current trigger sources.
The currently selected trigger source is shown under the “Source” label
with a color block of the same color as the waveform.
The selectable trigger sources are the selected signal in the “Signal”
menu, which is the signal displayed on the “Vertical Axis Scale” of the
screen, see
Select the Waveform to Display.
1.888.610.7664 sales@GlobalTestSupply.com
Fluke-Direct.com
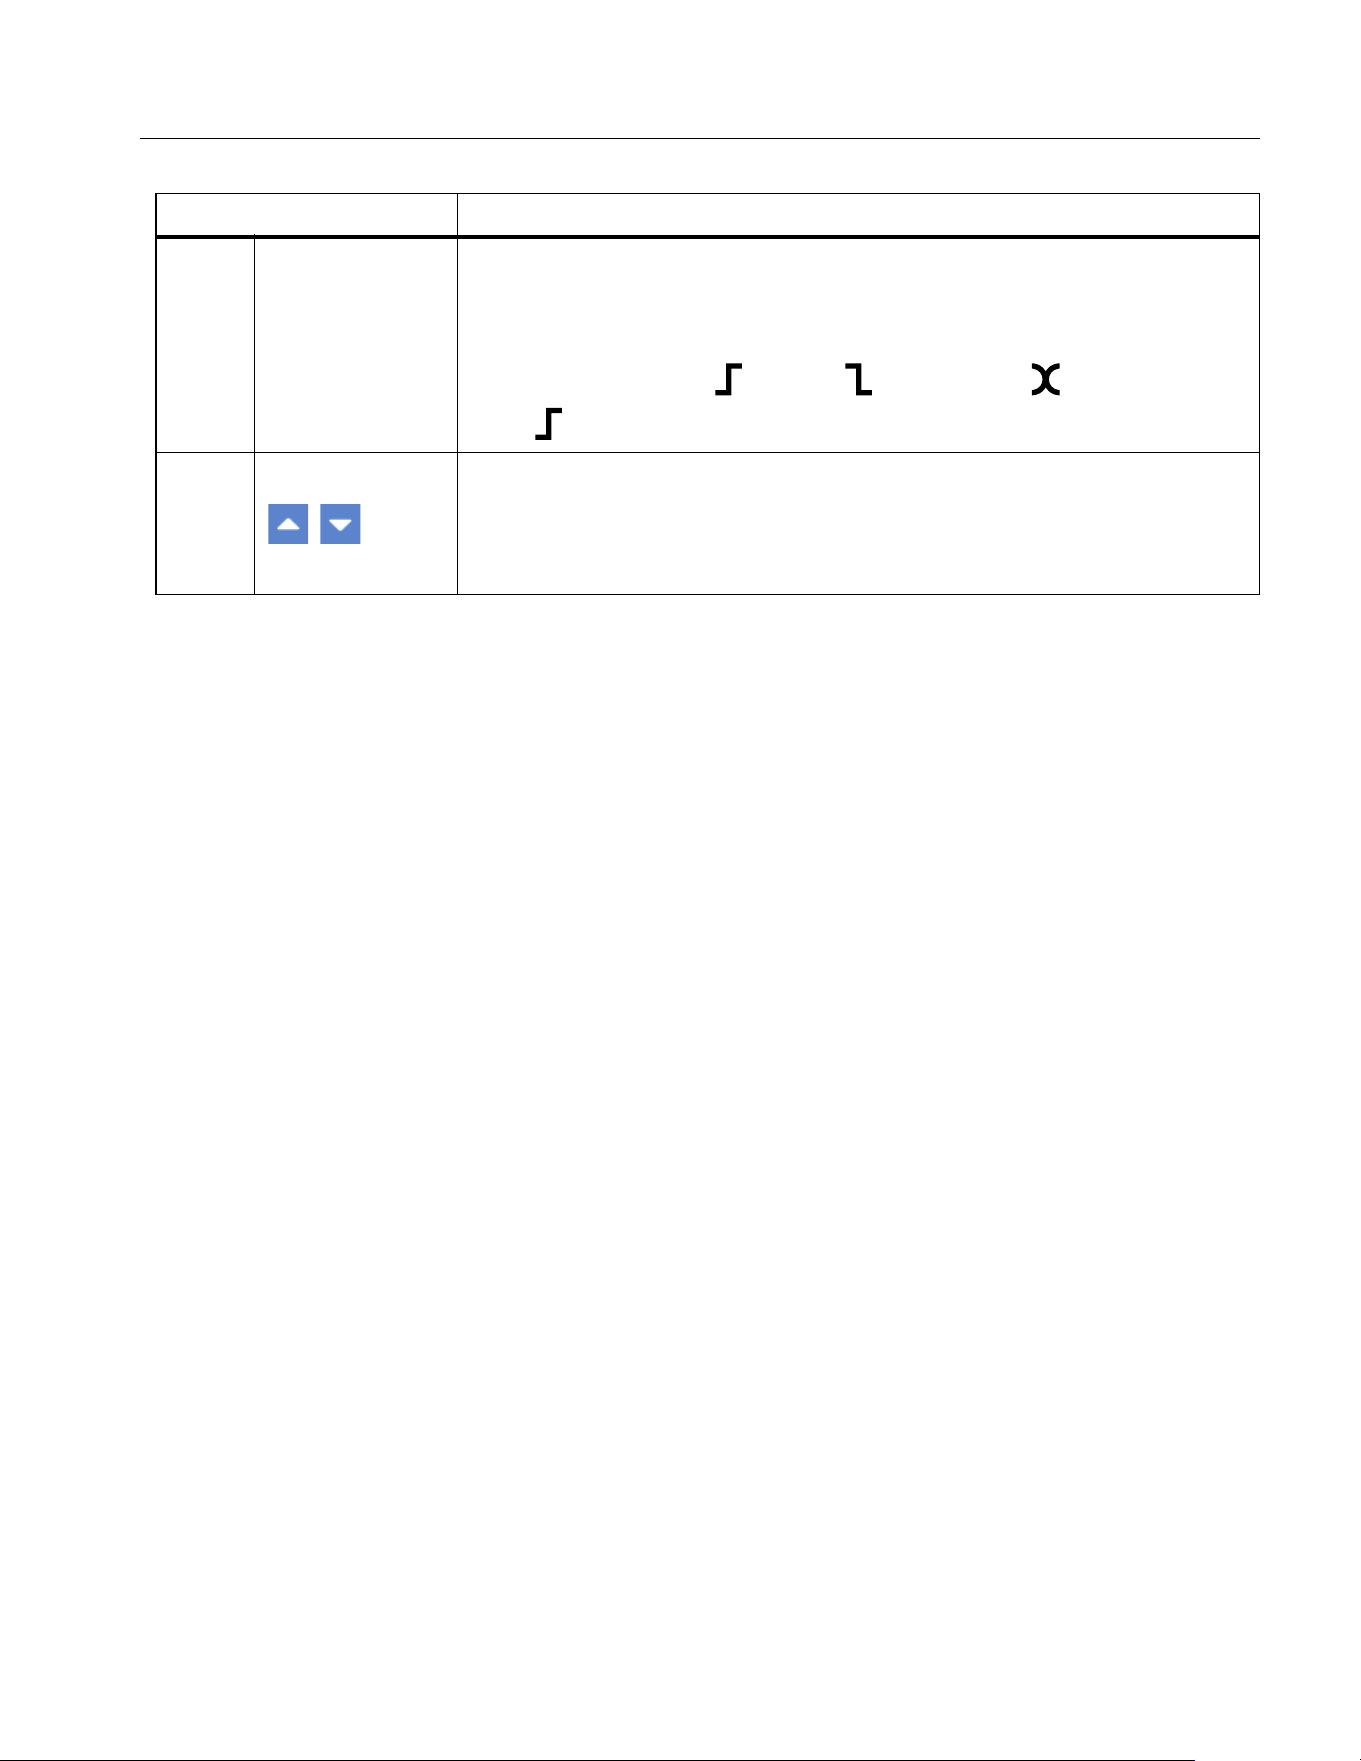
Power Analyzers
Operation
47
Note
If the trigger level is not set properly, under the “Auto” mode, the starting point of the waveform
displayed (signal level at the left side of the screen) may be unstable, it will jitter left and right.
The waveform may not be displayed at all under “Normal” mode.
Trigger Setup:
1. From the main screen of Scope select 3 (Trigger).
2. Push 1 (Source) until the block with the same color as the waveform of the trigger signal is
shown.
3. Push 2 (Method).
4. Use the up and down arrow (K L) keys to move the cursor to Type and push S.
5. Use the up and down arrow (K L) keys to select the appropriate option and push S.
6. Use the up and down arrow (K L) keys to move the cursor to Slope and push S.
7. Use the up and down arrow (K L) keys to select the appropriate option and push S.
8. Push J.
9. Use 4(Level ▲) and 5 (Level
▼) to adjust the trigger level as needed.
2 Trigger Option
Configure trigger mode and trigger edge.
• Method: options are Auto, Normal and Single Shot. The default is
Auto mode.
• Slope: options are Positive,
Negative and Dual. The default
is Positive.
4
5
Trigger Level
The up and down arrow keys increase or decrease the trigger level. Each
time the key is pushed, the trigger mark on the screen moves in the
up/down direction.
Table 20. Trigger Setup (cont.)
Item Description
1.888.610.7664 sales@GlobalTestSupply.com
Fluke-Direct.com
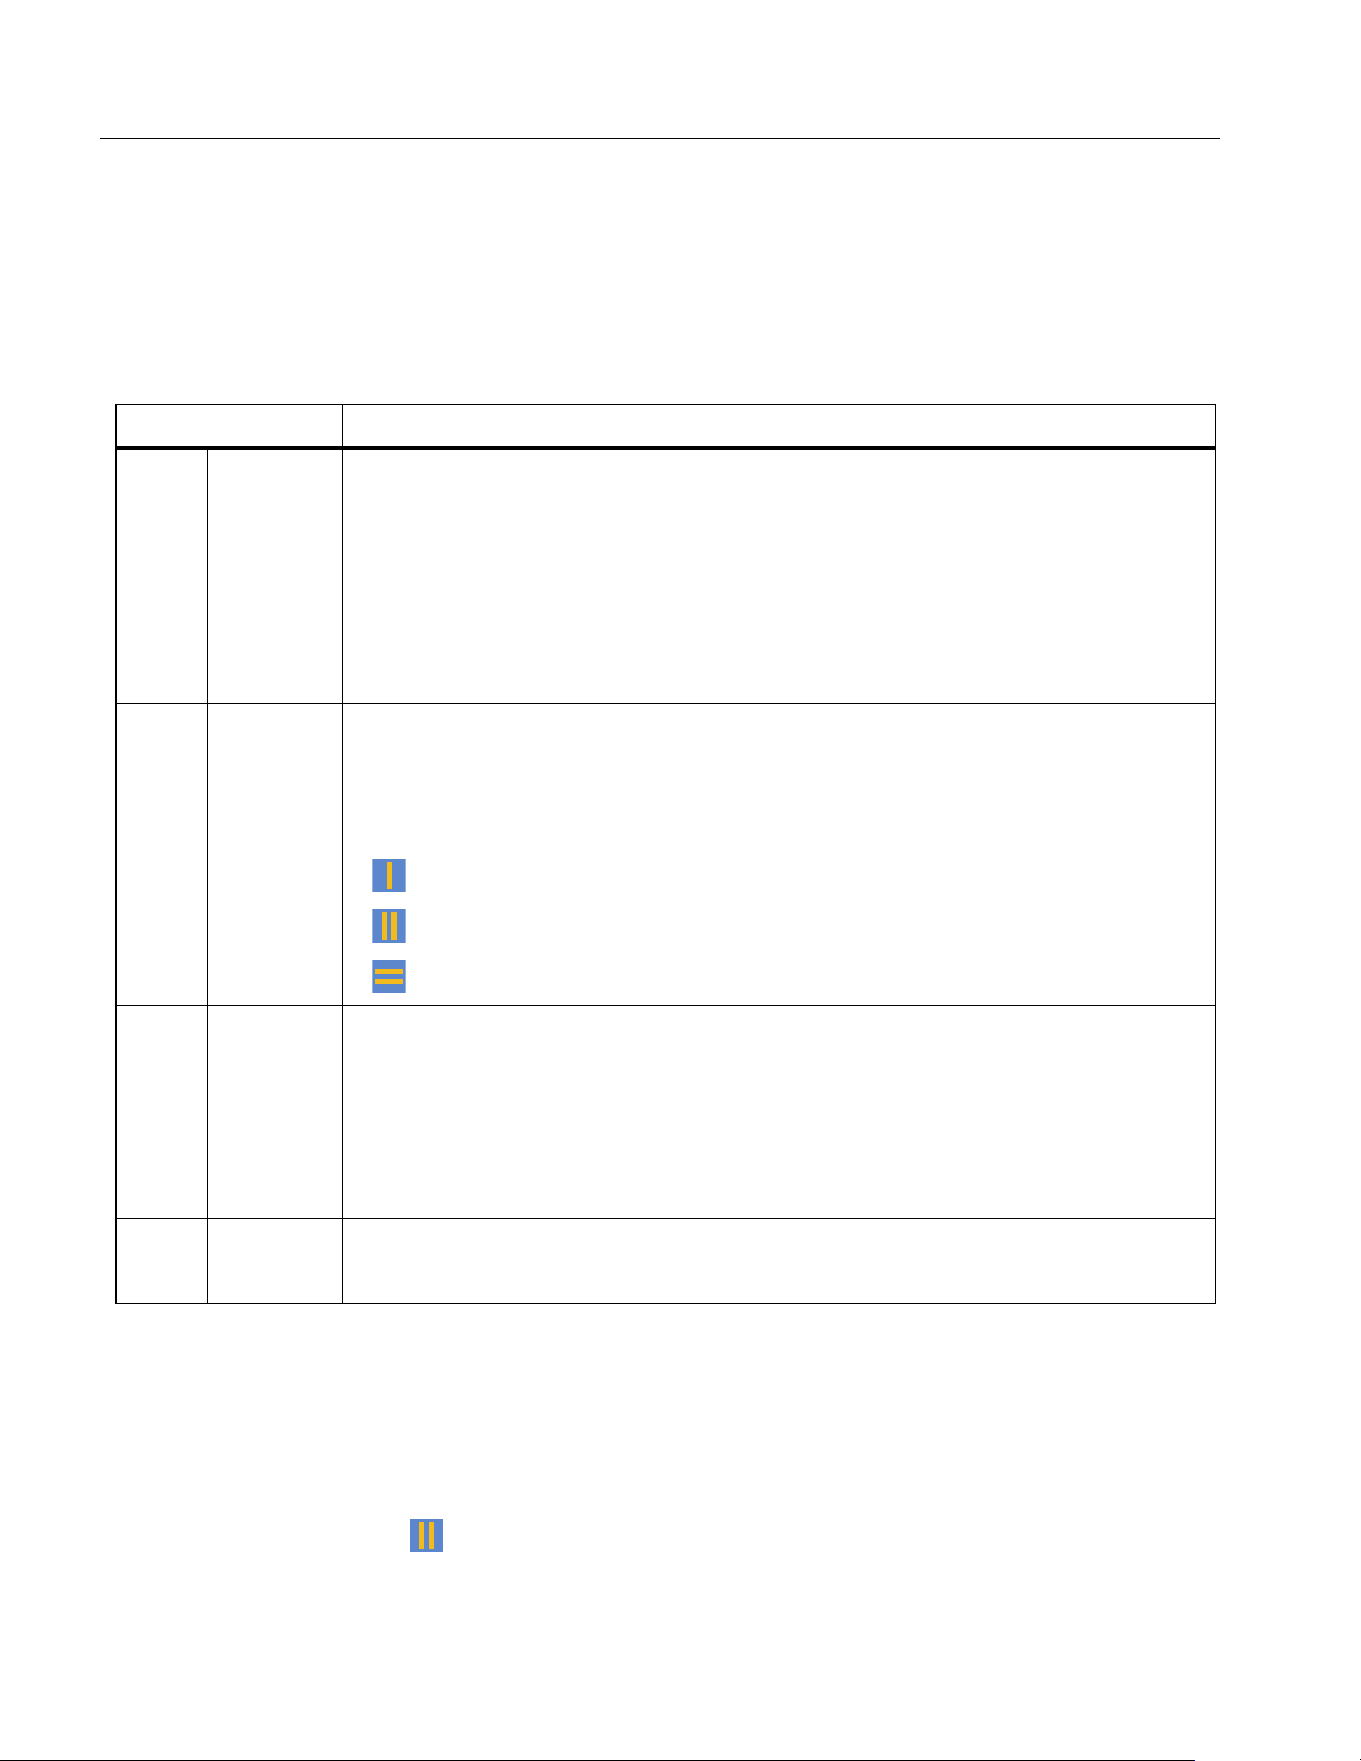
NORMA 6003/NORMA 6003+/NORMA 6004/NORMA 6004+
Users Manual
48
Measure with The Cursor
Use the cursor to measure the waveform digitally.
Enter the Cursor Setup Menu:
• From the main screen of Scope select 4(Cursor).
The options are as shown in
Table 21.
Use the Cursor
The following content uses the double vertical lines as an example to introduce the use of the cursor,
which is similar to the use of the cursor of a single vertical lines and double horizontal lines.
1. From the main screen of Scope select 4(Cursor).
2. Push 4(Cursor) until “ON” is shows on the label.
3. Push 2 (Type) until shows on the label.
Table 21. Cursor Setup
Item Description
1 Select
Select the measured signal
Push 1 (Select) to cycle through the current measured signal.
The currently selected signal is shown under the Select label with a color block
of the same color as the signal waveform.
The selectable signals are the selected signal in the Select menu, which is the
signal shown on the Vertical Axis Scale of the screen, see
Select the
Waveform to Display
.
2 Type
Measurement type
Push 2 to cycle through and select the cursor measurement types. Cursor
Measurement types include single vertical line, double vertical lines and double
horizontal lines.
• (single vertical line)
•
(double vertical lines)
•
(double horizontal lines)
3 Move
Move the cursor
Each time you push 3, the currently selected cursor will be cycled through.
The selected cursor is indicated in yellow and is displayed below the Move
label.
After selecting a cursor, use the arrow (K L M N) keys to move the cursor to the
corresponding position on the waveform.
4 Cursor
Turn the cursor on/off
Push 4to turn the cursor function on or off.
1.888.610.7664 sales@GlobalTestSupply.com
Fluke-Direct.com
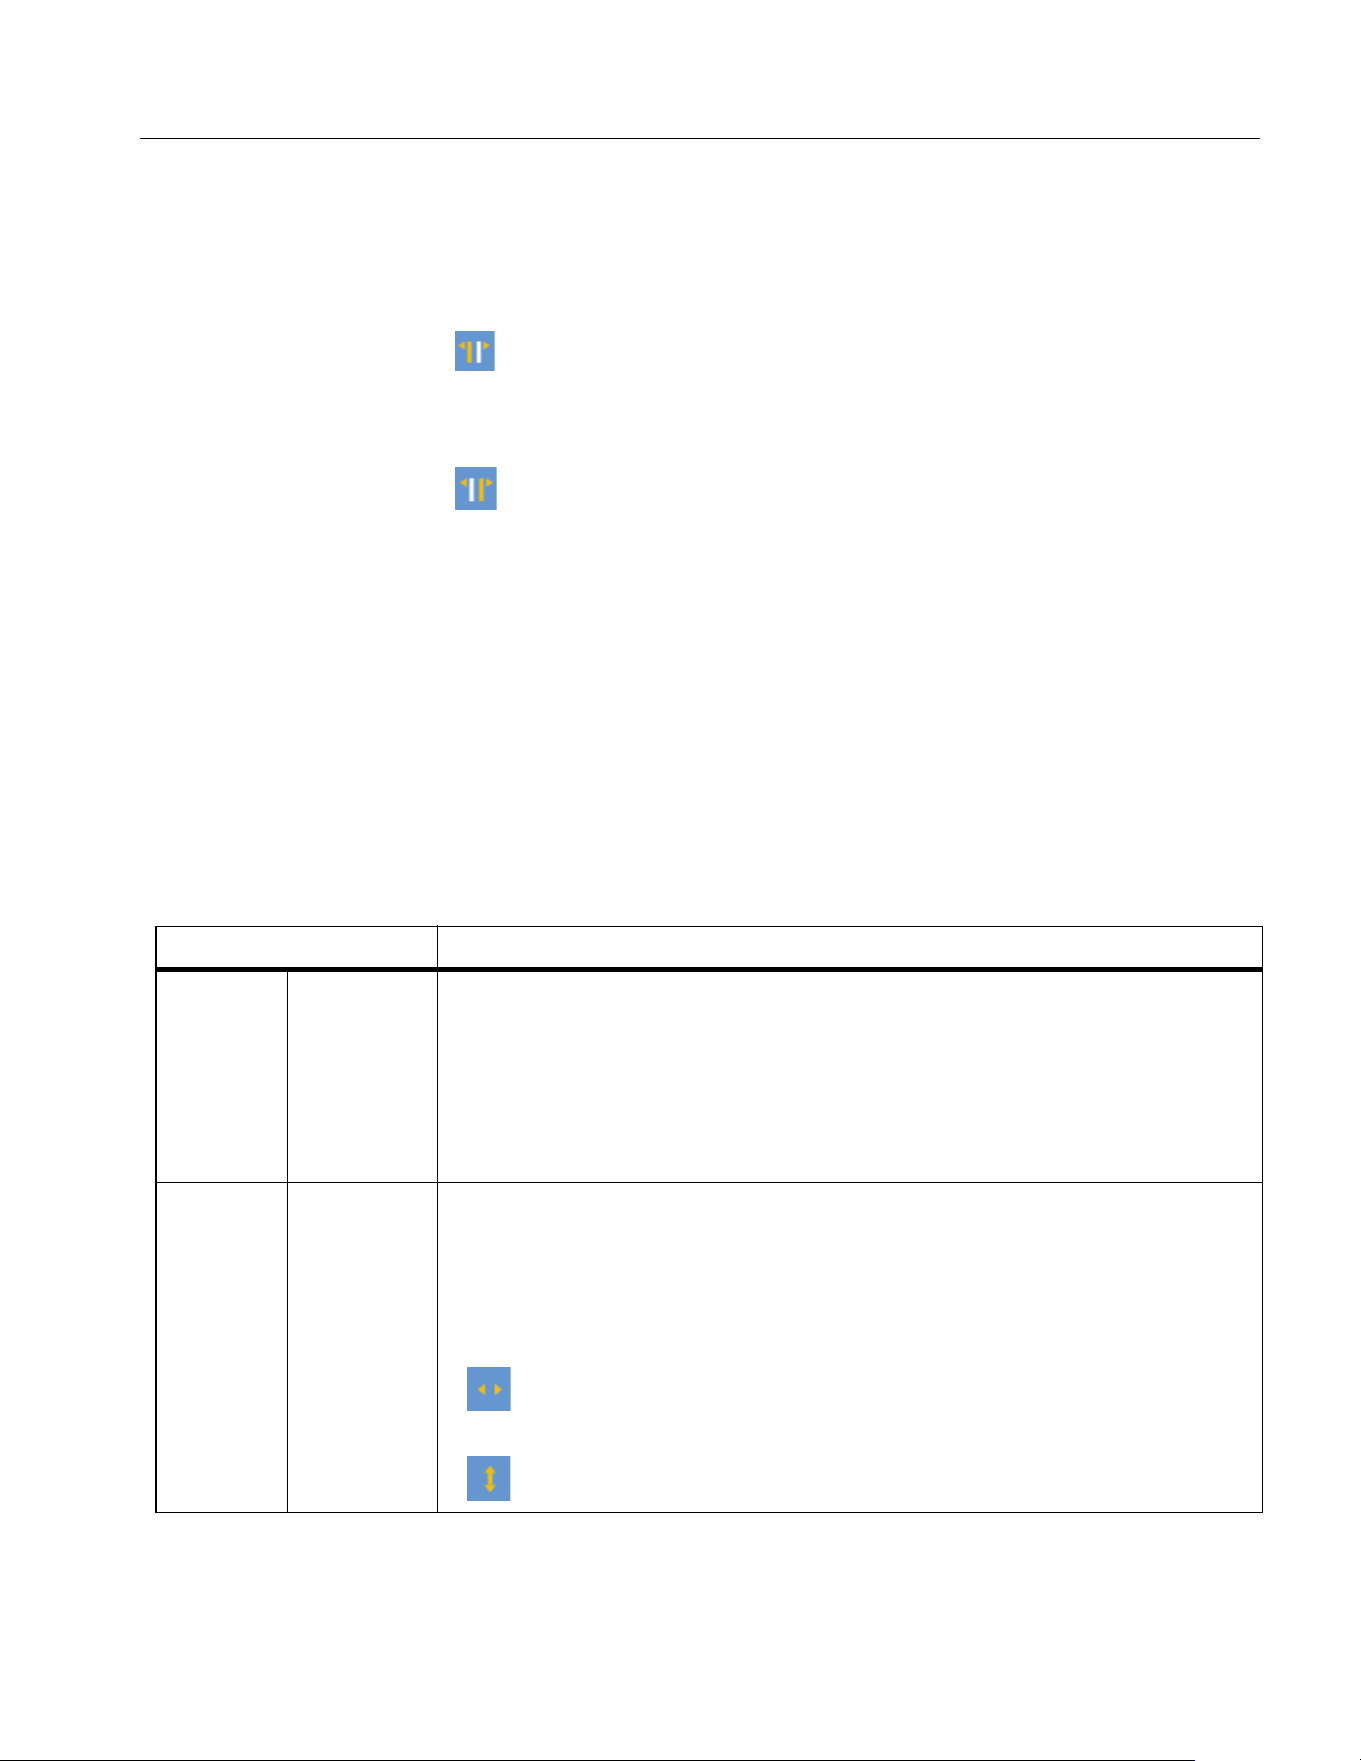
Power Analyzers
Operation
49
4. Push 1 (Select) to select the signal to be measured.
The difference between the crossing points of the two cursors and the signal under measurement is
shown in the upper left corner of the screen, such as “204.7 V”. The time difference (426 ms)
between the two cursors and the frequency (2.347 Hz) calculated are displayed in the upper part of
the screen.
5. Push 3 (Move) until shows on the label, indicating that the left cursor is selected and a
diamond mark is displayed on the left cursor.
6. Use the left and right arrow (M N) keys to move the left cursor to the appropriate position.
7. Push 3 (Move) until shows on the label, indicating that the right cursor is selected and a
diamond mark is displayed on the right cursor.
8. Use the left and right arrow (M N) keys to move the right cursor to the appropriate position.
9. Read the difference, time difference and frequency value at the top of the screen.
Zoom and Shift the Waveform
The Scope supports horizontal and vertical zooming and shifting. You can select a singe waveform
independently for vertical zooming and shifting and the waveforms are not affected by each other.
Enter the Zoom Menu:
• From the main screen of Scope select 5 (Zoom/Shift).
The options are as shown in Table 22.
Table 22. Zoom In/Out the Waveform
Item Description
1 Select
Push 1 (Select) to cycle through the current selected signal.
The currently selected signal is displayed under the “Select” label with a
color block of the same color as the signal waveform.
The selectable signals are the selected signal in the “Select” menu, which
is the signal displayed on the “Vertical Axis Scale” of the screen, see
Select the Waveform to Display.
2 DIR
Zoom direction
Push 2 to cycle through and select the zoom direction. Horizontal and
vertical zooming of waveforms are supported. The currently selected zoom
direction is displayed below the “DIR” softkey label, indicated by a
horizontal or vertical two-way arrow.
• (horizontal): Zooms the time axis of all signal waveforms in step of 1,
2, 5 and 10.
• (Vertical): Zooms the currently selected signal vertically.
1.888.610.7664 sales@GlobalTestSupply.com
Fluke-Direct.com
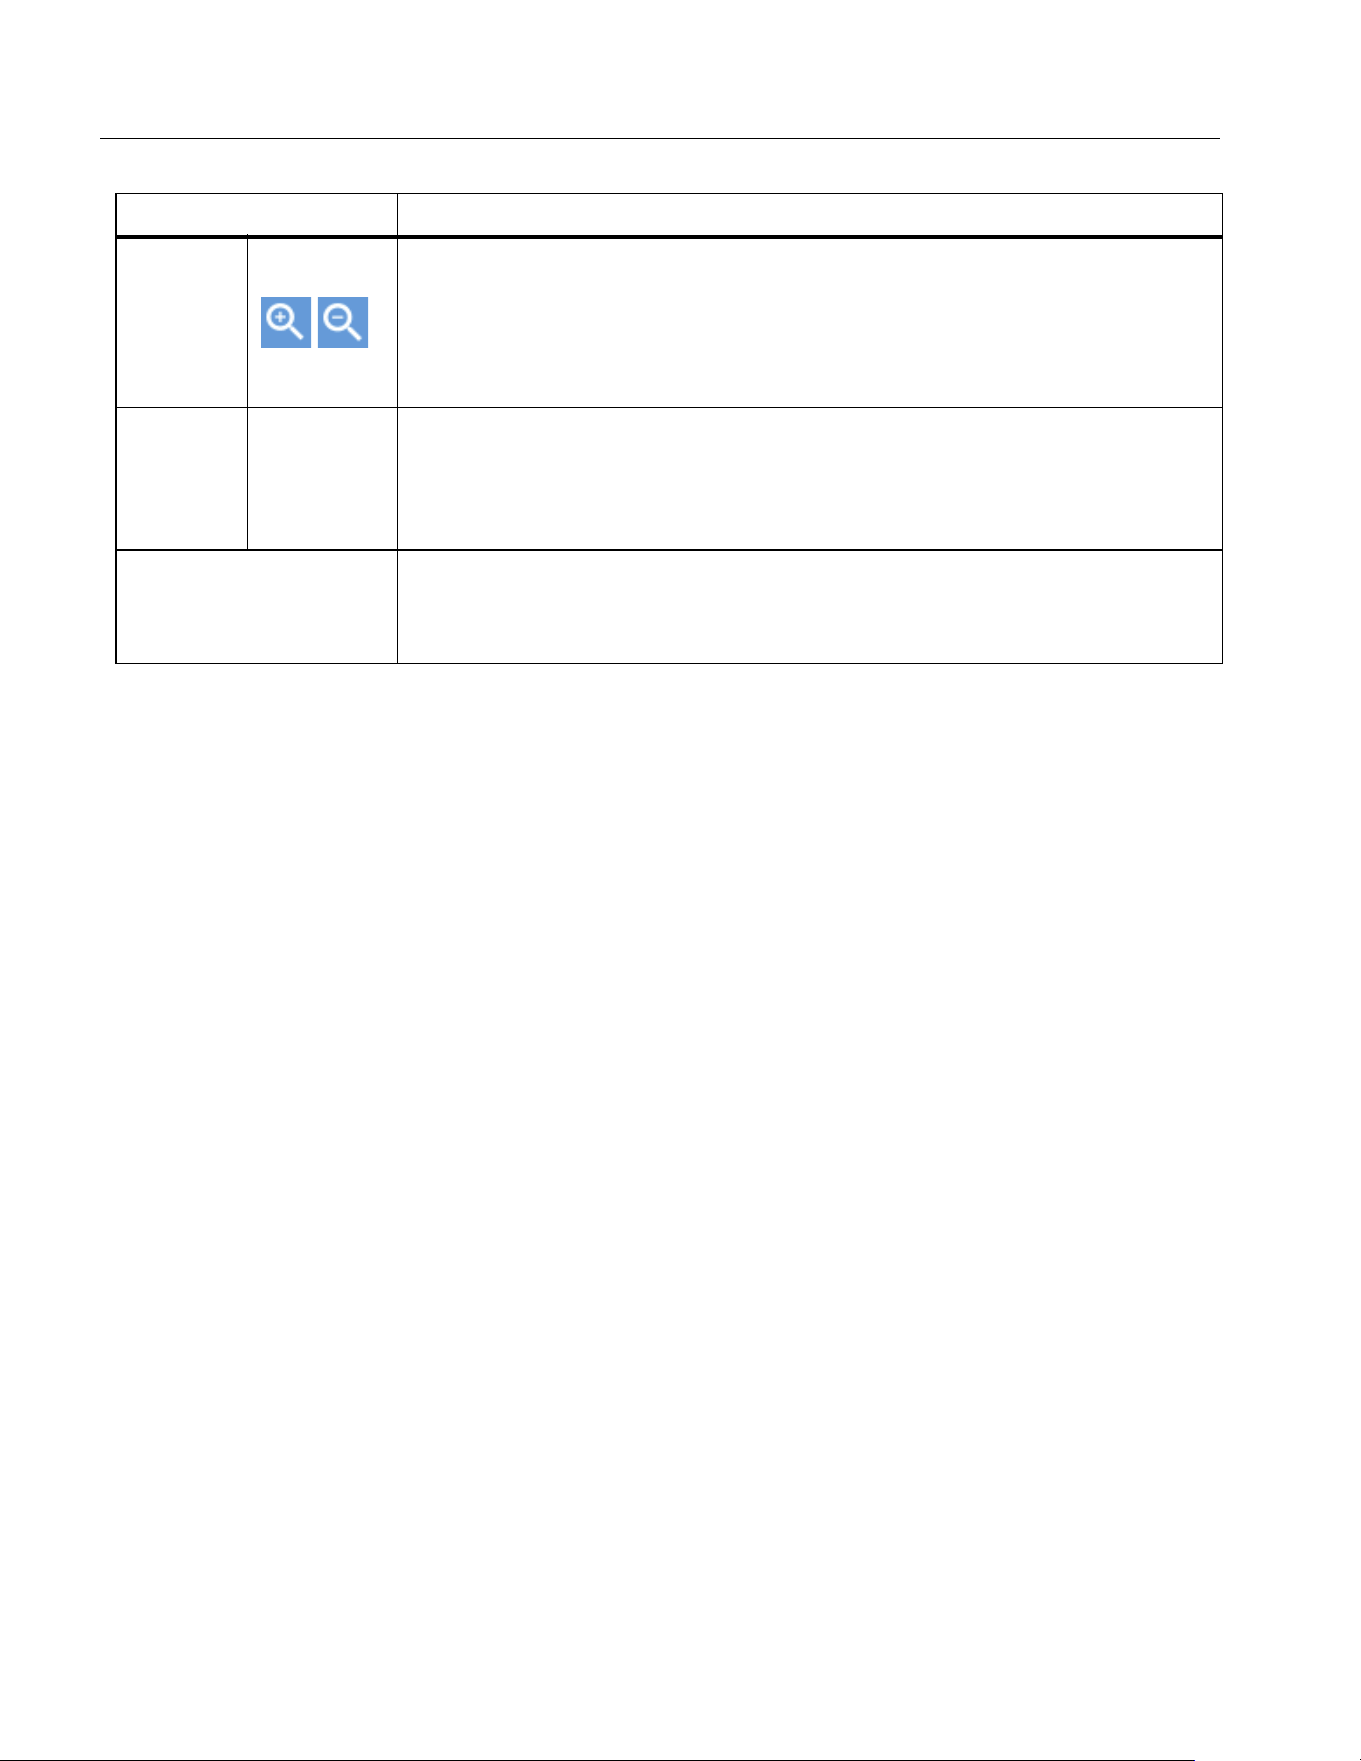
NORMA 6003/NORMA 6003+/NORMA 6004/NORMA 6004+
Users Manual
50
Trend
The Trend mode displays and records the trend of numerical measurements. Any numerical
measurement item can be displayed as a trend, up to 4 trend curves can be displayed simultaneously
on the screen.
When the trend function is activated, the Analyzer continuously records the digital reading of the
measurements and displays it as a graph. Like a paper chart recorder, the trend graph can be scrolled
from right to left.
The bottom of the screen shows the recording time since it starts.
Enter Trend Mode:
• From the Current measurement screen, push t.
The Trend screen is as shown in
Table 23.
34
Zoom in/out waveform
Each time you push 3 (zoom in) or 4(zoom out), the waveform is
zoomed in or out in a certain step in the horizontal or vertical direction.
(Vertical zooming will be applied to the selected waveform. Horizontal
zooming will be applied to all waveforms currently displayed.)
5 Auto
Auto zoom
Push 5 to enter the Auto Zoom mode, the system automatically zooms
all displayed waveforms to the appropriate scale. All manual zooming
settings are ignored.
K L
Shift waveform
In the menu, use the up and down arrow (K L) keys to move the currently
selected waveform up and down on the screen.
Table 22. Zoom In/Out the Waveform (cont.)
Item Description
1.888.610.7664 sales@GlobalTestSupply.com
Fluke-Direct.com
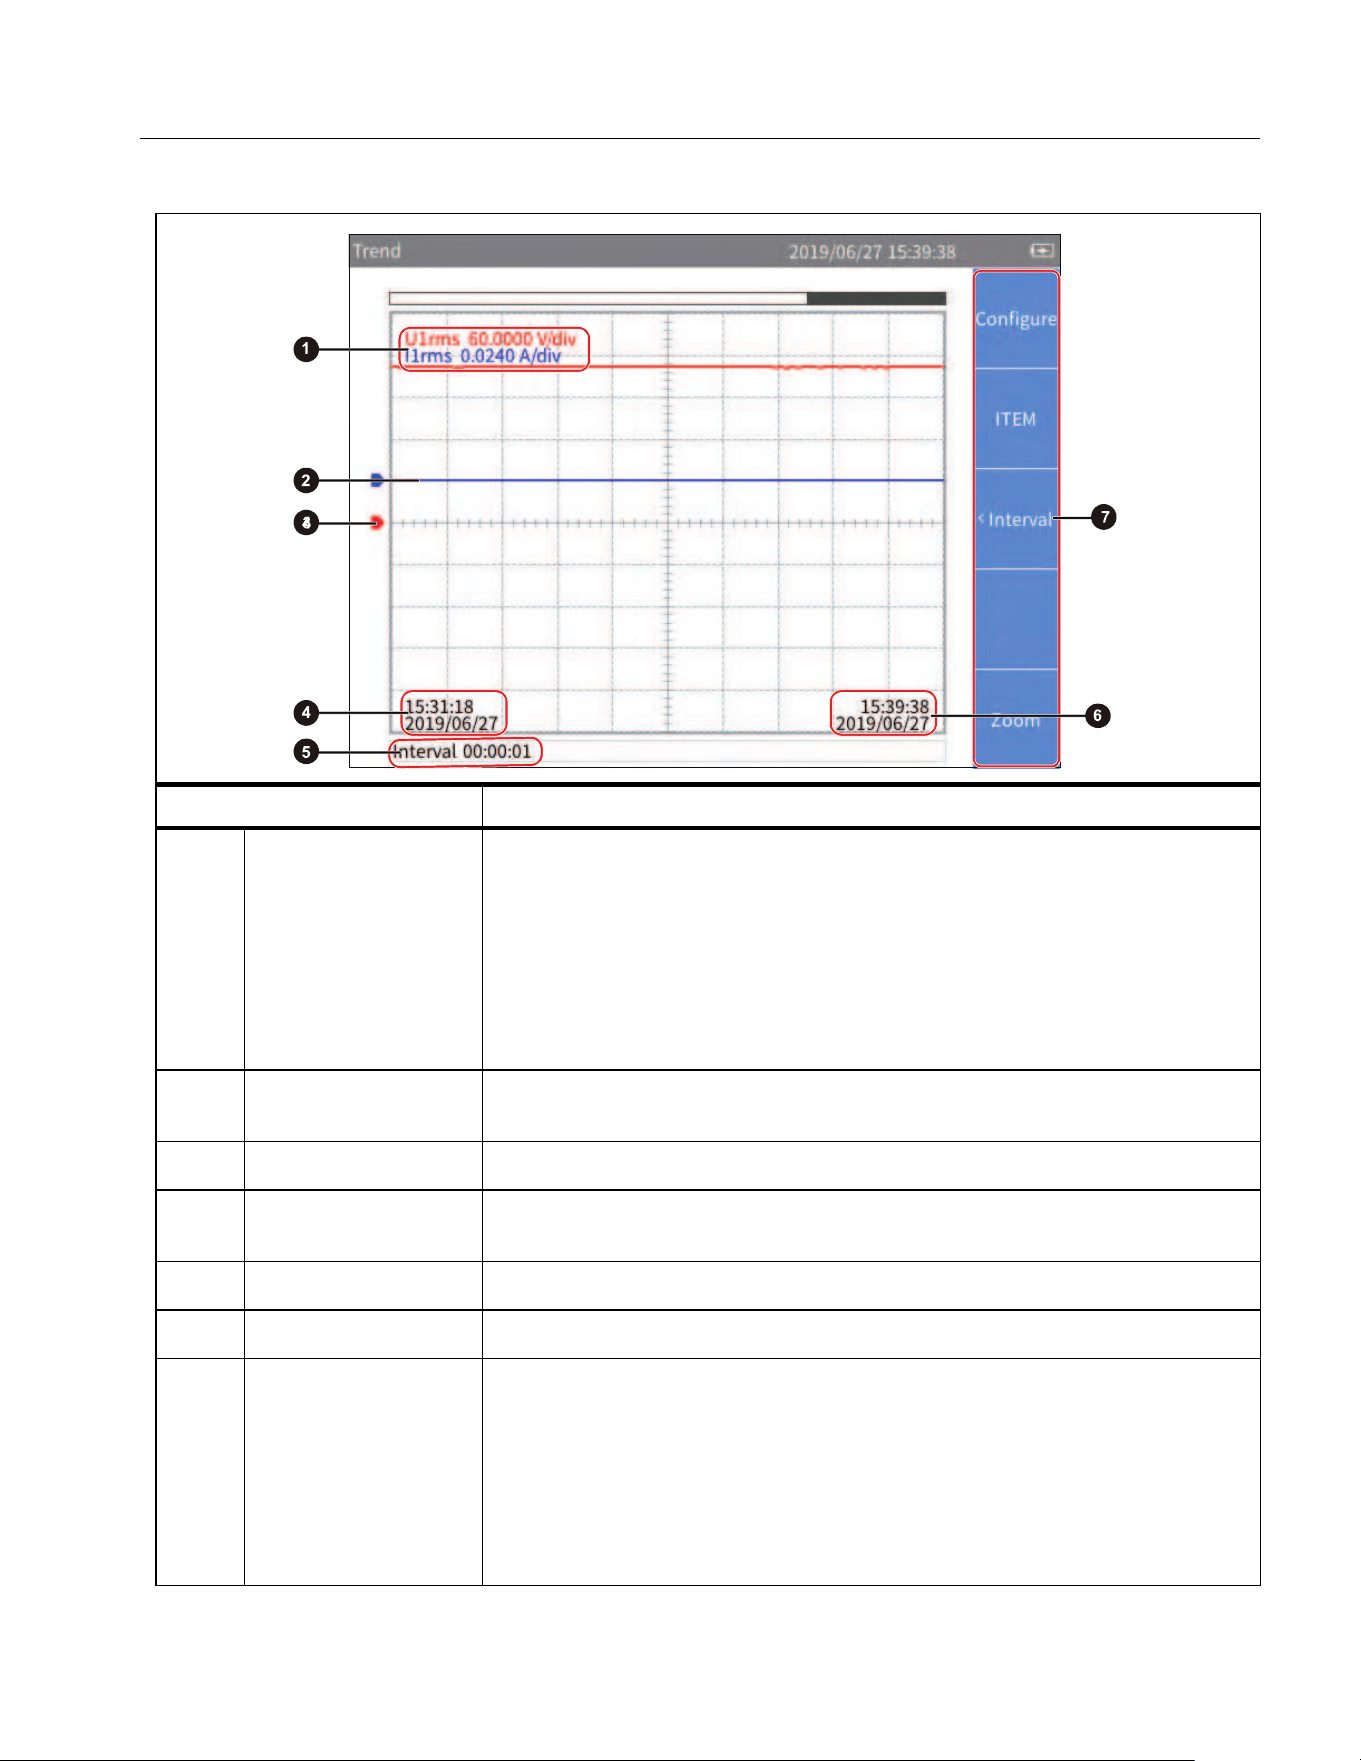
Power Analyzers
Operation
51
Table 23. Trend Screen
Item Description
Vertical Axis Scale
Displays the vertical axis scale of each trend waveform on the current
screen, which is the value represented by each grid.
The left side is the item symbol, and the right side is the vertical axis
scale of its trend curve. The specific unit depends on the
corresponding item.
The color of the scale depends on the color of the corresponding trend
curve.
Trend Curve
Up to 4 user-selectable trend curves can be displayed simultaneously
on the screen. See
Select the Trend to Display for details.
Zero Position Indicates the zero position of the trend curve.
D
Time on the Left of
the Screen
Start time of the trend graph on current screen.
E
Interval Sampling interval used to draw the current trends.
F
Current Time End time of the trend graph on current screen.
G
Soft Keys
1 (Configure): Global configuration, see
Global Configuration.
2 (Item): Select trend items displayed on the screen, see
Select
the Trend to Display
.
3 (Interval): Set the acquisition interval of the trend curve. See
Set
Measurement Period
.
5 (Zoom/Shift): Zoom / shift trends, see
Zoom and Shift the Trend.
1.888.610.7664 sales@GlobalTestSupply.com
Fluke-Direct.com
NORMA 6003/NORMA 6003+/NORMA 6004/NORMA 6004+
Users Manual
52
Select the Trend to Display
You can select 1 to 4 items from all available items to show on the screen.
Enter the Item menu:
• From the main screen of Trend select 2 (Item).
The Item menu is as shown in
Table 24.
Display/hide Trend Curve:
1. From the main screen of Trend select 2 (Item) > 1 (Display).
2. In Display dialog, use the up and down arrow (K L) buttons to move the cursor over the trend
curve you want to display/hide.
3. Push S to select or deselect the current item depending on its previous state.
When a trend curve is selected or deselected, it will immediately be reflected in the trend screen to
display or hide the trend curve.
4. Push J to go back to the main screen of Trend.
Note
The Display menu is equivalent to a buffer that can hold up to 4 items. Use 2 (Add) and
3 (Del) to add the 4 most commonly used items to the buffer. Then select the trend data to
show/hide the trend curve through the Display menu. This avoids frequently using the
cumbersome 2 (Add) and 3 (Del) keys to switch the displayed trend curve.
Add Trend Item:
1. From the main screen of Trend select 2 (ITEM) > 2 (Add).
The Add menu is shown. All available items are listed by categories in a tree structure. The
available trend items contain the most measurement items under Meter function.
2. Use 1 to 4button to enter the category.
3. For each item to add (up to 4):
a. Use the navigation arrow (K L) keys to move the cursor over the corresponding item.
In most cases, there are 2 dialog boxes displayed in the measurement tree menu, the one on
the left lists the names of items, and the one on the right lists the supported channels or wiring
groups. The yellow block represents the cursor position, and the yellow box indicates the
corresponding branch in the current tree structure.
b. Push S to enter its sub-menu (if any).
c. Use the arrow (K L) keys to move the cursor over the corresponding item.
Table 24. Select the Trend to Display
Item Description
1 Display
Set the trend curve currently displayed. You can choose from up to 4 trend
curves. All 4 trend curves are displayed by default.
2 Add Add items to plot trend curves and up to 4 collection items can be added.
3 Del Delete the trend item that is currently added.
1.888.610.7664 sales@GlobalTestSupply.com
Fluke-Direct.com

Power Analyzers
Operation
53
d. Push S to add the current item. The item will be highlighted in yellow.
After the item is added successful, you will be straight back to the top-level parameter menu.
4. Push J repeatedly to go back to the main screen of Trend.
Note
If there are already 4 trend items in the “Display” menu, you cannot add a 5th item regardless
of whether they are all displayed on the trend screen. You must delete one or more trend items
and then add other items.
Delete Trend Item:
1. From the main screen of Trend select 2 (ITEM) > 3 (Del).
2. In “Del” dialog, use the up and down arrow (K L) buttons to move the cursor over the item to be
delete.
3. Push S to delete the current item from the Display menu.
4. Go back directly to ITEM screen.
Note
When deleting trend data, remove an item from the Display menu by using the Del menu even
if its trend curve is not displayed on the screen.
Set Measurement Period
The measurement period is the time interval used to plot the trends and provides two modes of Update
Rate and Interval. In the Update Rate mode, the interval of the trends is the update rate of the
Analyzer, which can achieve accurate evenly spaced acquisition, which is suitable for analyzing the
process of rapid change. In the Interval mode, the interval of the trends is determined by the trend
function itself, which is not as accurate as the Update Rate mode, but it can record the trends for a long
time.
Enter the Measurement Period Setup Menu:
• From the main screen of Trend select 3 (Interval).
The measurement period setup dialog is shown in
Table 25.
Table 25. Measurement Period Setup
Item Description
Update rate
By update rate
The measurement period is the same as the update rate of the Analyzer by
default.
The update rate is a kind of global configuration of the Analyzer. See
Set
Sync Source and Update Rate
for information on update rate.
1.888.610.7664 sales@GlobalTestSupply.com
Fluke-Direct.com
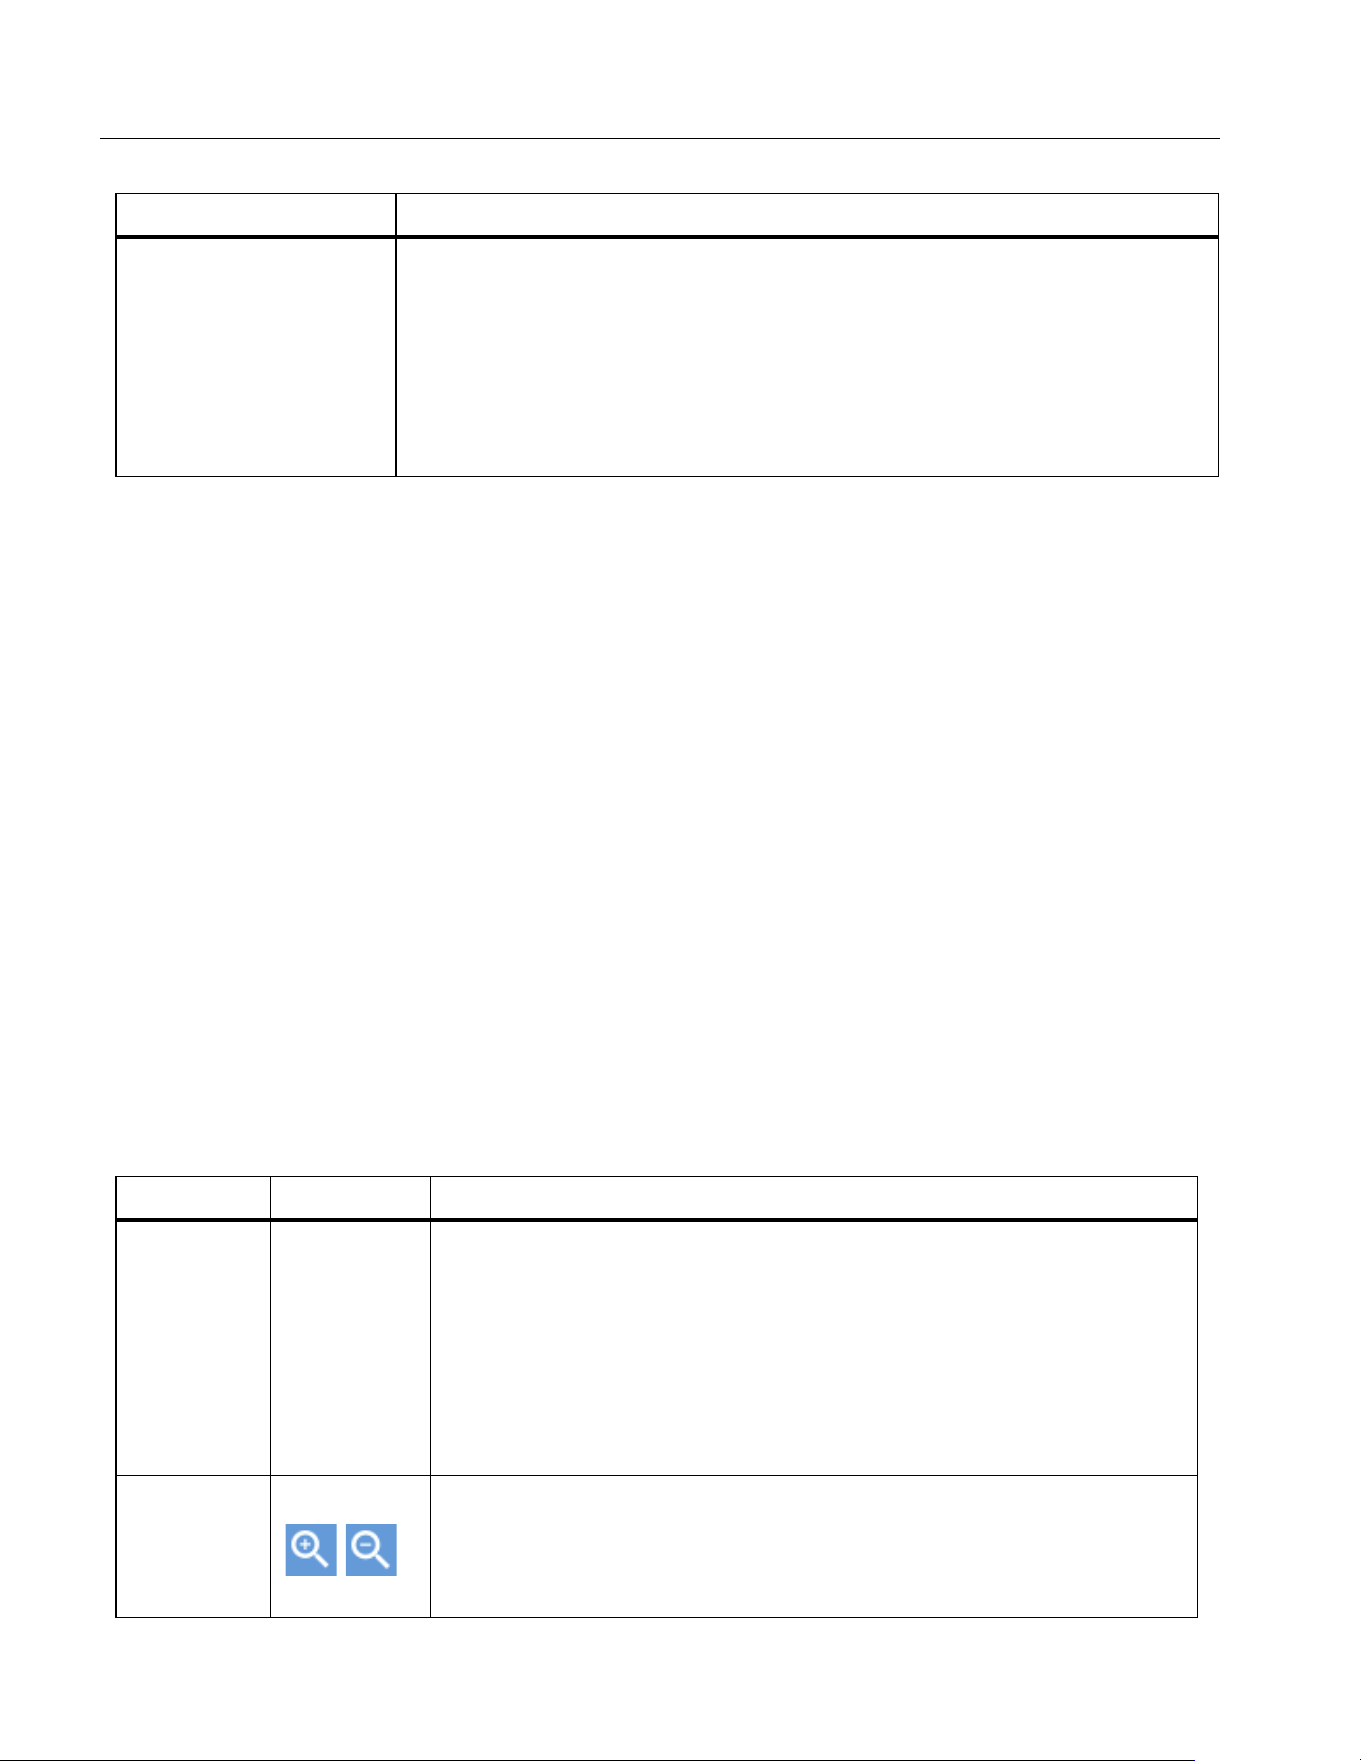
NORMA 6003/NORMA 6003+/NORMA 6004/NORMA 6004+
Users Manual
54
Customize the Interval
1. From the main screen of Trend select 3 (Interval).
2. If Update Rate is selected, use the up and down arrow (K L) keys to move the cursor to Interval.
Push S. The Interval option is selected.
3. Use the up and down arrow (K L) keys to move the cursor to
H (Hour) input box.
4. Use the left and right arrow (M N) keys to adjust the Hour value.
5. Push S.
6. Use the left and right arrow (M N) keys and S to set Minutes and Seconds.
7. Push J to go back to the main screen of Trend.
Zoom and Shift the Trend
The Trend supports vertical and horizontal shifting as well as vertical zooming. Each trend graph can
be shifted and zoomed vertically independently, and they are not affected by each other.
Enter the Zoom Menu:
• From the main screen of Trend select 5 (Zoom/Shift).
The options are as shown in
Table 26.
Interval
Customize sampling interval
You can customize sampling interval as measurement period. The
minimum interval is 1 second and the maximum is 24 hours
• H: Customize the Hour value of the interval.
• M: Customize the Minute value of the interval.
• S: Customize the Second value of the interval.
Table 26. Zoom the Trend
Item Description
1 Select
Select the trend
Push 1 (Select) to cycle through the currently selected trend.
The currently selected trend is displayed under Select with a color
block of the same color as the trend curve.
The available trend is the selected items in the ITEM menu, which is
the items displayed on the Vertical Axis Scale of the screen, see
Select the Trend to Display.
3 4
Zoom in/out waveform
Each time you push 3 (zoom in) or 4(zoom out) button, the
selected waveform will be zoomed in or out vertically by a certain
step.
Table 25. Measurement Period Setup (cont.)
Item Description
1.888.610.7664 sales@GlobalTestSupply.com
Fluke-Direct.com

Power Analyzers
Operation
55
Data Management
The Analyzer can save the measurement data and the current configuration of the Analyzer in the
internal memory, or log the data displayed on the current screen in Meter mode for a long time. The
data can be downloaded to a PC by using the Fluke Power Analyzer software. For more information,
please refer to the instructions for using the PC software.
Use mto manage the data stored in the internal memory.
Save Data
On any measurement screen, push s and the Save dialog box will show on the screen.
• Push 1 (Data) to save all valid measurements at the current time to the internal memory. When
it is saved successfully, a prompt message containing the name of the file will show on the screen.
• Push 2 (Settings) to save the current system settings and the configuration of all measurement
functions. When the save is successful, a message containing the name of the file shows on the
screen.
Note
The Analyzer automatically creates the file name based on the category of the saved data and
system time. To modify the file name, after it is saved, push m and follow the prompt.
(See
Memory)
Logger
Enter the Logger Menu:
• In Meter mode, push and hold sfor more than 2 seconds, to show the Logger menu on the
screen.
The functions in the Logger menu are as shown in Table 27
.
5 Restore
Restore auto zoom
When this button is pushed, it will restore to the display scale
automatically determined by the system.
K L M N
Shift waveform
In the interface of this menu, use the navigation arrow (K L M N) keys
to shift the currently selected trend up and down on the screen, and
the left and right movement will be applied to all displayed trends.
Table 26. Zoom the Trend (cont.)
Item Description
1.888.610.7664 sales@GlobalTestSupply.com
Fluke-Direct.com
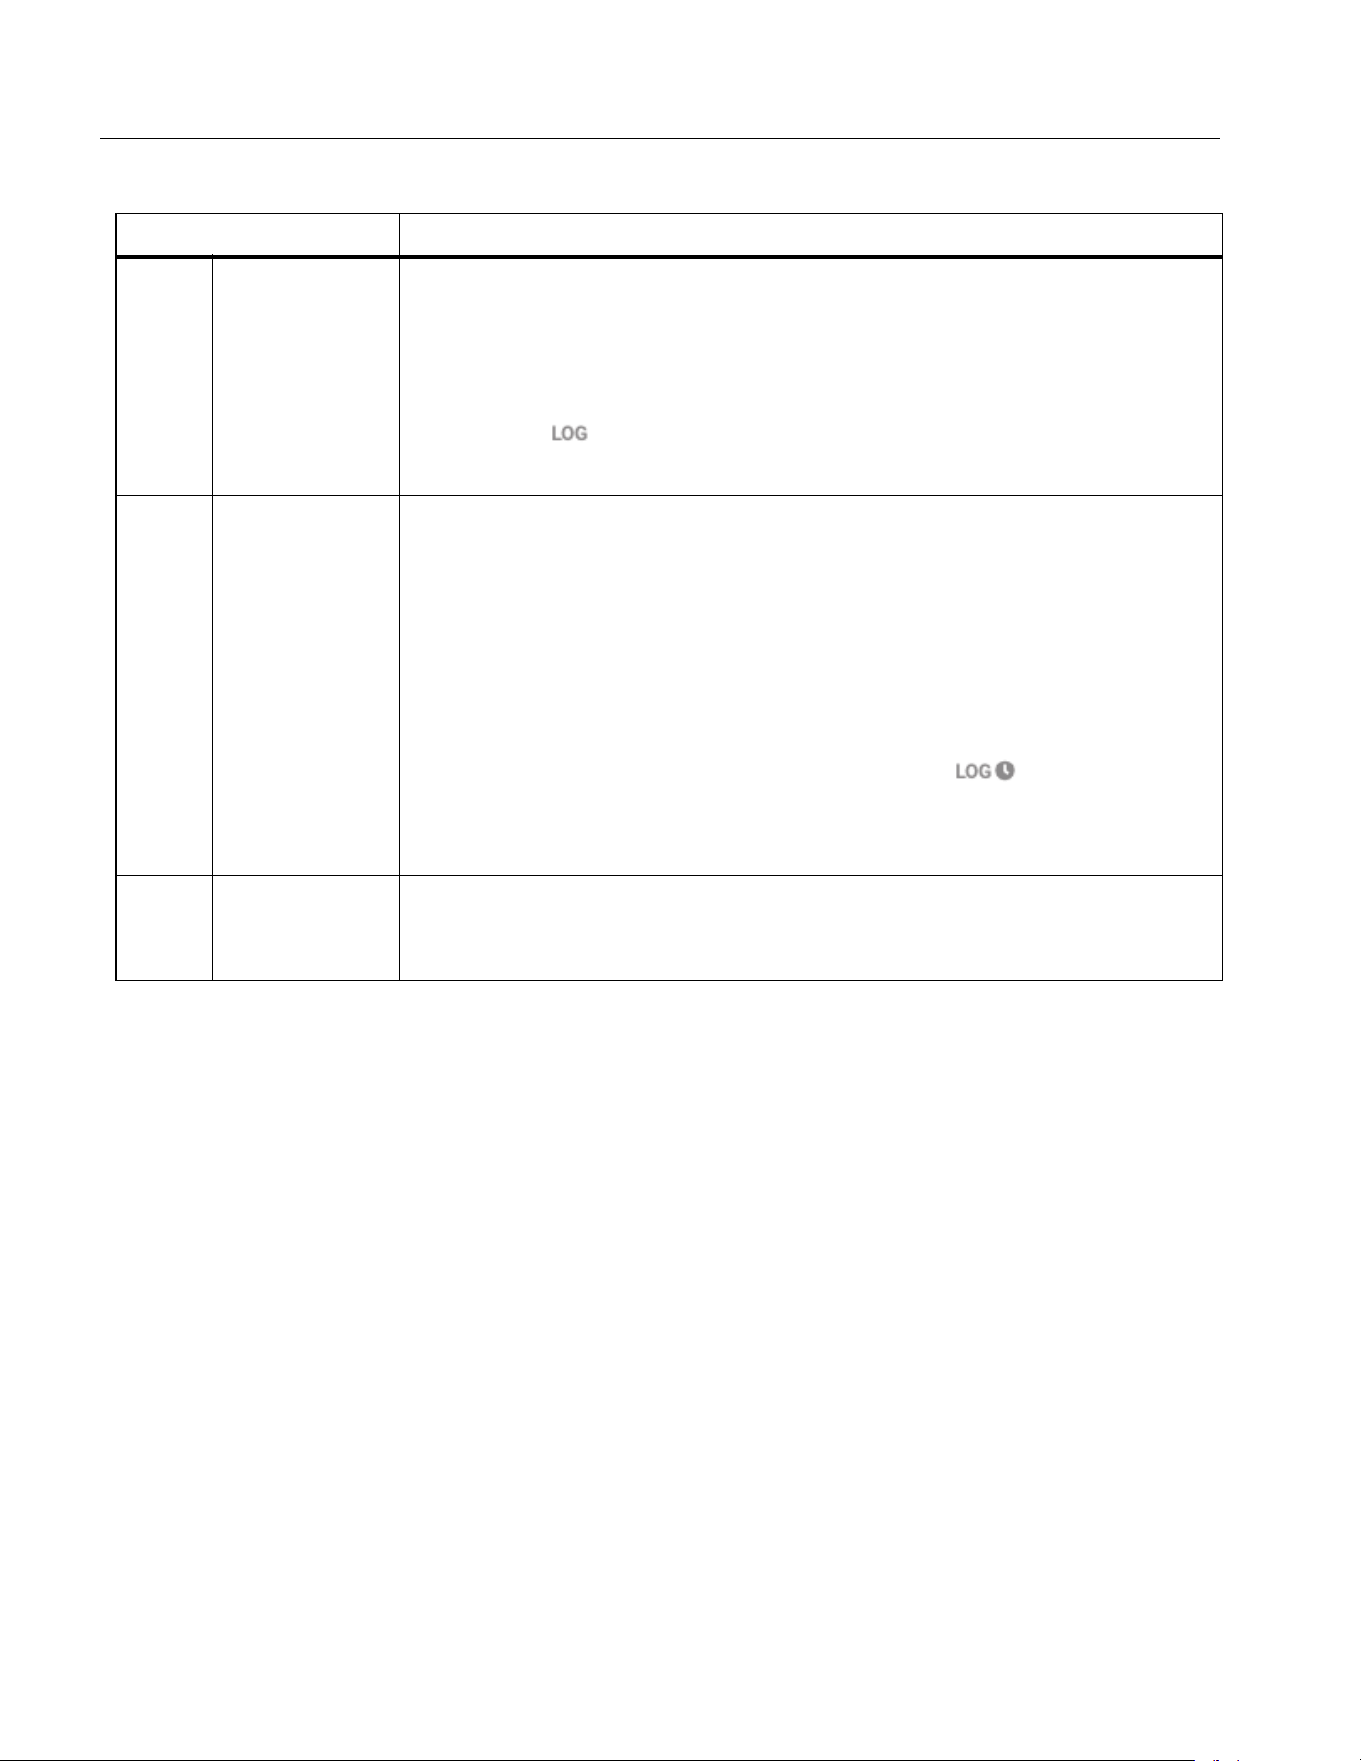
NORMA 6003/NORMA 6003+/NORMA 6004/NORMA 6004+
Users Manual
56
Auto Logger
The Analyzer provides automatic logger mode.
1. Use the up and down arrows (L K) to select the appropriate option and push S.
2. Use the left and right arrow (N M) keys to adjust the time and duration as needed.
3. Push 1 (Confirm) to start logger.
4. Push 2 (Cancel) to go back to the main screen of Logger menu.
Logger Interval
The logger interval can be set to Update Rate or specified Interval.
• When set to Update Rate, the logger interval is the update rate of the Analyzer, which can achieve
accurate equidistant acquisition, which is suitable for analyzing the process of rapid change.
• When set to specified Interval, the logger interval can be customized for long-time logging,
however not as accurate as the Update Rate.
The logger interval interface is shown in
Table 28.
Table 27. Logger
Item Description
1
Manual
Logger
Push 1 (Manual Logger) to manually start the logger. The Analyzer will
log all measurements currently shown on the screen.
Push 1 (Stop Logger) to stop logging, and the screen will prompt you
that a log file was created successfully, including the name of the log file.
The symbol appears on the title bar to indicate that Logger is in
progress.
2
Auto
Logger
Push 2 (Auto Logger) to enter Auto Logger menu, in this mode, the
logger can be stopped either manually or automatically.
• Manual stop: Only the start time is specified. After Logger starts, it
needs to be stopped manually.
• Automatic stop: The start time and duration of the Logger are specified.
When the duration time finished, the Logger will automatically stop.
If the specified start time is a future time, Logger will enter Logger waiting
status after pushing
1
(
Confirm
).
The symbol appears on the
title bar to indicate that Logger is waiting to start.
For detailed information, see
Auto Logger
3
Logger
Interval
Push 3 (Logger Interval) to enter Logger Interval menu and set the
Logging period. For detailed information, see
Logger Interval
1.888.610.7664 sales@GlobalTestSupply.com
Fluke-Direct.com

Power Analyzers
Operation
57
Update Rate is selected by default.
1. Use the up and down arrow (L K) keys to move the cursor to Interval. Push
S
, the Interval
option is selected.
2. Use the up and down arrow (L K) keys to move the cursor to H (Hour) input box.
3. Use the left and right arrow (N M) keys to adjust the Hour value.
4. Continue using the arrow keys to adjust the Minute and Second value.
5. Push 1 (Confirm) to take the adjustment into effect and back to main screen of Logger menu.
6. Push 2 (Cancel) to go back to the main screen of Logger menu without any change.
Note
During logging, the user cannot switch screens and perform other measurement functions. If
the user tries to perform other operations, the Analyzer will prompt you to stop the logger.
The logger function is available in the Meter mode only. In other modes, when you push and
hold s, the Analyzer will show a message that indicates the Logger is only available in
Meter mode.
Even in Meter mode, the logger function is not supported if the user freezes the display with
h. You must exit the Hold mode first before you can use the Logger function.
Memory
1. Push m to enter the
Memory interface.
The available file types are shown in
Table 29.
Table 28. Logger Interval
Item Description
Update rate
By update rate (default)
The logger interval is the update rate of the Analyzer.
The update rate is a kind of global configuration of the Analyzer. See
Set
Sync
Set Sync Source and Update Rate for information on update rate.
Interval
Customize acquisition interval
Acquisition interval can be customized, the minimum interval is 1
second and the maximum is 24 hours
- H: Customize the Hour value of the interval.
- M: Customize the Minute value of the interval.
- S: Customize the Second value of the interval.
1.888.610.7664 sales@GlobalTestSupply.com
Fluke-Direct.com
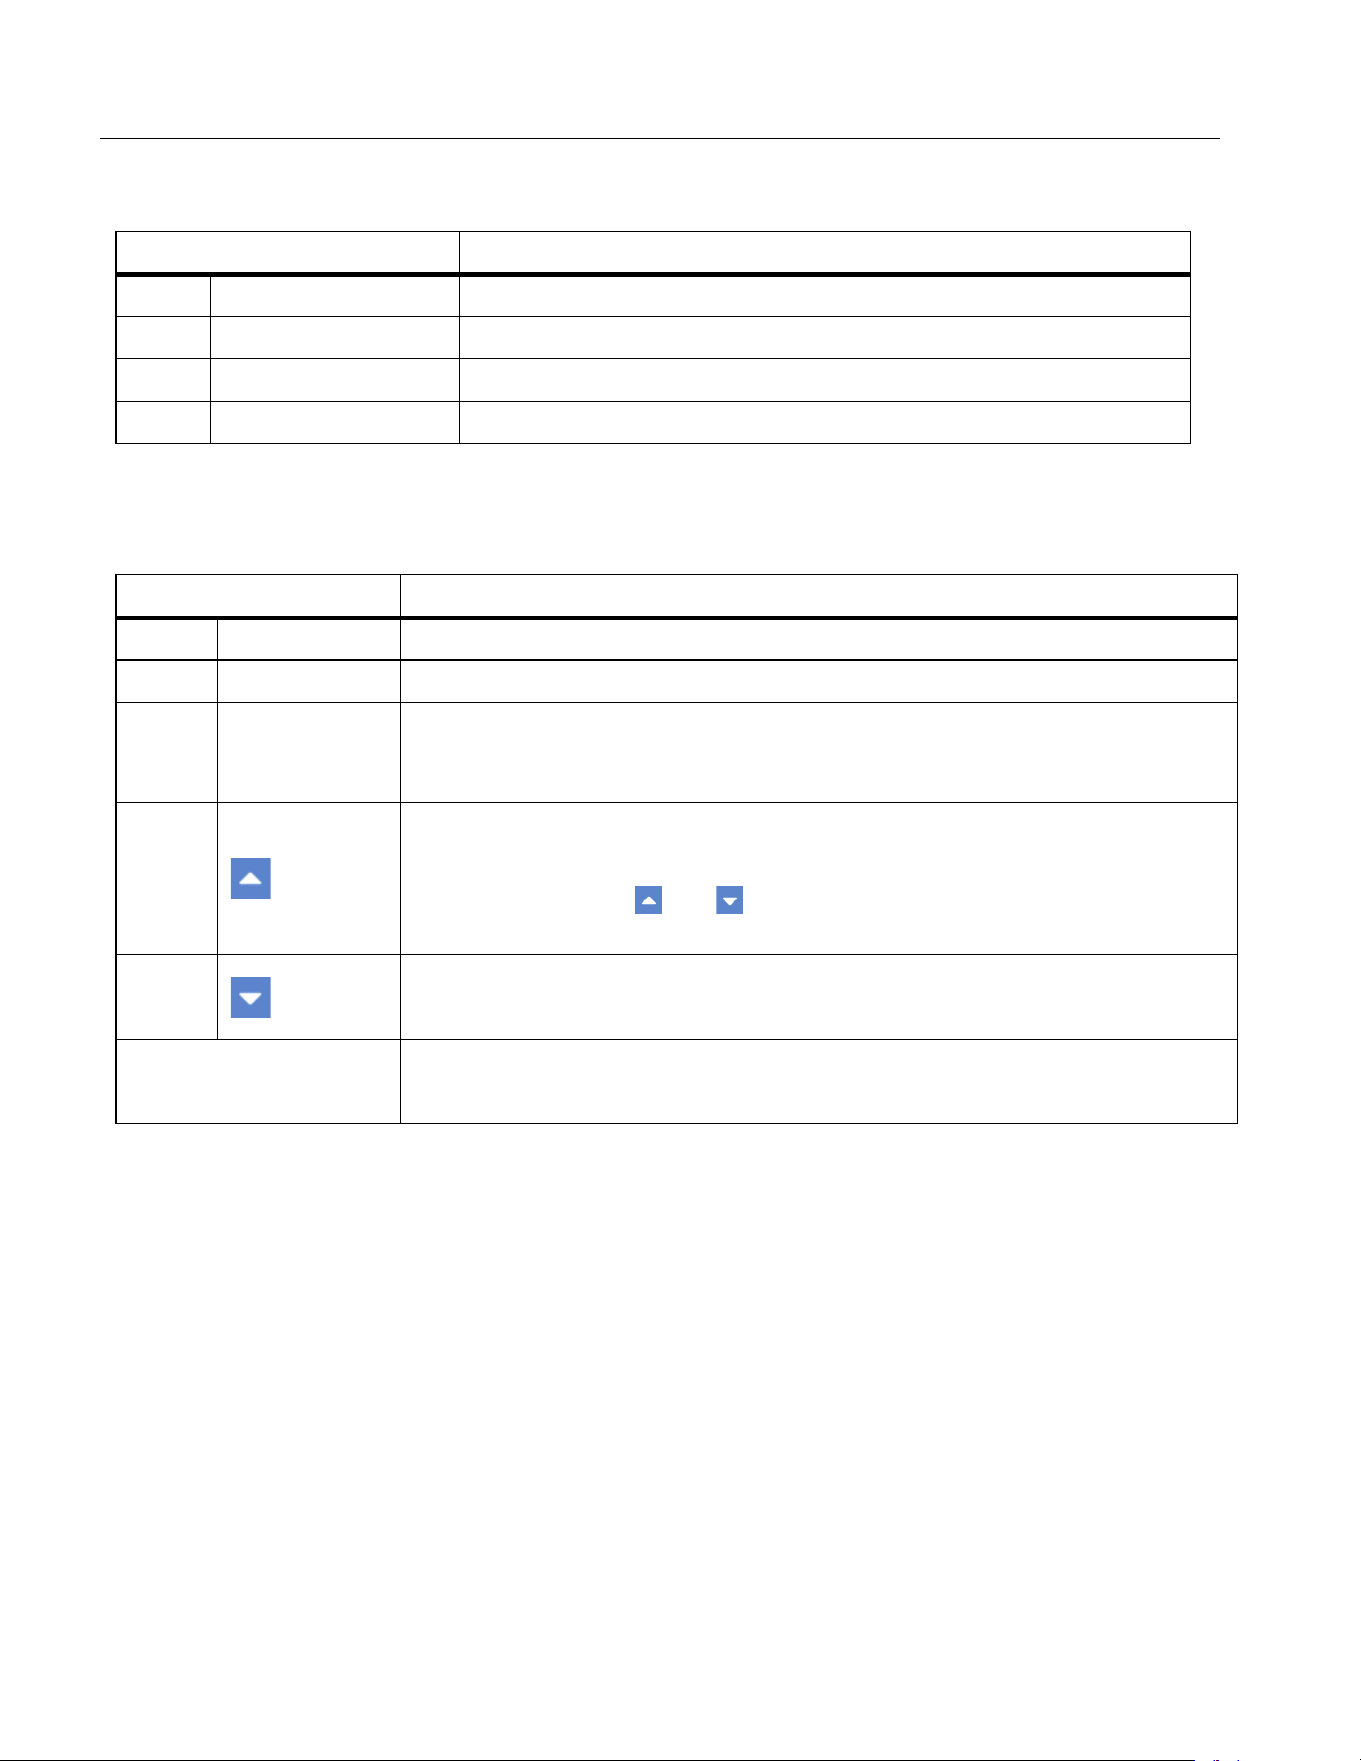
NORMA 6003/NORMA 6003+/NORMA 6004/NORMA 6004+
Users Manual
58
2. Select the type of file.
The available file actions are shown in
Table 30
3. Select the action. To delete one file, rename, or playback, select the file and then select the action.
Note
When you select “Delete”, the Analyzer deletes the selected files or deletes all files of the
current category without any prompts. The files deleted by these operations cannot be restored
locally. Please operate with caution.
Table 29. Memory Data Management
Item Description
1 Data View and manage saved data files.
2 Logger Sessions View and manage Logger items.
3 Screen Captures View and manage saved screenshot files.
4 Settings View and manage saved settings files.
Table 30. Memory File Operation
Item Description
1 Del Delete a file
2 Del All Delete all files of the current type.
3 Rename
The Analyzer uses an automatic naming method when saving files. With this
function key, the user can rename each file to a name that is easy to
remember.
4
Page up key
When the number of files available exceeds the number of items displayed
on each screen, the and keys can be used to scroll forward or
backward to display more files.
5
Page down key
Page down key for scrolling backward to display next page.
K L M N
Playback
Use the navigation arrow (K L M N) keys to playback the selected file.
1.888.610.7664 sales@GlobalTestSupply.com
Fluke-Direct.com
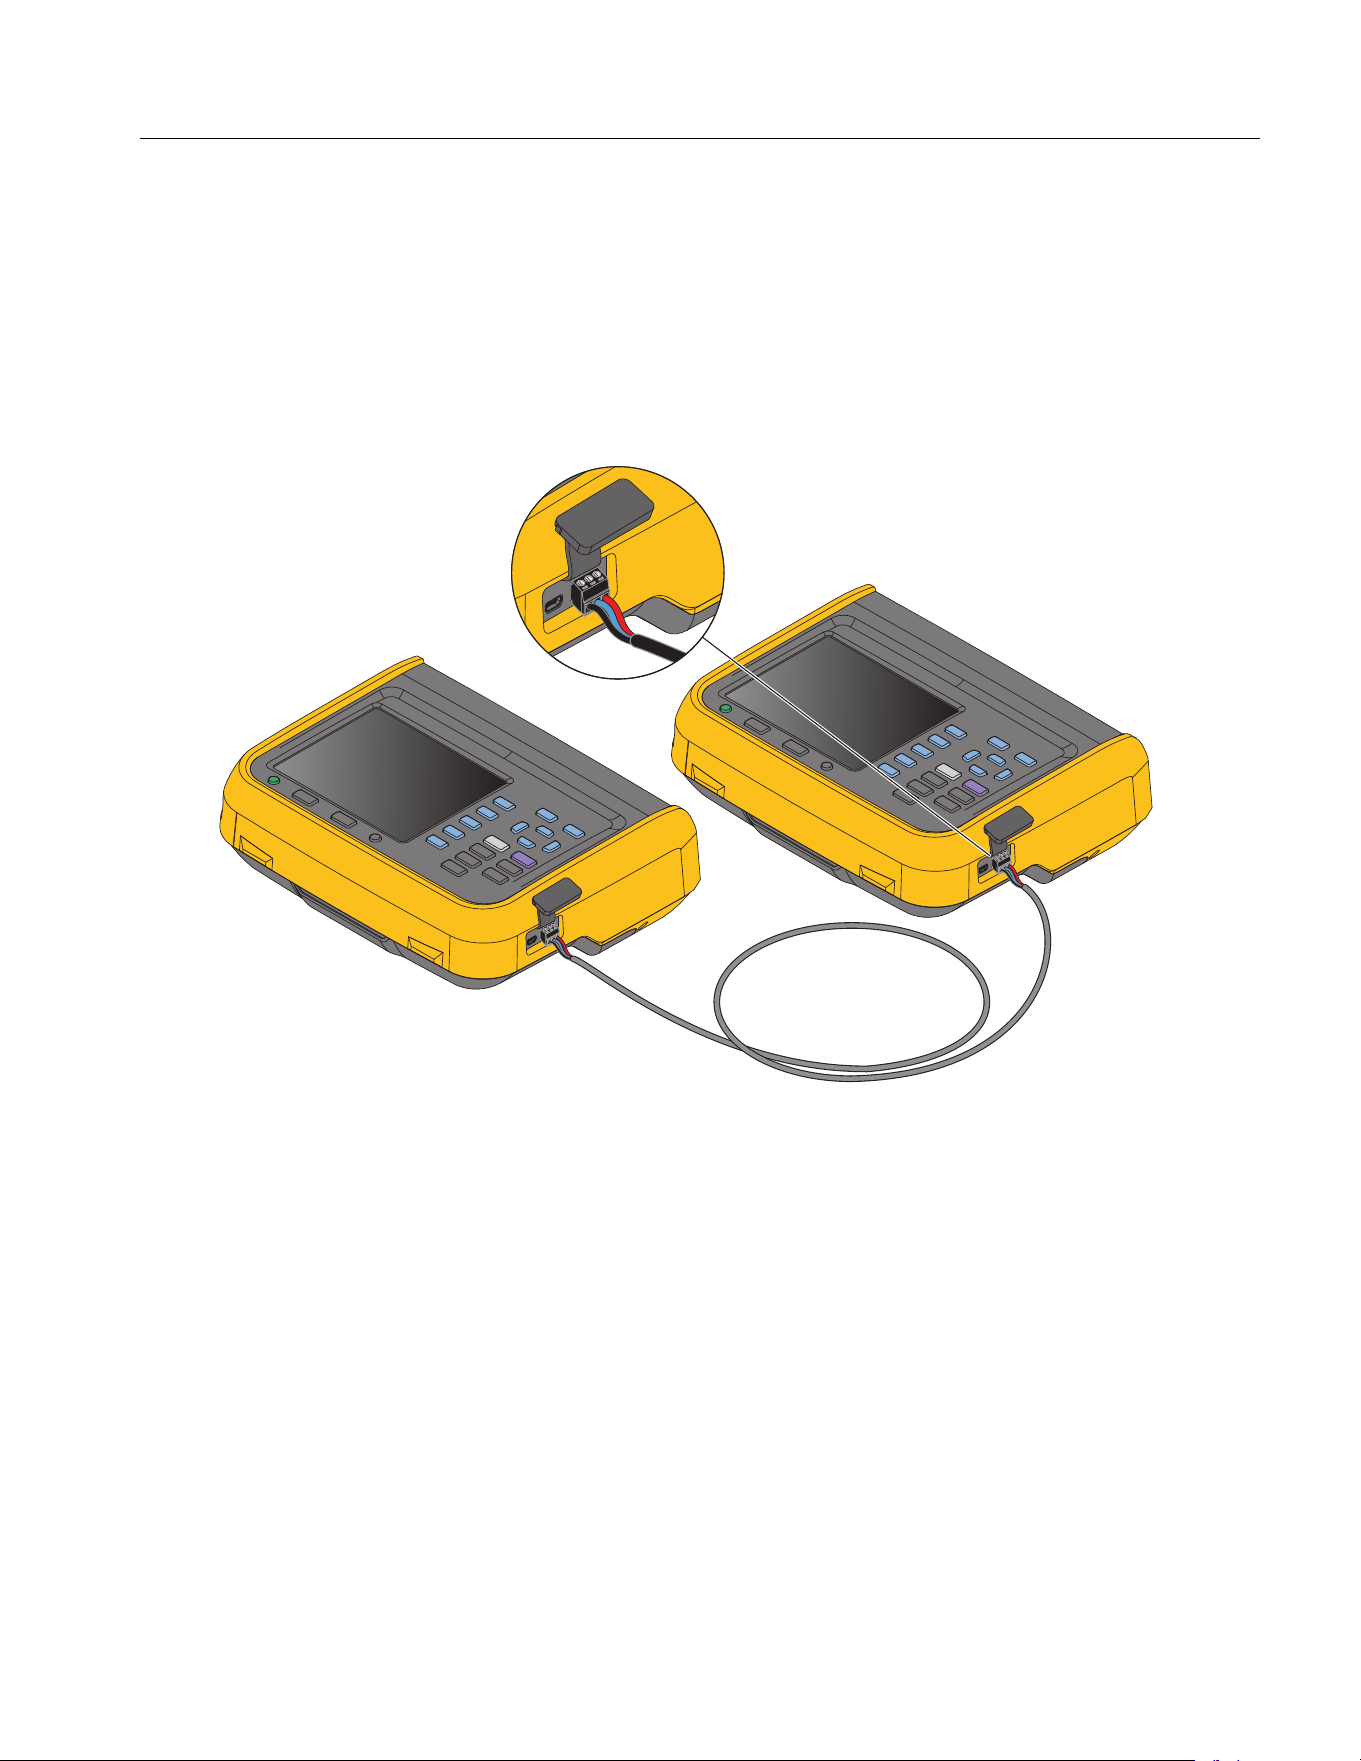
Power Analyzers
Operation
59
Dual-Unit Interconnection
The Analyzer supports Dual-Unit Interconnection, that is, 2 Analyzers work synchronously in host/slave
mode to realize 6-channel or 8-channel configuration.
2 Analyzers are connected in a point-to-point manner by using the RS-485/sync adapter provided with
the Analyzer to connect the RS-485 communication ports on the right side of the 2 Analyzers, which
are 3-pin connector sockets, as shown in the
Figure 19.
For the 2 Analyzers, one works as a host and the other works as a slave.
Figure 19. Dual-Unit Interconnection
Note
The host can only add user defined measurement items that have been added in the slave.
See
User Item View for more information on user defined measurement items.
RS-485
Red: A
Blue: B
Black: GND
1.888.610.7664 sales@GlobalTestSupply.com
Fluke-Direct.com

NORMA 6003/NORMA 6003+/NORMA 6004/NORMA 6004+
Users Manual
60
Dual-Unit Interconnection Measurement
Dual-Unit Interconnection Measurement require specific RS-485 communications parameters. These
are:
• Baud Rate = 921600,
•Parity = None,
• EOL = CRLF,
• Data Bit = 8,
• Stop bits = 1.
After the 2 Analyzers are connected through the RS-485 port, follow these steps to make
measurements:
1. Set RS-485 communication parameters of the slave.
a. From the main screen in any operating mode of the slave, select r > 2 (Comm.), and
then select the RS-485 connection method. Follow the instructions in
Set Communication
Parameters
.
b. Push J repeatedly to go back to the main screen of the Meter.
2. Set RS-485 communication parameters of the host. On the host:
a. Push r> 2 (Comm.) and then select the RS-485 connection method. Follow the
instructions in
Set Communication Parameters.
b. Push r> 3 (Remote) to enter the Remote menu.
The host’s screen prompts that the remote device is being searched, and the host will
automatically scan the connected device.
After the Analyzer as a slave is searched by the host the connected device shows in the
Available devices list, such as Address 2.
c. Push 1 (Connect) to enter the Remote menu. If the connection succeeds, the label for 2
changes to Disconnected.
d. Push J repeatedly to go back to the main screen of the System.
e. Follow the instructions in section
User Item View to enter the interface of Add Measurement
Items. Notice that 5 (Remote) is added to the category of Add measurement items.
f. Push 5 (Remote).
All user defined measurement items selected on the slave will be listed on the host’s screen.
g. Use the arrow (K L M N) keys to move the cursor to the corresponding measurement item and
push S.
The corresponding measurement items show in the list of user defined measurement items on
the host (the measurement item name has the suffix "*").
3. To exit Dual-Unit interconnection mode:
On the host, push r > 3 (Remote) > 2 (
Disconnect).
Or
On the slave, push 1 (Local).
1.888.610.7664 sales@GlobalTestSupply.com
Fluke-Direct.com
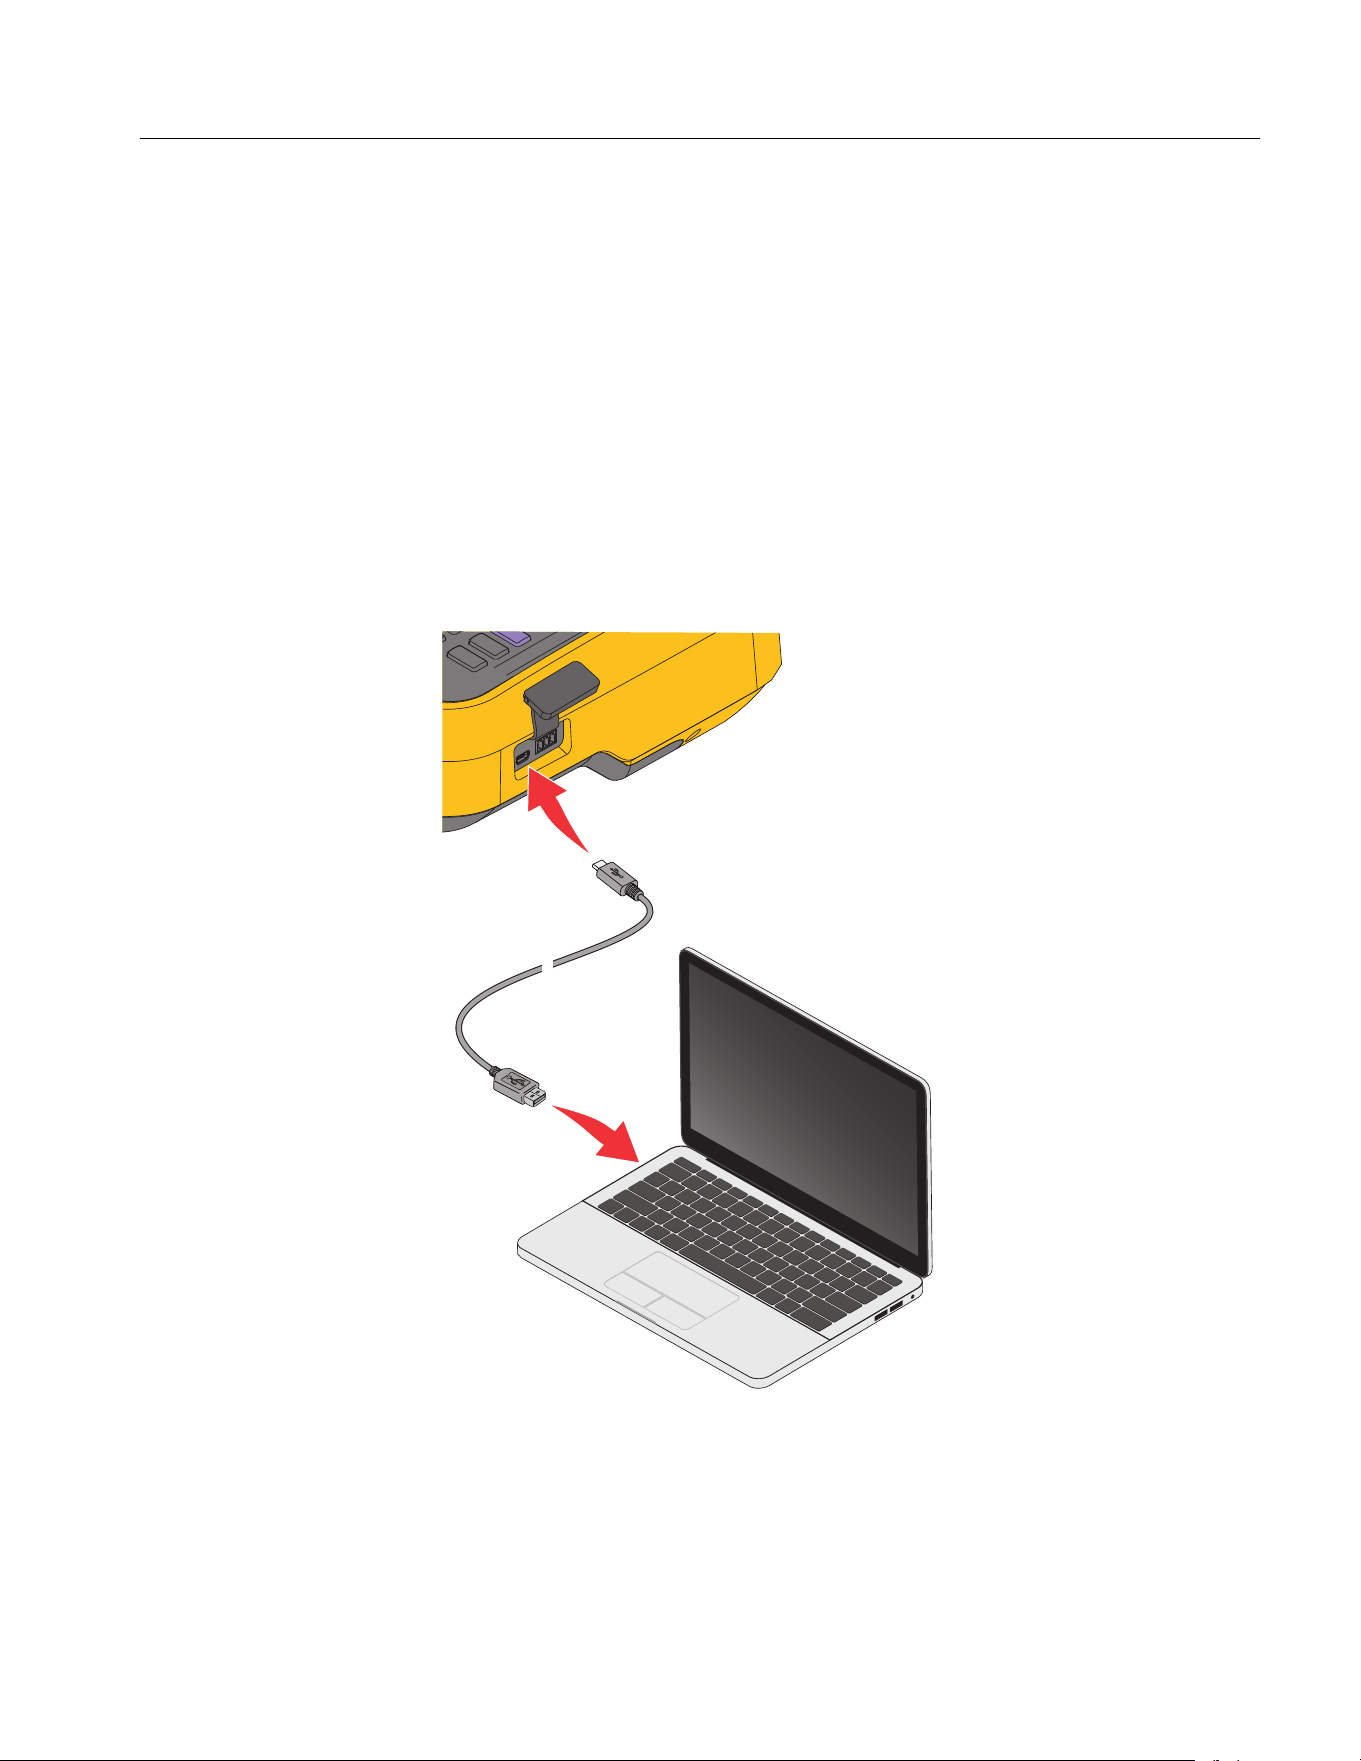
Power Analyzers
Operation
61
Note
If the measurement item is not listed in the Remote interface on the host, exit the Dual-Unit
interconnection mode and add the measurement items on the slave. See
User Item View for
details.
Note
Under the Dual-Unit interconnection mode, the slave will be locked for remote operation and
the buttons on the control panel will be locked (except for (1 (Local)) and no other
operations can be performed.
Connect the Computer
The Fluke Power Analyzer software is a software that communicates between the Analyzer and PCs
through RS-485 or mini-USB interfaces. With this software, data can be controlled and summarized
simply and quickly on the PC.
Figure 20. Connect the Computer
With the Fluke Power Analyze software:
• The PC screen shows the measurements, waveforms, phasors, harmonics and trends from the
Analyzer Select from all measurements such as voltage, current, power and harmonics.
• Instrument settings: settings of the connected Analyzer can be changed in the PC software.
1.888.610.7664 sales@GlobalTestSupply.com
Fluke-Direct.com
NORMA 6003/NORMA 6003+/NORMA 6004/NORMA 6004+
Users Manual
62
• Files in the Analyzer memory can be downloaded to a PC and analyzed.
• Operating system required: Windows 10 / Windows 8 / Windows 7 (32bit/64bit).
For more information about using the Analyzer with the PC software, refer to the instructions for using
the PC software.
System Settings
The System Settings function provides the system level setup options, including general settings,
communication parameter settings, local/remote control, as well as the test of the Analyzer itself.
Enter the System Settings Function:
• From the main screen in any operating mode push r.
All information listed in the work area of the System screen is reference information and cannot be
changed. This information is useful for troubleshooting and maintenance.
Note
Table 31. System Information
Item Description
Description Product name, such as Power Analyzer.
Model Name Product model, for example Norma 6004+
Serial No.
The unique serial number of the product, which may be requested when
Calibration Date
Last calibration date of the Product. See Calibration for information on
calibration.
Firmware Version The version number of the internal firmware of the Product.
DSP Version
The version numbers of the Digital Signal Processing (DSP) device in the
Product.
FPGA Version The version number of the FPGA in the Product.
Soft Keys
1 (Settings): Sets general options for the Analyzer, see
General
Settings
.
2 (Comm.): Sets the serial communication parameters of the Analyzer,
see Set Communication Parameters.
3 (Remote): Connects remote analyzer, see Remote.
4(Maint.): Diagnoses and tests the LCD and buttons/keys of the
Analyzer, see Instrument Maintenance.
1.888.610.7664 sales@GlobalTestSupply.com
Fluke-Direct.com

Power Analyzers
System Settings
63
General Settings
The Settings screen contains some general instrument settings such as interface language, time and
date, date format, log storage settings, as well as firmware upgrades and factory resets.
Enter the Settings screen:
• From the Main screen in any operating mode select r > 1 (Settings).
The options listed on the Settings screen include:
• Language
•Time date
• Date format
• Auto-off
• Firmware upgrade
• Factory default
•Memory
See Firmware Upgrade for the operation of firmware upgrade.
Language
Users can select the language supported by this unit.
Change UI Language:
1. In the Settings screen, use the up and down arrow (K L) keys to move the cursor to the
Language option (the drop-down menu is highlighted in yellow).
2. Push S and use the up and down arrow (K L) keys to select the corresponding option. Then
push S again to confirm the option.
3. Push J repeatedly to go back to the main screen of the Settings.
Set Time and Date
In the Settings screen:
1. Use the up and down arrow (K L) keys to move the cursor to the Date Time option (the drop-
down menu is highlighted in yellow).
2. In the Time Date dialog box, use the left and right arrow (M N) keys to select the year, month, day,
hour and minute, and use the up and down arrow (K L) keys to adjust the value.
3. Push J repeatedly to go back to the main screen of the Settings.
Auto-Off
If set to ON, the power turns off automatically after 30 minutes without operation, communication,
integral, or logging.
Default is OFF.
1.888.610.7664 sales@GlobalTestSupply.com
Fluke-Direct.com
NORMA 6003/NORMA 6003+/NORMA 6004/NORMA 6004+
Users Manual
64
Memory
The user can select the operation mode of the Analyzer when the memory is full, which can be set to
stop the logging by the system, to manually clear log files saved in the Product by the user, or to
automatically overwrite the old files by the system.
1. In the Settings screen, use the up and down arrow (K L) keys to move the cursor to the Logger
Memory option (the drop-down menu is highlighted in yellow).
2. Push S and use the up and down arrow (K L) keys to select the corresponding option. Then
push S again to confirm the option.
3. Push J repeatedly to go back to the main screen of the Settings.
Set Communication Parameters
The Analyzer supports communication via USB virtual serial port and RS-485. Host/slave
communication is realized by RS-485 communication in the dual-unit interconnection mode. For
details, see
Dual-Unit Interconnection.
In order to ensure normal communication, the communication port of the Product needs to be set up
correctly.
Enter the Comm. Setup Interface:
• From the Main screen in any operating mode select r > 2 (Comm.).
The "Comm." settings screen is shown, the items that can be set for USB virtual serial port and
RS-485 port are as shown in
Table 30.
Table 32. Communication Parameters
Item Option
Connect
USB (virtual serial) port
RS-485
Parity
O: Odd parity
E: Even parity
N: No parity
Baud Rate
9600
19200
38400
57600
112500
230400
460800
576000
921600
1.888.610.7664 sales@GlobalTestSupply.com
Fluke-Direct.com
Power Analyzers
System Settings
65
Note
To ensure proper communication between the host/slave Analyzer, you must configure both
Analyzers correctly. Please refer to
Dual-Unit Interconnection.
Remote
The Analyzer supports Dual-Unit interconnection. This menu allows 2 Analyzers to be configured in
host/slave mode for 6 or 8 channels configurations. See
Dual-Unit Interconnection for details.
Instrument Maintenance
The Analyzer provides a self-diagnosis function that allows the user to test the button/key and display
screen of the Product.
Enter Diagnosis:
• From the Main screen in any operating mode select r > 4(Maint.)
EOL
CR
LF
CRLF
Data Bits
7 Bits
8 Bits
Stop Bits
1 Bits
1.5 Bits
2 Bits
Device address 1 to 9
Table 33. Diagnostics
Item Description
1 LCD Test
Push K, the screen will show alternately full-screen of solid colors of blue,
black, white, red and green.
Push J to go back to the test menu.
2 Keys Test
Test if each key is valid. All the keys on the control panel are shown on the
screen. The original function of all the keys on the control panel will be
disabled.
Each time a physical key on the control panel is pushed, the corresponding
key on the screen changes from white to yellow.
Pushing J will not take you back to the main menu. The screen will
automatically go back to the Maint. menu only after all physical
buttons/keys on the control panel have been tested.
Table 32. Communication Parameters (cont.)
Item Option
1.888.610.7664 sales@GlobalTestSupply.com
Fluke-Direct.com

NORMA 6003/NORMA 6003+/NORMA 6004/NORMA 6004+
Users Manual
66
Calibration
Maintenance
The only required maintenance is to replace the battery regularly and to replace the fuse, if necessary.
Cleaning
Clean the case with a damp cloth and a weak soap solution. Do not use abrasives, isopropyl alcohol, or
solvents to clean the case.
Warning
Before cleaning the Analyzer, please be sure to unplug the power adapter/charger from
the power jack and disconnect all test leads.
Change the Battery
The battery is charged in the Analyzer, the battery can be changed if a freshly charged battery is
required for extended battery power operation or the battery is no longer keeping charge. Charge the
Analyzer every three months if the Analyzer is not in use.
Warning
To prevent electric shock, remove all probes, test leads and accessories before the
battery compartment cover is opened.
Do not use any battery which is not designed or recommended by Fluke for use with
the Product.
Caution
Do not incinerate the product and/or the battery.
1.888.610.7664 sales@GlobalTestSupply.com
Fluke-Direct.com
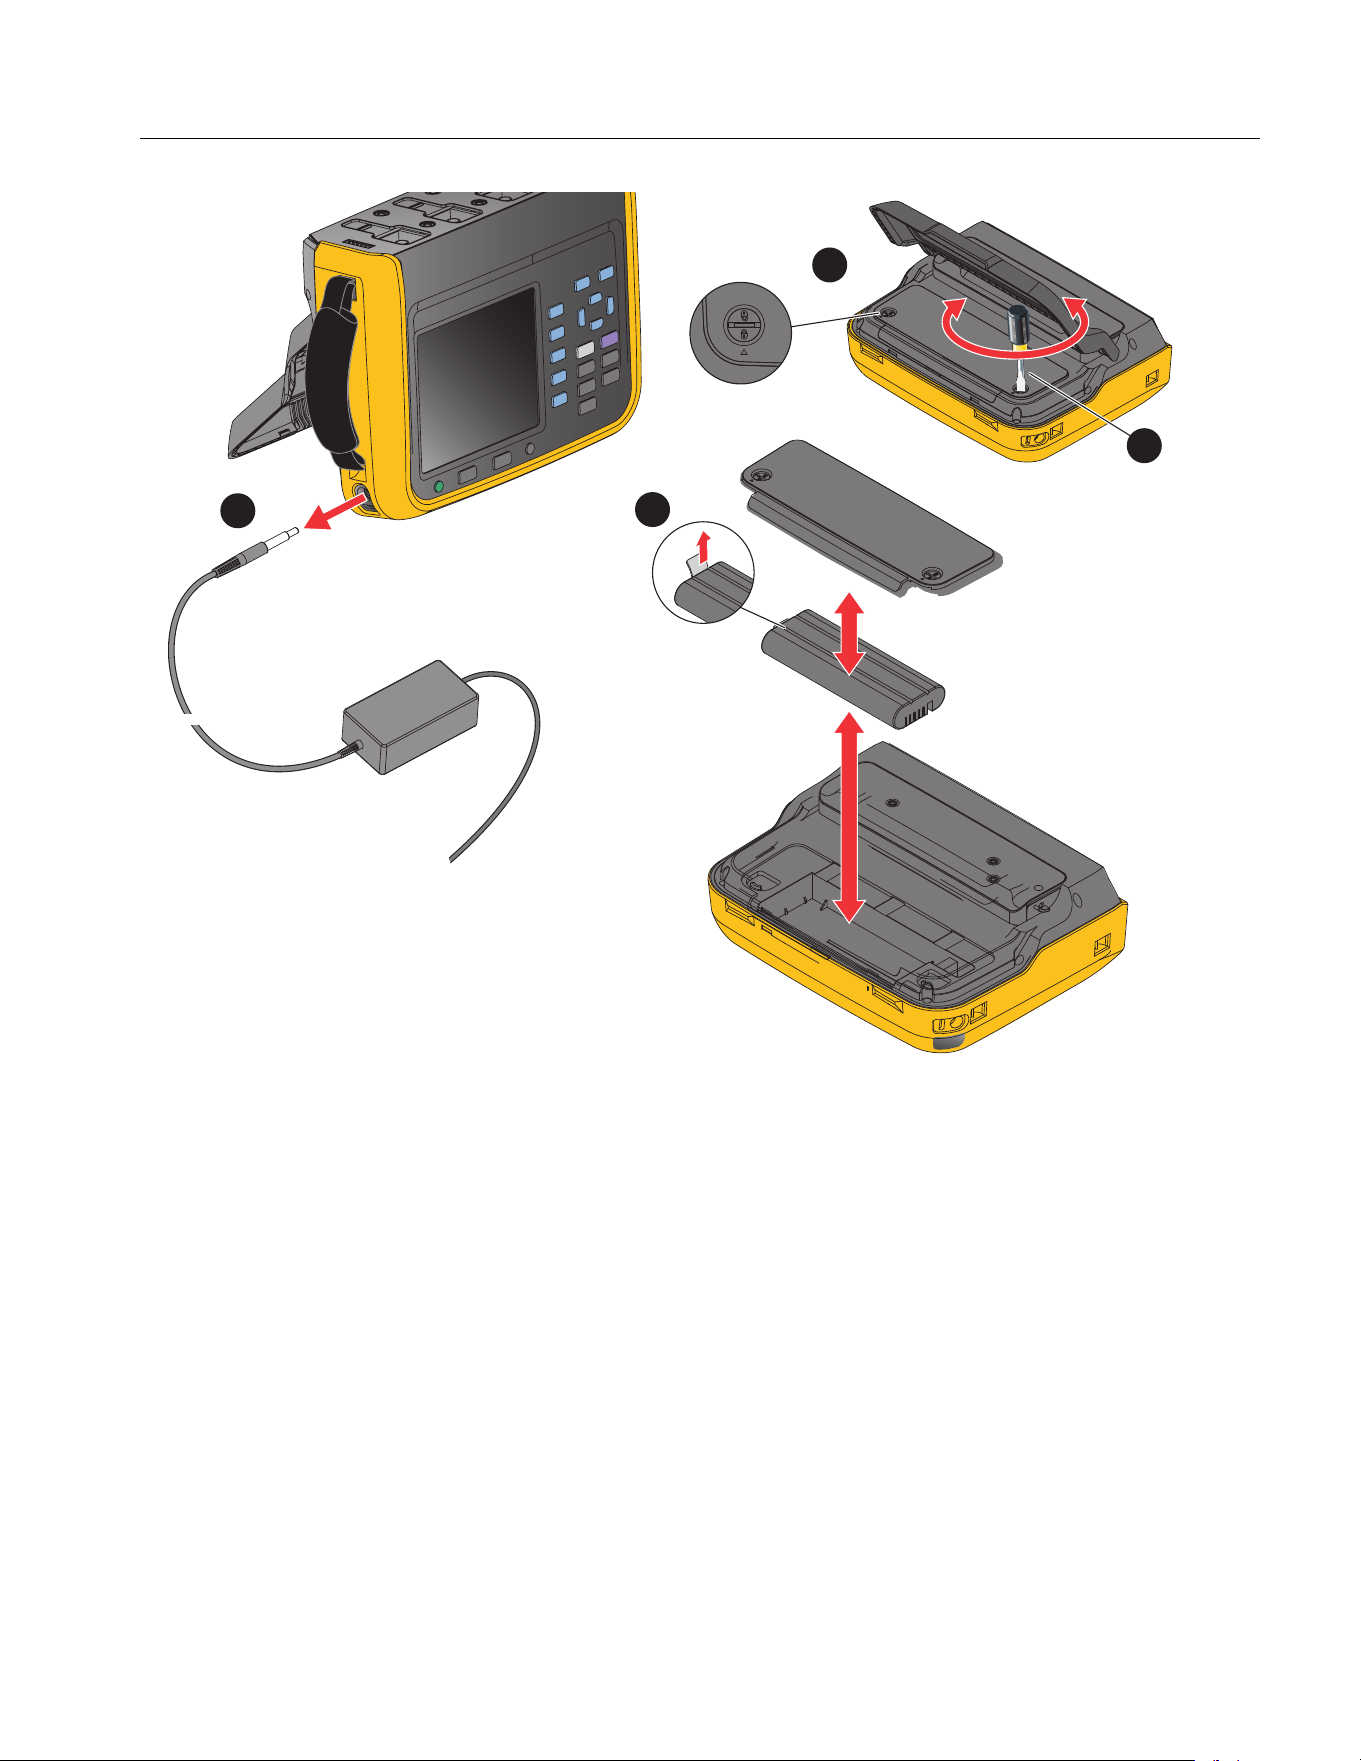
Power Analyzers
Maintenance
67
Figure 21. Change the Battery
To Change the Battery:
1. Turn off the Product, unplug the power adapter/charger from the power jack, and disconnect all test
leads.
2. Place the Product's operating panel face down on a flat table and lift the stand or remove it from the
Product.
3. Use a slotted screwdriver to rotate the 2 snap bolts on the battery compartment cover by 180° so
that the arrow on the cover points toward the unlock mark and then remove the battery
compartment cover.
4. Use the drawstring on one end of the battery to lift one side of the battery and then remove the
battery completely.
5. Install new batteries and reinstall and fix the battery compartment cover and stand in the reverse
order of the above.
1
2
4
3
2x
1.888.610.7664 sales@GlobalTestSupply.com
Fluke-Direct.com
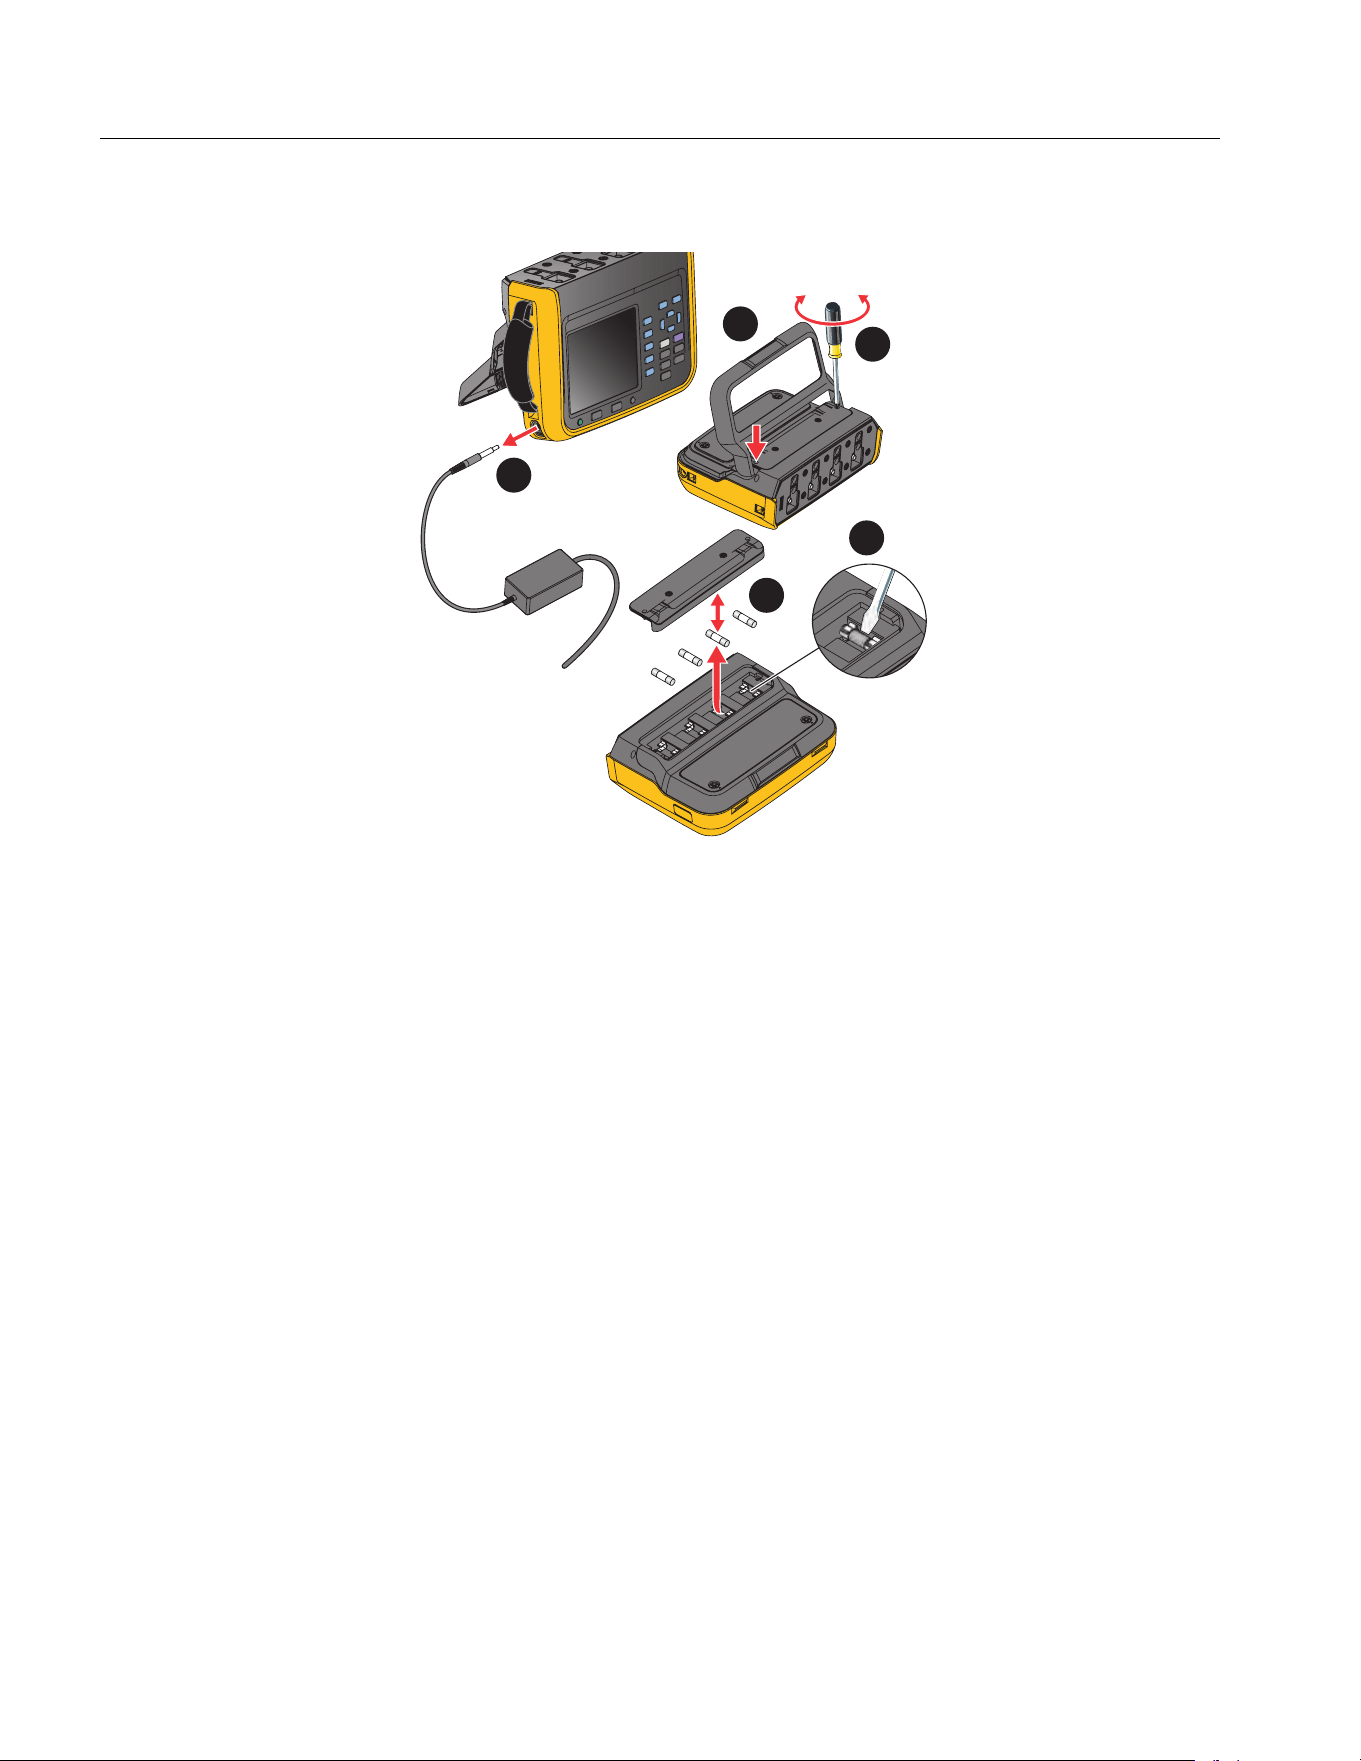
NORMA 6003/NORMA 6003+/NORMA 6004/NORMA 6004+
Users Manual
68
Change the Fuse
See Figure 22.
Figure 22. Fuse Replacement
Caution
To change the fuse:
1. Turn off the Product, unplug the power adapter/charger from the power jack, and disconnect all test
leads.
2. Place the operating panel face down on a flat surface and fold the tilt stand or remove it from the
Product.
3. Use a Phillips screwdriver to remove the 2 screws from the fuse compartment cover and remove
the cover.
4. Insert a flat screwdriver into the gap to the right of the fuse holder and gently pry it until it is possible
to hold the fuse by one hand and take it out.
5. Install new fuses and reinstall and fix the fuse cover and stand in the reverse order of the above.
6. Check the circuit before reconnecting to ensure the current does not blow the fuse again.
1
2
3
4
2x
5
4x
1.888.610.7664 sales@GlobalTestSupply.com
Fluke-Direct.com
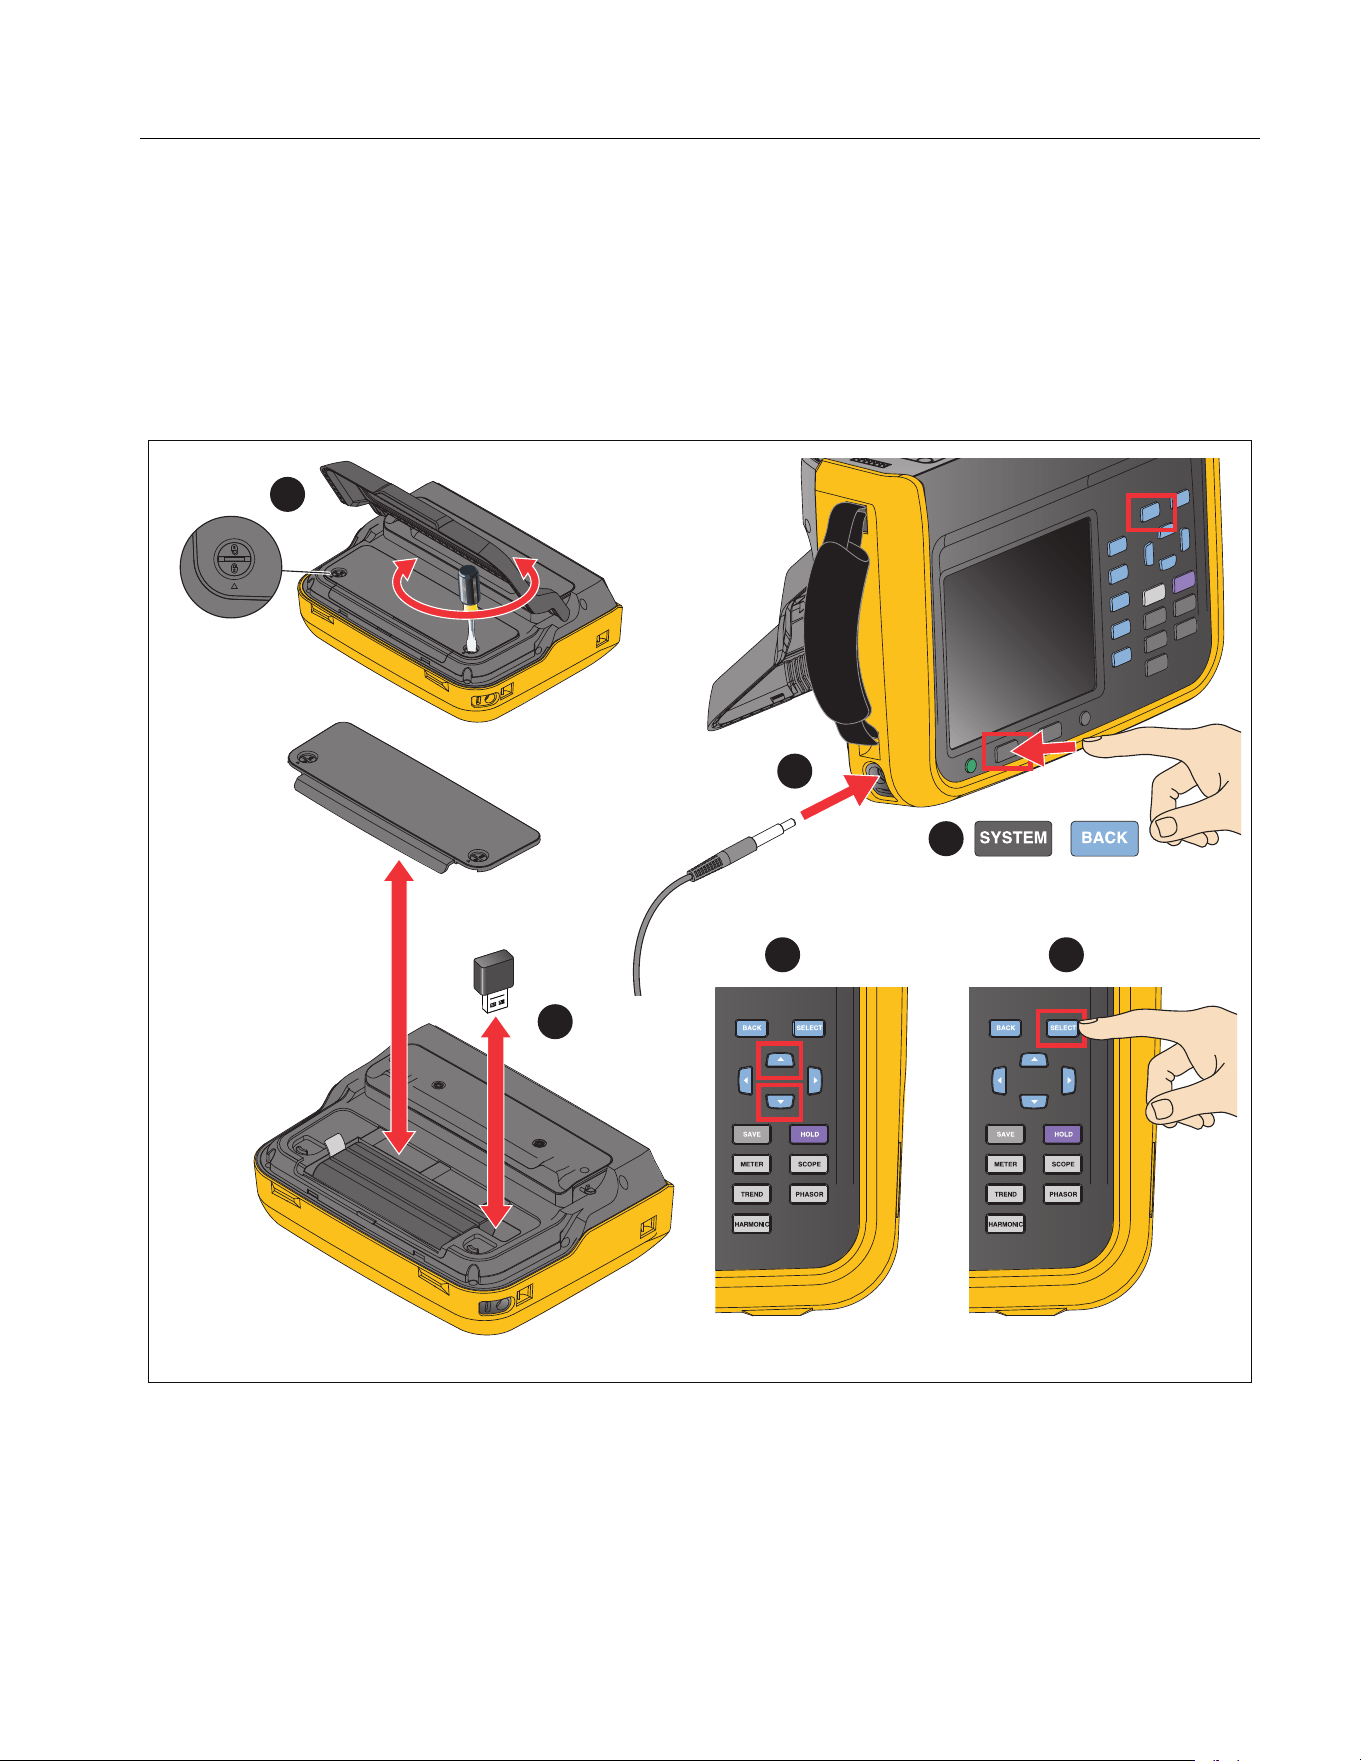
Power Analyzers
Maintenance
69
Firmware Upgrade
The firmware upgrade of the Product is convenient and can be completed by using the USB memory
containing the new firmware.
Please refer to
Figure 23.
Figure 23. Firmware Upgrade
1. Open the cover of the battery compartment as specified in the section
Change the Battery.
2. Plug the USB memory containing the new firmware into the USB port on the upper-right side of the
battery compartment.
3
4
5 6
1
2
1.888.610.7664 sales@GlobalTestSupply.com
Fluke-Direct.com

NORMA 6003/NORMA 6003+/NORMA 6004/NORMA 6004+
Users Manual
70
3. During the upgrade, make sure that the battery is in good contact and can power the unit normally,
and the USB connection is reliable.
4. After the instrument is powered on, select r > 1 (Settings).
5. Use the up and down arrow (K L) keys to move the cursor to Firmware Upgrade (the drop-down
menu is highlighted in yellow).
6. Push S.
Note
If the USB memory is not inserted, the Product will prompt to insert the USB. Follow the steps
above to insert the USB memory. Or check if the USB memory is connected securely.
The upgrade will take a few minutes. Wait for the upgrade to complete. The Analyzer automatically
restarts after the upgrade.
Note
To ensure the success of the upgrade, the battery must be installed during the firmware
upgrade and the battery level must be at least 50 %. The power adapter must be connected.
Specifications
General Specifications
Size (HxWxL).............................................. 298 mm x 215 mm x 96 mm
Weight......................................................... 3.5 kg
Display ....................................................... 5.7" TFT LCD, 640x480 pixels
Maximum voltage between any Terminal
and Earth Ground… ...........................................1000 V
Temperature
Operating Temperature ...................................0 °C to 40 °C (with power adapter)
-10 °C to + 50 °C (battery only)
Storage Temperature.......................................-30 °C to 60 °C (Without battery)
-20 °C to 60 °C (With battery)
Operating Humidity.............................................Non-condensing (<10 °C)
≤90 % RH (10 °C to 30 °C)
≤75 % RH (30 °C to 40 °C)
≤45 % RH (40 °C to 50 °C)
Altitude
Operating .........................................................2000 m
Storage ............................................................12 000 m
Ingress Protection...............................................IEC 60529: IP50 (terminals mated)
Battery
Type....................................................................Li-ion, BP 291, 10.8V/5000 mAh, 54 Wh IEC 62133, UN 38.3
Battery life...........................................................10 hours (Typical)
Safety
General...............................................................IEC 61010-1: Pollution Degree 2
1.888.610.7664 sales@GlobalTestSupply.com
Fluke-Direct.com

Power Analyzers
Specifications
71
Measurement ..................................................... IEC 61010-2-030: CAT IV 600/CAT III 1000 V
Electromagnetic Compatibility (EMC)
International........................................................IEC 61326-1: Industrial Electromagnetic Environment;
IEC 61326-2-2,CISPR 11: Group 1, Class A
Group 1: Equipment has intentionally generated and/or uses conductively-coupled radio frequency energy that is
necessary for the internal function of the equipment itself.
Class A: Equipment is suitable for use in all establishments other than domestic and those directly connected to a
low-voltage power supply network that supplies buildings used for domestic purposes. There may be potential
difficulties in ensuring electromagnetic compatibility in other environments due to conducted and radiated
disturbances.
Caution: This equipment is not intended for use in residential environments and may not provide adequate
protection to radio reception in such environments.
Emissions that exceed the levels required by CISPR 11 can occur when the equipment is connected to a test
object.
Korea (KCC)....................................................... Class A Equipment
(Industrial Broadcasting & Communication Equipment)
Class A: Equipment meets requirements for industrial electromagnetic wave equipment and the seller or user
should take notice of it. This equipment is intended for use in business environments and not to be used in homes.
USA (FCC) ......................................................... 47 CFR 15 subpart B.
This product is considered an exempt device per clause 15.103.
Electrical Specifications
Modules
NORMA 6003 .................................................. 3 Voltage + 3 Current
NORMA6003+ ................................................3 Voltage + 3 Current + 1 Motor
NORMA 6004 ................................................. 4 Voltage + 4 Current
NORMA 6004+ ............................................... 4 Voltage + 4 Current + 1 Motor
Sample Rate ......................................................200 kHz
Data Update Rate .............................................. 100 ms, 200 ms, 500 ms, 1 s
Voltage
Range ................................................................ 10 V, 100 V, 1000 V
Crest Factor ....................................................... CF ≤2
Overload Capacity.............................................. 10 % overload
Input Impedance ................................................2 MΩ / 10 pF (Typical)
Temperature Coefficient .................................... 0.05 x (Spec)/K @ <18°C or >28°C
Bandwidth .......................................................... 1000 V range: 500 kHz
100 V range: 200 kHz
10 V range: 100 kHz
Accuracy
Accuracy (% reading + % range)
Range DC
AC
10 Hz to 1 kHz 10 kHz
1000 V 0.1 + 0.1 0.1 + 0.1 5 + 0.5
100 V 0.1 + 0.1 0.1 + 0.1 5 + 0.5
10 V 0.1+0.2 0.1 + 0.2 5 + 0.5
1.888.610.7664 sales@GlobalTestSupply.com
Fluke-Direct.com
NORMA 6003/NORMA 6003+/NORMA 6004/NORMA 6004+
Users Manual
72
Current
Shunt
Range ..............................................................0.1 A, 1 A, 10 A
Crest Factor ....................................................CF ≤2
Overload Capacity ...........................................10 % overload
Input Impedance .............................................0.025 Ω (Typical)
Temperature Coefficient .................................0.05 x (Spec)/K
Bandwidth .......................................................10 A range: 500 kHz
1A range: 200 kHz
0.1A range: 100 kHz
BNC
Range .............................................................0.1 V, 1 V, 10 V
Crest Factor ....................................................CF ≤2
Overload Capacity ...........................................10 % overload
Input Impedance .............................................100 kΩ / 100 pF
Temperature Coefficient .................................0.05 x (Spec)/K
Bandwidth .......................................................10 V range: 500 kHz
1 V range: 200 kHz
0.1 V range: 100 kHz
Accuracy
Accuracy (% reading + % range)
Motor (NORMA 6003+
、
NORMA 6004+)
Voltage Range....................................................±10 V dc, 10 % overload
Voltage Channels ..............................................2
Input Impedance.................................................1.1 MΩ (Typical)
Temperature Coefficient ....................................0.05 x (Spec)/K
Accuracy @ DC .................................................0.1 % reading + 0.1 % range
Pulse Channels ..................................................3
Pulse logic high threshold ..................................2 V (Typical)
Pulse logic low threshold ...................................0.8 V (Typical)
Maximum pulse frequency .................................100 kHz
Range DC
AC
10 Hz to 1 kHz 10 kHz
Shunt
10 A 0.1 + 0.2 0.1 + 0.1 5 + 1
1 A 0.1 + 0.5 0.1 + 0.2 5 + 1
0.1 A 0.1+2 0.1 + 1 5 + 1
BNC
10 V 0.1 + 0.1 0.1 + 0.1 5 + 1
1 V 0.1 + 0.2 0.1 + 0.1 5 + 1
0.1 V 0.1 + 1 0.1 + 0.5 5 + 1
1.888.610.7664 sales@GlobalTestSupply.com
Fluke-Direct.com

Power Analyzers
Specifications
73
Frequency Domain Measurement
Frequency Accuracy...........................................0.05 % range + 0.05 % reading
(3 ranges: 1 Hz to 10 Hz, 10 Hz to 400 Hz, 400 Hz to 100 kHz)
Harmonics .......................................................... 100 order, up to 6 kHz
1.888.610.7664 sales@GlobalTestSupply.com
Fluke-Direct.com
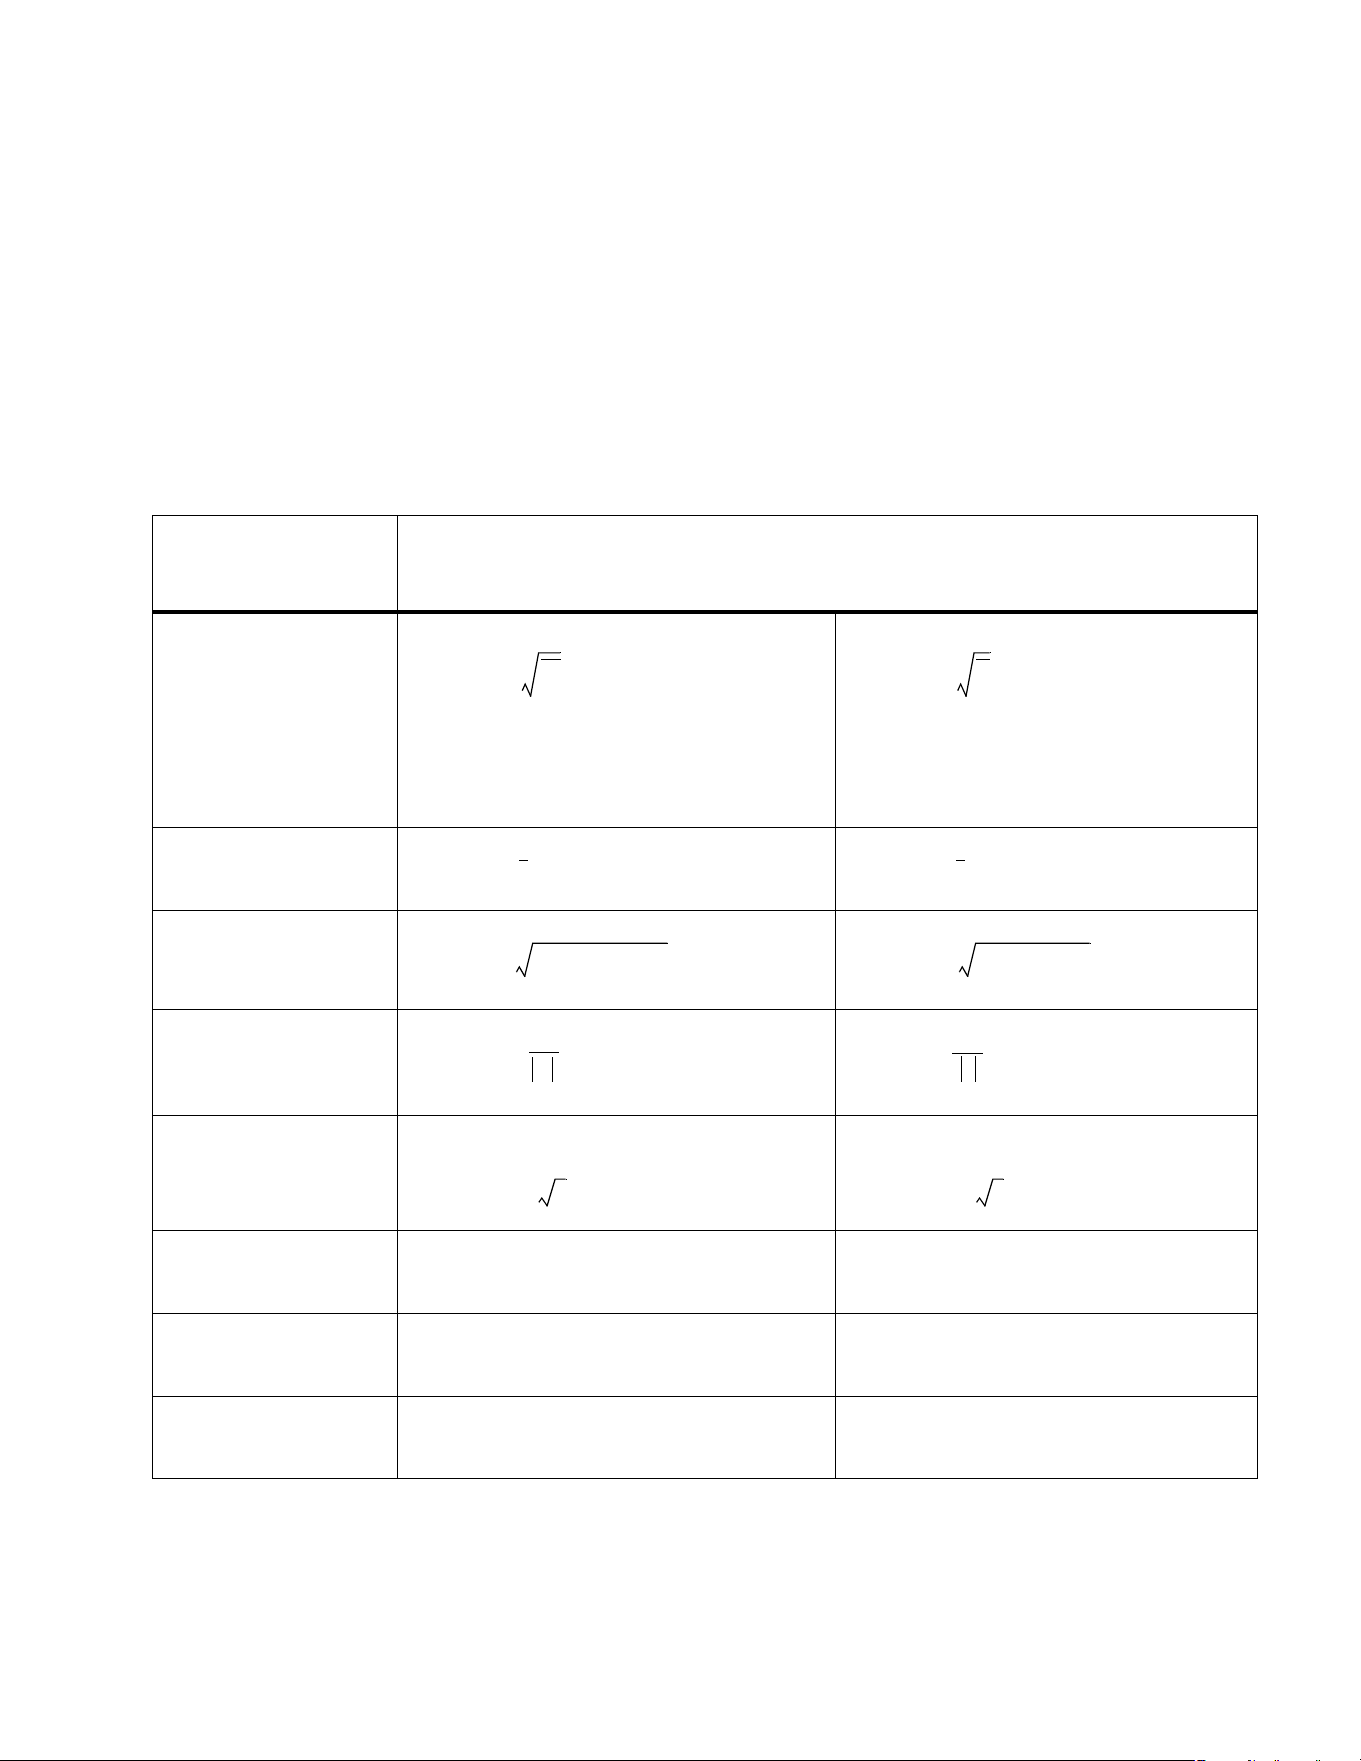
75
Appendix A
Measurement Calculation Method
Measurement
Function
Calculation Formula
RMS
DC component
AC component
Rectified Mean
Corrected
Rectified Mean
Peak+
Peak-
Peak to Peak
U
rms
u
2
=
U
Σ
U
A
U
B
U
C
++
3
----------------------------------=
I
rms
i
2
=
I
Σ
I
A
I
B
I
C
++
3
---------------------------=
U
DC
u=
U
DC
u=
U
AC
U
rms
2
U
DC
–
2
=
I
AC
I
rms
2
I
DC
–
2
=
U
rm
u=
I
rm
i=
U
rmc
π
22
----------
U
rm
=
I
rmc
π
22
----------
I
rm
=
U
p+
MAX u()=
I
p+
MAX i()=
U
p-
MIN u()=
I
p-
MIN i()=
U
pp
U
p+
U
p-
–=
I
pp
I
p+
I
p-
–=
1.888.610.7664 sales@GlobalTestSupply.com
Fluke-Direct.com
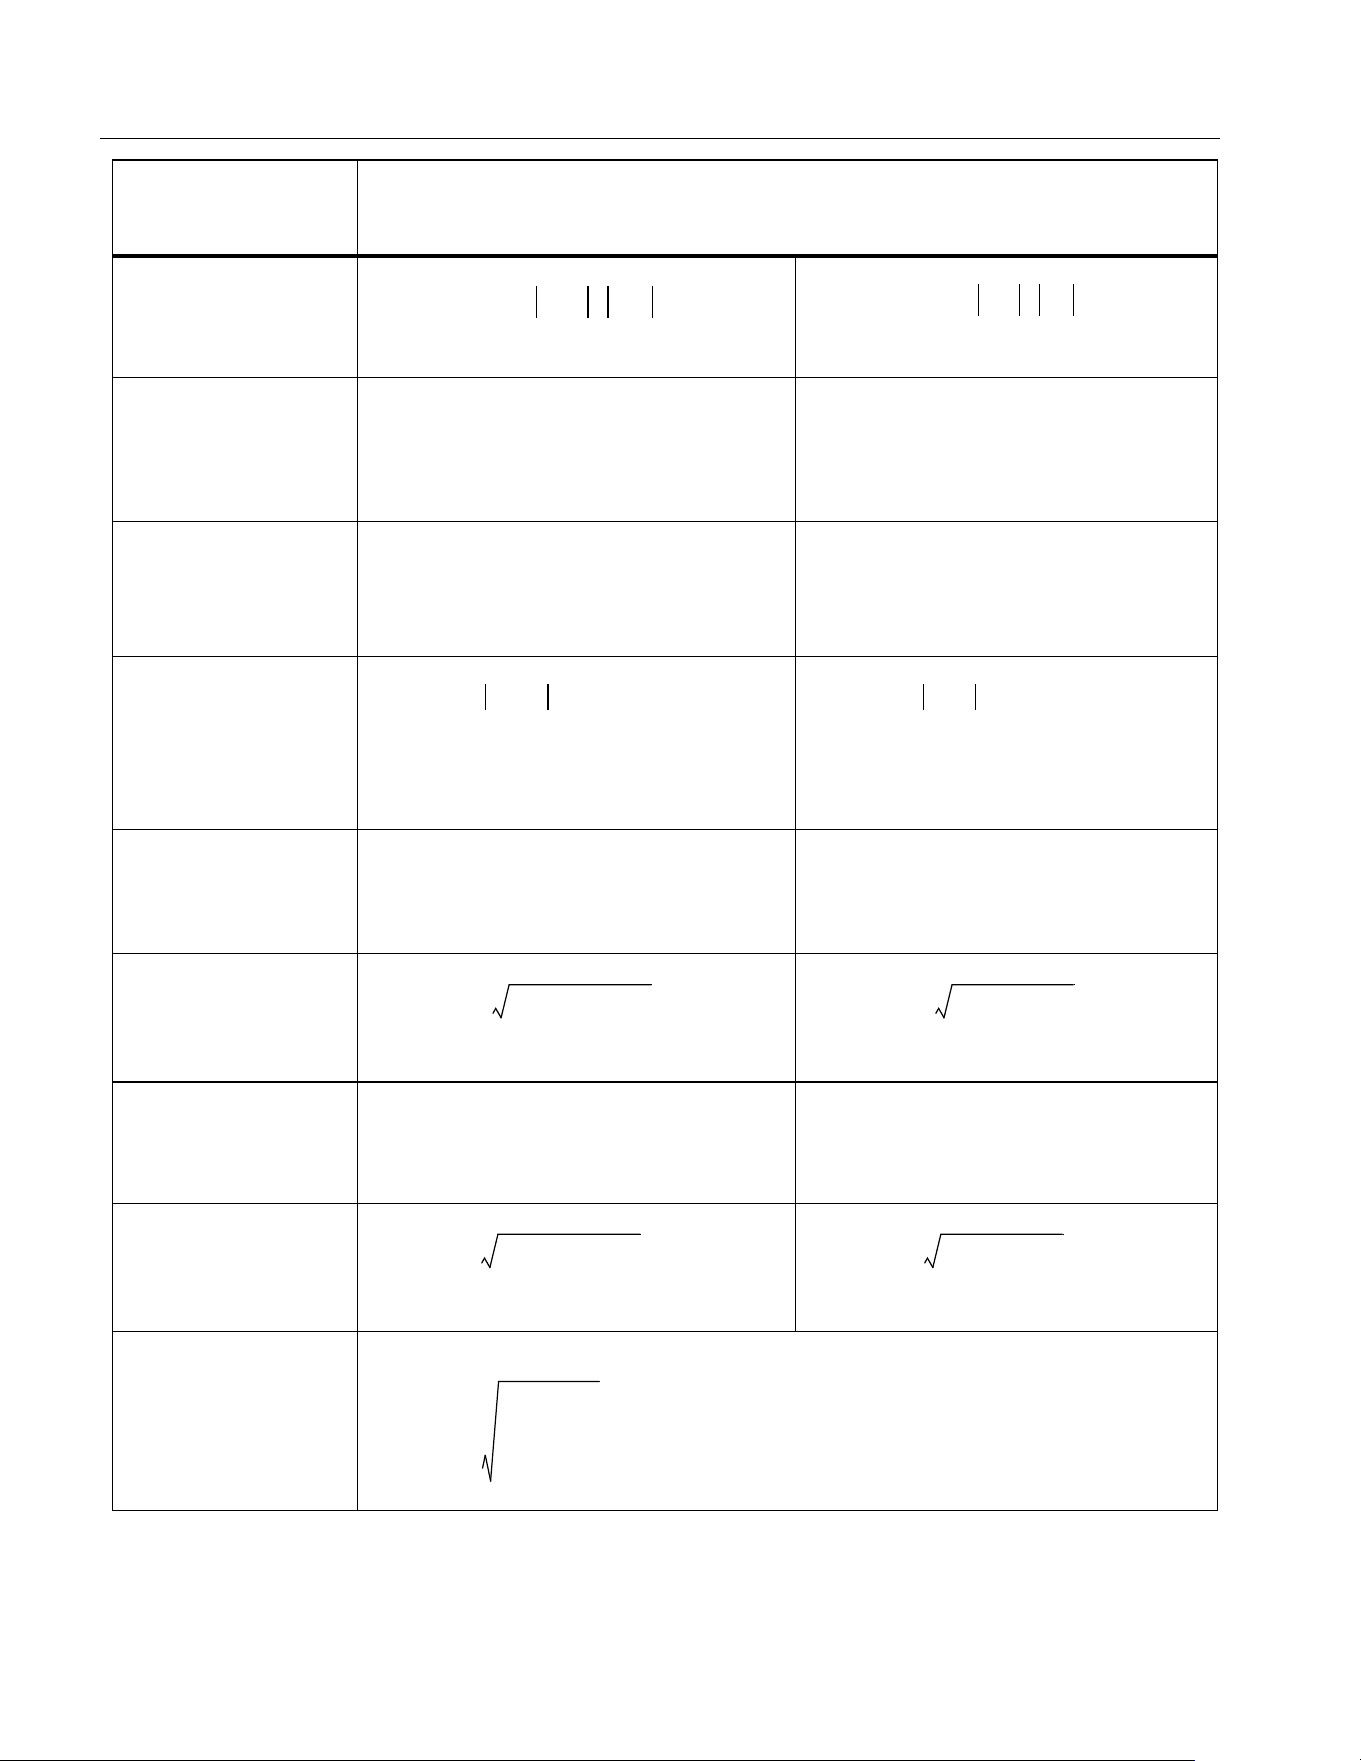
NORMA 6003/NORMA 6003+/NORMA 6004/NORMA 6004+
Users Manual
76
Crest Factor
Ripple Factor
Form Factor
Fundamental
Amplitude
Fundamental
Phase
Relative to the sync source Relative to the sync source
THD
Fundamental
Content
Harmonic Content
hvf
Measurement
Function
Calculation Formula
U
cf
MAX U
p+
U
p-
,()
U
rms
---------------------------------------------=
I
cf
MAX I
p+
I
p-
,()
I
rms
-----------------------------------------=
Urip
Upp
2Udc
------------
=
Irip
Ipp
2Idc
---------
=
Uff
Urm
Urms
-----------
=
Iff
Irm
Irms
---------
=
U
H01
U1()=
U
ΣH01
U
AH01
U
BH01
U
CH01
++()
3
----------------------------------------------------------------=
I
H01
I1()=
I
ΣH01
I
AH01
I
BH01
I
CH01
++()
3
---------------------------------------------------------=
ϕU
H01
U1()[]arg=
ϕI
H01
I1()[]arg=
U
THD
U
rms
2
U
H01
–
U
H01
------------------------------------
2
=
I
THD
I
rms
2
I
H01
–
I
H01
--------------------------------
2
=
U
fc
U
H01
U
rms
------------=
I
fc
I
H01
I
rms
----------=
U
hc
U
rms
2
U
H01
–
U
rms
------------------------------------
2
=
I
hc
I
rms
2
I
H01
–
I
rms
--------------------------------
2
=
hvf
U
2
Hk
k
------------
k2=
13
1
U
N
-------
k 3n for 3-phase motor≠(),=
1.888.610.7664 sales@GlobalTestSupply.com
Fluke-Direct.com
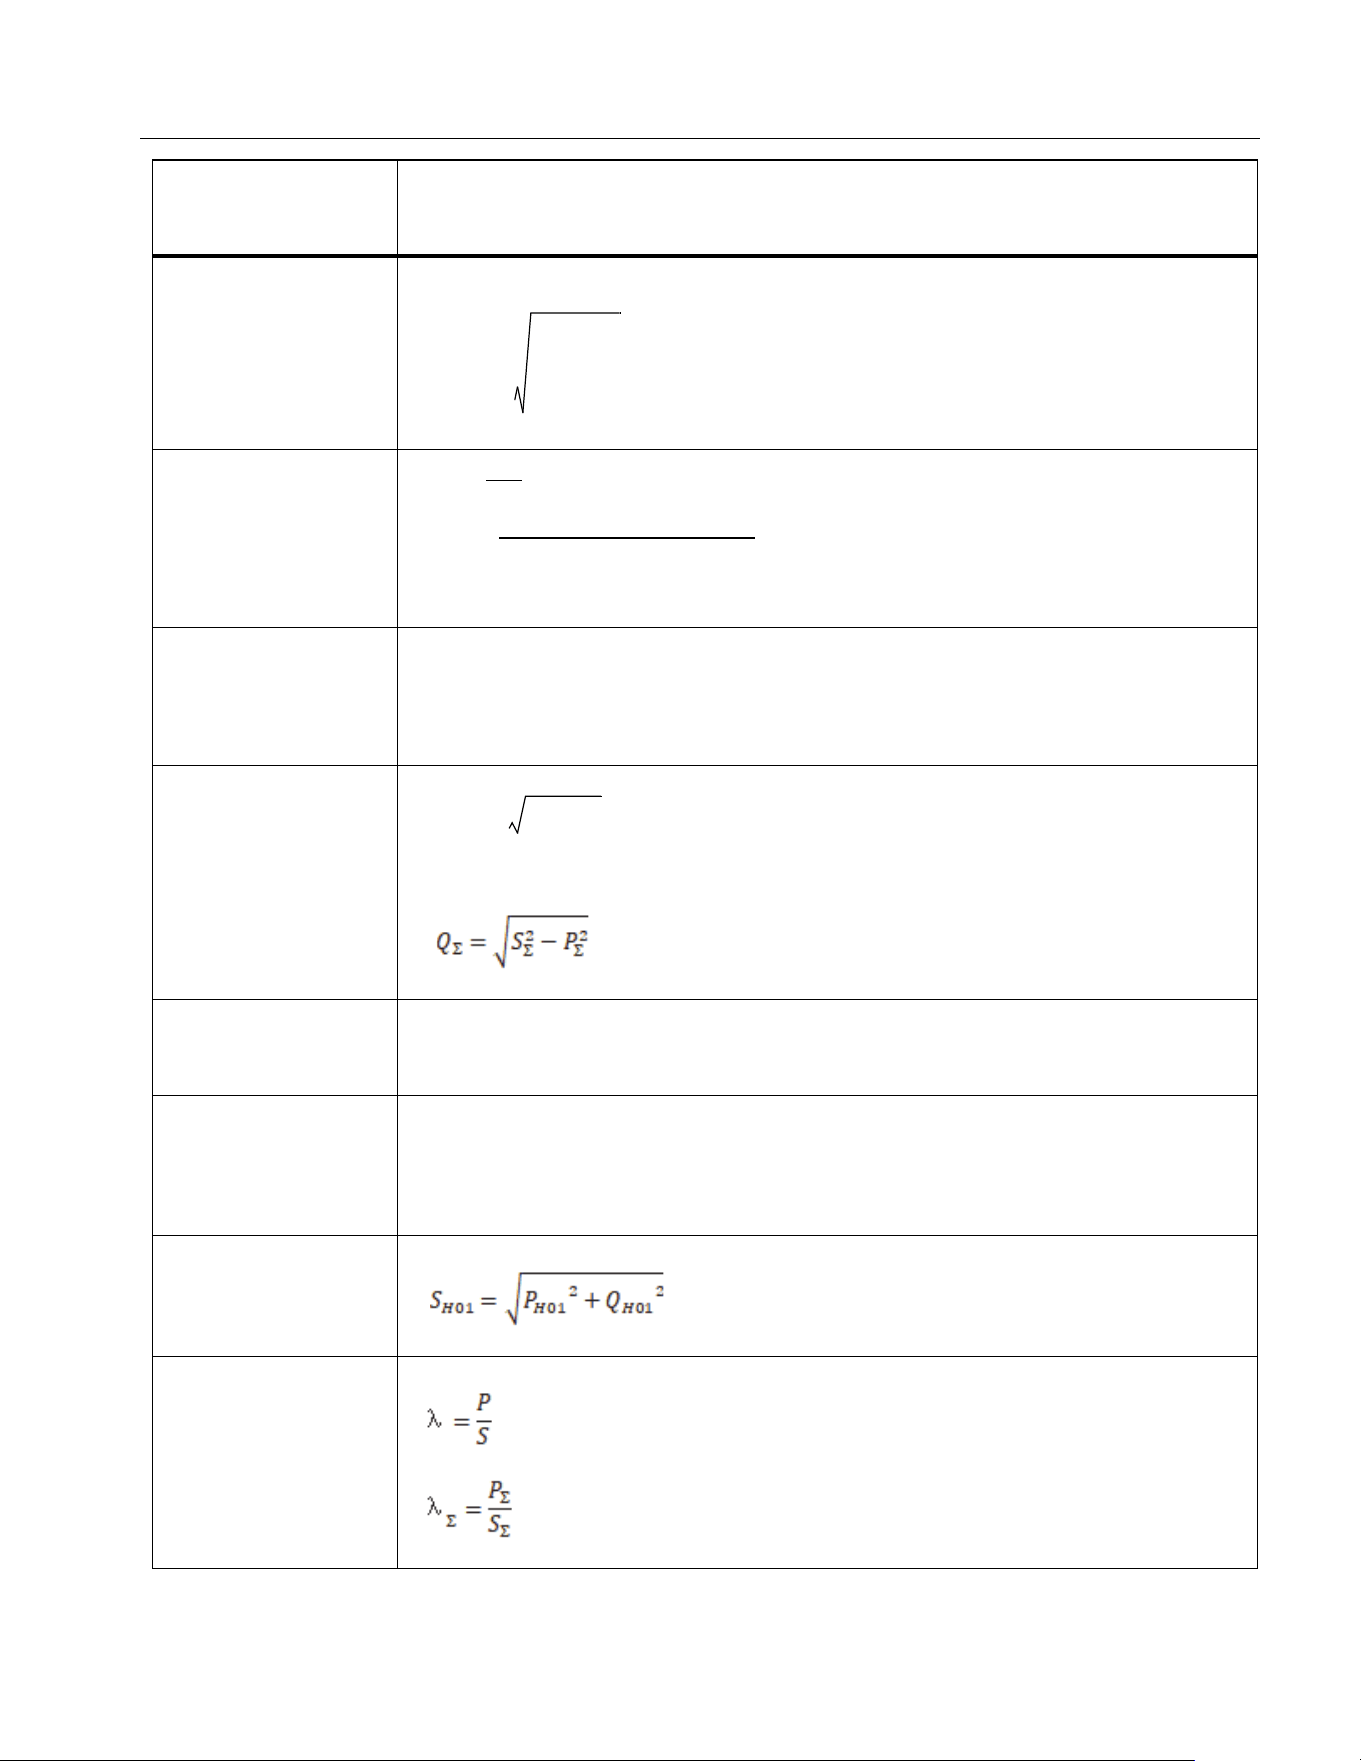
Power Analyzers
Appendix A
77
hcf
Active Power
Assume I
N
= 0 for 3P3W3M
Fundamental
Active Power
Reactive Power
s = +1 when inductive ; s = -1 when capacitive
Fundamental
Reactive Power
Apparent Power
Fundamental
Apparent Power
Power Factor
Measurement
Function
Calculation Formula
hcf I
2
Hk
k2=
13
1
I
N
----
=
Pui⋅=
P
Σ
u
A
i
A
⋅ u
B
i
B
u
C
i
C
⋅+⋅+=
P
H01
U
r
1()I
r
1() U
j
1()I
j
1()+=
P
ΣH01
P
AH01
P
BH01
P
CH01
++=
QsS
2
P
2
–=
Q
H01
U
j
1()I
r
1() U
r
1()I
j
1()+=
SU
rms
I
rms
⋅=
S
Σ
U
A
I
A
⋅ U
B
I
B
U
C
I
C
⋅+⋅+=
1.888.610.7664 sales@GlobalTestSupply.com
Fluke-Direct.com
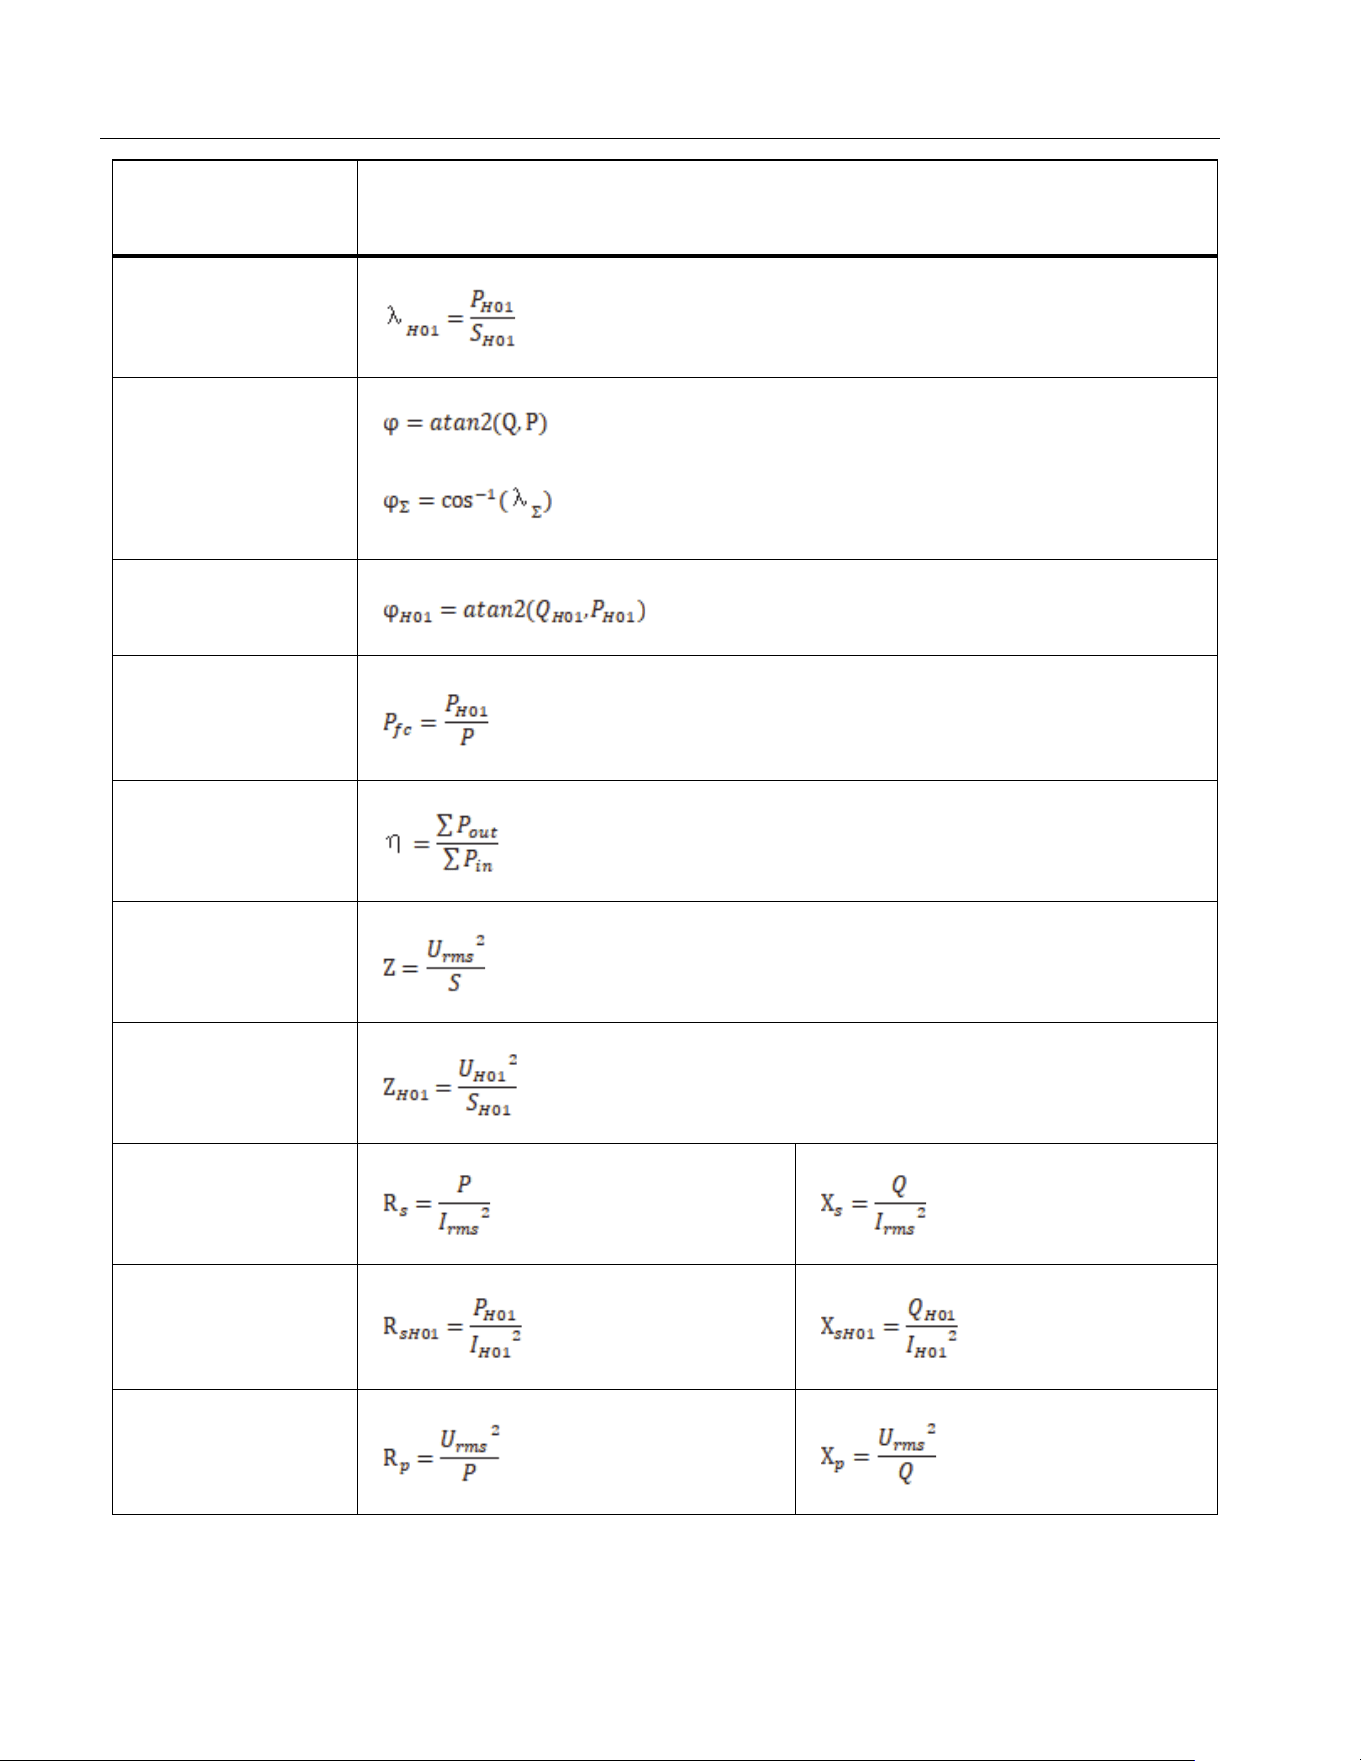
NORMA 6003/NORMA 6003+/NORMA 6004/NORMA 6004+
Users Manual
78
Fundamental
Power Factor
Phase Shift
Fundamental
Phase Shift
Power
Fundamental
Content
Efficiency
Impedance
Fundamental
Impedance
Impedance Series
Equivalence
Fundamental
Impedance Series
Equivalence
Impedance
Parallel
Equivalence
Measurement
Function
Calculation Formula
1.888.610.7664 sales@GlobalTestSupply.com
Fluke-Direct.com
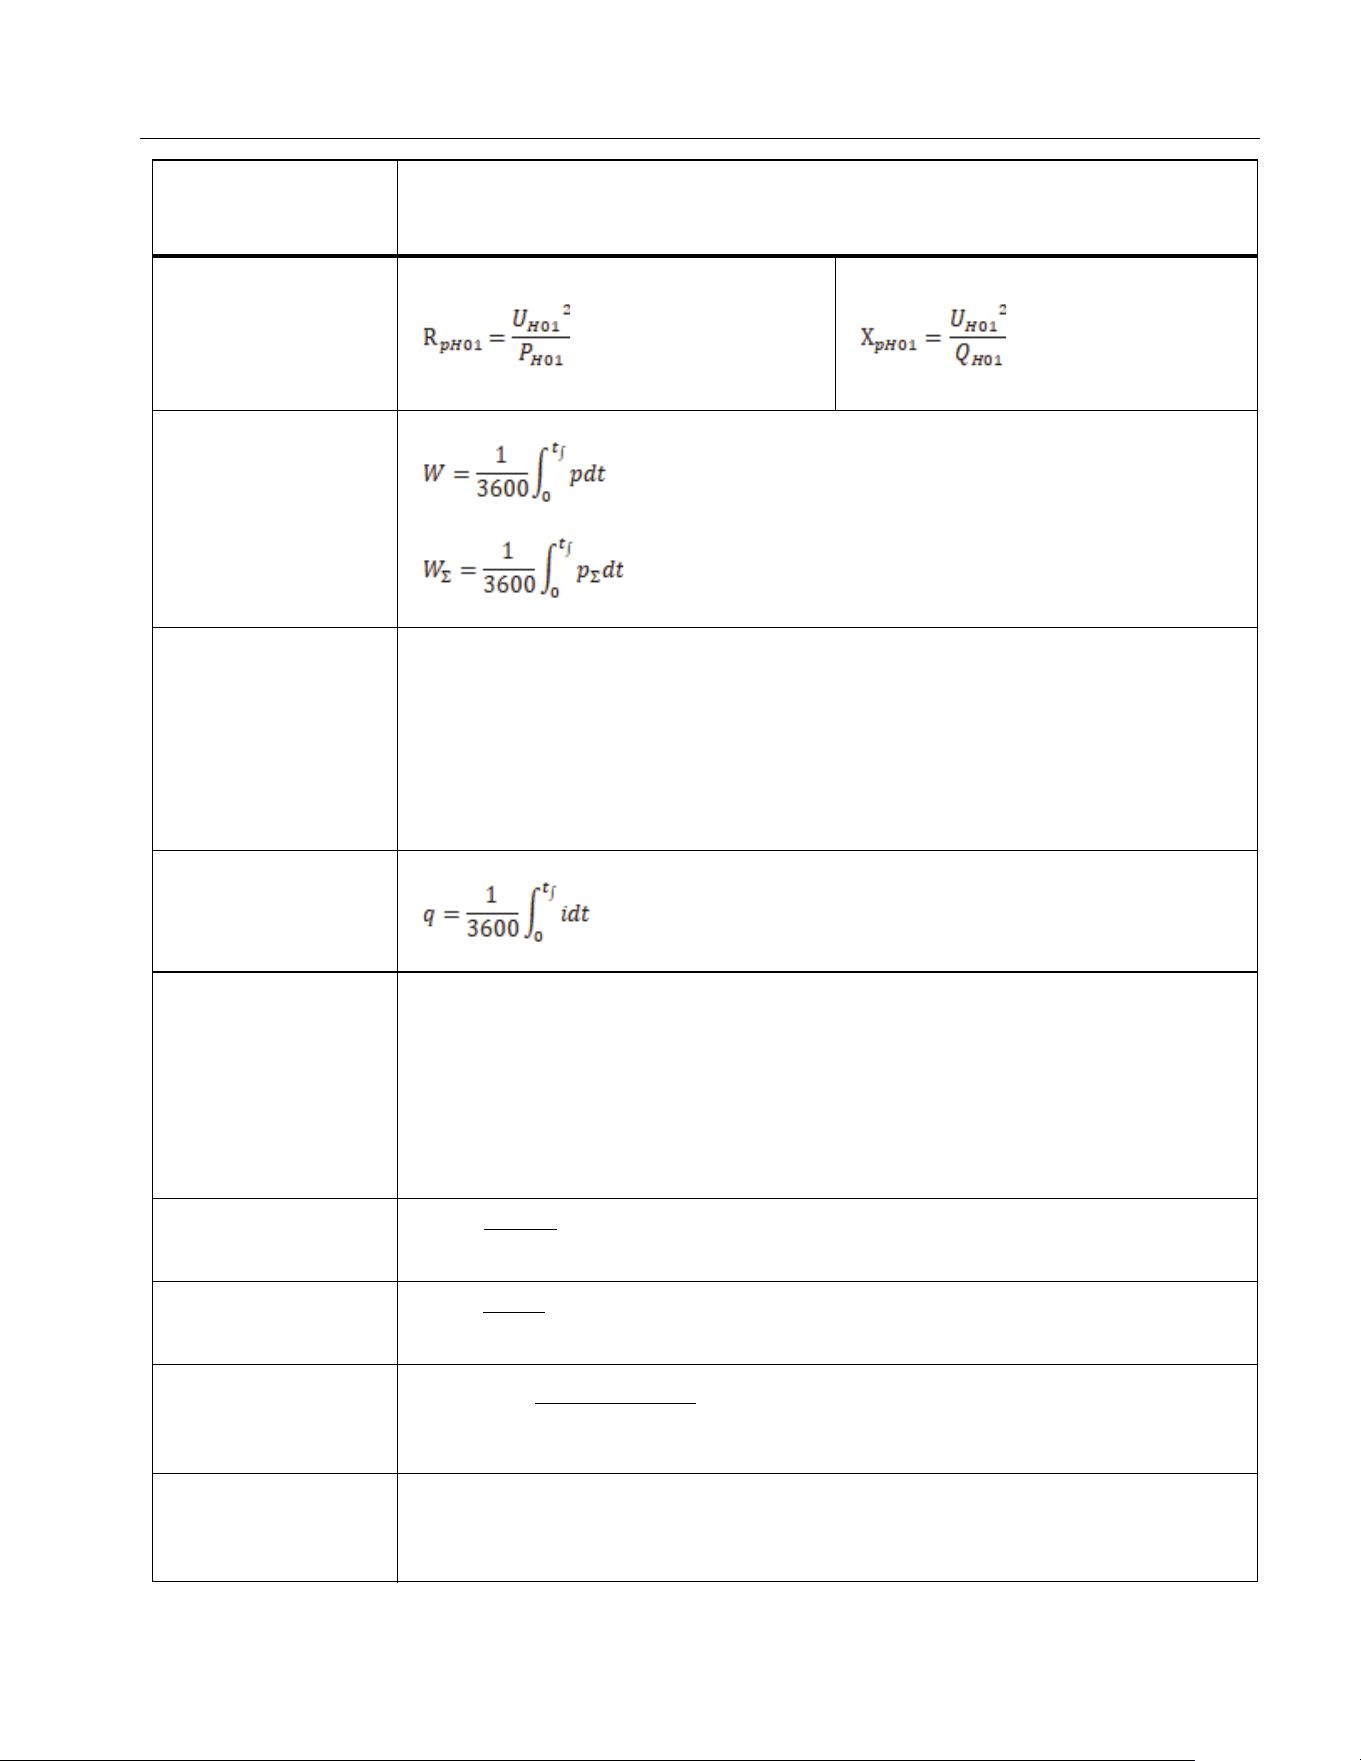
Power Analyzers
Appendix A
79
Fundamental
Impedance
Parallel
Equivalence
Electrical Energy
(Wh)
Electric Energy +/-
in each update cycle
Electric Quantity
Electric Quantity
+/-
in each update cycle
Torque
Rotation Speed
Mechanical Power
Mechanical
Energy
Measurement
Function
Calculation Formula
W
update
1
3600
------------
ptd
=
if W
update
0 W
+
,> W
+
W
update
+=
if W
update
0 W
-
,< W
-
W
update
+=
q
update
1
3600
------------
itd
=
if q
update
0 q
+
,> q
+
q
update
+=
if q
update
0 q
-
,< q
-
q
update
+=
T torque=
nspeed=
P
M
2π
60
------
torque speed⋅=
E
M
1
3600
------------
P
M
td
0
t
sr
=
1.888.610.7664 sales@GlobalTestSupply.com
Fluke-Direct.com
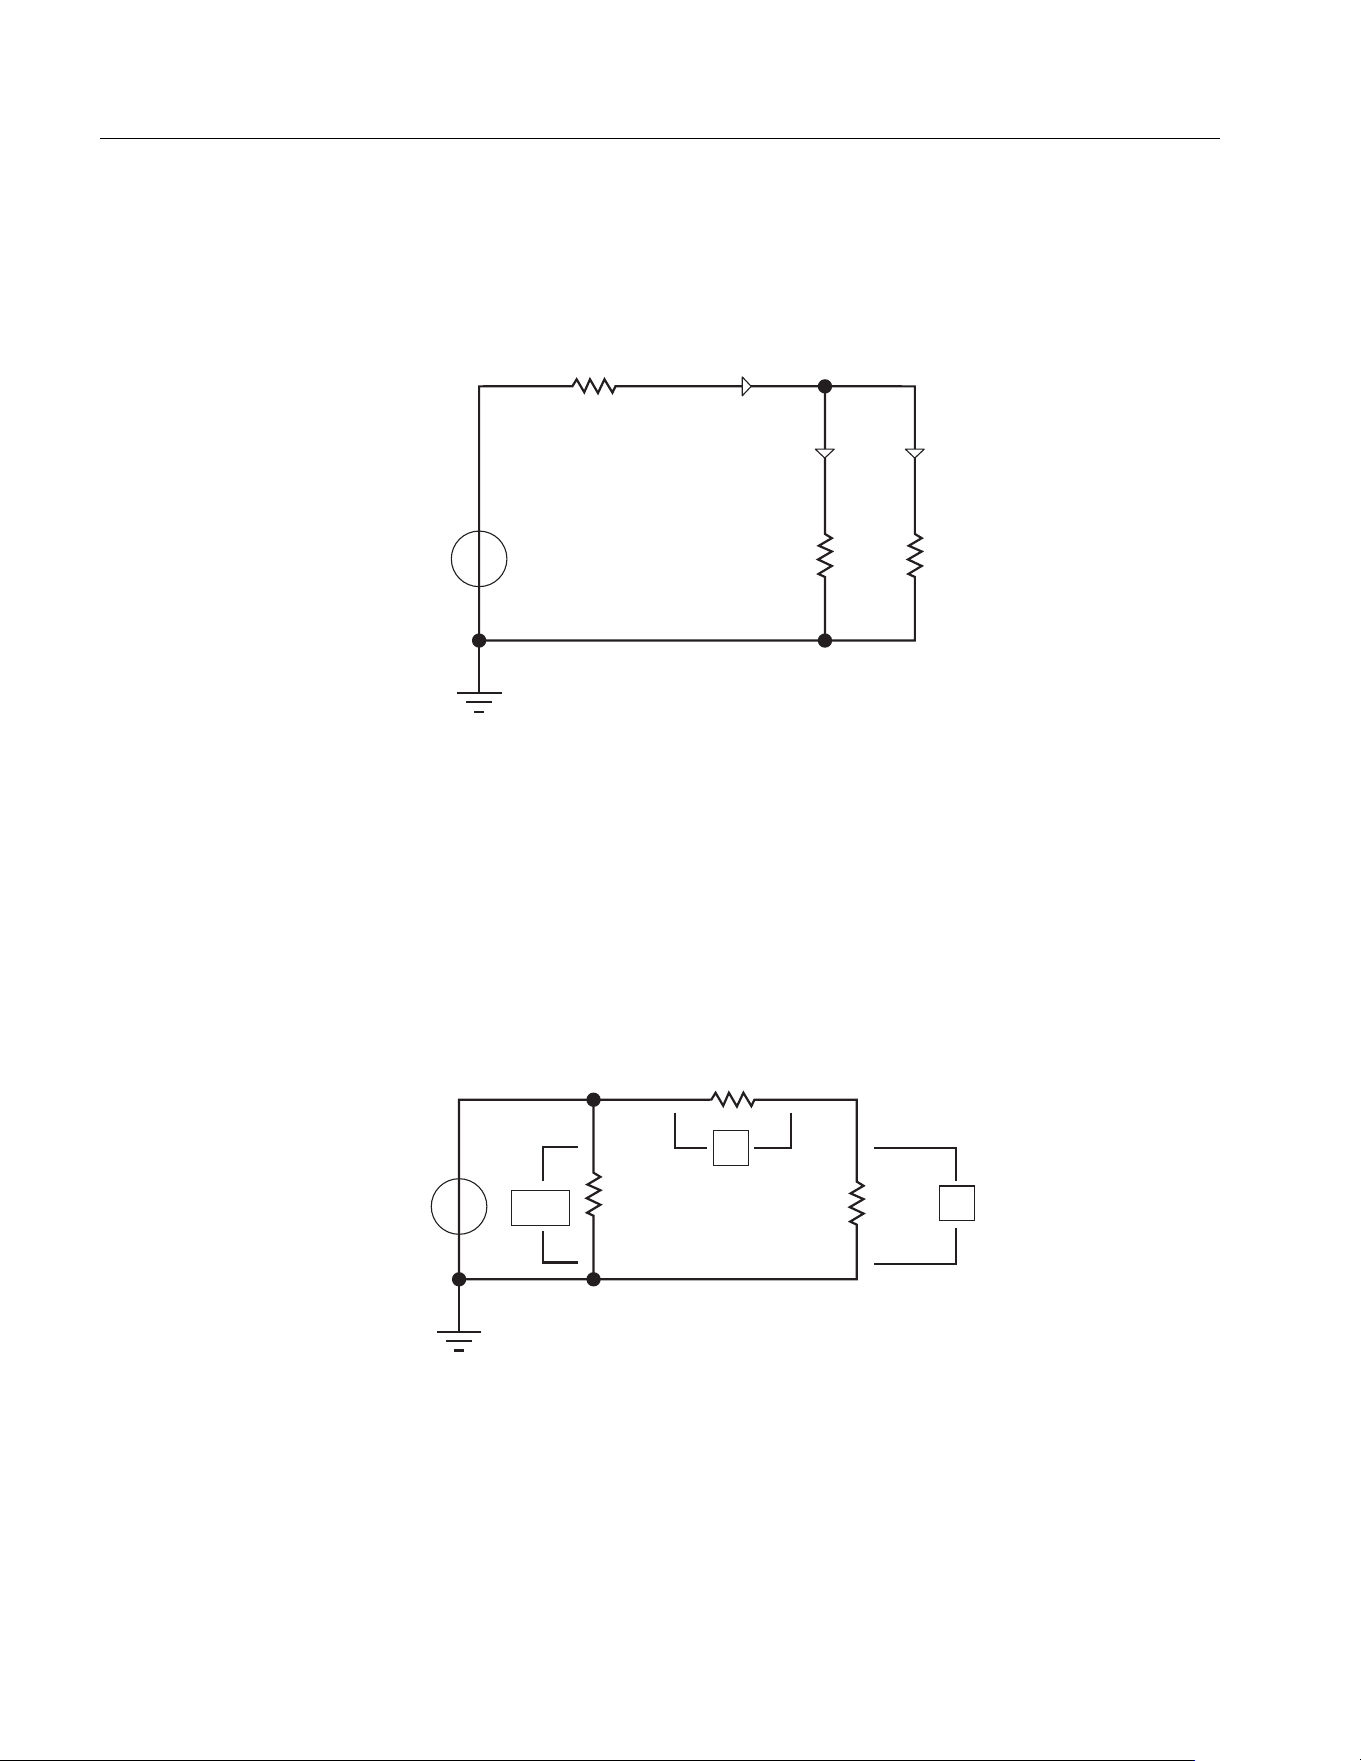
NORMA 6003/NORMA 6003+/NORMA 6004/NORMA 6004+
Users Manual
80
How to Make More Accurate Measurements
Measurement Error Caused by the Channel Resistance
By wiring a circuit to match the load, you can minimize the effects of power loss on measurement
accuracy. The wiring of the source and load is discussed in this section.
Figure A1. Connect the Voltage Measurement near the load
Connect the voltage measurement circuit near the load (as shown in
Figure A1). The current
measurement circuit measures the sum of i
Connect the Voltage Measurement near the loadL
and i
V
. i
L
(desired
current) is the current flowing through the load of the circuit under measurement, and i
V
(error current)
is the current flowing through the voltage measurement circuit. Because the current flowing through the
circuit under measurement is i
L
, only i
V
reduces measurement accuracy. The input resistance of the
voltage measurement circuit of the Analyzer is approximately 2 MΩ. If the input voltage is 1000 V, i
V
is
approximately 0.5 mA (1000 V/2 MΩ). Only when the load current i
L
is 0.5 A or more, the effect of i
V
on
the measurement accuracy is 0.1% or less.
Figure A2. Connect the Voltage Measurement near the source
Connect the voltage measurement circuit near the source (as shown in
Figure A2). The voltage
measurement circuit measures the sum of e
L
and e
I
. e
L
(desired voltage) is the load voltage, and e
I
(error voltage) is the voltage drop across the current measurement circuit. The input resistance of the
current measurement circuit of the Analyzer, I Rin is approximately 0.025 Ω. If the input current is 10 A,
the effect of e
I
on the measurement accuracy is approximately 0.25 V (10 A×0.025 Ω). Only when the
I Rin=0.025Ω
U Rin=2MΩ
iv+iL
iv iL
Load
Source
+
I Rin=0.025Ω
U Rin=2MΩ
Load
Source
+
e
L
e
i
e
L
e
i
+
1.888.610.7664 sales@GlobalTestSupply.com
Fluke-Direct.com
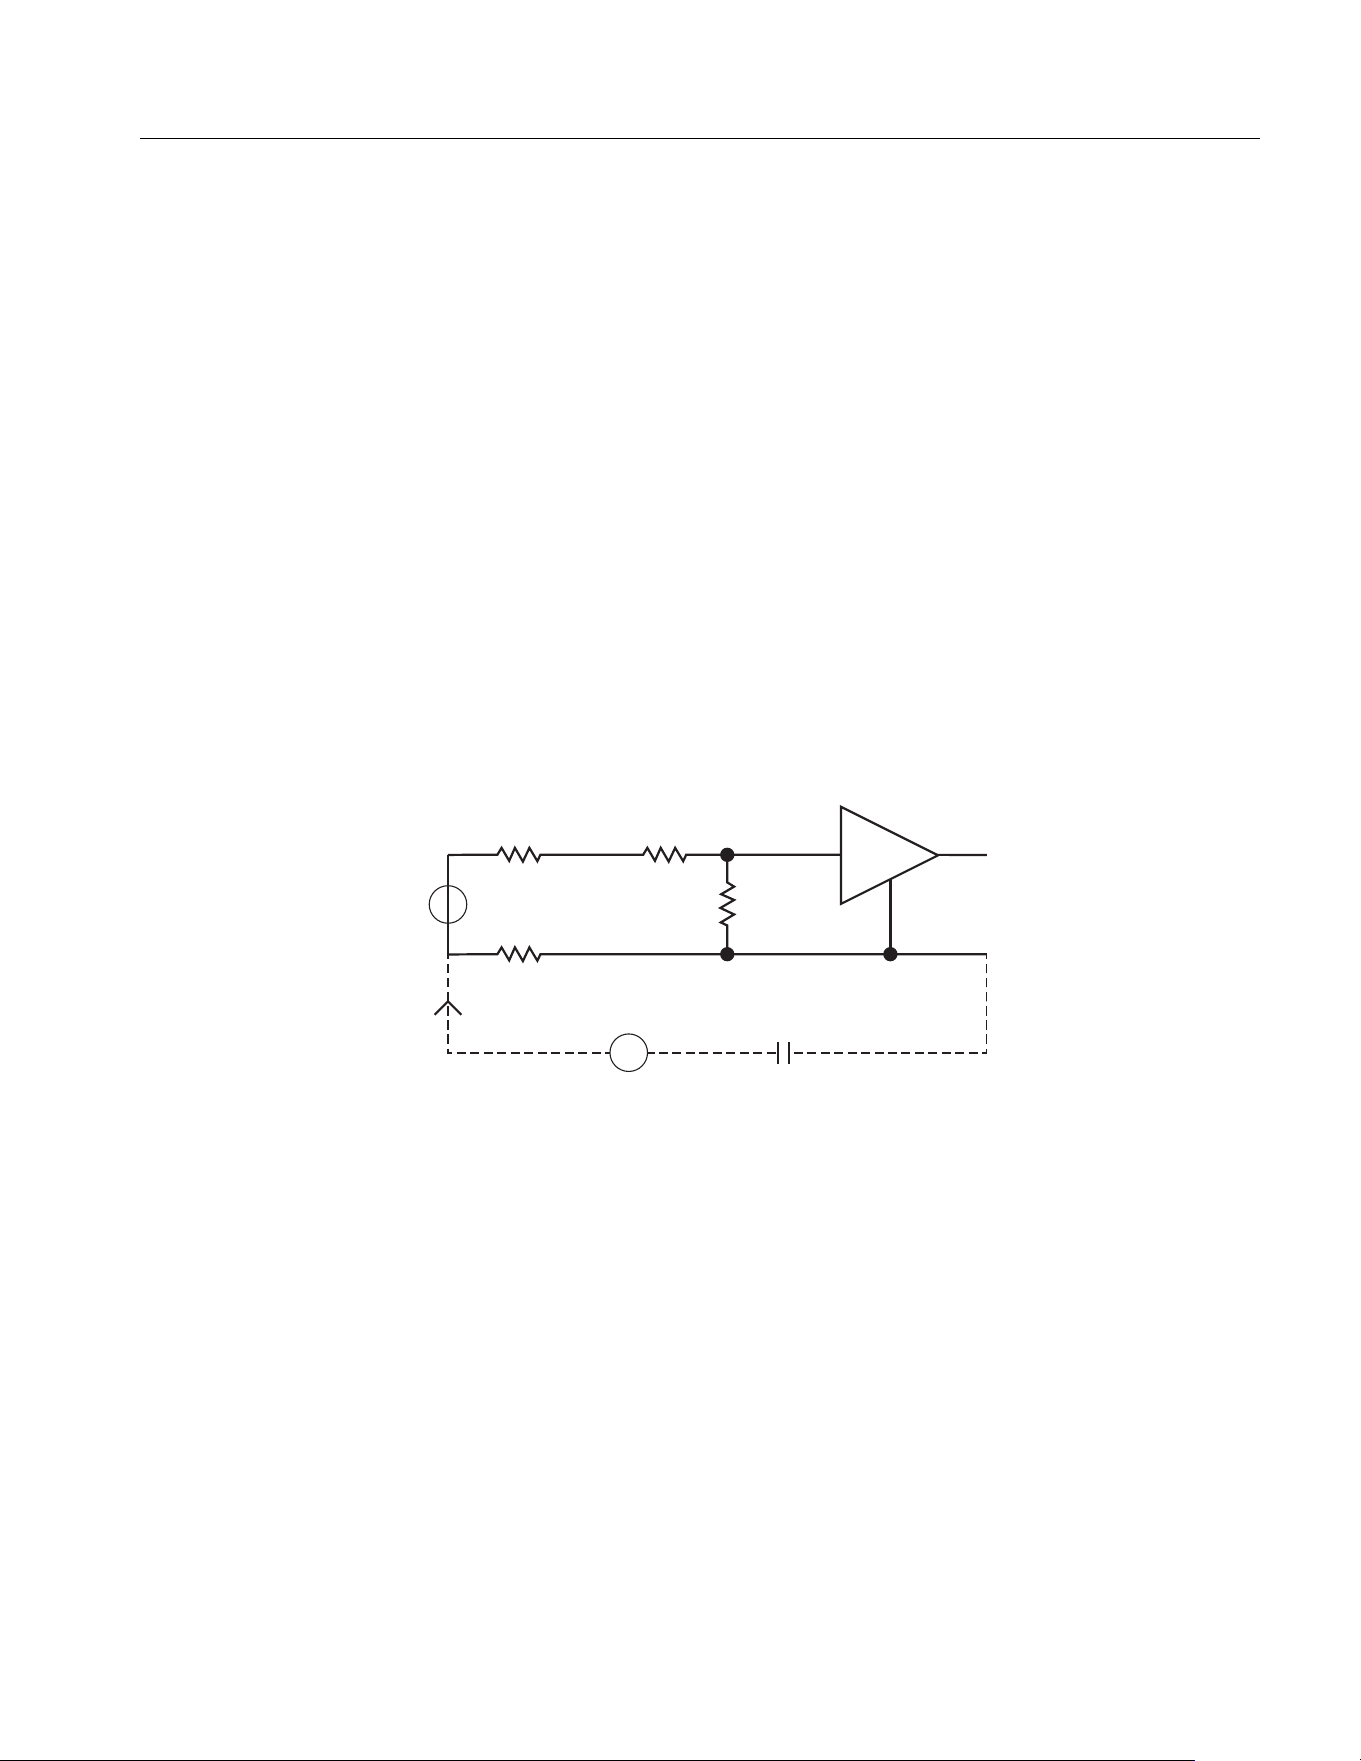
Power Analyzers
Appendix A
81
load voltage e
L
is 250 V or more, the effect on the measurement accuracy is less than 0.1 %. In
summary, when measuring low voltage and large current, it is recommended to use the wiring method
of the figure above; when measuring high voltage and small current, it is recommended to use the
wiring method of the figure below.
Effects of Leakage Capacitance
Each measurement channel of the Analyzer is isolated from each other. However, these isolated
channels still have a leakage capacitance C
s
relative to the earth, which consists of the distributed
capacitance of the instrument itself, the isolation capacitance of the power adapter, and the anti-
interference capacitance inside the instrument. In general, the test object of the Analyzer has a higher
voltage relative to the earth, and we call this voltage common mode voltage V
com
. The common mode
voltage can generate a current i
cs
through the leakage capacitance C
s
. This current i
cs
will have a
certain impact on the measurement results of the Analyzer.
As shown in
Figure A3, during voltage measurement, the current i
cs
is coupled to the measurement
circuit through R
s+
, R
s-
and R
in
. R
s+
and R
s-
are internal resistances of the power supply under
measurement and R
in
is the test internal resistance of the power analyzer. The effect on the
measurement voltage is: . Because R
in
is larger, internal resistance of
the power supply under measurement R
s-
has the main impact. R
s-
is connected to the common
terminal (black terminal) of the measurement circuit.
Figure A3. Effects of Leakage Current on Voltage Measurement
During current measurement, the current i
cs
flows through the test resistance R
shunt
, and the internal
resistance of the test resistance and the common terminal of the measurement circuit R
s-
and forms a
voltage, that is coupled into the measurement circuit. The effect on the measurement
current: , the voltage drop of i
cs
in R
Shunt
and internal resistance R
s -
can cause measurement errors.
∆Ui
cs
R
S-
//(R
S+
R
in
)+[]=
RinRs+
Rs-
Cs
Ics
U
2M Ohm
∆U= Ics[Rs-//(Rs+ + Rin)]
Vcom
∆Ii
cs
R
Shunt
R
S-
+()R
Shunt
⁄[]=
1.888.610.7664 sales@GlobalTestSupply.com
Fluke-Direct.com
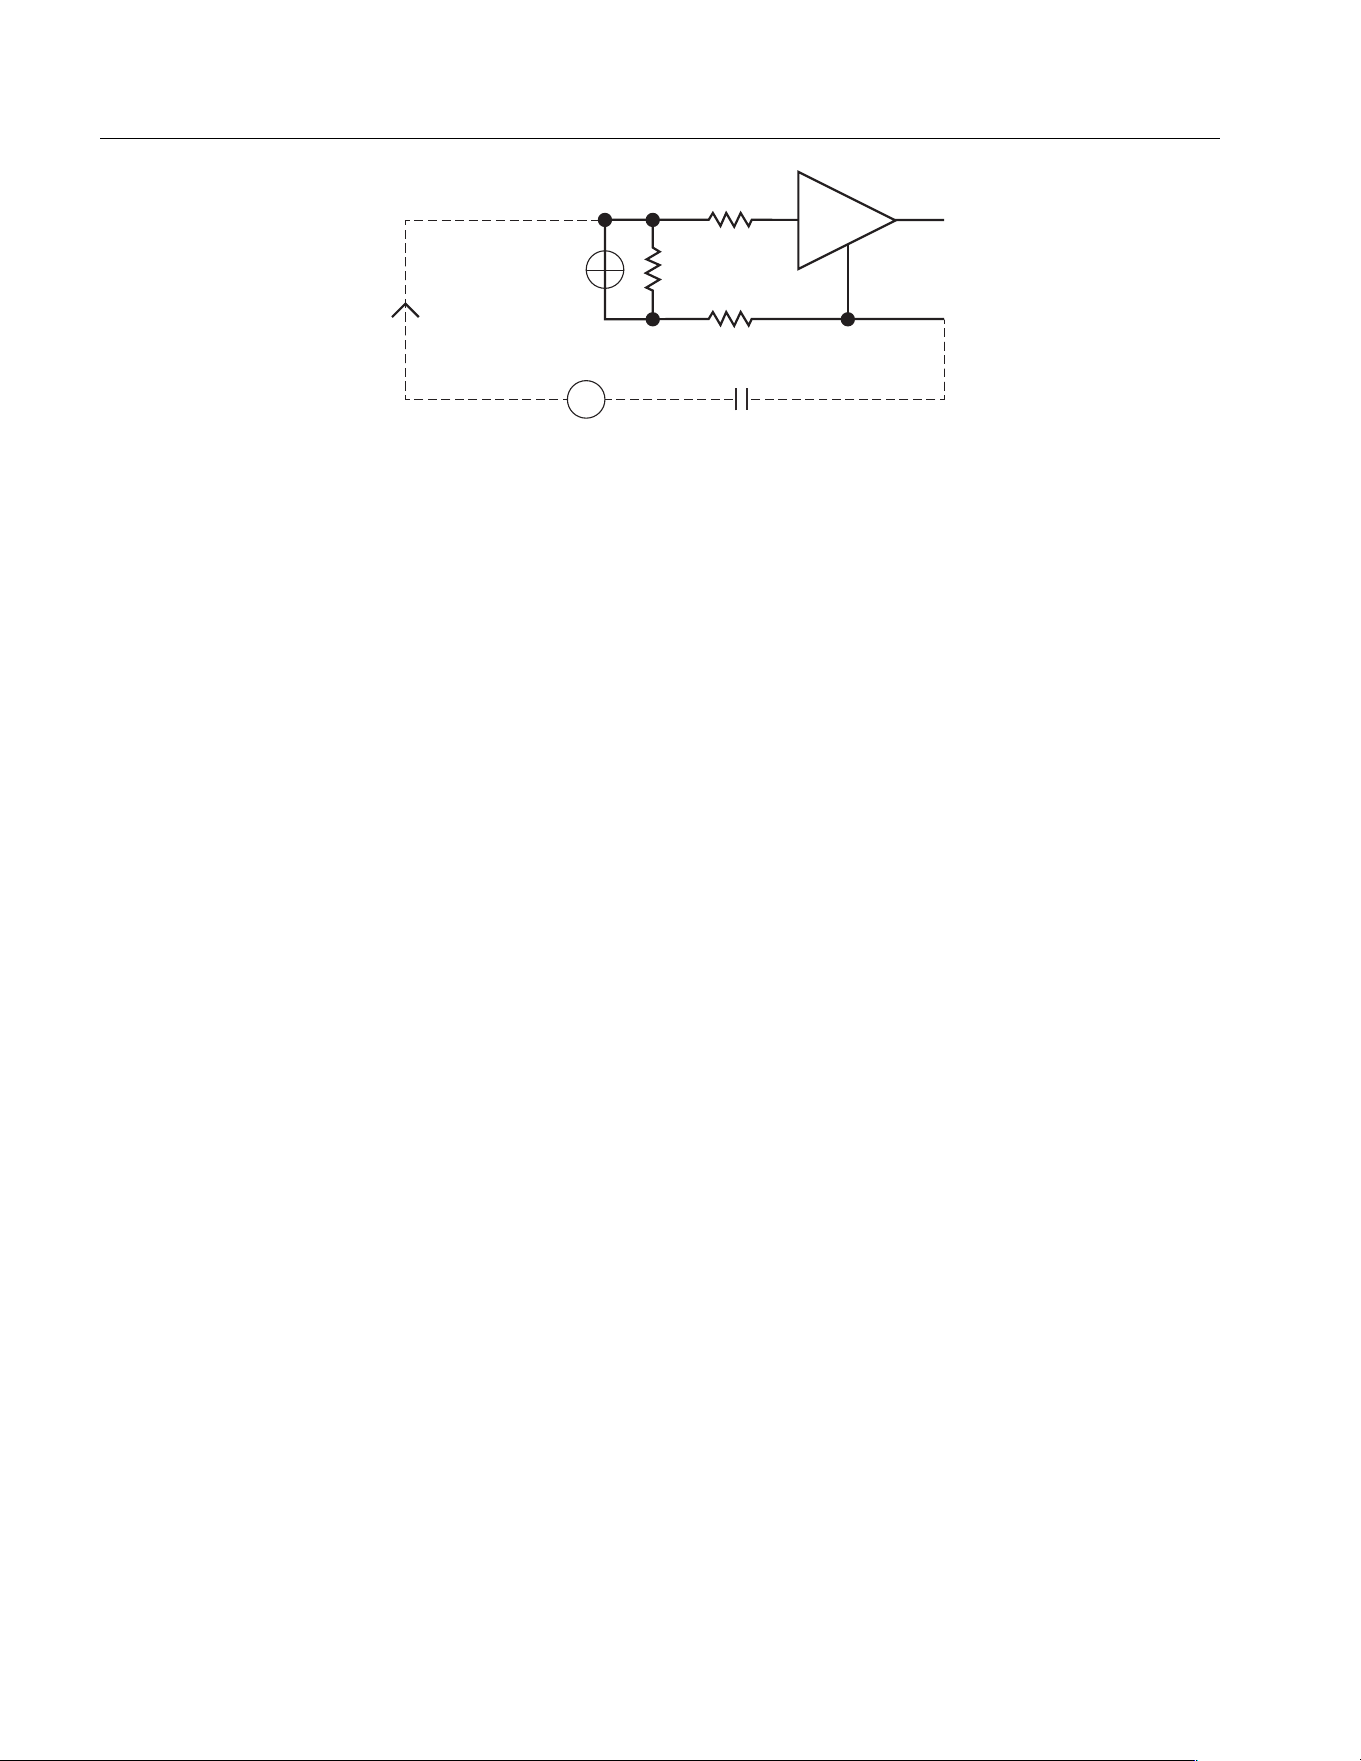
NORMA 6003/NORMA 6003+/NORMA 6004/NORMA 6004+
Users Manual
82
Figure A4. Effects of Leakage Current on Current Measurement
Methods to Reduce the Effect of Leakage Capacitance
1. High frequency components more easily generate current on the leakage capacitance than low
frequency components. When measuring the small current with the built-in current channel, if you
do not pay attention to the high-frequency components of the current, it is recommended to turn on
the 650Hz line filter to effectively reduce the effect of leakage capacitance.
2. Connecting the built-in current channel to terminal N or ground can effectively reduce the effect of
leakage capacitance.
3. Disconnecting the power adapter and using battery only can reduce the effect of leakage
capacitance.
4. When measuring voltage, if the 2 terminals of the voltage source under measurement do not have
the same impedance to the ground, it is recommended to connect the black terminal to the terminal
with lower impedance (to avoid leakage current flowing through the internal resistance of the
voltage source under measurement).
Broadband Measurement
The Analyzer has a bandwidth of up to 500 kHz and a sample rate of 200 kHz. When the measurement
bandwidth is greater than half of the sample rate, aliasing may be caused, the observed waveform is
not the real waveform, and the measured frequency is not the real frequency.
To measure a time-based digital quantity, such as RMS, AC and DC components, the results of the
measurement after aliasing are still accurate. However, note that if the signal frequency is close to or
equal to the sample frequency and its multiples, the measurement results are probably invalid.
If the signal under measurement has a frequency component higher than 100 kHz, and it is not desired
to be measured under aliasing, the line filter of the corresponding channel can be turned on according
to the required bandwidth.
Rs+
Rs-
Rshunt
0.01 Ohm
I
Cs
Ics
∆I= Ics[(Rshunt + Rs-)/Rshunt]
Vcom
1.888.610.7664 sales@GlobalTestSupply.com
Fluke-Direct.com