
User Manual

User Manual
i
About this Document
● This Document includes instructions for using and managing the Product. Pictures, charts,
images and all other information hereinafter are for description and explanation only.
● The information contained in the Document is subject to change, without notice, due to
firmware updates or other reasons. Please find the latest version of the Document at the
Hikvision website (https://www.hikvision.com). Unless otherwise agreed, Hangzhou Hikvision
Digital Technology Co., Ltd. or its affiliates (hereinafter referred to as "Hikvision") makes no
warranties, express or implied.
● Please use the Document with the guidance and assistance of professionals trained in
supporting the Product.
About this Product
This product can only enjoy the after-sales service support in the country or region where the
purchase is made.
Acknowledgment of Intellectual Property Rights
● Hikvision owns the copyrights and/or patents related to the technology embodied in the
Products described in this Document, which may include licenses obtained from third parties.
● Any part of the Document, including text, pictures, graphics, etc., belongs to Hikvision. No part
of this Document may be excerpted, copied, translated, or modified in whole or in part by any
means without written permission.
● and other Hikvision's trademarks and logos are the properties of Hikvision in
various jurisdictions.
● Other trademarks and logos mentioned are the properties of their respective owners.
LEGAL DISCLAIMER
● TO THE MAXIMUM EXTENT PERMITTED BY APPLICABLE LAW, THIS DOCUMENT AND THE
PRODUCT DESCRIBED, WITH ITS HARDWARE, SOFTWARE AND FIRMWARE, ARE PROVIDED "AS
IS" AND "WITH ALL FAULTS AND ERRORS". HIKVISION MAKES NO WARRANTIES, EXPRESS OR
IMPLIED, INCLUDING WITHOUT LIMITATION, MERCHANTABILITY, SATISFACTORY QUALITY, OR
FITNESS FOR A PARTICULAR PURPOSE. THE USE OF THE PRODUCT BY YOU IS AT YOUR OWN
RISK. IN NO EVENT WILL HIKVISION BE LIABLE TO YOU FOR ANY SPECIAL, CONSEQUENTIAL,
INCIDENTAL, OR INDIRECT DAMAGES, INCLUDING, AMONG OTHERS, DAMAGES FOR LOSS OF
BUSINESS PROFITS, BUSINESS INTERRUPTION, OR LOSS OF DATA, CORRUPTION OF SYSTEMS, OR
LOSS OF DOCUMENTATION, WHETHER BASED ON BREACH OF CONTRACT, TORT (INCLUDING
NEGLIGENCE), PRODUCT LIABILITY, OR OTHERWISE, IN CONNECTION WITH THE USE OF THE
PRODUCT, EVEN IF HIKVISION HAS BEEN ADVISED OF THE POSSIBILITY OF SUCH DAMAGES OR
LOSS.
● YOU ACKNOWLEDGE THAT THE NATURE OF THE INTERNET PROVIDES FOR INHERENT SECURITY
RISKS, AND HIKVISION SHALL NOT TAKE ANY RESPONSIBILITIES FOR ABNORMAL OPERATION,
PRIVACY LEAKAGE OR OTHER DAMAGES RESULTING FROM CYBER-ATTACK, HACKER ATTACK,
VIRUS INFECTION, OR OTHER INTERNET SECURITY RISKS; HOWEVER, HIKVISION WILL PROVIDE
TIMELY TECHNICAL SUPPORT IF REQUIRED.

User Manual
ii
● YOU AGREE TO USE THIS PRODUCT IN COMPLIANCE WITH ALL APPLICABLE LAWS, AND YOU ARE
SOLELY RESPONSIBLE FOR ENSURING THAT YOUR USE CONFORMS TO THE APPLICABLE LAW.
ESPECIALLY, YOU ARE RESPONSIBLE, FOR USING THIS PRODUCT IN A MANNER THAT DOES NOT
INFRINGE ON THE RIGHTS OF THIRD PARTIES, INCLUDING WITHOUT LIMITATION, RIGHTS OF
PUBLICITY, INTELLECTUAL PROPERTY RIGHTS, OR DATA PROTECTION AND OTHER PRIVACY
RIGHTS. YOU SHALL NOT USE THIS PRODUCT FOR ANY PROHIBITED END-USES, INCLUDING THE
DEVELOPMENT OR PRODUCTION OF WEAPONS OF MASS DESTRUCTION, THE DEVELOPMENT
OR PRODUCTION OF CHEMICAL OR BIOLOGICAL WEAPONS, ANY ACTIVITIES IN THE CONTEXT
RELATED TO ANY NUCLEAR EXPLOSIVE OR UNSAFE NUCLEAR FUEL-CYCLE, OR IN SUPPORT OF
HUMAN RIGHTS ABUSES.
● IN THE EVENT OF ANY CONFLICTS BETWEEN THIS DOCUMENT AND THE APPLICABLE LAW, THE
LATTER PREVAILS.
© Hangzhou Hikvision Digital Technology Co., Ltd. All rights reserved.
User Manual
iii
Symbol Conventions
The symbols that may be found in this document are defined as follows.
Symbol
Description
Danger
Indicates a hazardous situation which, if not avoided, will or could
result in death or serious injury.
Caution
Indicates a potentially hazardous situation which, if not avoided,
could result in equipment damage, data loss, performance
degradation, or unexpected results.
Note
Provides additional information to emphasize or supplement
important points of the main text.
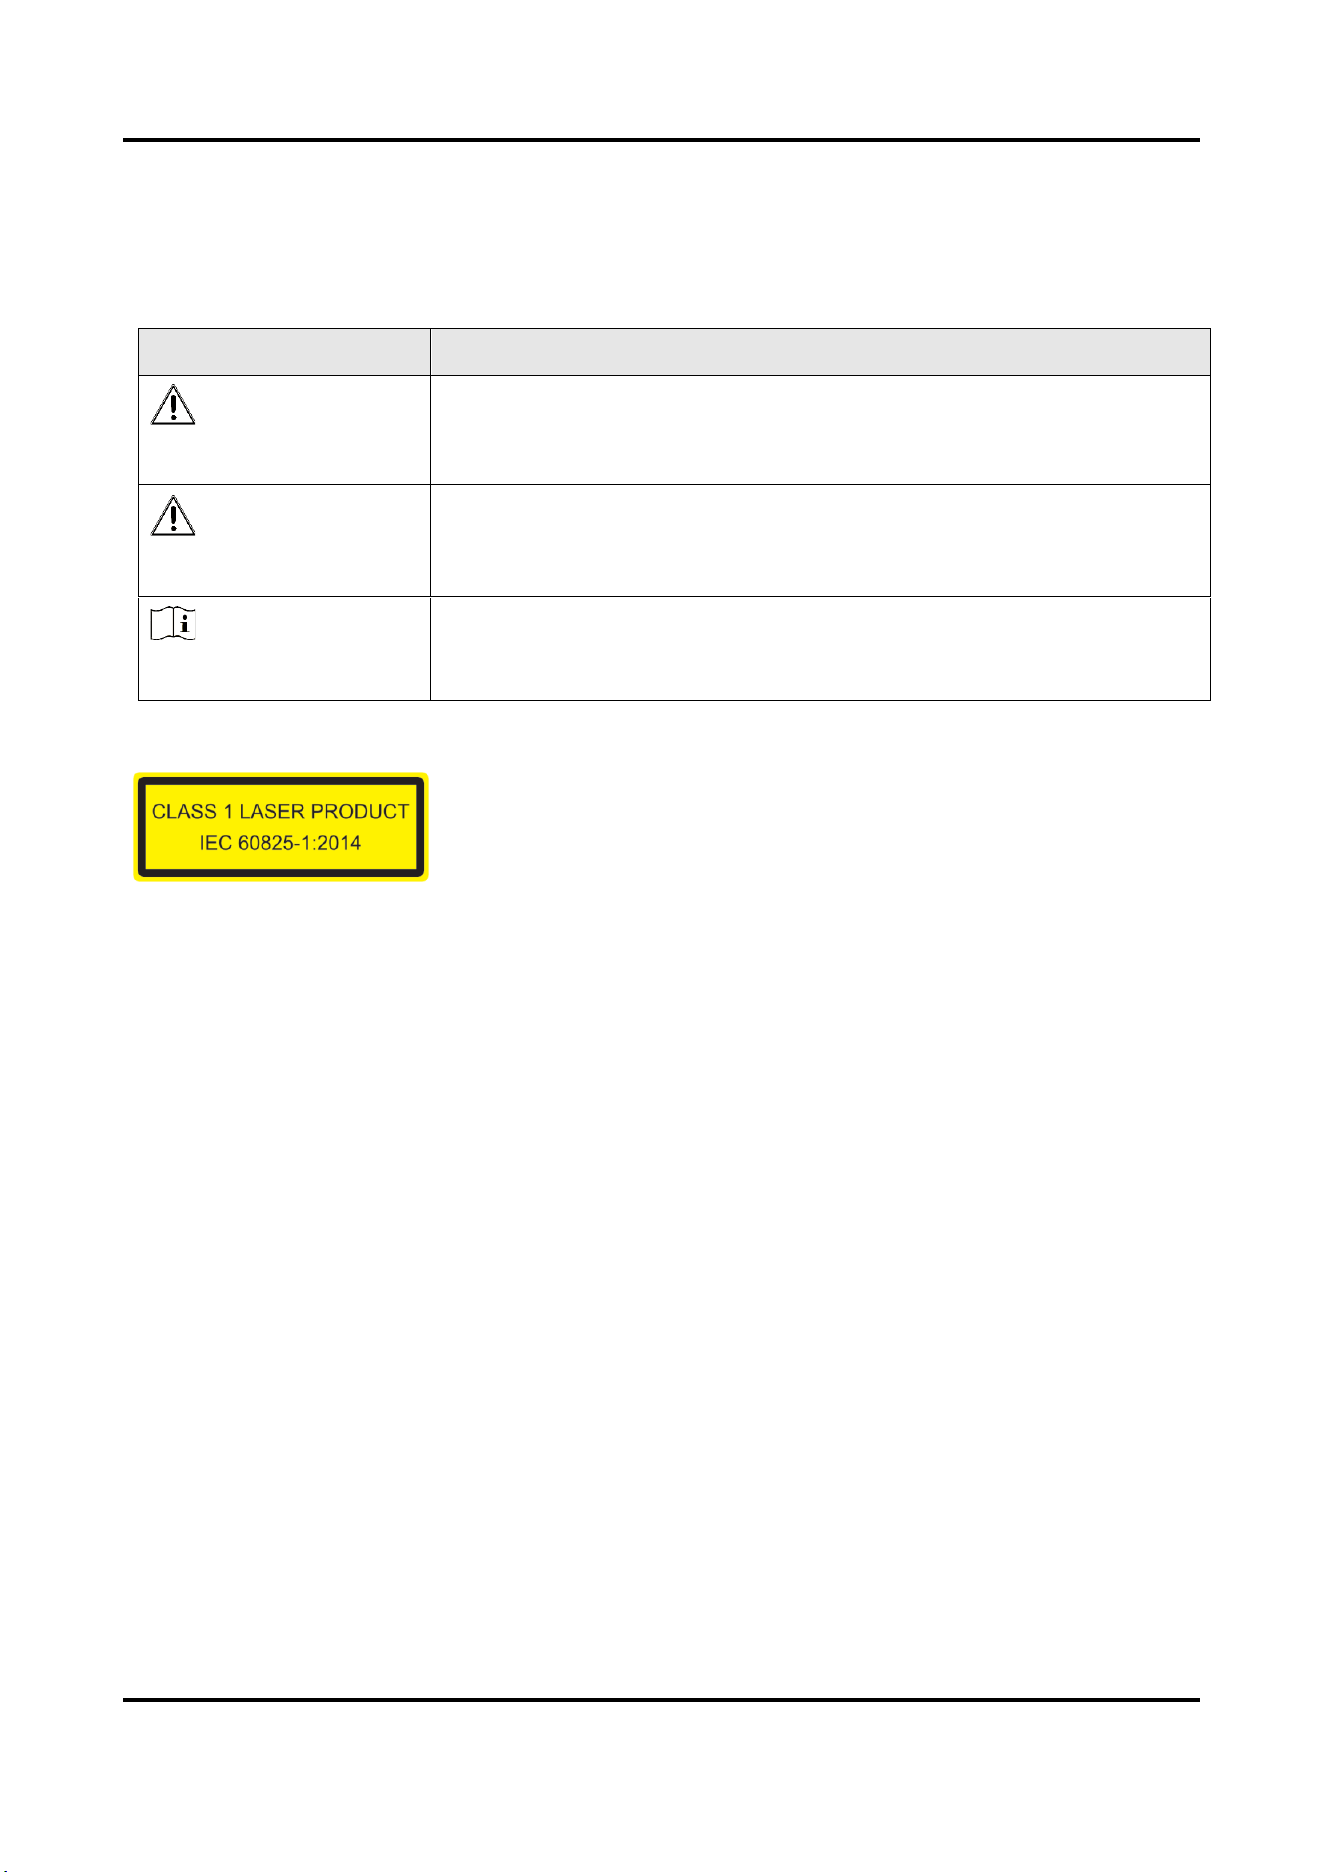
Safety Instruction
CLASS 1 LASER PRODUCT
The product meets the requirements of Class 1 laser products. Class 1 Laser products that are safe
during use, including long-term direct intrabeam viewing, even when exposure occurs while using
telescopic optics.

User Manual
iv
CONTENTS
Chapter 1 Device Activation
.................................................................. 1
1.1 Activate the Device via Local Client
..................................................... 1
1.2 Activate the Device via Browser
........................................................ 2
Chapter 2 Local Client Operation Instructions
..................................................... 8
2.1 Signal
............................................................................. 8
2.1.1 Parameter Settings
............................................................ 8
2.1.2 Real-Time Generation
.......................................................... 8
2.1.3 Data Saving and Playback
....................................................... 9
2.2 Analysis
.......................................................................... 10
2.2.1 Waterfall Plot
............................................................... 10
2.2.2 Spectrum
.................................................................. 11
2.2.2 Spatial Intensity Map
......................................................... 12
2.3 Search alarm information.
........................................................... 13
2.4 Unit Management
.................................................................. 14
2.4.1 Add Unit
................................................................... 15
2.4.2 Edit Unit
................................................................... 15
2.4.3 Delete Unit
................................................................. 16
2.5 Sensitivity Management
............................................................. 16
2.6 System Settings
.................................................................... 17
2.7 Help
............................................................................. 17
Chapter 3 Web Client Operation Instructions
..................................................... 8
3.1 Alarm Record Display
................................................................ 8
3.1.1 Map Configuration
............................................................ 9
3.1.2 Function
................................................................... 11
3.2 Alarm Record
..................................................................... 14
3.2.1 Alarm Statistics
.............................................................. 14
3.2.2 Historical Alarm Record
....................................................... 17
3.3 Configuration
..................................................................... 17
3.3.1 System
.................................................................... 17
3.3.2 Network
................................................................... 20
3.3.3 Optical Fiber Monitoring Settings
................................................ 21
3.3.4 Upload Event Report
......................................................... 24
3.4 Maintenance and Security
........................................................... 25
3.4.1 Device Status
............................................................... 25
3.4.2 Fiber Monitoring
............................................................. 25
3.4.3 Restart
.................................................................... 28
3.4.4 Upgrade
................................................................... 29
3.4.5 Backup and Reset
............................................................ 29
3.4.6 Search and Manage Log
....................................................... 30
3.4.7 Security Audit Log
............................................................ 30
3.4.8 Device Debugging
............................................................ 30

User Manual
1
Chapter 1 Device Activation
To protect the security and privacy of the user account and data, you should set a login password to activate the
device when access the device via network.
Note
Refer to the user manual of the software client for the detailed information about the client software activation.
1.1 Activate the Device via Local Client
Before You Start
Connect the device to the display screen, keyboard, and mouse.
Power on the device.
Steps
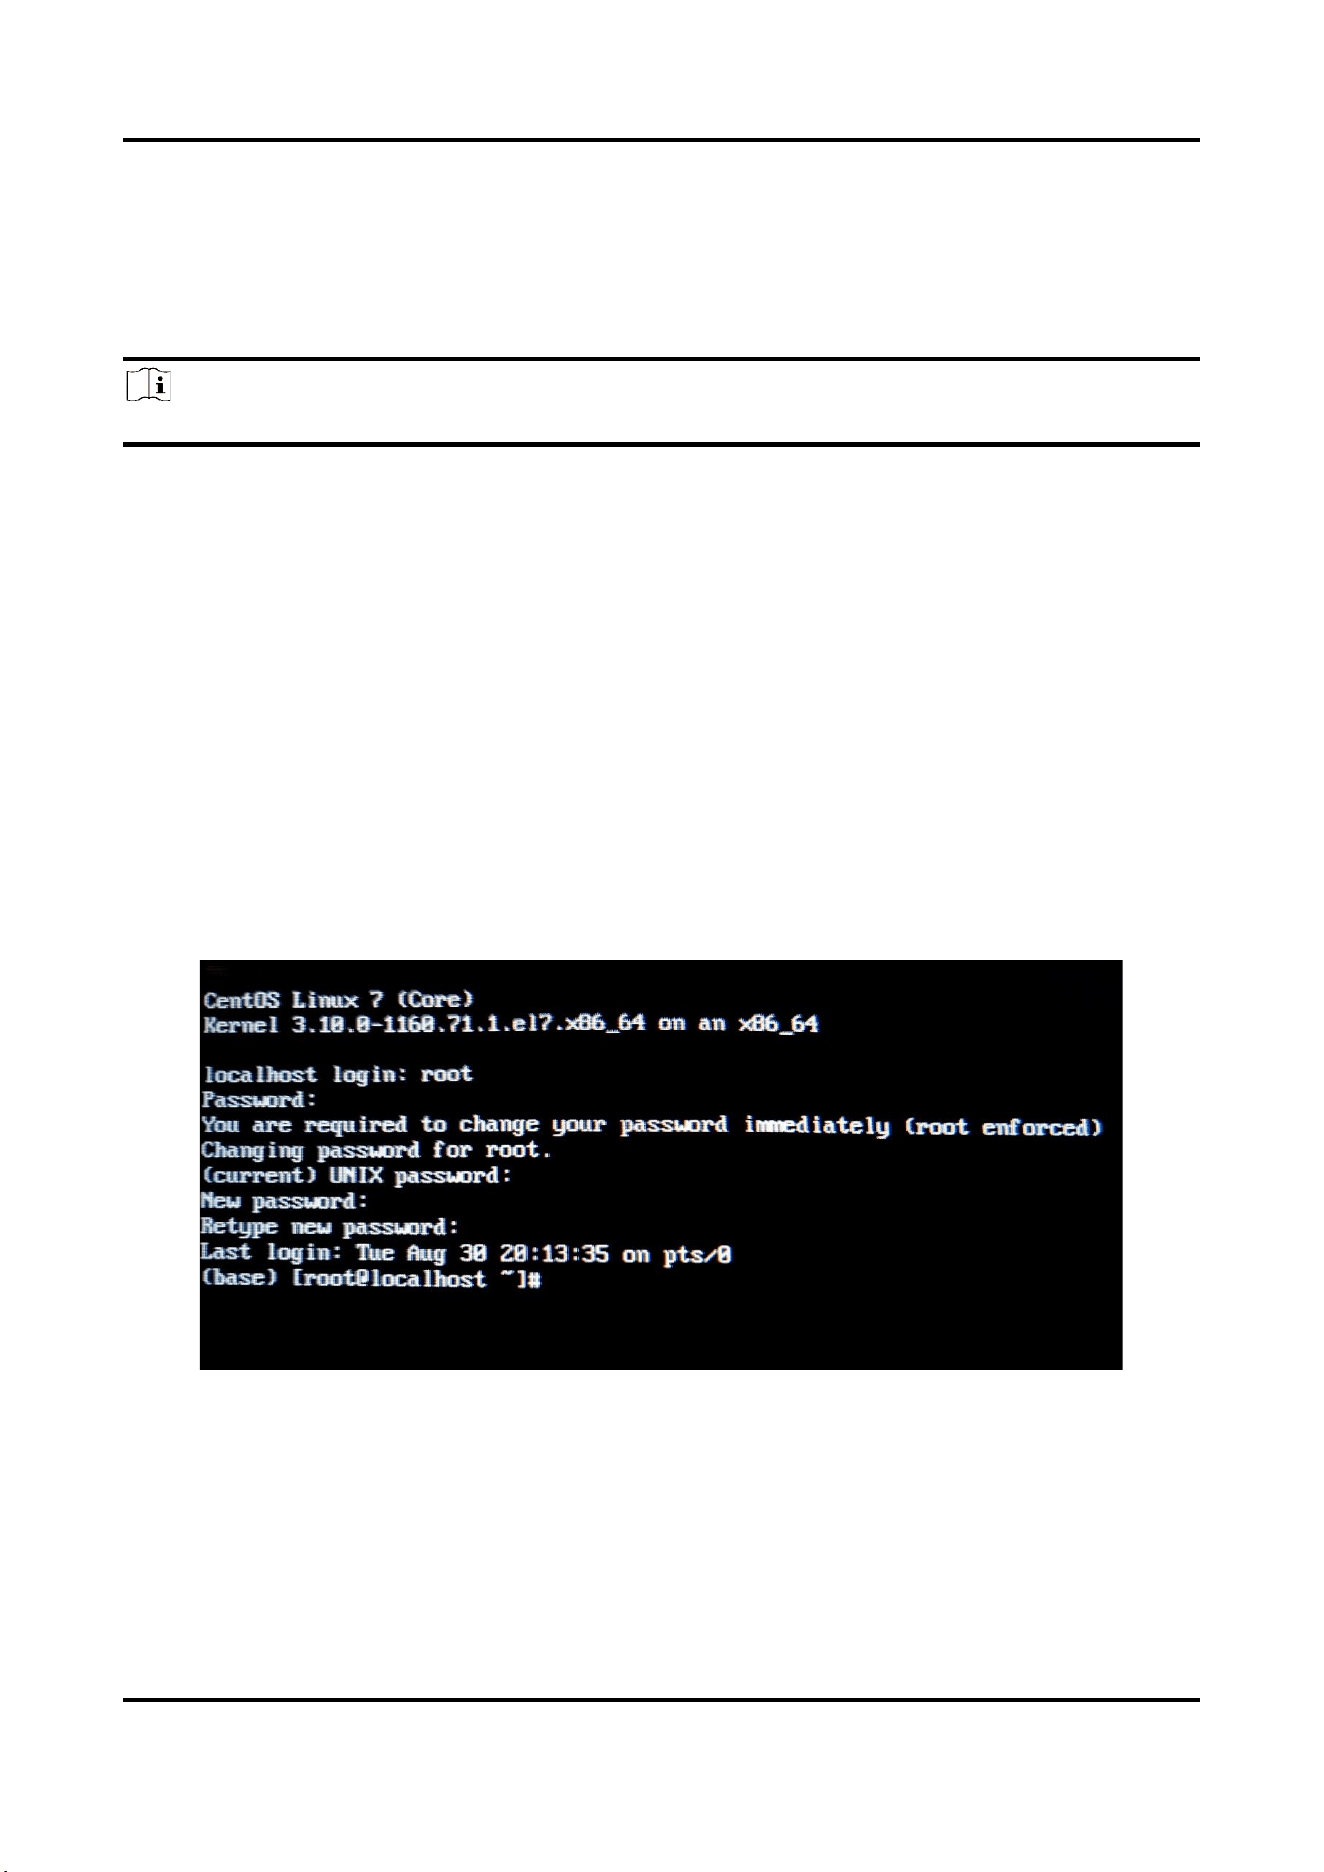
1. Log in to the root account and change the password when the device starts up for the first time.
1) Enter root after localhost login.
2) Enter hik12345 after Password and press Enter to confirm. Enter hik12345 again after (current) UMIX
password and press Enter to confirm.
3) Change the password when logging in for the first time. Enter New password as prompted and press
Enter to confirm. Enter Retype new password again and press Enter to confirm.
4) Enter systemctl set-default graphical.target, press Enter to go to the graphical interface, and restart the
device.
Figure 1-1 Logging in for the First Time
2. Run the client software.

User Manual
2
Figure 1-2 Local Client
3. The software automatically pops up an activation window when logging in for the first time.
The default administrator username for the device is admin. You need to input new password (admin
password) and confirm the password in the pop-up window.
Caution
We highly recommend you create a strong password of your own choosing (using a minimum of 8 characters,
including upper case letters, lower case letters, numbers, and special characters) in order to increase the
security of your product. And we recommend you reset your password regularly, especially in the high
security system, resetting the password monthly or weekly can better protect your product.
4. Click OK.
1.2 Activate the Device via Browser
You can access and activate the device via the browser.
Steps
1. Connect the device to the PC using the network cables.
2. Change the IP address of the PC and device to the same segment.
Note
The default IP address of the device is 192.0.0.64. You can set the IP address of the PC from 192.0.0.2 to
192.0.0.254 (except 192.0.0.64). For example, you can set the IP address of the PC to 192.0.0.100.
3. Input 192.0.0.64 in the browser.
4. Set device activation password.
Caution
We highly recommend you create a strong password of your own choosing (using a minimum of 8 characters,
including at least three of the following categories: upper case letters, lower case letters, numbers, and
special characters) in order to increase the security of your product. And we recommend you reset your
password regularly, especially in the high security system, resetting the password monthly or weekly can
better protect your product.
5. Click OK.
6. Input the activation password to log in to the device.
7. Optional: Go to Configuration → Network → Network Settings → TCP/IP to change the IP address of the
device to the same segment of your network.
User Manual
8
Chapter 2 Local Client Operation Instructions
Local client is mainly used for debugging.
Click Log In in the upper-left corner, enter administrator user name and password, and click OK to log in to
client.
You can view the interface without logging in to local client, but cannot edit the parameters. Logging in is not
recommended for normal user. Please contact professionals to edit parameters.
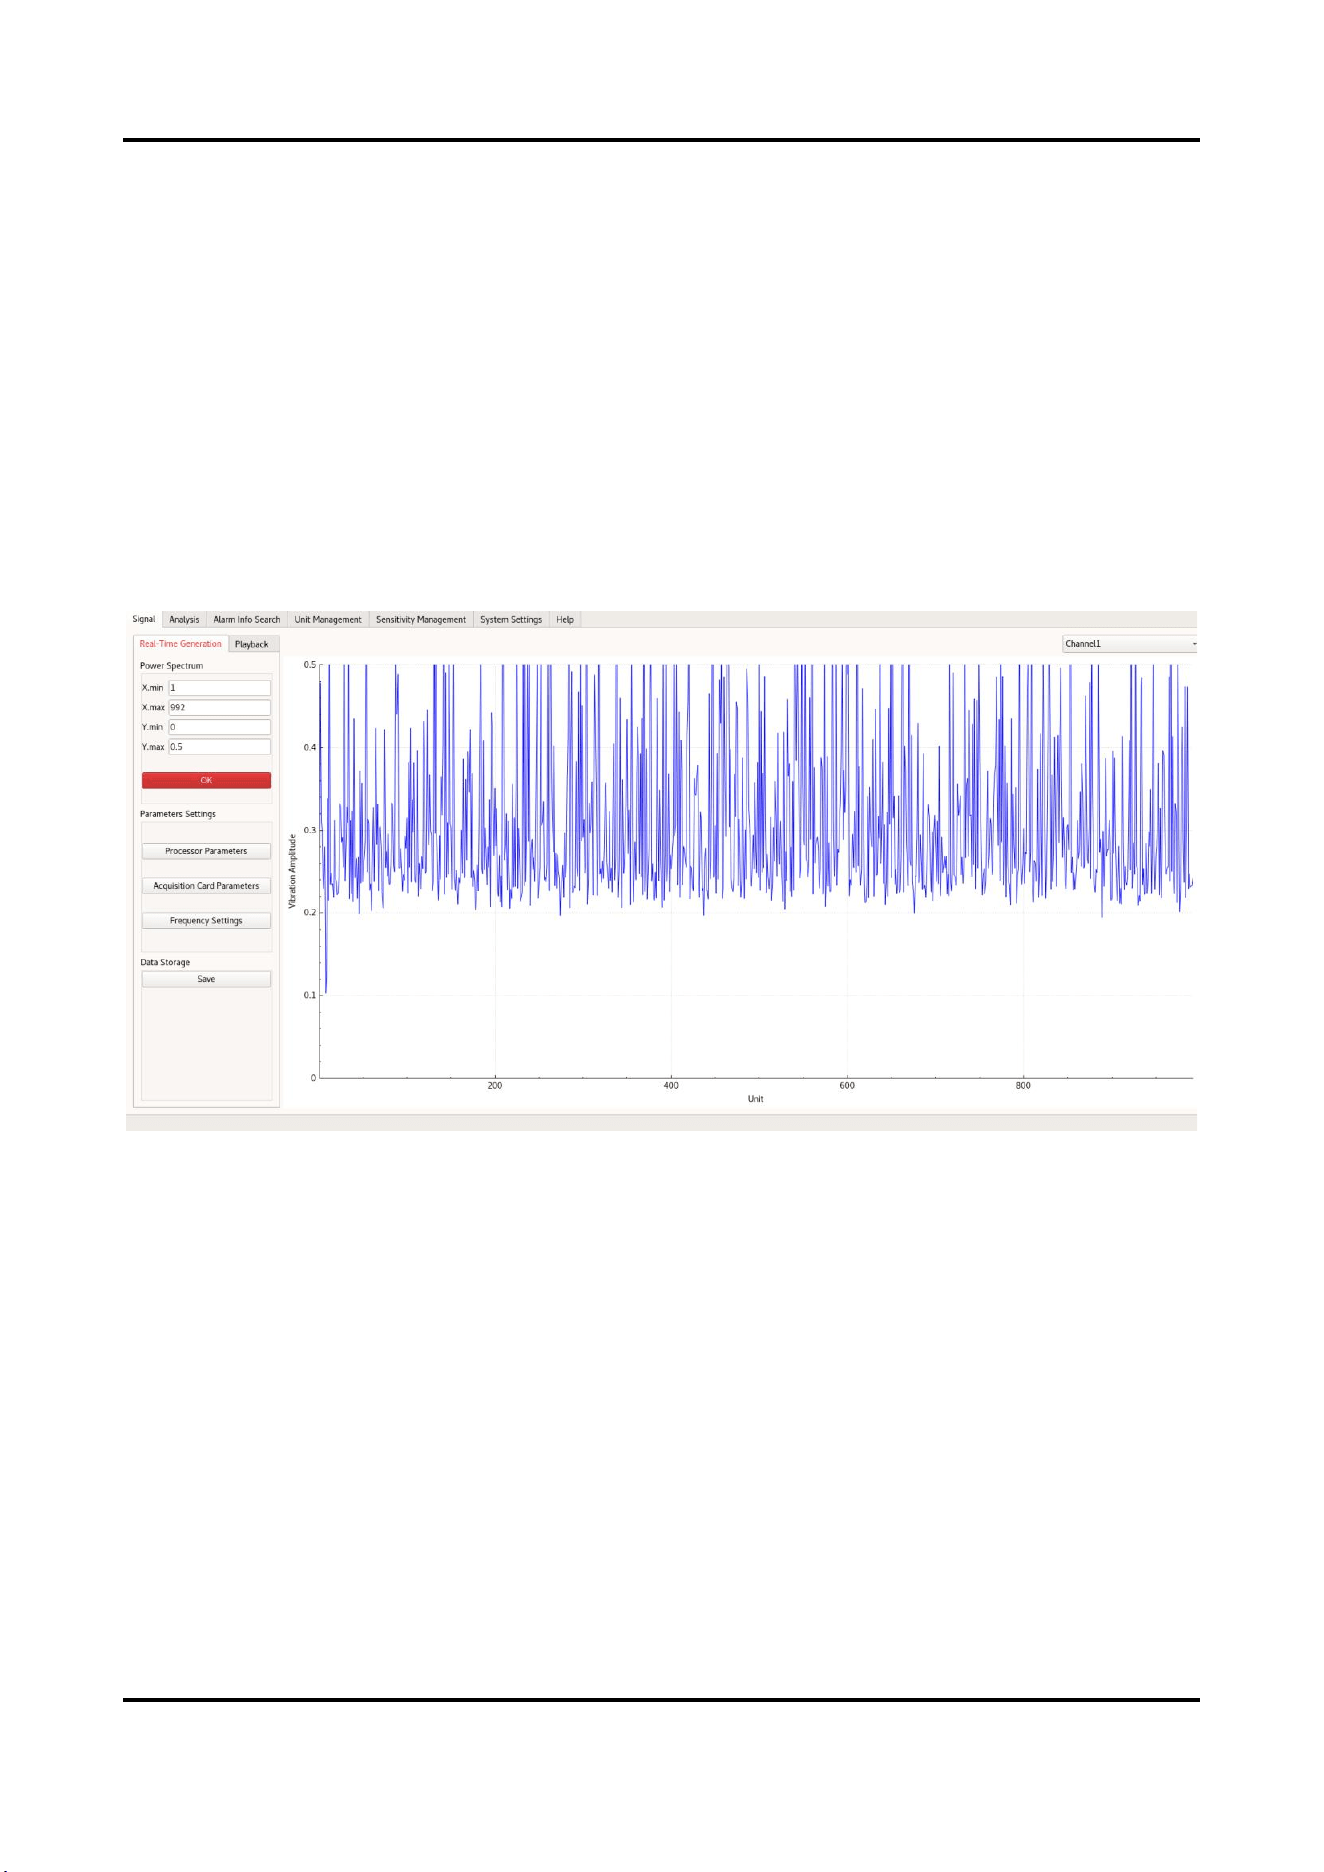
2.1 Signal
Click Signal to enter the interface.
Figure 2-1 Signal Interface
2.1.1 Parameter Settings
The photoelectric parameters, acquisition card parameters and frequency settings are usually debugged and set
by technical support personnel, and are not recommended for change.
2.1.2 Real-Time Generation
Click OK in real-time generation. The right-side chart area starts to generate real-time signal charts (slab chart
and spatial intensity chart). Click Stop to stop generating.
The dual-channel device can switch between channel 1 and channel 2.
User Manual
9
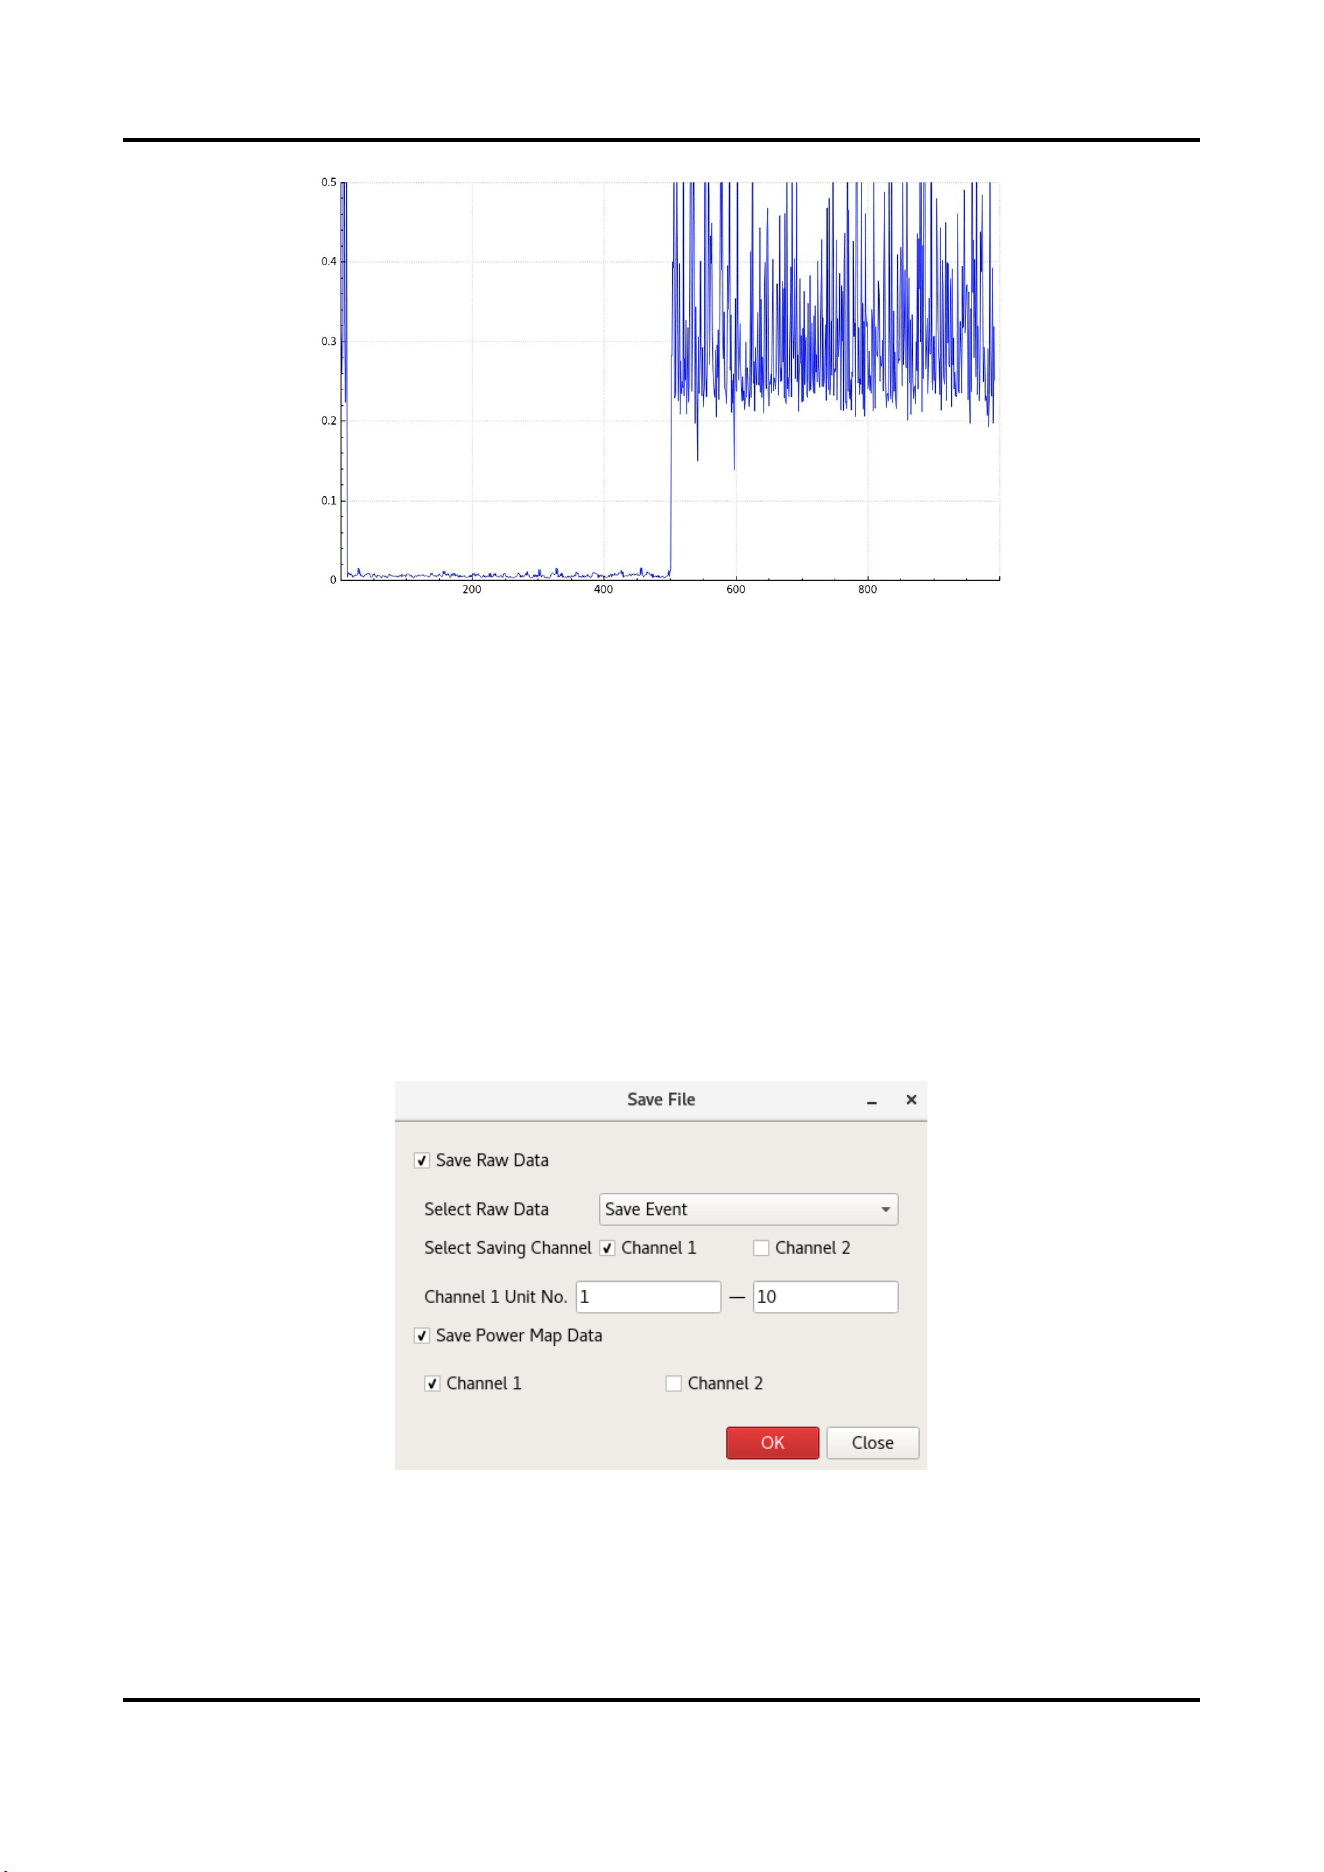
Figure 2-2 Vibration Amplitude
As shown in the above figure, the lower-level line segment on the left indicates that the signals of unit 1 to 500
are normal, and the bottom noise on the right indicates that units above 500 have no signal.
When there is vibration, the left line segment will fluctuate according to the vibration intensity.
X.min/X.max/Y.min/Y.max
Adjust the max. and min. value of X and Y axis, and press Enter to confirm.
2.1.3 Data Saving and Playback
Save data in a certain time period. You can read the power map data through playback.
Data Saving
1. Click Save in the Data Storage.
2. Select Save Raw Data and Save Power Map Data as needed in pop-up window.
Figure 2-3 Save File
Saving Type
Save Event: When alarms occur in the selected unit No. range, the system records alarm data of the
unit and the four units before and after it.

User Manual
10
Save Manually: The phase data in the selected unit No. range can be saved.
Saving Channel
Select the channel to save data.
Unit No.
The unit No. to save data cannot be 0.
Raw Data and Power Map Data
The power map data is a wave band graph generated in the graph. Only power map data can be played
back in playback. The raw data is only for professional analysis.
3. Click OK to save the raw data. Click OK in the Real-Time Generation window to generate power map data after
setting the condition.
4. When data saving needs to be ended:
To disable Save Raw Data, you can cancel the selected items.
To disable Save Power Map Data, you can cancel the selected item, click OK to close the window, or close
the client.
5. Set the path to save the file to local.
Playback
1. Go to Signal → Playback, and click Import.
2. Select Path and set Playback Rate (Milliseconds).
3. Click OK.
4. View data playback in playback interface.
2.2 Analysis
Click Analysis to enter the interface. View waterfall plot, spectrogram and spatial intensity map.
2.2.1 Waterfall Plot
Click Start to generate spectrogram, and click Stop to stop generating.
Two-channel device can switch channel 1 or channel 2.
User Manual
11
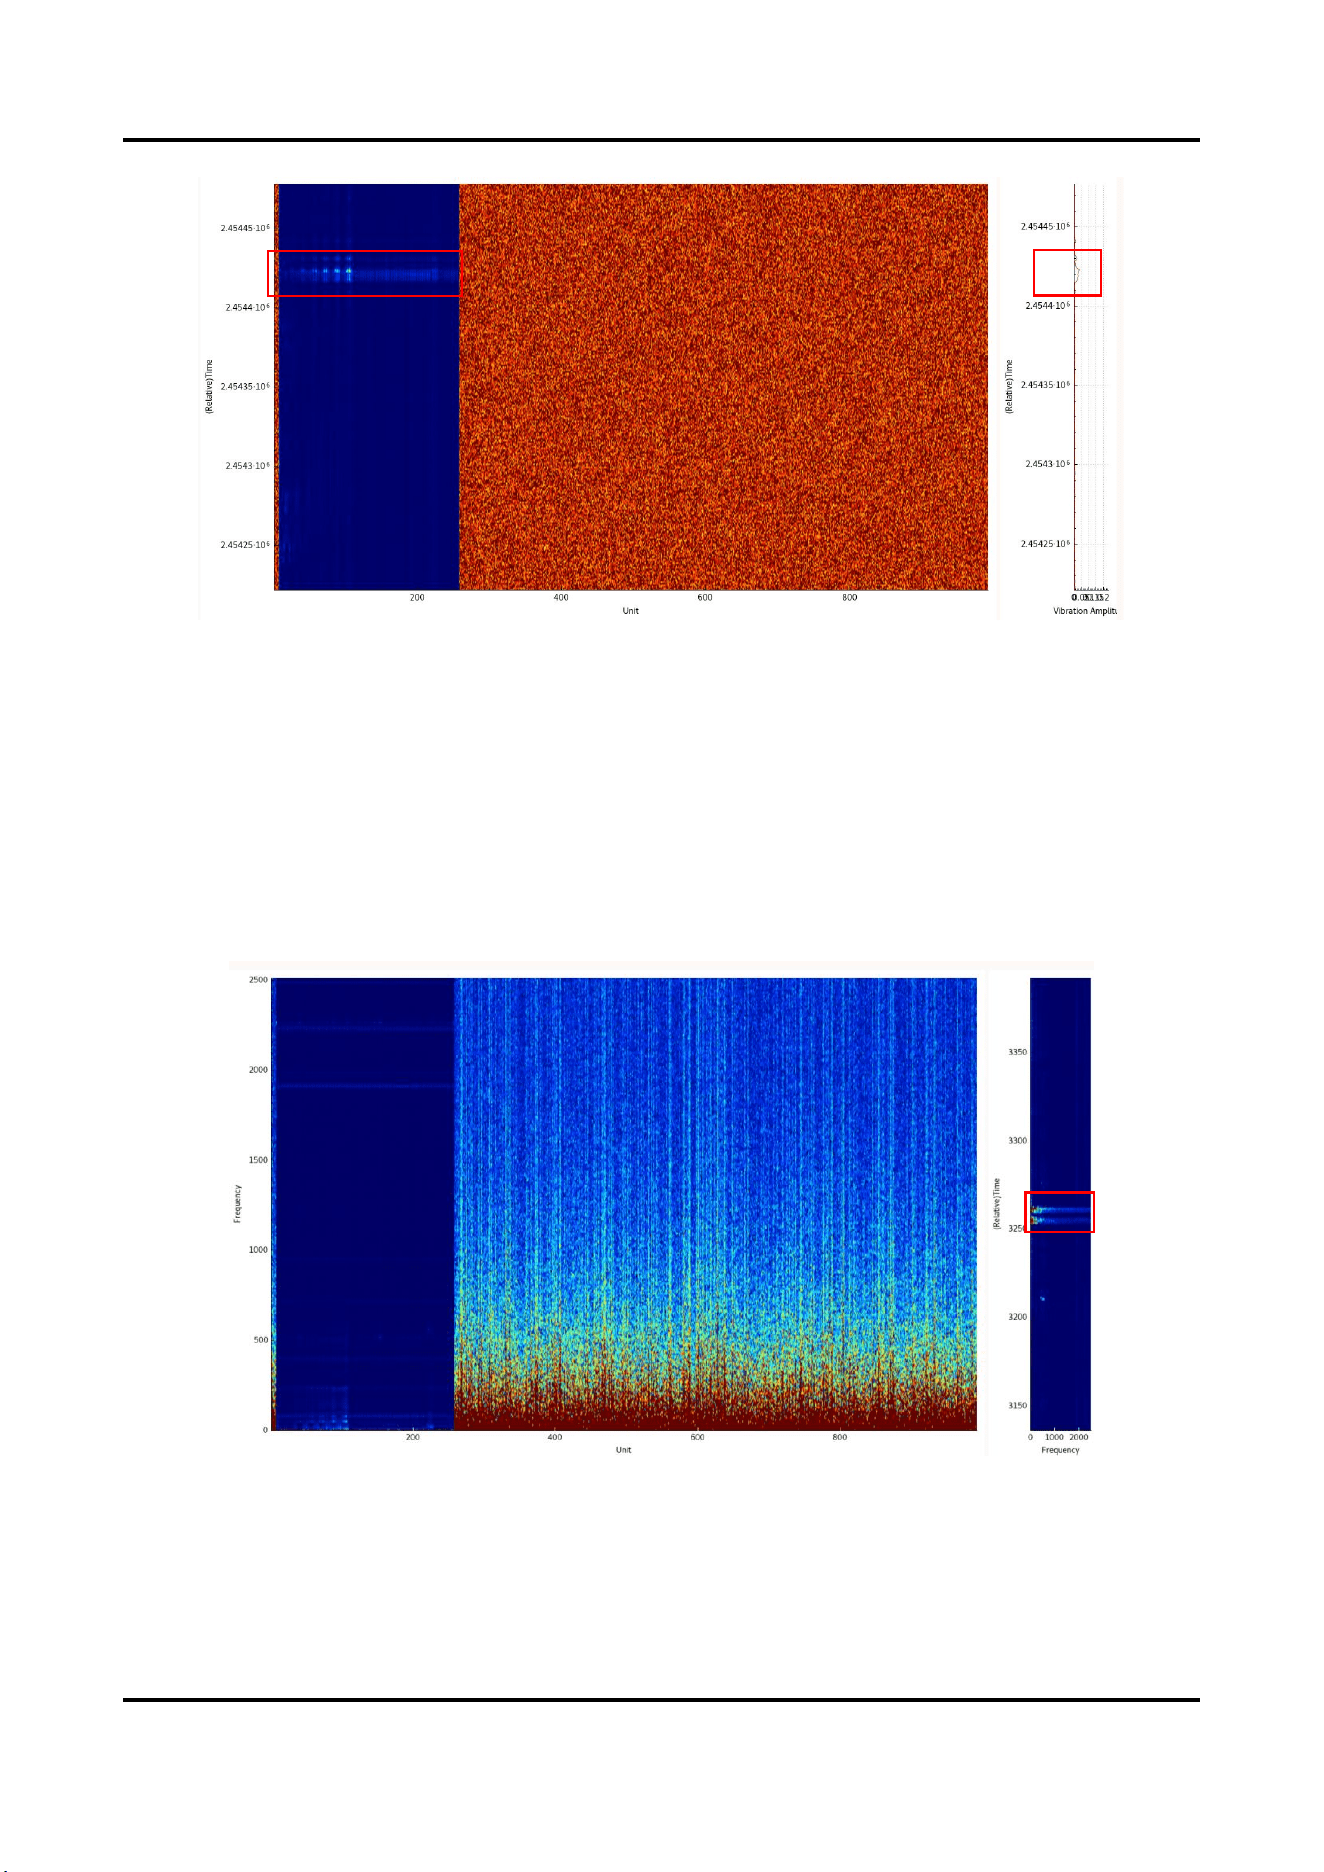
Figure 2-4 Waterfall Plot (With Vibration)
The vertical axis of the left picture is relative time, and the horizontal axis is unit No.
The vertical axis of the right picture is relative time, and the horizontal axis is vibration amplitude.
As shown in the above picture, the unit 1 to 250 on the left have signals and the signals are normal, and the
bottom noise on the right indicates that units above 250 have no signals.
2.2.2 Spectrum
Click Start to generate spectrogram, and click Stop to stop generating.
Two-channel device can switch channel 1 or channel 2.
Figure 2-5 Spectrogram (With Vibration)
With Signal
&Vibration
Bottom Nosie
No Signal
Vibration
Vibration
Vibration
User Manual
12
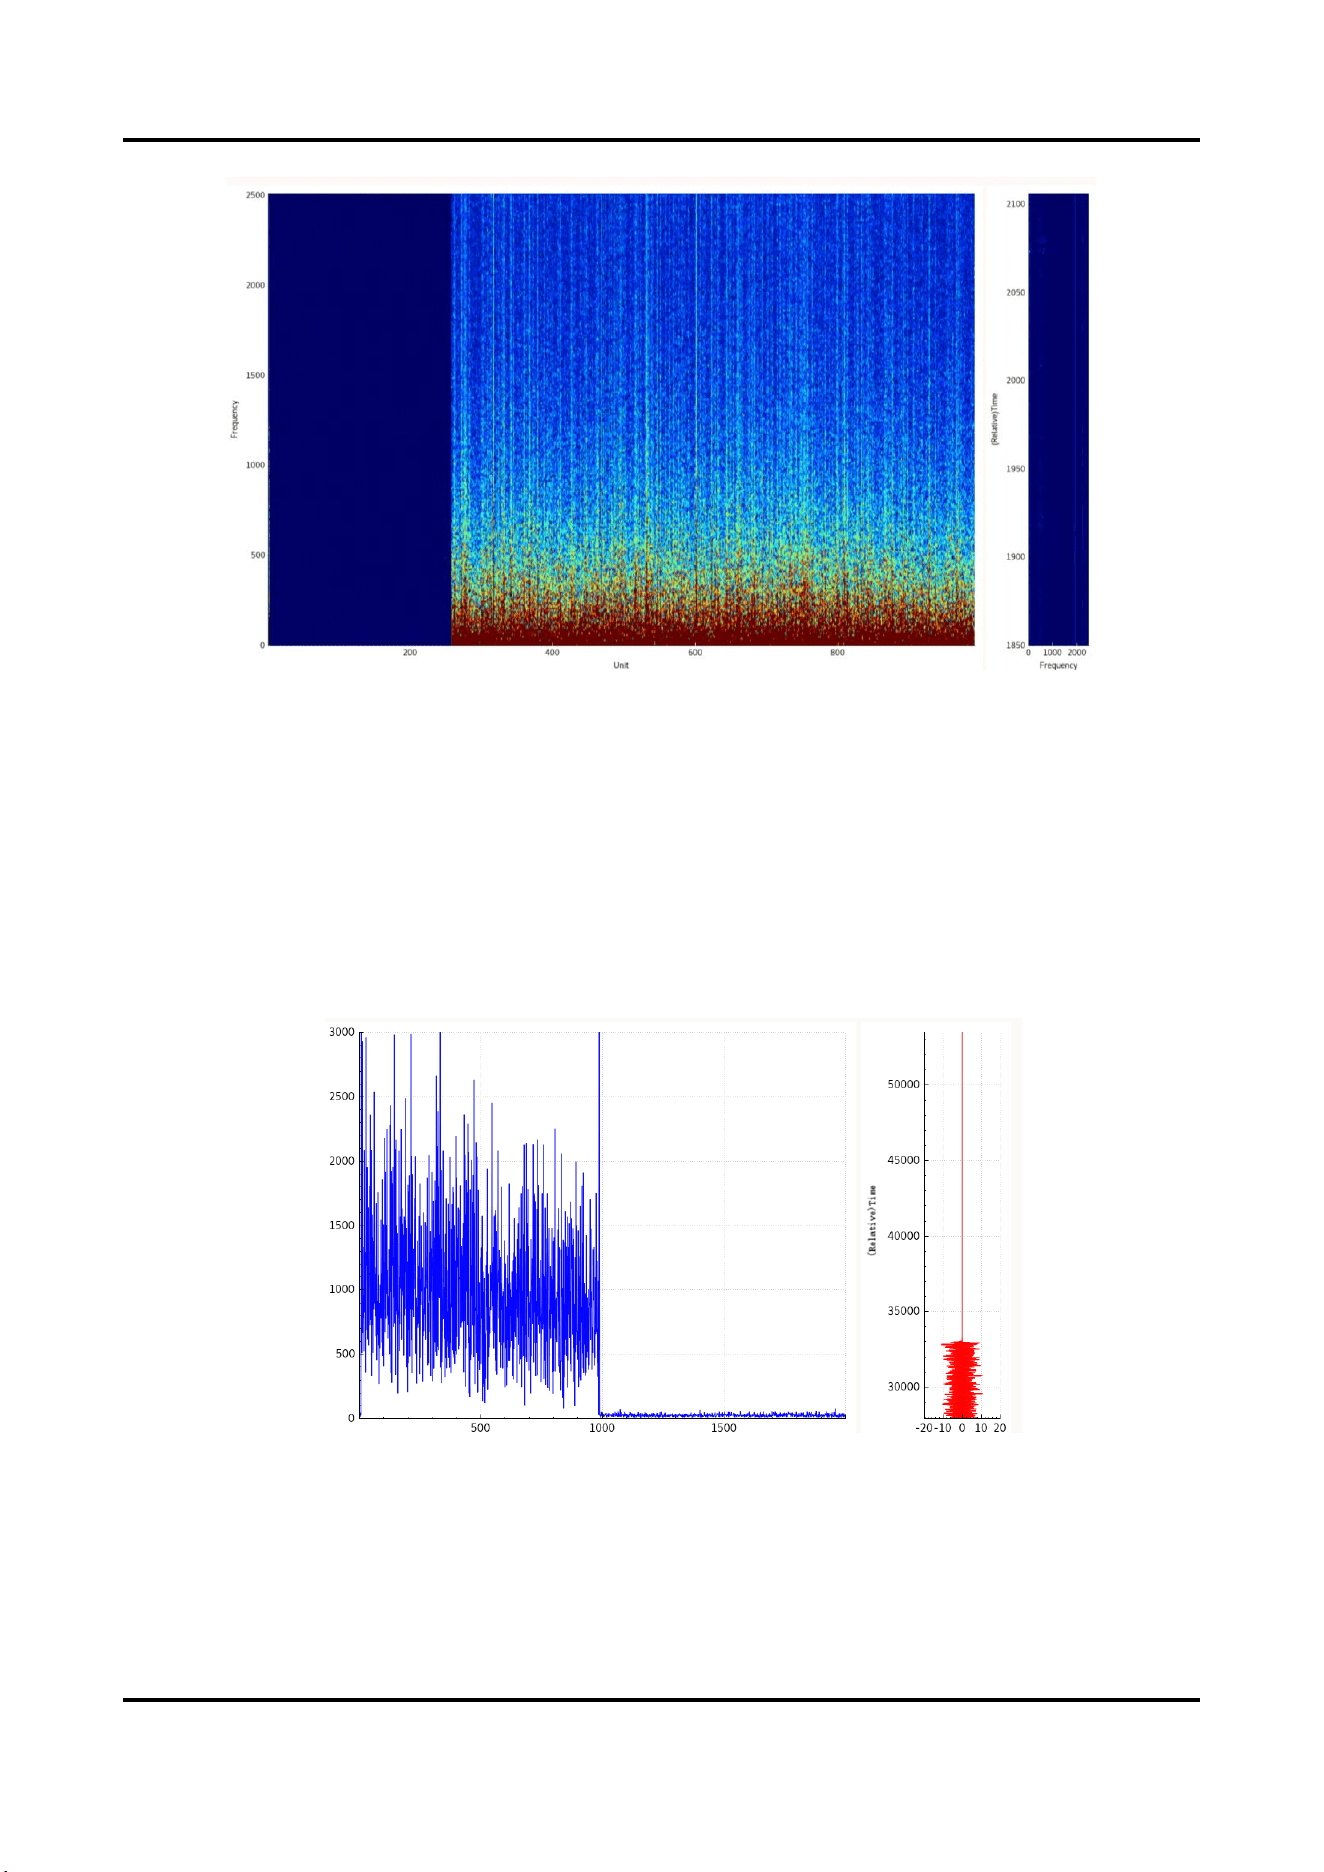
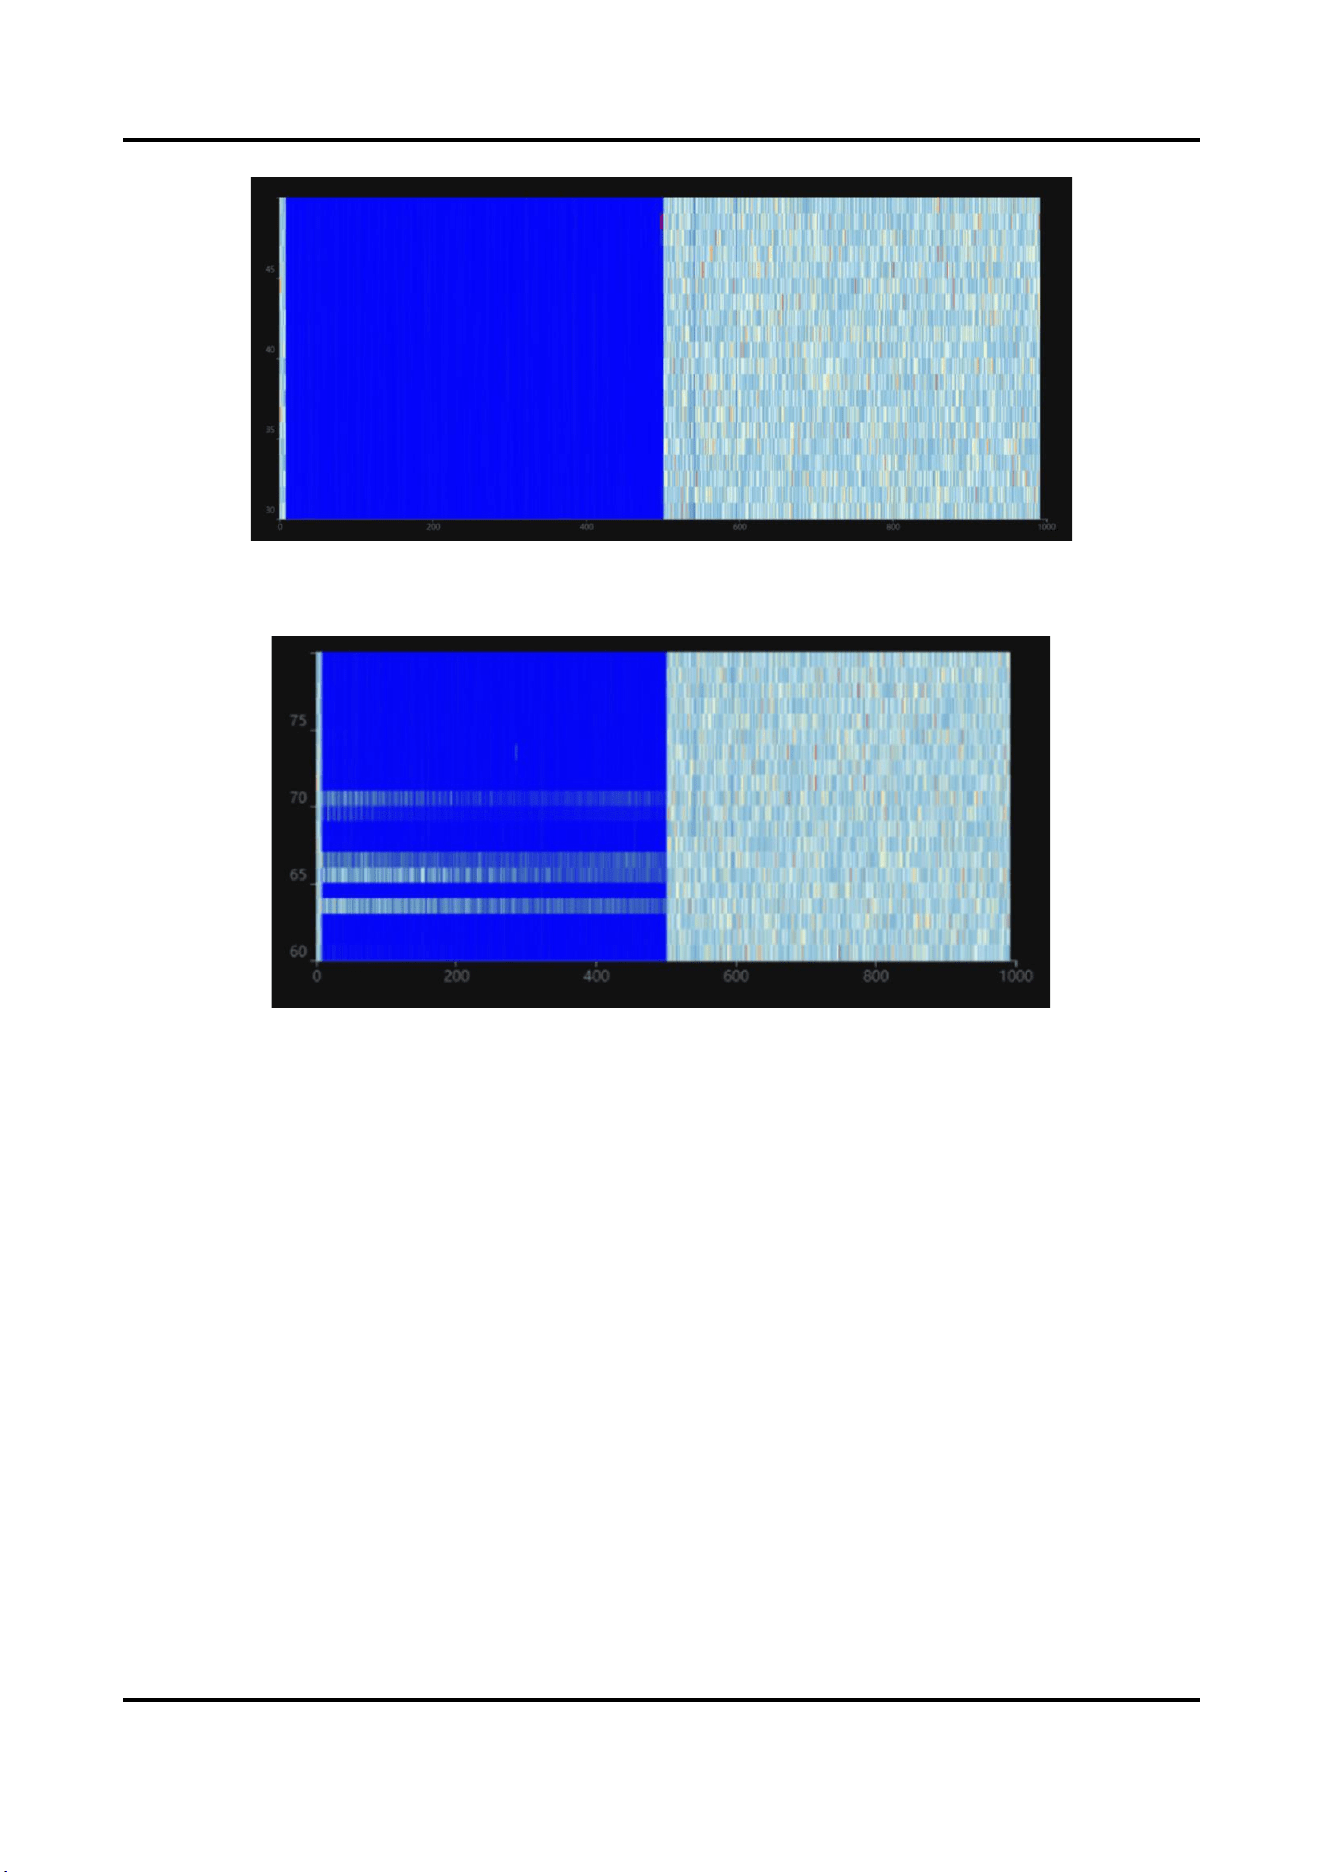
Figure 2-6 Spectrogram (No Vibration)
The vertical axis of the left picture is frequency, and the horizontal axis is unit No.
The vertical axis of the right picture is relative time, and the horizontal axis is frequency.
As shown in the above picture, the unit 1 to 250 on the left have signals and the signals are normal, and the
bottom noise on the right indicates that units above 250 have no signals.
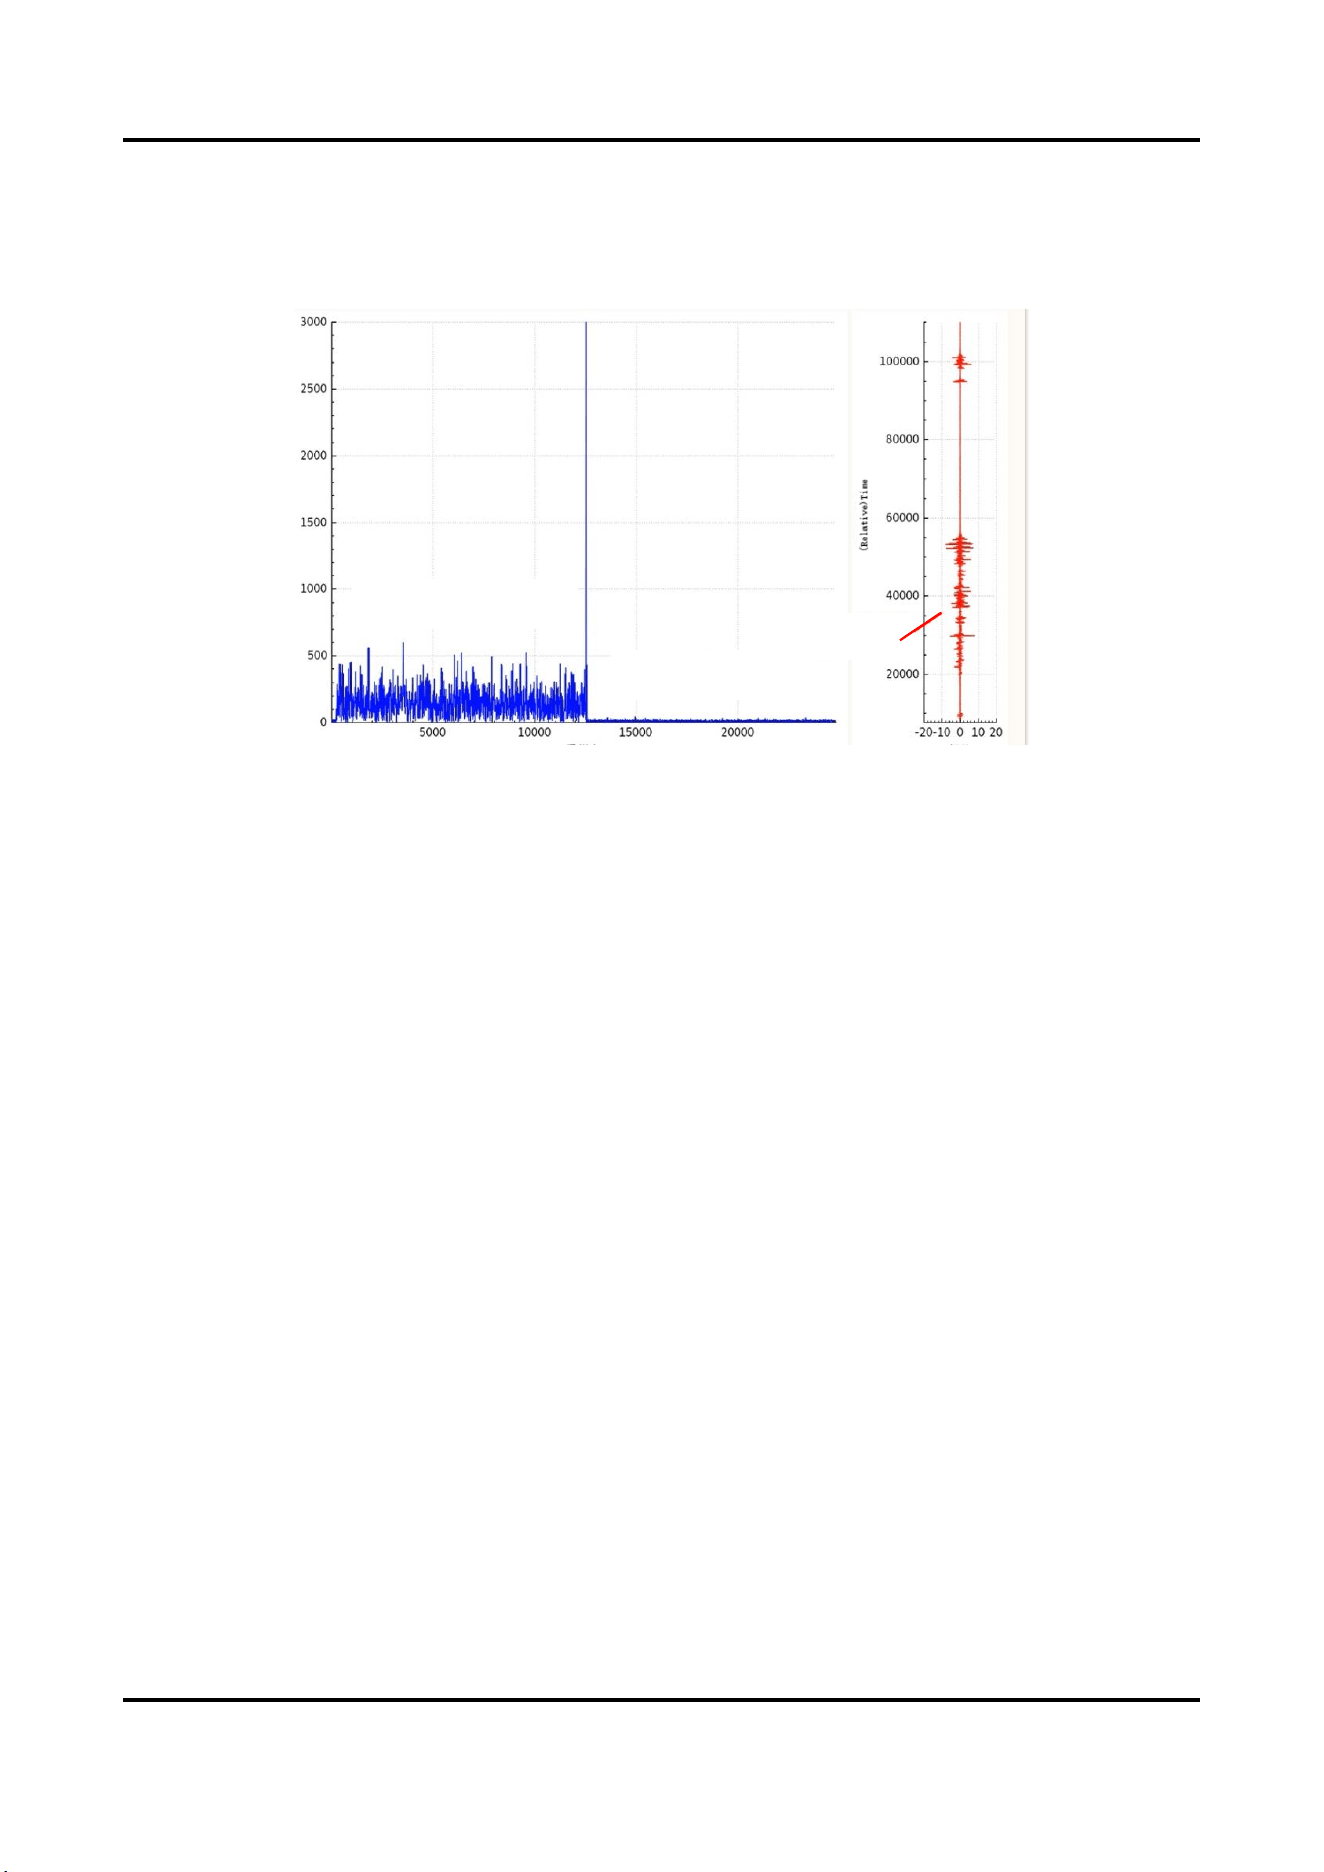
2.2.2 Spatial Intensity Map
Click Start to generate space intensity map. Click Stop to stop generating.
Two-channel device can switch channel 1 or channel 2.
Figure 2-7 Spatial Intensity Map (Normal Signal)
The vertical axis of the left picture is the vibration amplitude, and the horizontal axis is the unit. The larger the
vibration amplitude, the stronger the signal.
The vertical axis of the right picture is relative time, and the horizontal axis is phase.
As shown in the above picture, the unit 1 to 1000 on the left have signals and the signals are normal, and the
With
Signal
No
Signal
With Signal
No Vibration
Bottom Nosie
No Signal
User Manual
13
units above 1000 have no signals.
The space intensity map is mainly used to display signal strength. When there is vibration, the left map
fluctuates slightly. The initial signal peak value of the device should be around unit 2500. If it is lower, the signal
is weak.
Figure 2-8 Spatial Intensity (Weak Signal)
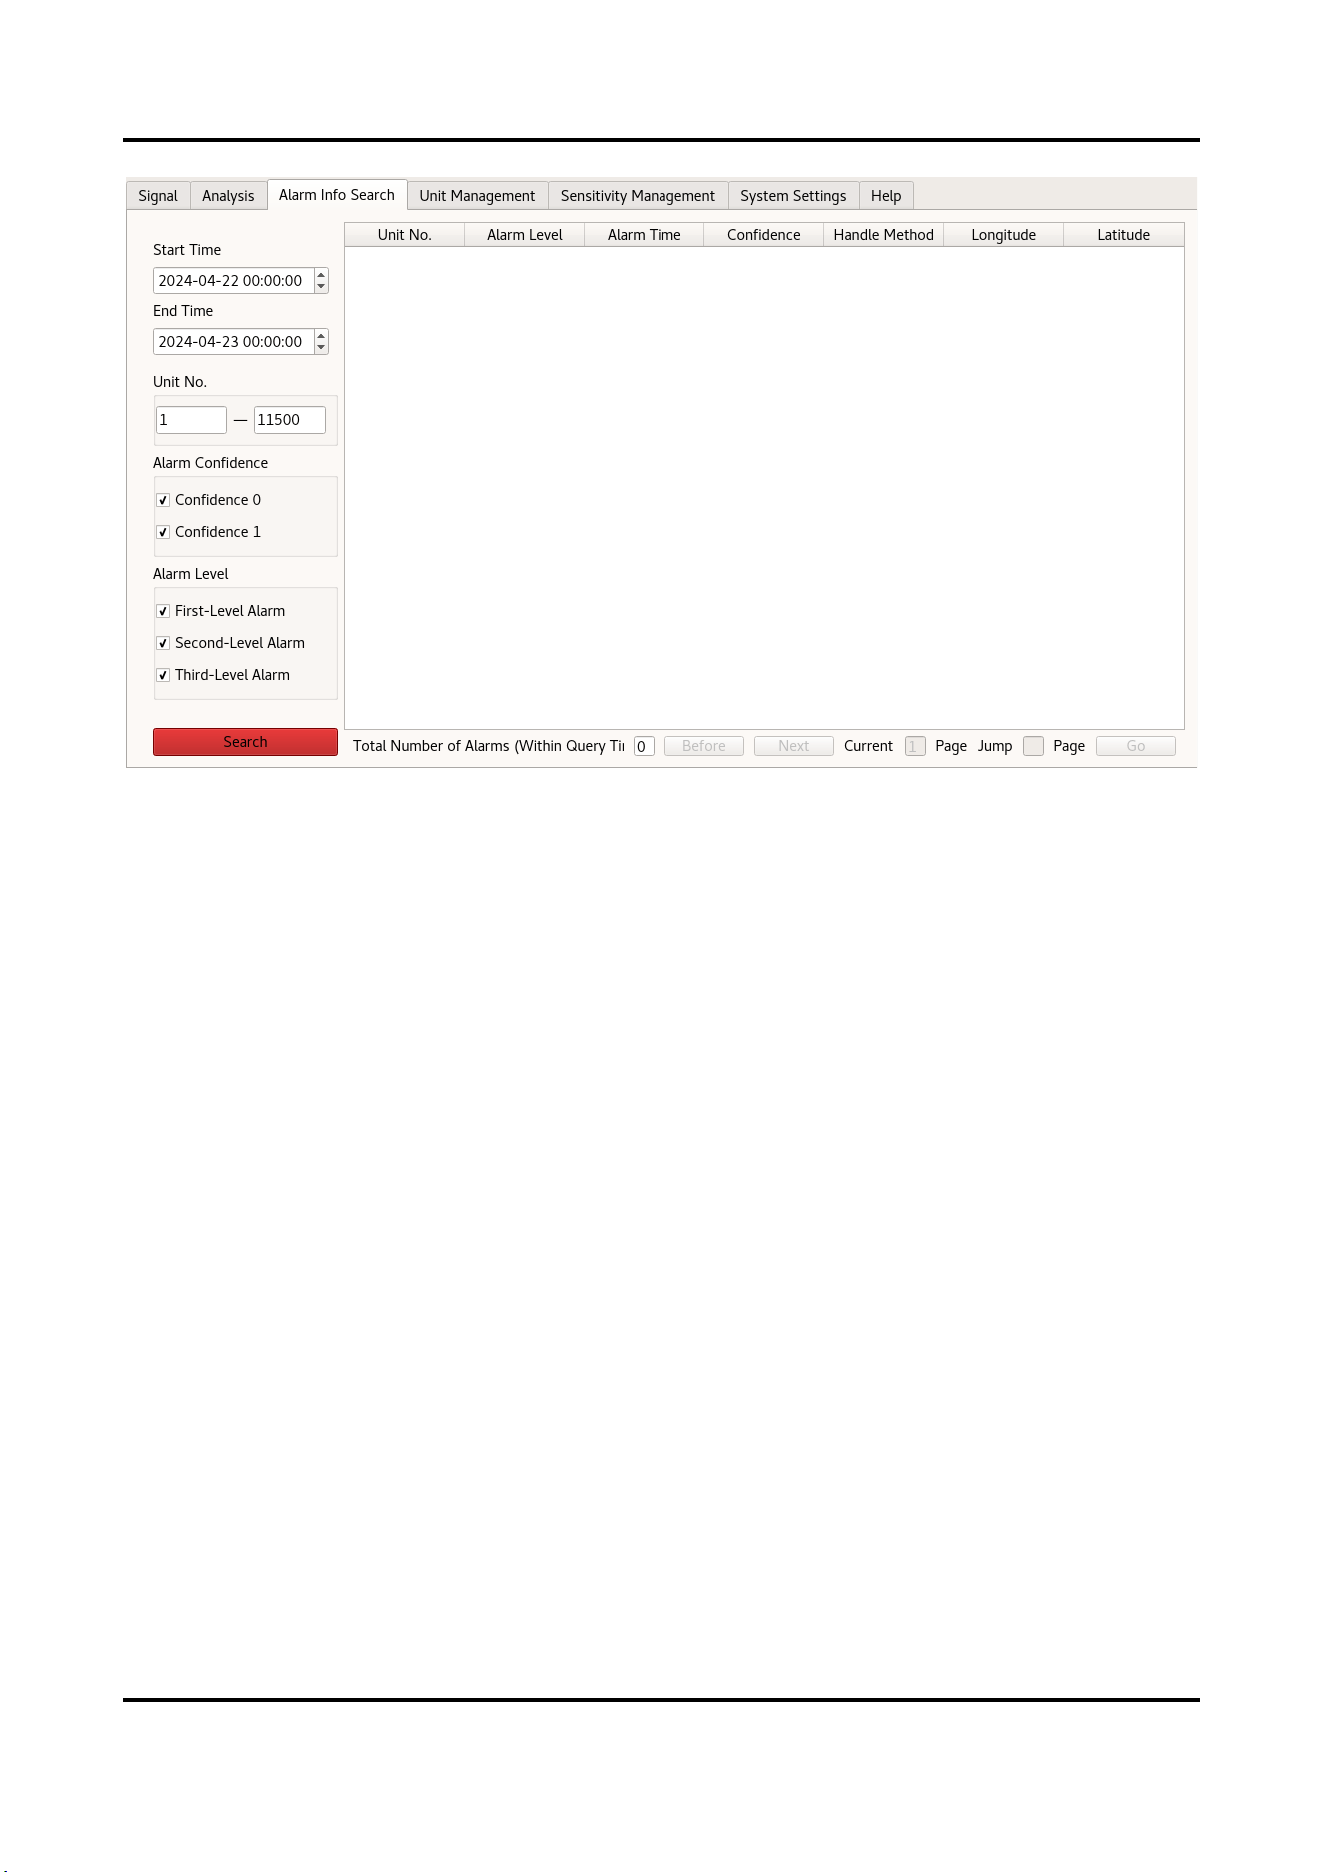
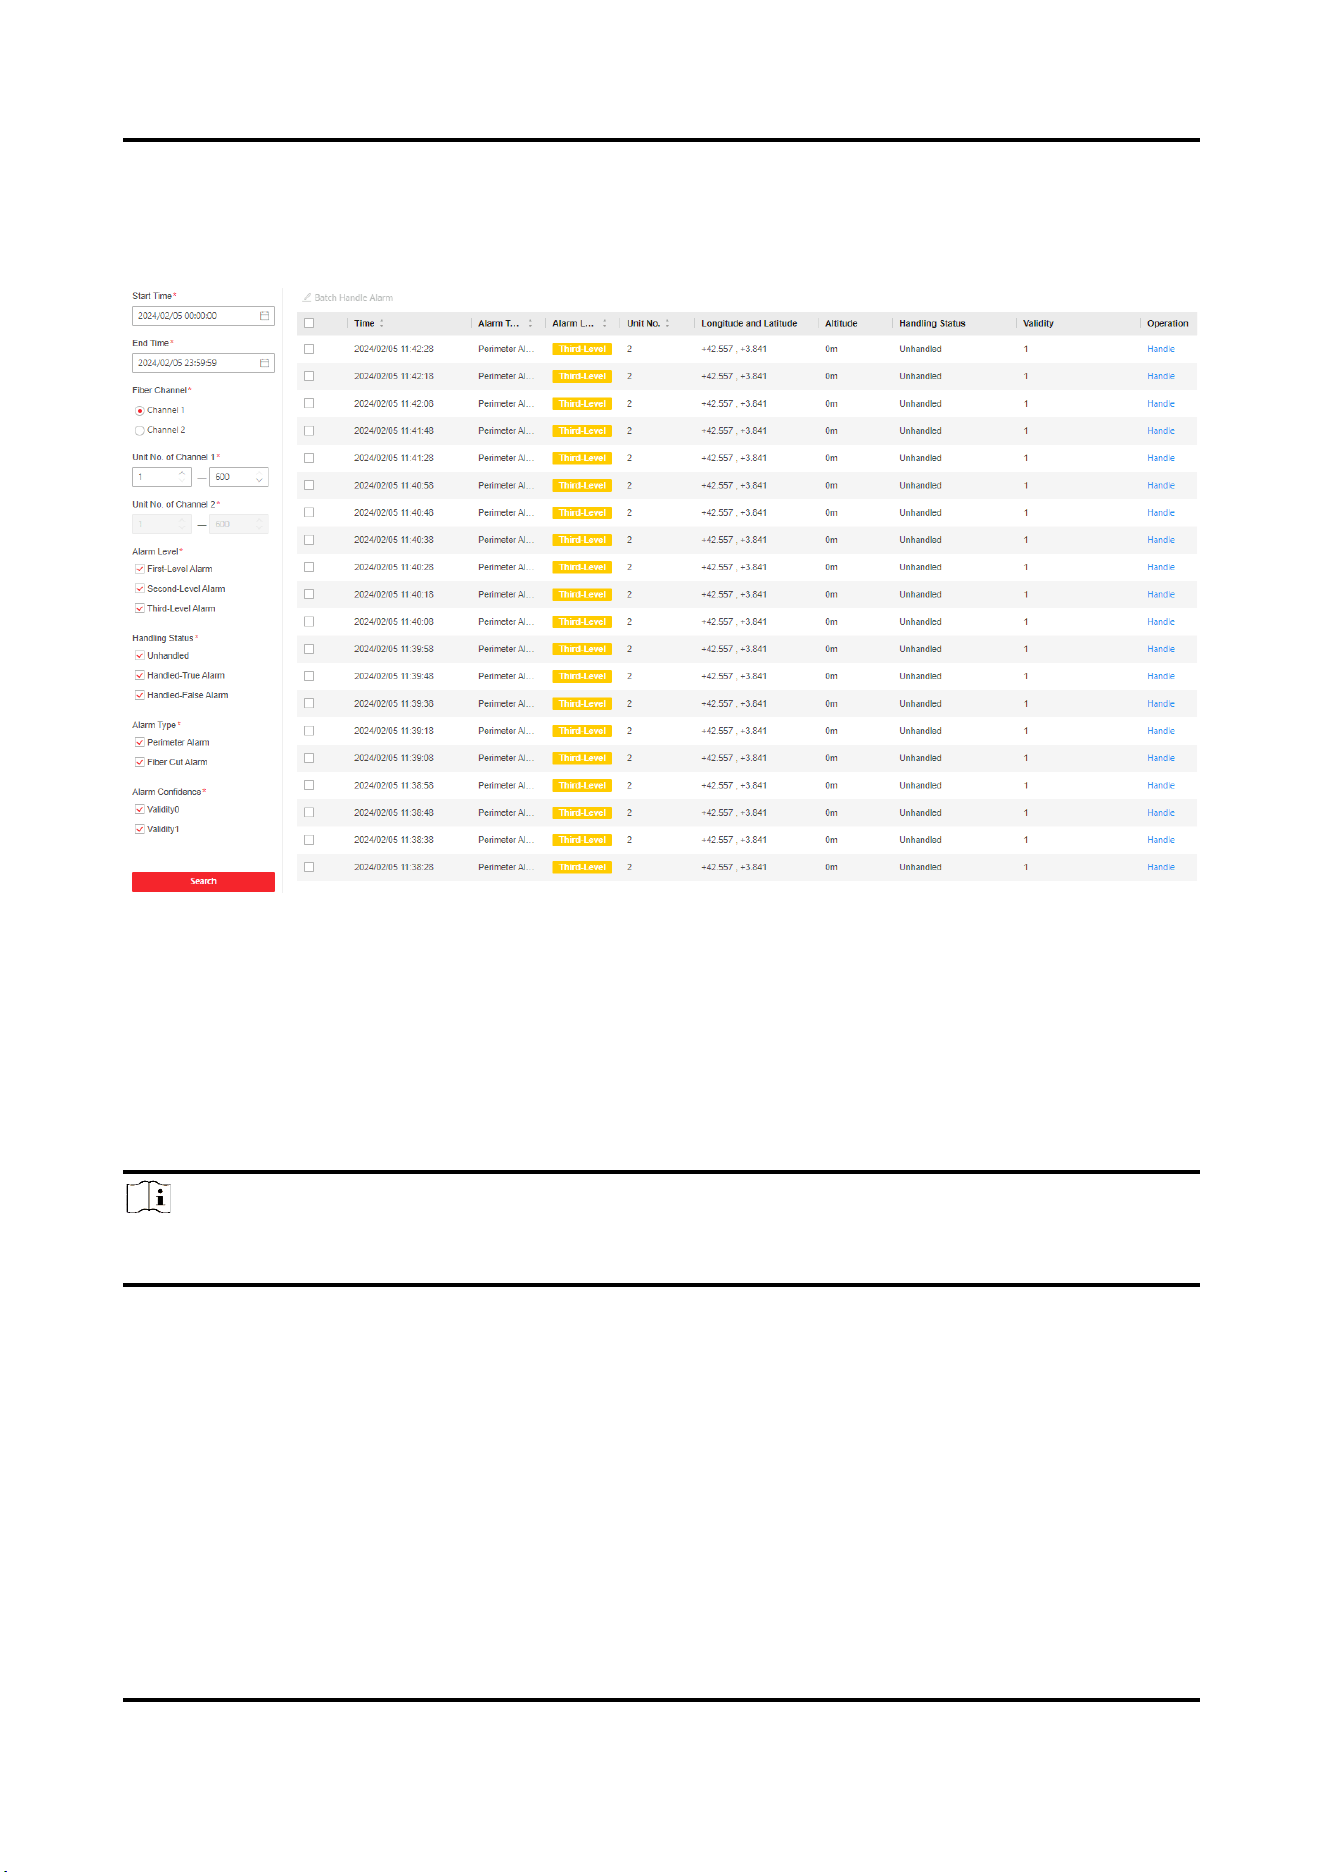
2.3 Search alarm information.
Click Alarm Info Search to enter the interface.
After setting the condition, click Search.
Alarm Confidence
After enabling AI switch in unit management, the system will automatically judge if the alarm is true or
false. Validity1 indicates that the alarm event is more likely to be true. Validity0 indicates that the alarm
event is more likely to be false.
With Signal
Vibration
No Signal
User Manual
14
Figure 2-9 Search Alarm Information
The unit No. of channel 1 shows the original unit No.
If the device is the dual-channel device, the unit No. of channel 2 shows 10000 + original unit No. For example,
channel 1 unit No. 502 is shown as 502, and channel 2 unit No. 502 is shown as 10502.
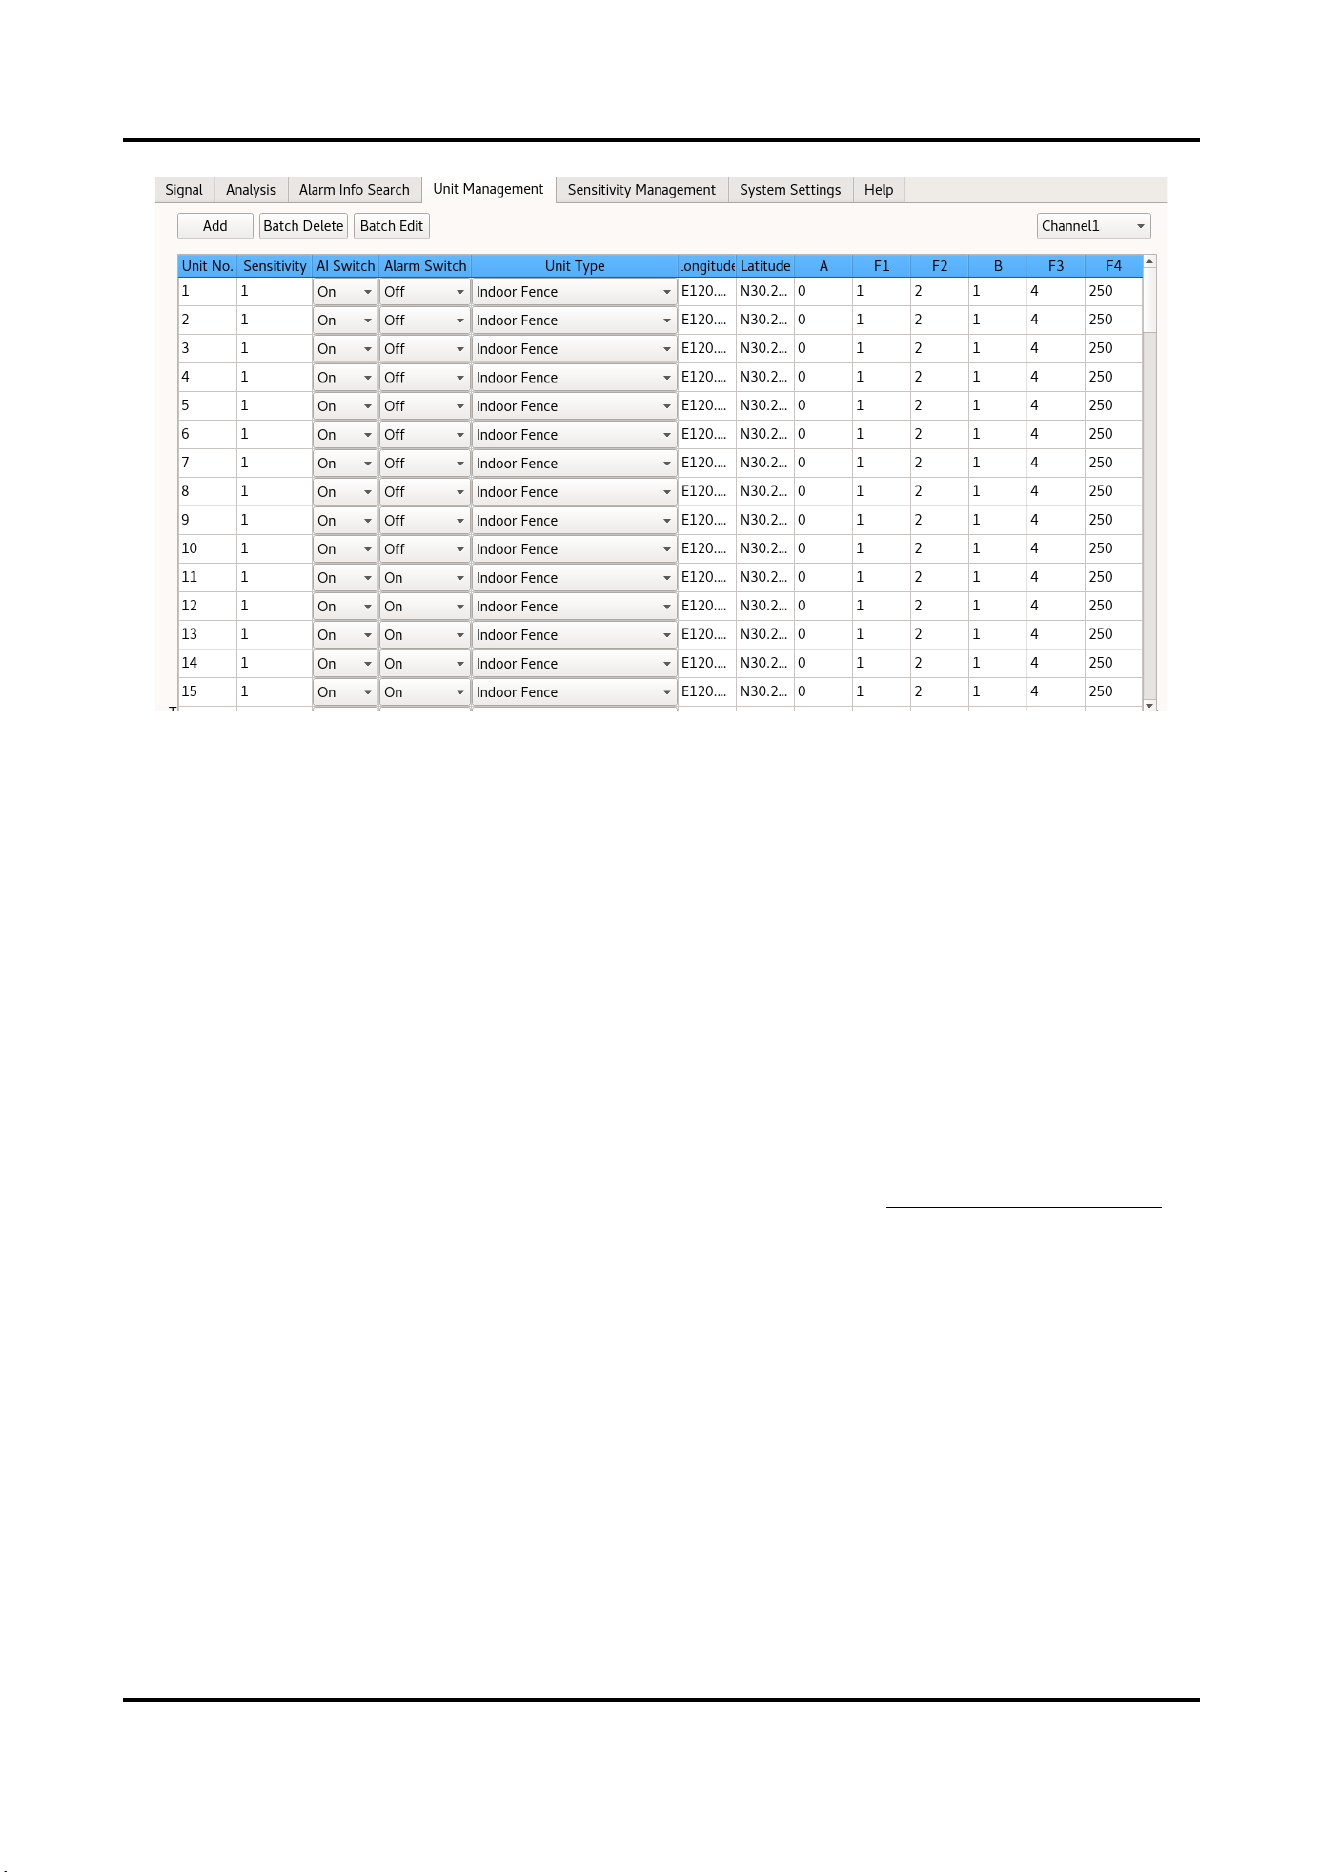
2.4 Unit Management
Click Unit Management to enter the interface.
This interface is used to configure the fiber optic unit.
User Manual
15
Figure 2-10 Unit Management
Channel 1 or channel 2 can be switched by dual-channel device.
2.4.1 Add Unit
Click Add to enter the unit parameters in the pop-up window, and click OK to add the unit.
Start Unit/End Unit
The system will automatically generate the unit within the range. For example, if the start unit is 1, and
the end unit is 5, then it will add 5 units, 1, 2, 3, 4, and 5.
Max. number of units varies with device models.
Unit Type
Select the unit type as your needs.
Sensitivity
Only preset sensitivity can be selected. You can configure sensitivity in 2.5 Sensitivity Management in
advance
Alarm Switch
After enabling, the unit will alarm according to the triggering type
AI Switch
After enabling, the system judges alarm confidence according to smart algorithm. The system will
automatically judge if the alarm is true or false. 1 means that the alarm event is likely to be true. 0
means that the alarm event is likely to be false. If the AI switch is disabled, the confidence level of the
alarm will be 0 by default.
2.4.2 Edit Unit
Edit AI Switch, Alarm Switch, and Unit Type of a single unit in the list.
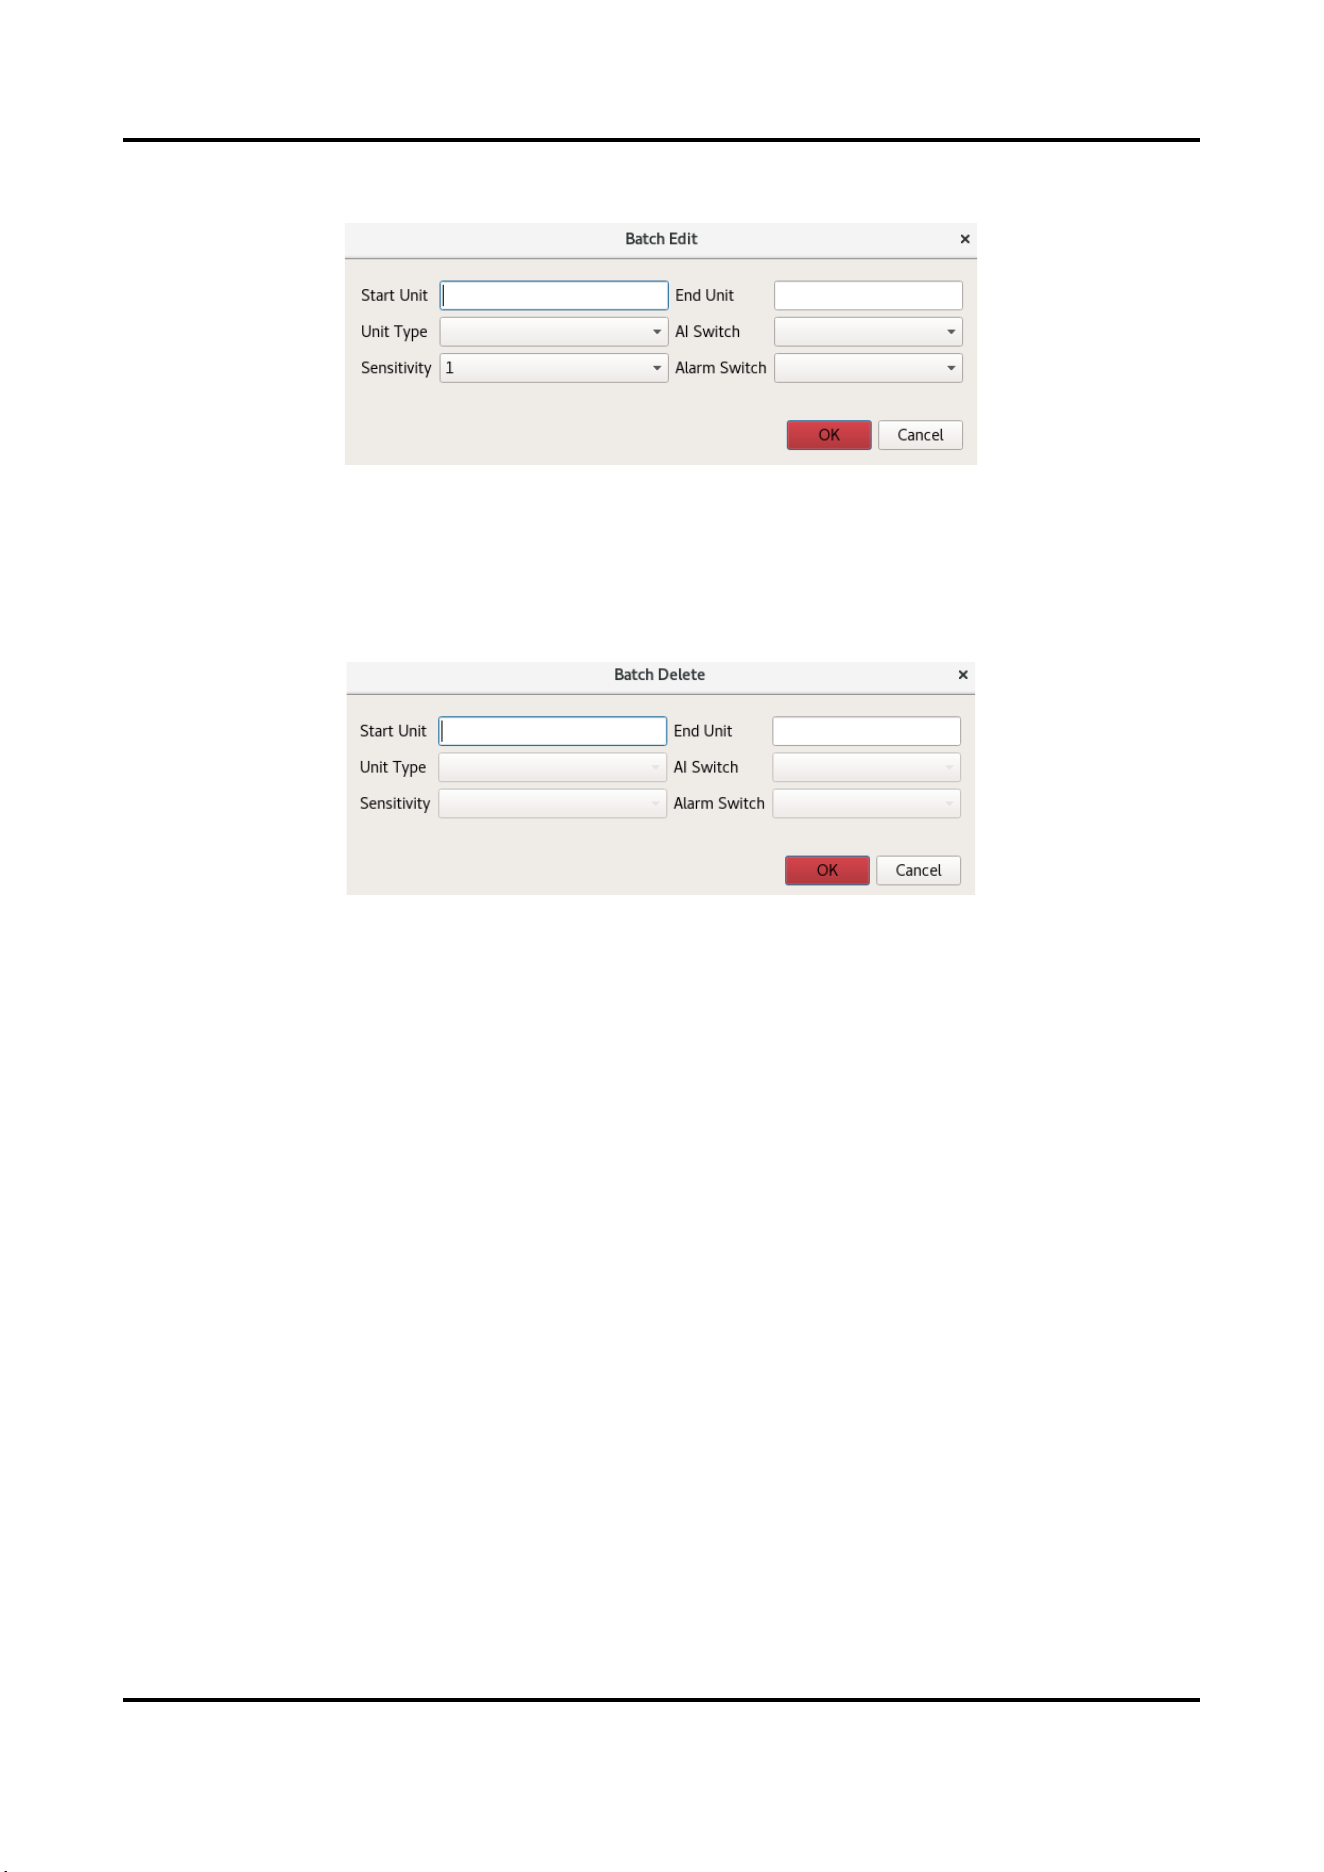
User Manual
16
Or click Batch Edit to edit the units and parameters in the pop-up window. Click OK.
Figure 2-11 Batch Edit
2.4.3 Delete Unit
Click Batch Delete, enter the Start Unit and End Unit to delete the units, and click OK.
Figure 2-12 Batch Delete
2.5 Sensitivity Management
Click Sensitivity Management to enter the interface.
Double-click the data to edit.
I stands for intensity. N stands for number of times. T stands for duration (ms).
Recommended Sensitivity: Third-Level Alarm: I0.2/N10/T2000, Second-Level Alarm: I1/N30/T5000, First-Level
Alarm: I3/N50/T10000.
Alarm Intensity: First-Level Alarm Intensity > Second -Level Alarm Intensity > Third -Level Alarm Intensity.

User Manual
17
Figure 2-13 Sensitivity Management
2.6 System Settings
Click System Settings to enter the interface.
Enable Web Service, and input IP Address.
Web page will not be available when web service is disabled.
2.7 Help
Click Help to view Open Source Software Licenses.
User Manual
8
Chapter 3 Web Client Operation Instructions
3.1 Alarm Record Display
The alarm display interface will pop up prompt according to the missing configuration, and you can click to go to
the corresponding interface.
Figure 3-1 Fiber Monitoring Prompt
Go to 3.4.2 Fiber Monitoring to set parameters when you see the prompt above.
Figure 3-2 Unit Management Prompt
Go to Sensitivity Preset to set sensitivity and Unit Management to set unit when you see the prompt above.
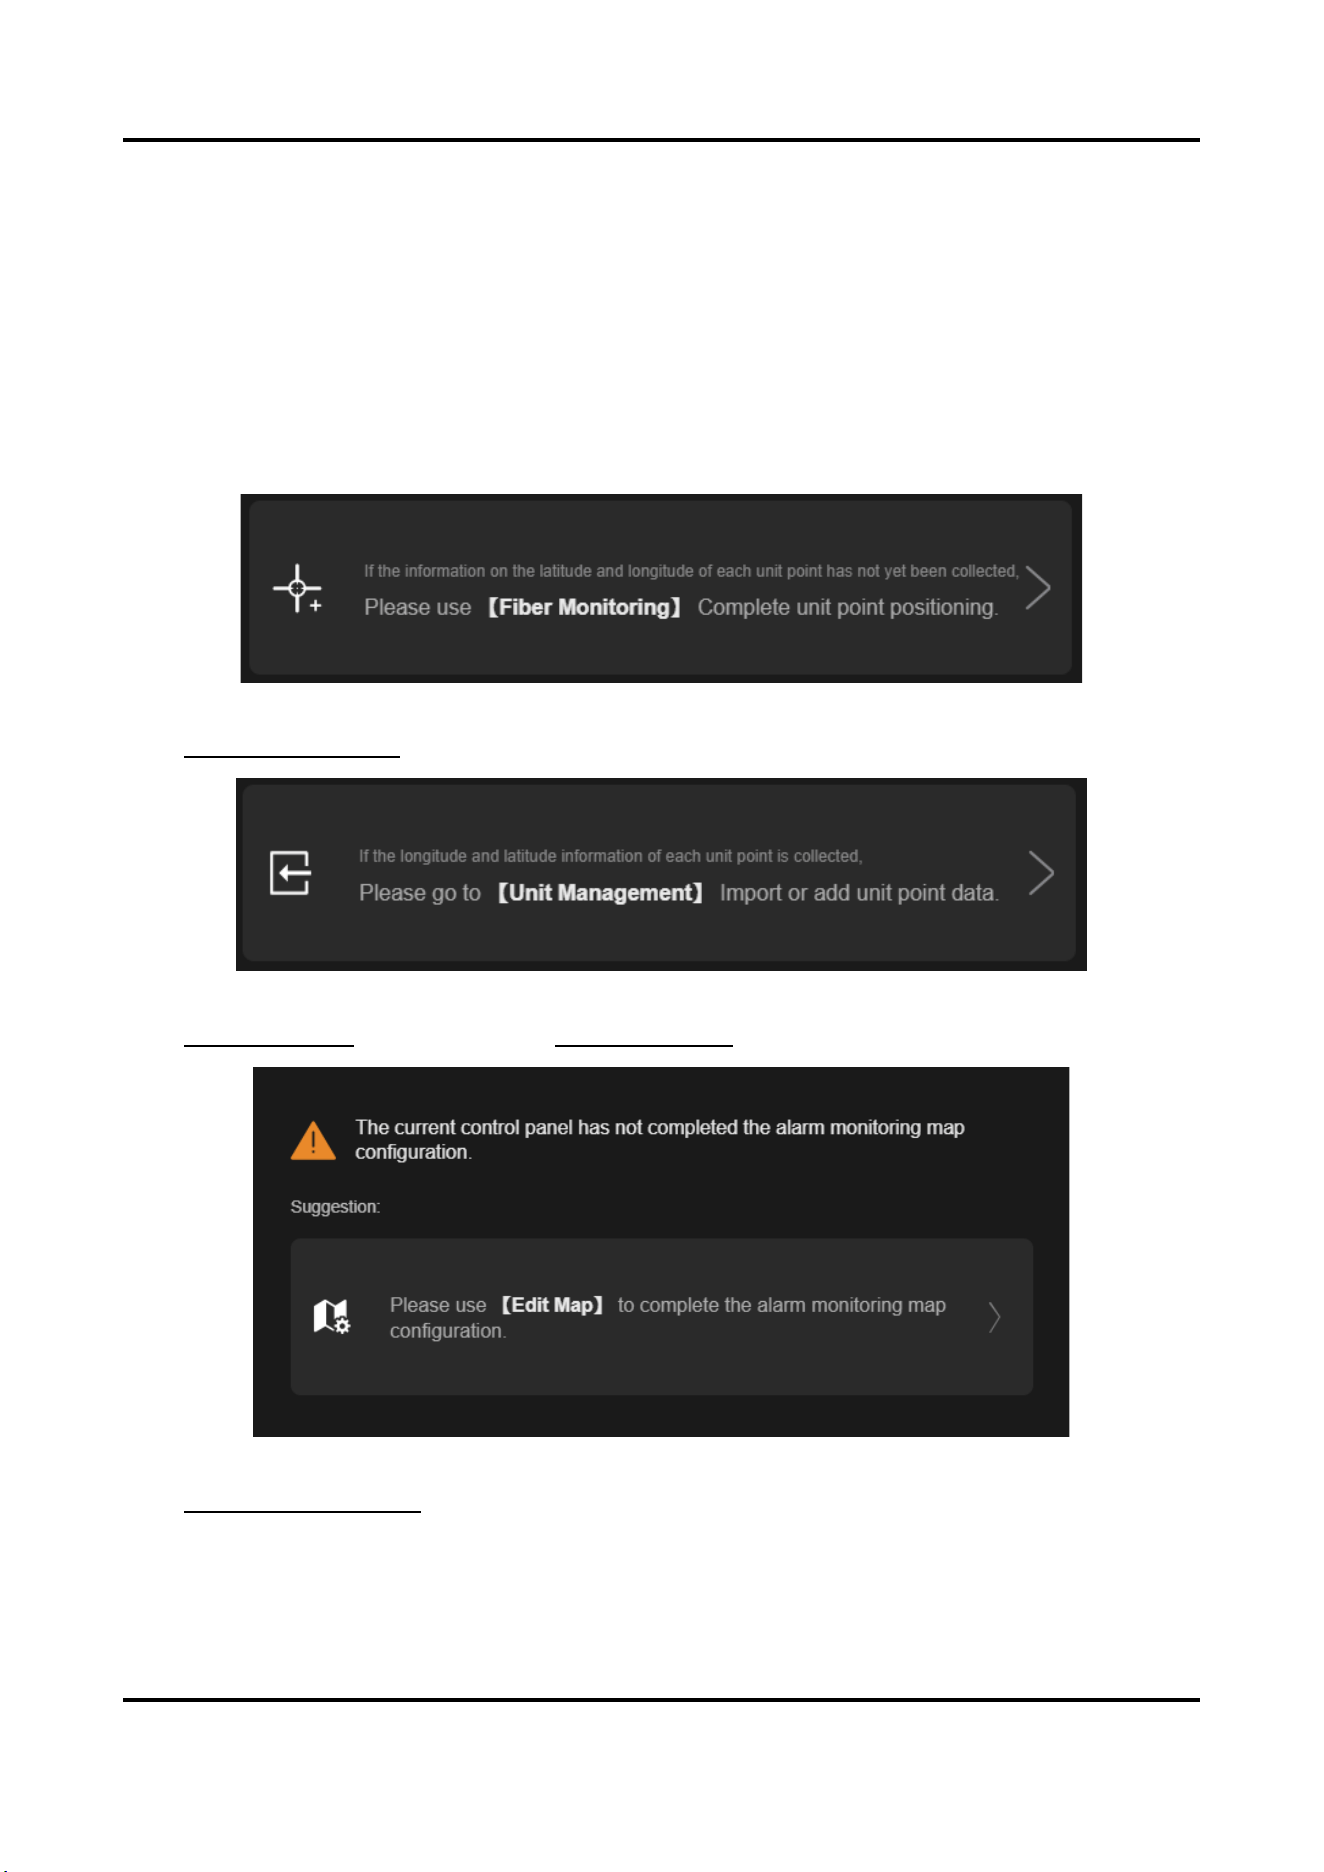
Figure 3-3 Edit Map Prompt
Go to 3.1.1 Map Configuration to finish map configuration when you see the prompt above..
User Manual
9
3.1.1 Map Configuration
Steps
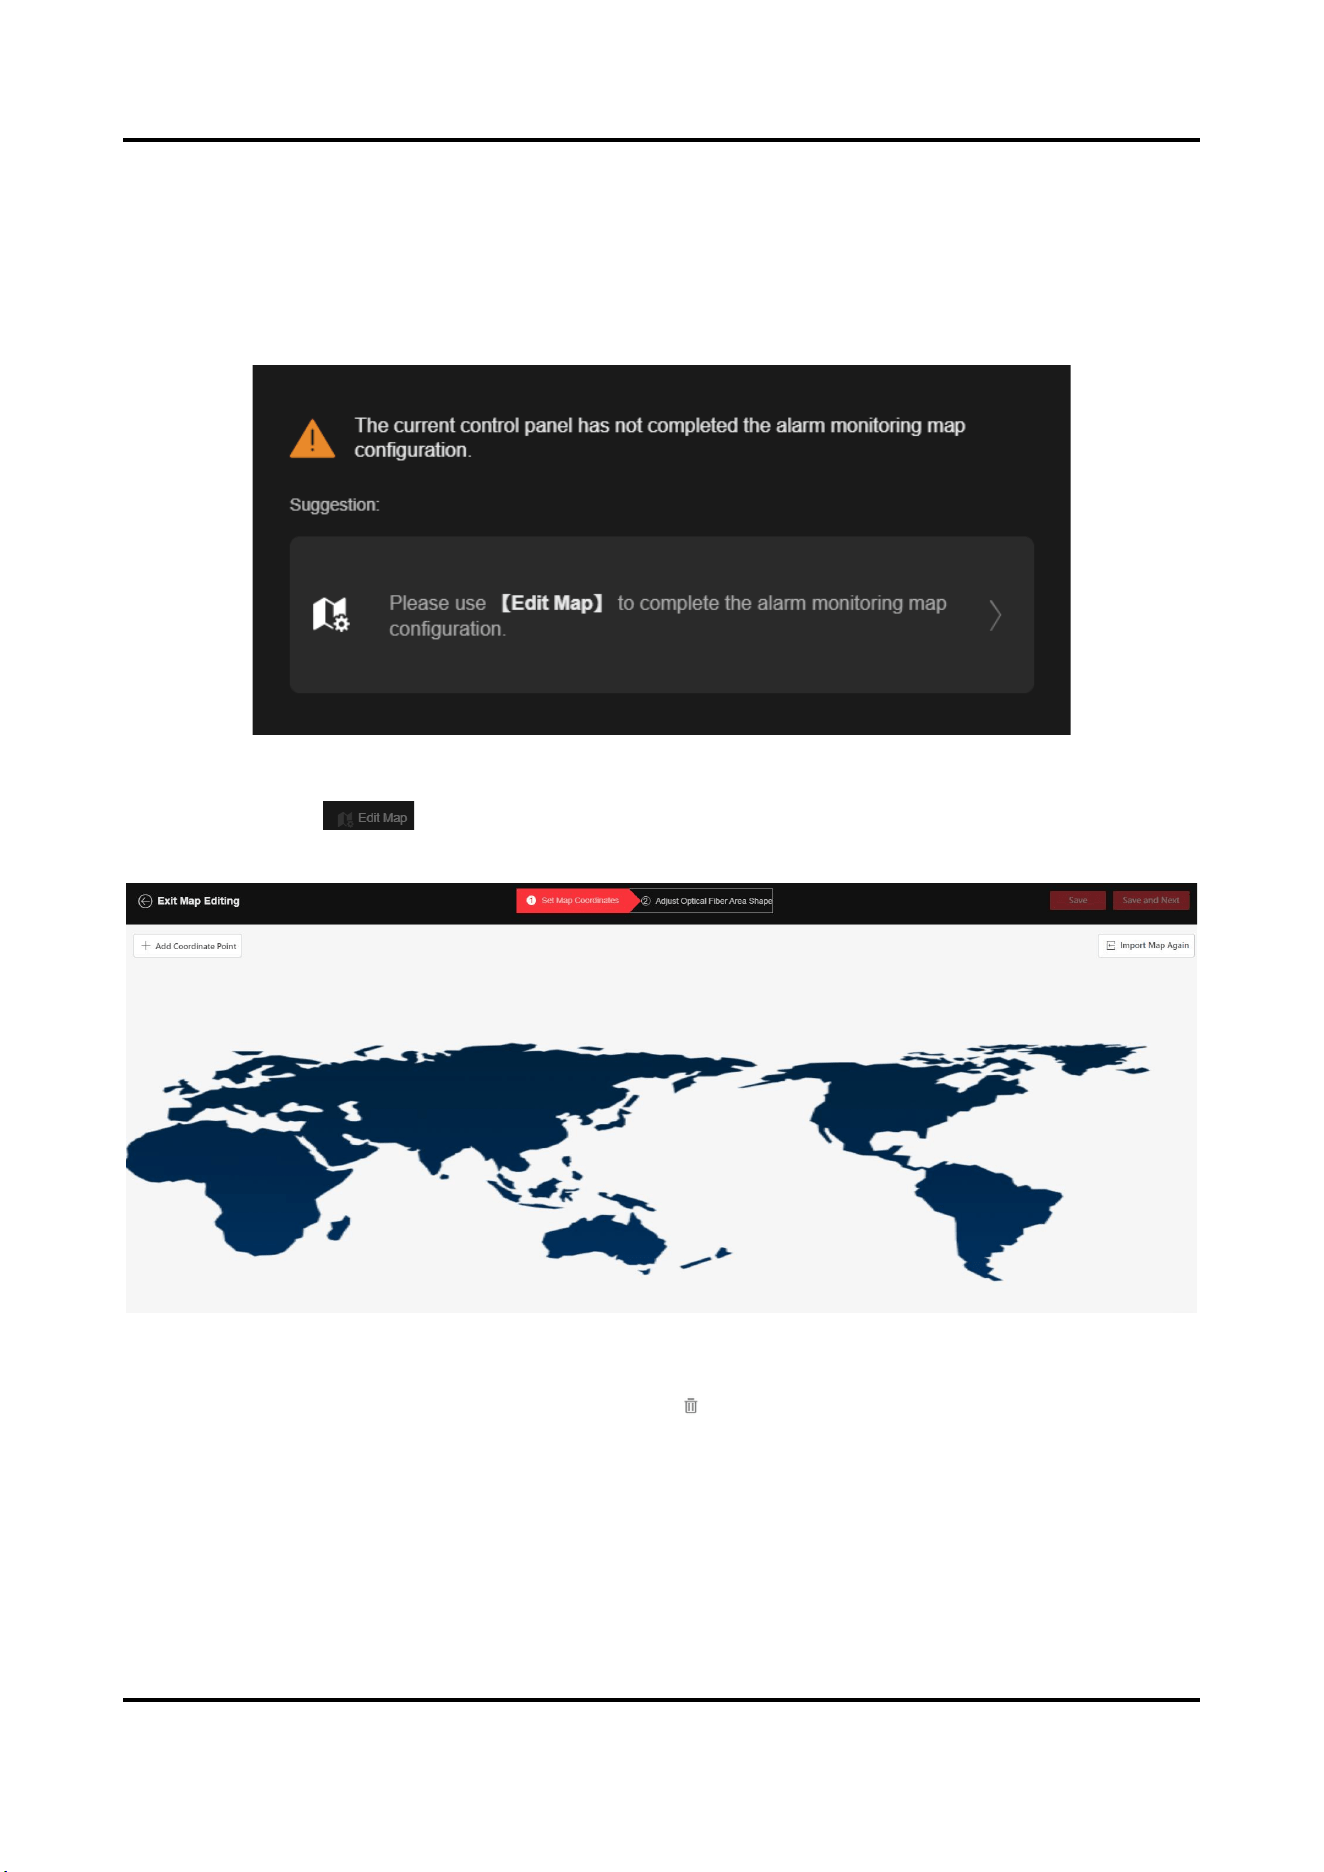
1. The pop-up window will be displayed when you enter the display screen for the first time. Click the pop-up
window.
Figure 3-4 Edit Map Prompt
Otherwise, click on the upper right, and click Import Map Again.
2. Import map according to pop-up prompt and wait for the map to load.
Figure 3-5 Map Imported
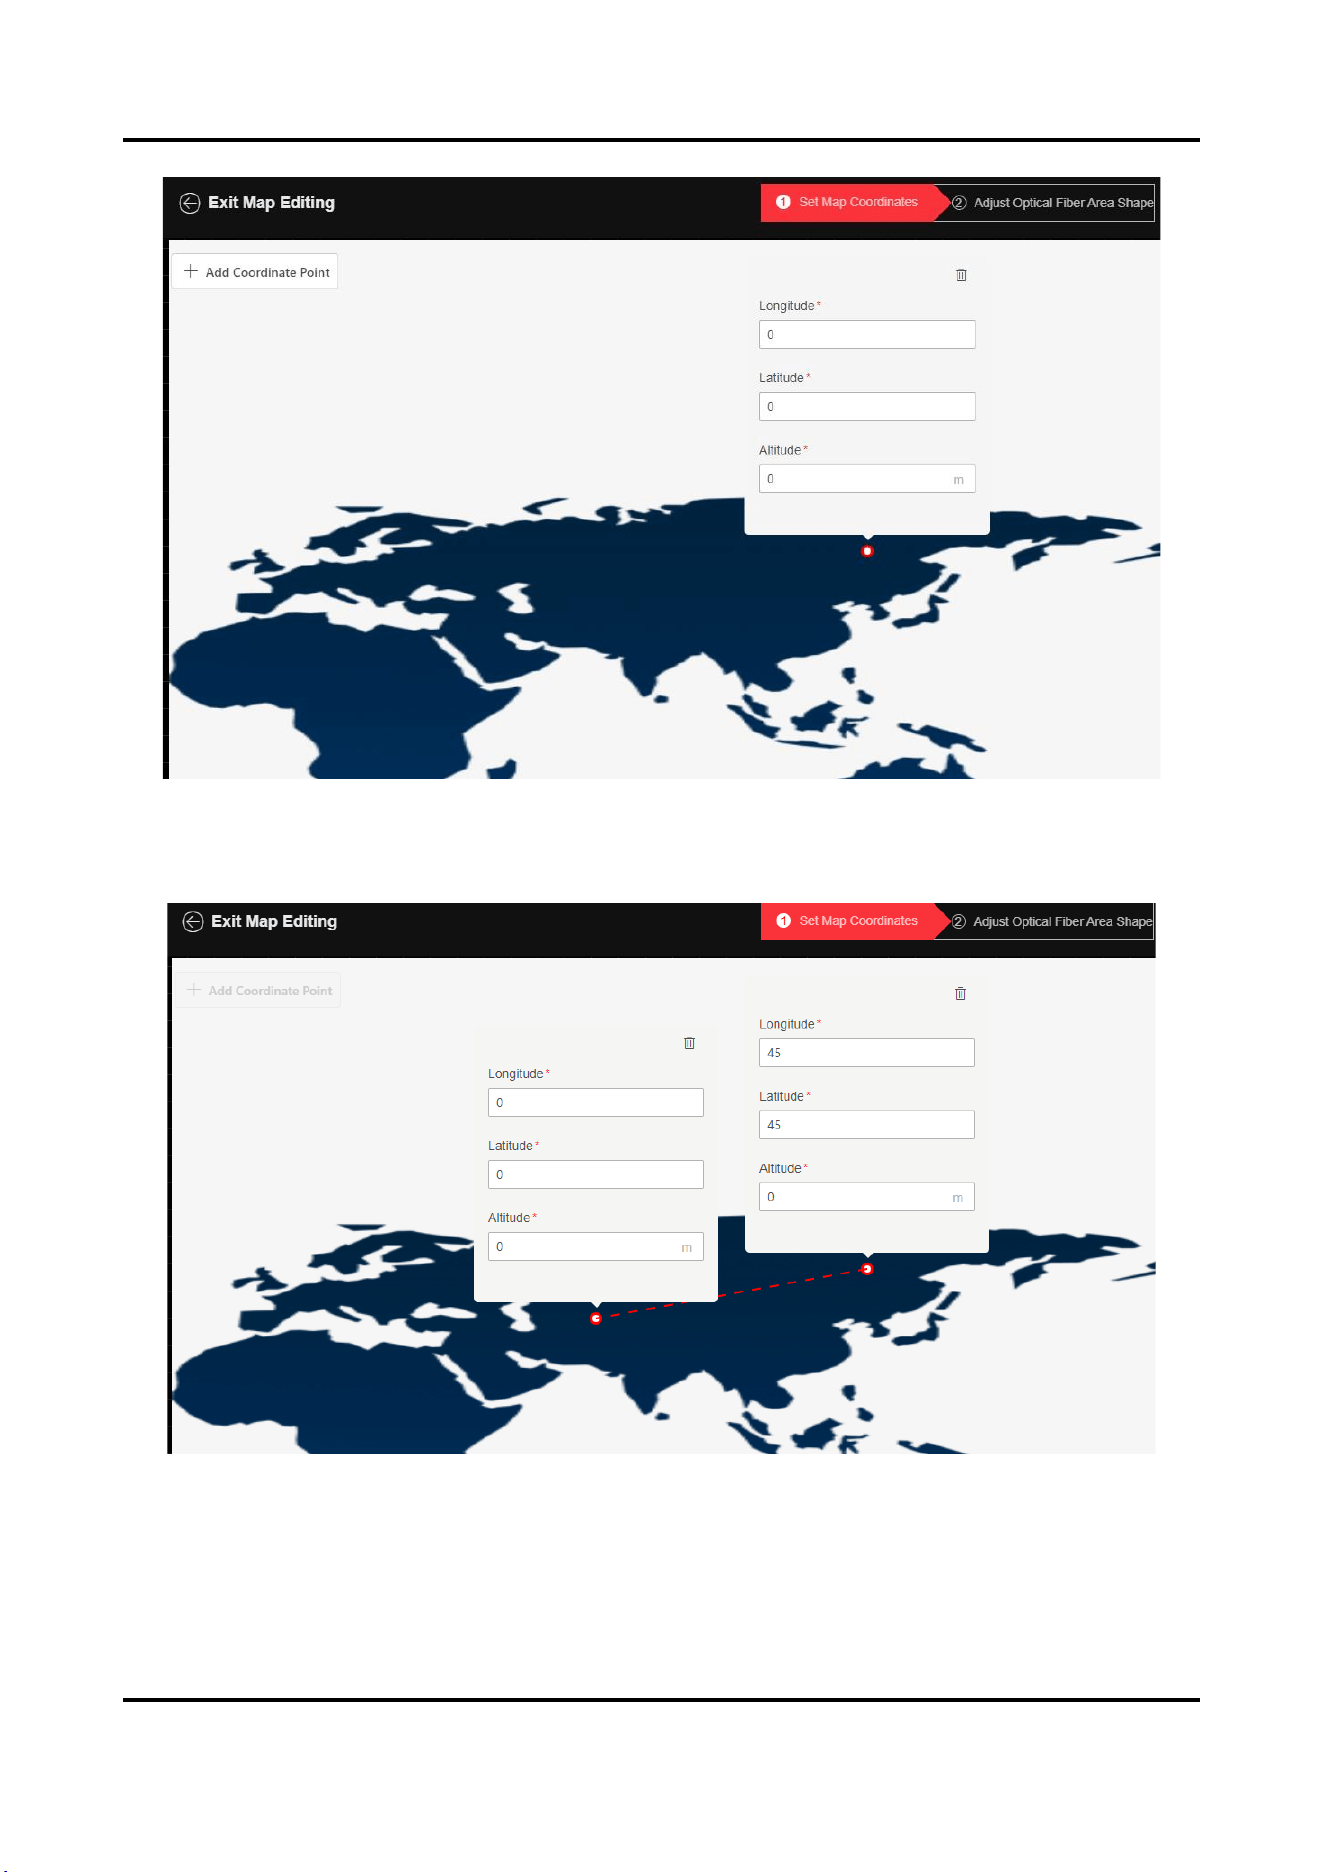
3. Click + Add Axis Point, and then left click to generate the axiss of the map. You can enter longitude, latitude,
and altitude. If the information filled is incorrect, click to delete the axis point.
User Manual
10
Figure 3-6 Add Axis Point
4. Click + Add Axis Point again. Repeat the previous step to generate the second point. Only two axis points can
be added.
Figure 3-7 Add Second Axis Point
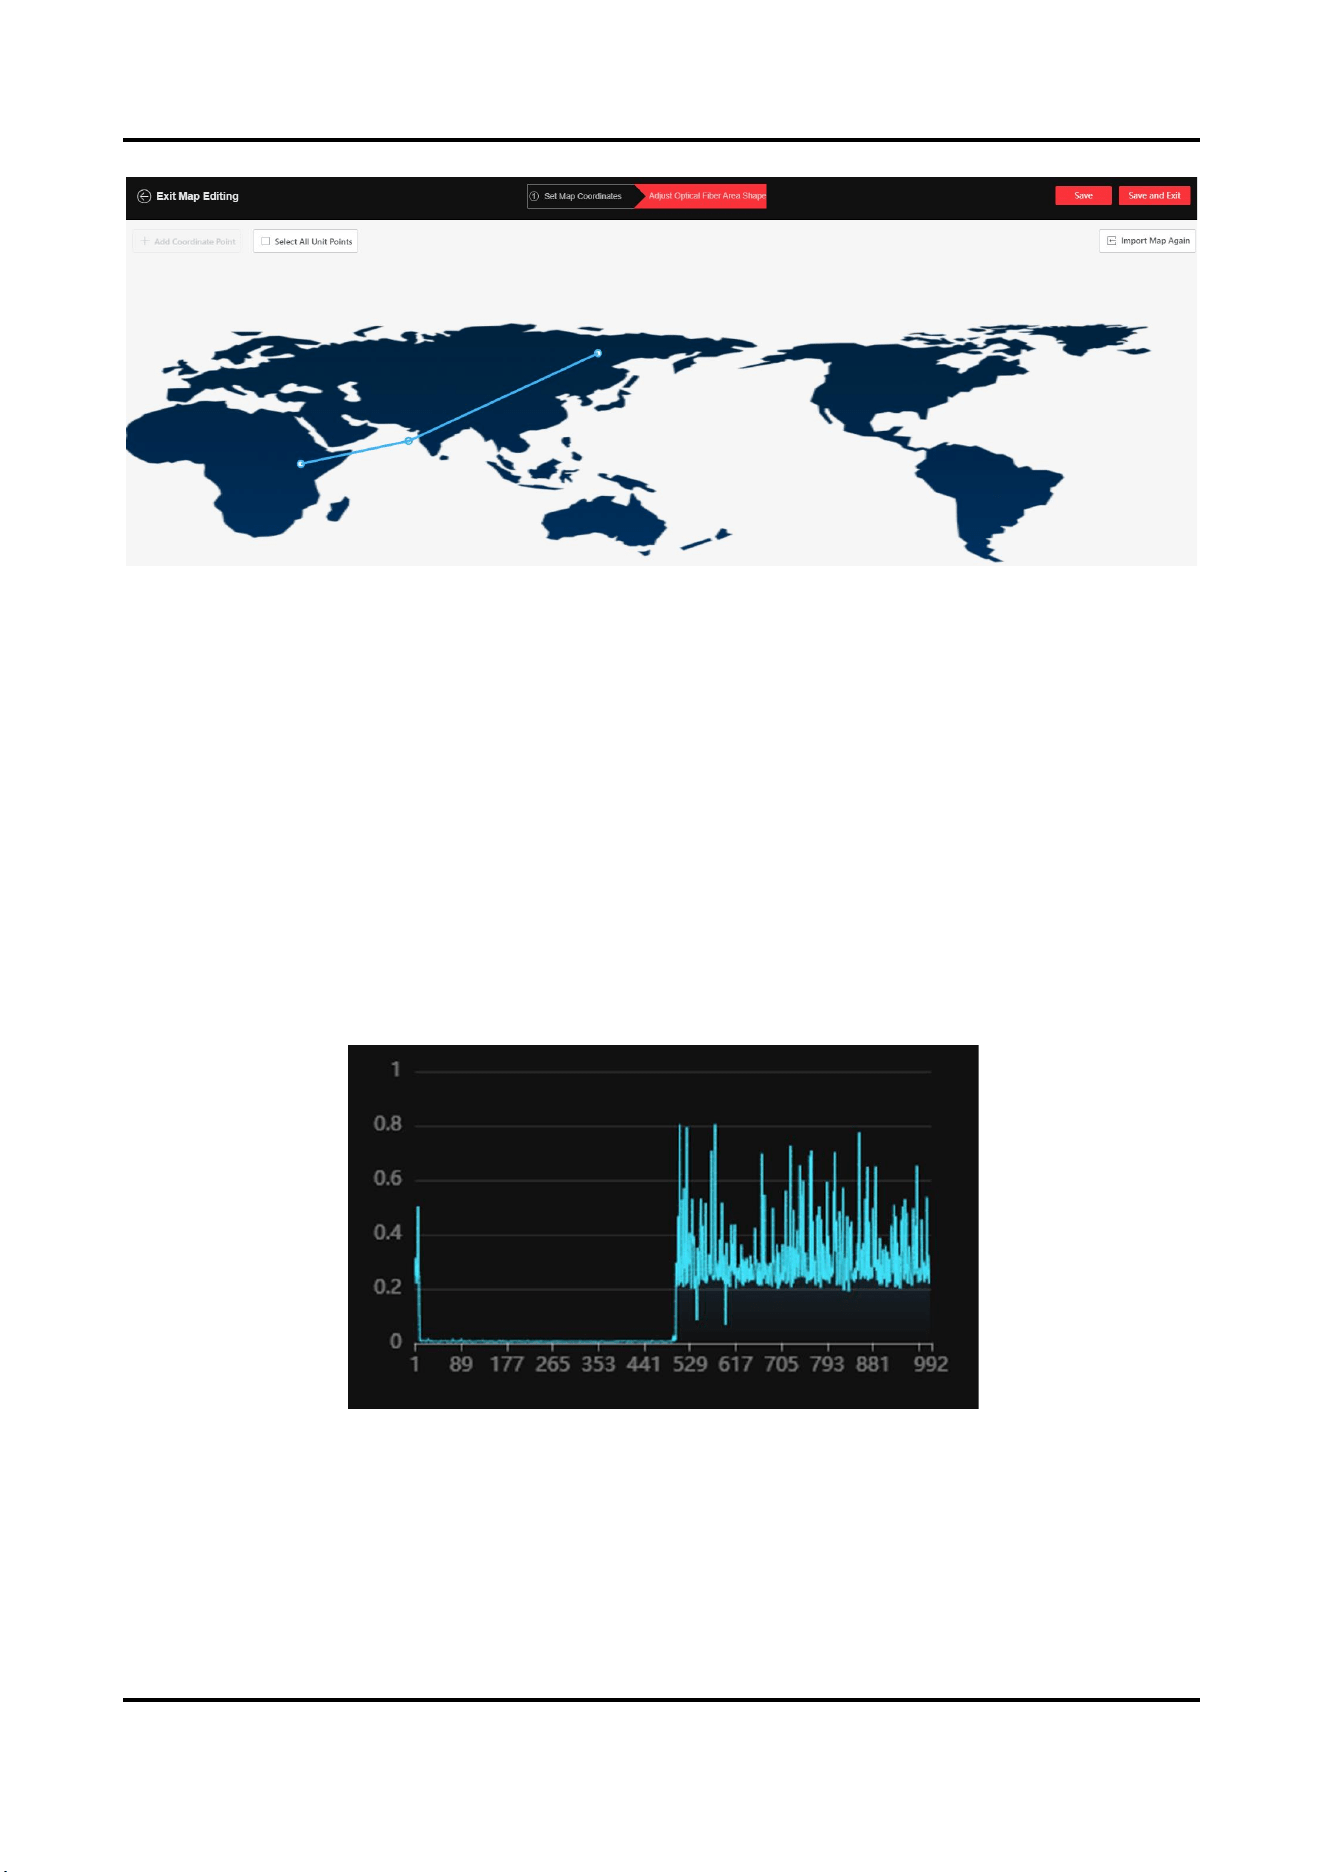
5. Click Save and Next.
6. Enter the fiber shape adjustment interface. Number of units is set in the Unit Management.
User Manual
11
Figure 3-8 Adjust Fiber Shape
7. Drag the end point to adjust the fiber shape. Check Select All Unit Points to drag all the points together.
8. Click Save and Exit.
3.1.2 Function
Fiber Monitoring
The upper-left page is displayed with fiber monitoring.
The dual-channel device can switch between channel 1 and channel 2.
Power Spectrum
Display the power statistics of each unit.
As shown in the figure below, the lower-level segment on the left indicates that the signals of unit 1 to 500
are normal, and the bottom noise on the right indicates that units above 500 have no signals.
Figure 3-9 Power Spectrum
When there is vibration, the left part will fluctuate.
User Manual
12
Figure 3-10 Power Spectrum (With Vibration)
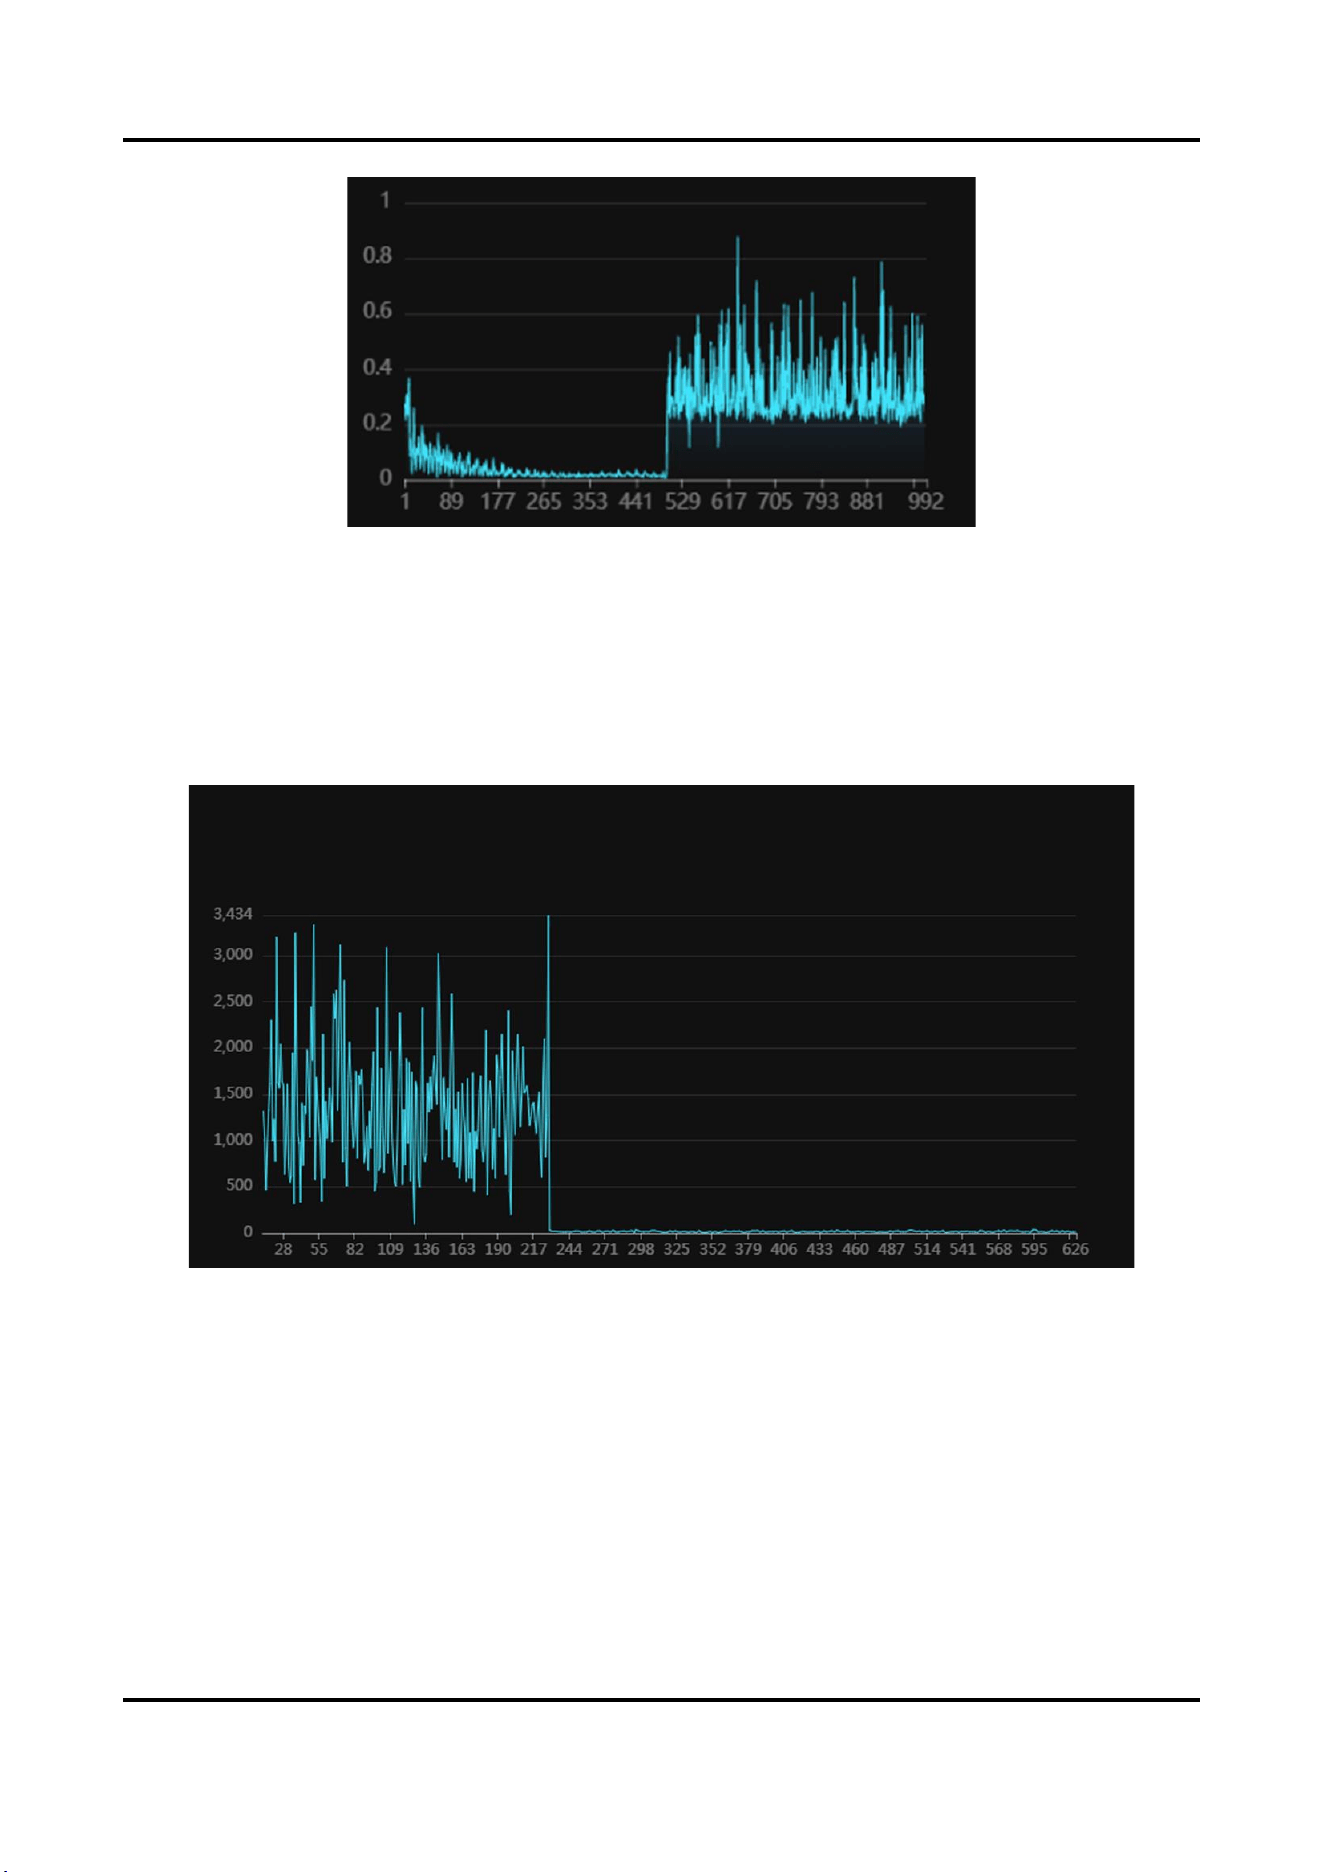
Amplitude Curve
It is mainly used to check signal strength and whether the fiber is broken.
Under normal circumstances, it is fluctuating curve. If the fiber is broken, there is no curve. As shown in the
following figure, the signals of unit 1 to 230 are normal (the vertical axiss can be regarded as signal
strength). Units above 230 have no signals.
You can see the broken unit through the amplitude curve.
Figure 3-11 Amplitude Curve
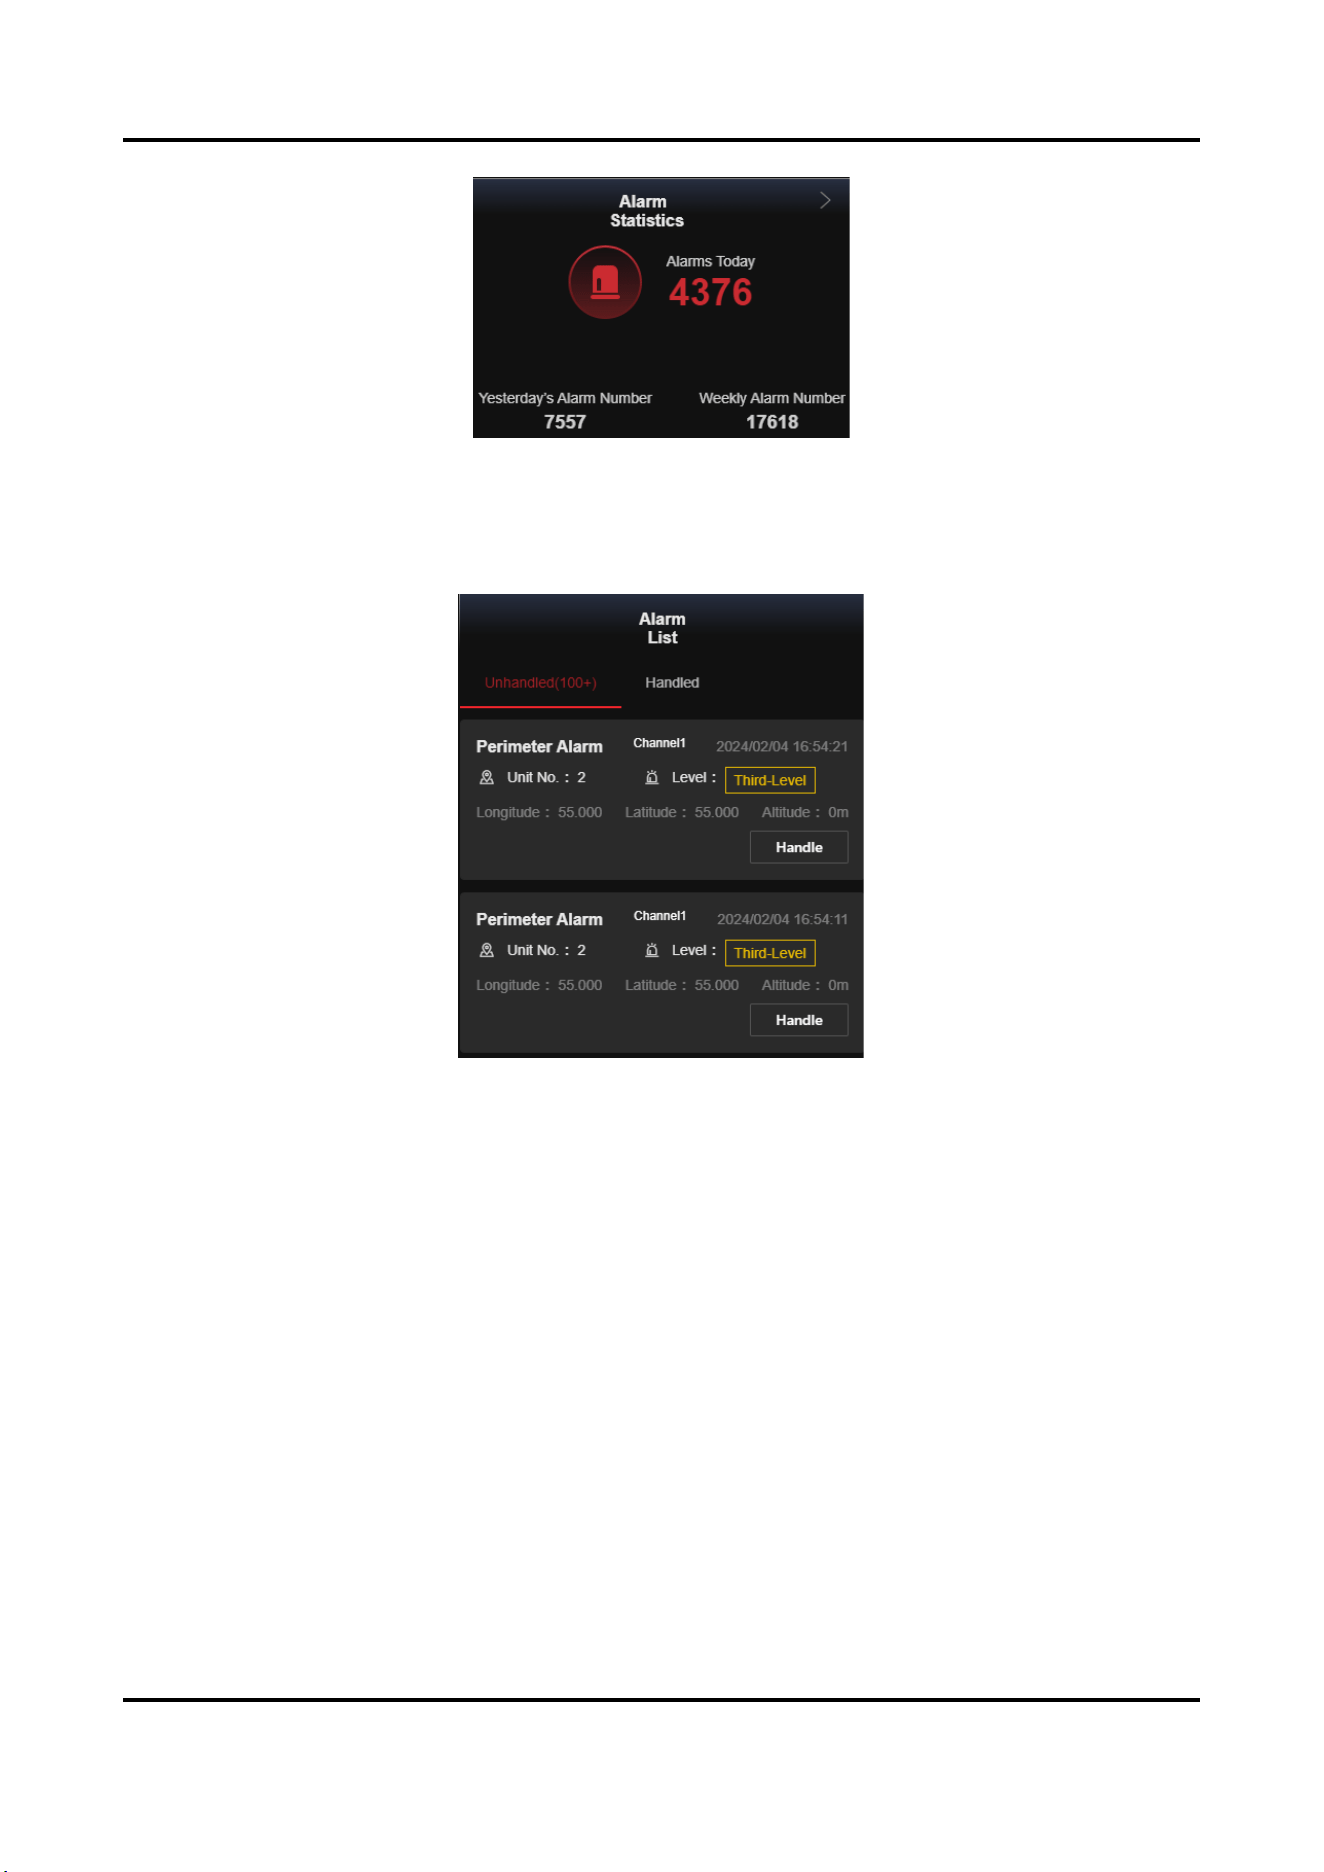
Alarm Statistics
The lower-left page shows alarm data.
User Manual
13
Figure 3-12 Alarm Statistics
Alarm List
The screen on the right shows the alarm. You can select the handled alarms and unhandled alarms.
Figure 3-13 Alarm List
Click Handle to view alarm type, time, unit No., and alarm level in pop-up window. Please select true or false
alarm in handle method.

User Manual
14
Figure 3-14 Alarm Basic Information
Click More Unhandled Alarms to go to the historical alarm record page.
Note
Smart algorithm and alarm handling are two parallel mechanisms. Whether the alarm confidence is 1 or 0, you
should handle the alarm manually and set it as true or false.
Alarm Type
Perimeter Alarm
The fiber is vibrating. Check if there are people crossing.
The preset sensitivity is divided into first to third level. Unit No. refers to the alarm triggering location.
Fiber Cut Alarm
The fiber is broken and has no signal. The default alarm level is first-level. The unit No. is the position of the
fiber cut closest to the start of the fiber.
3.2 Alarm Record
Click Alarm Record in the list on the left to enter the interface.
You can view alarm data.
3.2.1 Alarm Statistics
Go to Alarm Record → Alarm Statistics to enter the interface.
User Manual
15
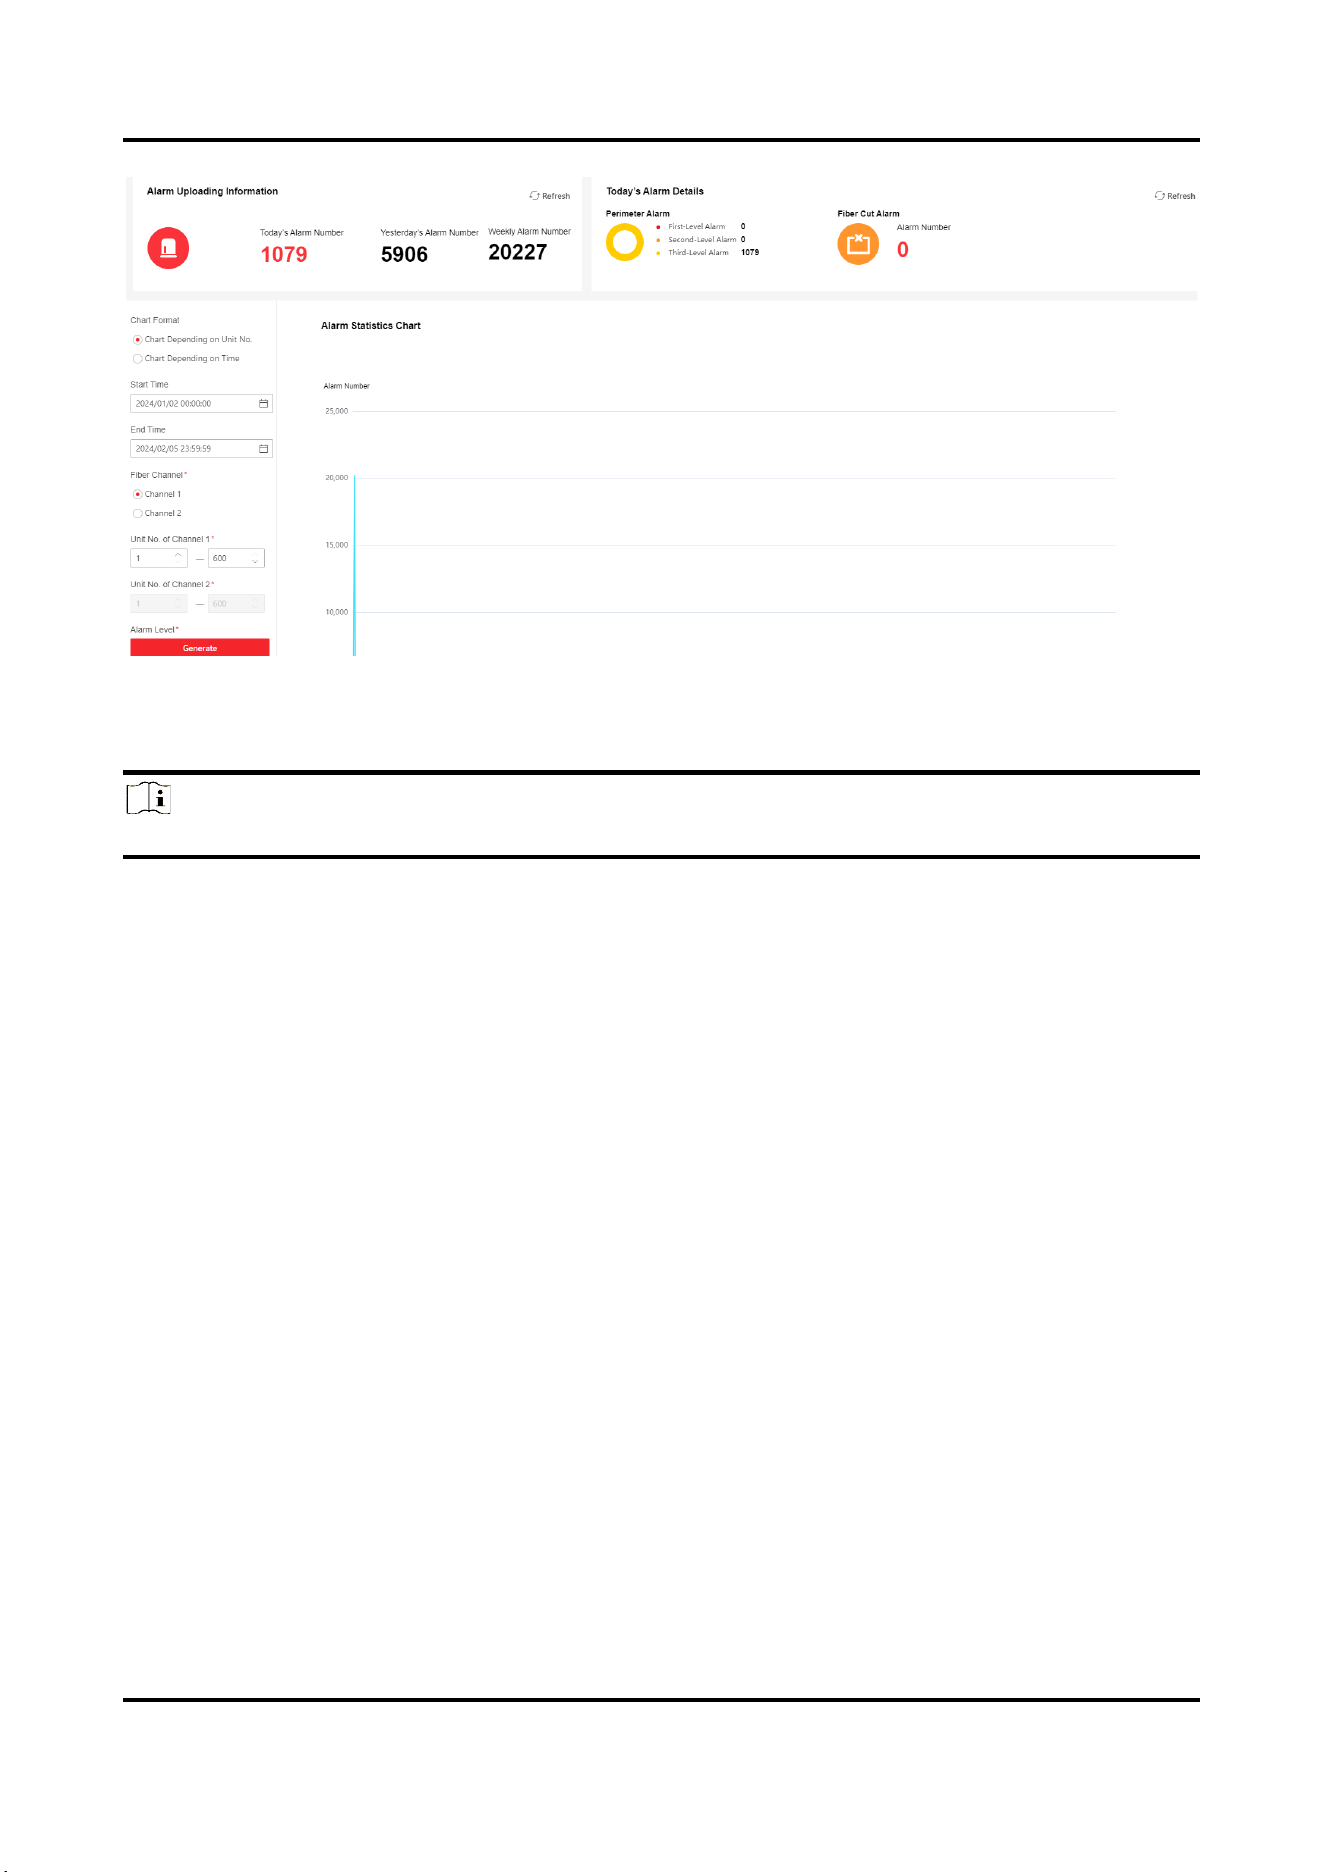
Figure 3-15 Alarm Statistics
Alarm uploading information and today’s alarm details are displayed in the upper side of the interface.
Set the filter conditions on the left, click Generate to generate the alarm statistics chart on the right.
Note
Hover the cursor over the alarm statistics chart. Slide the roller to zoom in or out the statistics chart.
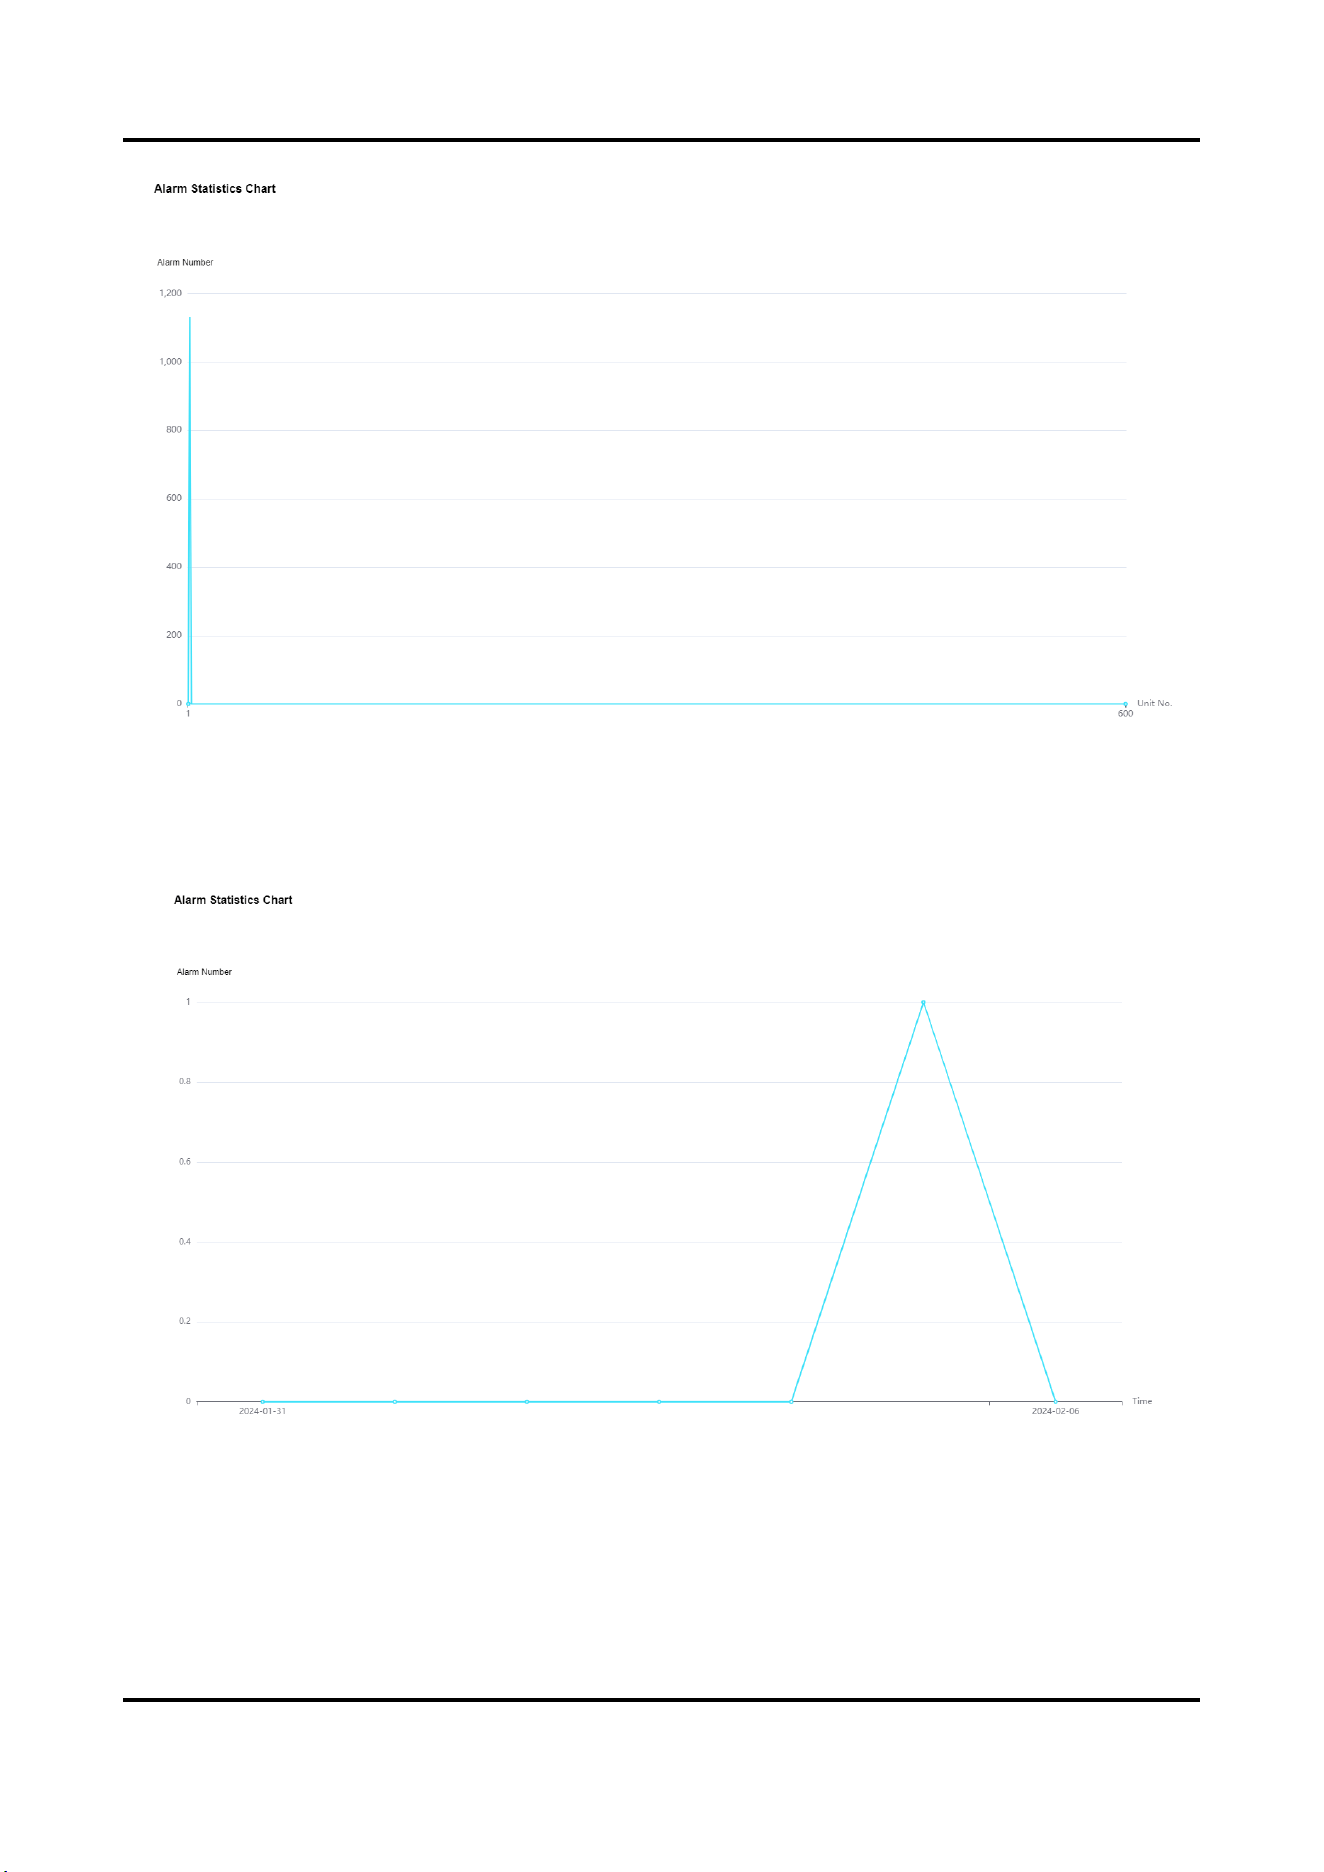
Chart Depending on Unit No.
In the statistics chart, the vertical axis is the alarm number, and the horizontal axis is the unit No.
The number of alarms in each unit that meet the selected condition in start time and end time will be
displayed.
User Manual
16
Figure 3-16 Chart Depending on Unit No.
Chart Depending on Time
In the statistics chart, the vertical axis is the alarm number, and the horizontal axis is the time.
The number of alarms that meet the selected condition will be displayed by time.
Figure 3-17 Chart Depending on Time
Alarm Confidence
After enabling smart algorithm in unit management, the system will automatically judge if the alarm is true
or false. Validity1 indicates that the alarm event is more likely to be true. Validity0 indicates that the alarm
event is more likely to be false.
User Manual
17
3.2.2 Historical Alarm Record
Go to Alarm Record → Historical Alarm Record to enter the interface.
Figure 3-18 Historical Alarm Record
Set the filter conditions on the left, and click Search to search historical alarm records.
You can handle unhandled alarms here. Select true or false alarm.
Alarm Confidence
After enabling smart algorithm in unit management, the system will automatically judge if the alarm is true
or false. Validity1 indicates that the alarm event is more likely to be true. Validity0 indicates that the alarm
event is more likely to be false.
Note
Smart algorithm and alarm handling are two parallel mechanisms. Whether the alarm confidence is 1 or 0, you
should handle the alarm manually and set it as true or false.
3.3 Configuration
3.3.1 System
Basic Information
You can view device information, such as Model, Serial No. and Version.
Enter Configuration → System → System Settings → Basic Information to view the device information, and you
User Manual
18
can edit device name.
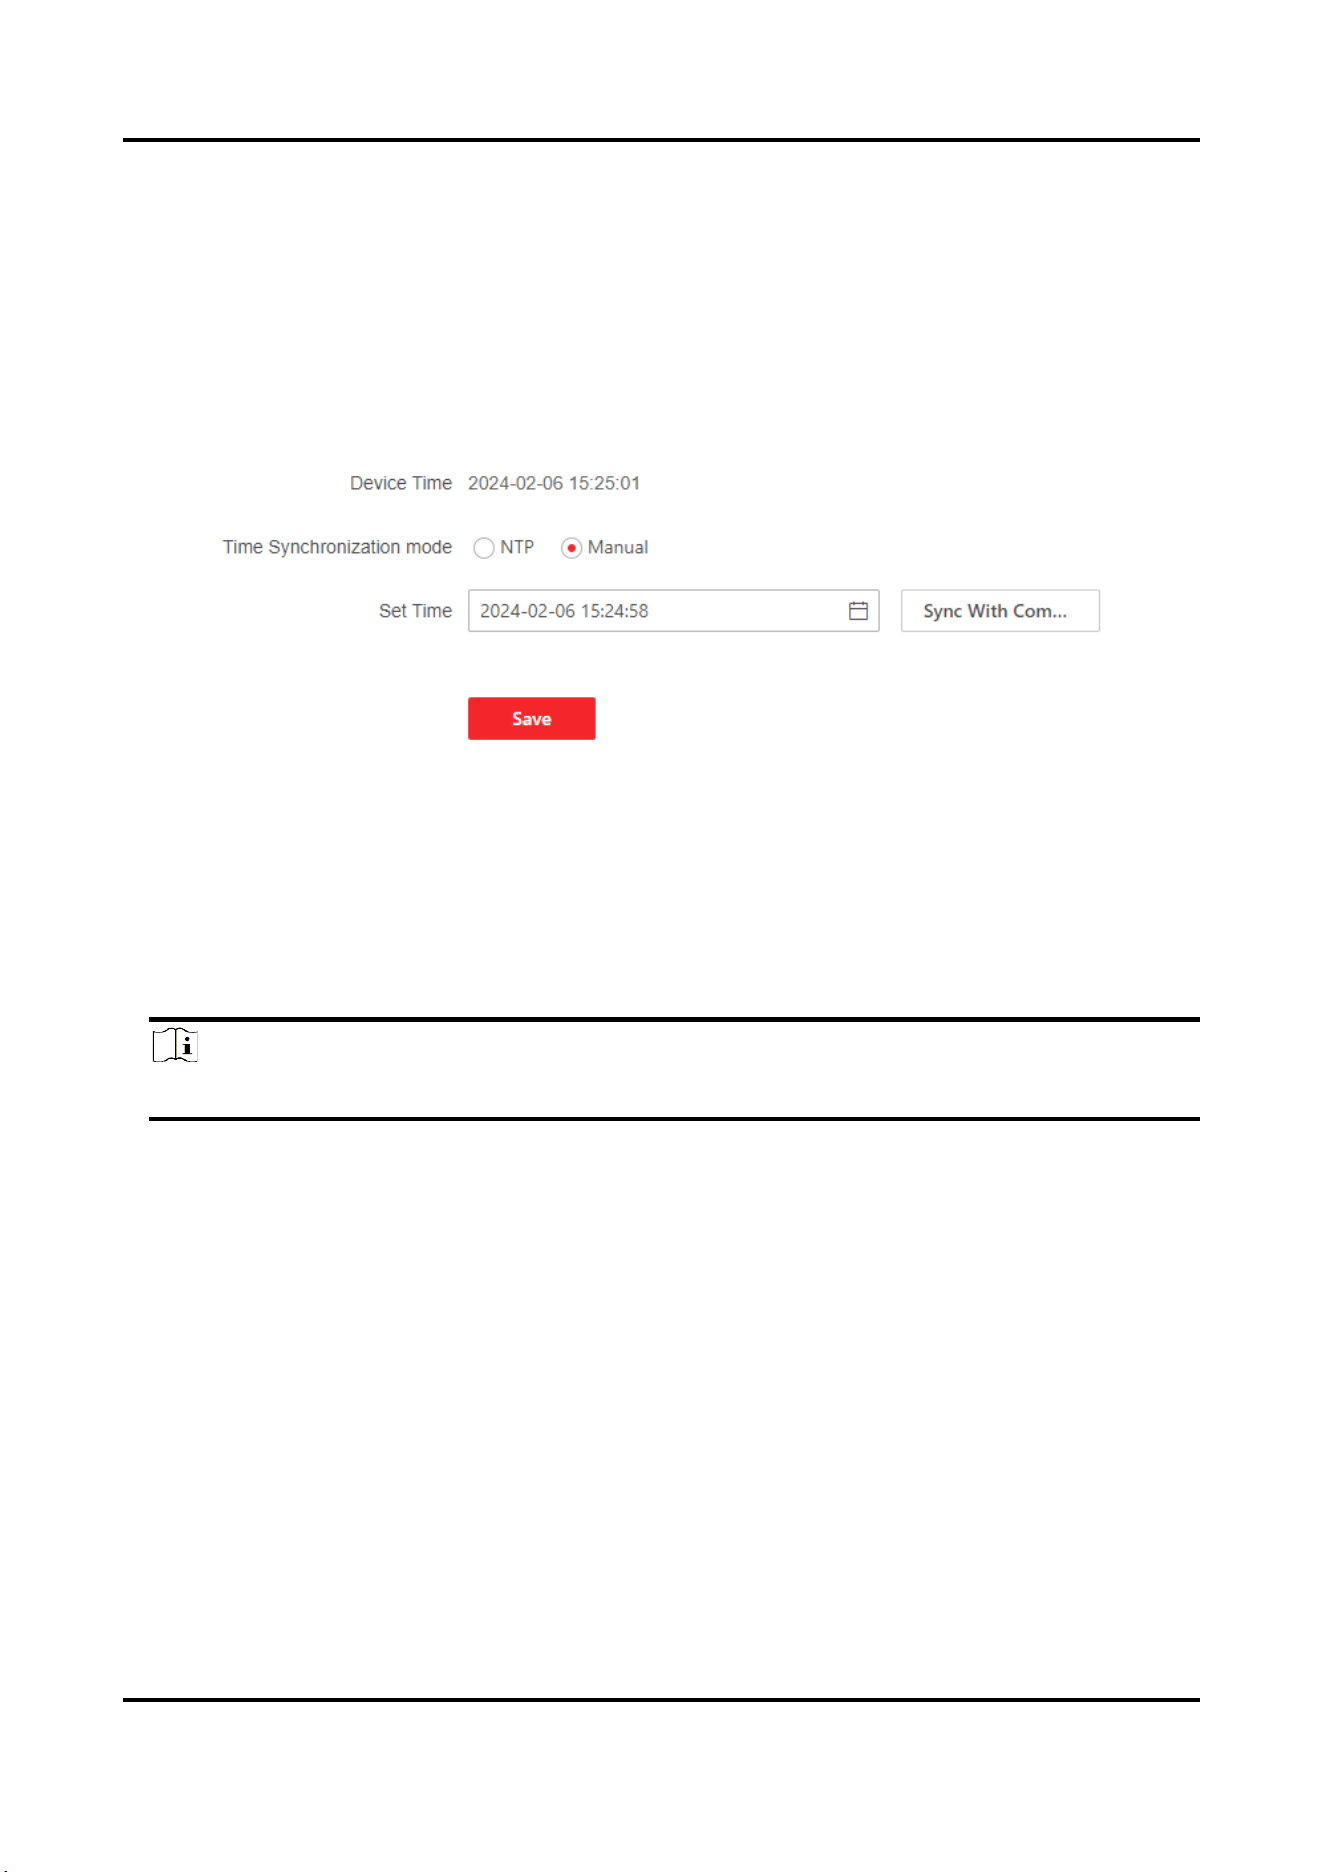
Time Settings
Synchronize Time Manually
Steps
1. Go to Configuration → System → System Settings → Time Settings.
2. Select Manual in Time Synchronization Mode.
Figure 3-19 Synchronize Time Manually
3. Select date and time in Set Time.
4. Click Sync. With Computer Time to synchronize the time of the device with that of the local PC.
5. Click Save.
Set NTP Server
You can use NTP server when accurate and reliable time source is required.
Note
Only certain models support the function.
Before You Start
Set up a NTP server or obtain NTP server information.
Steps
1. Go to Configuration → System → System Settings → Time Settings.
2. Select NTP in Time Synchronization Mode.

User Manual
19
Figure 3-20 Set NTP Server
3. Set Server IP Address, NTP Port and Interval.
Note
Server IP Address is NTP server IP address.
4. Click Save.
User Management
Add Users
Caution
To increase security of using the device on the network, please change the password of your account regularly.
Changing the password every 3 months is recommended. If the device is used in high-risk environment, it is
recommended that the password should be changed every month or week.
Steps
1. Go to Configuration → System → User Management → User Management.
2. Click +Add. Enter User Name, select User Role, and enter Password and Confirm Password. Assign remote
permission to users based on needs.
Administrator
The administrator has the authority to all operations and can add installers and operators and assign
permission.
Installer
The administrator can select whether to enable the installer, and whether to grant the installer permission
to configure the parameters.
The default password of the Installer is setter12345. Please change password after initial login.
Operator
The administrator can select whether to grant the operator permission to configure the parameters.
3. Click Save.

User Manual
20
Edit Users
Steps
1. Go to Configuration → System → User Management → User Management.
2. Click . Edit the information as your needs.
3. Click Save.
Delete User
● Click to delete a single user.
● Select the user in the list. Click to delete the user in a batch.
Note
The administrator and Installer cannot be deleted.
Online Users
Go to Configuration → System → User Management → Online Users to view the list of online users.
3.3.2 Network
Network Settings
TCP/IP settings must be properly configured before you operate the device over network.
Steps
1. Go to Configuration → Network → Basic Settings → TCP/IP.
2. Select Network ID.
3. Enable DHCP, or manually input IPv4 parameters.
DHCP
The device automatically gets the IPv4 parameters from the network if you check DHCP. The device IP
address is changed after enabling the function. You can use SADP to get the device IP address.
4. Click Save.
Network Service
The device port can be modified when the device cannot access the network due to port conflicts. For debuggers
only.
Go to Configuration → Network → Network Service to enter the interface.
Device Access
The device can be accessed to the maintenance platform via OTAP protocol, in order to search and acquire
device information, upload device status and alarm information, reboot and update the device.
Steps
1. Go to Configuration → Network →Device Access → OTAP to enable the function
2. Set related parameters.
User Manual
21
3. Click Test to check if the device connects to server.
4. Click Save.
Result
Register Status turns to Online when the function is correctly set.
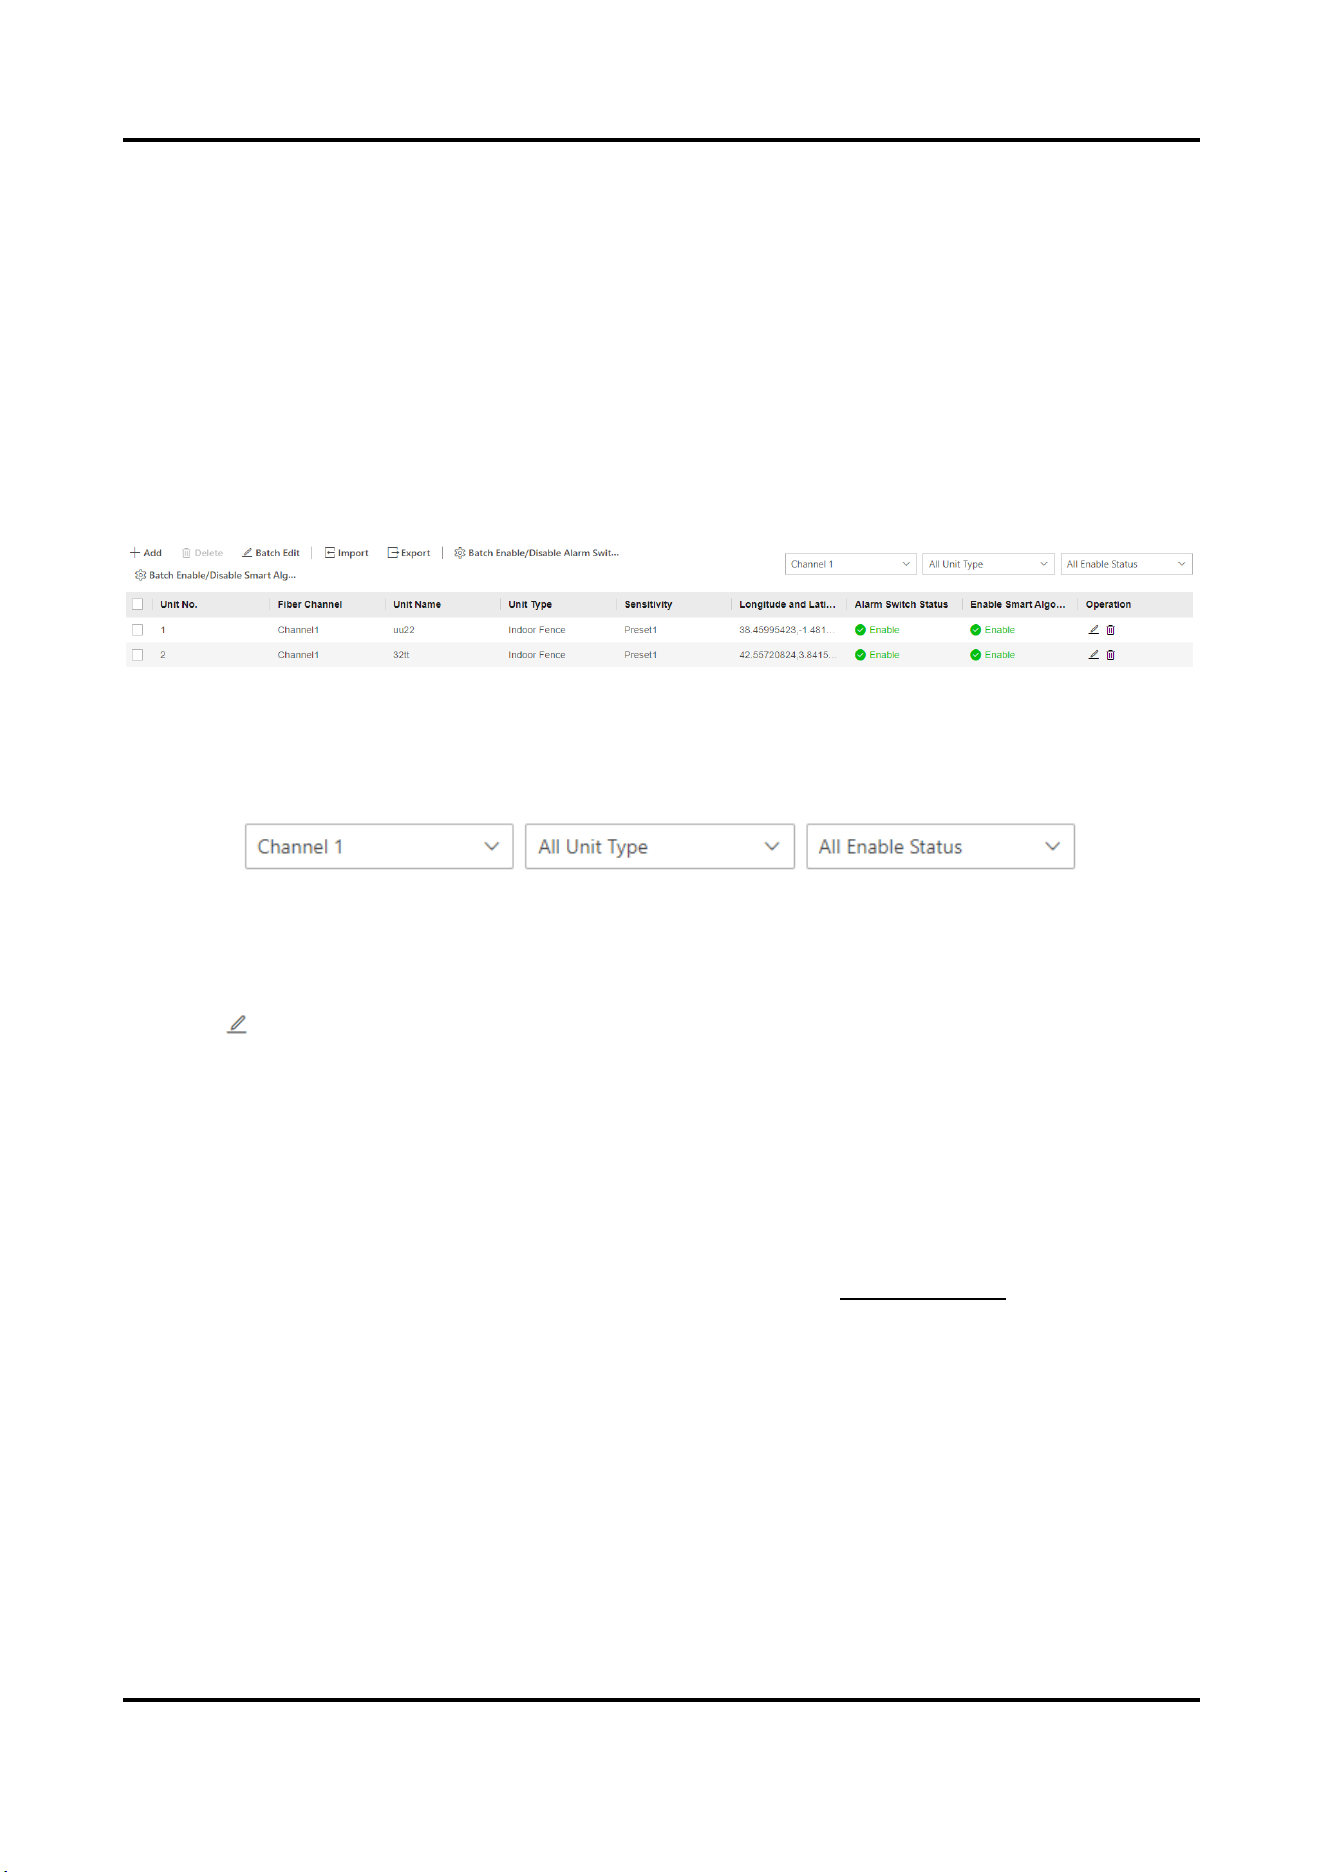
3.3.3 Optical Fiber Monitoring Settings
Unit Management
Go to Configuration → Optical Fiber Monitoring Settings → Optical Fiber Unit → Unit Management to enter
the interface.
You can configure the fiber unit.
Figure 3-21 Unit Management
Filter Display Unit
Set the condition bar on the right to select the unit to be displayed in the list.
Figure 3-22 Unit Condition
Single Add/Edit Unit
● Click + Add, enter unit parameters in the pop-up window on the right, and click Save to add unit.
● Click to enter unit parameter in the pop-up window on the right, and click Save to edit the unit.
Add Unit No.
Max. number of units varies with device models
Unit No. in each channel is unique.
Unit Name
It can be duplicated.
Sensitivity
Only preset sensitivity can be selected. You can configure sensitivity
in
Sensitivity Preset
in advance.
Longitude and Latitude
Enter the latitude and longitude of the unit.
Enable Alarm Switch
After enabling, the unit will alarm according to the triggering type.
Enable Smart Algorithm
After enabling, the system judges alarm confidence according to smart algorithm. The system will
automatically judge if the alarm is true or false. 1 means that the alarm event is likely to be true. 0 means
that the alarm event is likely to be false. If the smart algorithm is disabled, the confidence level of the alarm
User Manual
22
will be 0 by default.
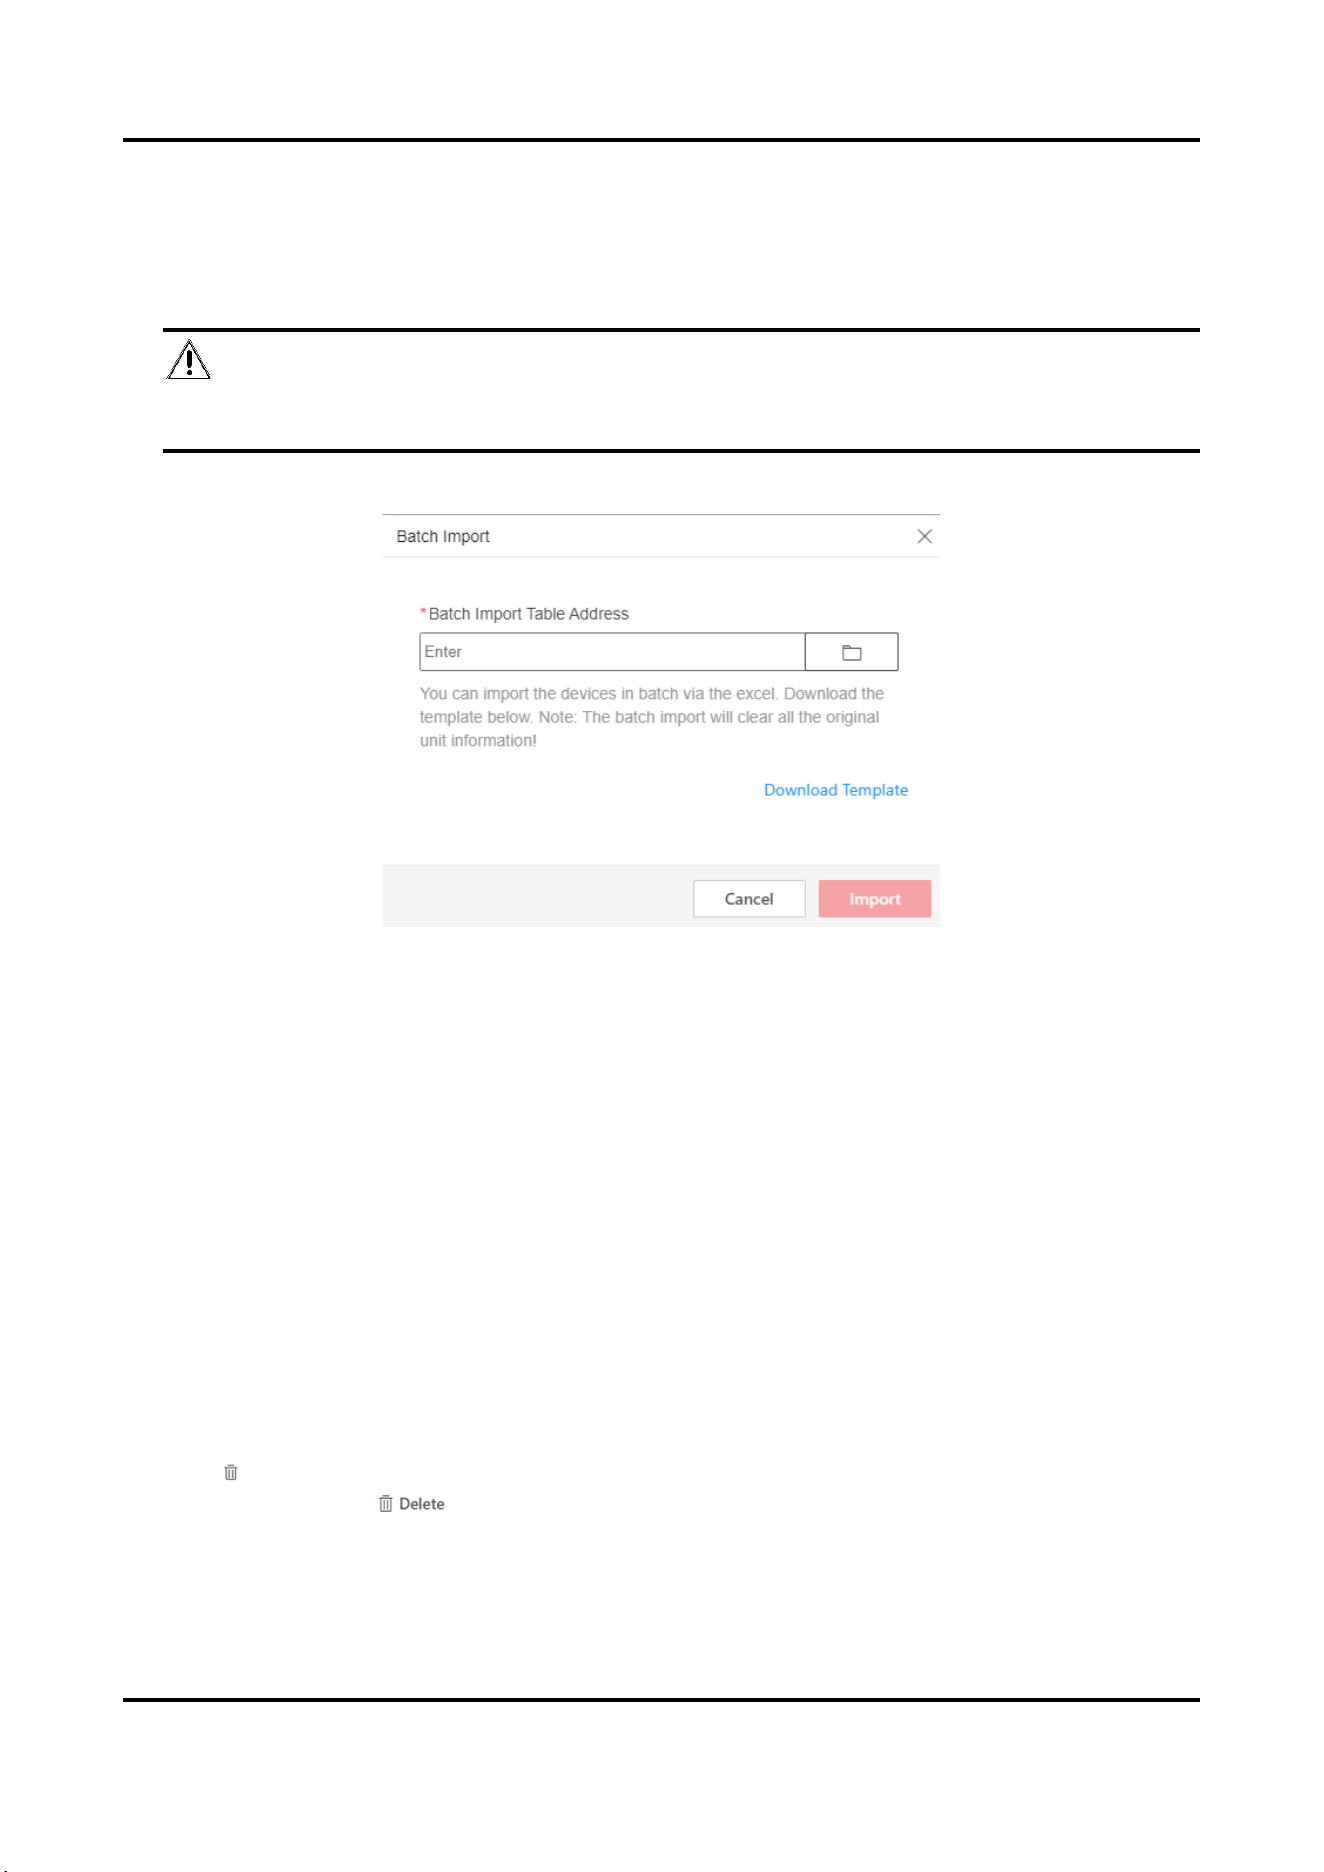
Batch Add Unit/Import&Export Unit Data
1. Click Import.
2. Click Download Template in the pop-up window. Enter relevant parameters according to template.
Note
● The batch import will clear all the original unit information. Please operate with care.
● The imported form template is English.
Figure 3-23 Batch Import
3. Click Import.
4. Select the completed template.
5. Optional Operation: Click Export to export the unit parameters. Only all unit parameters can be exported.
Batch Edit Unit
1. Select the unit in the list.
2. Click Batch Edit.
3. Edit the parameters to be edited in the pop-up window.
You can batch edit unit name, unit type, and sensitivity. You can also enable or disable alarm switches and
smart algorithms in a batch.
4. Click Save.
Batch Edit Alarm Switch
Select the unit in the list. Click Bath Enable/Disable Alarm Switches. Select Bath Enable the Above Units or Bath
Disable the Above Units in a pop-up window. Click Save.
Delete Unit
● Click to delete the unit.
● Select the units, click , and delete them in a batch.
Sensitivity Preset
Go to Configuration → Fiber Monitoring Configuration → Optical Fiber Unit → Sensitivity Preset to enter the
User Manual
23
interface.
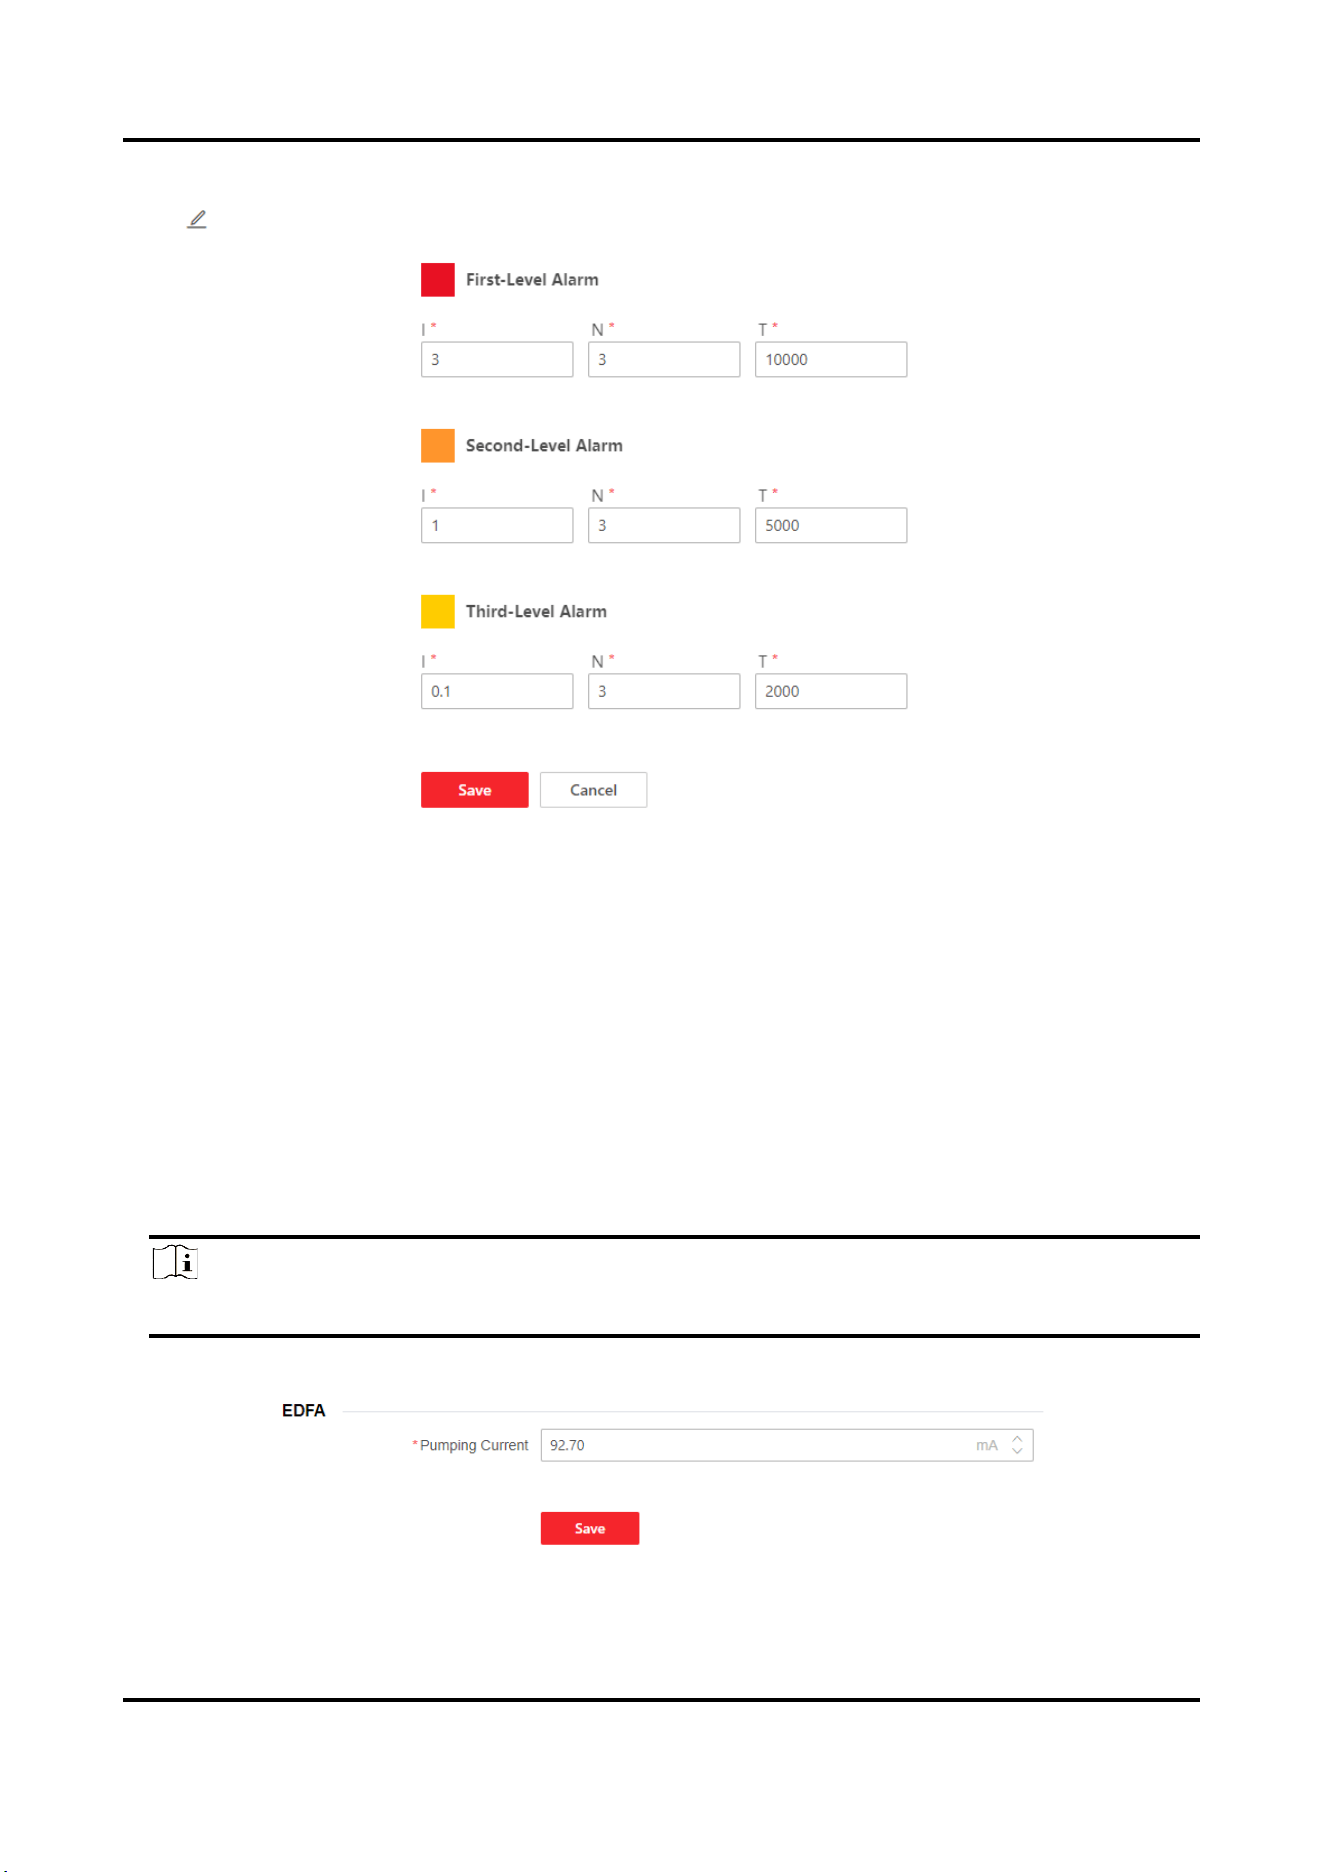
Click to edit and save the parameters in the pop-up window.
Figure 3-24 Edit Sensitivity
I stands for intensity. N stands for number of times. T stands for duration (ms).
Recommended Sensitivity: Third-Level Alarm: I0.2/N10/T2000, Second-Level Alarm: I1/N30/T5000, First-Level
Alarm: I3/N50/T10000.
Alarm Intensity: First-Level Alarm Intensity > Second -Level Alarm Intensity > Third -Level Alarm Intensity.
Optical Fiber Basic Information
Go to Configuration → Optical Fiber Monitoring Settings → Optical Fiber Unit →Optical Fiber Basic
Information to enter the interface.
Select Channel, and enter the usage length. The system will read the actual length automatically.
The actual length depends on the fiber cut position.
Processor Settings
Note
Only certain models support the function.
Go to Configuration → Optical Fiber Monitoring Settings → Processor to enter the interface.
Figure 3-25 Processor Settings
User Manual
24
EDFA is a optical fiber amplifier used to amplify the power of the optical fiber.
Pumping Current
The higher the current value, the higher the power of the optical fiber.
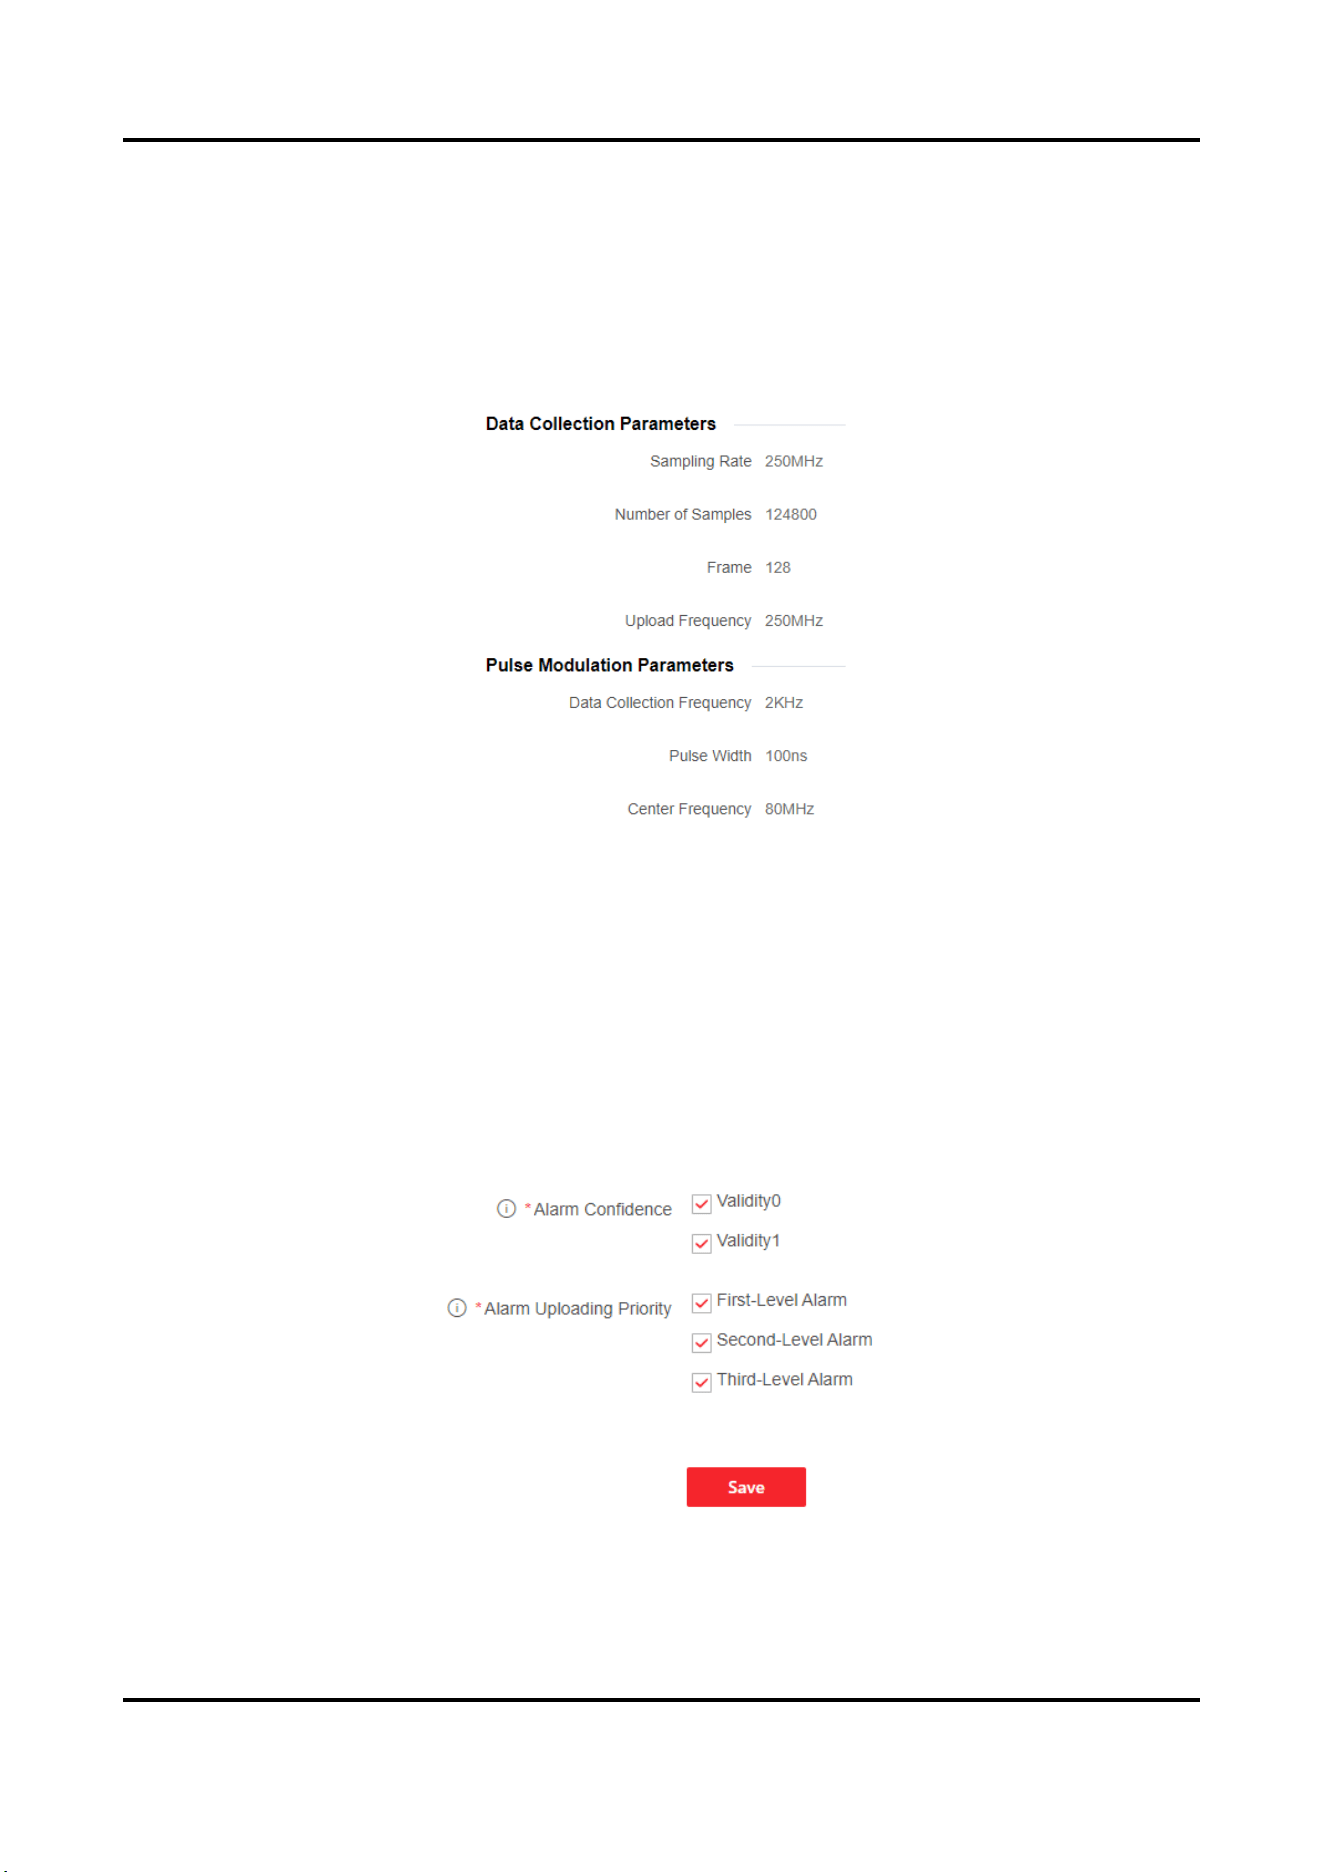
Acquisition Card Settings
Go to Configuration → Optical Fiber Monitoring Settings → Acquisition Card to enter the interface.
You can view data collection parameters and pulse modulation parameters.
Figure 3-26 Processor Settings
3.3.4 Upload Event Report
Go to Configuration → Upload Event Report to enter the interface.
Set Alarm Confidence and Alarm Uploading Priority.
Alarm Confidence
After enabling smart algorithm in unit management, the system will automatically judge if the alarm is true
or false. 1 indicates that the alarm event is likely to be true. 0 indicates that the alarm event is likely to be
false.
Figure 3-27 Upload Event Report
User Manual
25
3.4 Maintenance and Security
Go to Maintenance and Security to enter the interface.
You can view device status, fiber monitoring, log, etc. Reboot or debug the device.
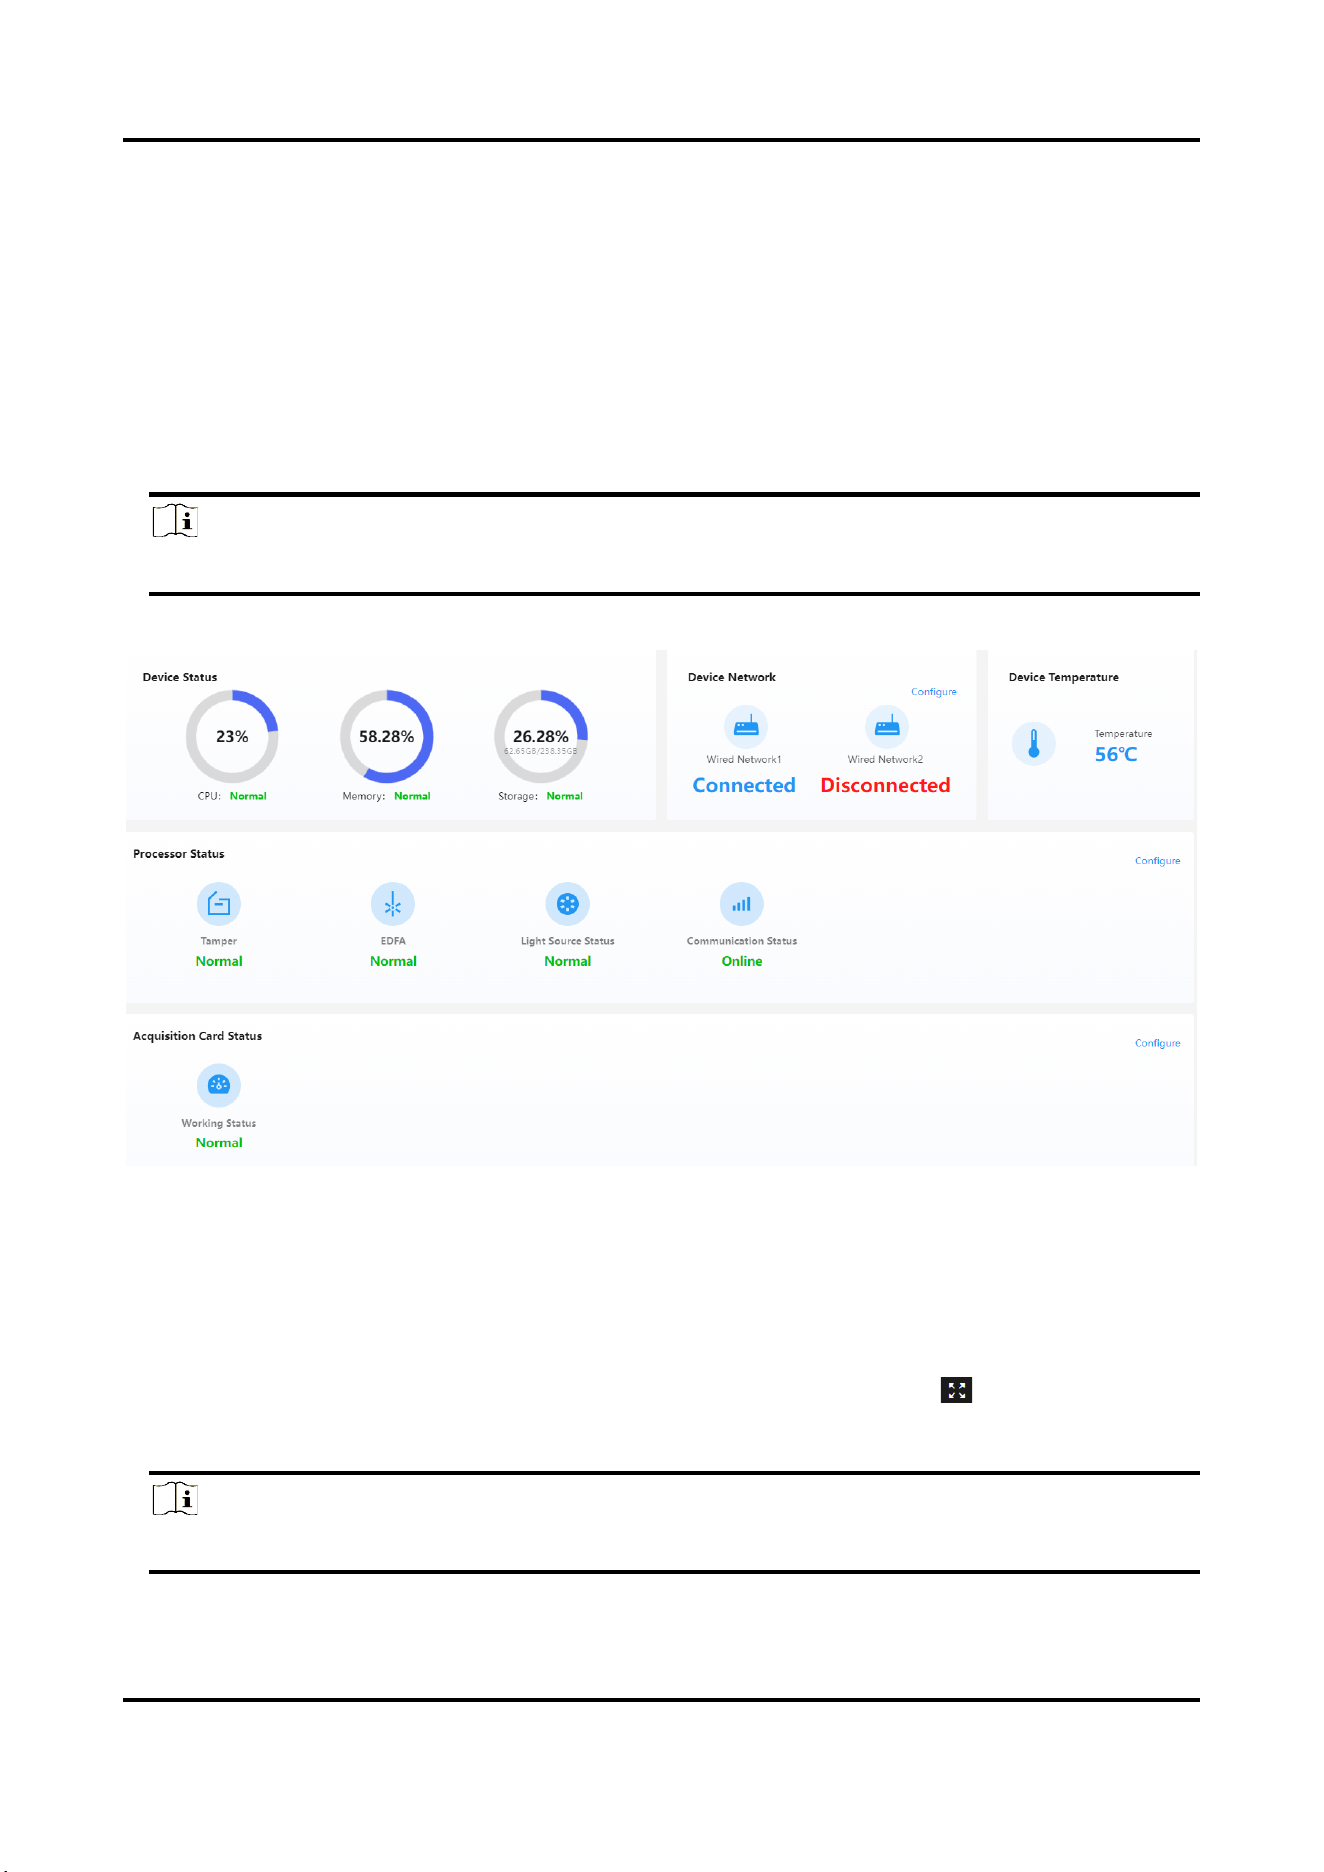
3.4.1 Device Status
Go to Maintenance and Security → Maintenance → Device Status to enter the interface.
View device status, device network status, device temperature, etc. Click Configure to enter configuration
interface.
Note
The interface varies with models.
Figure 3-28 Device Status
3.4.2 Fiber Monitoring
Go to Maintenance and Security → Maintenance → Fiber Monitoring to enter the interface.
Hover the cursor over the chart to zoom in or out. Hold the left mouse button to drag the chart.
Dual-Channel device can switch channel to view the chart of different channels. Click to display the chart in
full screen.
Note
The interface varies with models.
User Manual
26
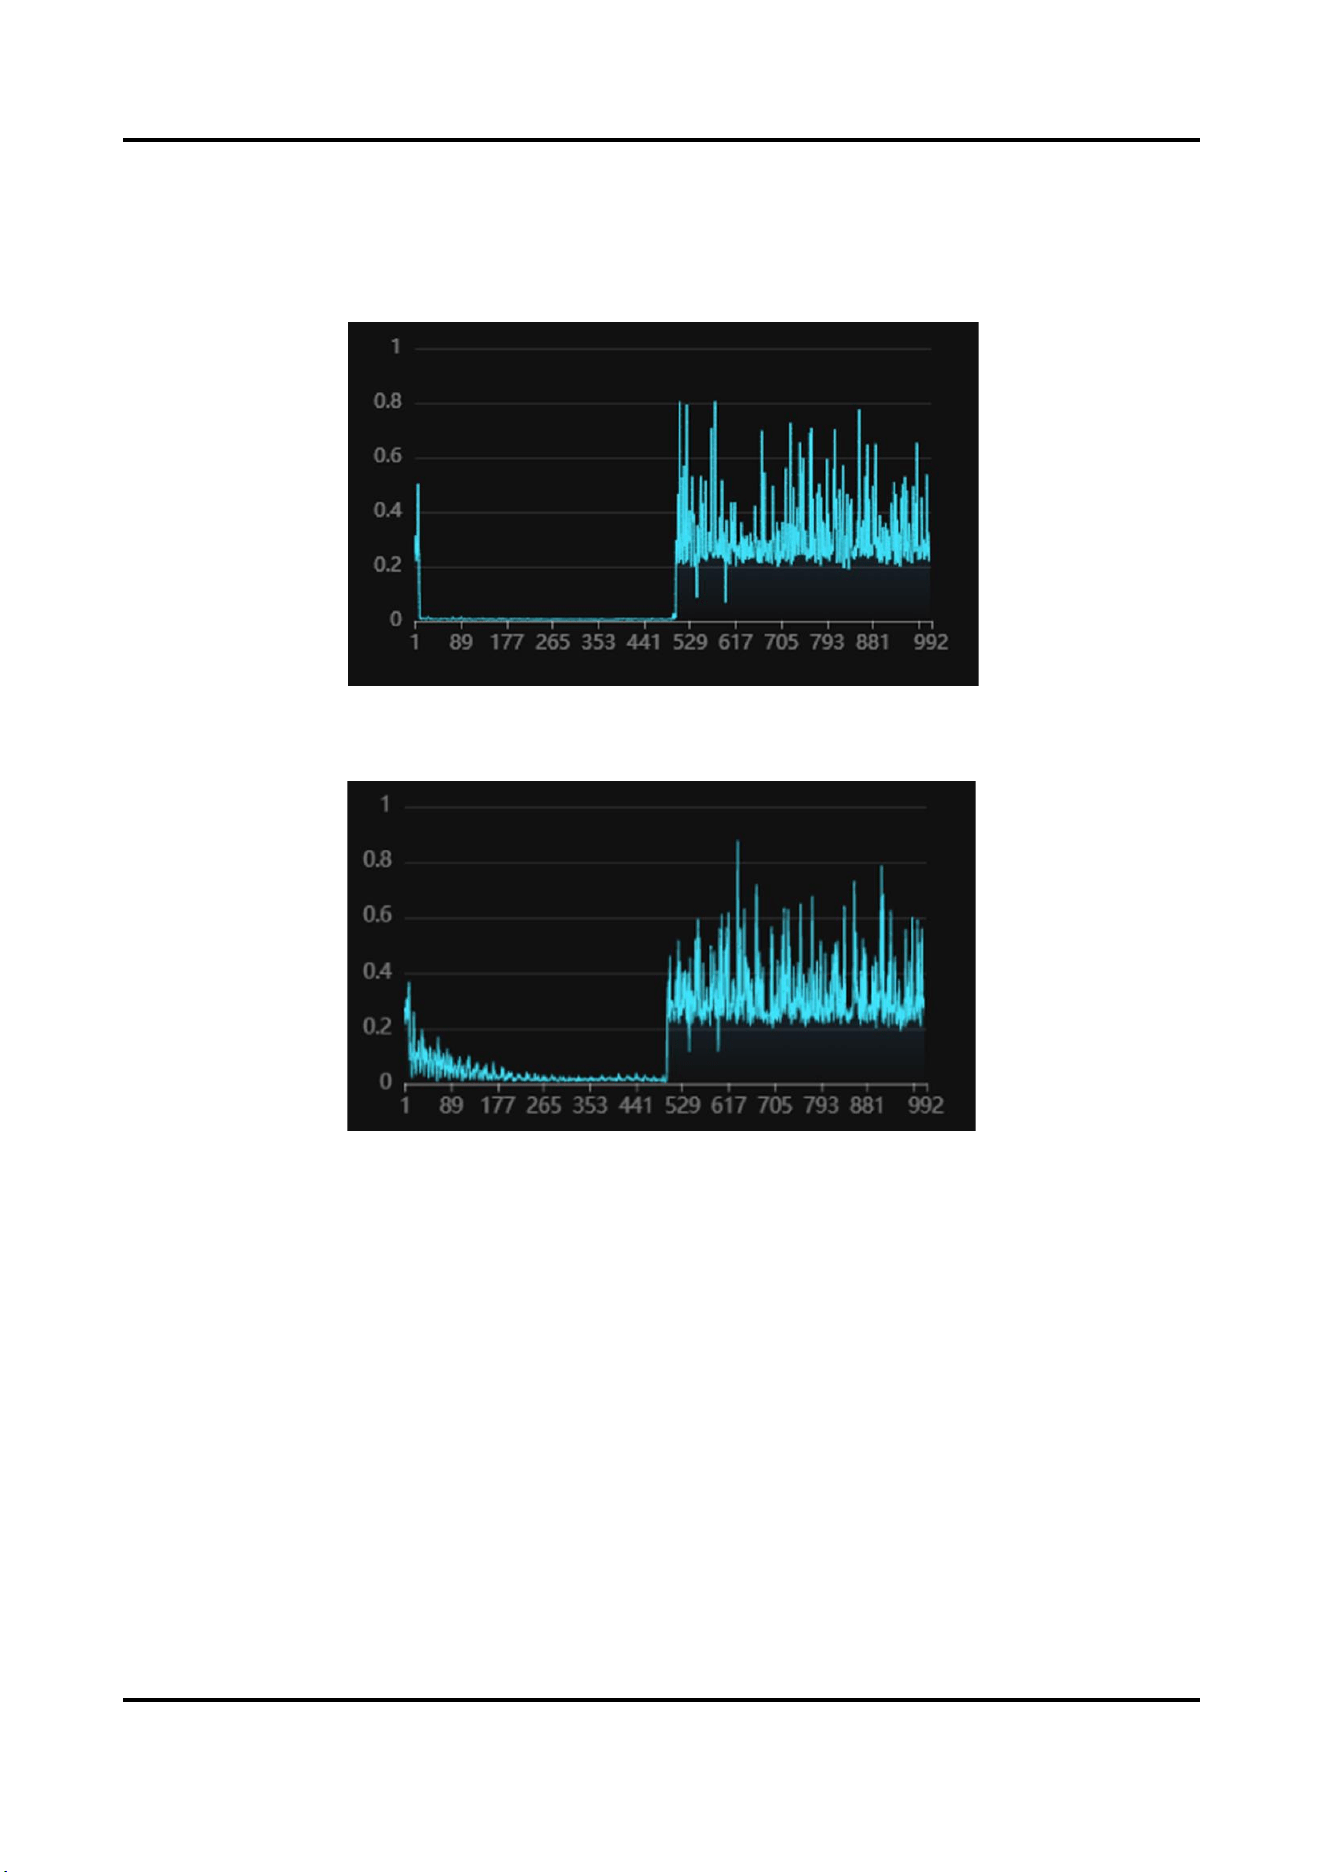
Power Spectrum
Display the power statistics of each unit.
As shown in the figure below, the lower-level segment on the left indicates that the signals of unit 1 to 500
are normal, and the bottom noise on the right indicates that units above 500 have no signal.
Figure 3-29 Power Spectrum
When there is vibration, the left part will fluctuate.
Figure 3-30 Power Spectrum (With Vibration)
Waterfall Plot
The vertical axis is the time, and the horizontal axis is the unit. It shows vibration ranges in past time with
two-dimensional figure.
As shown in the figure below, the unit 1 to 500 on the left have signals and the signals are normal, and the
bottom noise on the right indicates that units above 500 have no signals.
User Manual
27
Figure 3-31 Waterfall Plot
When there is vibration, a white vibration band will be displayed.
Figure 3-32 Waterfall Plot (With Vibration)
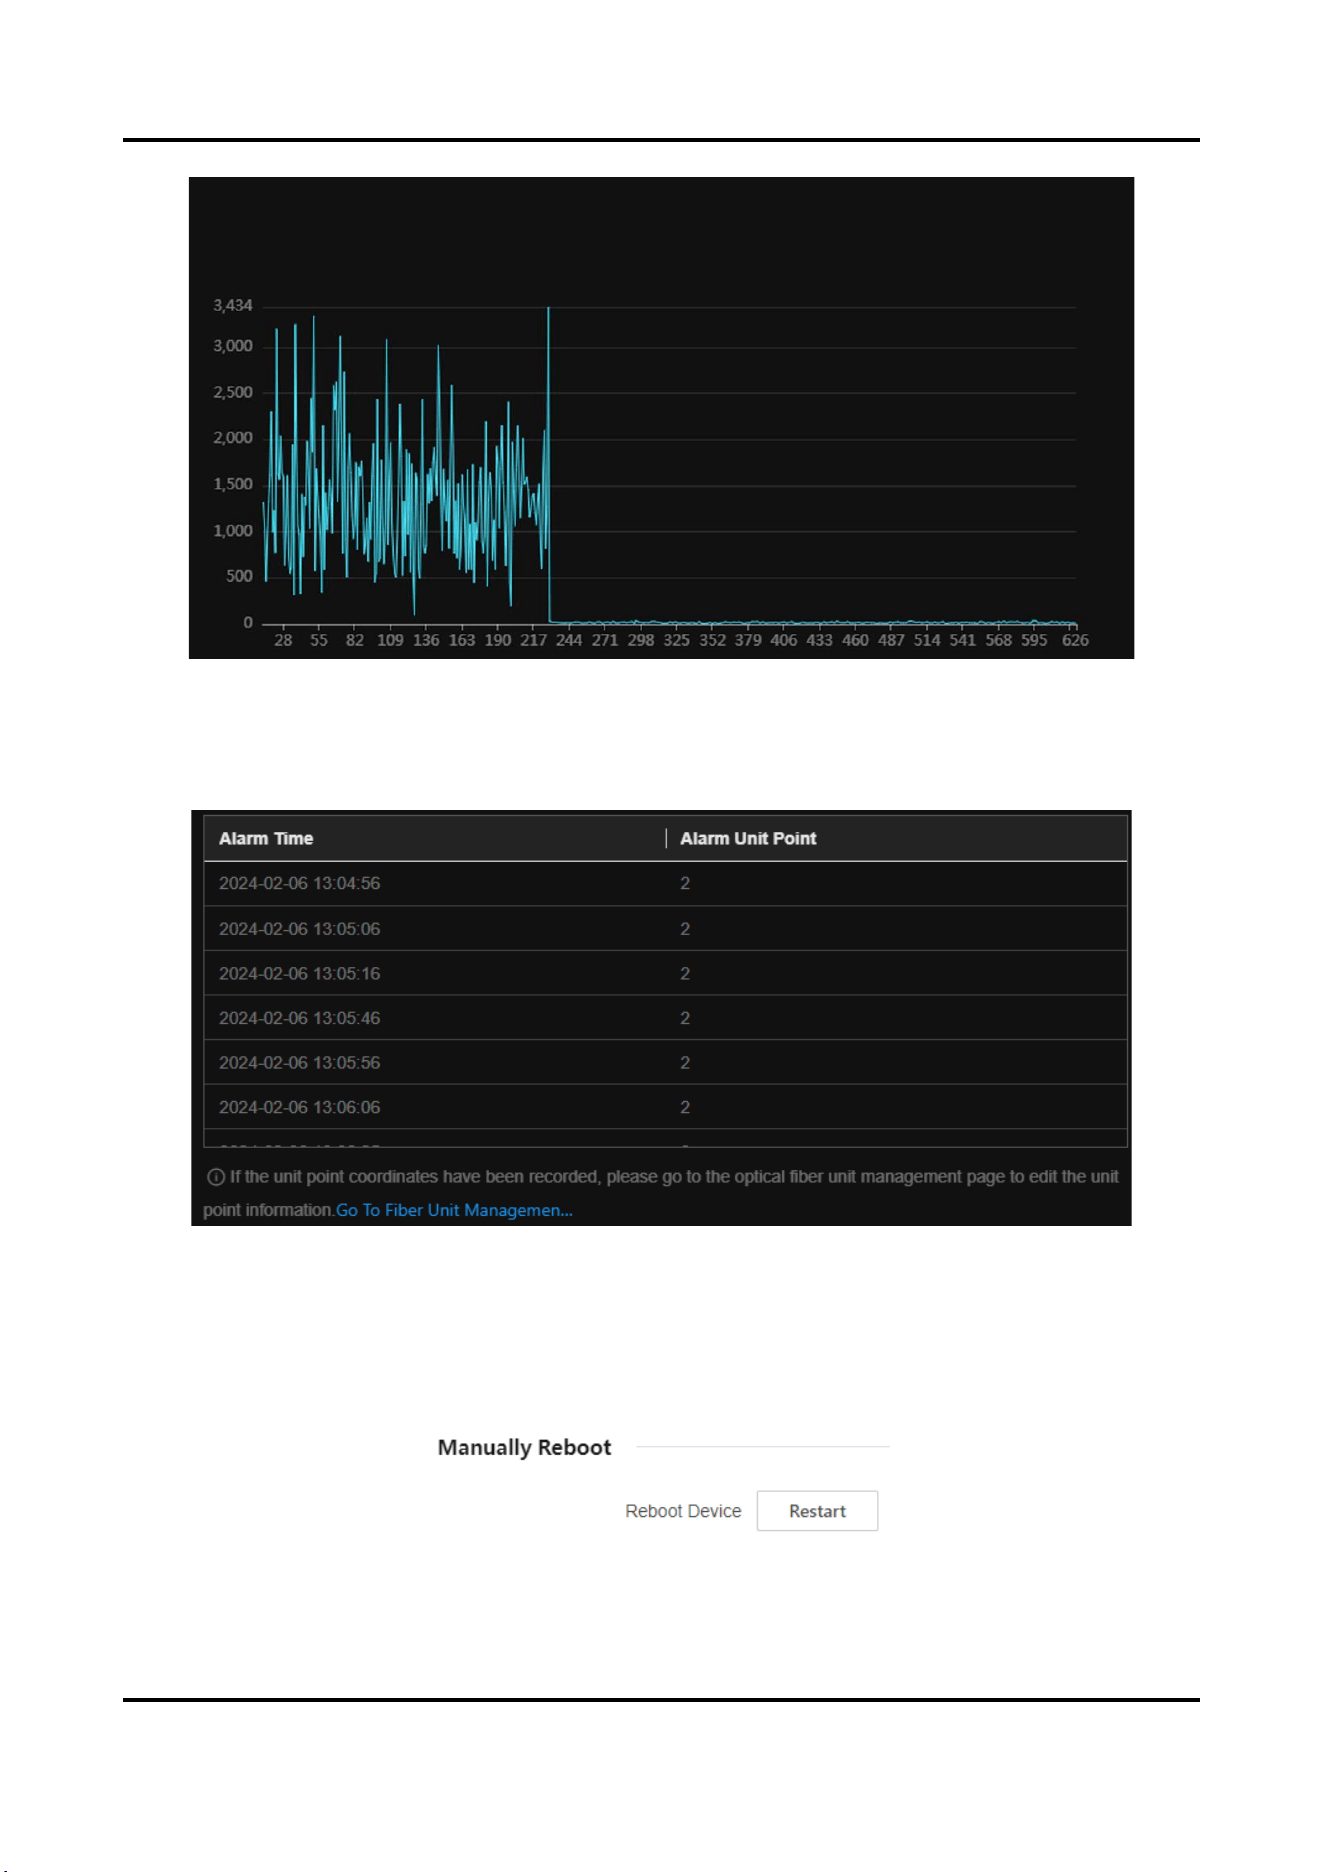
Amplitude Curve
It is mainly used to check signal strength and whether the fiber is broken.
Under normal circumstances, it is fluctuating curve. If the fiber is broken, there is no curve. As shown in the
following figure, the signals of unit 1 to 230 are normal (the vertical axiss can be regarded as signal
strength). Units above 230 have no signals.
You can see the broken unit through the amplitude curve.
User Manual
28
Figure 3-33 Amplitude Curve
Current Alarm
Display current alarm event and alarm unit.
Figure 3-34 Current Alarm
3.4.3 Restart
Go to Maintenance and Security → Maintenance → Restart to enter the interface.
You can restart the device manually.
Figure 3-35 Restart
User Manual
29
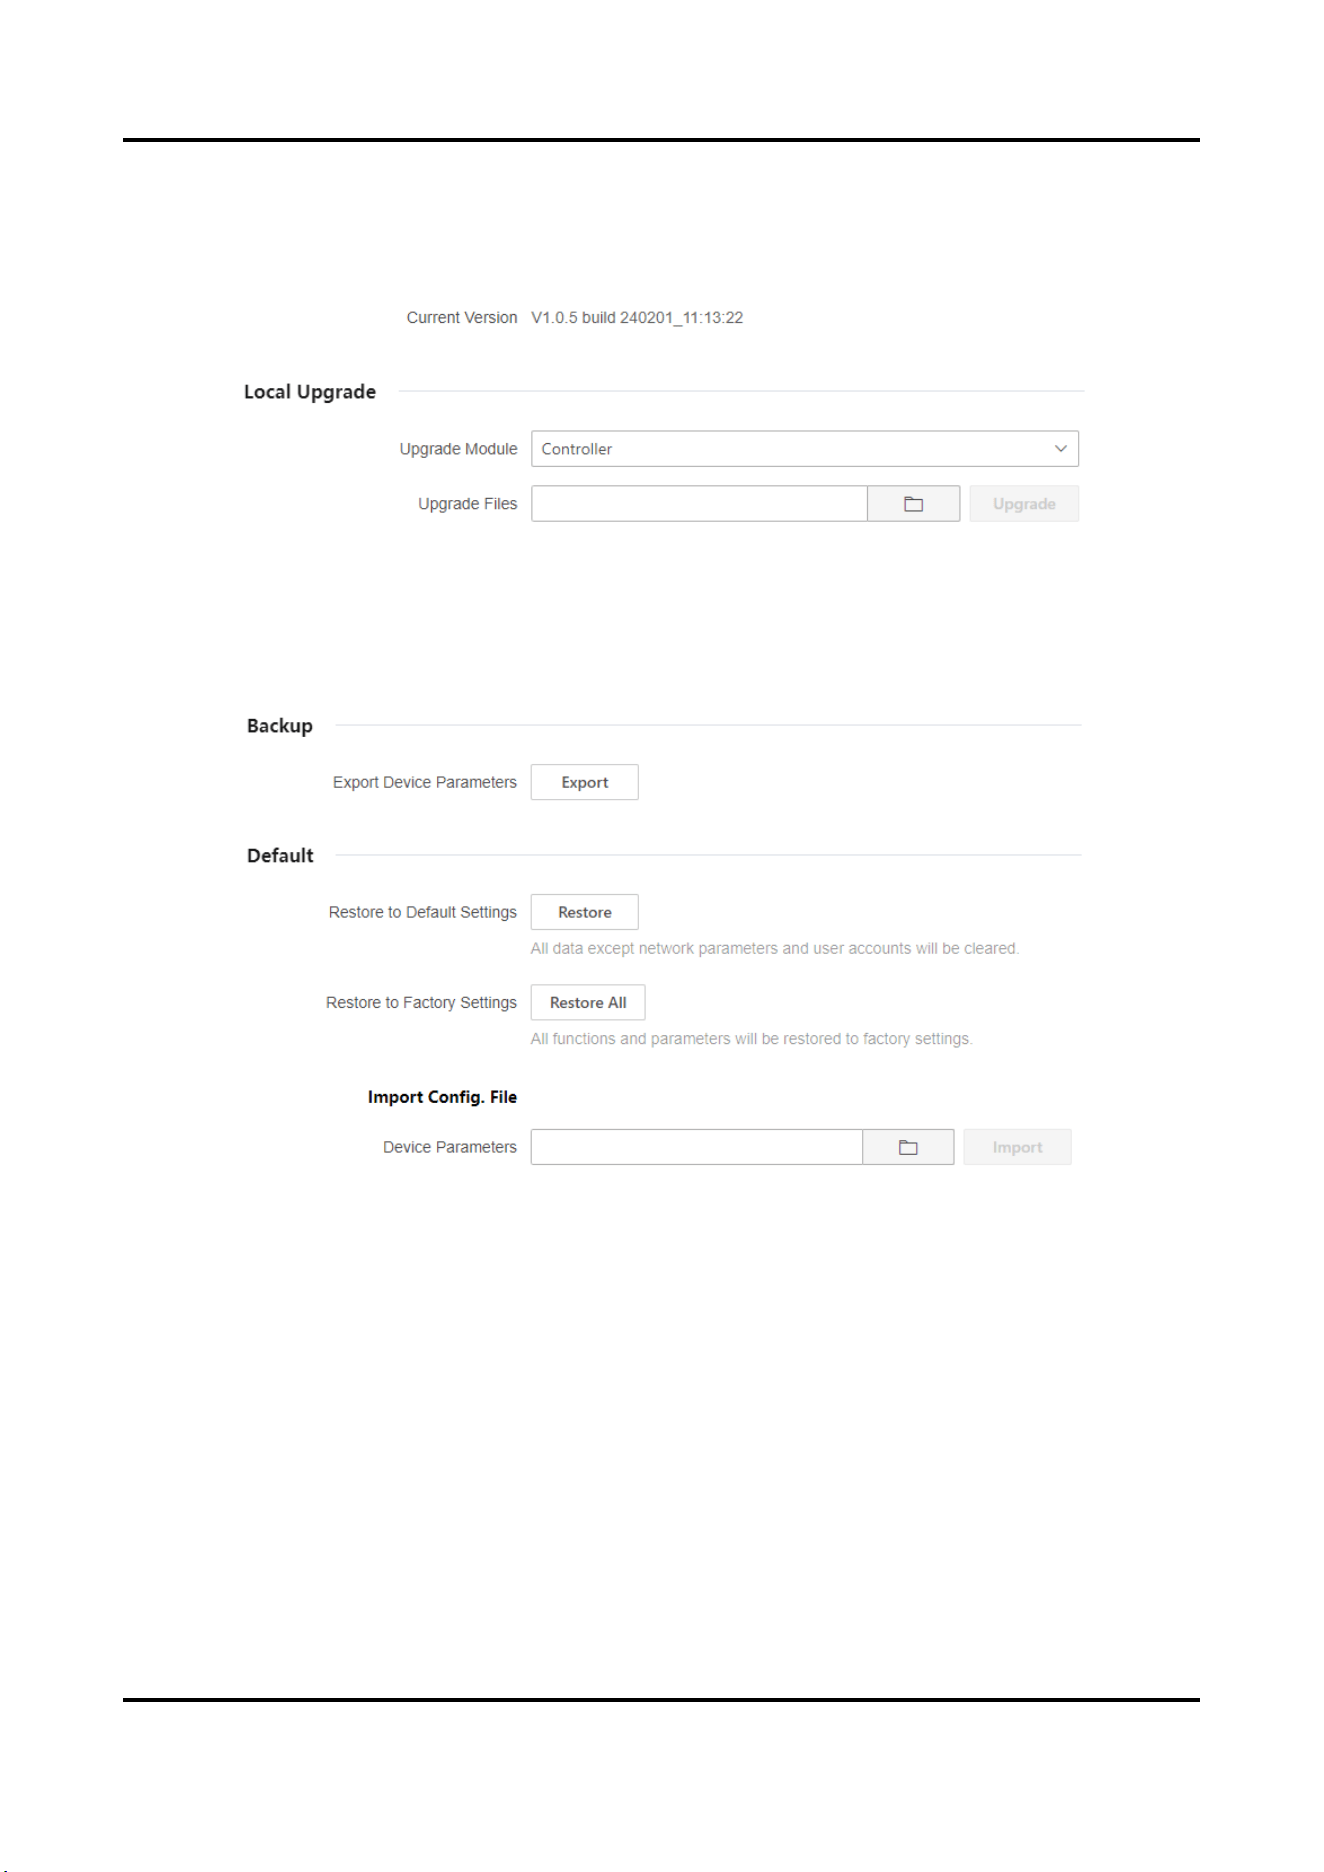
3.4.4 Upgrade
Go to Maintenance and Security → Maintenance → Upgrade to enter the interface.
You can view the current version, select the upgrade module and upgrade files to upgrade.
Figure 3-36 Upload
3.4.5 Backup and Reset
Go to Maintenance and Security → Maintenance → Backup and Reset to enter the interface.
Figure 3-37 Backup and Reset
Export Device Parameters
Click Export to export configuration file. The configuration file contains parameter information of the device.
Restore to Default Settings
Click Restore, all data except network parameters and user accounts will be cleared.
Restore to Factory Settings
Click Restore All, all functions and parameters will be restored to factory settings.
Import Config. File
Select the file address and click Import to import the configuration file from the local computer to the
device.
User Manual
30
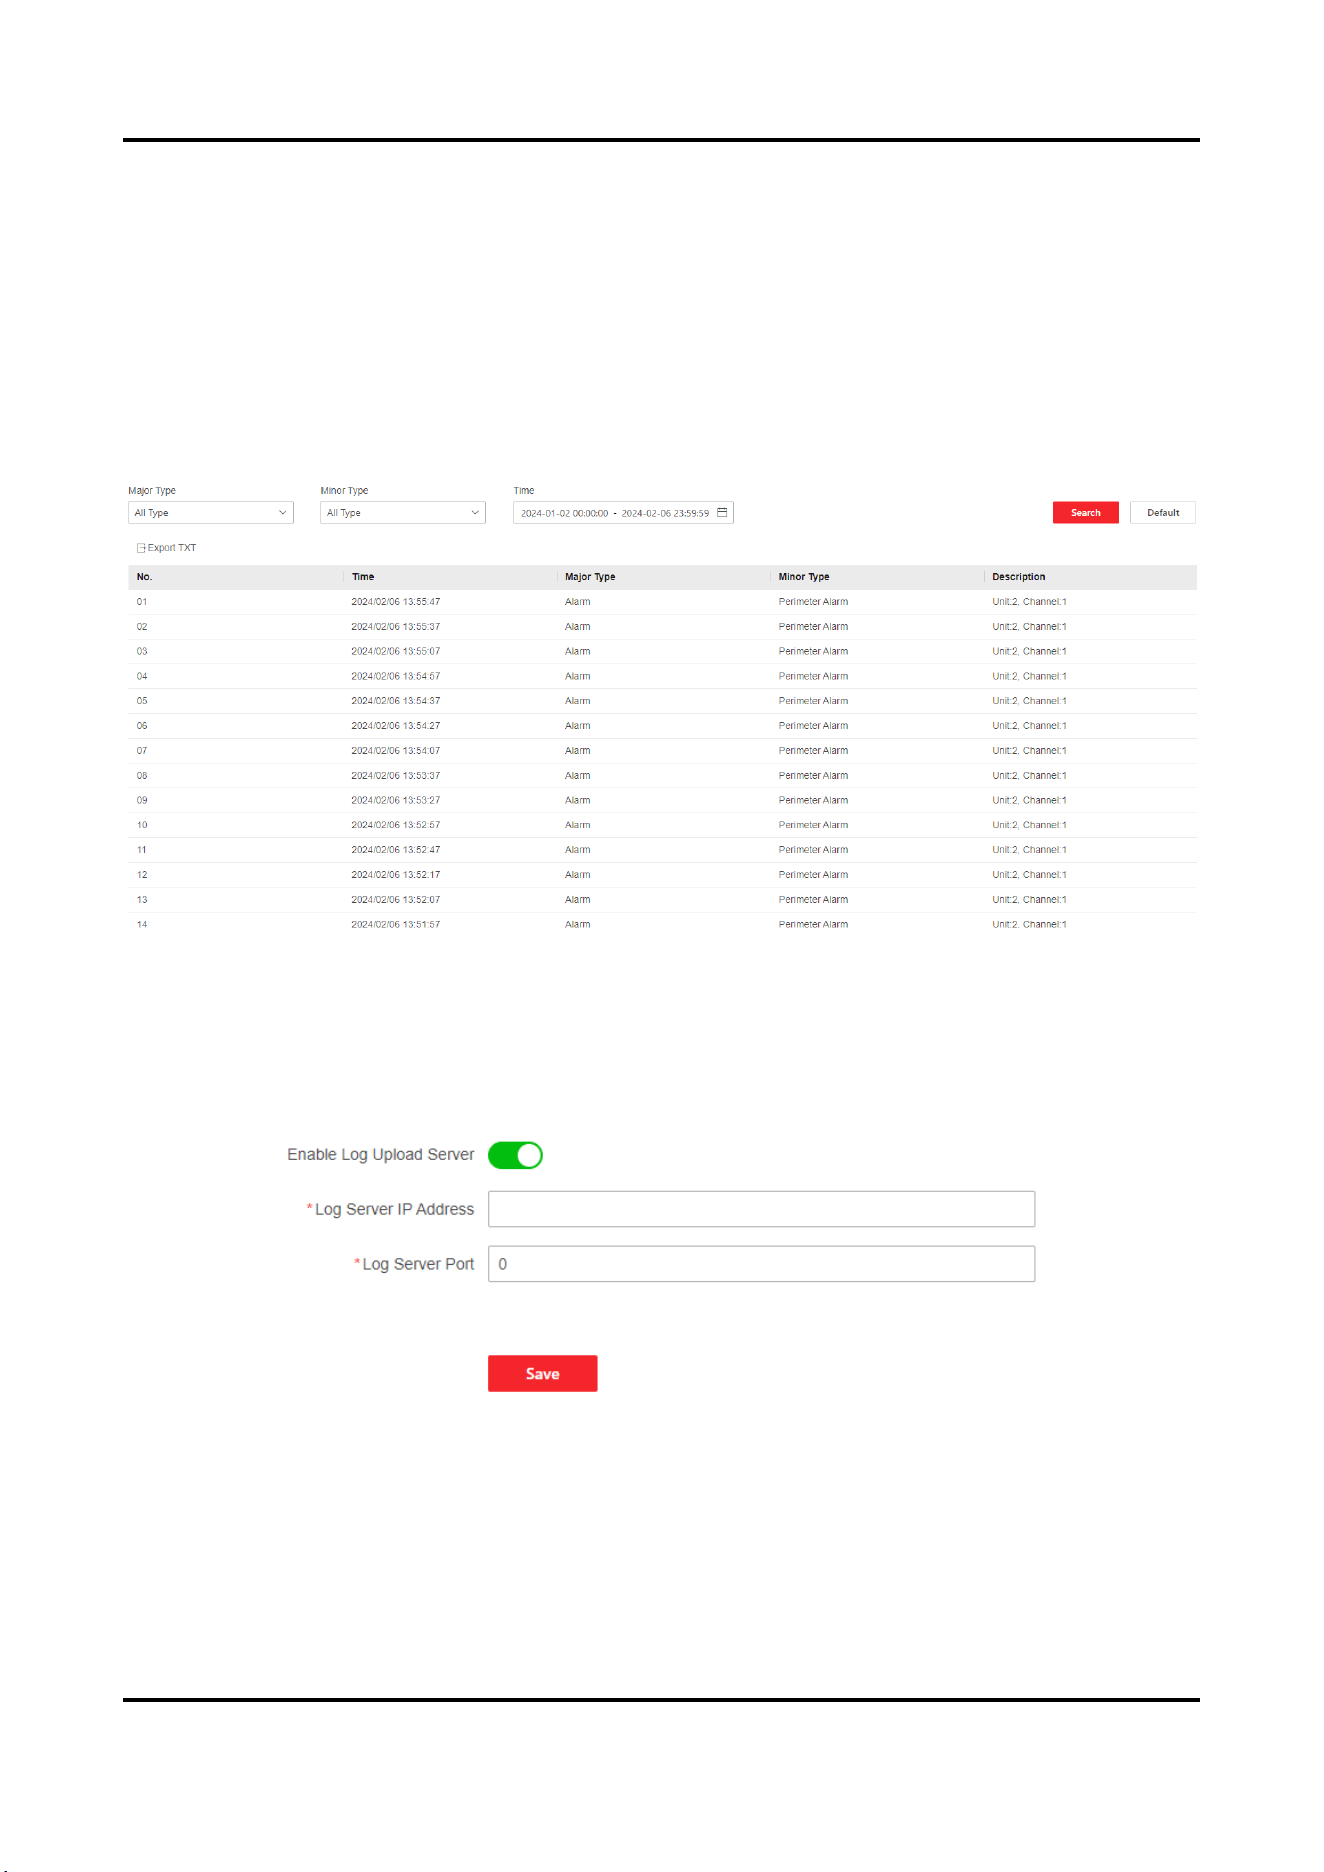
3.4.6 Search and Manage Log
Log helps locate and troubleshoot problems.
Steps
1. Go to Maintenance and Security → Maintenance → Log.
2. Set search conditions, Major Type, Minor Type, Start Time, and End Time.
3. Click Search.
The matched log files will be displayed on the log list.
4. Optional Operation: Click Export to save the log files in your computer.
Figure 3-38 Log
3.4.7 Security Audit Log
Go to Maintenance and Security → Maintenance → Security Audit Log to enter the interface.
Enable Enable Log Upload Server, input Log Server IP Address and Log Server Port, and click Save.
Figure 3-39 Security Audit Log
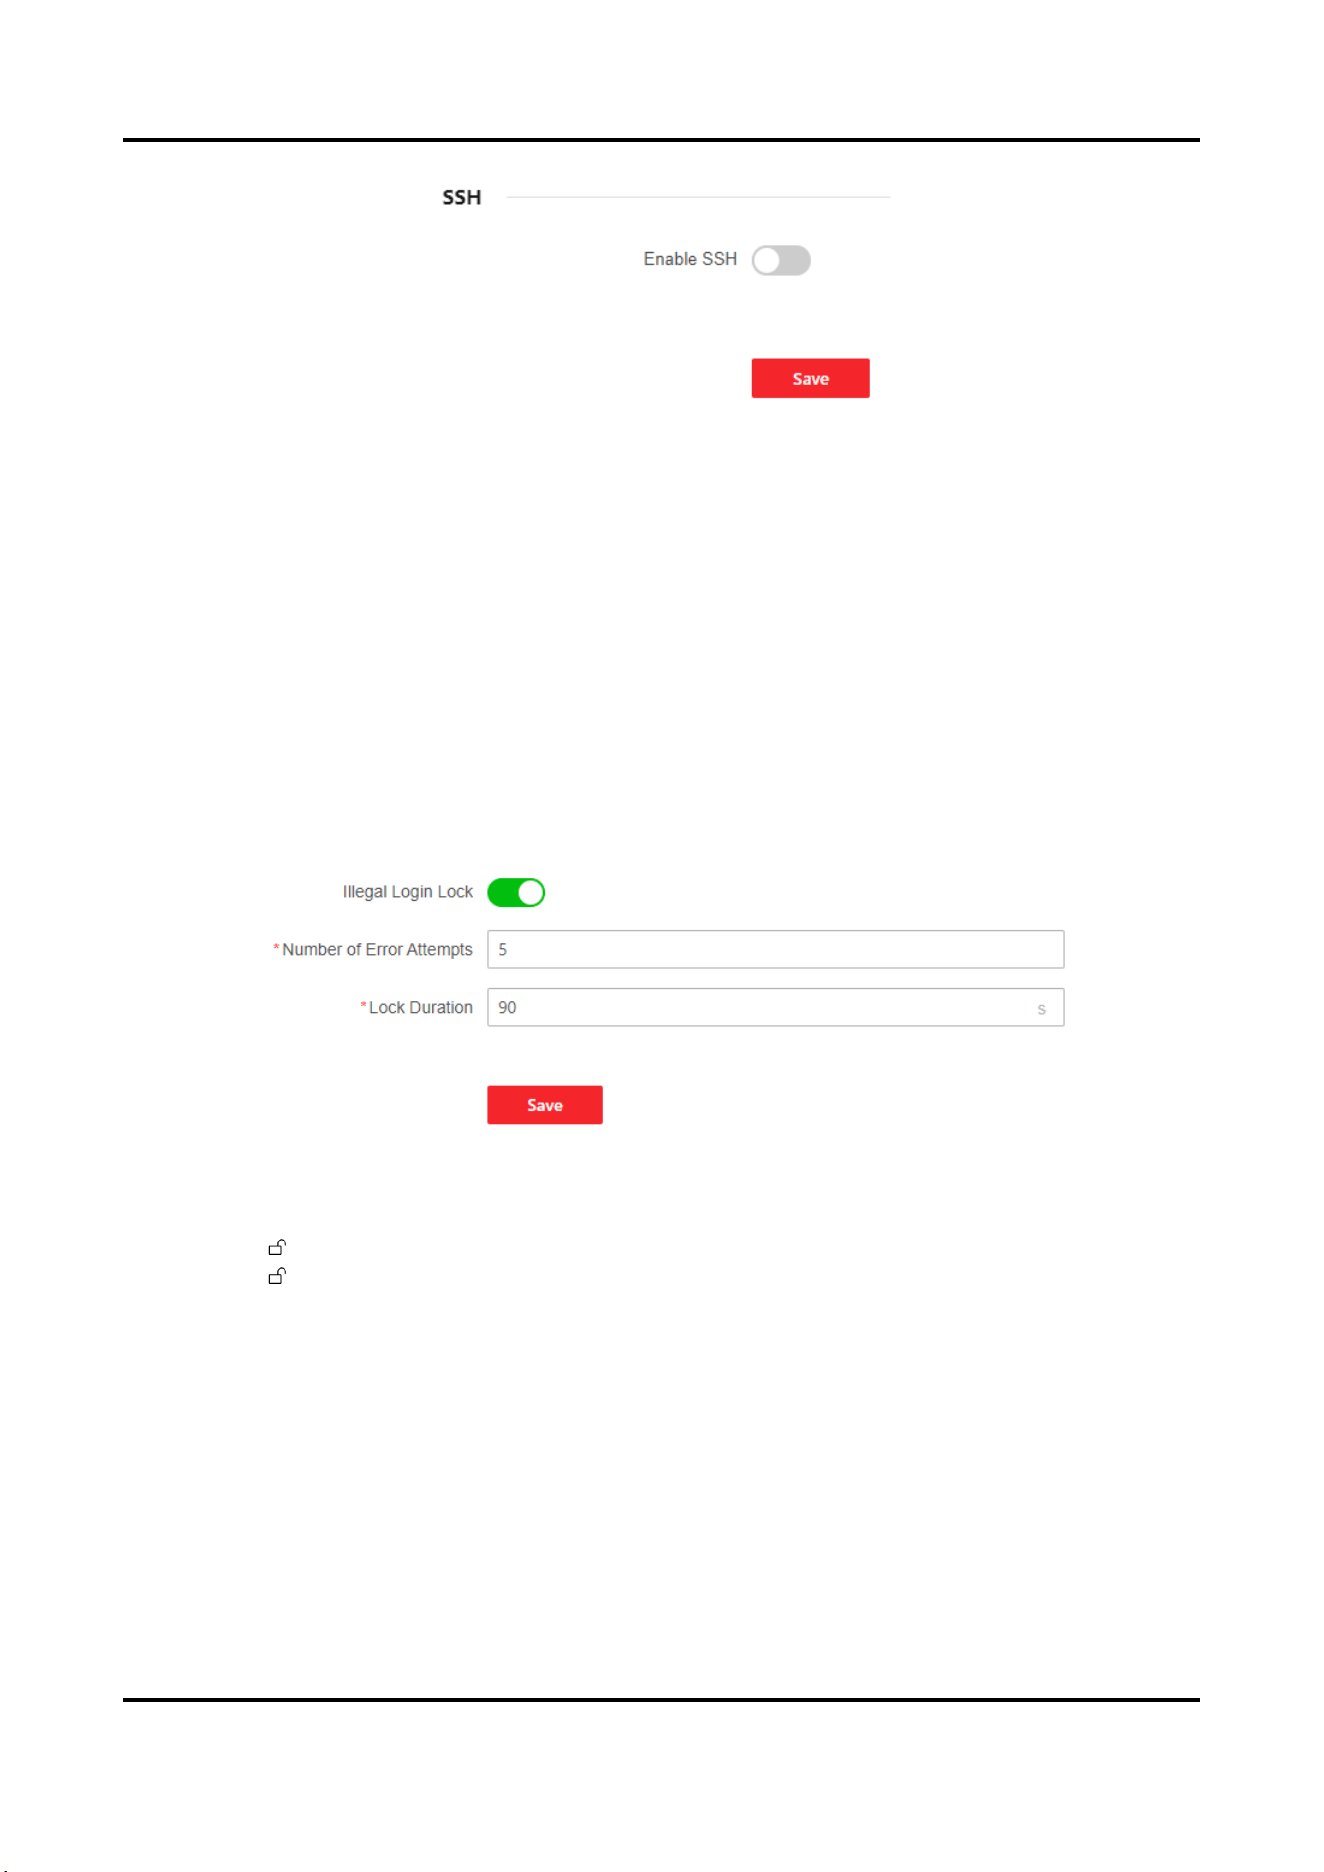
3.4.8 Device Debugging
Go to Maintenance and Security → Maintenance → Device Debugging to enter the interface.
You can enable SSH for debugging. It is recommended to disable SSH during daily use.
User Manual
31
Figure 3-40 Device Debugging
3.4.9 Login Management
It helps to improve the security when accessing the device via Internet.
Steps
1. Go to Maintenance and Security → Security → Login Management to enter the interface.
2. Enable Illegal Login Lock.
3. Set parameters.
Number of Error Attempts
When your login attempts with the wrong password reach the set times, the device is locked.
Lock Duration
The device releases the lock after the setting duration.
Figure 3-41 Illegal Login Lock
4. Click Save.
5. Optional Operation: The user can be unlocked through the following operations.
– Click to unlock the locked user in the list.
– Click Unlock All to unlock all locked users.

UD37576B