Loading ...
Loading ...
Loading ...
ScopeMeter® Test Tool 190 Series II
Users Manual
42
Plotting Measurements Over Time
(TrendPlot™)
Use the TrendPlot function to plot a graph of Scope or
Meter measurements (readings) as function of time.
Note
Because the navigations for the TrendPlot Scope
and the TrendPlot Meter are identical, only Scope
TrendPlot is explained in the next sections.
Starting a TrendPlot Function
To start a TrendPlot, do the following:
1
Make automatic Scope or Meter measurements,
see Chapter 1. The readings will be plotted!
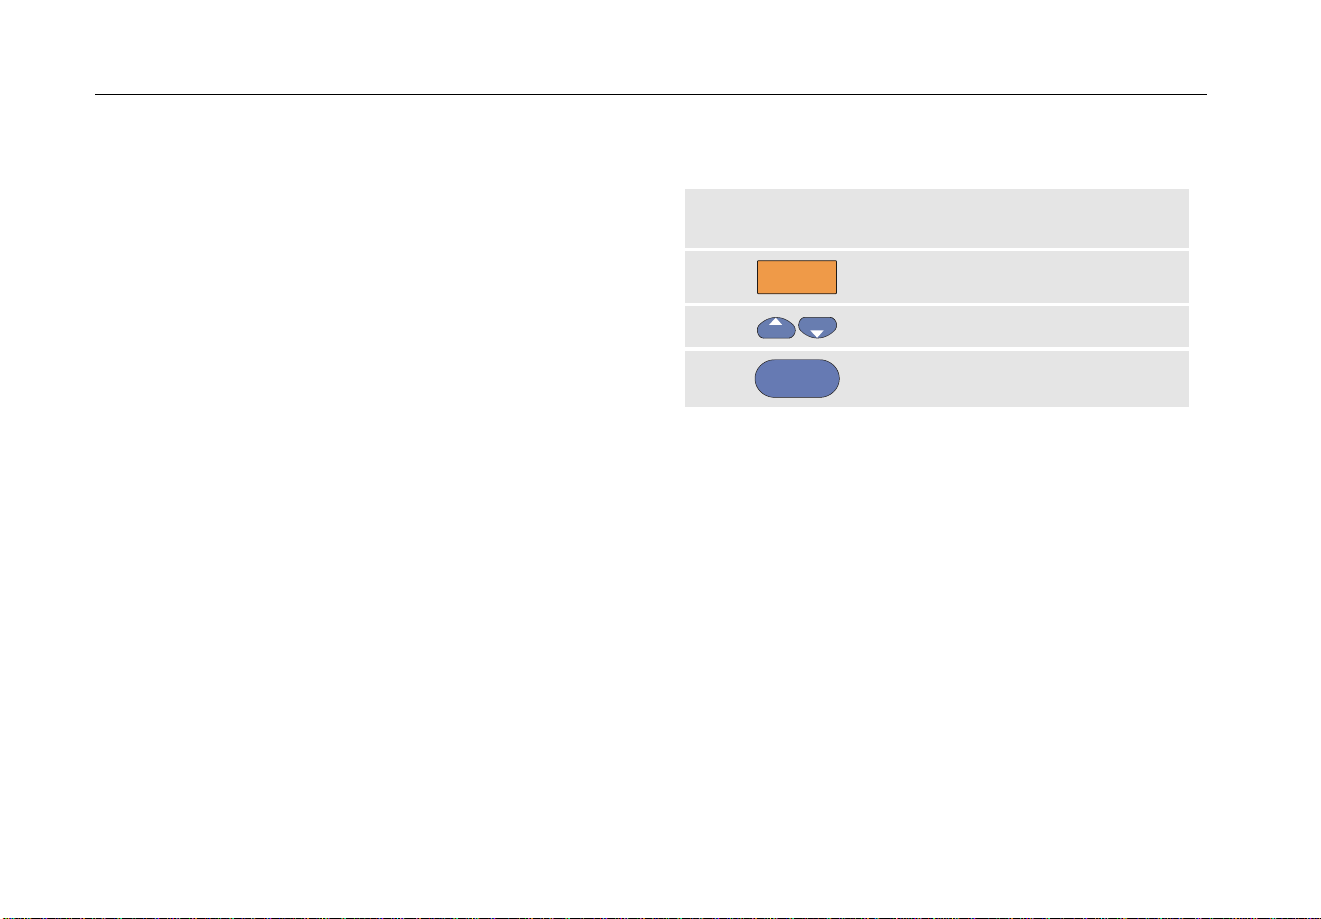
2
RECORDER
Open the
RECORDER
main menu.
3
Highlight Trend Plot.
4
ENTER
Start the TrendPlot recording.
The test tool continuously records the digital readings of
the measurements and displays these as a graph. The
TrendPlot graph rolls from right to left like a paper chart
recorder.
Observe that the recorded time from start appears at the
bottom of the screen. The present reading appears on top
of the screen. (See Figure 20.)
1.888.610.7664 sales@GlobalTestSupply.com
Fluke-Direct.com
Loading ...
Loading ...
Loading ...