USER’S MANUAL
Handheld Spectrum Analyzer
HSA2030/HSA2016 Series
V1.0.0

Notice
Qingdao Hantek Electronic co., Ltd. All Rights Reserved.
Qingdao Hantek Electronic co., Ltd. reserves the right to modify or change parts of or all the
specifications without special notification. Qingdao Hantek Electronic co., Ltd. promises that the
information is all correct and reliable but does not guarantee no mistake in this document. Please
confirm that the relevant document and specification is the latest valid version before using. If
needs any help from third-party products, patents or works when using Hantek document or
product, please be liable to get the approvement and authorization from the third-party company.
It is not Hantek’s responsibility to get the above approvement and authorization.

Contents
CHAPTER1 QUICK START ............................................................................. 7
1.1 Instrument Introduction ..................................................................................... 8
1.2 General Inspection ............................................................................................ 9
1.3 To Prepare for Use ............................................................................................ 9
CHAPTER2 OPERATING BASICS .................................................................. 10
2.1 Front Panel...................................................................................................... 11
2.1.1 Menu Reference ............................................................................................................ 11
2.1.2 Front Panel Function Keys ............................................................................................. 12
2.1.3 Numeric Keyboard ......................................................................................................... 12
2.2 Top Panel ........................................................................................................ 14
2.3 Side Panel ....................................................................................................... 14
2.3.1 Right Panel ..................................................................................................................... 14
2.3.2 Left Panel ....................................................................................................................... 15
2.4 User Interface .................................................................................................. 16
2.5 Menu Operation .............................................................................................. 17
2.6 Parameter Setting ........................................................................................... 18
CHAPTER3 BASIC SETTINGS ....................................................................... 20
3.1 Basic Settings ................................................................................................. 21
3.1.1 FREQ ............................................................................................................................... 21
3.1.2 SPAN ............................................................................................................................... 23
3.1.3 AMPT.............................................................................................................................. 24
3.2 Sweep and Function Settings.......................................................................... 26
3.2.1 BW .................................................................................................................................. 26
3.2.2 Sweep ............................................................................................................................. 27
3.2.3 Trace .............................................................................................................................. 28
3.3 Marker Measurement ...................................................................................... 30
3.4 Shortcut Key .................................................................................................... 33
3.4.1 Auto ............................................................................................................................... 33
3.4.2 Preset ............................................................................................................................. 34
3.4.3 Utility ............................................................................................................................. 35
CHAPTER4 TEST CASE ................................................................................ 40
4.1 Testing Low Level Signal ................................................................................. 40
4.1.1 Reduce the Loss of Input ............................................................................................... 40
4.1.2 Reduce the Resolution Bandwidth ................................................................................ 42
4.1.3 Trace Average ................................................................................................................. 43
4.2 Measuring Signal Distortion ............................................................................ 44
CHAPTER5 SCPI PROGRAMME .................................................................. 47
5.1 SCPI Brief Introduction .................................................................................... 48
5.1.1 Basic Knowledge Requirement ...................................................................................... 48
5.1.2 Command Syntax ........................................................................................................... 48
5.1.3 Standard Notations ........................................................................................................ 48
5.1.4 Punctuation.................................................................................................................... 49
5.1.5Separator ........................................................................................................................ 49
5.1.6 Default unit of parameters ............................................................................................ 49
5.2 Common Commands ...................................................................................... 49

5.2.1 Clear Status .................................................................................................................... 49
5.2.2 Identification Query ....................................................................................................... 49
5.2.3 Reset .............................................................................................................................. 50
5.2.4 ABORt Command ........................................................................................................... 50
5.3 CALCulate Subsystem .................................................................................... 50
5.3.1 CALCulate: MARKer Subsection ..................................................................................... 50
5.4 DEMOdulation Subsystem .............................................................................. 52
5.4.1 AM Demodulation ......................................................................................................... 52
5.4.2 FM Demodulation .......................................................................................................... 52
5.5 DISPlay Subsystem ........................................................................................ 53
5.5.1 Trace Y-Axis Scaling ........................................................................................................ 53
5.5.2 Trace Y-Axis Reference Level .......................................................................................... 53
5.5.3 Trace Y-Axis Reference Level Offset ............................................................................... 53
5.6 TRACe Subsystem .......................................................................................... 54
5.6.1 Read appointed trace data ............................................................................................ 54
5.6.2 Select trace display mode .............................................................................................. 54
5.6.3 Set trace average time ................................................................................................... 54
5.6.4 Set on/off of the average function in appointed trace. ................................................. 55
5.6.5 Clear all trace ................................................................................................................. 55
5.6.6 FORMat Subsystem ........................................................................................................ 55
5.7 SENSe Subsystem .......................................................................................... 56
5.7.1 FREQuency Subsection .................................................................................................. 56
5.7.2 Span Mode ..................................................................................................................... 57
5.7.3 Sweep ............................................................................................................................. 57
5.7.4 Detection ....................................................................................................................... 57
5.7.5 Bandwidth ...................................................................................................................... 58
5.7.6 Average .......................................................................................................................... 59
5.7.7 Power ............................................................................................................................. 59
5.8 INITiate Subsystem ......................................................................................... 60
5.8.1 Continuous Sweep and Single Sweep ............................................................................ 60
5.8.2 Start Single Sweep ......................................................................................................... 61
5.9 TRIGger Subsystem ........................................................................................ 61
5.9.1 Set Trigger Type ............................................................................................................. 61
5.9.2 Edge Trigger of External Trigger ..................................................................................... 61
5.9.3 Trigger Level in Video Trigger. ........................................................................................ 62
5.9.4 UNIT Subsystem ............................................................................................................. 62
5.10 SYSTem Subsystem ..................................................................................... 62
5.10.1 Power off the Instrument. ........................................................................................... 62
5.10.2 Restart the Instrument ................................................................................................ 62
5.10.3 Preset ........................................................................................................................... 63
CHAPTER6 SPECIFICATIONS ....................................................................... 64
6.1 Technical Specifications .................................................................................. 65
CHAPTER7 APPENDIX ................................................................................ 68
Appendix A:Accessories ..................................................................................... 69
Appendix B: Services and Support ........................................................................ 69
CHAPTER8 GENERAL CARE AND CLEANING ............................................... 70
8.1 General Care ................................................................................................... 70
8.2 Cleaning .......................................................................................................... 70

General Safety Summary
Please review the following safety precautions carefully before putting the instrument into
operation so as to avoid any personal injuries or damages to the instrument and any product
connected to it. To prevent potential hazards, please use the instrument only specified by this
manual.
The reparation could only be executed by professional authorized personnel.
Avoid fire and personal injury.
Use Proper Power Cord.
Ground the Instrument.
The instrument is grounded through the Protective Earth lead of the power cord. To avoid
electric shock, it is essential to connect the earth terminal of power cord to the Protective
Earth terminal before any inputs or outputs.
Observe all Terminal Ratings.
To avoid fire or shock hazard, observe all ratings and markers on the instrument and check
your manual for more information about ratings before connecting.
Do Not Operate Without Covers.
Do not operate the instrument with covers or panels removed.
Avoid Circuit or Wire Exposure.
Do not touch exposed junctions and components when the unit is powered.
Do Not Operate With Suspected Failures.
If you suspect damage occurs to the instrument, have it inspected by qualified service
personnel before further operations. Any maintenance, adjustment or replacement especially
to circuits or accessories must be performed by HANTEK authorized personnel.
Keep Well Ventilated.
Do Not Operate in Wet Conditions.
Do Not Operate in an Explosive Atmosphere.
Keep Product Surfaces Clean and Dry.

Model Number
The model in HSA2000 Series instrument
Instrument Model Number
Model No.
Spectrum Analyzer
TG
DMM
DSO
HSA2030A
9 kHz to 3.2 GHz
(1.6GHz)
HSA2030B
9 kHz to 3.2 GHz
(1.6GHz)
5M-3G
HSA2030C
9 kHz to 3.2 GHz
(1.6GHz)
5M-3G 6000COUNTS
HSA2030D
9 kHz to 3.2 GHz
(1.6GHz)
5M-3G 6000COUNTS YES
HSA2030E
9 kHz to 3.2 GHz
(1.6GHz)
6000COUNTS YES
Model No.
Spectrum Analyzer
TG
DMM
DSO
HSA2016A
9 kHz to 1.6 GHz
HSA2016B
9 kHz to 1.6 GHz
5M-1.6G
HSA2016C
9 kHz to 1.6 GHz
5M-1.6G
6000COUNTS
HSA2016D
9 kHz to 1.6 GHz
5M-1.6G
6000COUNTS
YES
HSA2016E
9 kHz to 1.6 GHz
6000COUNTS
YES


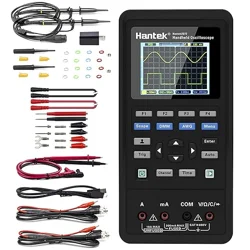
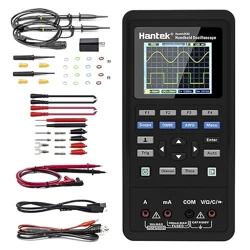
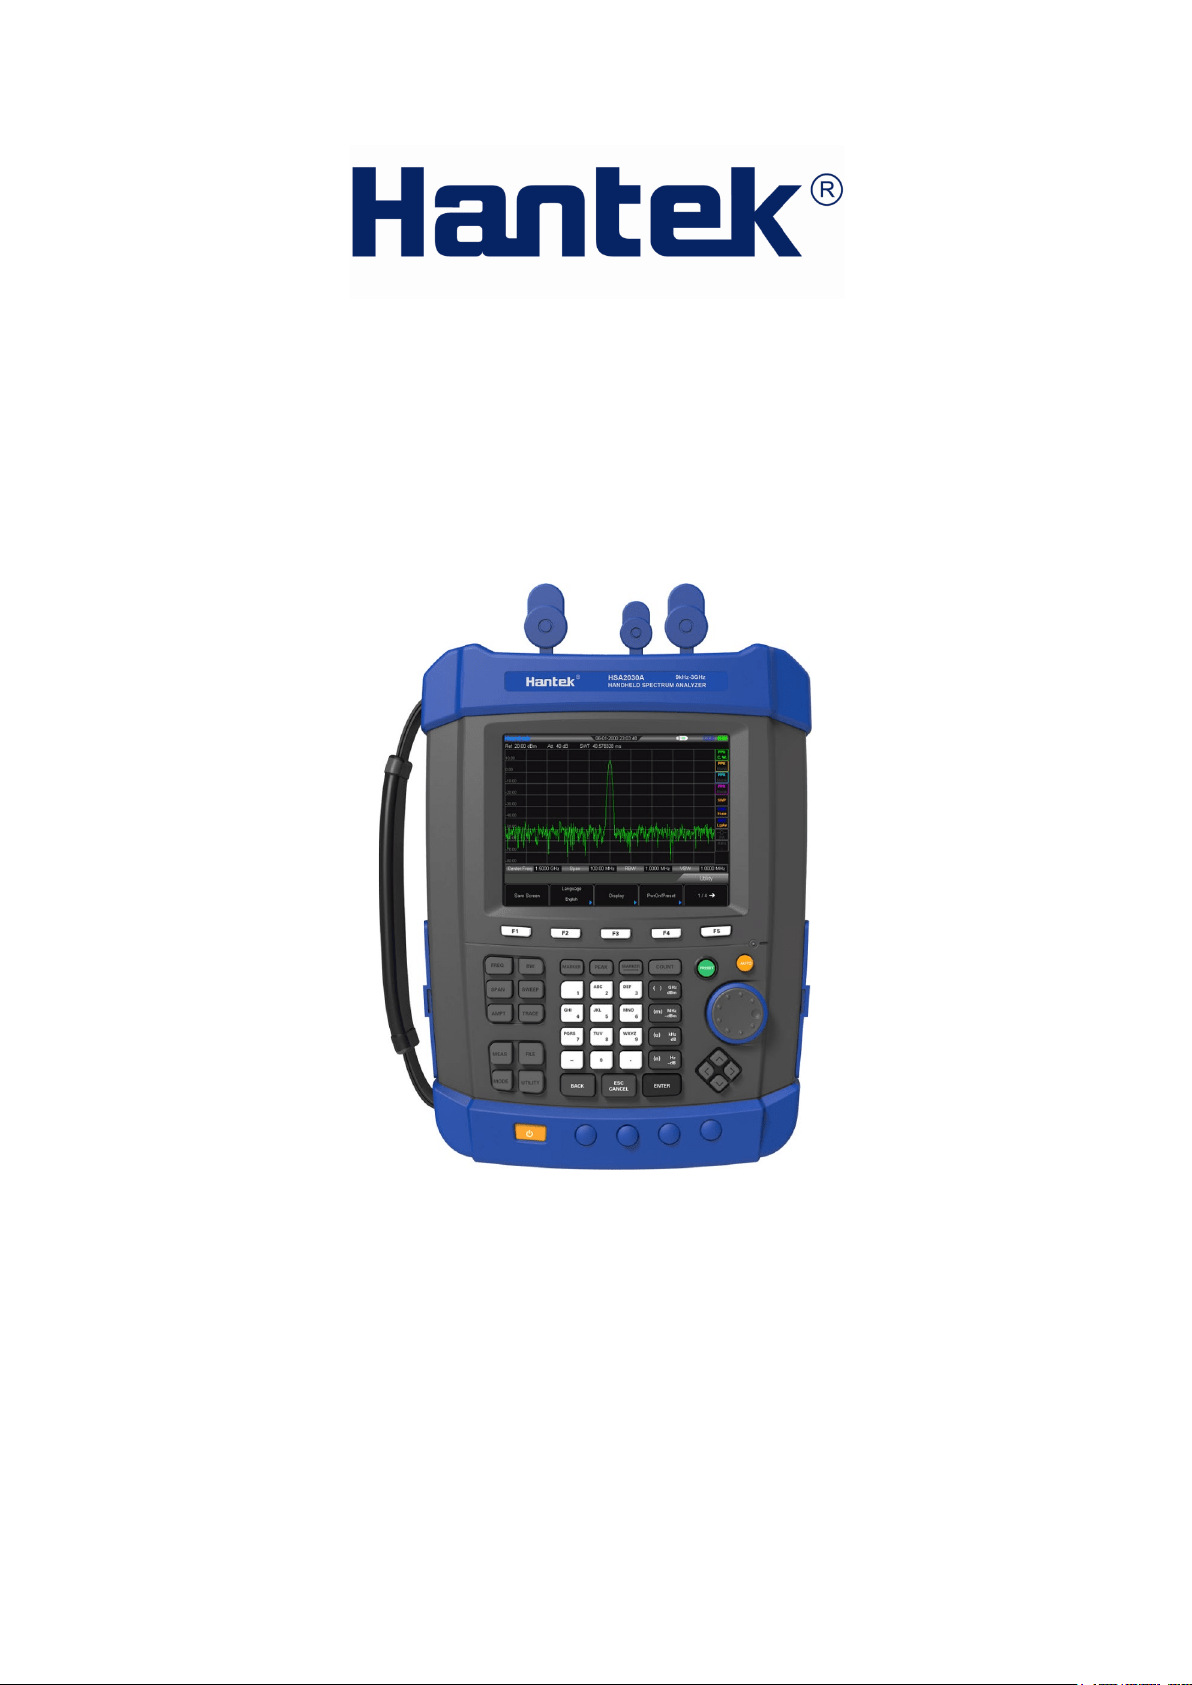
1.1 Instrument Introduction
HSA2000 series spectrum analyzers which are small, light and cost-effective, are portable
spectrum analyzers designed for starters. Configured with easy-to-operate numeric keyboard,
high-resolution color LCD display and various remote communication interfaces, they can be
widely used in various fields, such as education, company research and development as well as
industrial manufacture.
Main features:
• Frequency Range: 9 kHz to 3.2 GHz (1.6GHz)
• Displayed Average Noise Level (DANL): -135 dBm (Typical)
• Phase Noise: -80 dBc/Hz @ 10 kHz offset
• Total Amplitude Accuracy: <1.5 dB
• Minimum Resolution Bandwidth (RBW): 100 Hz
• VSWR Measurement Kit(Option)
• Standard with Preamplifier
• 5.7 inche (600×480 pixels) high-definition display with clear, vivid, and easy-to-use graphical
interface
• Various interfaces such as LAN, USB Host, USB Device

1.2 General Inspection
1. Inspect the shipping container for damage
Keep the damaged shipping container or cushioning material until the contents of the shipment
have been checked for completeness and the instrument has passed both electrical and
mechanical tests.
2. Inspect the instrument
In case of any damage, or defect, or failure, notify the Hantek representative.
3. Check the accessories
Please check the accessories according to the packing lists. If the accessories are incomplete or
damaged, please contact the Hantek representative.
1.3 To Prepare for Use
This chapter introduces the basic process to help you fast start to use the instrument.
Prepare the instrument.
1. To Connect to Power
Please use the power cord provided with the accessories to connect the spectrum analyzer to AC
power source.
Press the power switch on lower left of front pannel to turn on the instrument.
2. Power-on Inspection
After connecting the instrument to power source correctly, press at the front panel to start the
spectrum analyzer. Following the start-up screen which shows the start-up initialization process
information, the sweep curve is displayed.

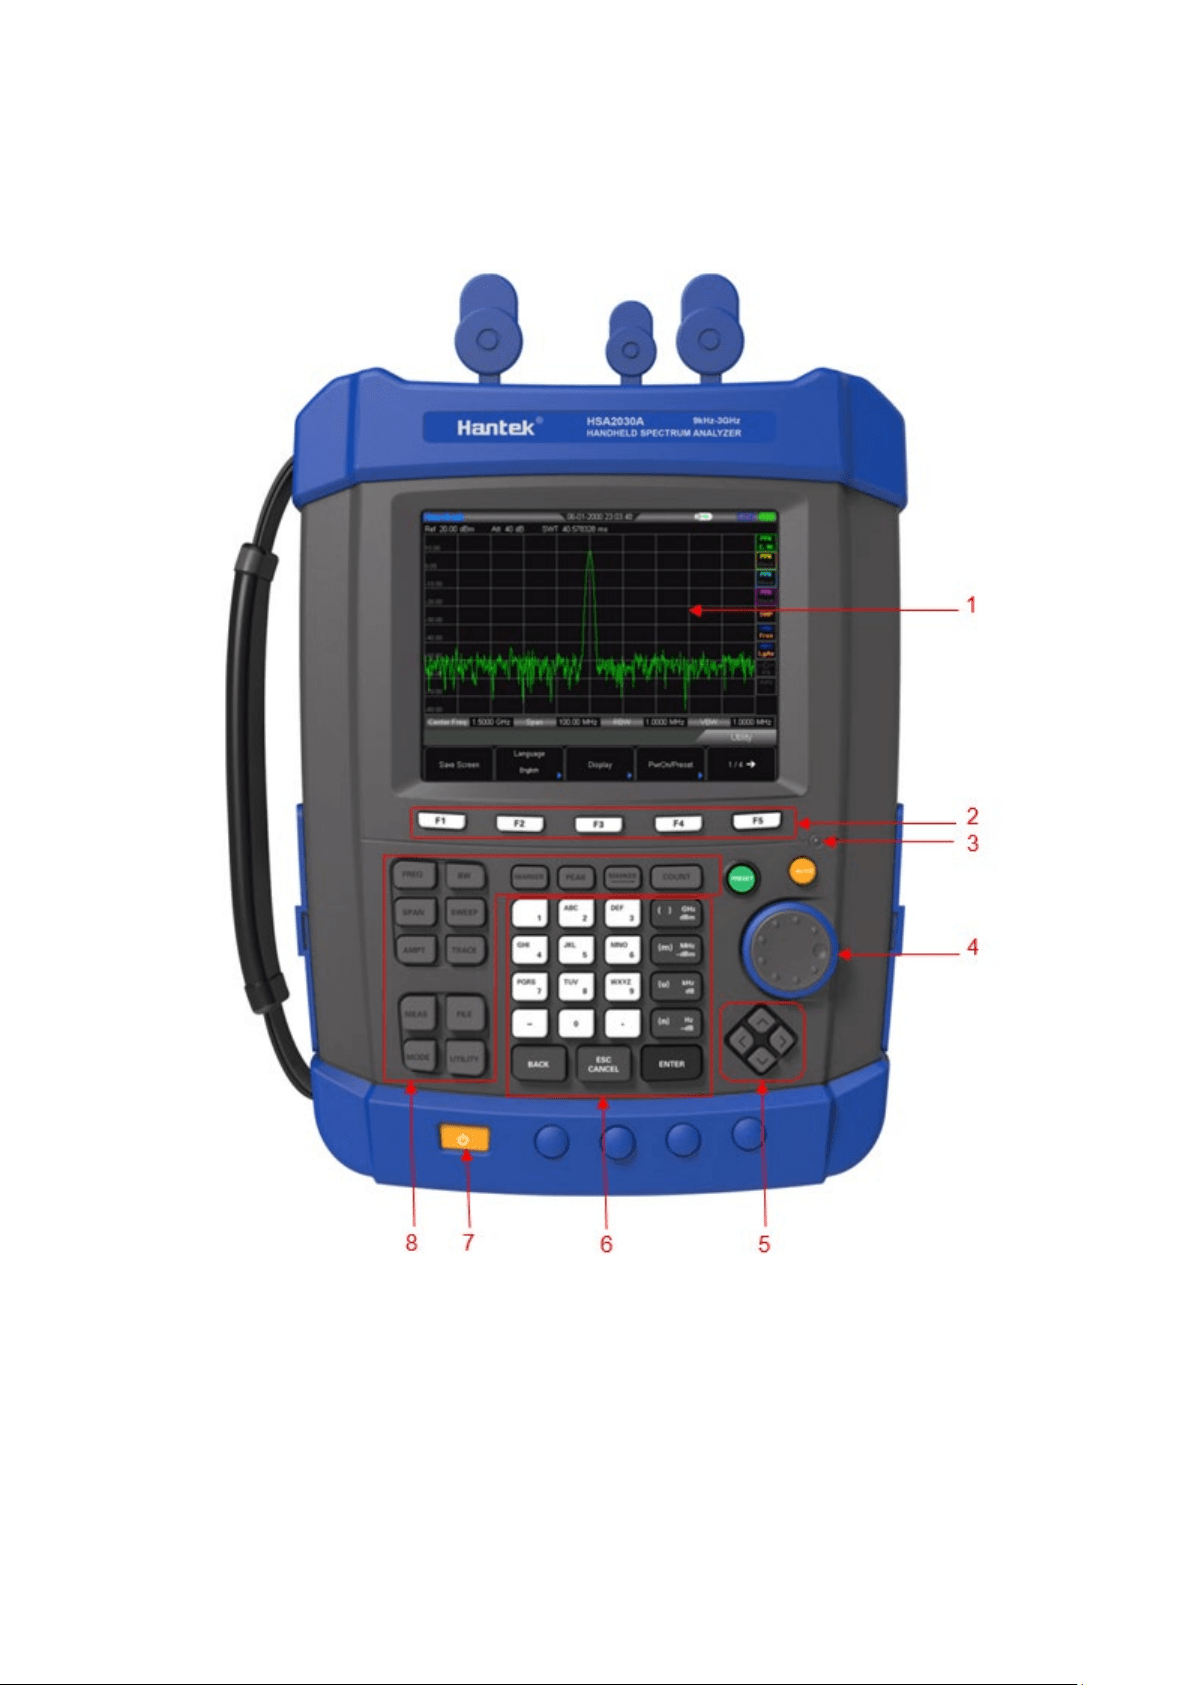
2.1 Front Panel
2.1.1 Menu Reference
1. LCD
2. Menu softkeys/menu control keys
3. Charge indicator (Only lights up when charging)
4. Knob
5. Direction keys
6. Numeric Keyboard
7. Power switch (Lighting-normal work status)
8. Function key area

2.1.2 Front Panel Function Keys
FREQ: Set the center, start and stop frequency; enable the signal tracking function.
SPAN: Set the frequency span of the sweep.
AMPT: Set the reference level, RF attenuator, scale and the unit of Y-axis, etc. Set the reference
level offset, maximum mixing level and input impedence. Execute auto scale and auto
range as well as turn on the RF preamplifier.
BW: Set the resolution bandwidth (RBW) and video bandwidth (VBW).
Select average type.
SWEEP: Set the sweep and trigger parameters.
TRACE:Set the parameters related to trace and filter types.
MEAS: Select and control the measurement function
MODE:Select mode
FILE:Save files
UTILITY:Auxiliary function
MARKER:Read the amplitude, frequency and sweep time of a certain point on the trace.
PEAK:Open the peak search menu and search for peaks immediately.
MARKER:Set other system parameters on the basis of the current marker value.
COUNT:
Frequency counter function
PRESET: Restore the system to factory settings or user-defined state.
AUTO: Search for signals automatically within full frequency range.
2.1.3 Numeric Keyboard
HSA2000 Series provides a numeric keyboard at the front panel (as shown in the figure below).
The numeric keyboard which supports the Chinese characters, numbers and common symbols
(including decimal point, and -) are mainly used to edit file or folder name.

The numeric keyboard consists of the following parts:
1.
• The input mode is fixed at number input during parameter setting. During parameter setting,
press this key to input the symbol (“-”) of the figure. When the key is pressed for the first
time, the parameter symbol is “-”.
• Press to switch among Chinese, English and number input during file or folder name
editing.
2. Number/Letter
• Multiplexing keys for numbers and letters. They are used to directly input the desired
number or letter.
• 0 is the multiplexing key for 0. Press this key to input 0 in number input.
3.
• Press this key to input a decimal point at the current cursor position in number input.
4. ENTER
• When pressed during parameter editing process, the system will complete the input and
insert a default unit for the parameter automatically.
• While in the process of file name editing, this key is used to input the character currently
selected by the cursor.
5. ESC CANCEL
• During parameter editing process, press this key to clear the inputs in the active function
area and exit parameter input.
• While in the process of file name editing, press this key tol delete characters that have
been entered.
• Press this key to turn off the display of the active function area when the main
measurement screen is displayed.
• Press this key to exit the current test mode in keyboard test.
• Press this key to unlock the screen when it is locked.
6. BACK
• During the process of parameter editing, press this key to delete the character on the left of
the cursor.
• While in the process of file name editing, press this key to delete the character on the left of
the cursor.
2.2 Top Panel
1. RF OUT Connector: The output for the built-in tracking generator. Enabled with Option TG3.
2. EXT TRIG IN/REF IN (BNC, Female): Connects to an external TTL signal or a 10 MHz
reference signal. The TTL signal is used to the analyzer’s internal sweep.
3. RF IN Connector (50 Ω): Accepts an external input with a frequency range from 100 kHz to 3
GHz(1.6GHz), tunable to 9 kHz.
2.3 Side Panel
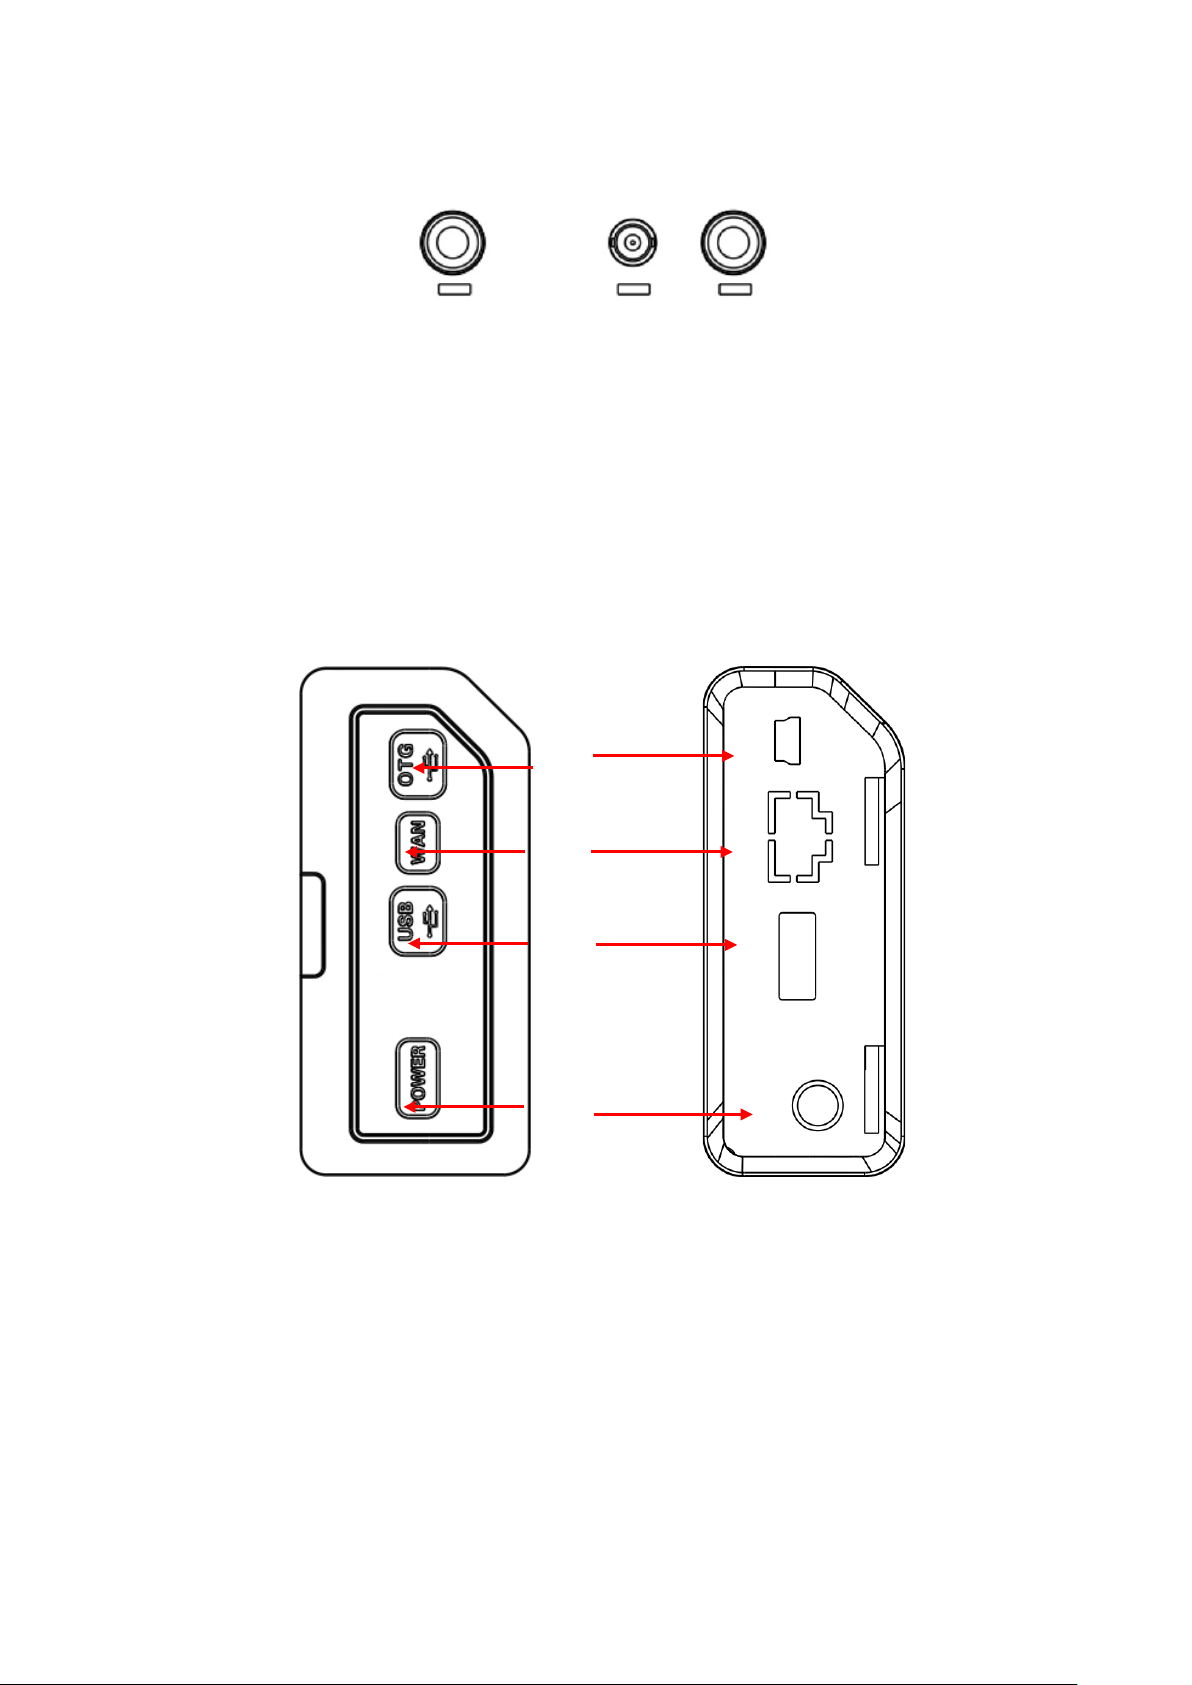
2.3.1 Right Panel
Right Panel
1. USB interface (Device)
Connects to a PC
2. WAN Interface
Connects to a PC for SCPI remote control
3. USB interface (Host)
Connects to a USB memory stick or disk
4. External DC power connector
Provides input for the DC power source via an AC-DC adapter, or Automotive type DC
adapter
1
2
3
4
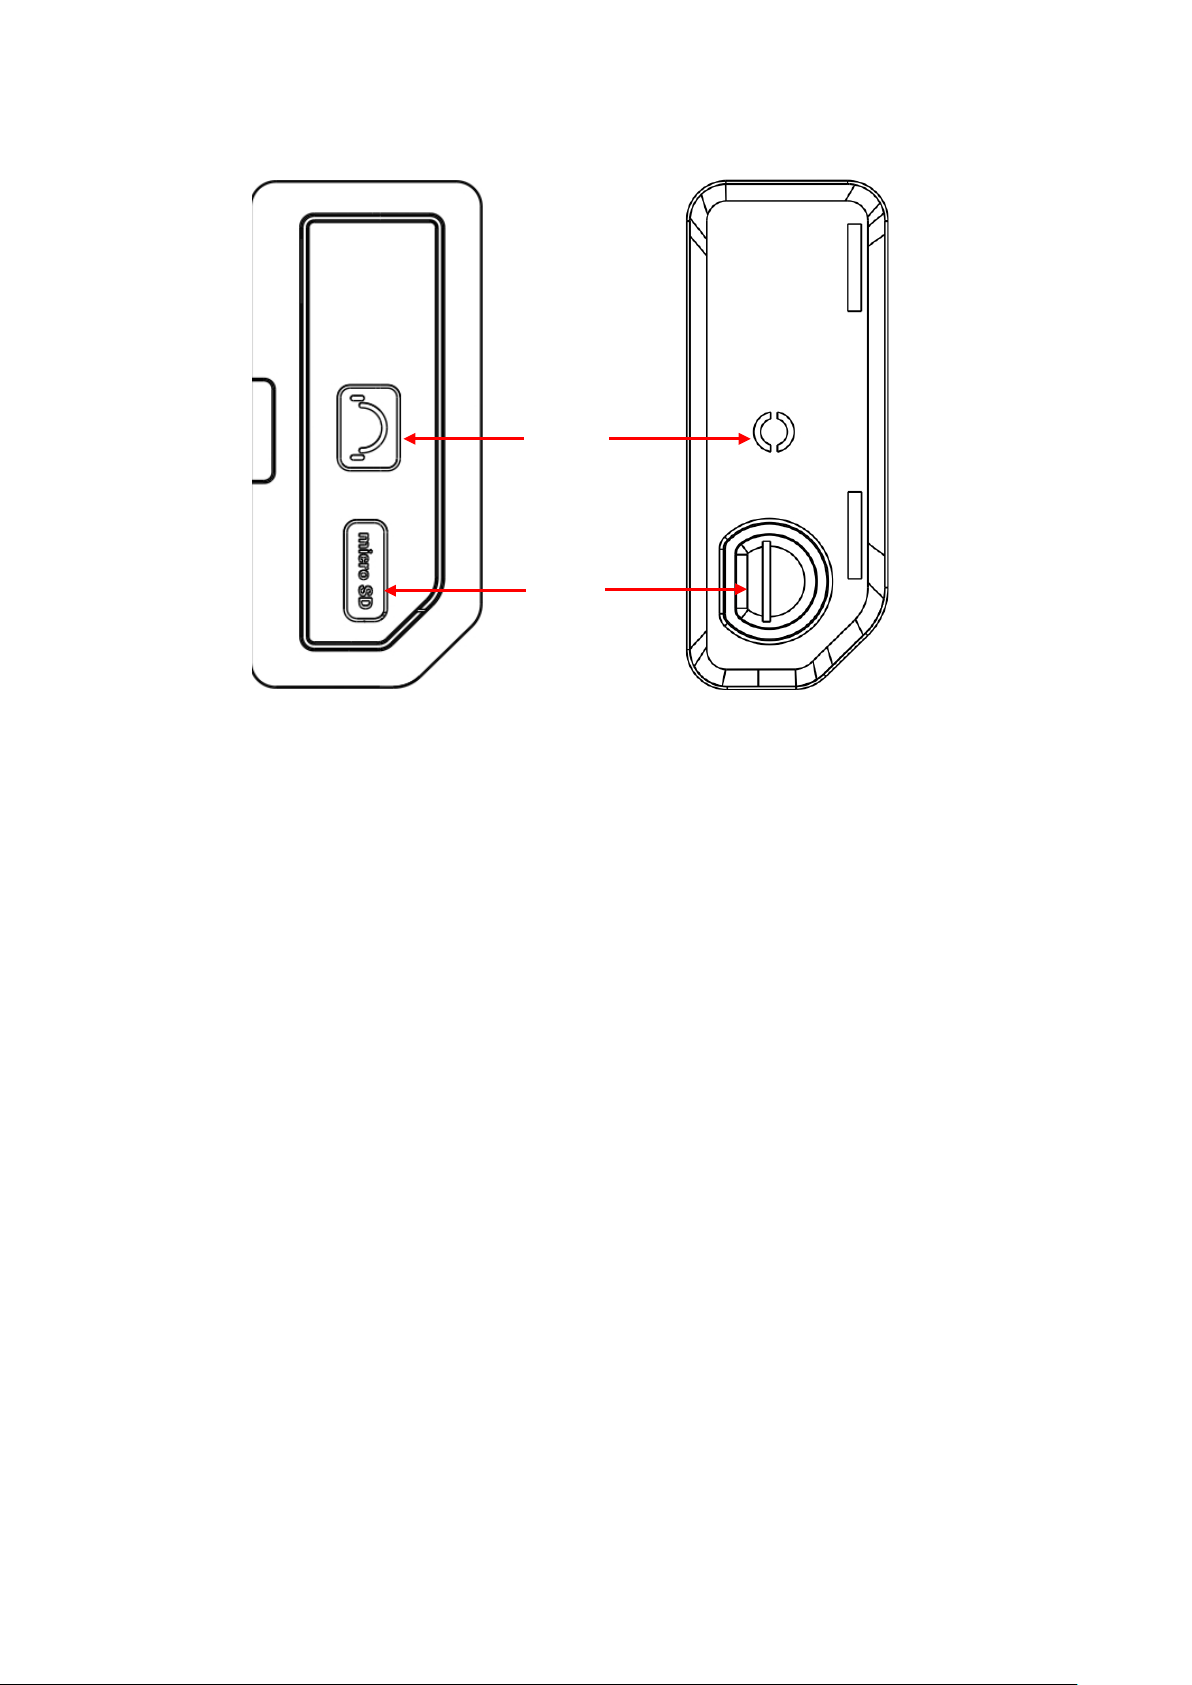
2.3.2 Left Panel
Left Panel
5. Headphone Connects to a headphone
6. SD card slot
5
6
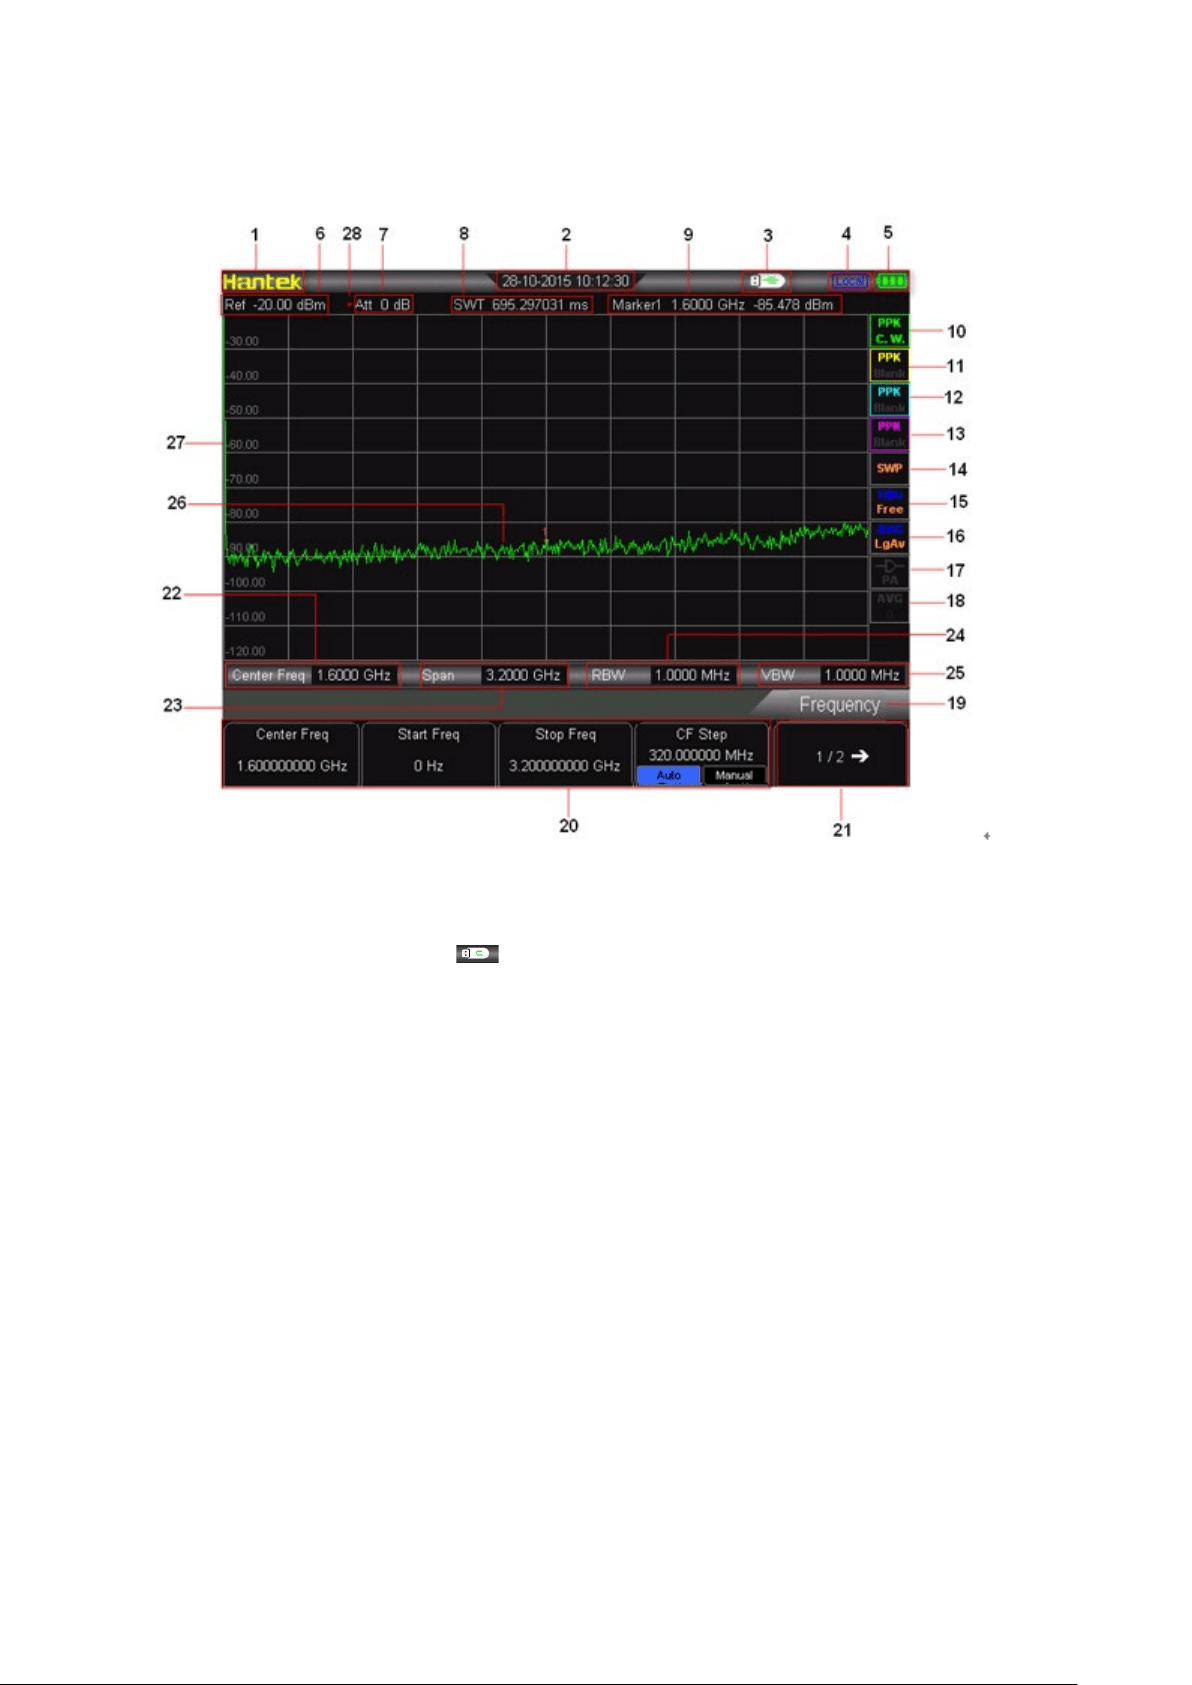
2.4 User Interface
User interface:
1. Hantek Logo
2. Time: System time
3. USB storage device status: is displayed when USB storage device is installed.
4. Operation status: Display “Local” (in local mode) or “Rmt” (in remote mode).
5. Power display
6. Reference level:Reference level value
7. Attenuator settings: Attenuator settings
8. SWT Value
9. Marker value:
Cursor X: Current X value of the cursor. Note that X indicates different physical quantities
in different functions.
Cursor Y: Current Y value of the cursor. Note that Y indicates different physical quantities
in different functions.
10. Trace 1 Detector type: Normal, Pos peak, Neg peak, Sample, RMS Avg.
11. Trace 2 Detector type: Normal, Pos peak, Neg peak, Sample, RMS Avg.
12. Trace 3 Detector type: Normal, Pos peak, Neg peak, Sample, RMS Avg.
13. Trace 4 Detector type: Normal, Pos peak, Neg peak, Sample, RMS Avg.
14. Sweep mode: Continuous or Single sweep (with current number of sweeps)

15. Trigger type: Free.
16. Average type: Average type in BW, logarithmic power, power, voltage.
17. Preamplifier status: Enable or disable the preamplifier.
18. Average times: Average times of trace.
19. Menu title: Function of the current menu.
20. Menu items: Menu items of the current function.
21. Menu page number:Show the total number of pages and current page number.
22. Center frequency: The frequency range of the current sweep channel can be expressed
by a combination of center frequency and span or a combination of start frequency and
stop frequency.
23. Span: The frequency range of the current sweep channel can be expressed by a
combination of center frequency and span or a combination of start frequency and stop
frequency.
24. RBW:Resolution bandwidth.
25. VBW:Video bandwidth.
26. Spectrum line display area: Spectrum line display area.
27. Y scale: Label of Y scale.
28. Manual setting: The corresponding parameter is in manual setting mode.
2.5 Menu Operation
There are 6 types of menus according to their operation modes. Each type of menu and its
operation method are introduced below.
1. Parameter Input
When selected, use the numeric keys to modify the parameters directly.
For example, select “Center Freq”, input the desired figure and select
proper unit to change the center frequency.
2. State Switching
Press the corresponding menu key to switch between the sub-options.
For example, press “Signal Track” to enable or disable the signal tracking
function.
3. Enter Lower Menu (with parameter)
Press the corresponding menu key to enter the lower menu and change
the option currently selected.
For example, press “AMPT” to enter the lower menu. Select dBm and
return to the previous menu. The unit of Y-axis changes to dBm.

4. Enter Lower Menu (without parameter)
Press the corresponding menu key to enter the lower menu. For example,
press “Corrections” to enter directly.
5.Function Switch + Parameter Input
Press the corresponding menu key to switch between functions; change
the parameter directly using the numeric keys.
For example, press “CF Step” to switch between “Auto” and “Manual”; if
“Manual” is selected, you can directly input the desired number to change
the CF Step.
6. State Selection
Press the corresponding menu key to modify the parameter and return to
the menu one level up. For example, press “MARKER” “NORMAL” to
select normal state. It means “MARKER” is in normal state.
2.6 Parameter Setting
Users can enter the desired parameter values using the numeric keys, knob, or direction keys.
This section describes the three methods of parameter setting through an example (to set the
center frequency to 800 MHz).
1. Use the numeric keyboard
1) Press “FREQ”Center Freq;
2) Input “800” using the numeric keys;
3) Select “MHz” by selecting the desired unit from the popup menu.
2. Use the knob
When the parameter is editable (namely when the parameter is selected), turn the knob clockwise
to increase or counterclockwise to decrease the parameter value at specified step.
1) Press “FREQ” Center Freq;
2) Rotate the knob until the parameter is set to a certain value (800 MHz).
3. Use the direction keys
When the parameter is editable (namely when the parameter is selected), you can increase or
decrease the parameter value at specific step using the direction keys.
1) Press “FREQ” Center Freq;
2) Press up/down direction key until the parameter is set to a certain value (800 MHz).

Note: in the storage function, the direction keys can also be used to select the current path or file.


3.1 Basic Settings
3.1.1 FREQ
Set the frequency parameters of the analyzer. The analyzer sweeps within a specified frequency
range, and the sweep is restarted every time you change the frequency parameters.
The frequency range of a channel can be expressed by either of two groups of parameters: Start
Frequency and Stop Frequency(
fstart/fstop); or Center Frequency and Span(fcenter/ fspan). If any
of the parameters is changed, the others would be adjusted automatically in order to ensure the
coupling relationship among them:
center
f
=
(
)
/2stop startff
+
span
f
=
stop start
ff
−
Center Freq
Set the center frequency of the current channel. Press this key to switch to center frequency input
mode and the center frequency is displayed at the lower left and right sides of the grid
respectively.
Key Points:
• The start and stop frequencies vary with the center frequency when the span is constant.
• Changing the center frequency horizontally shifts the current channel and the adjustment is
limited by the specified frequency range.
• In Zero Span mode, the start frequency, stop frequency and center frequency are always
the same.
• You can modify this parameter using the numeric keys, knob or direction keys. Refer to
“Parameter Setting” for more details.
Center Frequency
Parameter
Explanation
Default
3.2 GHz (1.6GHz)
Range*
0 Hz to 3.2 GHz (1.6GHz)
Unit
GHz, MHz, kHz, Hz
Knob Step
Span > 0, step = Span/200 Span = 0, step = RBW/100 Min = 1
Hz
Direction Key Step
CF step
*Note: The range is from 50 Hz to [3.2 GHz (1.6GHz)-50 Hz] in non-zero span.
Start Freq
Set the start frequency of the current channel. Press this key to switch to start/stop frequency
input mode and the start and stop frequencies are displayed at the lower left and right sides of the
grid respectively.
Key Points:
• The span and center frequency vary with the start frequency. The change of span would
affect other system parameters. For more details, please refer to “Span”.

• In Zero Span mode, the start frequency, stop frequency and center frequency are always the
same. If one is changed, the others are updated to match.
• You can modify this parameter using the numeric keys, knob or direction keys. Refer to
“Parameter Setting” for more details.
Start Frequency
Parameter
Explanation
Default
0 GHz
Range*
100 Hz to 3.2 GHz (1.6GHz)
Unit
GHz, MHz, kHz, Hz
Knob Step
Span > 0, step = Span/200 Span = 0, step = RBW/100
Min = 1 Hz
Direction Key Step
CF step
*Note: The range is from 0 Hz to 【3.2 GHz (1.6GHz)-100 Hz】 in non-zero span.
Stop Freq
Set the stop frequency of the current channel. Press this key to switch to start/stop frequency
input mode and the start and stop frequencies are displayed at the lower left and right sides of the
grid respectively.
Key Points:
• The span and center frequency vary with the stop frequency. The change of span would
affect other system parameters. For more details, please refer to “Span”.
• You can modify this parameter using the numeric keys, knob or direction keys. For more
details, please refer to “Parameter Setting”.
Stop frequency
Parameter
Explanation
Default
3.2 GHz (1.6GHz)
Range*
100 Hz to 3.2 GHz (1.6GHz)
Unit
GHz, MHz, kHz, Hz
Knob Step
Span > 0, step = Span/200 Span = 0, step = VBW/100
Min = 1 Hz
Direction Key Step
CF step
*Note: The range is from 100 Hz to 3.2 GHz (1.6GHz) in non-zero span.
CF Step
Set the step of center frequency. Changing the center frequency in a fixed step continuously
switches the channel to be measured. Key Points:
• The CF step can be set in “Manual” or “Auto” mode. In Auto mode, the CF step is 1/10 of the
span in Non-zero span mode or equals the RBW while in Zero span mode; in Manual mode,
you can set the step using the numeric keys.
• After you set an appropriate CF step and select Center Freq, use up and down direction keys
to switch between measurement channels in a specified step in order to sweep the adjacent
channel manually.
• You can modify this parameter using the numeric keys, knob or direction keys. For more
details, please refer to “Parameter Setting”.
CF step
Parameter
Explanation
Default
320 MHz
Range
1 Hz to 3.2 GHz (1.6GHz)
Unit
GHz, MHz, kHz, Hz
Knob Step Span > 0, step = Span/200 Span = 0 , step = 100 Hz Min =

1 Hz
Direction Key Step
in 1, 2, 5 sequence
3.1.2 SPAN
Set the span of the analyzer. The change of this parameter will affect the frequency parameters
and restart the sweep.
Span
Set the frequency range of the current channel. Press this key to switch to center frequency/span
input mode and the center frequency and span are displayed at the lower left and right sides of
the grid respectively.
Key Points:
• The start and stop frequencies vary with the span automatically.
• In manual span mode, the span can be set down to 100 Hz (the only way into the zero-span
mode is pressing the Zero Span menu option) and up to the full span described in
“Specifications”. When the span is set to the maximum, the analyzer enters full span mode.
• Modifying the span in non-zero span mode may cause an automatic change in both CF step
and RBW if they are in Auto mode, and the change of RBW may influence VBW (in Auto
VBW mode).
• Variation in the span, RBW or VBW would cause a change in the sweep time.
• You can modify this parameter using the numeric keys, knob, or direction keys. For more
details, please refer to “Parameter Setting”.
Span Parameter
Explanation
Default
3.2 GHz (1.6GHz)
Range*
0 Hz to 3.2 GHz (1.6GHz)
Unit
GHz, MHz, kHz, Hz
Knob Step
Span/200, Min = 1 Hz
Direction Key Step
in 1, 2, 5 sequence
*Note: 0 Hz is available only in zero span.
Full Span
Set the span of the analyzer to the maximum.
Zero Span
Set the span of the analyzer to 0 Hz. Both the start and stop frequencies will equal the center
frequency and the horizontal axis will denote time. The analyzer measures the time domain
characteristics of the amplitude of the corresponding frequency point on the input signal. Key
Points: As opposed to the Non-zero span, the screen shows the time domain characteristics of
the fixed frequency component in zero span mode.The following functions are invalid in Zero span
mode:
“Zoom In” and “Zoom Out” in SPAN
Zoom In
Set the span to half of its current value. At this point, the signal on the screen is zommed in on to
observe signal details.

Zoom Out
Set the span to twice the current value. At this point, the signal on the screen is zoomed out on to
gain more information about the signal.
3.1.3 AMPT
Set the amplitude parameters of the analyzer. Through modifying these parameters, signals under
measurement can be displayed in a proper mode for easier obsercation and minimum error.
Ref Level
Set the maximum power or voltage can be currently displayed in the window and the value is
displayed at the upper left corner of the screen grid. Key Points:
• The maximum reference level available is affected by the maximum mixing level, input
attenuation and preamplifier. When you adjust it, the input attenuation is adjusted under a
constant maximum mixing level in order to fulfill the following inequality:
Ref
L
RF
PA mix
aaL−
+≤
Ref
L
、
RF
a
、
PAa
和
mixL
denote the reference level, the input attenuation, the preamplifier
and the maximum mixing level respectively.
• You can modify this parameter using the numeric keys, knob or direction keys. For more
details, please refer to “Parameter Setting”.
Reference level
Parameter
Explanation
Default
20 dBm
Range
-100 dBm to 30 dBm
Unit
dBm, -dBm, mV, uV
Knob Step
in Log scale mode, step = Scale/10 in Lin scale mode, step
= 0.1 dBm
Direction Key Step
in Log scale mode, step = Scale in Lin scale mode, step =
1 dBm
Input Atten
Set the front attenuator of the RF input in order to ensure big signals (or small signals) to pass
from the mixer with low distortion (or low noise).
Key Points:
• When the preamplifier is On, the input attenuation could be set up to 30 dB. You can adjust
the reference level to ensure that the specified parameter meets the inequality
RefL
RF
PA mix
aaL−+ ≤
.
• You can modify this parameter using the numeric keys, knob or direction keys. For more
details, please refer to “Parameter Setting”.
Input attenuation
Parameter
Explanation
Default
40 dB
Range
0 dB to 30 dB
Unit
dB

Knob Step
1 dB
Direction Key Step
5 dB
Scale/Div
Set the logarithmic units per vertical grid division on the display. This function is only available
when the scale type is set to “Log”.
Key Points:
• By changing the scale, the amplitude range available is adjusted.
Scale Type
Set the scale type of Y-axis to Lin or Log, the default is Log. Key Points:
• In Log scale type: the Y-axis denotes the logarithmic coordinate, the value shown at the top
of the grid is the reference level and each grid represents the scale value. The unit of Y-axis
will automatically switch to the default “dBm” in Log scale type when the scale type is
changed from Lin to Log.
• In Lin scale type: the Y-axis denotes the linear coordinate, the values shown at the top of the
grid and the bottom of the grid are the reference level and 0 V respectively. Each grid
represents 10% of the reference level and the Scale/Div is invalid. The unit of Y-axis will
automatically switch to the default “Volts” in Lin scale type when the scale type is changed
from Log to Lin.
• The scale type does not affect the unit of Y-axis.
Units
Set the unit of the Y-axis to dBm, dBmV, dBuV, Volts or Watts. Wherein, dBm, dBmV, and dBuV
are for Log scale; Volts and Watts are for Linear scale. The default is dBm.
Key Points:
The conversion relationships between units:
dBm
=
2
1
0.001
10log
Volts
RW
×
dBuV
=
6
10
20log
1
Volts
uV
×
dBmV
=
3
10
20log
1
Volts
mV
×
Watts
=
2
Volts
R
Wherein,
R denotes the reference resistance.
Ref Offset
Assign an offset to the reference level to compensate for gains or losses generated between the
device under measurement and the analyzer.
Key Points:
The change of this value changes both the reference level readout and the amplitude readout of
the marker, but does not impact the position of the curve on the screen.
You can modify this parameter using the numeric keys. For more details, please refer to
“Parameter Setting”.

Reference level offset
Parameter
Explanation
Default
0 dB
Range
-300 dB to 300 dB
Unit
dB
Knob Step
N/A
Direction Key Step
N/A
RF Preamp
Set the status of the preamplifier located at the front of the RF signal path. Turning on the
preamplifier reduces the displayed average noise level in order to distinguish small signals from
the noise when the signal under measurement is small.
Key Points:
The corresponding icon will be displayed in the status bar at the left side of the screen when
the preamplifier is On.
Scale Value
Scale Value is on the left of display area. Select “ON”, display. Select “OFF”, do not display.
3.2 Sweep and Function Settings
3.2.1 BW
Set the RBW (Resolution Bandwidth), VBW (Video Bandwidth) and detector type parameters of
the analyzer.
RBW
Set the desired resolution bandwidth in order to distinguish between signals which are close in
frequency.
Key Points:
• Reducing RBW will increase the frequency resolution, but will increase the sweep time
(Sweep Time is affected by a combination of RBW and VBW when it is in Auto mode).
• RBW decreases with the span (non-zero span) in Auto RBW mode.
• You can modify this parameter using the numeric keys, knob or direction keys. For more
details, please refer to “Parameter Setting”.
Note: if detector type is “Quasi-Peak” or filter type is “EMI”, RBW can be 200 Hz, 9 kHz or 120
kHz only.
RBW (Filter Type is Gauss)
Parameter
Explanation
Default
1 MHz
Range
100 Hz to 1 MHz
Unit
GHz, MHz, kHz, Hz
Knob Step
in 1, 3, 10 sequence
Direction Key Step
in 1, 3, 10 sequence

Video Bandwidth
Set Video Bandwidth, shortform is VBW, to filter the noise out of the video band.
Key Points:
• Reduce VBW can make the spectral line be smooth, and the small signal which is submerged
in noise can stand out. But the scan time will be longer. (When scan time is automatic, it is
influenced by RBW and VBW together).
• When VBW is automatic, it changes with RBW. But it is not influenced by RBW when
manually.
• You can use numeric keys, knobs or direction keys to modify this parameter. The detail
method refers to the specification in “Parameter Setting”.
VBW Reference
Parameter
Instruction
Default
1 MHz
Range
1 Hz to 1 MHz
Unit
GHz, MHz, kHz, Hz
Knob Step
in 1, 3, 10 sequence
Direction Key Step
in 1, 3, 10 sequence
V/R Ratio
Set the ratio of VBW and RBW.
Key Points:
• Choose the ratio according to different signals:
• When measure sine signals, normally choose 1~3 (to get shorter scan time). When measure
pulse signals, choose 10 (to reduce the influence to the amplitude of nstantaneous signal).
When measure noise signals, normally choose 0.1 (to get the average value of noise).
• You can use numeric keys, knobs or direction keys to modify this parameter. The detail
method refers to the specification in “Parameter Setting”.
V/R Ratio Reference
Parameter
Instruction
Default
1 MHz
Range
0.000001 ~ 30000
Unit
N/A
Knob Step
in 1, 3, 10 sequence
Direction Key Step
in 1, 3, 10 sequence
3.2.2 Sweep
Set parameters about the Sweep and Trigger functions, including Time, Auto SWT, Mode,
Numbers, Trigger type, etc.
Mode
Set the sweep mode to “Single” or “Continue”, the default is “Continue”. The corresponding icon of
the sweep mode will be displayed in the status bar at the left side of the screen.

1. Single
Set the sweep mode to “Single”. The number 10 on the parameter icon denotes the current sweep
number.
2. Continue
Set the sweep mode to “Cont”. The character Continue on the parameter icon denotes the
analyzer is sweeping continuously.
Key Points:
• If the instrument is in single sweep mode and no measurement function is enabled, press this
key and the system will enter the continuous mode and sweep continuously if all the trigger
conditions are satisfied.
• If the instrument is in single sweep mode and a measurement function is on, press this key
and the system will enter the continuous sweep mode and measure continuously if all the
trigger conditions are satisfied.
• In continuous mode, the system will send a trigger initialization signal automatically and enter
the trigger condition judgment directly after each sweep.
Single
In single sweep mode, this menu is used to execute trigger initialization. After that, the analyzer
will execute specified number of sweeps (or measurements) if all the trigger conditions are
satisfied.
Key Points:
• If the instrument is in continuous sweep mode and no measurement function is enabled,
press this key and the system will enter the single sweep mode and execute specified
number of sweeps if all the trigger conditions are satisfied.
• If the instrument is in continuous sweep mode and a measurement function is on, press this
key and the system will enter the single measure mode and execute specified number of
measurements if all the trigger conditions are satisfied.
• If the system is already in single sweep mode, press this key and the system will execute
specified number of sweeps (or measurements) if all the trigger conditions are satisfied.
3.2.3 Trace
The sweep signal is displayed as a trace on the screen.
Select Trace
This series allows for up to four traces to be displayed at the same time, and each trace has its
own color. All traces can be set freely except Trace 4 (a math operation trace that can only be
obtained using the other three traces). Select Trace 1, Trace 2 or Trace 3 to set the corresponding
parameters. The default trace and type is Trace 1 and Clear Write.
Trace Type
Set the type of the current trace or disable it. The system calculates the sample data using a

specific operation method according to the trace type selected and displays the result. Trace
types contain Clear Write, Max Hold, Min Hold, Video Avg, Power Avg and Freeze. The
corresponding icon of the trace type will be displayed in the status bar at the left of the screen.
Take Trace 1 (Green) as an example and the icons are as shown in the figure below.
1. Clear Write
The trace continuously displays the points during the sweep of the analyzer.
2. Max Hold
Maintain the maximum for each point of the trace, and update the trace point if a new maximum is
generated in successive sweeps.
3. Min Hold
Maintain the minimum for each point of the trace, and update the trace point if a new minimum is
generated in successive sweeps.
4. Freeze
Stop updating the trace data to observe the trace and read the measurement data. This type is
generally used by traces loaded from storage devices or remote interface as default.
5. Blank
Disable the trace display and all measurements of this trace.
Average Times
Set the number of averages of the selected trace.
Key Points:
• More averages can reduce the noise and the influence of other random signals, thus
highlighting the stable signal characteristics. The larger the number of averages is, the
smoother the trace will be.
• You can use the numeric keys to modify this parameter, please refer to “Parameter Setting”
for more details.
Average times
Parameter
Explanation
Default
100
Range
1 to 1000
Unit
N/A
Knob Step
N/A
Direction Key Step
N/A
Clear All
Clear all the traces displayed on the screen. This operation will stop the current advanced
measurement as there is not valid data source.

3.3 Marker Measurement
Marker
Marker is a diamond-shaped marker (As shown below), to mark the point in trace. Through the
marker, you can read amplitude, frequency or the time point of scan on each point.
Keypoints:
• It can show four pairs of marker on time at the most, but there is only one pair or one single
marker which is in activated status each time.
• You can use numeric keys, knobs or direction keys to modify this parameter. The detail
method refers to the specification in “Parameter Setting”.
1. Marker
Choose one of four markers, the default one is the first. After choosen, you can set the mode of
marker, trace that is marked, reading method and other parameters. The marker which is opened
currently should be marked on the trace chosen by marker trace. The reading on the marker from
which is in activated status currently is shown on the right corner of the screen in active function
area.
Marker Paremeter
Parameter
Instruction
Default
Center Frequency
Range
0 ~ 3.2 GHz (1.6GHz)
Unit
Reading = Frequency (or period), unit is GHz, MHz, kHz, Hz (or ks, s, ms, us,
ns, ps)
Reading = Time (or reciprocal of time), unit is ks, s, ms, us, ns, ps (or GHz,
MHz, kHz, Hz)
Knob Step
Reading = Frequency (or period), Step = Sweeping width/(sweep point - 1),
Reading = Time (or reciprocal of time), Step = Sweeping time/(sweep point – 1)
Direction Key
Step
Reading = Frequency (or period), Sweeping width/10
Reading = Time (or reciprocal of time), Step = Sweeping time/10
2. Normal
One type of marker, used for measuring X value (frequency and time) and Y value (amplitude) of
one point on the trace. When choose “Normal”, there will be a marker marked by the current
marker on the trace, like “1”.
Keypoints:
• If there is no active marker, then you need to activate a marker in center frequency of current
trace.
• Move the marker through inputing value by numberic keys, knobs or direction keys. The
reading of current marker is shown on the right corner of screen.
• The resolution of reading on X-axis (frequency or time) is related with sweep width. Reduce
the sweep width can get higher resolution.
3. Off
Close the marker chosen currently, and the marder information and relative function shown in the
screen will be closed too.
4. Marking trace
Choose the trace marking by current marker as 1, 2, 3, 4.

5. Readout
Set the reading method of marker X-axis, each marker can be set different reading type. This set
only change the method of reading, not actual value. This set will influence the marker reading in
active function area and the corner of screen.
a) Frequency
“Normality” marker shows absolute frequency when choose this type of reading method.
“Difference Value”, “Difference Value Pair” and “Span Pair” marker shows the frequency
difference of reference marker relative to differenct value marker. In the mode of non-zero
sweeping width, the default reading method is “Frequency”.
b) Period
“Normality” marker shows the reciprocal of marker frequency, when choose this type of
reading method. “Difference Value”, “Difference Value Pair” and “Span Pair” marker shows
the reciprocal of frequency difference. When frequency difference is zero, the reciprocal is
infinity. The reading is shown as >100Ts. This reading method can not be used in the mode
of zero sweeping width.
c) Time Difference
“Normality” marker shows the time difference before the marker and the start of sweeping
when choose this type of reading method.. “Difference Value”, “Difference Value Pair” and
“Span Pair” marker shows the sweeping time difference between differenct value marker and
reference marker. The default reading method is “Time” in the mode of zero sweeping width.
6. All Off
Close all the markers which has been open and its realative function.
Marker->
Use current marker value to set other system parameter of equipment (like center frequency,
reference level, etc.). If there is no marker open, press Marker -> and activate a marker
automativly.
1. Center Frequency
Set center frequency of spectrum analyzer as the frequency of current marker.
• Center frequency is set as the frequency of marker when choose normality marker.
• Center frequency is set as the frequency of difference value marker when choose
difference value, difference value pair and span pair marker.
• This function is invalid in the mode of zero sweeping width.
2. Intermediate Frequency Step
Set intermediate frequency step of spectrum analyzer as the frequency of current marker.
• Intermediate frequency step is set as the frequency of marker when choosing normality
marker.
• Intermediate frequency step is set as the frequency of difference value marker when
choosing difference value, difference value pair and span pair marker.
• This function is invalid in the mode of zero sweeping width.
3. Start Frequency
Set start frequency of spectrum analyzer as the frequency of current marker.
• Start frequency is set as the frequency of marker when choosing normality marker.
• Start frequency is set as the frequency of difference value marker when choosing
difference value, difference value pair and span pair marker.
• This function is invalid in the mode of zero sweeping width.

4. Stop Frequency
Set stop frequency of spectrum analyzer as the frequency of current marker.
• Stop frequency is set as the frequency of marker when choosing normality marker.
• Stop frequency is set as the frequency of difference value marker when choosing
difference value, difference value pair and span pair marker.
• This function is invalid in the mode of zero sweeping width.
5. Reference Line
Set reference level of spectrum analyzer as the frequency of current marker.
• Reference level is set as the amplitude of marker when choosing normality marker.
• Reference level is set as the amplitude of difference value marker when choosing
difference value, difference value pair and span pair marker.
Peak
Open the setting menu of peak search, and excute the peak search function.
Keypoints:
• When choose “Max” in the option of Search Parameter Peak Search, it means to look up
the maximum value on the trace and mark with marker.
• When choose “Parameter” in the option of Search Parameter Peak Search, it means to
look up the peak value that meets the search parameter on the trace and mark with marker.
• The peak value search of next peak, right peak and left peak should meet the condition of
search parameter.
• When it can not find the peak meets the condition, it shows “No peak is found” in the screen.
1. Next Peak
Looking up the peak which amplitude is just second to current peak and meets the search
condition on the trace and marking with marker.
2. Peak Right
Looking up the peak which is on the right side of current peak and the nearest peak that
meets the search condition on the trace and marking with marker.
3. Peak Left
Looking up the peak which is on the left side of current peak and the nearest peak that meets
the search condition on the trace and marking with marker.
4. Min Search
Looking up the minimum amplitude value on the trace and marking with marker.
5. Peak-Peak Search
Execute peak search and minimum search at the same and mark with “difference value pair”
marker. Including, the peak search result is marked with difference value marker. The
minimum search result is marked with reference marker.
6. Continuous Search
Open or close continuous search. The default is close. When open continuous search, the
spectrum analyzer execute peak search once automaticly for tracking measurement signals
after the end of each sweeping.
The difference between continuous peak and signal tracking: Continuous peak always looks
up maximum value in current frequency channel. Signal tracking always tracks the signal
which has equal amplitude on the marker position before open this function, and set the
frequency of corresponding signals as center frequency.
7. Search Parameter

Define the condition of peak search to search all kinds of peak. It can only be judged as peak
when meanwhile meets the value of both “peak excursn” and “peak thresh”.
1) Peak Excursn
Specify the difference value between peak and minimum amplitude on left and right side. The
difference value which is higher than peak excursn can be judged as peak.
Parameter
Instruction
Default
10 dB
Range
0 dB ~ 200 dB
Unit
dB
Knob Step
1 dB
Direction Key Step
1 dB
2) Peak thresh
Specify the minimum value of peak amplitude. The peak which is higher than peak thresh can be
judged as peak.
Parameter
Instruction
Default
-90 dB
Range
-200 dBm ~ 0 dBm
Unit
dBm
、
-dBm
、
mV
、
uV
Knob Step
1 dBm
Direction Key Step
1 dBm
3) Peak Search
Set the peak which is looked up in peak search is whether the maximum value on the trace or the
peak meets search parameter.
• Choose “Max Value”, then look up the maximum value on the trace.
• Choose “Parameter”, then look up the peak meets the condition of search parameter on the
trace.
• This set is only valid for the peak search excecuted when press “Peak”.
3.4 Shortcut Key
3.4.1 Auto
Search for signals automatically throughout the full frequency range and adjust the frequency and
amplitude for optimum display effect of the signal, thus realizing one-key signal search and auto
setting of parameters.
Before Auto Search:
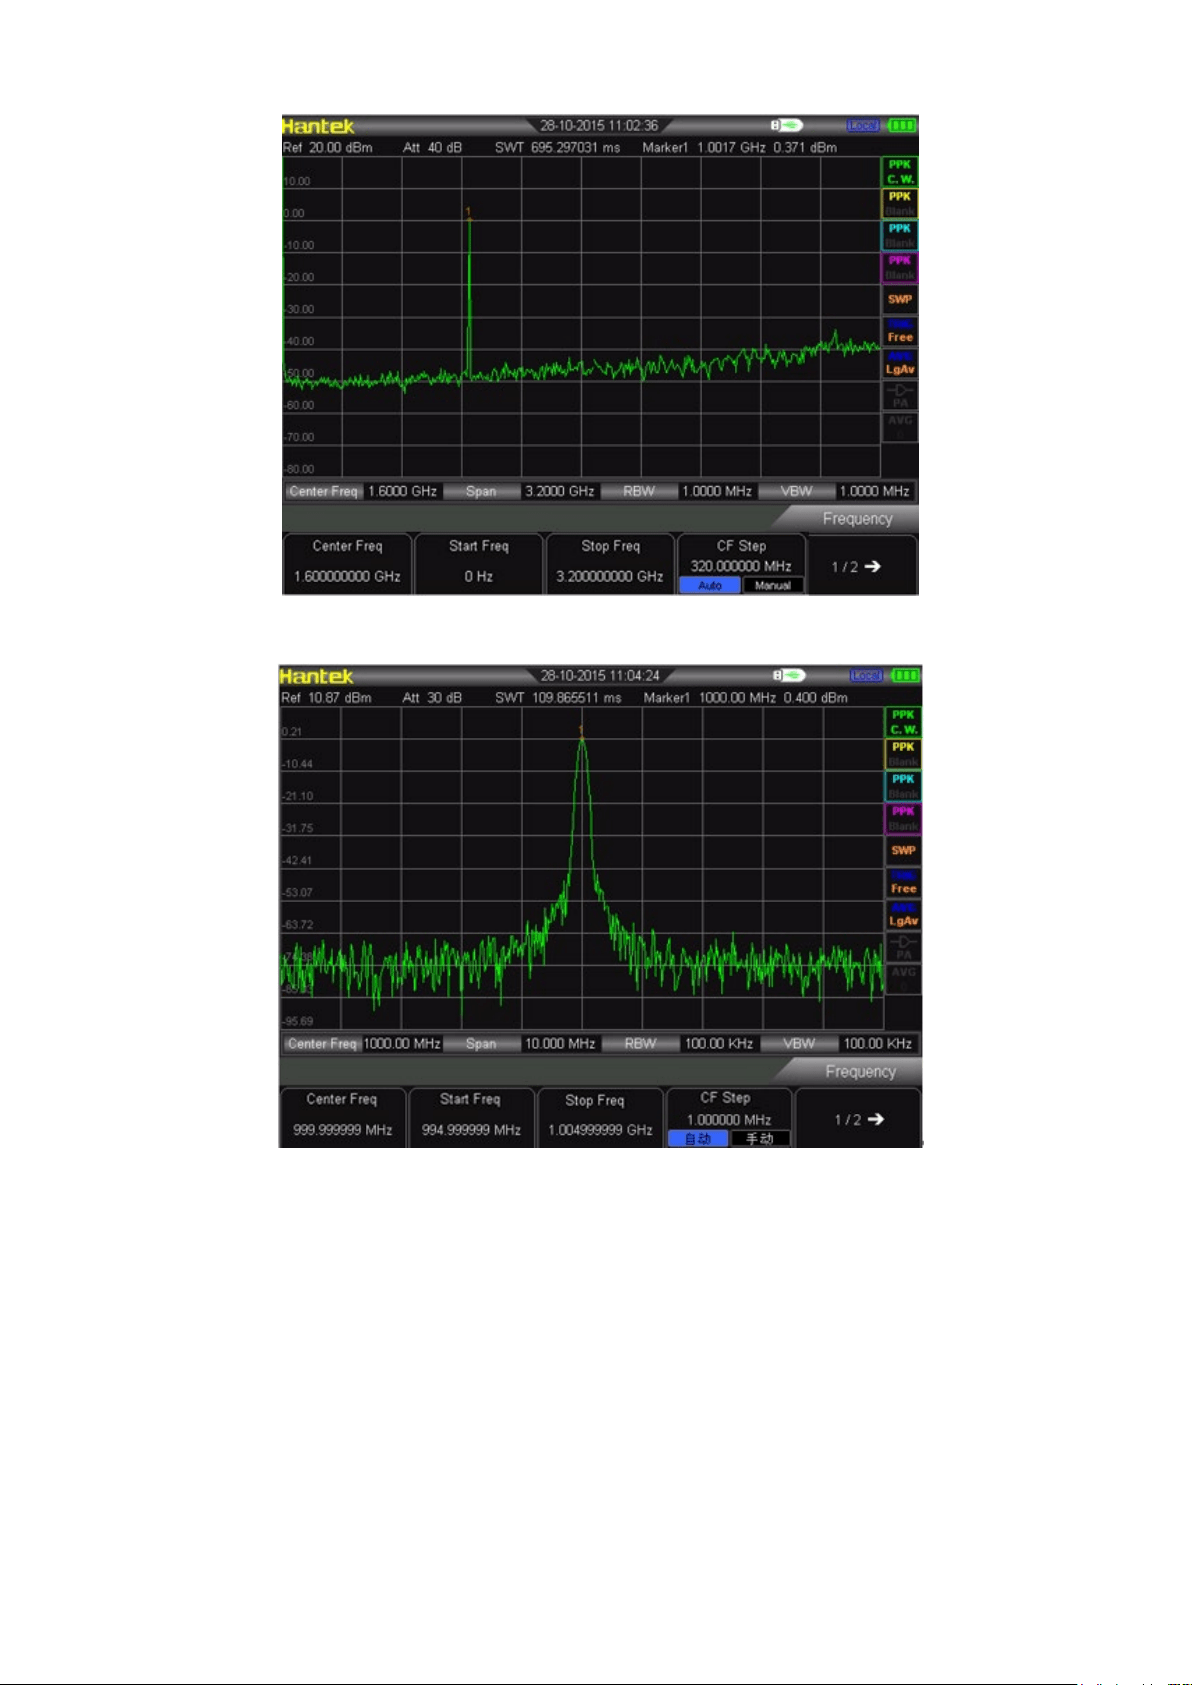
After Auto Search:
Key Points:
• In the process of auto search, the backlight of Auto turns on and “Auto Tune” is shown in the
status bar on the screen until the search is finished.
• Some parameters such as the reference level, scale, input attenuation and maximum mixing
level may be changed during the auto search.
3.4.2 Preset
Recall the preset setting and restore the analyzer to a specified status.
Key Point:
Press Preset to load the factory settings listed in the following table (except items marked
with “**”) or User-defined settings.

Parameter
Default
Frequency
Center Freq
1.6GHz (800MHz)
Start Freq
0 Hz
Stop Freq
3.2 GHz (1.6GHz)
CF Step
Auto
,
150 MHz
Span
Span
3.2 GHz (1.6GHz)
Amplitude
Ref Level
40 dBm
Ref Offset
20 dB
Scale/Div
5/DIV
Input Atten
Auto
,
40 dB
Scale Type
Log
Unit
dBm
RF Preamp
Off
BW
RBW
Auto, 1 MHz
VBW
Auto, 1 MHz
V/R Ratio
1
Sweep
Time
Auto
,
690 ms
Auto SWT
Normal
Trace
Select Trace
1
Trace Type of Trace 1
Clear Write
Avg Times
10
Measure*
Meas Fctn
Off
Marker
Select Mkr
1
Mkr Type
Normal
Delta Pair
Delta
Span Pair
Center
Mkr Table
Off
Peak
Cont Peak
Off
Peak Search
Max
Pk Excursn
10 dB
Pk Thresh
-90 dBm
3.4.3 Utility
Set the system parameters
1. Save
Press this key can save the screen as picture into U-stick.
2. Language
This series supports multi-language menu. Press this key to select the desired display language.
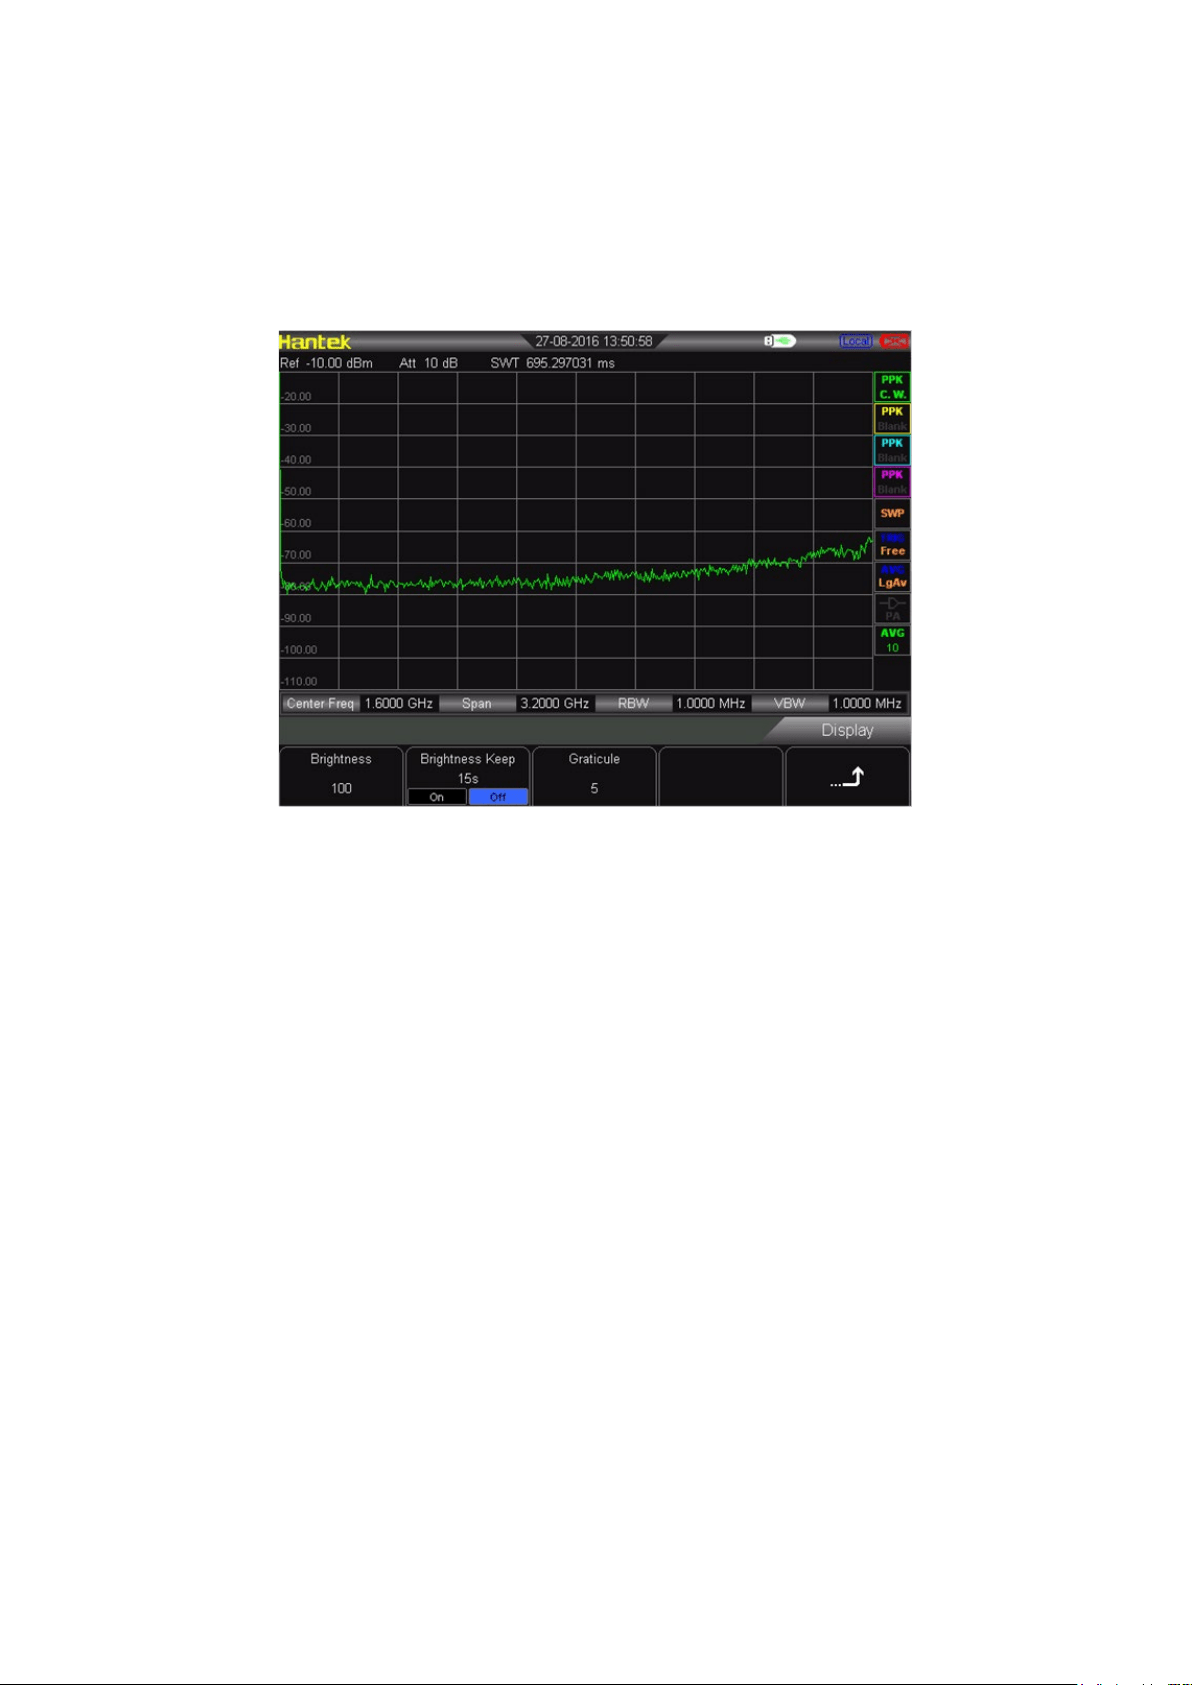
3. Display
Control the screen display of the analyzer, such as setting the graticule brightness, screen state,
brightness.
Brightness
Set the LCD brightness of the analyzer. Default is 100.
You can modify this parameter using the numeric keys, knob or direction keys.
Backlight Keeping
Set the On/Off status of backlight, default is “Off” 15s. It can be changed between On and Off.
Graticule
Set the brightness of the grid to highlight the display of the trace.
You can modify this parameter using the numeric keys, knob or direction keys.
4. Setting
This series spectrum analyzer can set reference clock, key tone, power by USB when shut down.
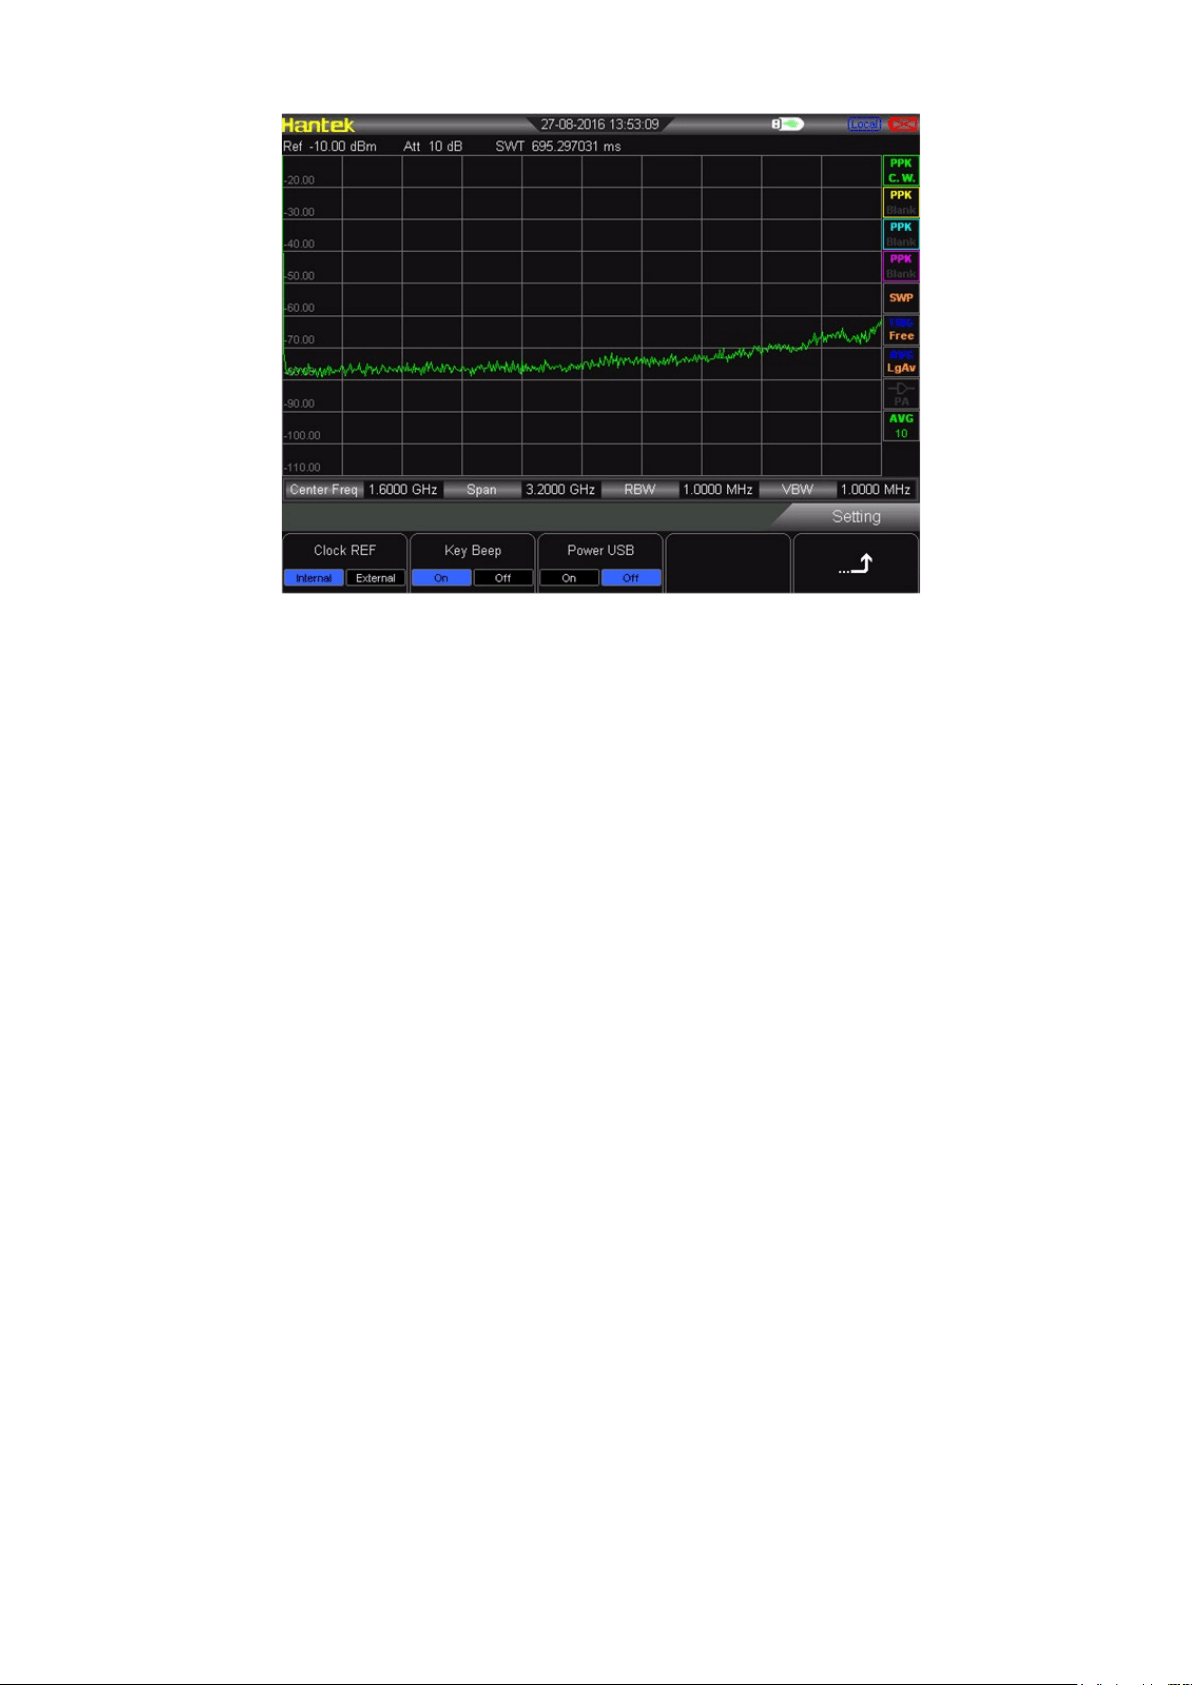
Reference Clock
HSA2000 series provides internal clock or external clock. User can select the internal or
external clock sourse directly. Default is internal clock.
Keytone
It can be turn on or off.
Power by USB when shut down
User can select whether it will still be powered by USB after shuting down.
5. Remote Control
Users can control this sesies spectrum analyzer through USB or LAN remote interface.
Remote Communication
Select to use LAN or USB interface, or close them all.
6. Power On/Preset
Power On/Preset includes power on, preset type, save as user. The user can set the power-on
status according to the requirement.
Power on
The user can select power-on status as the last time or preset. The preset content refers to
preset type.
Preset Type
The preset type includes Default, User, Last time. Default is the parameter of factory setting.
User is the parameter that is saved by the user manually. Last time is the paremeter setting
status that the user power off the equipment last time.
Save User
User can save the parameter of spectrum analyzer according to the requirement manully.
Press “Save User”, then it shows “saved”.
7. Time/Date
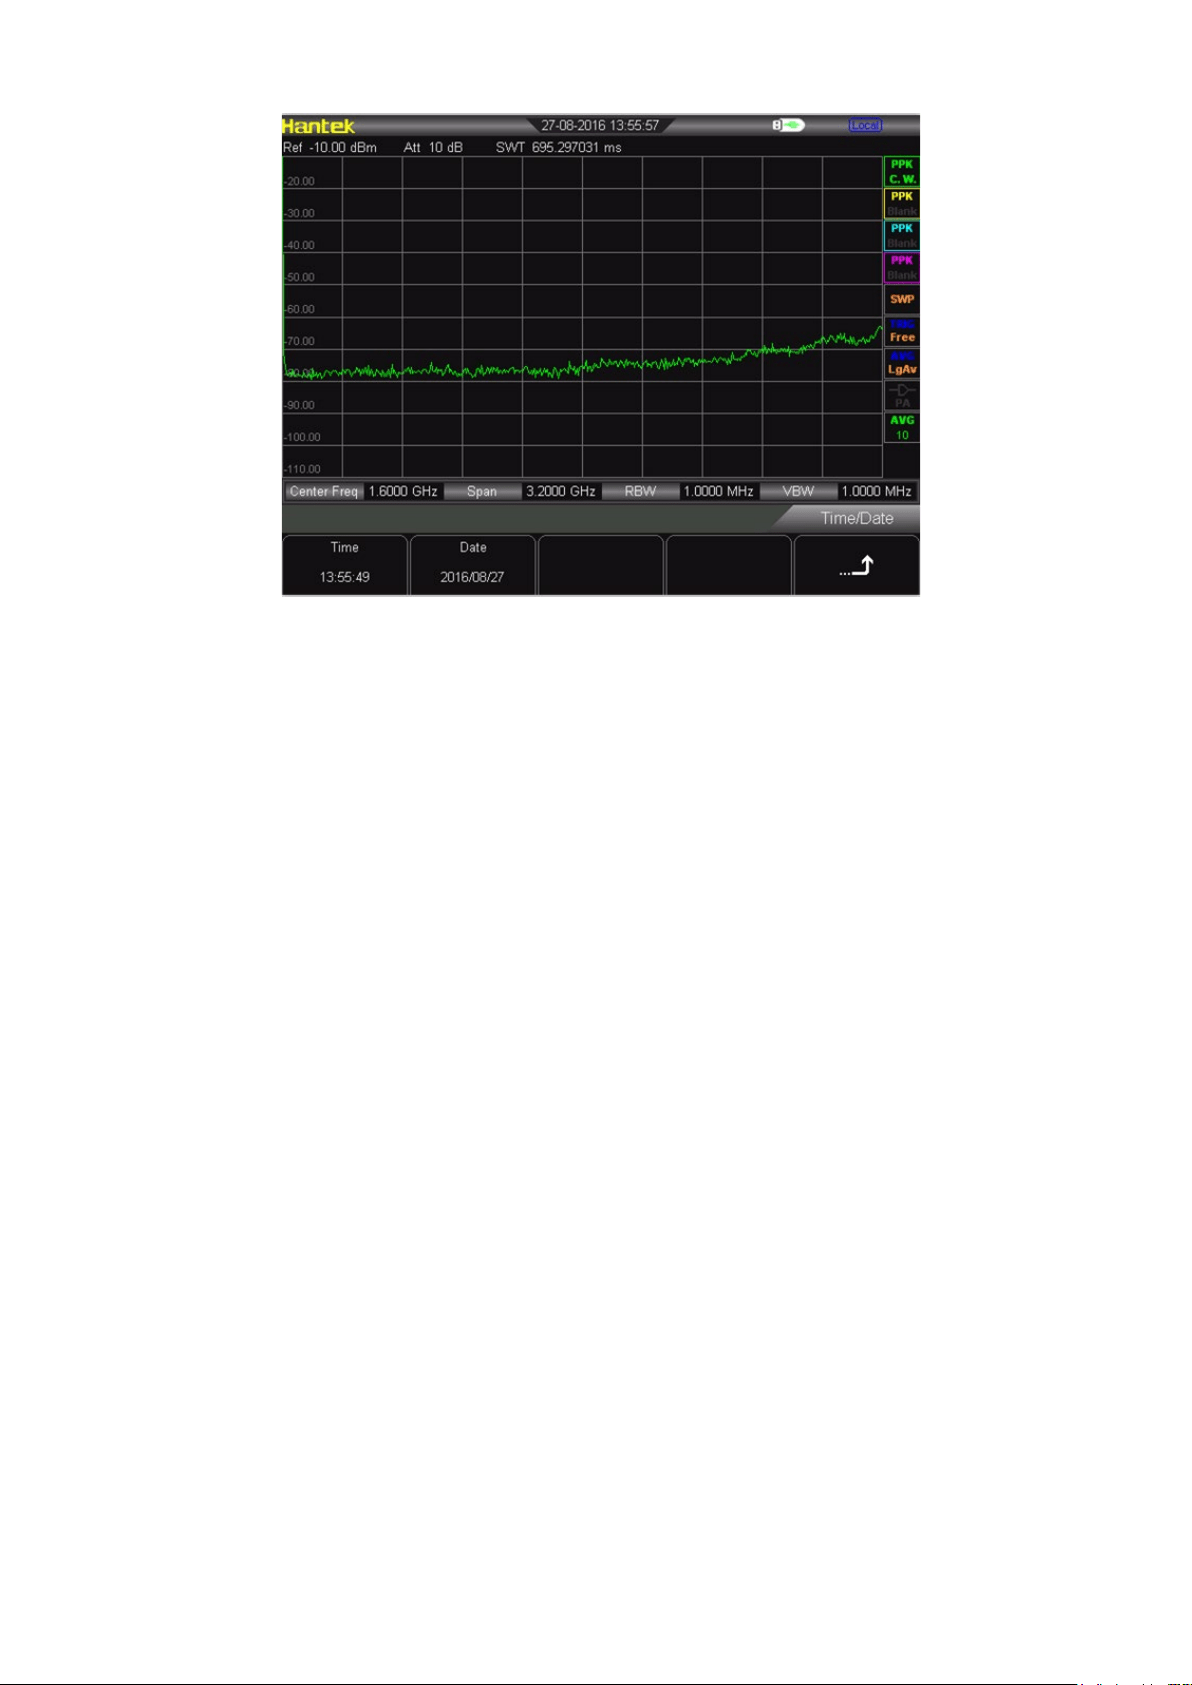
The system time is displayed in “hh:mm:ss YYYY-MM-DD” format in the DSA800 user interface.
The output file can include the time information when printing or storing interface image according
to your setting.
Set Time
Set the display time of the analyzer. The time format should be hhmmss, for example, 231211
(denotes 23:12:11).
Set Date
Set the display date of the analyzer. The date format should be YYYYMMDD, for example,
20111001 (denotes October 1st, 2011).
8. Diagnostics
Screen Test
Test whether the screen has a dot defect using five colors: White, Red, Green, Blue and Black.
Key Test
Enter the keyboard test interface. Press the function keys at the front panel one by one and
observe whether the corresponding key lights. If not, an error may have occurred in that key. Note
if the key at the front panel is transparent, its backlight will also light when you press it. To exit the
test, press Esc three times.
9. Update
User can update firmware. Plug in the U-stick within latest firmware file, the instrument will detect
it. Click UTILITY→update→firmware.
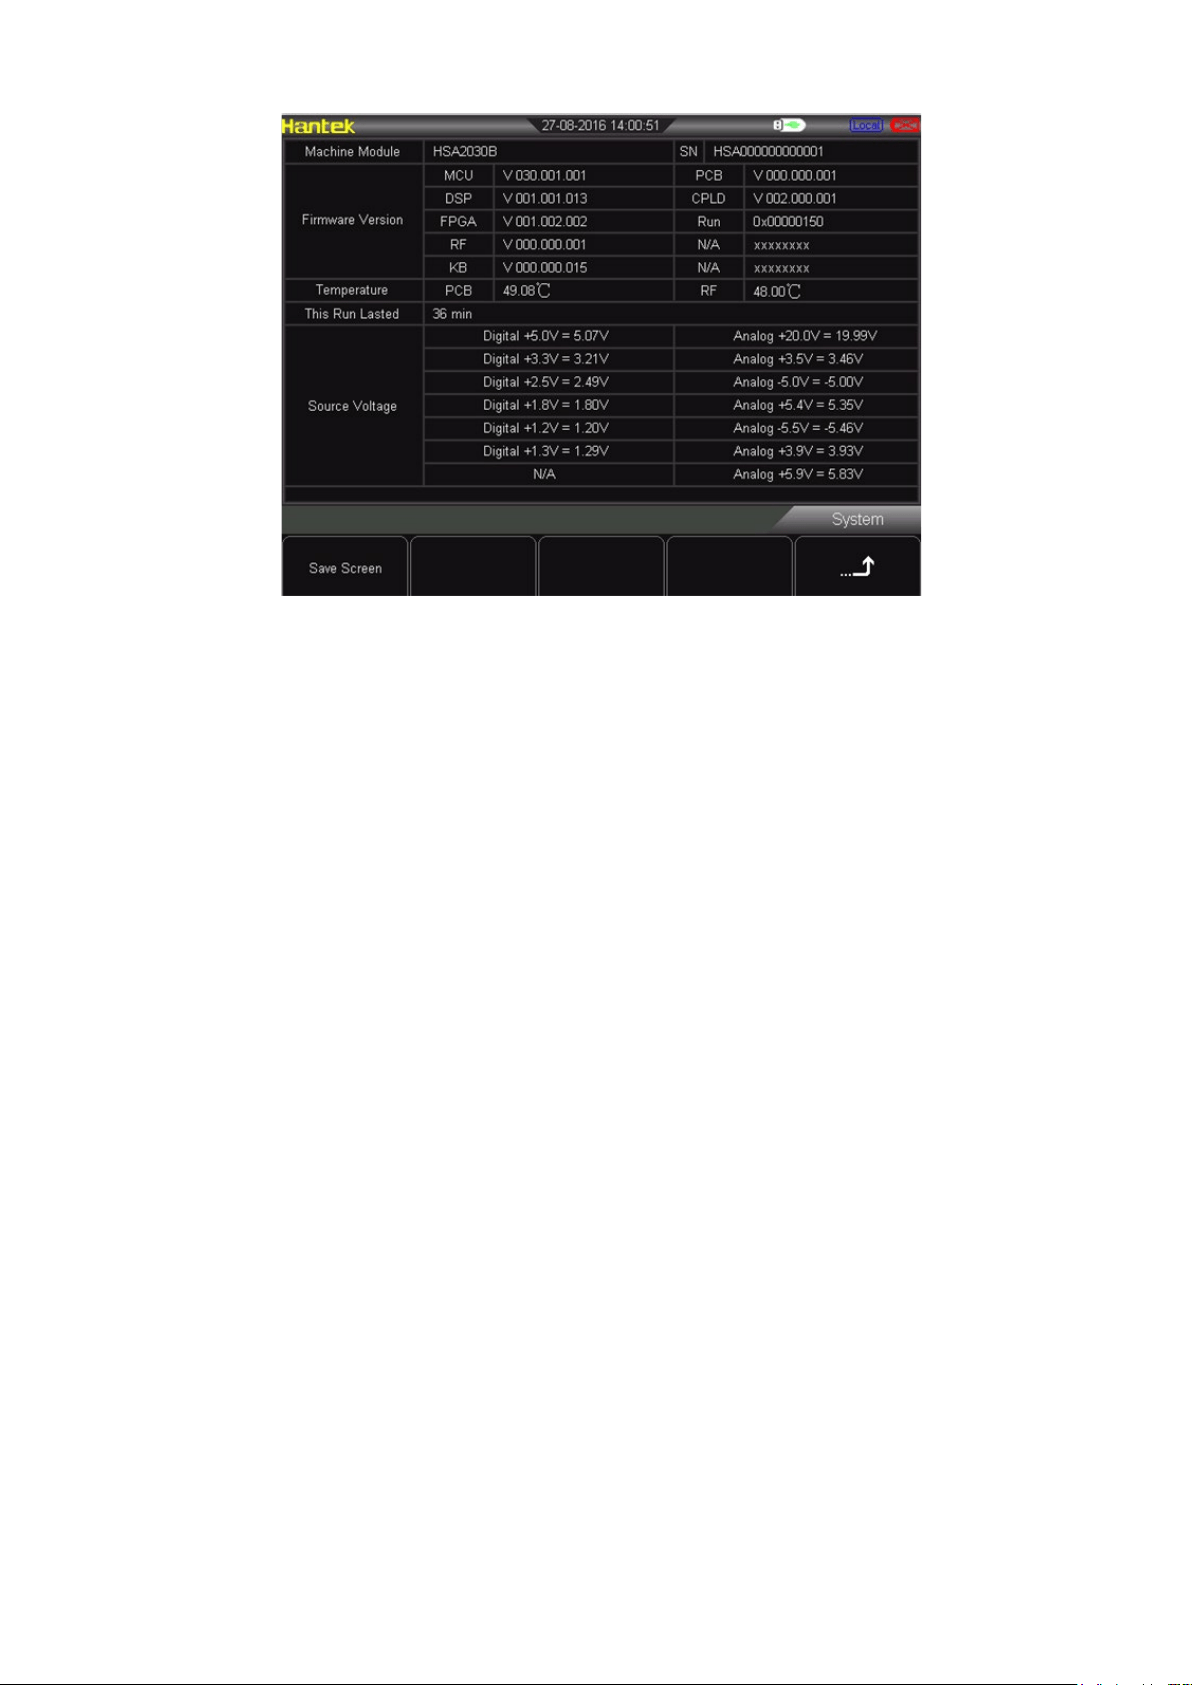
10. System Information
User can get the instrument information clearly. Click UTILITY → SYSTEM INFORMATION. It
includes firmware version, temperature, operation time of this time, power voltage.

Chapter4 Test Case
Testing Low Level Signal
Testing Signal Distortion
4.1 Testing Low Level Signal
This section introduces how to test low level signal, and how to differentiate it with the
noice in the same spectrum. The following is three methods to test low level signal.
4.1.1 Reduce the Loss of Input
The ability of spectrum analyzer to test low signal is limited by the noice produced
internally. The level is influenced by input attenuator when signal passes the
spectrum analyzer. If the signal is very close to the bottom of noise, it can differentiate
the signal with the noice to reduce the loss of input.
1) Reset spectrum analyzer
2) Set the frequency of signal source and amplitude as 1 GHz and -80 dBm. Connect
the RF OUT port of signal source to the RF IN port of spectrum analyzer and turn
on the signal output.
3) Set center frequency, span and reference level:
Press FREQ → 1GHz
Press SPAN → 5MHz
Press AMPT→ - 40dBm
4) Move the peak value that needed to the center of screen.
Press MARKER → Peak
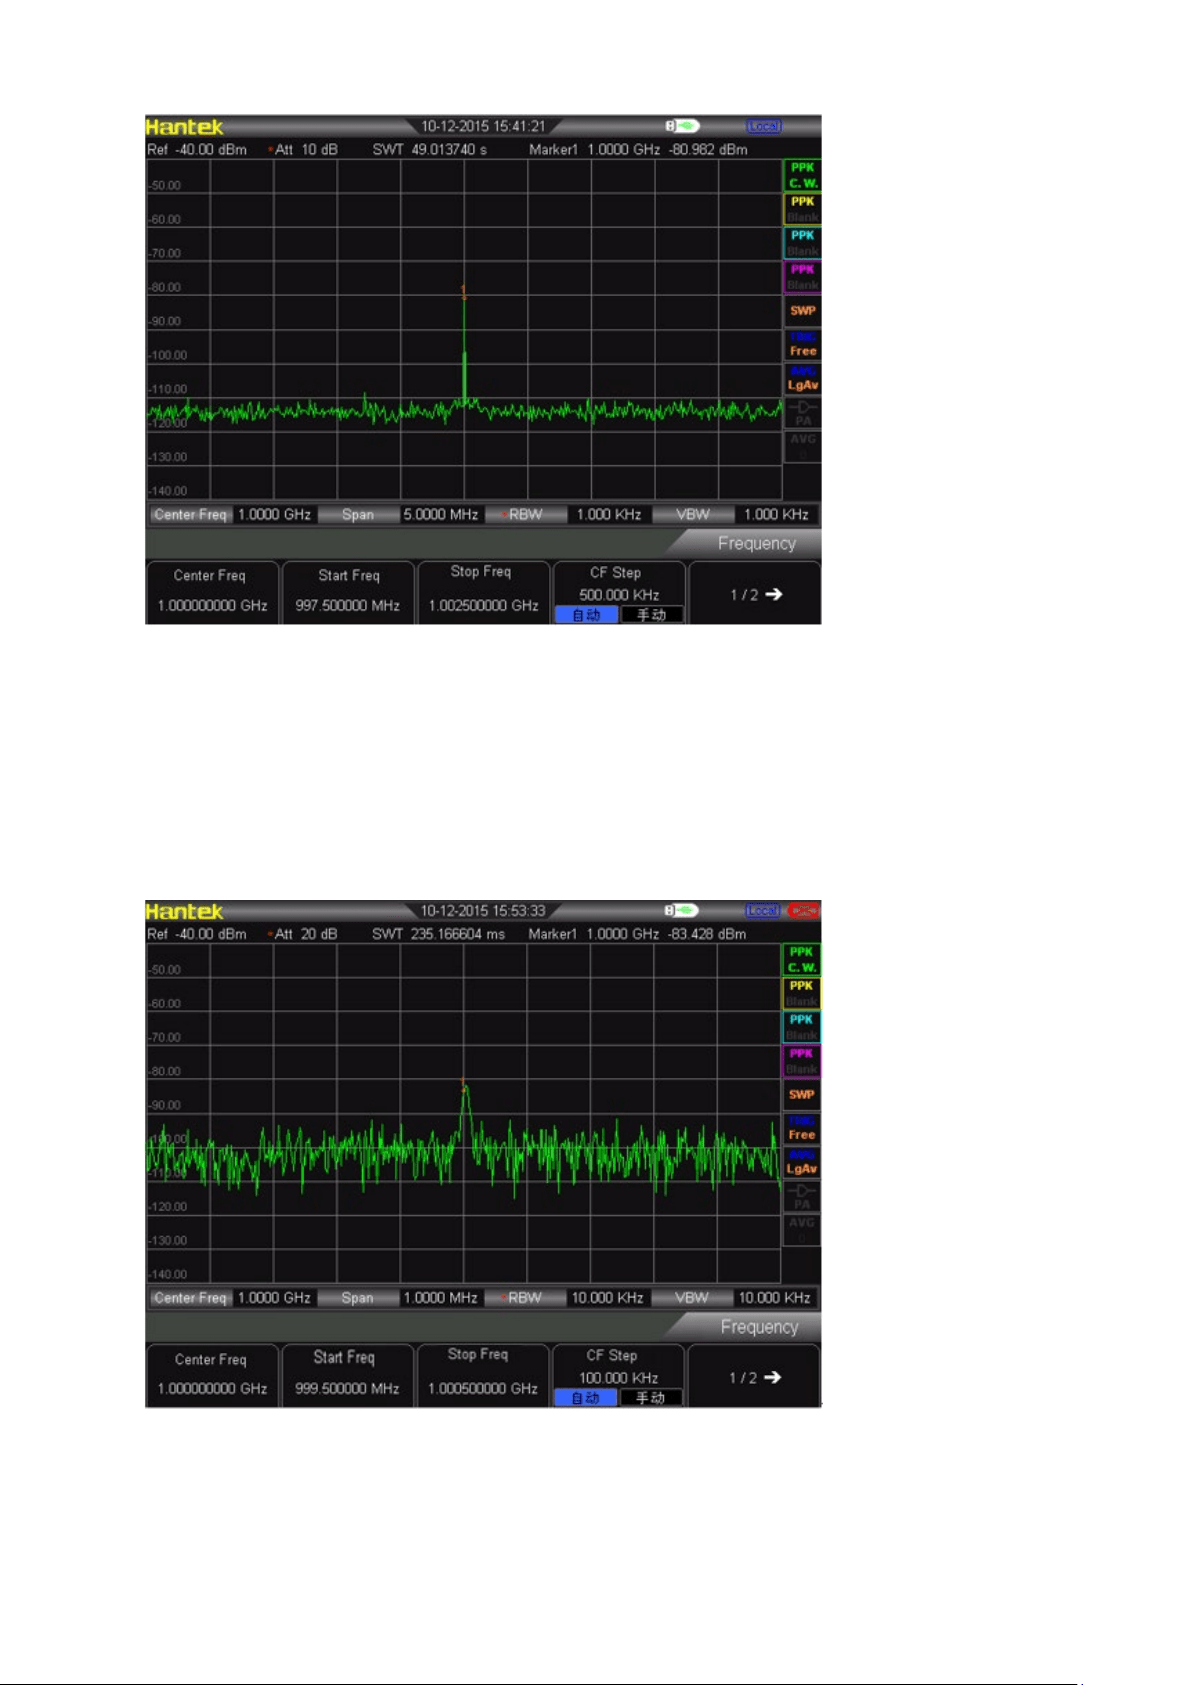
1) Reduce the span to 1 MHz. If need, move the peak value to the center of screen
again.
Press SPAN →1 MHz
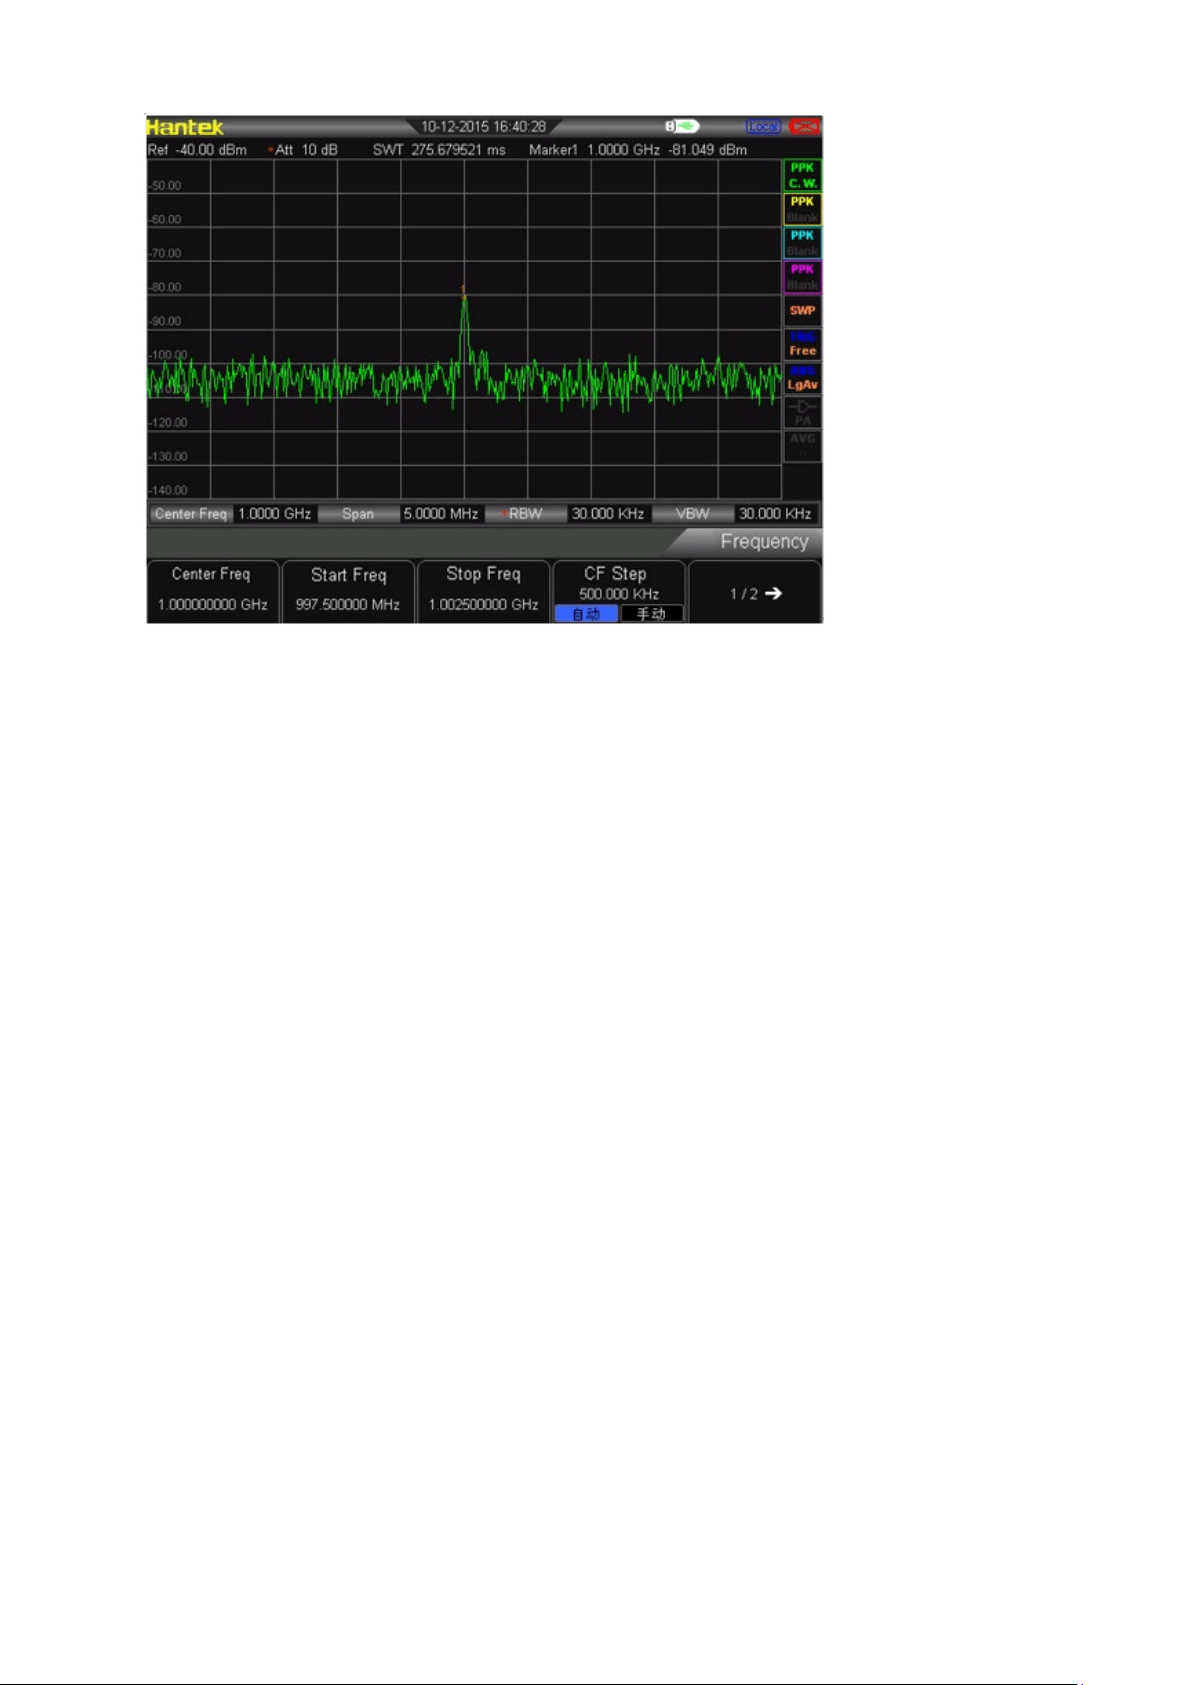
2) Set the attenuation as 20 dB. Pay attention that when the attenuation increases,
the bottom of noice will be more close to signal level.
Press AMPT→Attenuation→ 20dB
3) Press AMPT →Attenuation→ 0 dB, set the attenuation as 0 dB.
4.1.2 Reduce the Resolution Bandwidth
The internal noice level is influenced by resolution bandwidth, but continuous wave
signal is not. Decrease RBW into 10%, and the bottom noise will also decrease 10
dB.
1) Reset spectrum analyzer
2) Set the frequency of signal source and amplitude as 1 GHz and -80 dBm.
Connect the RF OUT port of signal source to the RF IN port of spectrum
analyzer and turn on the signal output.
3) Set center frequency, span and reference level:
Press FREQ → 1GHz
Press SPAN → 5MHz
Press AMPT→ - 40dBm
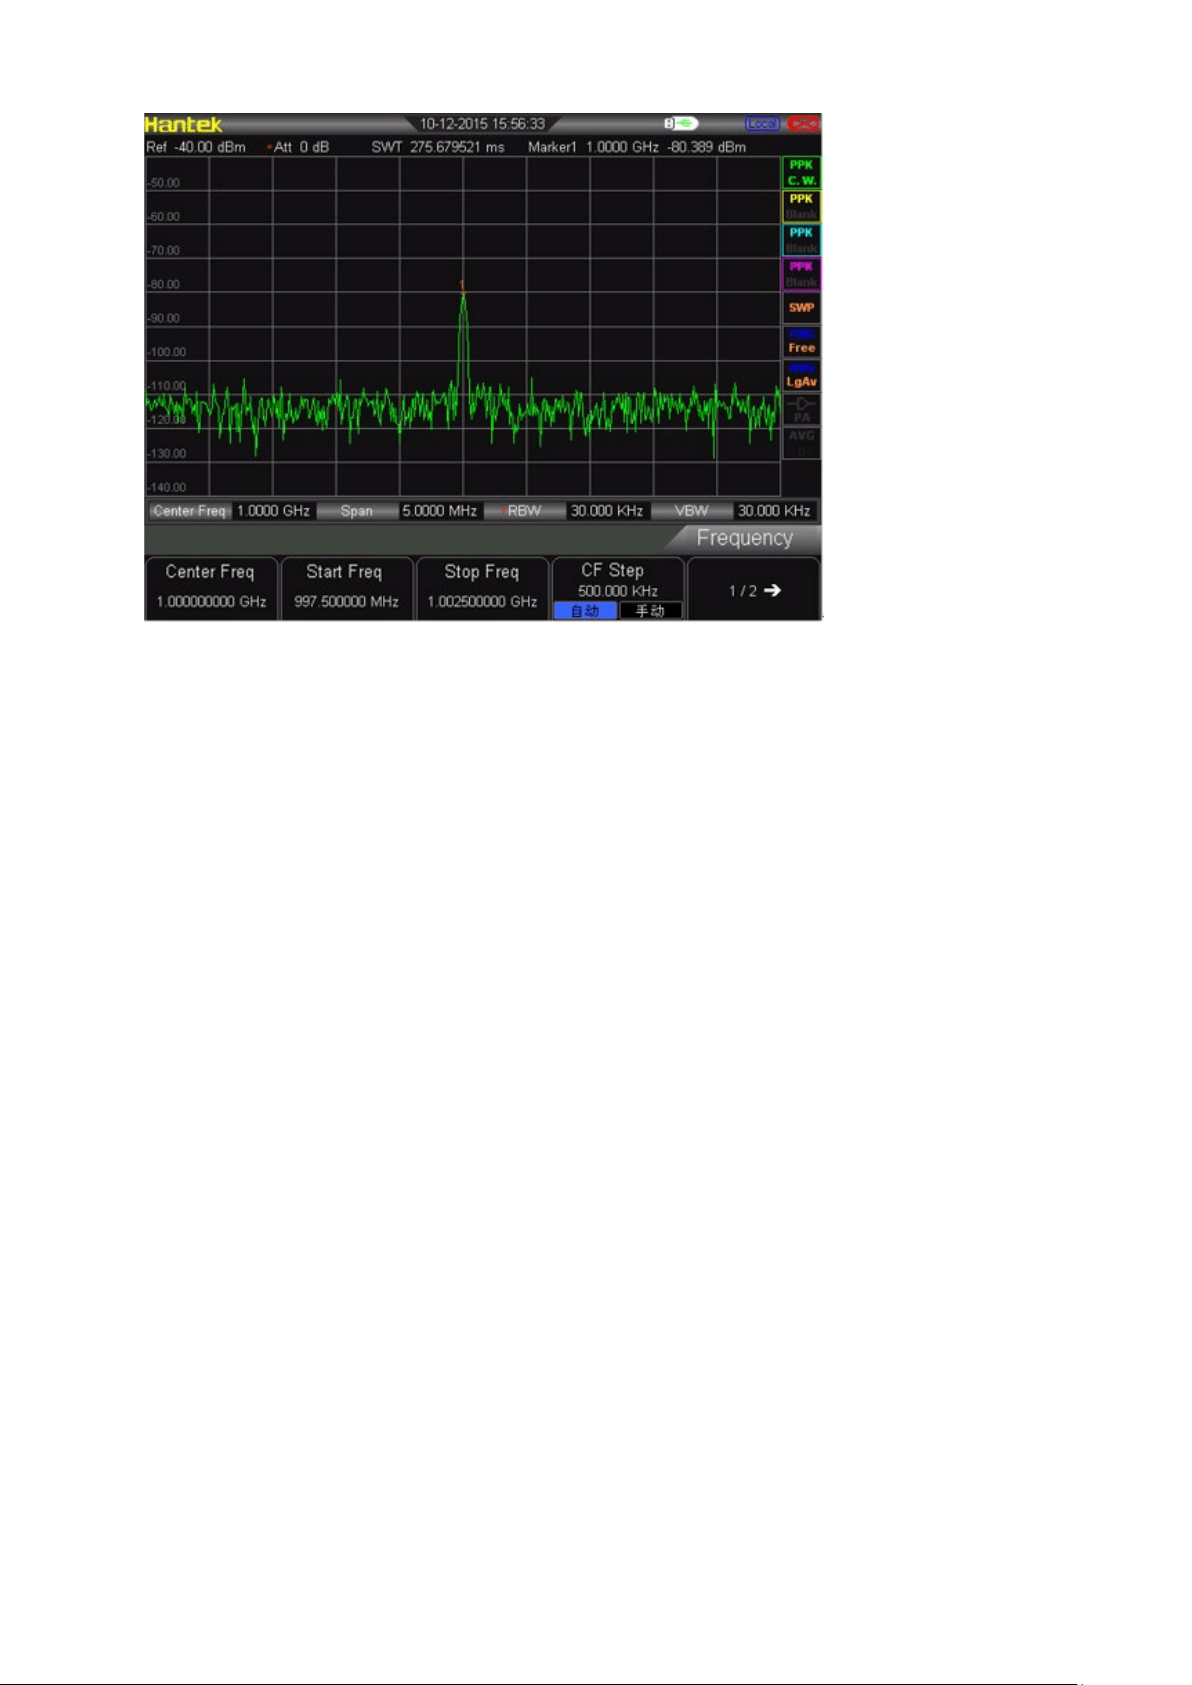
4) Reduce resolution bandwidth.
Press BW, and press manual. The resolution bandwidth can be reduced by
knobs and arrow key. Because the noise level reduces, the low level signal
will be clearer, as following picture.
4.1.3 Trace Average
Taking the average is the digital processing. It is to plus current value in each trace
point and previous average value, and then take the average. Choose the operation
of taking average. When spectrum analyzer is doing the automatic coupling, it can
make the displayed noise level get smooth to change detection mode into sampling
mode.
1) Reset spectrum analyzer
2) Set the frequency of signal source and amplitude as 1 GHz and -80 dBm.
Connect the RF OUT port of signal source to the RF IN port of spectrum
analyzer and turn on the signal output.
3) Set center frequency, span and reference level:
Press FREQ → 1GHz
Press SPAN → 5MHz
Press AMPT→ - 40dBm
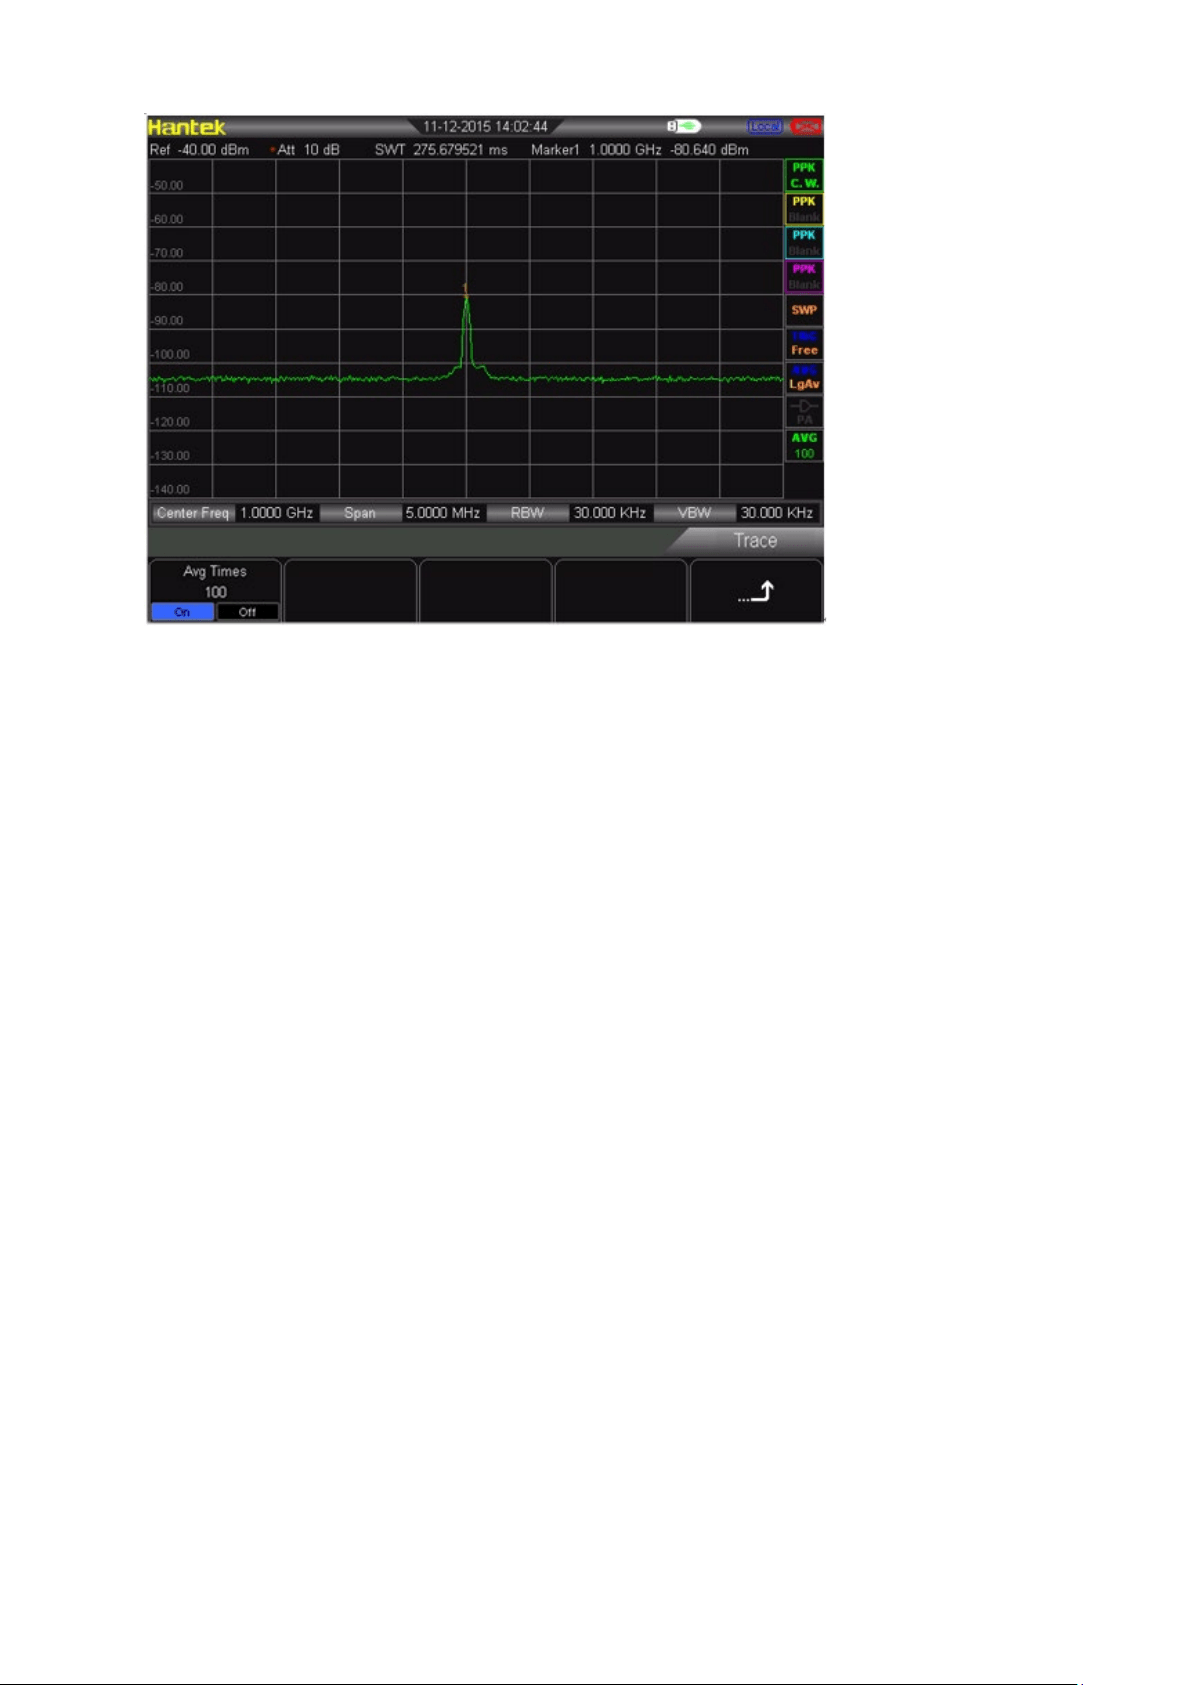
4) Press TRACE →Average (ON) to turn on the average function.
Press 100 → ENTER, set the number of average as 100. Because the
operation of taking the average will make the trace be smooth, and the low
level signal will be clearer.
4.2 Measuring Signal Distortion
This selection introduces how to recognize and measure signal distortion.
Recognize the distortion produced by spectrum analyzer.
The high level input signal may cause the distortion signal produced by spectrum
analyzer. This distortion signal will cover the true signal that needs to be measured in
the input signal. The user can recognize these signals through trace and RF
attenuator. If yes, this distortion is produced inside the instrument. In this case, we
use a signal output by a function generator as signal source to recognize whether the
harmonic distortion component is produced by spectrum analyzer.
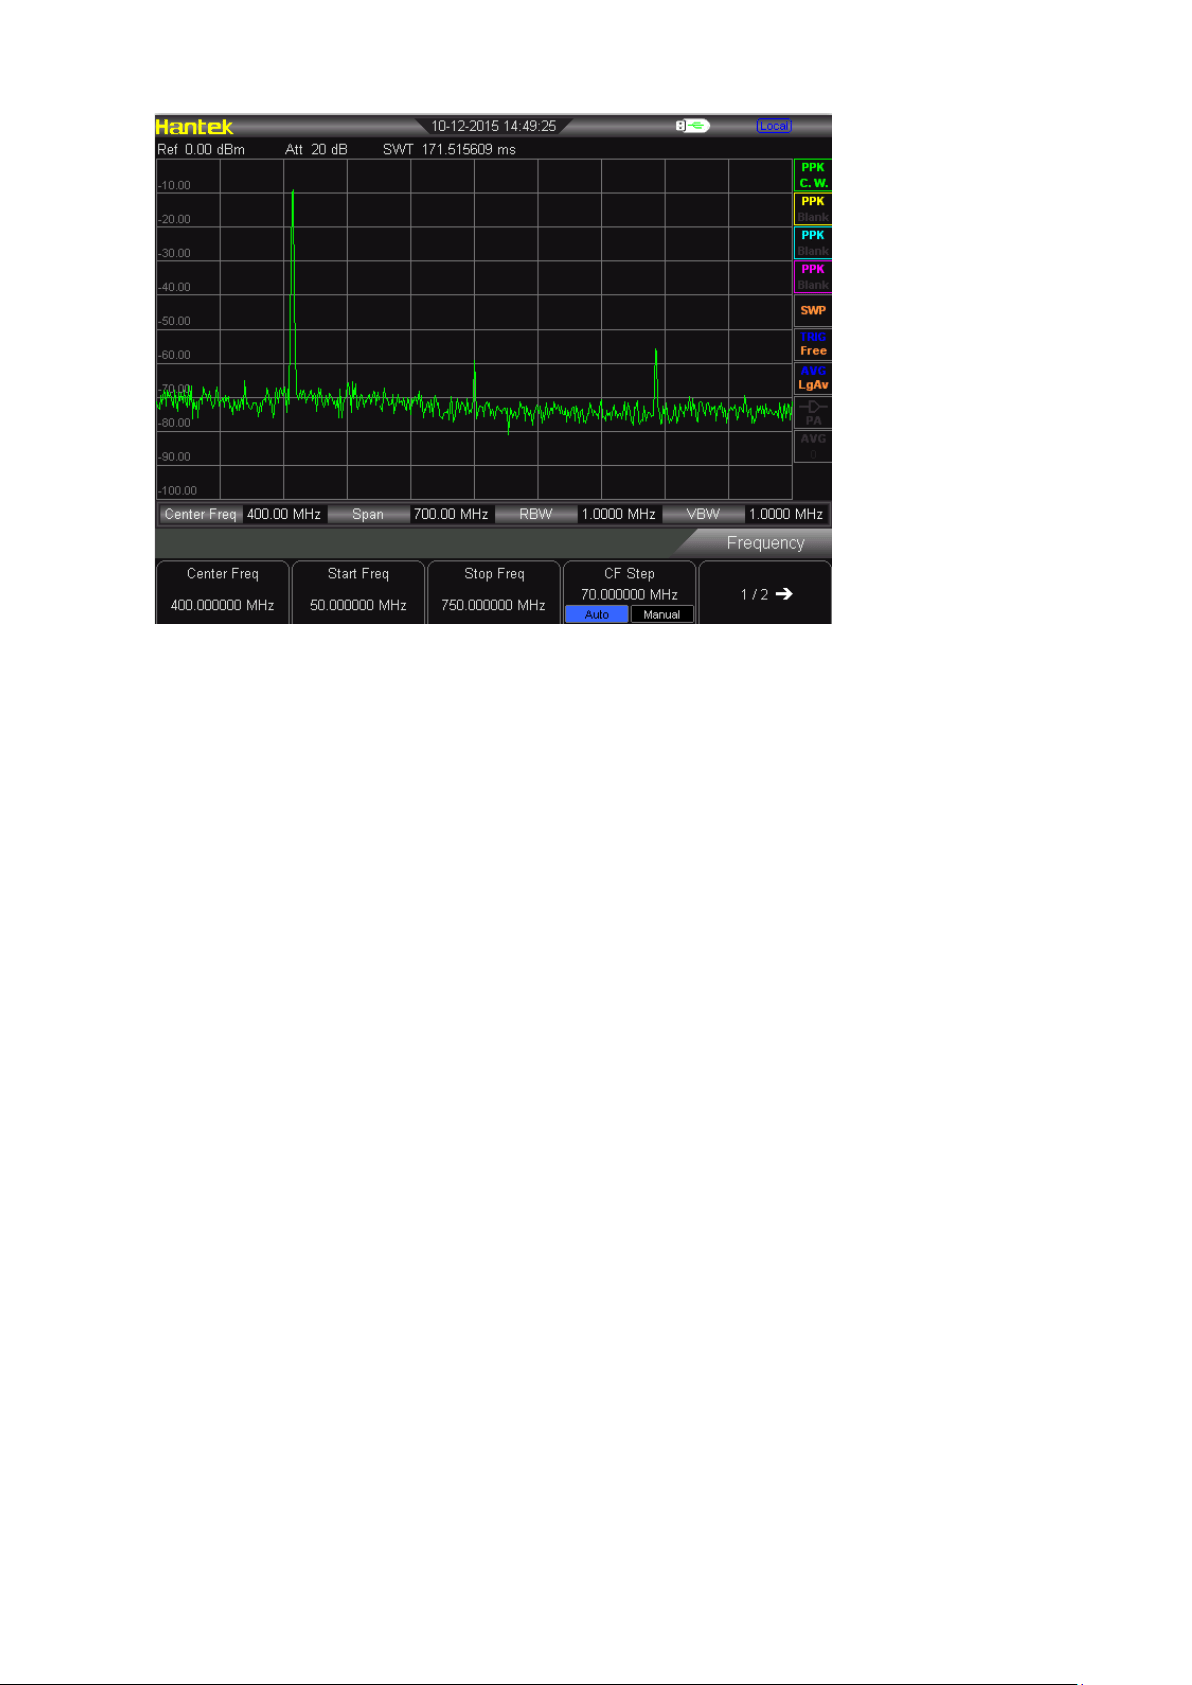
1. Connect function generator to RF IN of spectrum analyzer. Set the input
frequency and amplitude of signal source as 200MHz, -10dBm.
2. Set center frequency and span of spectrum analyzer.
Press [PRESET] (to restore factory settings) •
Press [FREQ] → 400MHz
Press [SPAN] → 700MHz
The harmonic distortion component produced by this signal at the inputmixer of
spectrum analyzer (arranged in turn with original 200MHz signal at 200MHz
interval).
1. The center frequency should be changed as the frequency value at the first
harmonic wave.
Press [MARKER] → PEAK
2. Change the span as 50 MHz, and display the signal in the center of screen again.
Press [SPAN] → 50MHz
Press [MARKER] → PEAK
3. Set the attenuation as 0 dB:
Press [AMPT] → Attenuation → 0dB
4. To recognize whether the harmonic distortion component is produced by
spectrum analyzer, firstly display the input signal in trace 2:
Press [TRACE] → Trace 2
Press [TRACE] → Clear
5. Place a Delta mark in the harmonic distortion component of trace 2:
Press [MARKER] → peak
Press [MARKER] → Delta
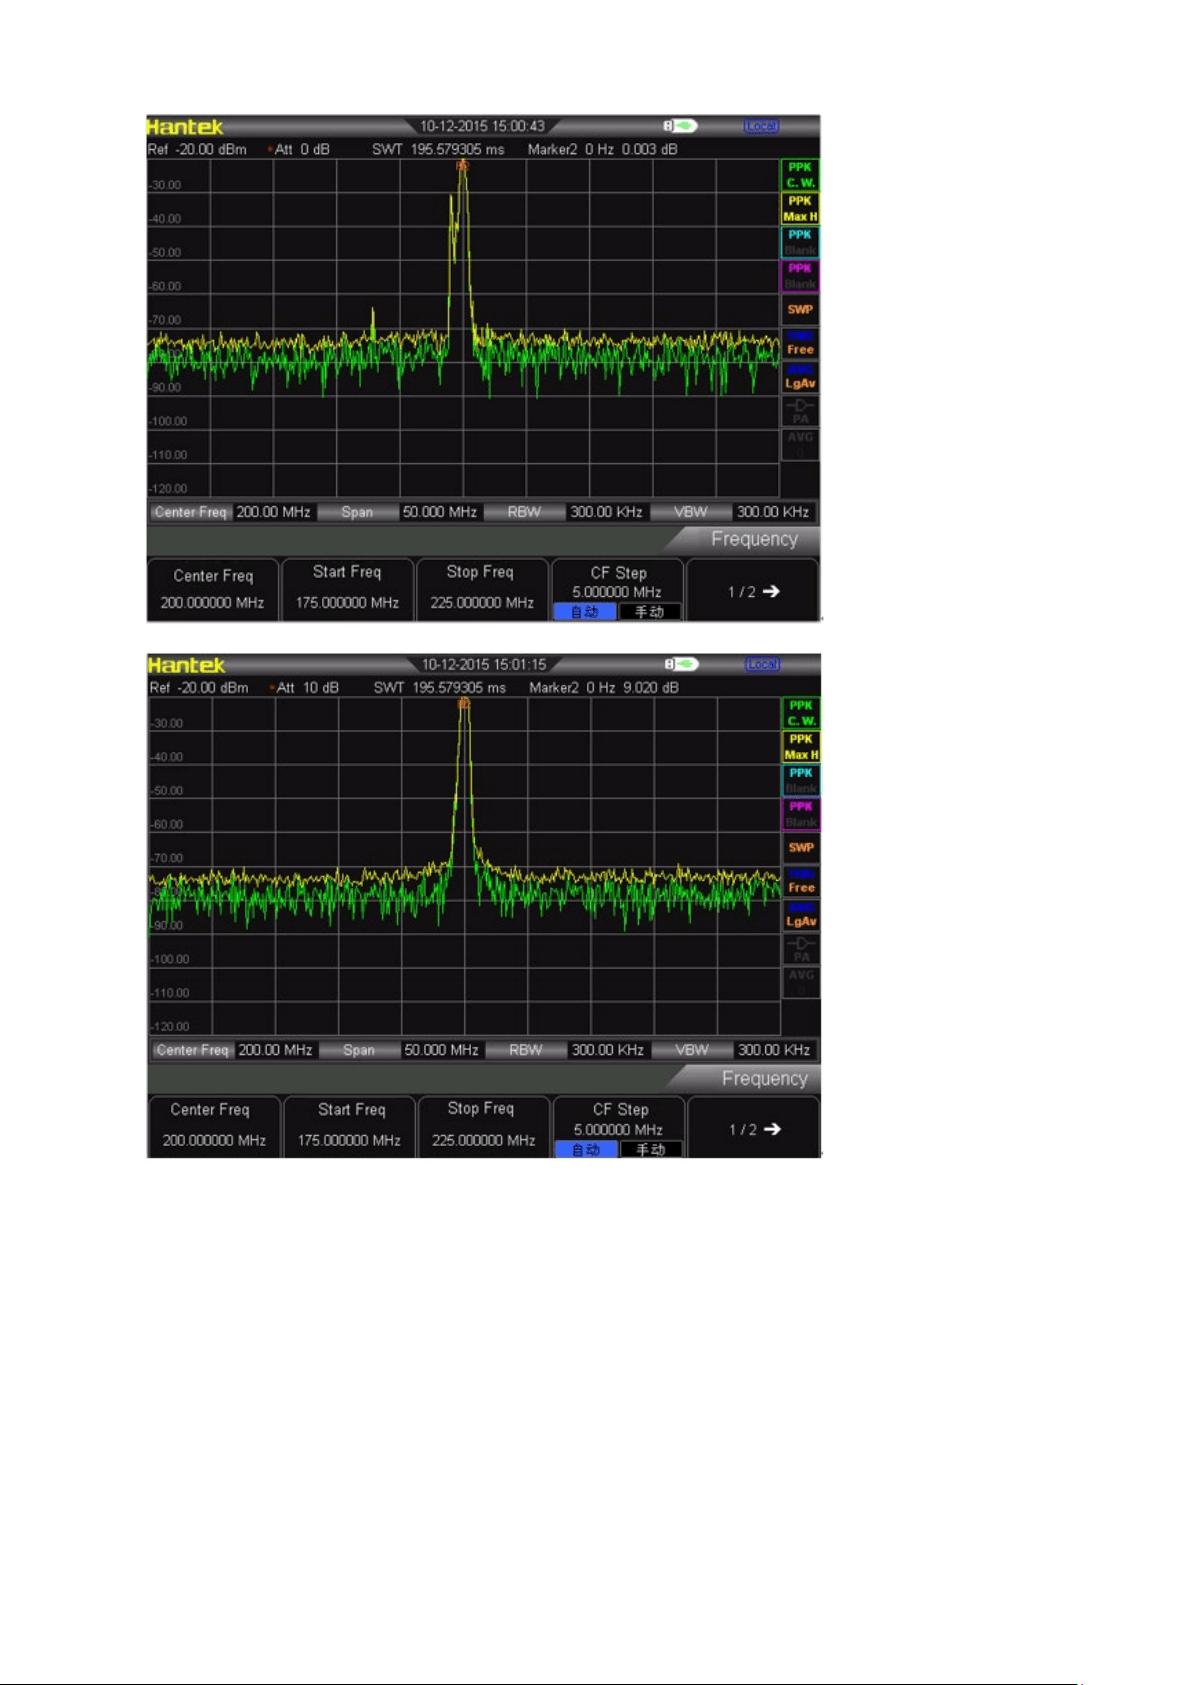
6. Press [AMPT] → Attenuation → 10dB to turn up the RF attenuation to 10 dB.
The reading of amplitude difference is influenced by two factors:
1) To increase input attenuation will make signal to noise ratio (SNR) worse which will
cause the reading to be positive.
2) The loss of harmonic wave caused by internal circuit of spectrum analyzer will
make the reading to be negative. To set the input attenuation can produce minimum
reading.

Chapter5 SCPI Programme
User can control HSA2000 Series spectrum analyzer by USB, LAN or remote interface. This
manual to guide the user to use SCPI commands to control HSA2000 Series spectrum analyzer
by USB, LAN or remote interface.
Contents of this chapter:
SCPI Brief Introduction
General Command
CALCulate subsystem
DEMOdulation subsystem
DISPlay subsystem
TRACe subsystem
FORMat subsystem
SENSe subsystem
INITiate subsystem
TRIGger subsystem
UNIT subsystem
SYSTem subsystem

5.1 SCPI Brief Introduction
SCPI (Standard Commands for Programmable Instrument) is an ASCII- based instrument
command language designed for test and measurement instruments, with the goal of reducing
automatic test equipment (ATE) program development time. SCPI accomplishes this goal by
providing a consistent programming environment for instrument control and data usage. This
consistent programming environment is achieved by the use of defined program messages,
instrument responses, and data formats across all SCPI instruments. By providing a consistent
programming environment, replacing one SCPI instrument with another SCPI instrument in a
system should require less effort than with non- SCPI instrument.
SCPI is not a standard which completely provides for interchangeable instrumentation. SCPI
helps move toward interchangeability by defining instrument commands and responses, but not
functionality, accuracy, resolution, and so forth.
5.1.1 Basic Knowledge Requirement
Programming with SCPI requires knowledge of:
• Computer programming languages, such as C or C++.
• The language of your instrument. A HAS Series spectrum analyzer employs SCPI as its
programming language.SCPI.
5.1.2 Command Syntax
Command syntax includes standard notations and statement rules.
Command Statement Rules Overview
• Command statements read from left to right
• Use either long form or short form of keywords, but do not use both
• No separating space between the keywords, only use a colon to separate keywords of
different levels
• Always separating a keyword from a variable with a space
• Always separating a variable from its unit with a space (if variable has a unit)
5.1.3 Standard Notations
A command consists of mnemonics (keywords), parameters and punctuation. Before you start to
program your analyzer, familiarize yourself with the standard notation of each of them.
Keywords
Many commands have both a long and a short form: use either one. (a combination of the two is
not allowed). Consider the: FREQuency command for example:
• Short form : FREQ
• Long form : FREQuency
SCPI is not case sensitive, so fREquEncy is just as valid as FREQUENCY, but FREQ and
FREQUENCY are the only valid forms of the FREQuency command. In this documentation, upper
case letters indicate the short form of the keyword. The upper case and lower case letters indicate
the long form of the keyword.

5.1.4 Punctuation
• A curly brackets “{ }” indicates a variable parameters to be defined.
• A vertical bar "|" dictates a choice of one element from a list. For example: <A>|<B> indicates
that either A or B can be selected, but not both.
• Square brackets "[ ]" indicates that the enclosed items are optional.
• Angle brackets "< >" indicates a variable value to be defined.
• A question mark "?" after a command indicates that this command is a query. The instrument
should return a data to the controller
5.1.5Separator
• A colon “:” separates keywords of different hiberarchy.
• A space separates a keyword and a parameter, as well as a parameter and a unit.
5.1.6 Default unit of parameters
The analyzer has the following default units for numeric variables.
Parameter
Default unit
Frequency
Hz
Amplitude
dBm
Time
uS
5.2 Common Commands
IEEE 488.2 common commands is mainly used to operate or query the status register.
5.2.1 Clear Status
Command format:
*CLS
Function description:
This command clears the error queue of the analyzer.
5.2.2 Identification Query
Command format:
*IDN?
Function description:
This command returns an instrument identification information string. The response is organized
into four fields by commas. The field definitions are as follows:
• Manufacturer
• Model
• Serial number
• Firmware version

5.2.3 Reset
Command format:
*RST
Function description:
This command returns the instrument to a factory defined condition that is appropriate for
remote programming operation.
5.2.4 ABORt Command
Command format:
:ABORt
Function description:
Give up the current operation. Restart the sweep.
5.3 CALCulate Subsystem
5.3.1 CALCulate: MARKer Subsection
• Markers All Off on All Traces
Command format:
:CALCulate:MARKer:AOFF
Function description:
This command turns off all markers on all traces.
• Turn on or off COUNT
Command format:
CALCulate:MARKer:FCOunt[:STATe] OFF|ON|0|1
Function description:
Turn on or off the COUNT function
• Query frequency values of COUNT
Command format:
CALCulate:MARKer:FCOunt:X?
Function description:
Query frequency values of COUNT, unit is Hz.
• Set mark as current mark
Command format:
CALCulate:MARKer:CURrent 0|1|2|3
Function description:
Set mark as current mark, easy for control.
• Set measurement type of current mark
Command format:
CALCulate:MARKer:MODE OFF|POSition|DELTa|BAND|SPAN
CALCulate:MARKer:MODE?

Function description:
Set measurement type of current mark
Query measurement type of current mark
Parameter specification
:
OFF: Turn off current cursor
POSition: to set measurement type as Normal
DELTa: to set measurement type as Different value
BAND: to set measurement type as Band
SPAN: to set measurement type as Span
Return format
:
Query return to POS,DELT,BAND,SPAN or OFF
• Marker Peak Left Search
Command format:
CALCulate:MARKer:MAXimum:LEFT
Function description:
Search a peak which is the nearest on the left of current peak and meets the search
condition, and mark with current cursor.
Instruction
“No peak is found” will be displayed on the screen when there is no approperate
peak been found.
• Marker Peak Right Search
Command format:
CALCulate:MARKer:MAXimum:RIGHt
Function description:
Search a peak which is the nearest on the right of current peak and meets the
search condition, and mark with current cursor.
Instruction
“No peak is found” will be displayed on the screen when there is no approperate
peak been found.
• Marker Peak Next Search
Command format:
CALCulate:MARKer:MAXimum:NEXT
Function description:
Search a peak which amplitude is next only to current peak and meets the search
condition, and mark with current cursor.
Instruction
“No peak is found” will be displayed on the screen when there is no approperate
peak been found.
• Execute peak search and mark once.
Command format:
CALCulate:MARKer:MAXimum:MAX
Function description:
Execute peak search once as the setting of search mode, and mark it with current
marker.

• Check the minimum amplitude value on the trace.
Command format:
CALCulate:MARKer:MINimum
Function description:
Check the minimum amplitude value on the trace, and mark it with current marker.
Instruction
It shows “No peak found” when can not find any peak.
• Turn on or off the continuous peak search
Command format:
CALCulate:MARKer:CPEak[:STATe] OFF|ON|0|1
Function description:
Turn on continuous peak search and mark the peak with current marker. Or turn off
the continuous peak search.
Instruction
If there is no marker be turned on, it turns on Marker 1 automaticly and marks peak.
5.4 DEMOdulation Subsystem
5.4.1 AM Demodulation
Command format:
DEMod:AM:STATe OFF|ON|0|1
DEMod:AM:STATe?
Function description:
This command toggles AM demodulation function between on and off.
Check the on and off status of AM demodulation function.
Return format
Return 0 or 1
5.4.2 FM Demodulation
Command format:
DEMod:FM:STATe OFF|ON|0|1
DEMod:FM:STATe?
Function description:
This command toggles FM demodulation function between on and off.
Check the on and off status of FM demodulation function.
Return format
Return 0 or 1

5.5 DISPlay Subsystem
5.5.1 Trace Y-Axis Scaling
Command format:
DISPlay:WINDow:TRACe:Y[:SCALe]:PDIVision <rel_ampl>
DISPlay:WINDow:TRACe:Y[:SCALe]:PDIVision?
Function description:
Set Y-Axis Scaling
Check Y-Axis Scaling
Parameter specification
rel_ampl, float data,range from 0.1 dB to 20 dB
Return format
Return Y-Axis Scaling as float data
5.5.2 Trace Y-Axis Reference Level
Command format:
DISPlay:WINDow:TRACe:Y[:SCALe]:RLEVel <rel_ampl>
DISPlay:WINDow:TRACe:Y[:SCALe]:RLEVel?
Function description:
Set reference level
Check reference level
Parameter specification
rel_ampl, float data, range from 100dBm to 30dBm。
Return format
Return reference level as float data
5.5.3 Trace Y-Axis Reference Level Offset
Command format:
DISPlay:WINDow:TRACe:Y[:SCALe]:RLEVel:OFFSet <rel_ampl>
DISPlay:WINDow:TRACe:Y[:SCALe]:RLEVel:OFFSet?
Function description:
Set Y-Axis Reference Level Offset
Check Y-Axis Reference Level Offset
Parameter specification
rel_ampl, float data, range from -300dB to 300dB。
Return format
Return Y-Axis Reference Level Offset as float data
• Vertical Axis Scaling
Command format:
DISPlay:WINdow:TRACe:Y:SCALe:SPACing LOG|LIN
DISPlay:WINdow:TRACe:Y:SCALe:SPACing?
Function description:
Set scale type

Check scale type
Parameter specification
LOG:Log
LIN: Line
Return format
Return LIN or LOG
5.6 TRACe Subsystem
5.6.1 Read appointed trace data
Command format:
TRACe[:DATA]:TRACE<n>?
Function description:
Read out appointed trace data from spectrum analyzer
Parameter specification
Value of n : 1|2|3|4
Return format
Return appointed trace data, its format depends on the set of commands:
FORMat:TRACe:DATA
5.6.2 Select trace display mode
Command format:
TRACE<n>:MODE WRITe|MAXHold|MINHold|FREEze|BLANk
TRACE<n>:MODE?
Function description:
Set appointed trace mode
Check appointed trace mode
Parameter specification
Value of n : 1|2|3|4
W RITe:Clear write
MAXHold: Maximum hold
MINHold:Minimum hold
FREEze:Review
BLANk:Close
Return format
Return WRITe, MAXHold, MINHold, FREEze, BLANk
5.6.3 Set trace average time
Command format:
TRACE<n>: AVERage:COUNt <int_avg>
TRACE<n>: AVERage:COUNt?

Function description:
Set appointed trace average time
Check appointed trace average time
Parameter specification
Value of n : 1|2|3|4
int_avg, integral data,range from 1 to 1000
Return format
Return appointed trace average time
5.6.4 Set on/off of the average function in appointed trace.
Command format:
TRACE<n>:AVERage 0|1
TRACE<n>:AVERage?
Function description:
Turn on or off the average function of appointed trace.
Check the on/off status of average function in appointed trace.
Parameter specification
Value of n: 1|2|3|4
Return format
Check and return the on(1)/off(0) status of average function in appointed trace
5.6.5 Clear all trace
Command format:
TRACe:CLEar:ALL
Function description:
Clear all trace, means to set all trace type as BLANK.
5.6.6 FORMat Subsystem
Set the return format of trace data.
Command format:
FORMat:TRACe:DATA ASCii|REAL
FORMat:TRACe:DATA?
Function description:
Set the return format of trace data.
Parameter specification
ASCii: The data point is ASCII character, separated by comma.
REAL: The data point is 32 bit binary number.
Return format
Check and return ASCii or REAL

5.7 SENSe Subsystem
5.7.1 FREQuency Subsection
• Set start frequency
Command format:
SENSe:FREQuency:STARt <freq>
SENSe:FREQuency:STARt?
Function description:
Set start frequency
Query start frequency
Parameter specification
freq, integral data, range 0Hz to 3.2GHz
Return format
Query and return start frequency as an integer, unit is Hz.
• Set center frequency
Command format:
SENSe:FREQuency: CENTer <freq>
SENSe:FREQuency: C EN Ter ?
Function description:
Set center frequency
Query center frequency
Parameter specification
freq, integral data, range 0Hz to 3.2GHz
Return format
Query and return center frequency as an integer, unit is Hz.
• Set stop frequency
Command format:
SENSe:FREQuency: STOP <freq>
SENSe:FREQuency: STOP?
Function description:
Set stop frequency
Query stop frequency
Parameter specification
freq, integral data, range 0Hz to 3.2GHz
Return format
Query and return stop frequency as an integer, unit is Hz.
• Set span frequency
Command format:
SENSe:FREQuency: SPAN <freq>
SENSe:FREQuency: SPAN?
Function description:
Set span frequency
Query span frequency

Parameter specification
freq, integral data, range 0Hz to 3.2GHz
Return format
Query and return span frequency as an integer, unit is Hz.
5.7.2 Span Mode
• Set span mode
Command format:
SENSe:FREQuency: SPAN FULL|PREVious|ZIn|ZOUT
Function description:
Set span mode
Parameter specification
FULL: Set as full span
PREVious: Set as previous span
ZIn: Zoom-in span
ZOUT: Zoom-out span
5.7.3 Sweep
• Query span time
Command format:
SENSe:SWEep:TIME?
Function description:
Query span time
Return format
Query the span time returned as floating-point type data. Unit is us.
• Set span mode
Command format:
SENSe:SWEep:MODE NORMal|FAST
SENSe:SWEep:MODE?
Function description:
Set span mode
Query span mode
Parameter specification:
NORMal:Normal
FAST: Fast span
Return format
Query and return NORMal or FAST
5.7.4 Detection
• Set the type of detector
Command format:
SENSe:DETector:TRACE<n>:FUNCtion NORMal|POSitive|NEGative|SAMPle|AVERage
SENSe:DETector:TRACE<n>:FUNCtion?

Function description:
This command indicates detection mode. The detector will show every sampling
everage in the intervel between each trce. The everage will be achieved through the
following two methods.
Power Methods (RMS)
Video Methods (Y-axis unit)
These two methods is controlled by trace detection.
Parameter specification
The value of n: 1|2|3|4
NORMal: normal
POSitive:positive value
NEGative:negative value
SAMPle:sampling 采样
AVERage:average
Return format
Quary and return NORMal, POSitive, NEGative, SAMPle or AVERage.
5.7.5 Bandwidth
• Set resolution bandwidth RBW
Command format:
SENSe:BANDwidth:RESolution <freq>
SENSe:BANDwidth:RESolution?
Function description:
Set resolution bandwidth (RBW)
Query resolution bandwidth.
Parameter specification
freq, integral data, range from 10Hz to 1MHz.
Return format
Query and return the value of RBW as integral data format, unit is Hz.
• Set resolution bandwidth RBW as AUTO mode
Command format:
SENSe:BANDwidth:RESolution:AUTO OFF|ON|0|1
SENSe:BANDwidth:RESolution:AUTO?
Function description:
Set resolution bandwidth RBW as AUTO mode.
Query the status of resolution bandwidth AUTO mode.
Return format
Query and return the ON(1) or OFF(0) status of resolution bandwidth AUTO mode.
• Set video bandwidth VBW
Command format:
SENSe:BANDwidth: VIDeo <freq>
SENSe:BANDwidth: VIDeo?
Function description:
Set video bandwidth (VBW).

Query vedio bandwidth.
Parameter specification
freq, integral data, range from 1Hz to 1MHz.
Return format
Query and return the value of video bandwidth (VBW) as integral data format, unit is
Hz.
• Set video bandwidth VBW as AUTO mode.
Command format:
SENSe:BANDwidth: VIDeo:AUTO OFF|ON|0|1
SENSe:BANDwidth: VIDeo:AUTO?
Function description:
Set video bandwidth (VBW) as AUTO mode.
Query the status of video bandwidth AUTO mode.
Return format
Query and return the ON(1) or OFF(0) status of resolution bandwidth AUTO mode.
5.7.6 Average
• Set average type
Command format:
SENSe:BANDwidth:AVGType LOGPwr|POWEr|VOLTage
SENSe:BANDwidth:AVGType?
Function description:
Set average type.
Query average type.
Parameter specification
LOGPwr:ogarithmic power
POWEr:power
VO LTage:voltage
Return format
Query and return LOGPwr,POWEr or VOLTage
.
5.7.7 Power
• Set input attenuation
Command format:
SENSe:POWer[:RF]:ATTenuation <rel_ampl>
SENSe:POWer[:RF]:ATTenuation?
Function description:
Set the attenuation value of RF front-end attenuator.
Query the attenuation value of RF front-end attenuator.
Parameter specification
rel_ampl, integral data, range from 0dB to 51dB.
Return format
Query input attenuation value, unit is dB.

• Turn on or off the autoset of input attenuation
Command format:
SENSe:POWer[:RF]:ATTenuation:AUTO OFF|ON|0|1
SENSe:POWer[:RF]:ATTenuation:AUTO?
Function description:
Turn on or off the autoset of input attenuation.
Query the autoset status of input attenuation.
Return format
Query and return the autoset on(1) or off(0) status of input attenuation.
• Turn on or off the pre-amplifier
Command format:
SENSe:POWer[:RF]:GAIN:STATe OFF|ON|0|1
SENSe:POWer[:RF]:GAIN:STATe?
Function description:
Turn on or off the pre-amplifier
Query the status of the pre-amplifier
Return format
Query and return the on(1) or off(0) status of the pre-amplifier
• Autoset
(
AUTO
)
Command format:
SENSe:POWer:ATUNe
Function description:
Search signals in the full spectrum, and adjust the parameter of frequency and
amplitude to the best status.
• Turn on or off the function of high sensitivity
Command format:
SENSe:HIGH:SENSitivity OFF|ON|0|1
SENSe:HIGH:SENSitivity?
Function description:
Turn on or off the function of high sensitivity.
Query the on/off status of high sensitivity.
Return format
Query and return the ON or OFF status as the format of characters.
5.8 INITiate Subsystem
5.8.1 Continuous Sweep and Single Sweep
Command format:
INITiate:CONTinuous OFF|ON|0|1
INITiate:CONTinuous?
Function description:

Turn on or off the function of continuous sweep. When continuous sweep is turned
off, it enters into single sweep status.
Query the status of continuous sweep function.
Return format
Query and return the ON or OFF status of continuous sweep function as the format
of characters.
5.8.2 Start Single Sweep
Command format:
INITiate:IMMediate
Function description:
This command is to start single sweep. Pay attention that this command is only valid
after you set the sweep mode as single sweep in advance.
5.9 TRIGger Subsystem
5.9.1 Set Trigger Type
Command format:
TRIGger:SEQuence:SOURce IMMdeiate|VIDeo|EXTernal
TRIGger:SEQuence:SOURce?
Function description:
Set trigger type
Query trigger type
Parameter specification
IMMediate:Free trigger
VIDeo:Video trigger
EXTernal:External trigger
Return format
Query and reture IMMdeiate, VIDeo or EXTernal as the format of characters.
5.9.2 Edge Trigger of External Trigger
Command format:
TRIGger:SEQuence:EXTernal:SLOPe POSitive|NEGative
TRIGger:SEQuence:EXTernal:SLOPe?
Function description:
Set edge trigger of external trigger.
Query edge trigger of external trigger.
Parameter specification
POSitive:Rising edge
NEGative:Falling edge
Return format

Query and reture POSitive or NEGative as the format of characters.
5.9.3 Trigger Level in Video Trigger.
Command format:
TRIGger:SEQuence:VIDeo:LEVel <level>
TRIGger:SEQuence:VIDeo:LEVel?
Function description:
Set trigger level in video trigger.
Query trigger level in video trigger.
This command is only valid when select video trigger.
Parameter specification
level, floating-point data, range from -300.0dBm to 50 dBm.
Return format
Query and return trigger level value as the format of floating-point data.
5.9.4 UNIT Subsystem
• Select the power unit used for measurement.
Command format:
UNIT:POWer DBM|DBMV|DBUV|W|V
UNIT:POWer?
Function description:
Set amplitude unit of Y-axis.
Query amplitude unit of Y-axis.
Return format
Query and return DBM, DBMV, DBUV, W or V.
5.10 SYSTem Subsystem
5.10.1 Power off the Instrument.
Command format:
SYSTem:SHUTDOWN
Function description:
This command is to power off this spectrum analyzer.
5.10.2 Restart the Instrument
Command format:
SYSTem:RESTART
Function description:
This command is to restart the spectrum analyzer.

5.10.3 Preset
Command format:
SYSTem:PRESet
Function description:
This command makes the relevant setting of spectrum analyzer into preset status.

Chapter6 Specifications
This chapter lists the specifications and general specifications of the analyzer. All the
specifications apply to the following conditions unless otherwise noted.
The instrument has been warmed-up for 30 minutes.
The instrument is within the calibration period and a self-calibration has been performed.
Typical value and nominal value are defined as follows.
Typical value: defined as the specifications of the product under specified conditions.
Nominal value: defined as the approximate quantity in the application of the product.

6.1 Technical Specifications
Parameters
Model
HSA2030A
(
HSA2016
)
HSA2030B
(
HSA2016B
)
Frequency
Frequency Range
9KHz~3GHz(1.6GHz) AC
Coupled
9KHz~3GHz(1.6HGz) AC Coupled
5M~3GHz(1.6GHz) TG
Frequency Resolution
1Hz
Reference Frequency
10MHz
Frequency Readout Accuracy
±(frequency indication*frequency reference
uncertainty+1%*span+20%RBW+marker resolution+1Hz)
Internal 10MHz Reference
Accuracy
Aging rate
±1ppm/year
(
0
℃
~50
℃,
Reference is 25
℃
)
Temperature stability ±1ppm
Marker Resolution
(Frequency span)/(number of sweep points-1)
Resolution Bandwidth
(
RBW
)
-3dB Bandwidth
10Hz to 1MHz
,
1-3-10 sequence
Accuracy
±5% RBW=10Hz~1MHz nominal
Resolution Filter Shape Factor
<
5:1 nominal
Video Bandwidth(VBW)
-3dB bandwidth
1Hz to 1MHz
,
1-3-10 sequence
Accuracy
±10% VBM=1Hz~1MHz nominal
Displayed Average Noise Level (normalized to1Hz)
9K~1MHz
Preamp off
-108dBm, typical -127dBm
1MHz ~10MHz
-128dBm, typical -146dBm
10MHz ~500MHz
-142dBm, typical -146dBm
500MHz ~2.5GHz(1.6GHz)
-141dBm, typical -145dBm
2.5GHz ~3GHz
-136dBm, typical -140dBm
9K~1MHz
Preamp on
-131dBm, typical -150dBm
1MHz ~10MHz
-148dBm, typical -163dBm
10MHz ~500MHz
-161dBm, typical -164dBm
500MHz ~2.5GHz(1.6GHz)
-159dBm, typical -162dBm
2.5GHz ~3GHz
-158dBm, typical -161dBm
SSB Phase Noise
Carrier Offset(20
℃
~
30℃,500MHz
Central Frequency)
10K
< -92 dBc/Hz, typical -95 dBc/Hz
30K
< -93 dBc/Hz, typical -96 dBc/Hz
100K
< -95 dBc/Hz, typical -97 dBc/Hz
1MHz < -117 dBc/Hz, typical -119 dBc/Hz
Sweep Time
Range
Span >100Hz
2ms to 1000s
Span=0Hz
600ns to 200s
Sweep Mode
Continuous, single
Trigger Source
Free run; video; external
Trigger slope
Selectable positive or negative edge
Trigger delay
Span =0Hz
±12ms to ±12s nominal
Frequency Counter
Counter Resolution
1Hz
Accuracy
± (marker frequency × frequency reference uncertainty + counter
resolution)

Level Display Range
Log Scale and Units
1 to 10 dB/divisions in 1, 2, 5, 10 dB steps, 10 divisions displayed
Linear Scale and Units
0 to 100%, 10 divisions displayed
Scale Unit
dBm, dBmV,dBuV,Watts
,
Volts
Sweep (Trace) Points
461
Number of Markers
4
Detectors
Normal, positive peak, dample, negative peak, RMS
Number of Traces
4
Trace Functions
Clear/write, maximum hold, minimum hold, average, check
,
close
Level Measurement Error
±1.5dB(excluding input VSWR mismatch)
20~30℃,peak detector, preamplifier off, input signal -50dBm to 0dBm
Reference Level
Setting Range
-100dBm to +30dBm, steps of 1dB
Setting Resolution
Log scale
0.01dB
Linear scale
Almost log
(
2.236μV to 7.07V
)
Amplitude
Maximum Safety Input Level
Average continuous power
+33dBm
DC input voltage
50Vdc
Measurement Range
9KHz~2MHz
Displayed average noise level (DANL) to
+10dB
2MHz~3GHz(1.6GHz)
Displayed average noise level (DANL) to
+20dB
Input attenuator range
0 to 51dB,1dB steps
Spurious Response
Second Harmonic Distortion(SHI
)
<65dBc
,
50MHz to 3GHz(1.6GHz)
(
Mixer level -30dBm
,
attenuator =0dB,
preamp off,20℃~30℃)
Third-Order
Intermodulation(TOI)
50~300MHz
+8dBm, Third-order intermodulation
products:2 x -20dBm; frequency
separation 100KHz: attenuation =
0dB; preamp off, 20℃~30℃
300MHz~3GHz
(
1.6GHz
)
+10dBm
Input Related Spurious
<-75dBc, (input mixer = -30dBm)
Inherent Residual Response
<-90dBm
,
typical -98dBm (Input terminated and 0 dB RF attenuation,
preamplifier off)
RF Input VSWR
(at Tuned Frequency)
10MHz to 3GHz(1.6GHz)
<1.5:1, nominal Attenuator setting
10~20dB
10MHz Reference/External Trigger Input
Reference Iinput Frequency
10MHz
Reference Input Amplitude
0~10dBm
Trigger Voltage
5V TTL level
Connector and Output
Impendence
N female;(50Ω)
Gennral Feature
Interface Language
English
,
Chinese
,
Chinese Traditional
Display Index
5.7 inch
,
640*480 resolution
,
64M color LCD display
Temperature Range
Working
-10
℃
to +50
℃
,
(
battery
:
0
℃
to 50
℃)
Storage
-40
℃
to +70
℃
,
(
battery :-20
℃
to 50
℃)
Relative Humidity
<95%

Weight
2.9kg
(
with battery
),
2.6kg
(
without battery
)
Size
260m X 220m X 75m
Power
Input voltage range
DC: 12-17V, maximum 2.8A
input 220VAC±15%
AC frequency range
40Hz to 60Hz
Power consumption
Maximum 32W


Appendix A
:
Accessories
Power: Input voltage range, AC 100 V to 240 V, standard value;AC frequency range 45 Hz
to 440 Hz; Power consumption 35 W, typical value;All chosen work<50 W。
Software installation CD, including PC communication software, which can easily transfer the
data from spectrum analyzer to PC. There is also “User manual” in the CD.
Appendix B: Services and Support
Thank you for choosing HANTEK. Please contact us through the following ways should you have
any inquiry regarding our products. We shall do our best to help you.
1. Contact your local HANTEK distributor;
2. Contact your local HANTEK field office;
3. Contact HANTEK headquarters in China.
Headquarters
Qingdao Hantek Electronic Co., Ltd
http://www.hantek.com
Address: 2/F., Zone D2, No. 112 Keyuan Longitude 7th Road,
Qingdao City, Shandong Province, China 266101
Tel: +86-532-88703687 / 88703697
Fax: +86-532-88705691
Email: service@hantek.com.cn
Technical Support
Tel: +86-532-88703687 / 88703697
Email: support@hantek.com.cn

Chapter8 General Care and Cleaning
8.1 General Care
Do not put or leave the device in a place where the LCD display will be exposed to direct sunlight
for long periods of time.
Note: To avoid damage to the oscilloscope or probes, do not expose them to sprays, liquids, or
solvents.
8.2 Cleaning
Examine the oscilloscope and probes as often as operating conditions require. To clean the
exterior surface, perform the following steps:
1) Use a lint-free cloth to remove floating dust on the outside of the oscilloscope and probes.
Take care to avoid scratching the glabrous display filter.
2) Use a soft cloth dampened with water to clean the oscilloscope. For more efficient cleaning,
you may use an aqueous solution of 75% isopropyl alcohol.
Note: To avoid damage to the surface of the oscilloscope or probes, do not use any
corrosive or chemical cleaning agents.