Loading ...
Loading ...
Loading ...
286
µ
1G
µ
2 .............. direction of test
t
......................
t-value
p ..................... p-value
df .................... degrees of freedom
o1 .................... sample 1 mean
o2 .................... sample 2 mean
x1
σ
n-1 ............... sample 1 standard deviation
x2
σ
n-1 ............... sample 2 standard deviation
n1 .................... sample 1 size
n2 .................... sample 2 size
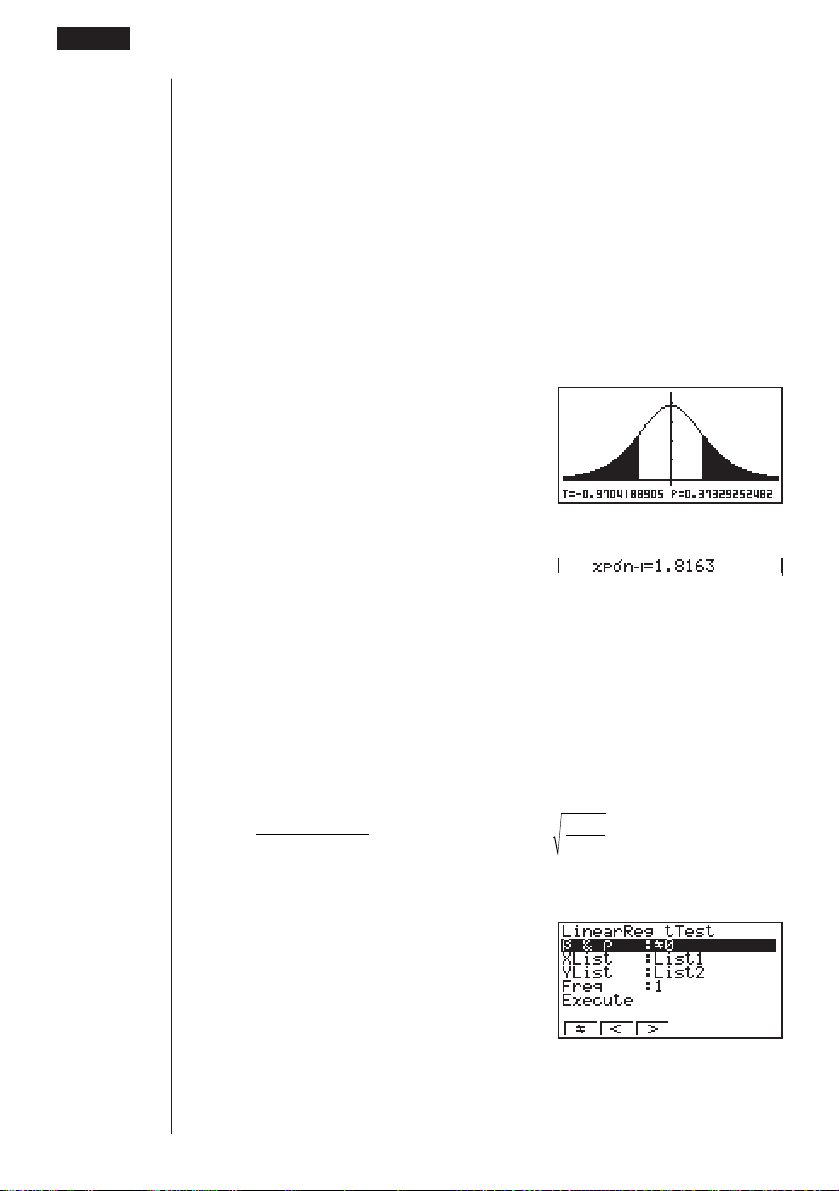
Perform the following key operation to display a graph.
J
ccccccc
6(DRAW)
The following item is also shown when Pooled = On.
xp
σ
n-1 ............... pooled sample standard deviation
uu
uu
uLinearReg t Test
LinearReg t Test treats paired-variable data sets as (x, y) pairs and plots all data
on a graph. Next, a straight line (y = a + bx) is drawn through the area where the
greatest number of plots are located and the degree to which a relationship exists
is calculated.
b =
Σ
( x – o)( y – p)
i =1
n
Σ
(x – o)
2
i =1
n
a = p – bo t = r
n – 2
1 – r
2
a : intercept
b : slope of the line
Perform the following key operation from the statistical data list.
3(TEST)
2(t)
3(REG)
18 - 6 Tests
Loading ...
Loading ...
Loading ...