Loading ...
Loading ...
Loading ...
258
To plot the data that falls outside the box, first specify “MedBox” as the graph
type. Then, on the same screen you use to specify the graph type, turn the outliers
item “On”, and draw the graph.
kk
kk
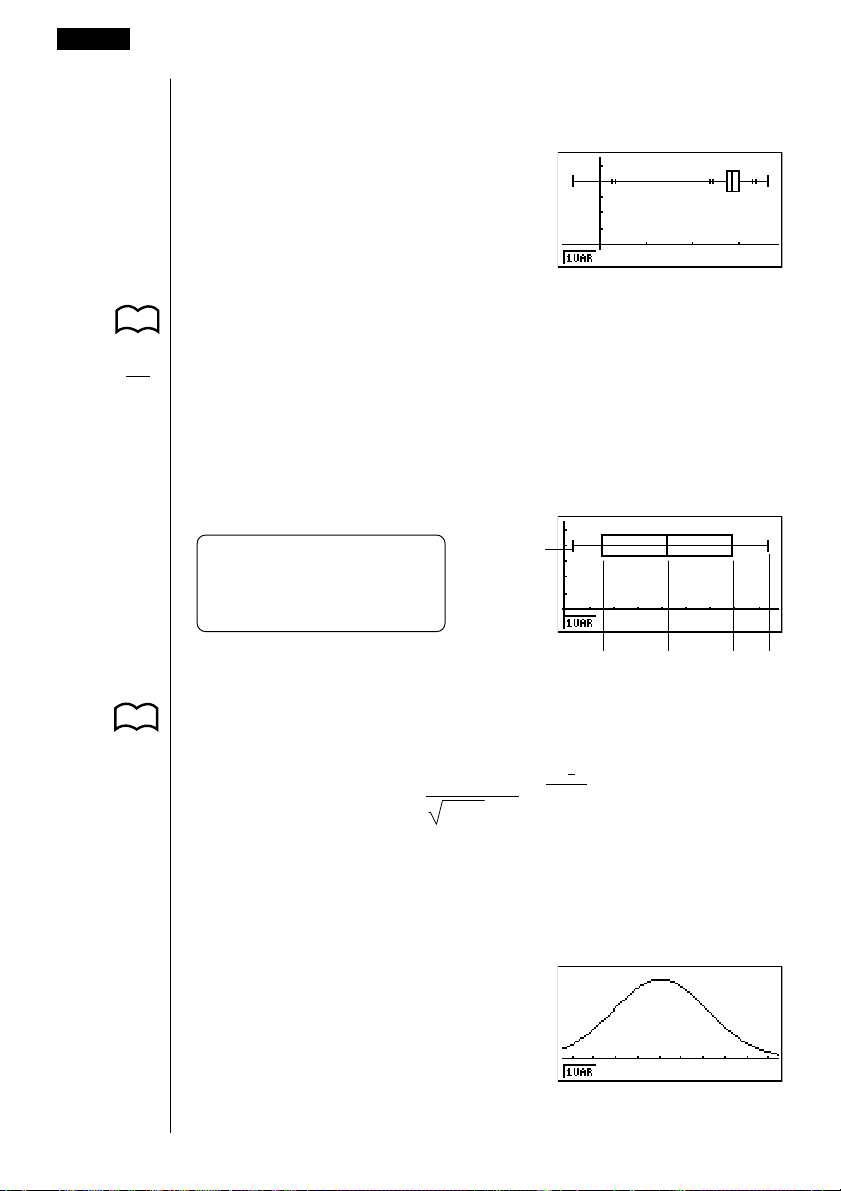
k Mean-box Graph
This type of graph shows the distribution around the mean when there is a large
number of data items. A line is drawn at the point where the mean is located, and
then a box is drawn so that it extends below the mean up to the population
standard deviation (o – x
σ
n) and above the mean up to the population standard
deviation (o + x
σ
n). Lines (called whiskers) extend from either end of the box up to
the minimum (minX) and maximum (maxX) of the data.
From the statistical data list, press 1 (GRPH) to display the graph menu, press
6 (SET), and then change the graph type of the graph you want to use (GPH1,
GPH2, GPH3) to mean-box graph.
kk
kk
k Normal Distribution Curve
P. 254 The normal distribution curve is graphed using the following normal distribution
(Graph Type) function.
(N·Dis)
y
=
1
(2 π) xσ
n
e
–
2xσ
n
2
(
x–
x
)
2
The distribution of characteristics of items manufactured according to some fixed
standard (such as component length) fall within normal distribution. The more data
items there are, the closer the distribution is to normal distribution.
From the statistical data list, press 1 (GRPH) to display the graph menu, press
6 (SET), and then change the graph type of the graph you want to use (GPH1,
GPH2, GPH3) to normal distribution.
18 - 3 Calculating and Graphing Single-Variable Statistical Data
P. 254
(Graph Type)
(Box)
Note :
This function is not usually used in
the classrooms in U.S. Please use
Med-box Graph, instead.
o – x
σ
n o o + x
σ
n
minX
maxX
Loading ...
Loading ...
Loading ...