Loading ...
Loading ...
Loading ...
EN-3
• The table below explains the result displayed for each type of simulation.
Table Graph
Coin Toss 1 coin Cumulative number of heads
over multiple tosses
Head/tail percentages over
multiple tosses
2 coins/
3 coins*
Number of heads for a single
toss
Cumulative percentages
of number of heads over
multiple tosses
Dice Roll 1 die Number produced by a
single roll
Percentages of each number
over multiple rolls
2 dice/
3 dice*
Total of numbers produced
by a single roll
Percentage of roll totals over
multiple rolls
Spinner Spinner number by a single
spin
Percentages of each number
over multiple spins
Marble Grab Types of marbles for a single
grab
Percentages of each type of
marble over multiple grabs
Card Draw Rank and suit of drawn card No graph
Random Numbers Generated random integer No graph
* For information about how to configure settings, see “3-1. Set Up Screen”.
The leftmost column of the table shows the number of tries up to 999.
You can use f and c to scroll a table up and down. You can use d and e to scroll a
graph left and right.
4. To return to the simulation selection screen, press J.
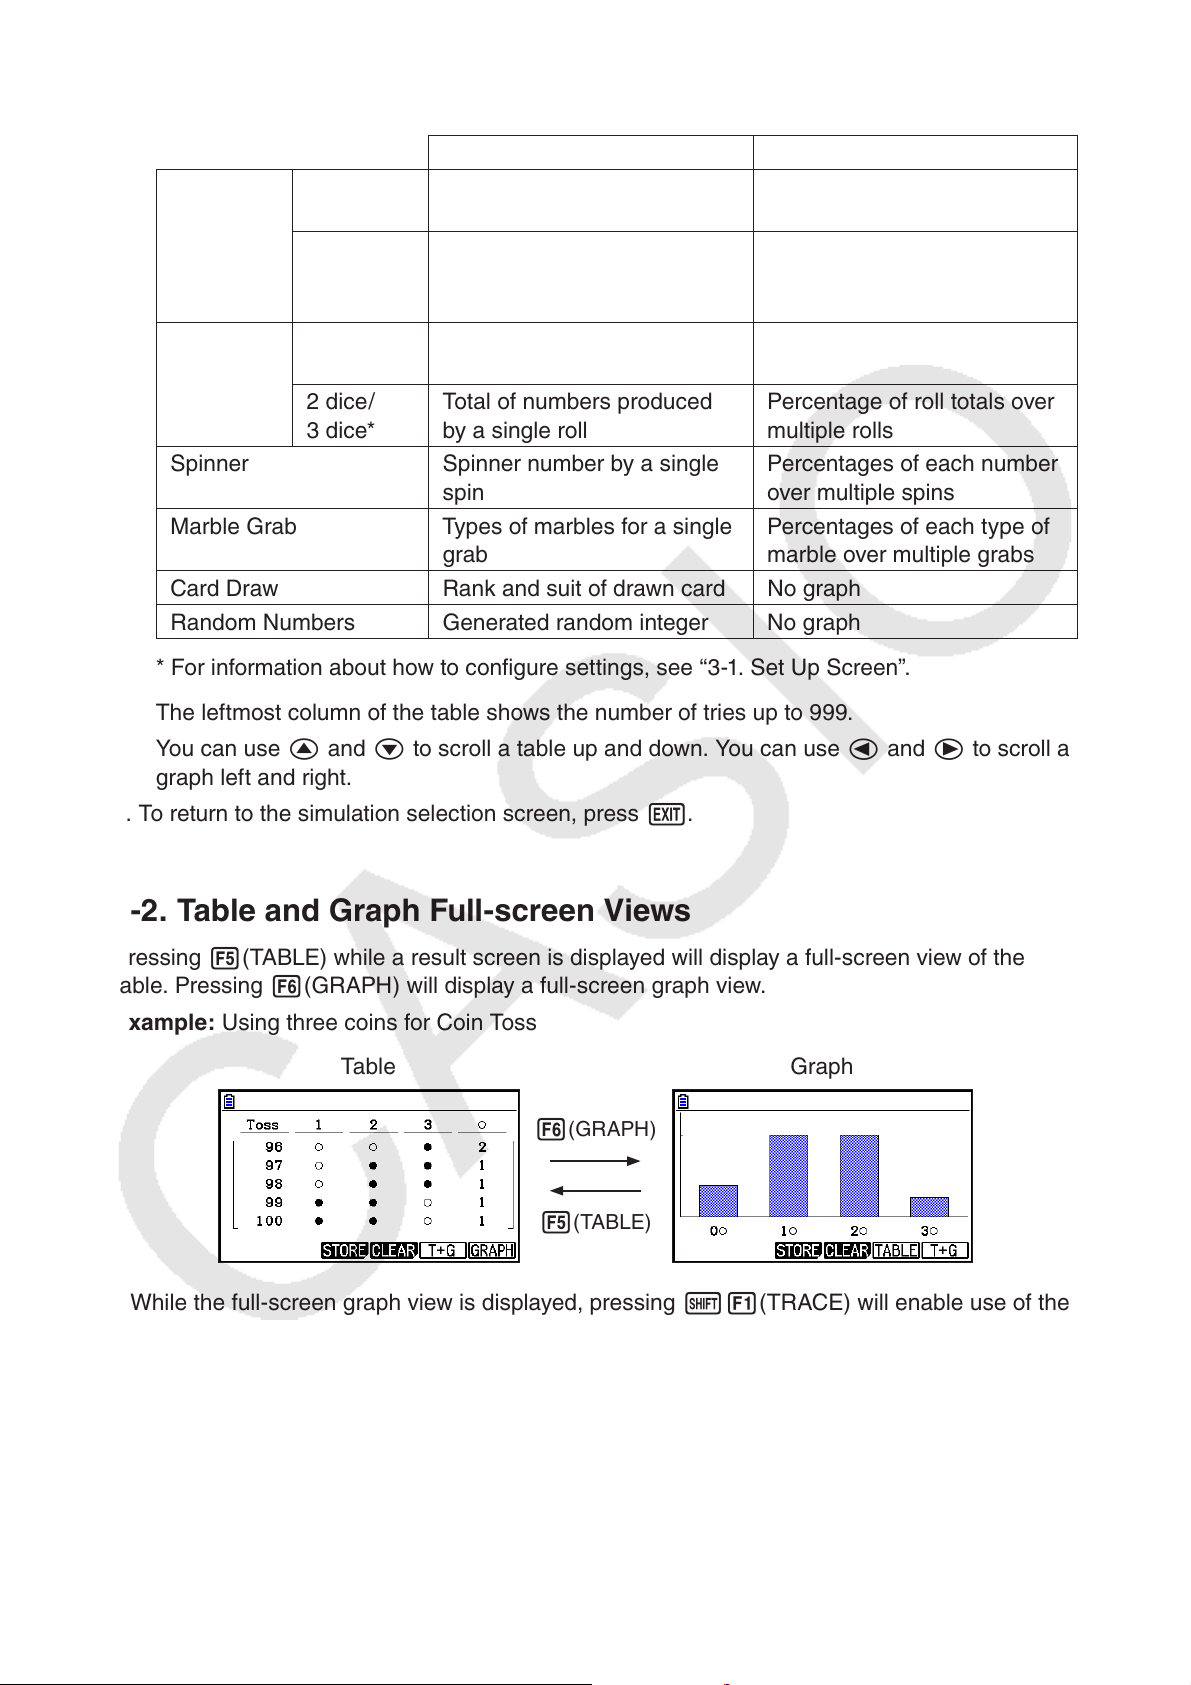
2-2. Table and Graph Full-screen Views
Pressing 5(TABLE) while a result screen is displayed will display a full-screen view of the
table. Pressing 6(GRAPH) will display a full-screen graph view.
Example: Using three coins for Coin Toss
Table Graph
6(GRAPH)
5(TABLE)
• While the full-screen graph view is displayed, pressing !1(TRACE) will enable use of the
trace function.
• Press 5(T+G) or 6(T+G) to return to the result view.
Loading ...
Loading ...
Loading ...