Loading ...
Loading ...
Loading ...
13
Treadmill
XT685
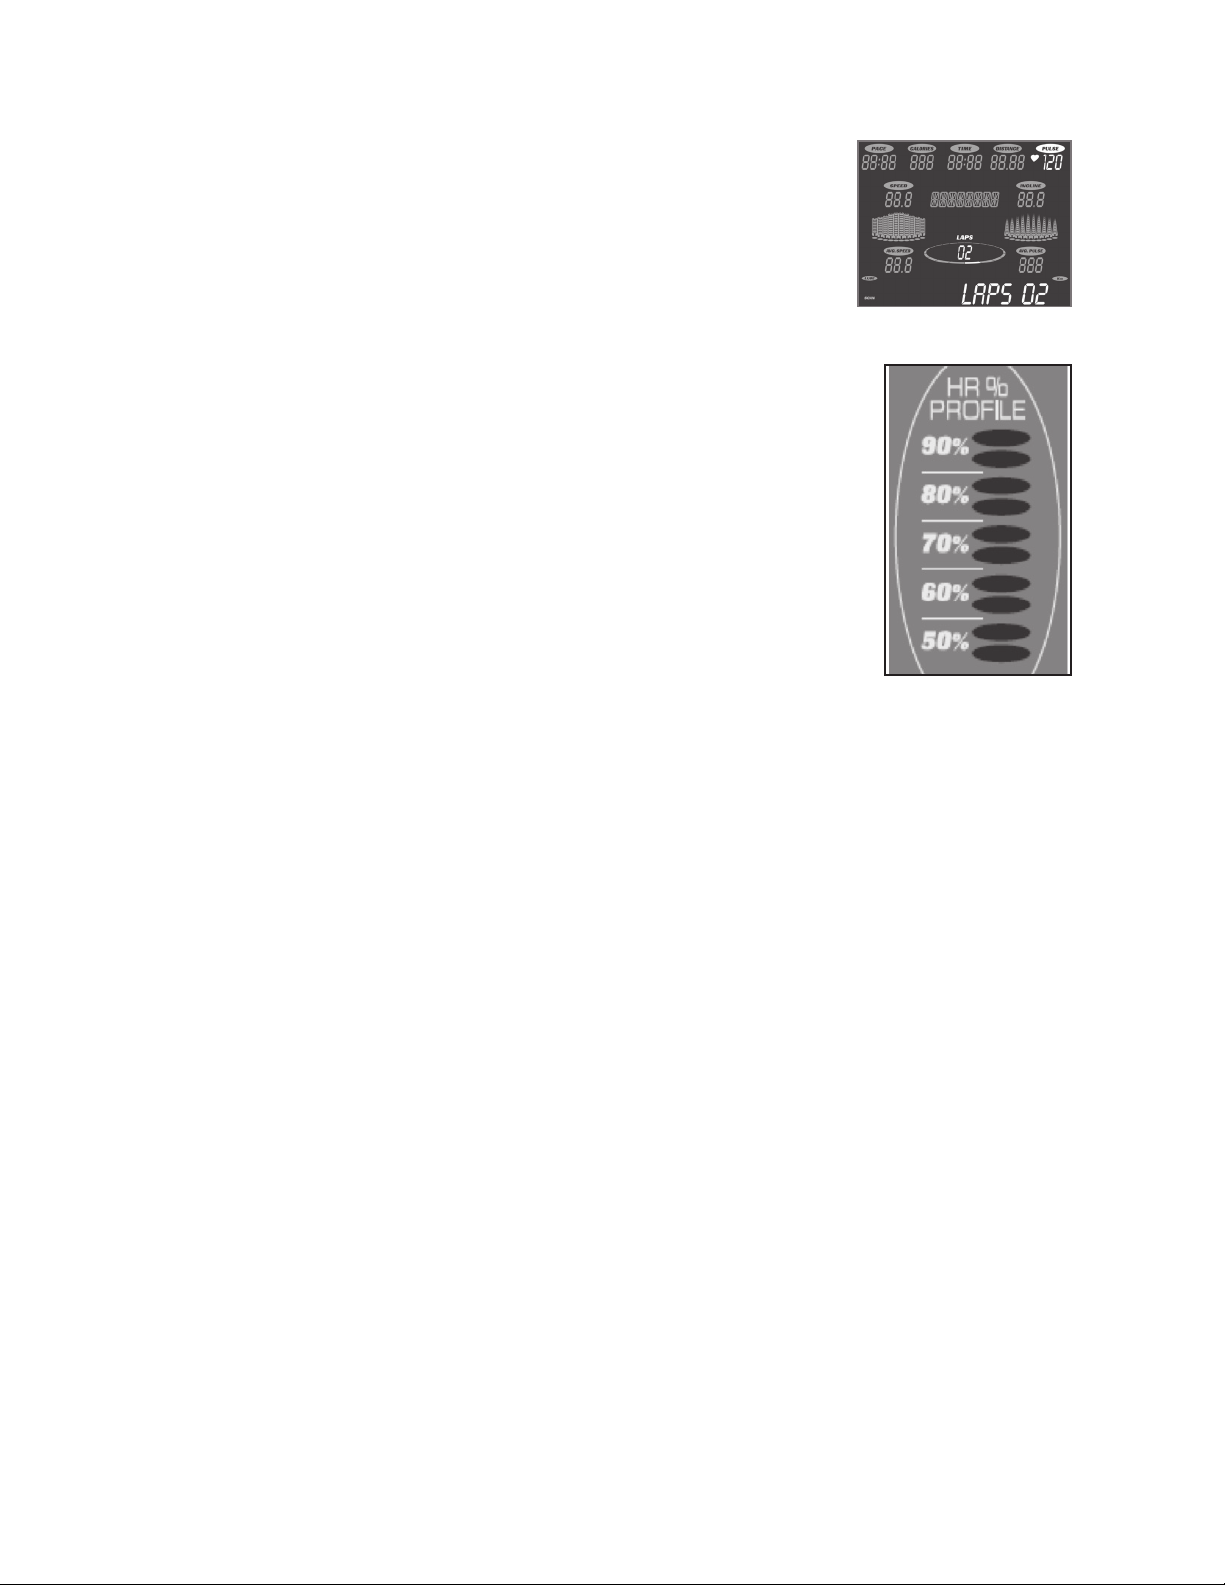
HEART RATE % PROFILE
The console LCD screen will display your current heart rate anytime a
pulse is detected. The Bar Graph, located to the right of the LCD screen,
will show your current heart rate % in relation to your projected maximum
heart rate, which is determined by your age that you entered during the
programming phase of any of the 10 programs. The signicance of the bar
graph colors are as follows:
• 50-60% of maximum is Amber
• 65-80% of maximum is Amber and Green
• 85-90% or more is Amber, Green, and Red
MESSAGE CENTER
The console will display Pace, Calories burned, Time (elapsed or
countdown), Distance travelled, Pulse, Speed, Incline, Program Name,
number of Laps completed, and Segment Time. There is also a Speed &
Incline prole graph that lets you see how hard you have worked and
how challenging the upcoming segments will be.
Loading ...
Loading ...
Loading ...